Submitted:
02 July 2023
Posted:
03 July 2023
You are already at the latest version
Abstract

Keywords:
1. Introduction
2. Materials
2.1. Culturing of Lysinibacillus Sphaericus Bacterium
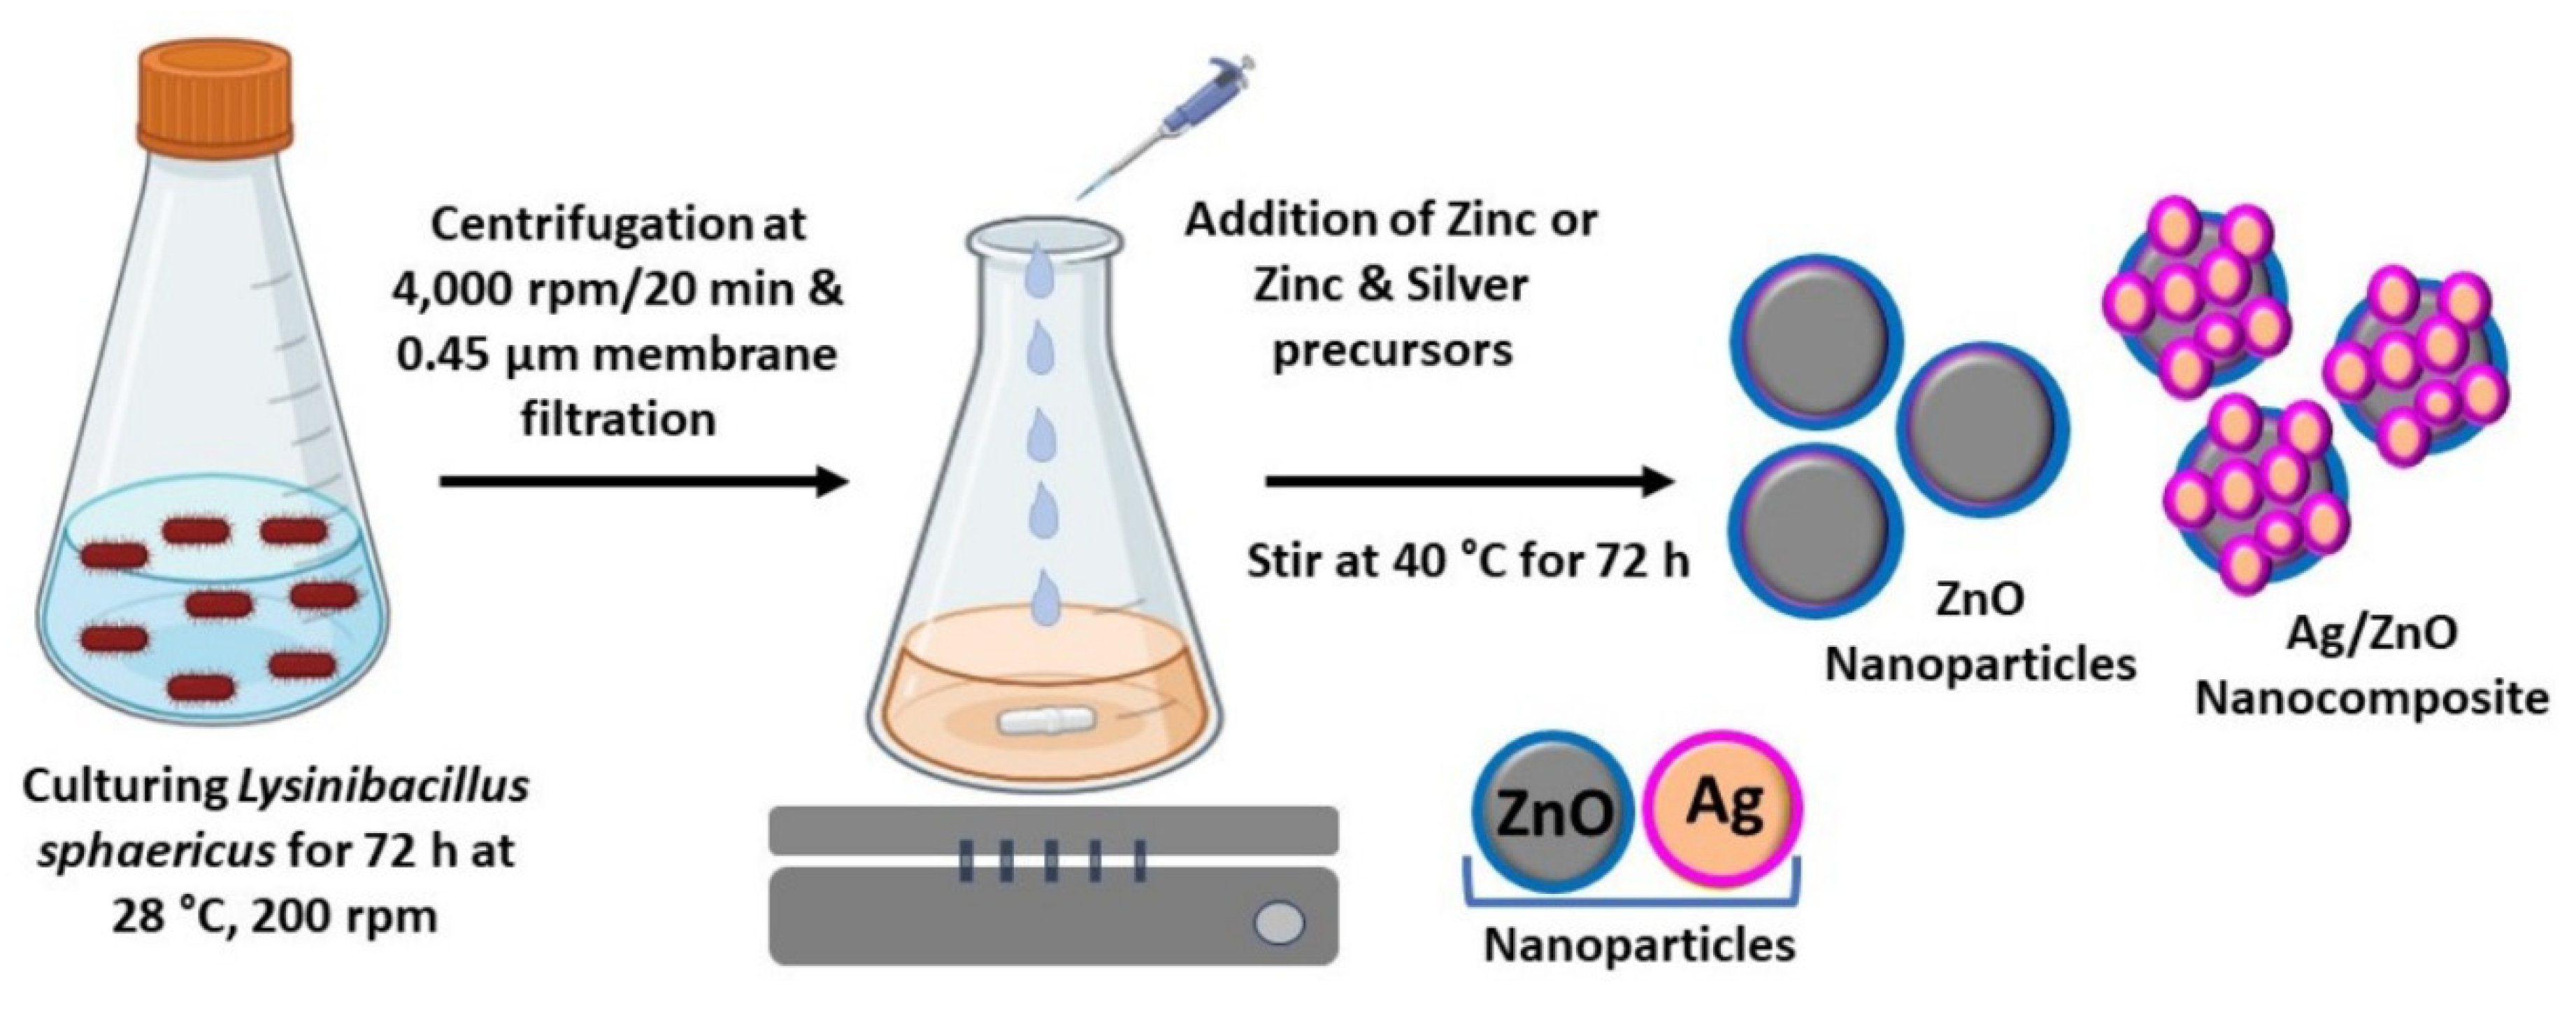
2.2. Biosynthesis of Semiconductor and Metal/Semiconductor Nanoparticles
2.3. Characterization of ZnO and Ag/ZnO
2.4. Evaluation of the Antibacterial Activity of ZnO and Ag/ZnO NPs
2.5. In Vitro Cytotoxicity Assay
2.5.1. Cell Culture
2.5.2. MTT Assay
2.6. Photocatalytic Degradation of Methylene Blue Using ZnO and Ag/ZnO
3. Results and Discussion
3.1. Mechanism of Biological Synthesis of Semiconductor and Metal/Semiconductor Nanoparticles
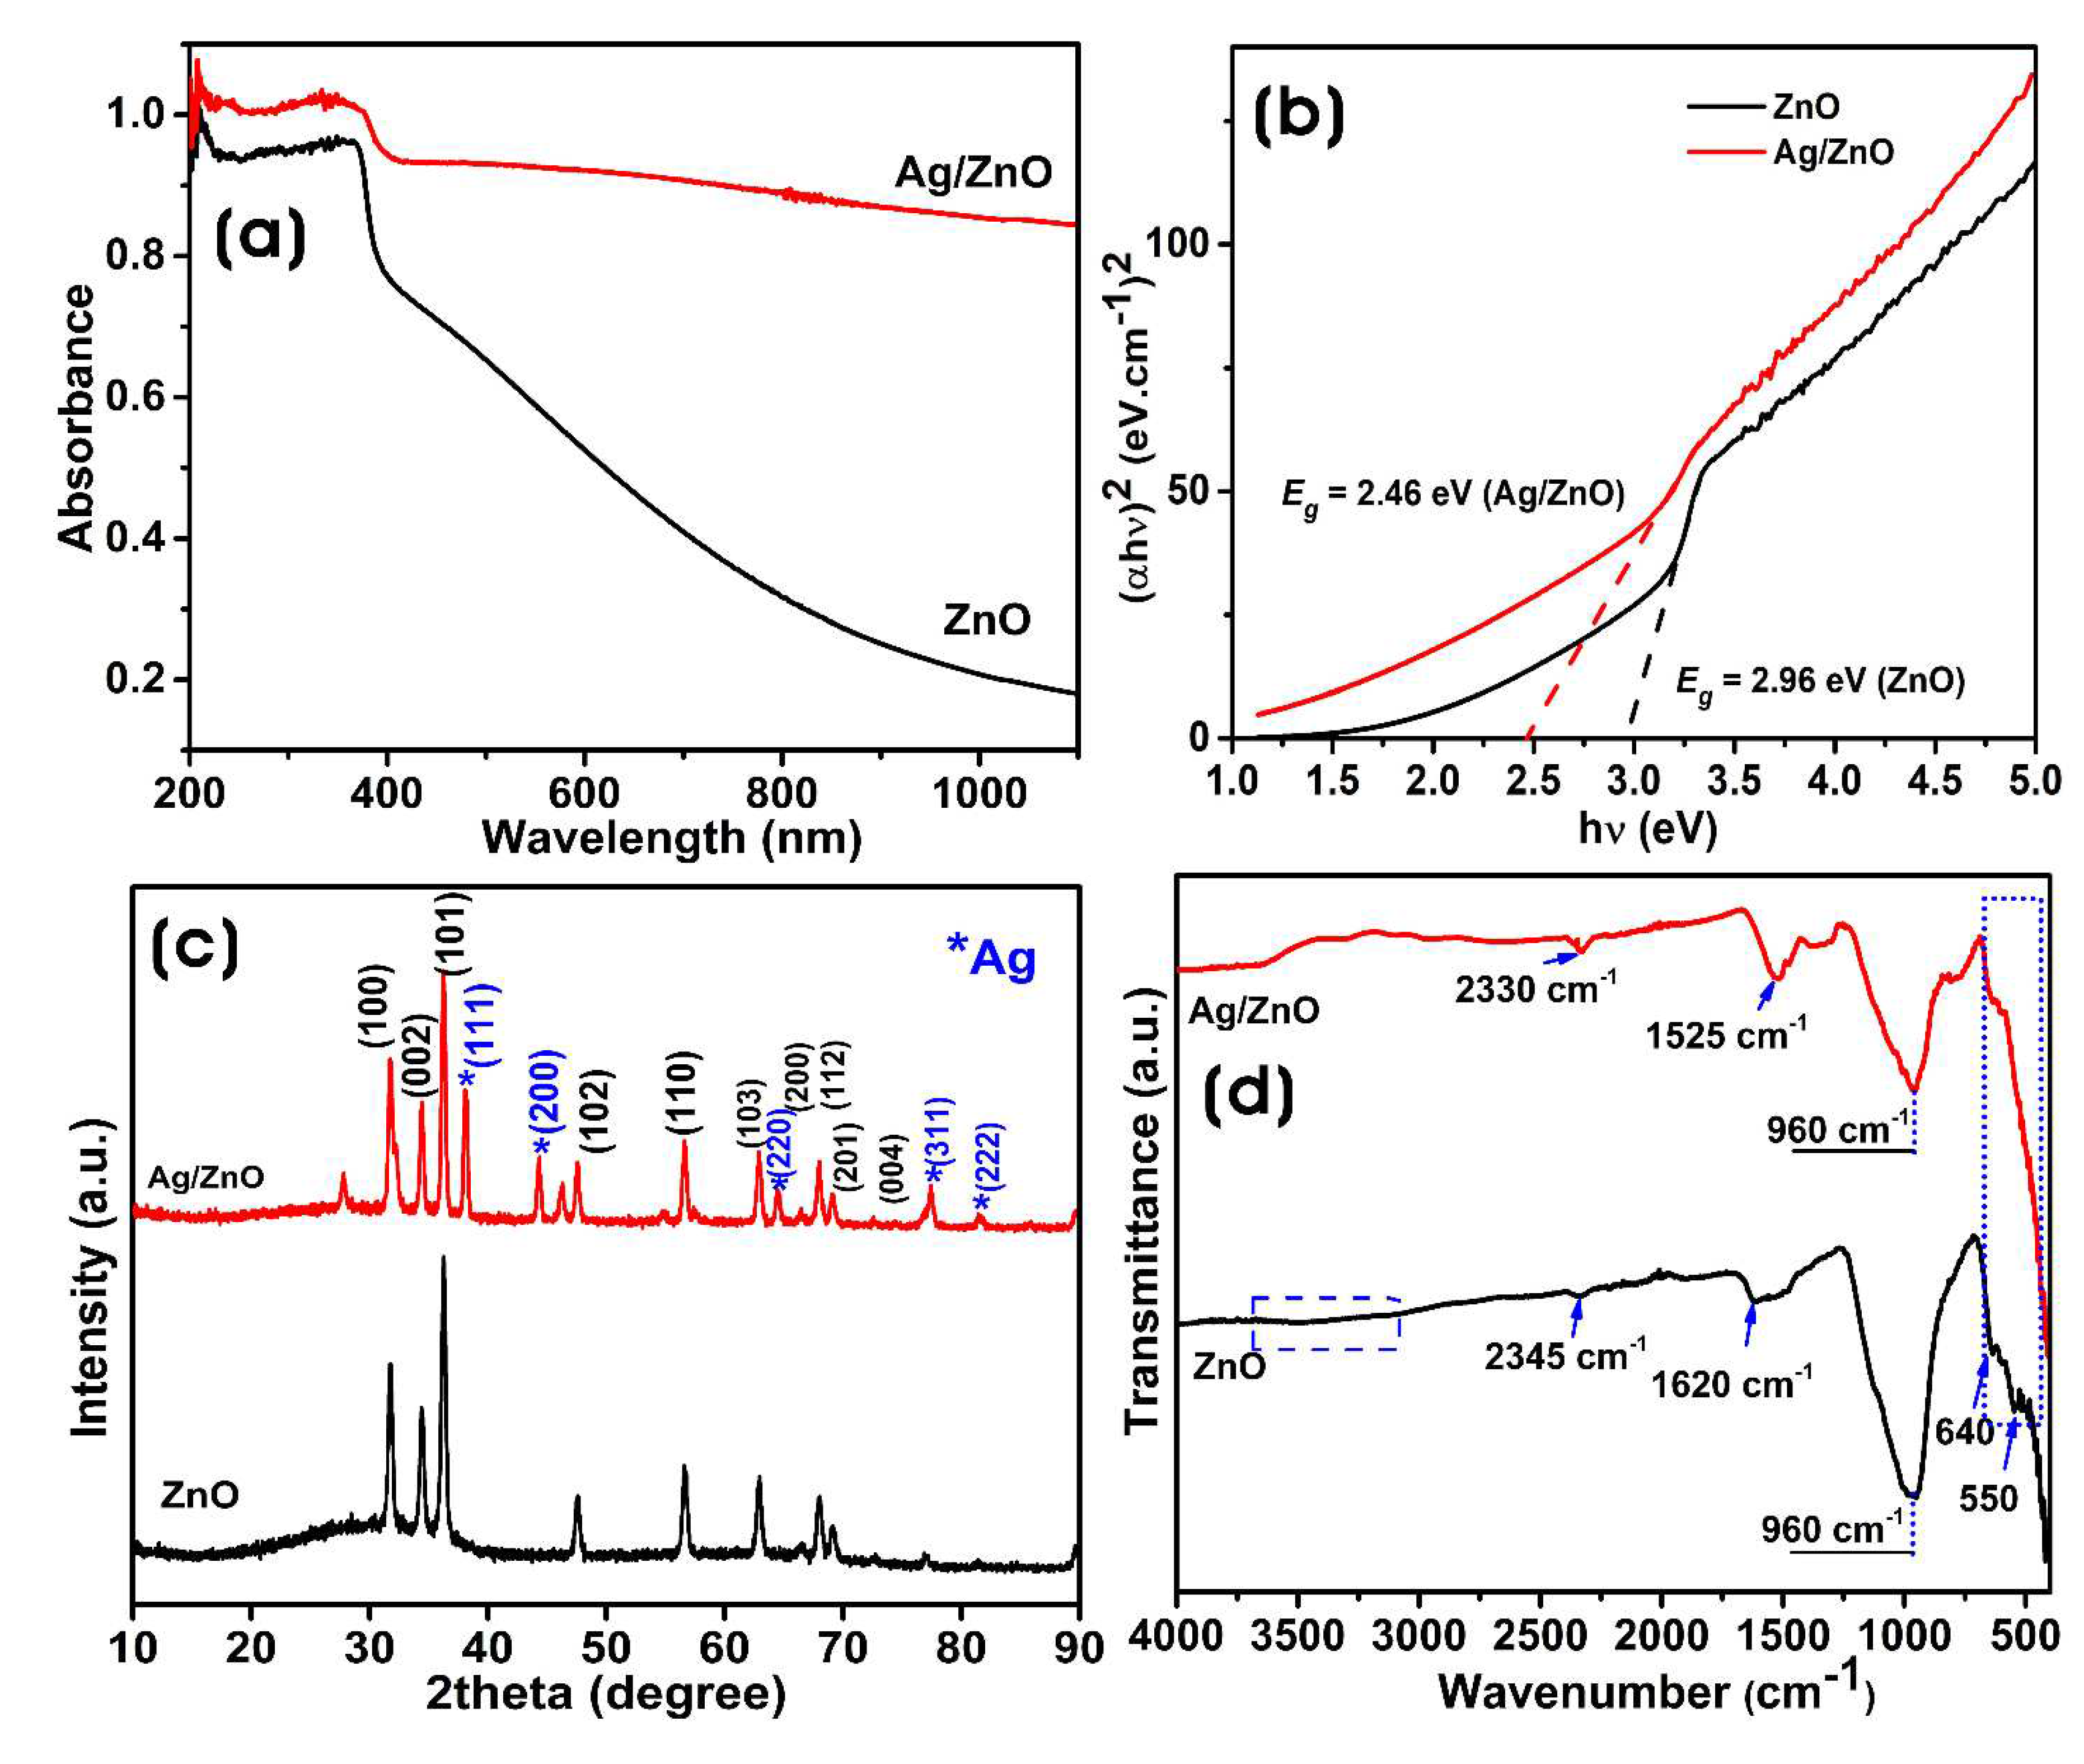
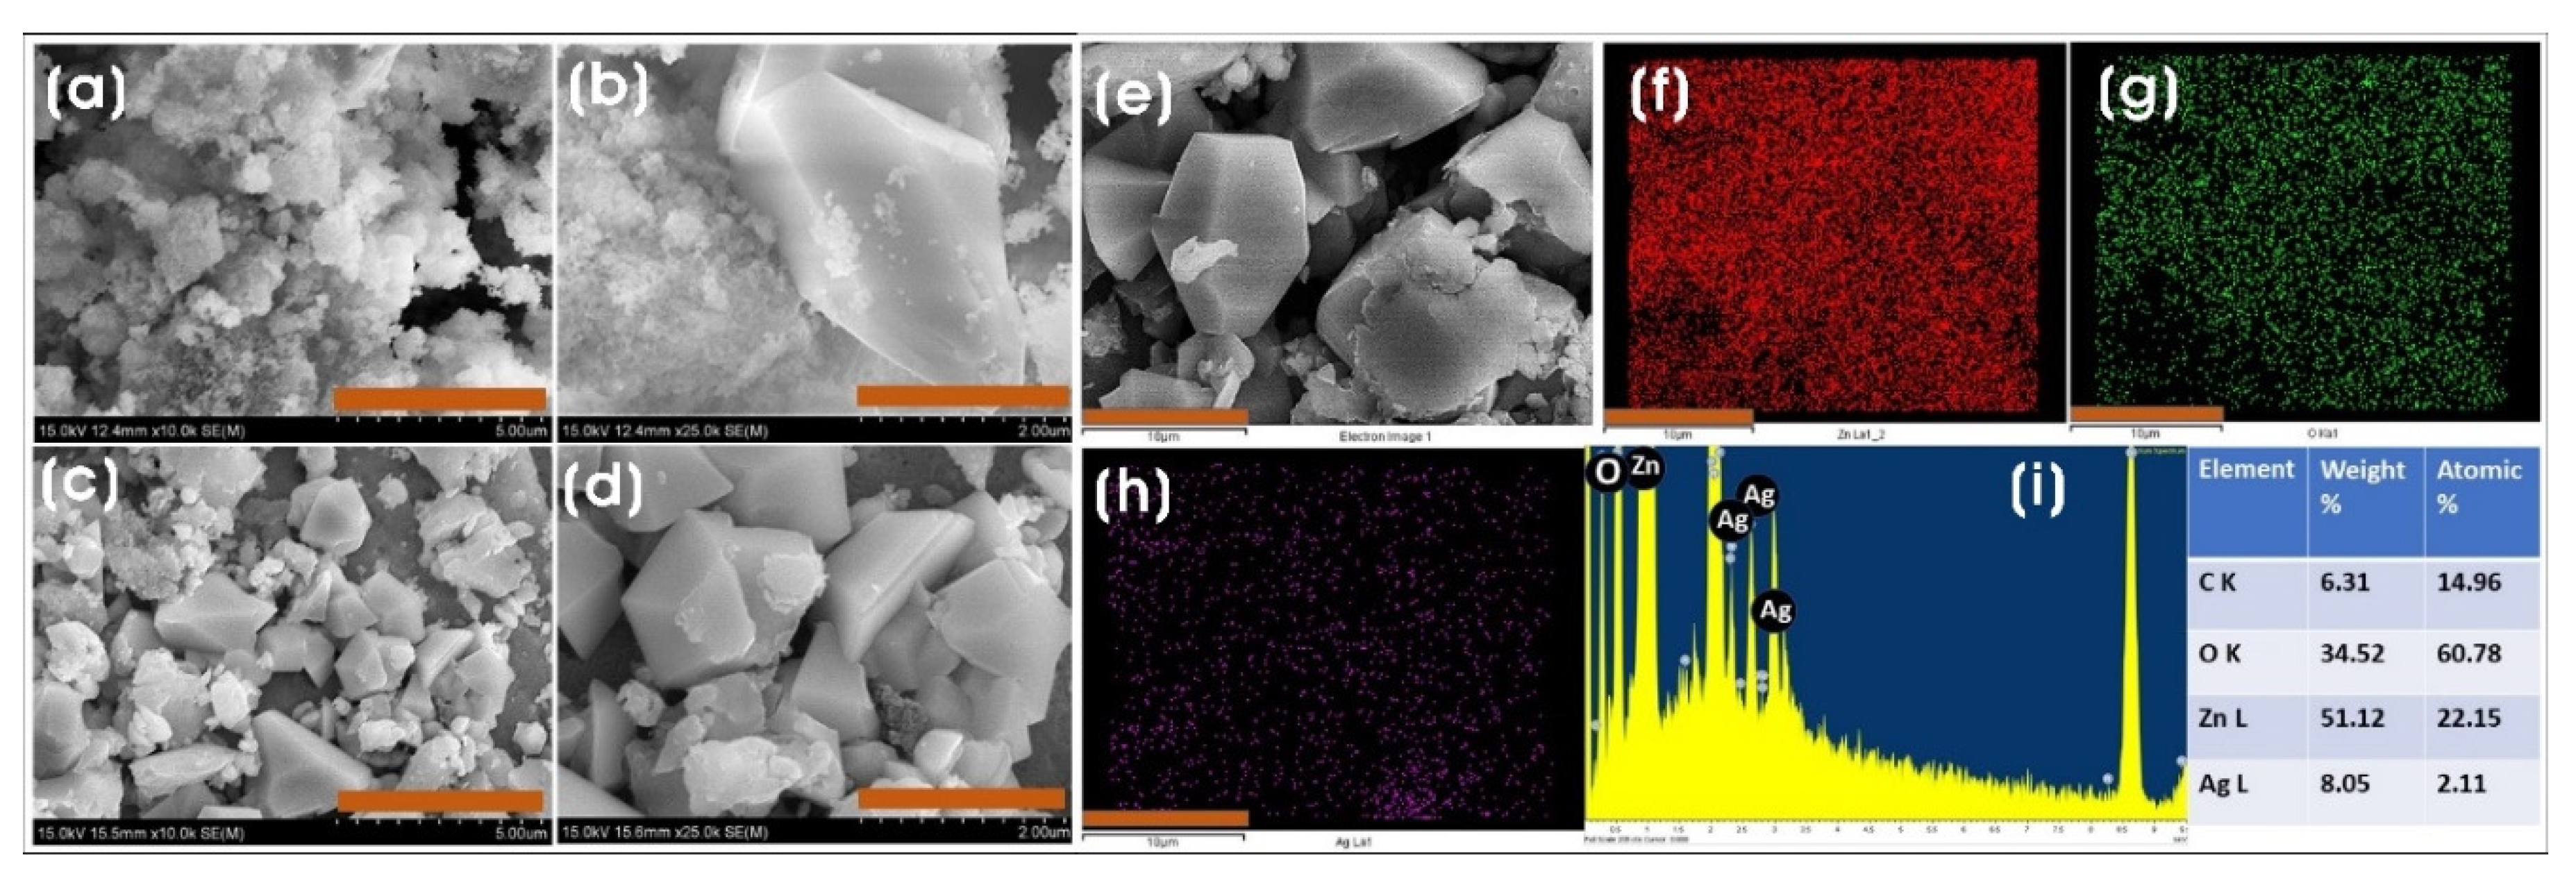
3.2. Characterization of Biosynthesized ZnO and Ag/ZnO NPs
3.3. Applications of Biosynthesized ZnO and Ag/ZnO NPs
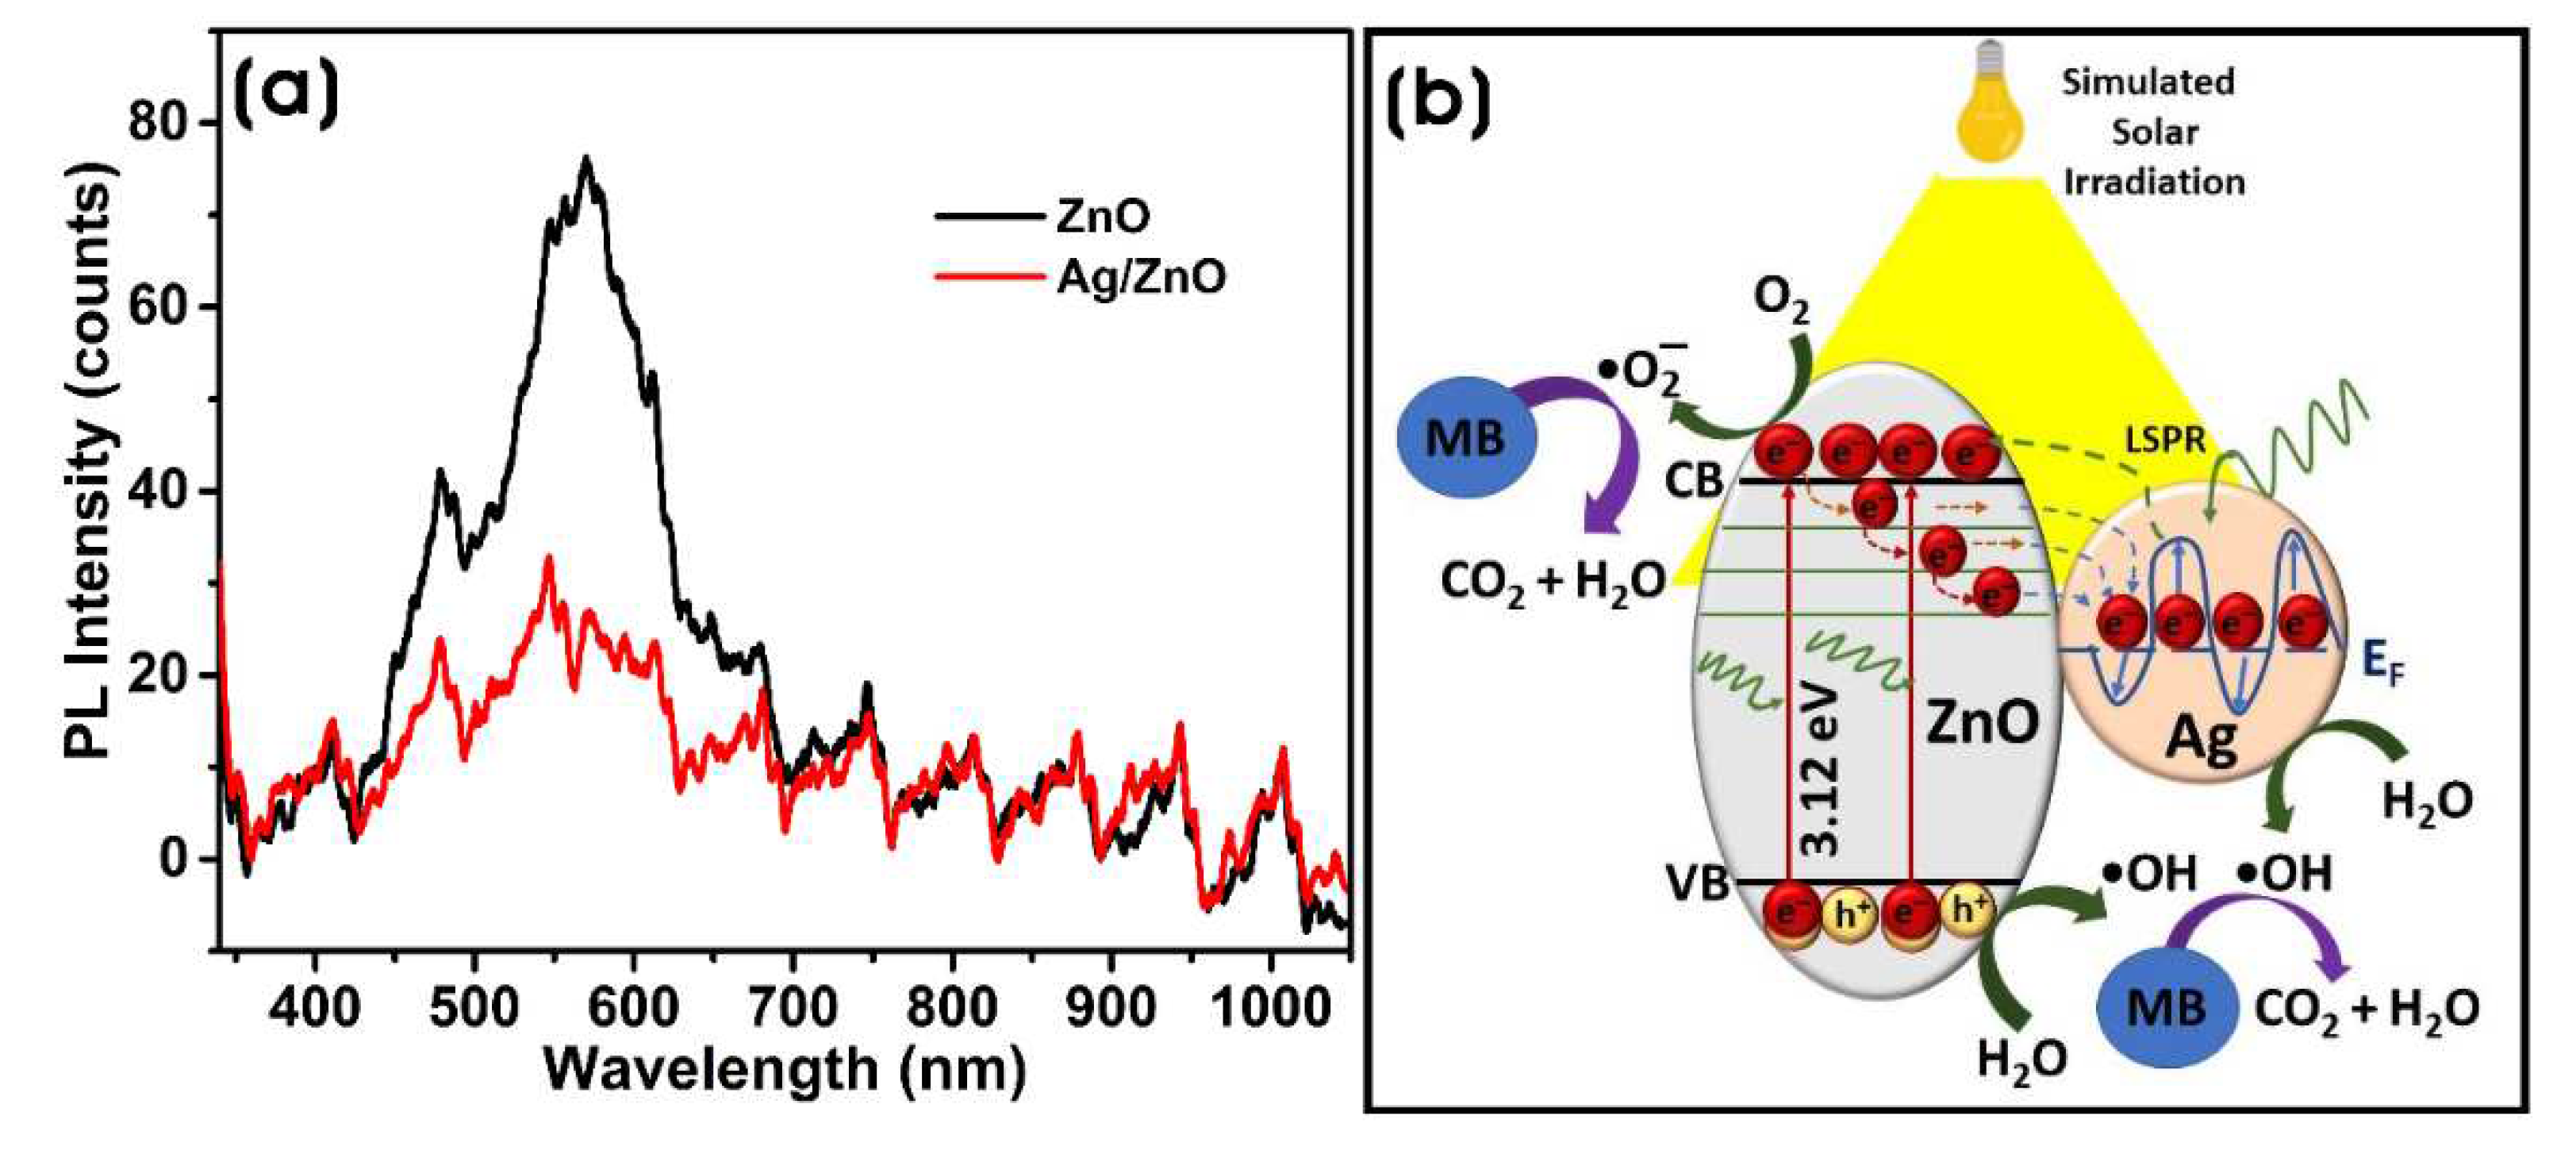
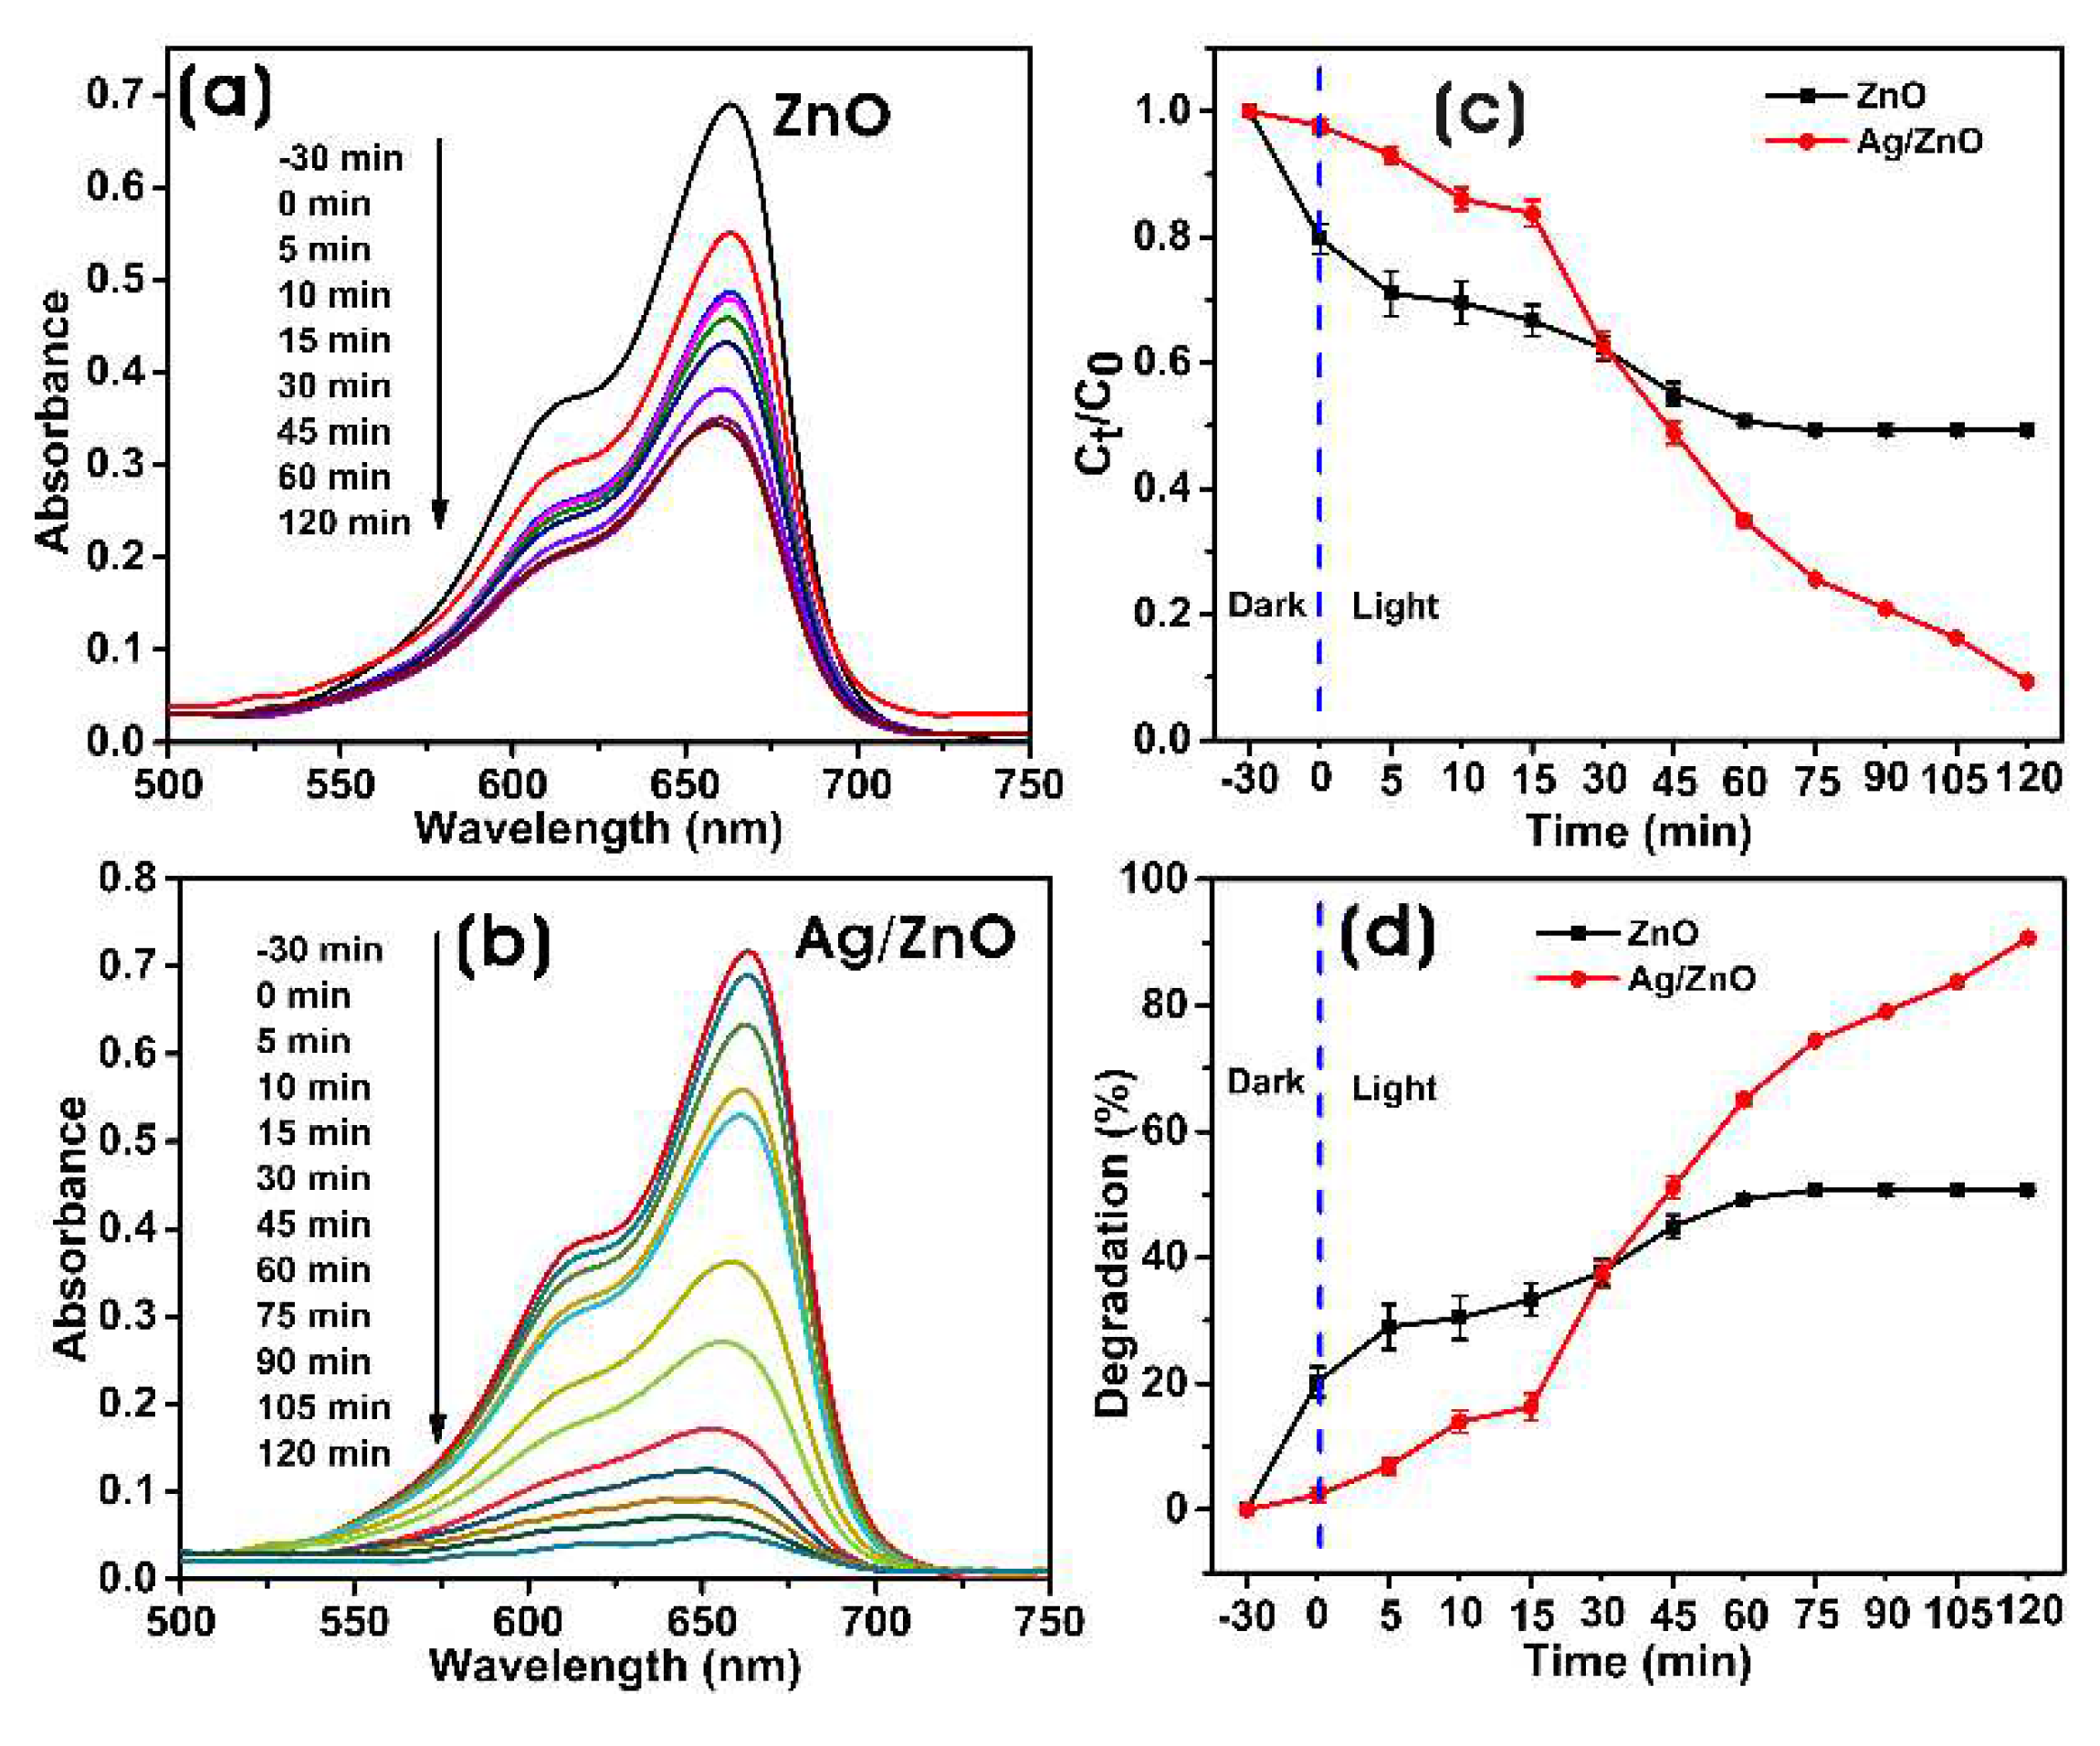
3.3.1. Photocatalytic Degradation
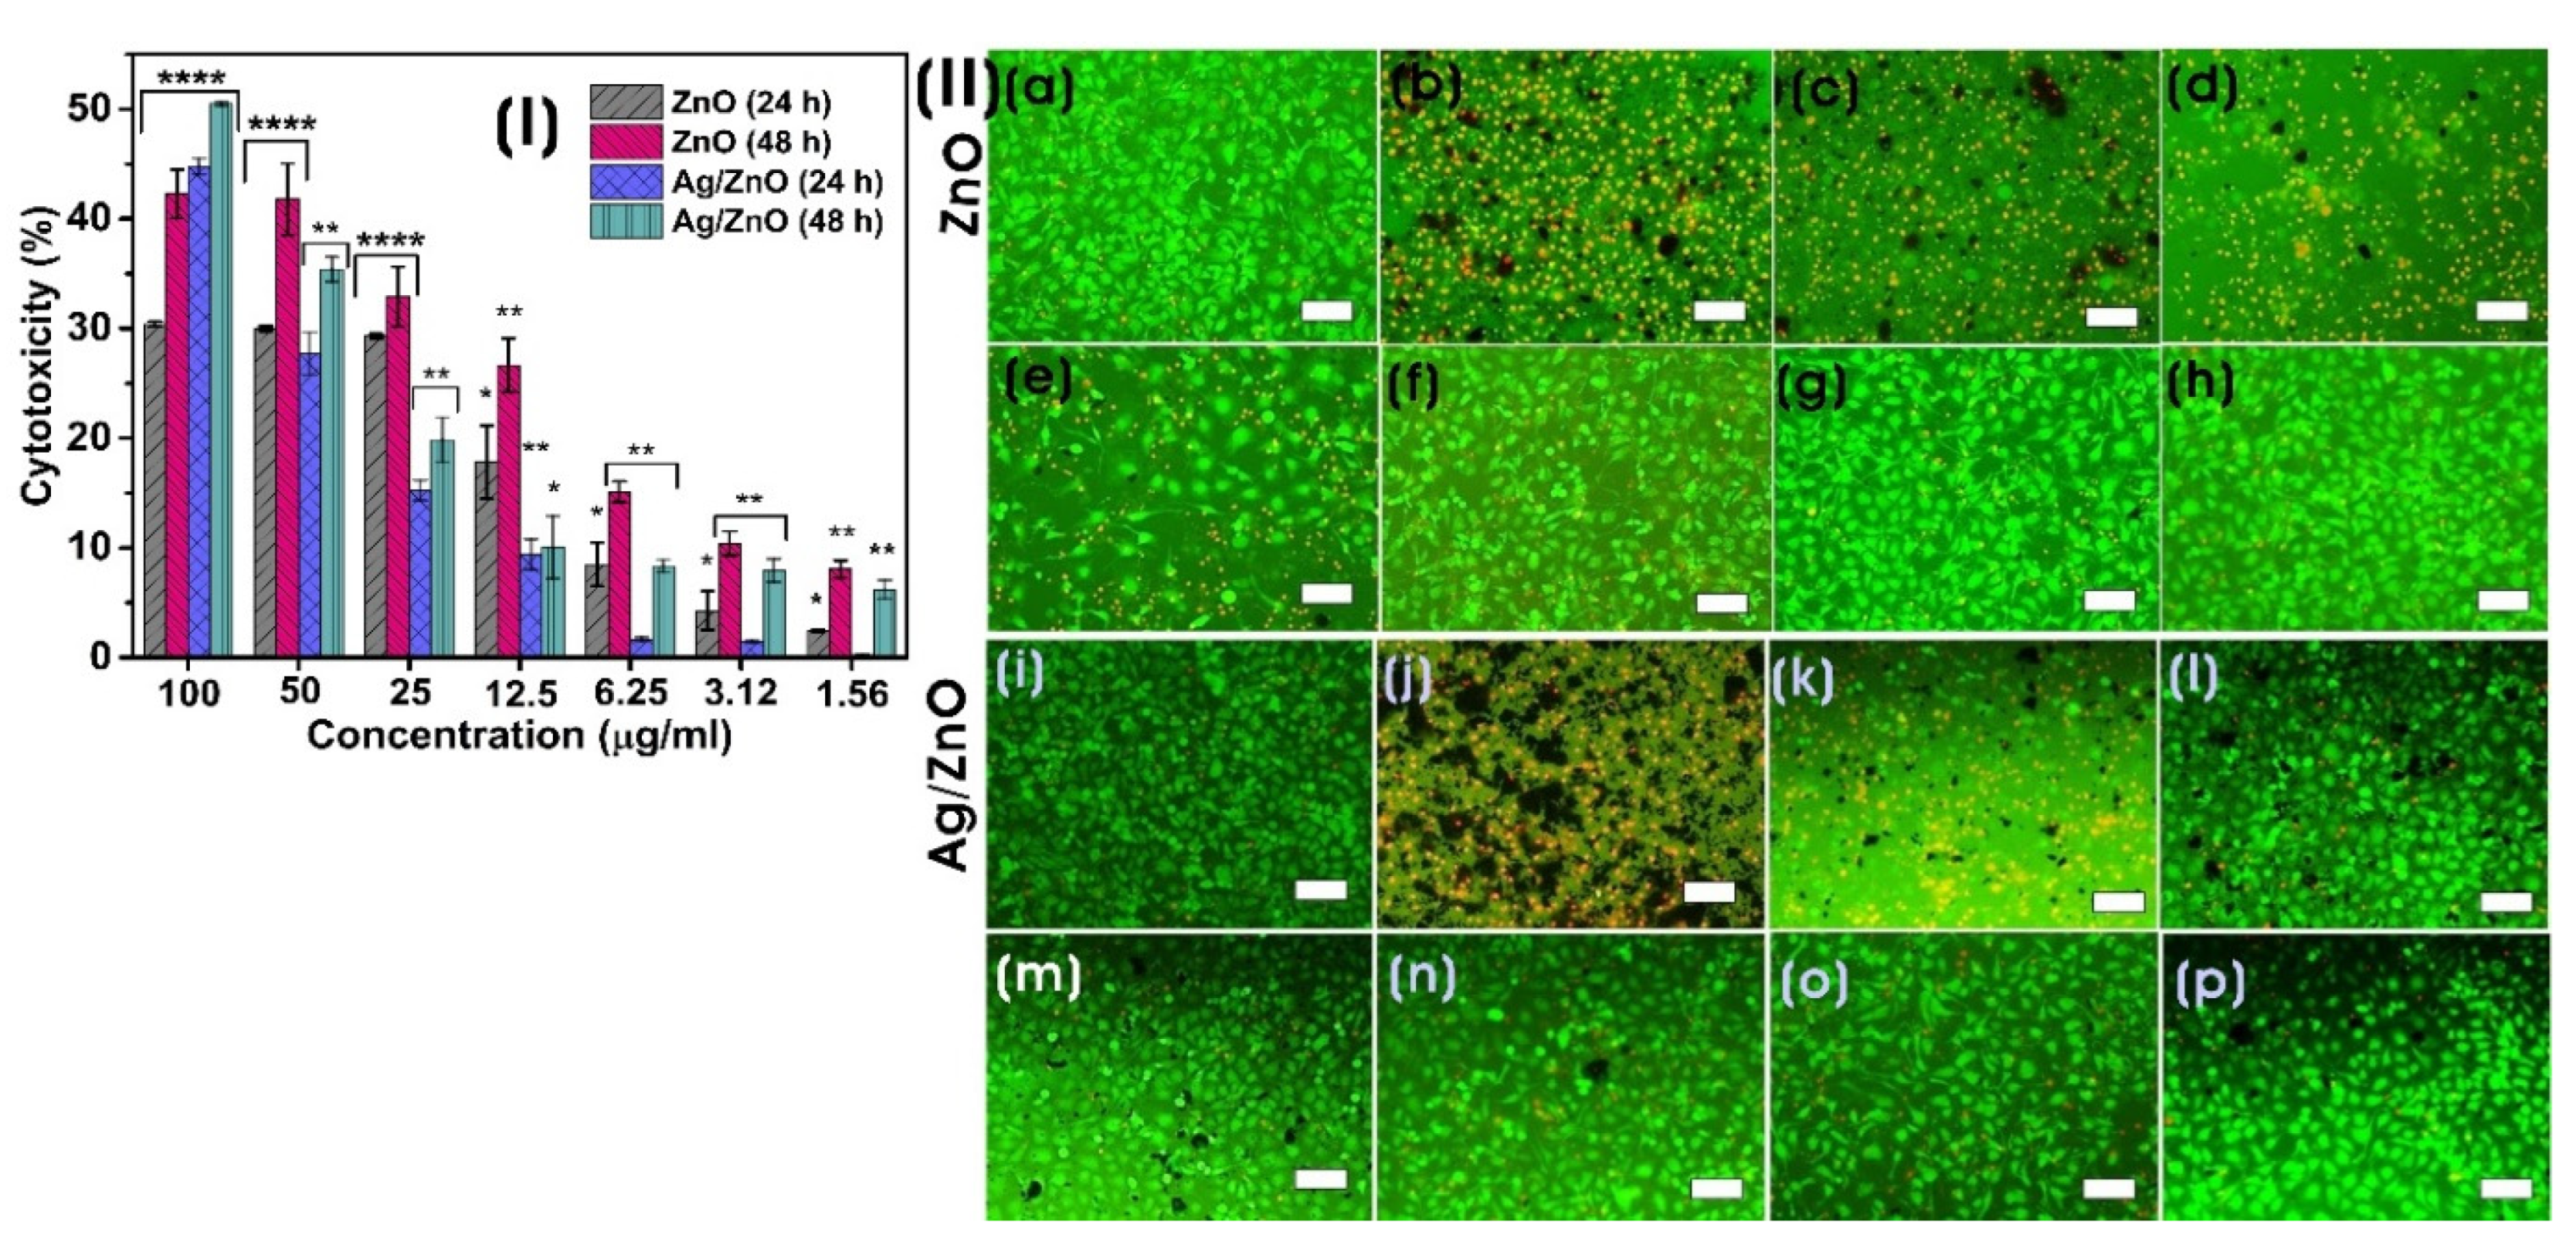
3.3.2. In Vitro Cytotoxicity Assay
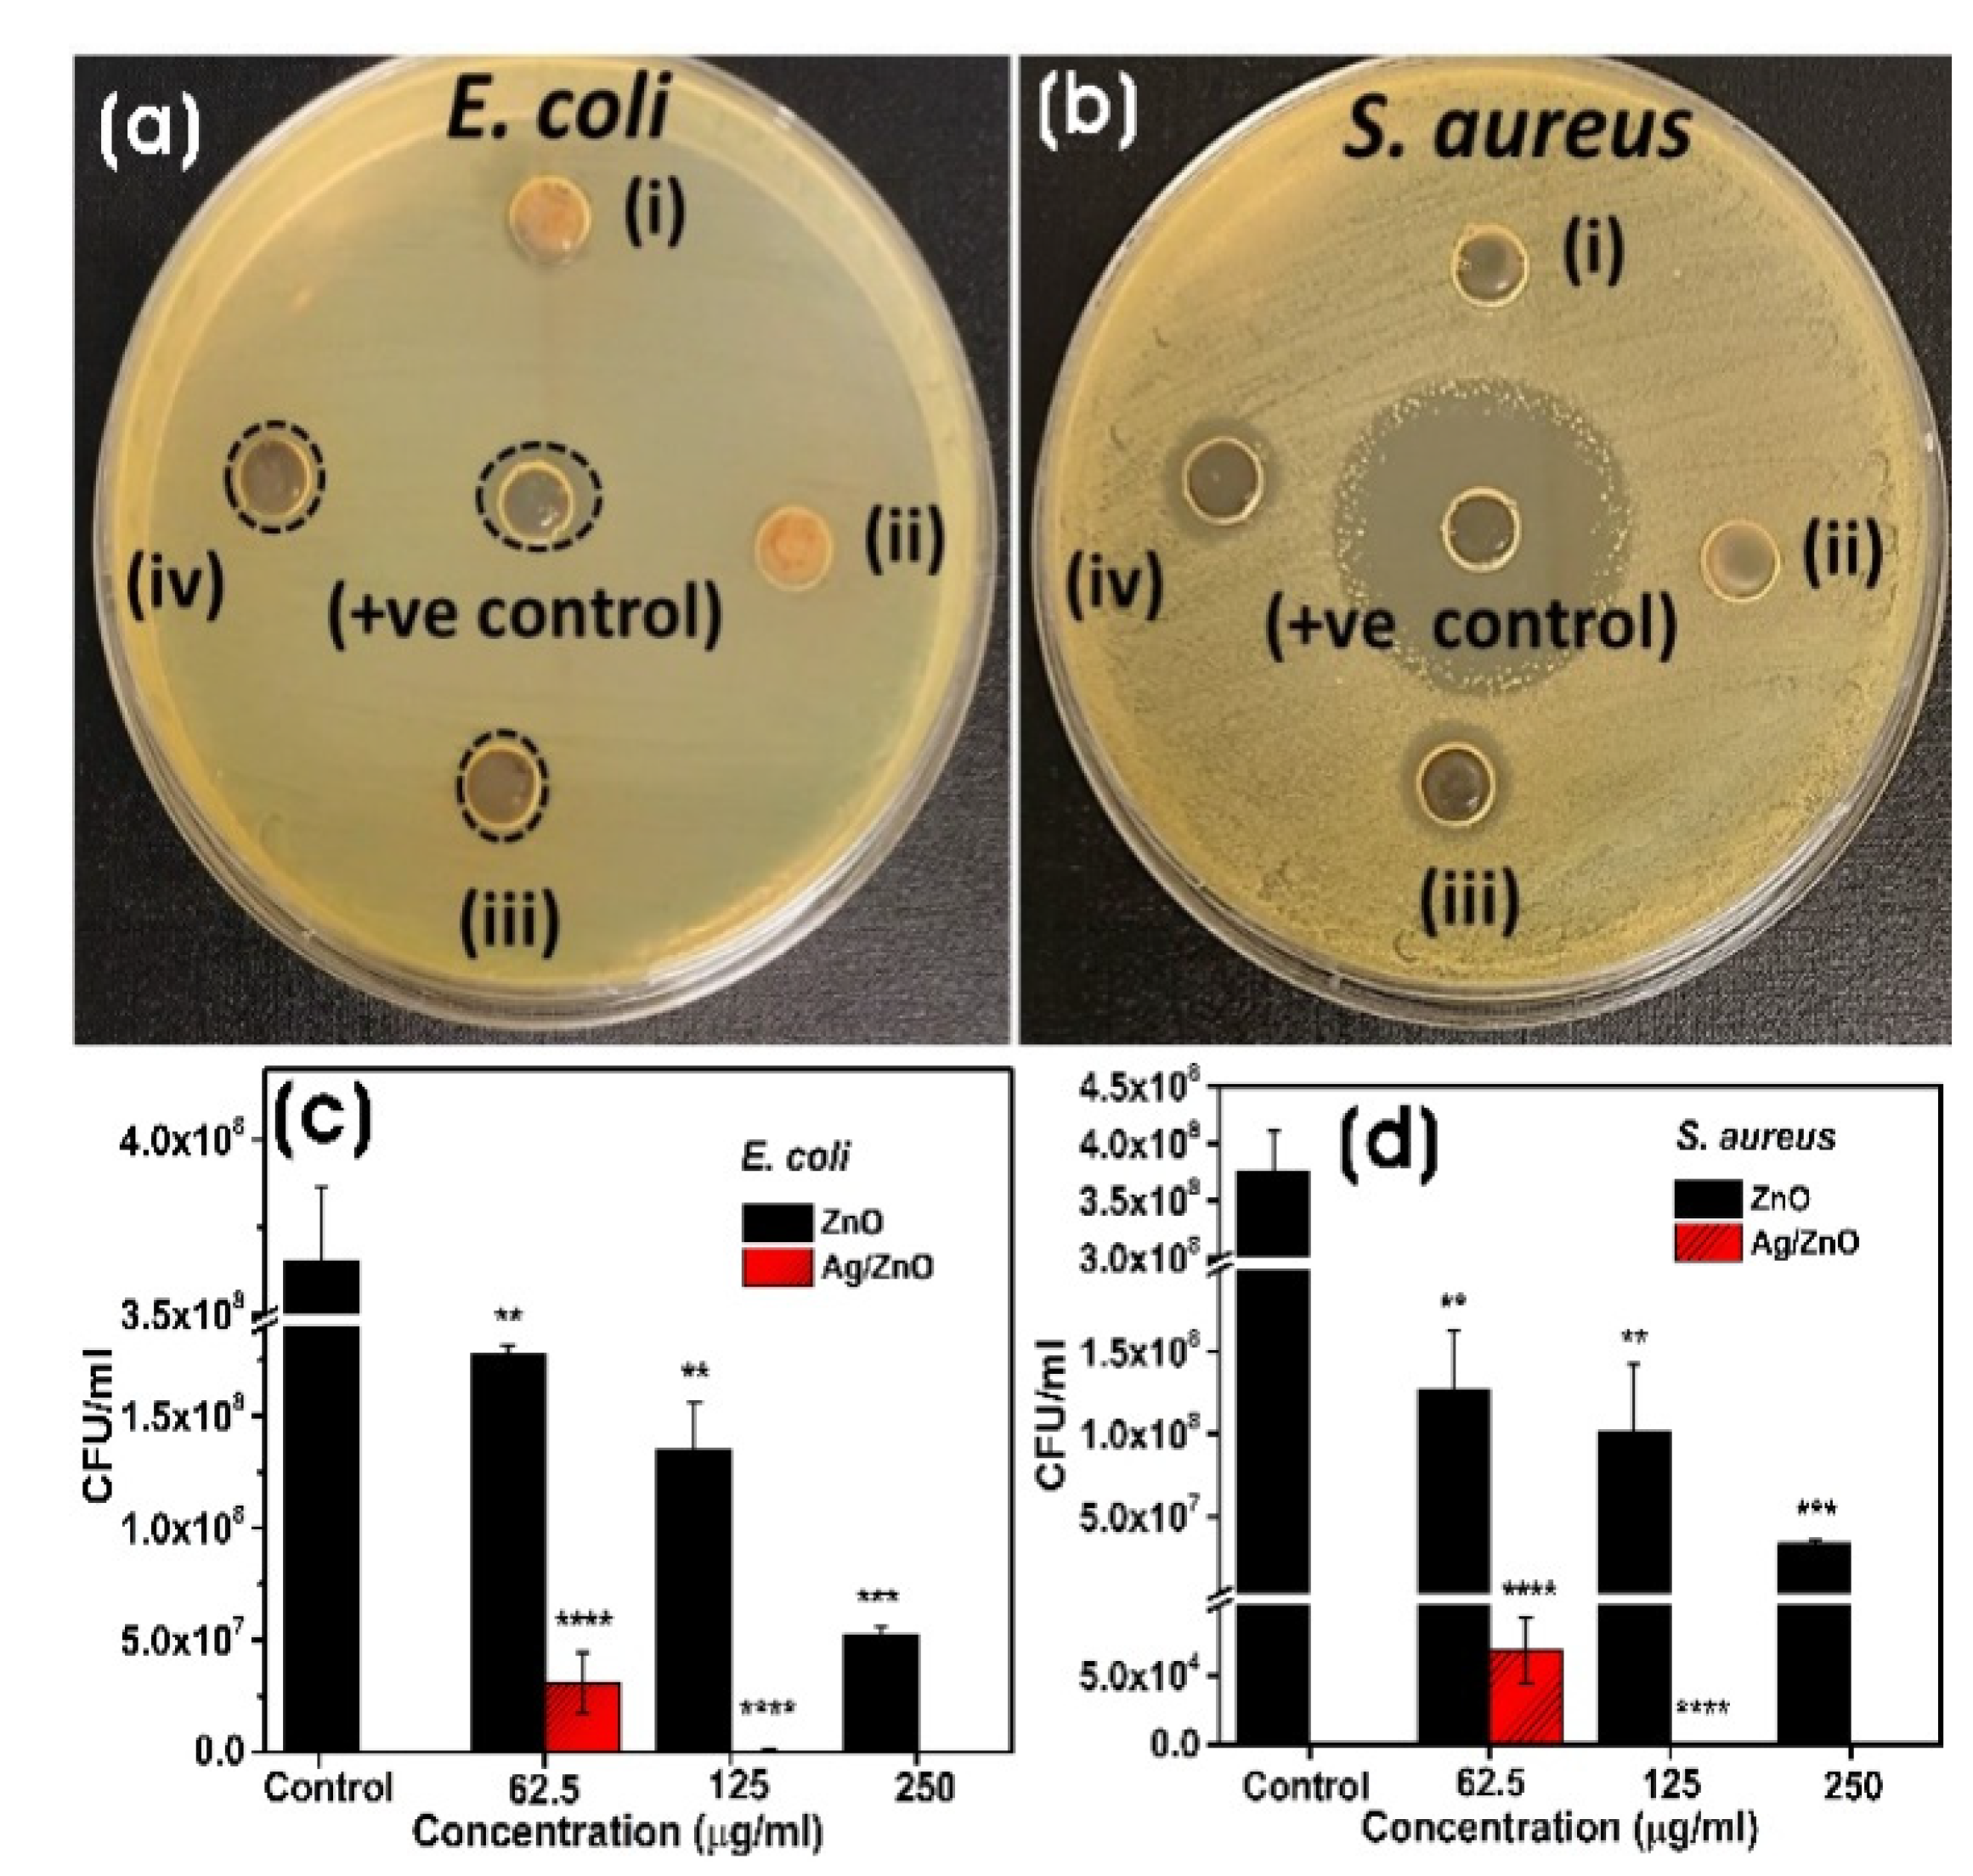
3.3.3. Antibacterial Assay
4. Conclusions
Supplementary Materials
Acknowledgments
CRediT Authors
Declaration of Competing Interest
References
- Sharwani, A.A.; Narayanan, K.B.; Khan, M.E.; Han, S.S. Photocatalytic degradation activity of goji berry extract synthesized silver-loaded mesoporous zinc oxide (Ag@ ZnO) nanocomposites under simulated solar light irradiation. Scientific Reports 2022, 12, 10017. [Google Scholar] [CrossRef]
- Castro, A.M.; Nogueira, V.; Lopes, I.; Rocha-Santos, T.; Pereira, R. Evaluation of the potential toxicity of effluents from the textile industry before and after treatment. Applied Sciences 2019, 9, 3804. [Google Scholar] [CrossRef]
- Cova, T.F.; Pais, A.A.; Seixas de Melo, J.S. Reconstructing the historical synthesis of mauveine from Perkin and Caro: procedure and details. Scientific reports 2017, 7, 6806. [Google Scholar] [CrossRef] [PubMed]
- Perkin, W. Producing a new coloring matter for dyeing with a lilac or purple color stuffs of silk, cotton, wool, or other materials. William Henry Perkin, United Kingdom, BP1984, 1856. [Google Scholar]
- Mondal, S.; Samanta, G.; De la Sen, M. Dynamics of Oxygen-Plankton Model with Variable Zooplankton Search Rate in Deterministic and Fluctuating Environments. Mathematics 2022, 10, 1641. [Google Scholar] [CrossRef]
- Kasperchik, V.; Yaskevich, A.; Bil’Dyukevich, A. Wastewater treatment for removal of dyes by coagulation and membrane processes. Petroleum Chemistry 2012, 52, 545–556. [Google Scholar] [CrossRef]
- Zhang, J.; Wang, F.; Yalamarty, S.S.K.; Filipczak, N.; Jin, Y.; Li, X. Nano silver-induced toxicity and associated mechanisms. International Journal of Nanomedicine 2022, 1851–1864. [Google Scholar] [CrossRef]
- Chandran, H.; Meena, M.; Sharma, K. Microbial biodiversity and bioremediation assessment through omics approaches. Frontiers in Environmental Chemistry 2020, 1, 570326. [Google Scholar] [CrossRef]
- Patel, H.; Yadav, V.K.; Yadav, K.K.; Choudhary, N.; Kalasariya, H.; Alam, M.M.; Gacem, A.; Amanullah, M.; Ibrahium, H.A.; Park, J.-W. A recent and systemic approach towards microbial biodegradation of dyes from textile industries. Water 2022, 14, 3163. [Google Scholar] [CrossRef]
- Talha, M.A.; Goswami, M.; Giri, B.; Sharma, A.; Rai, B.; Singh, R. Bioremediation of Congo red dye in immobilized batch and continuous packed bed bioreactor by Brevibacillus parabrevis using coconut shell bio-char. Bioresource technology 2018, 252, 37–43. [Google Scholar] [CrossRef]
- Narayanan, K.B.; Sakthivel, N. Biological synthesis of metal nanoparticles by microbes. Advances in colloid and interface science 2010, 156, 1–13. [Google Scholar] [CrossRef]
- Narayanan, K.B.; Sakthivel, N. Green synthesis of biogenic metal nanoparticles by terrestrial and aquatic phototrophic and heterotrophic eukaryotes and biocompatible agents. Advances in colloid and interface science 2011, 169, 59–79. [Google Scholar] [CrossRef]
- Mao, T.; Liu, M.; Lin, L.; Cheng, Y.; Fang, C. A Study on Doping and Compound of Zinc Oxide Photocatalysts. Polymers 2022, 14, 4484. [Google Scholar] [CrossRef] [PubMed]
- Harish, S.; Archana, J.; Sabarinathan, M.; Navaneethan, M.; Nisha, K.; Ponnusamy, S.; Muthamizhchelvan, C.; Ikeda, H.; Aswal, D.; Hayakawa, Y. Controlled structural and compositional characteristic of visible light active ZnO/CuO photocatalyst for the degradation of organic pollutant. Applied Surface Science 2017, 418, 103–112. [Google Scholar] [CrossRef]
- Yu, C.; Yang, K.; Xie, Y.; Fan, Q.; Jimmy, C.Y.; Shu, Q.; Wang, C. Novel hollow Pt-ZnO nanocomposite microspheres with hierarchical structure and enhanced photocatalytic activity and stability. Nanoscale 2013, 5, 2142–2151. [Google Scholar] [CrossRef]
- Kareem, M.; Bello, I.; Shittu, H.; Sivaprakash, P.; Adedokun, O.; Arumugam, S. Synthesis, characterization, and photocatalytic application of silver doped zinc oxide nanoparticles. Cleaner Materials 2022, 3, 100041. [Google Scholar] [CrossRef]
- Roy, T.S.; Akter, S.; Fahim, M.R.; Gafur, M.A.; Ferdous, T. Incorporation of Ag-doped ZnO nanorod through graphite hybridization: Effective approach for degradation of ciprofloxacin. Heliyon 2023, e13130. [Google Scholar] [CrossRef]
- Rafique, S.; Bashir, S.; Akram, R.; Jawaid, S.; Bashir, M.; Aftab, A.; Attique, A.; Awan, S.U. In vitro anticancer activity and comparative green synthesis of ZnO/Ag nanoparticles by moringa oleifera, mentha piperita, and citrus lemon. Ceramics International 2023, 49, 5613–5620. [Google Scholar] [CrossRef]
- Narayanan, K.B.; Choi, S.M.; Han, S.S. Biofabrication of Lysinibacillus sphaericus-reduced graphene oxide in three-dimensional polyacrylamide/carbon nanocomposite hydrogels for skin tissue engineering. Colloids and Surfaces B: Biointerfaces 2019, 181, 539–548. [Google Scholar] [CrossRef]
- Narayanan, K.B.; Park, G.T.; Han, S.S. Antibacterial properties of starch-reduced graphene oxide–polyiodide nanocomposite. Food Chemistry 2021, 342, 128385. [Google Scholar] [CrossRef]
- Singh, A.; Singh, N.á.; Afzal, S.; Singh, T.; Hussain, I. Zinc oxide nanoparticles: a review of their biological synthesis, antimicrobial activity, uptake, translocation and biotransformation in plants. Journal of materials science 2018, 53, 185–201. [Google Scholar] [CrossRef]
- Jain, D.; Shivani; Bhojiya, A. A.; Singh, H.; Daima, H.K.; Singh, M.; Mohanty, S.R.; Stephen, B.J.; Singh, A. Microbial fabrication of zinc oxide nanoparticles and evaluation of their antimicrobial and photocatalytic properties. Frontiers in chemistry 2020, 8, 778. [Google Scholar] [CrossRef]
- Davaeifar, S.; Modarresi, M.-H.; Mohammadi, M.; Hashemi, E.; Shafiei, M.; Maleki, H.; Vali, H.; Zahiri, H.S.; Noghabi, K.A. Synthesizing, characterizing, and toxicity evaluating of Phycocyanin-ZnO nanorod composites: a back to nature approaches. Colloids and Surfaces B: Biointerfaces 2019, 175, 221–230. [Google Scholar] [CrossRef]
- Singh, B.N.; Rawat, A.K.S.; Khan, W.; Naqvi, A.H.; Singh, B.R. Biosynthesis of stable antioxidant ZnO nanoparticles by Pseudomonas aeruginosa rhamnolipids. PLoS One 2014, 9, e106937. [Google Scholar] [CrossRef] [PubMed]
- Kyomuhimbo, H.D.; Michira, I.N.; Mwaura, F.B.; Derese, S.; Feleni, U.; Iwuoha, E.I. Silver–zinc oxide nanocomposite antiseptic from the extract of bidens pilosa. SN Applied Sciences 2019, 1, 1–17. [Google Scholar] [CrossRef]
- Mousavi-Kouhi, S.M.; Beyk-Khormizi, A.; Amiri, M.S.; Mashreghi, M.; Yazdi, M.E.T. Silver-zinc oxide nanocomposite: From synthesis to antimicrobial and anticancer properties. Ceramics International 2021, 47, 21490–21497. [Google Scholar] [CrossRef]
- Mahmudin, L.; Suharyadi, E.; Utomo, A.B.S.; Abraha, K. Influence of stabilizing agent and synthesis temperature on the optical properties of silver nanoparticles as active materials in surface plasmon resonance (SPR) biosensor. In Proceedings of the AIP Conference Proceedings; 2016; p. 020041. [Google Scholar]
- Jobe, M.C.; Mthiyane, D.M.; Mwanza, M.; Onwudiwe, D.C. Biosynthesis of zinc oxide and silver/zinc oxide nanoparticles from Urginea epigea for antibacterial and antioxidant applications. Heliyon 2022, 8, e12243. [Google Scholar] [CrossRef] [PubMed]
- Fouladi-Fard, R.; Aali, R.; Mohammadi-Aghdam, S.; Mortazavi-derazkola, S. The surface modification of spherical ZnO with Ag nanoparticles: A novel agent, biogenic synthesis, catalytic and antibacterial activities. Arabian Journal of Chemistry 2022, 15, 103658. [Google Scholar] [CrossRef]
- Makuła, P.; Pacia, M.; Macyk, W. How to correctly determine the band gap energy of modified semiconductor photocatalysts based on UV–Vis spectra. 2018, 9, 6814–6817.
- Xu, J.-J.; Lu, Y.-N.; Tao, F.-F.; Liang, P.-F.; Zhang, P.-A. ZnO Nanoparticles Modified by Carbon Quantum Dots for the Photocatalytic Removal of Synthetic Pigment Pollutants. ACS omega 2023, 8, 7845–7857. [Google Scholar] [CrossRef] [PubMed]
- Al-Ariki, S.; Yahya, N.A.; Al-A’nsi, S.a.A.; Jumali, M.H.; Jannah, A.; Abd-Shukor, R. Synthesis and comparative study on the structural and optical properties of ZnO doped with Ni and Ag nanopowders fabricated by sol gel technique. Scientific Reports 2021, 11, 11948. [Google Scholar] [CrossRef]
- Ren, T.; Baker, H.R.; Poduska, K.M. Optical absorption edge shifts in electrodeposited ZnO thin films. Thin Solid Films 2007, 515, 7976–7983. [Google Scholar] [CrossRef]
- Saboor, A.; Shah, S.M.; Hussain, H. Band gap tuning and applications of ZnO nanorods in hybrid solar cell: Ag-doped verses Nd-doped ZnO nanorods. Materials Science in Semiconductor Processing 2019, 93, 215–225. [Google Scholar] [CrossRef]
- Dasari, M.P.; Godavarti, U.; Mote, V. Structural, morphological, magnetic and electrical properties of Ni-doped ZnO nanoparticles synthesized by co-precipitation method. Processing and Application of Ceramics 2018, 12, 100–110. [Google Scholar] [CrossRef]
- Elhamdi, I.; Souissi, H.; Taktak, O.; Elghoul, J.; Kammoun, S.; Dhahri, E.; Costa, B.F. Experimental and modeling study of ZnO: Ni nanoparticles for near-infrared light emitting diodes. RSC advances 2022, 12, 13074–13086. [Google Scholar] [CrossRef]
- Bonifácio, M.A.R.; Lira, H.d.L.; Neiva, L.S.; Kiminami, R.H.; Gama, L. Nanoparticles of ZnO doped with Mn: Structural and morphological characteristics. Materials Research 2017, 20, 1044–1049. [Google Scholar] [CrossRef]
- Sajjad, M.; Ullah, I.; Khan, M.; Khan, J.; Khan, M.Y.; Qureshi, M.T. Structural and optical properties of pure and copper doped zinc oxide nanoparticles. Results in Physics 2018, 9, 1301–1309. [Google Scholar] [CrossRef]
- Riza, M.A.; Go, Y.I.; Harun, S.W.; Anas, S.B.A. Effect of additive concentration on crystalline surface of ZnO nanostructures morphology for enhanced humidity sensing. Sensors International 2023, 4, 100211. [Google Scholar] [CrossRef]
- Ismail, A.; Menazea, A.; Kabary, H.A.; El-Sherbiny, A.; Samy, A. The influence of calcination temperature on structural and antimicrobial characteristics of zinc oxide nanoparticles synthesized by Sol–Gel method. Journal of Molecular Structure 2019, 1196, 332–337. [Google Scholar] [CrossRef]
- Blount, P.; Marder, L.; Oyegoke, J.; Trad, T. The effects of copper doping on morphology and room-temperature photoluminescence of ZnO nanocolumns. RSC advances 2022, 12, 32667–32672. [Google Scholar] [CrossRef]
- Kothe, L.; Albert, M.; Meier, C.; Wagner, T.; Tiemann, M. Stimulation and Enhancement of Near-Band-Edge Emission in Zinc Oxide by Distributed Bragg Reflectors. Advanced Materials Interfaces 2022, 9, 2102357. [Google Scholar] [CrossRef]
- Gupta, J.; Mohapatra, J.; Bahadur, D. Visible light driven mesoporous Ag-embedded ZnO nanocomposites: reactive oxygen species enhanced photocatalysis, bacterial inhibition and photodynamic therapy. Dalton Transactions 2017, 46, 685–696. [Google Scholar] [CrossRef]
- Vanheusden, K.; Warren, W.; Seager, C.; Tallant, D.; Voigt, J.; Gnade, B. Mechanisms behind green photoluminescence in ZnO phosphor powders. Journal of Applied Physics 1996, 79, 7983–7990. [Google Scholar] [CrossRef]
- Zheng, Y.; Chen, C.; Zhan, Y.; Lin, X.; Zheng, Q.; Wei, K.; Zhu, J. Photocatalytic activity of Ag/ZnO heterostructure nanocatalyst: correlation between structure and property. The Journal of Physical Chemistry C 2008, 112, 10773–10777. [Google Scholar] [CrossRef]
- Alharthi, F.A.; Alghamdi, A.A.; Al-Zaqri, N.; Alanazi, H.S.; Alsyahi, A.A.; Marghany, A.E.; Ahmad, N. Facile one-pot green synthesis of Ag–ZnO Nanocomposites using potato peeland their Ag concentration dependent photocatalytic properties. Scientific Reports 2020, 10, 20229. [Google Scholar] [CrossRef]
- Essawy, A.A. Silver imprinted zinc oxide nanoparticles: Green synthetic approach, characterization and efficient sunlight-induced photocatalytic water detoxification. Journal of Cleaner Production 2018, 183, 1011–1020. [Google Scholar] [CrossRef]
- Kumar, A.; Sharma, G.; Naushad, M.; Singh, P.; Kalia, S. Polyacrylamide/Ni0. 02Zn0. 98O nanocomposite with high solar light photocatalytic activity and efficient adsorption capacity for toxic dye removal. Industrial & Engineering Chemistry Research 2014, 53, 15549–15560. [Google Scholar]
- Ha, L.P.P.; Vinh, T.H.T.; Thuy, N.T.B.; Thi, C.M.; Viet, P.V. Visible-light-driven photocatalysis of anisotropic silver nanoparticles decorated on ZnO nanorods: Synthesis and characterizations. Journal of Environmental Chemical Engineering 2021, 9, 105103. [Google Scholar] [CrossRef]
- Zhang, C.; Kong, C.; Tratnyek, P.G.; Qin, C. Generation of reactive oxygen species and degradation of pollutants in the Fe2+/O2/tripolyphosphate system: Regulated by the concentration ratio of Fe2+ and tripolyphosphate. Environmental Science & Technology 2022, 56, 4367–4376. [Google Scholar]
- Khorrami, S.; Zarrabi, A.; Khaleghi, M.; Danaei, M.; Mozafari, M. Selective cytotoxicity of green synthesized silver nanoparticles against the MCF-7 tumor cell line and their enhanced antioxidant and antimicrobial properties. International journal of nanomedicine 2018, 13, 8013. [Google Scholar] [CrossRef]
- Rohde, M.M.; Snyder, C.M.; Sloop, J.; Solst, S.R.; Donati, G.L.; Spitz, D.R.; Furdui, C.M.; Singh, R. The mechanism of cell death induced by silver nanoparticles is distinct from silver cations. Particle and Fibre Toxicology 2021, 18, 1–24. [Google Scholar] [CrossRef]
- Hussain, A.; Oves, M.; Alajmi, M.F.; Hussain, I.; Amir, S.; Ahmed, J.; Rehman, M.T.; El-Seedi, H.R.; Ali, I. Biogenesis of ZnO nanoparticles using Pandanus odorifer leaf extract: anticancer and antimicrobial activities. RSC advances 2019, 9, 15357–15369. [Google Scholar] [CrossRef]
- Chandrasekaran, S.; Anusuya, S.; Anbazhagan, V. Anticancer, anti-diabetic, antimicrobial activity of zinc oxide nanoparticles: A comparative analysis. Journal of Molecular Structure 2022, 1263, 133139. [Google Scholar] [CrossRef]
- Tanino, R.; Amano, Y.; Tong, X.; Sun, R.; Tsubata, Y.; Harada, M.; Fujita, Y.; Isobe, T. Anticancer activity of ZnO nanoparticles against human small-cell lung cancer in an orthotopic mouse ModelZnO nanoparticles inhibit growth of small-cell lung cancer. Molecular cancer therapeutics 2020, 19, 502–512. [Google Scholar] [CrossRef] [PubMed]
- González, S.E.; Bolaina-Lorenzo, E.; Pérez-Trujillo, J.; Puente-Urbina, B.; Rodríguez-Fernández, O.; Fonseca-García, A.; Betancourt-Galindo, R. Antibacterial and anticancer activity of ZnO with different morphologies: a comparative study. 3 Biotech 2021, 11, 1–12. [Google Scholar] [CrossRef] [PubMed]
- Wang, H.; Xing, Z.; Sun, Y.; Jing, Y.; Zhang, J.; Li, X.; Zhang, H.; Shakoor, A.; Guo, J. UV-irradiating synthesis of cyclodextrin–silver nanocluster decorated TiO2 nanoparticles for photocatalytic enhanced anticancer effect on HeLa cancer cells. Frontiers in Chemistry 2022, 10. [Google Scholar] [CrossRef]
- Tenjin, T.; Yoshino, N.; Tanaka, S. Evaluation of cell viability by double-staining fluorescence assay. Gan to Kagaku ryoho. Cancer & Chemotherapy 2002, 29, 2025–2029. [Google Scholar]
- Álvarez-Chimal, R.; García-Pérez, V.I.; Álvarez-Pérez, M.A.; Tavera-Hernández, R.; Reyes-Carmona, L.; Martínez-Hernández, M.; Arenas-Alatorre, J.Á. Influence of the particle size on the antibacterial activity of green synthesized zinc oxide nanoparticles using Dysphania ambrosioides extract, supported by molecular docking analysis. Arabian Journal of Chemistry 2022, 15, 103804. [Google Scholar] [CrossRef]
- Menichetti, A.; Mavridi-Printezi, A.; Mordini, D.; Montalti, M. Effect of Size, Shape and Surface Functionalization on the Antibacterial Activity of Silver Nanoparticles. Journal of Functional Biomaterials 2023, 14, 244. [Google Scholar] [CrossRef]
- Singh, R.; Cheng, S.; Singh, S. Oxidative stress-mediated genotoxic effect of zinc oxide nanoparticles on Deinococcus radiodurans. 3 Biotech 2020, 10, 1–13. [Google Scholar] [CrossRef]
- Yu, Z.; Li, Q.; Wang, J.; Yu, Y.; Wang, Y.; Zhou, Q.; Li, P. Reactive oxygen species-related nanoparticle toxicity in the biomedical field. Nanoscale research letters 2020, 15, 1–14. [Google Scholar] [CrossRef]

Disclaimer/Publisher’s Note: The statements, opinions and data contained in all publications are solely those of the individual author(s) and contributor(s) and not of MDPI and/or the editor(s). MDPI and/or the editor(s) disclaim responsibility for any injury to people or property resulting from any ideas, methods, instructions or products referred to in the content. |
© 2023 by the authors. Licensee MDPI, Basel, Switzerland. This article is an open access article distributed under the terms and conditions of the Creative Commons Attribution (CC BY) license (http://creativecommons.org/licenses/by/4.0/).


