Preprint
Article

Rapid Urbanization Change the Driving Factors of Groundwater Chemical Evolution in the World’s Largest Groundwater Depression Funnel Area, China

Altmetrics

Downloads

95

Views

27

Comments

0

A peer-reviewed article of this preprint also exists.

This version is not peer-reviewed

Submitted:

30 June 2023

Posted:

03 July 2023

You are already at the latest version

Alerts
Abstract
With the rapid development of urbanization, the chemical evolution of groundwater is significantly affected by human activities. However, the driving mechanisms of groundwater chemical evolution at different stages of urbanization remain unclear, severely impacting the implementation of groundwater protection. This study investigated the driving mechanisms of groundwater chemical evolution based on the long-term series (from 1985 to 2015) of hydrochemical data from 19 groundwater monitoring sites in rapidly urbanizing areas (Shijiazhuang, Hebei Province, China). The results show that the concentrations of various chemical components in groundwater gradually increase with the acceleration of urbanization process, especially NO3-, which has increased from 13.7 mg/L in the primary stage of urbanization (PSU) to 65.1mg/L in the advanced stage of urbanization (ASU), exceeding the WHO drinking water standard (50mg/L), indicating that the groundwater chemistry has been significantly affected by human activities. It is interesting to find that the main hydrochemical types have changed from HCO3•SO4-Ca•Mg type water in the PSU to SO4•HCO3-Ca•Mg type water in the ASU. It is worth noting that there were obvious differences in driving factors of groundwater chemical evolution at different urbanization stages. In the PSU, the driving factors of groundwater chemical evolution were carbonate and rock salt dissolution, cation exchange, and industrial activities. However, in the intermediate stage and advanced stage, the driving factors of groundwater chemical evolution were changed to carbonate and gypsum dissolution, groundwater over-exploitation, agricultural fertilization, and domestic sewage. Based on the above conclusions, it is suggested that future groundwater management should control the amount of agricultural fertilizers, apply scientific fertilization, and prohibit the discharge of various types of non-compliant sewage, while strengthening the supervision of groundwater extraction to reduce the impact of urbanization development on the groundwater chemical evolution process.
Keywords: 
Subject: Environmental and Earth Sciences  -   Geochemistry and Petrology

1. Introduction

Groundwater, as an essential component of water resources, plays a vital role in maintaining ecological balance, ensuring residents' livelihoods, and supporting socio-economic development (Li et al.; 2021; Pashaeifar et al.; 2021; Peng et al.; 2022; Quinn and Oster, 2021, Sacc et al.; 2022, Qin et al.; 2023). The concentration and variation of various chemical components in groundwater have significant impacts on water quality and human health, making it extremely important to thoroughly understand the hydrochemical evolution process of groundwater (Stanley and Doyle, 2002, Israr et al.; 2022).
In recent years, with the rapid development of urbanization and industrialization processes, groundwater chemistry has been significantly affected by human activities such as sewage discharge and agricultural activities (Akakuru et al.; 2022; Kai and Peng, 2018, Rai and Saha, 2015; Villegas et al.; 2013; Sinha et al.; 2019;). Some researchers have studied the hydrochemical evolution in the Heilonggjiang area, China and found that groundwater chemical components are not only controlled by water-rock interaction, evaporation, and cation exchange but also impacted by domestic sewage (Liu et al.; 2022). Huang et al. (2013) discovered that the HCO3-Cl type, Cl-HCO3 type, and NO3-type waters frequently appear under the influence of human activities, making groundwater chemistry more diverse and complex. Additionally, researchers have found that socio-economic development and changes in land use also have some impact on the evolution of groundwater chemistry (Barron et al.; 2013, Zhang et al.; 2020). However, previous studies mainly focused on the influencing factors of groundwater hydrochemical evolution at the same time scale, while research on the impact of different stages of urbanization on the driving mechanisms of groundwater chemical evolution has not yet been reported.
To fill this research gap, we selected a typical area which strongly affected by human activities and experienced rapid urbanization—the Shijiazhuang section of Hutuo River alluvial fan (the largest groundwater funnel area in the North China Plain) (Huang et al.; 2015; Liu et al.; 2017; Zheng et al.; 2010; Zheng et al.; 2010) as our study area. Based on the long-term series data (over 30 years) from 19 groundwater sites, we focused on discussing the driving mechanisms of groundwater chemical evolution at different stages of urbanization. The objectives of this study are: (1) to analyze the impact of urbanization development on groundwater components and hydrochemical types; (2) to identify the influence mechanisms of natural factors and human activities on the hydrochemical evolution of groundwater at different stages of urbanization; (3) to reveal the driving factors of groundwater chemical evolution at different stages of urbanization through principal component analysis (PCA). The research results can provide important reference for the study of groundwater chemical evolution in areas yet to experience rapid urbanization and scientific basis for the protection of groundwater in rapidly urbanizing areas.

2. Materials and Methods

2.1. Study area overview

The Shijiazhuang section of Hutuo River alluvial fan is located in the piedmont inclined plain area at the eastern foot of Taihang Mountain in Hebei Province, China, with an area of about 1500Km2 (Figure 1). The study area has a permanent population of approximately 5.2 million and a cultivated land area of about 60 × 104 hectares. The region has distinct seasons and belongs to a semi-humid and semi-arid continental monsoon climate. The average annual precipitation is about 550 mm, unevenly distributed over time, mainly concentrating between April and September, accounting for 70% to 80% of the annual precipitation. The annual evaporation ranges from 1600mm to 2100mm, and the average annual temperature is 13.0°C (Ren et al.; 2020).

2.2. Geological and hydrogeological conditions

The strata in the study area are primarily composed of Quaternary sediments, and lithology mainly consists of sub-clay, sub-sandy soil, sandy silt clay, and gravel and sand layers of different particle sizes. Groundwater mainly occurs in the strata of Upper Pleistocene - Lower Pleistocene, and the aquifer lithology mainly includes sand gravel, coarse sand with gravel, and medium sand. The water table depth ranges from 12 to 240m, and the aquifer thickness is between 20 and 140m, both showing good conductivity and water yield. Shallow groundwater mainly receives recharge from atmospheric precipitation infiltration, lateral runoff, surface water infiltration, and agricultural irrigation return flow, among which atmospheric precipitation infiltration is the primary recharge method. Discharge is mainly through artificial extraction, followed by lateral runoff; deep groundwater flows from northwest to southeast, mainly recharged by lateral runoff, and discharges mainly through lateral runoff discharge and artificial extraction. Long-term severe over-extraction has led to the formation of the largest falling funnel in the North China Plain in the study area, which also affects groundwater chemical evolution.

2.3. Data sources and research methods

2.3.1. Data sources

The groundwater chemistry data in this study were obtained from the monitoring data of 19 regular groundwater monitoring stations between 1985 and 2015. The hydrochemical indicators include pH, K+, Na+, Ca2+, Mg2+, Cl-, SO42-, HCO3-, NO3-, total dissolved solids (TDS), and total hardness (TH).

2.3.2. Research methods

Based on the urbanization development level, the study area divided into three stages of urbanization. The first stage (1985~1995) is the primary stage of urbanization (PSU), with an urbanization rate less than 30.0%; the second stage (1986~2005) is the intermediate stage of urbanization (ISU), with an urbanization rate between 30% and 50%; the third stage (2006~2015) is the advanced stage of urbanization (ASU), with an urbanization rate between 50% and 75%.
In this study, Piper trilinear diagrams are used to interpret water chemical types and their changing characteristics; Gibbs diagrams, ion ratio analysis, and principal component analysis (PCA) are used to identify the main controlling factors of water chemical changes; map-making software is used for mapping. Data analysis and processing were carried out using SPSS 21(SPSS Inc.; Chicago, IL, USA), Origin 2022, and ArcGIS10.5software (ESRI Inc.; Redlands, CA, USA).

3. Results and Discussion

3.1. Analysis of groundwater chemical composition characteristics

3.1.1. pH

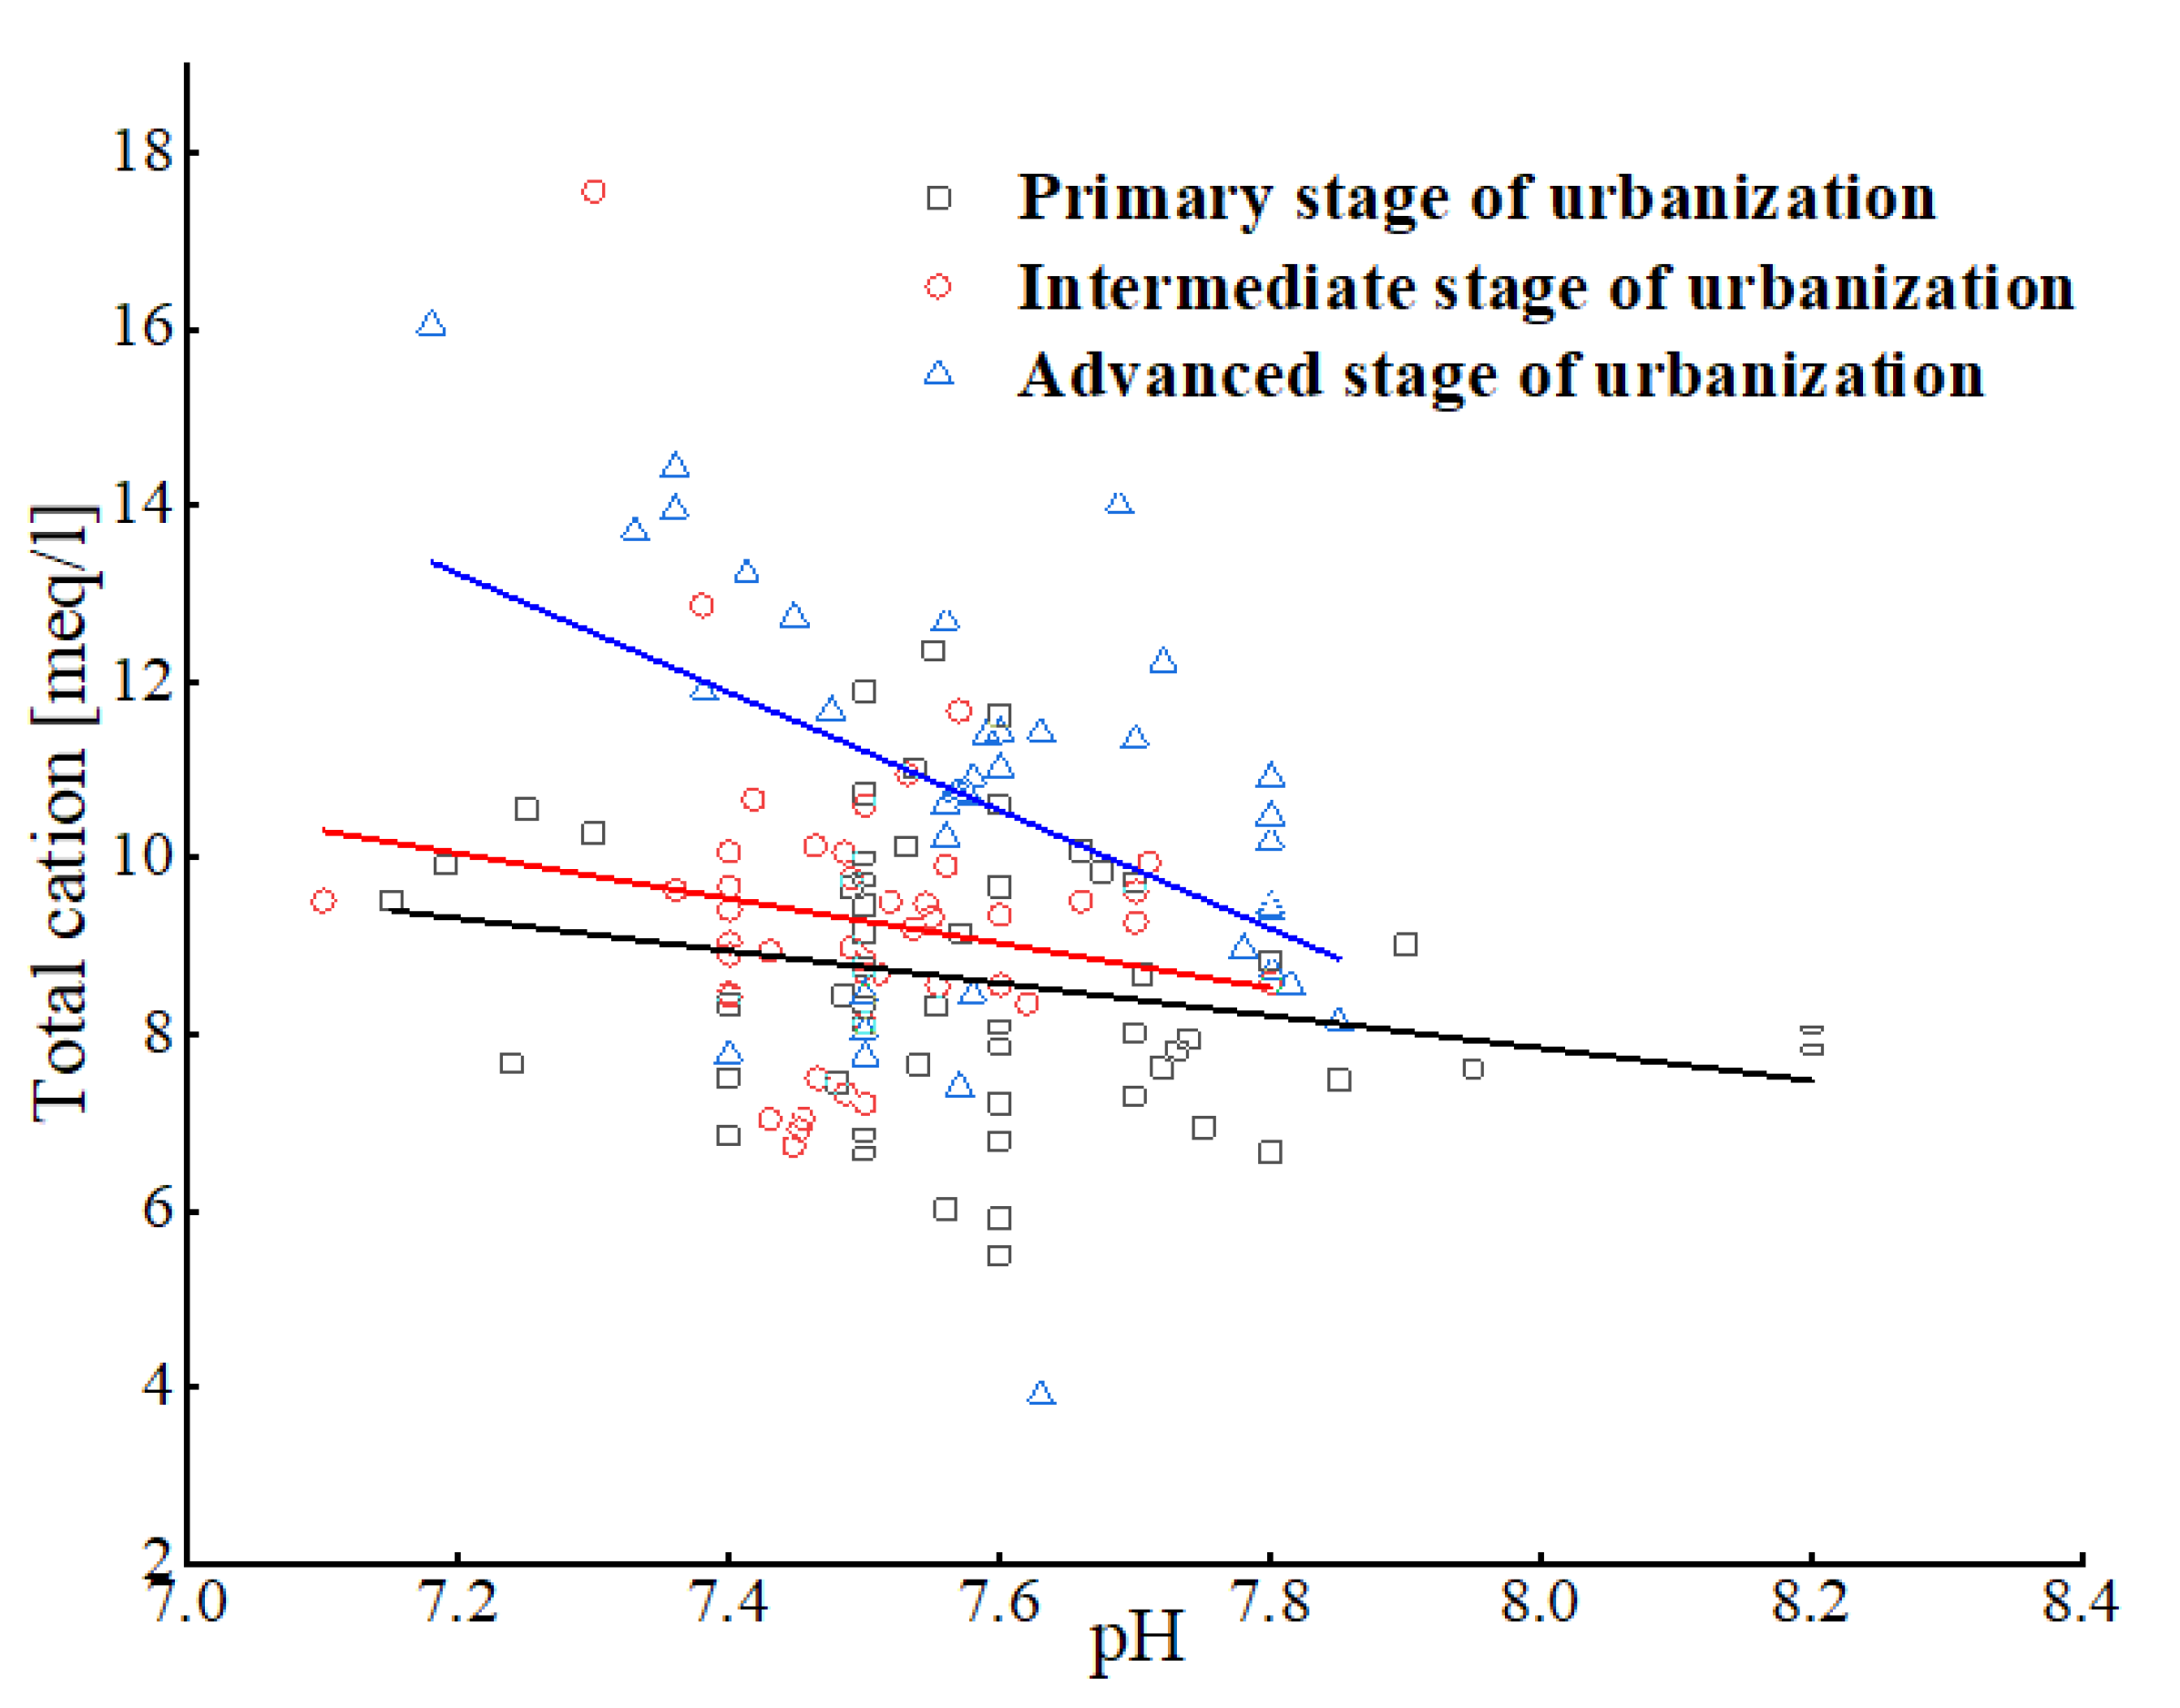
The pH of groundwater in the study area ranges from 7.18 to 8.20, with an average of 7.56, and showing neutral to weak alkaline properties. This is mainly because the study area is a semi-humid and semi-arid region with less precipitation, coupled with long-term over-exploitation of groundwater, which results in more salt-based ions being present in the groundwater. The pH fluctuations of different monitoring stations within different urbanization stages are small, meeting the WHO drinking water standard (pH between 6.5 and 8.5) (Cotruvo, 2017). The average pH values for the three development stages (PSU, ISU, and ASU) are 7.56, 7.52, and 7.50, respectively, showing a decreasing trend. Also, there is an inverse relationship between pH and major cation concentrations (Figure 2). This may be related to the carbon dioxide emissions from industrial and agricultural activities enter groundwater through precipitation infiltration due to the rapid urbanization in recent years, and leading to a decrease in pH value and an increase in cation concentration.

3.1.2. Ion characteristics analysis.

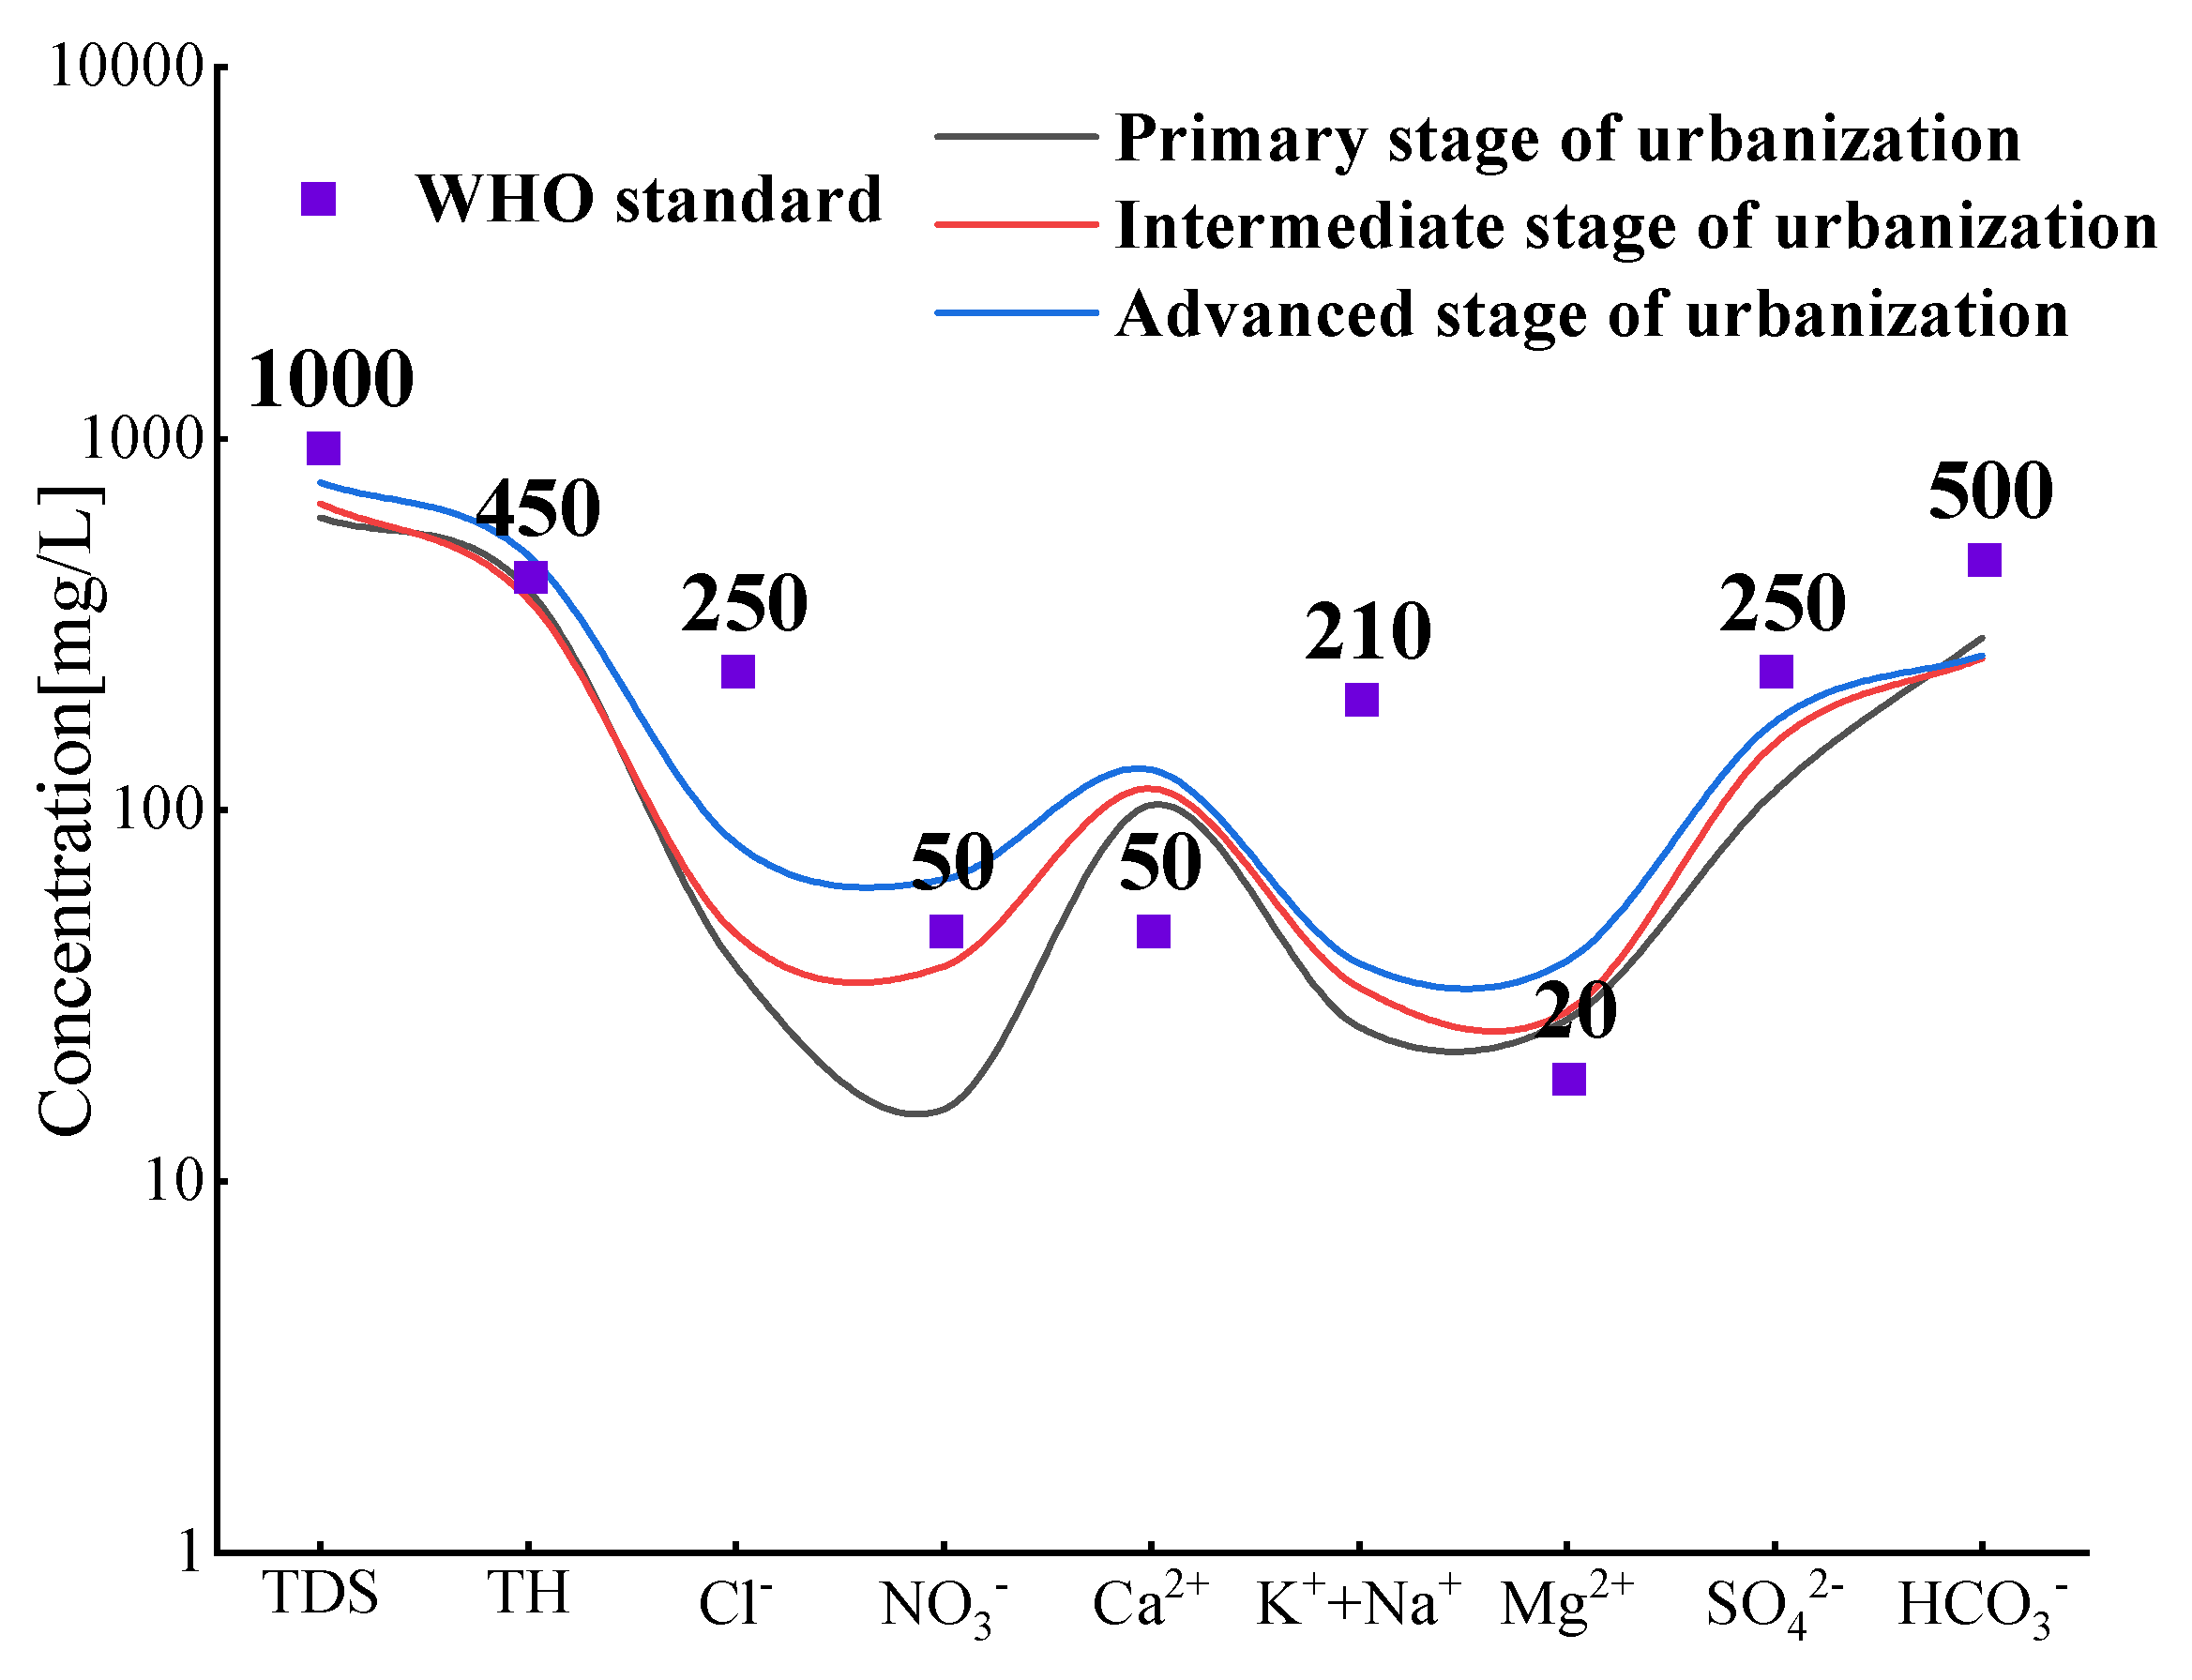
We analyzed the characteristics of the primary ion components in groundwater during the three urbanization stages based on a semi-logarithmic plot. As seen in Figure 3, the concentration of major ions in groundwater increases during three urbanization stages, and the degree of increase in the concentration of various ions is more apparent in the AUS. This indicates that frequent human activities have a strong impact on the chemical composition of groundwater. During the PSU, ISU, and ASU, the Ca2+ concentrations are 103 mg/L, 114 mg/L, and 128 mg/L, respectively, all exceeding the WHO water quality standard. This may be related to the lithology of the strata in the study area and long-term over-extraction (Fei et al; 2022). In addition, the concentrations of TH (485 mg/L) and NO3- (65.1 mg/L) in the ASU also exceed the WHO water quality standard. The high concentration of TH is mainly due to the continuous increase in Ca2+ and Mg2+ concentrations, while the concentration of NO3- exceeding standard is mainly related to human activities (Mukate et al.; 2022). Previous studies have found that NO3- in groundwater in the Hutuo River Basin mainly comes from domestic sewage and chemical fertilizers (Zhang and Wang, 2020).

3.2. Hydrochemical type analysis

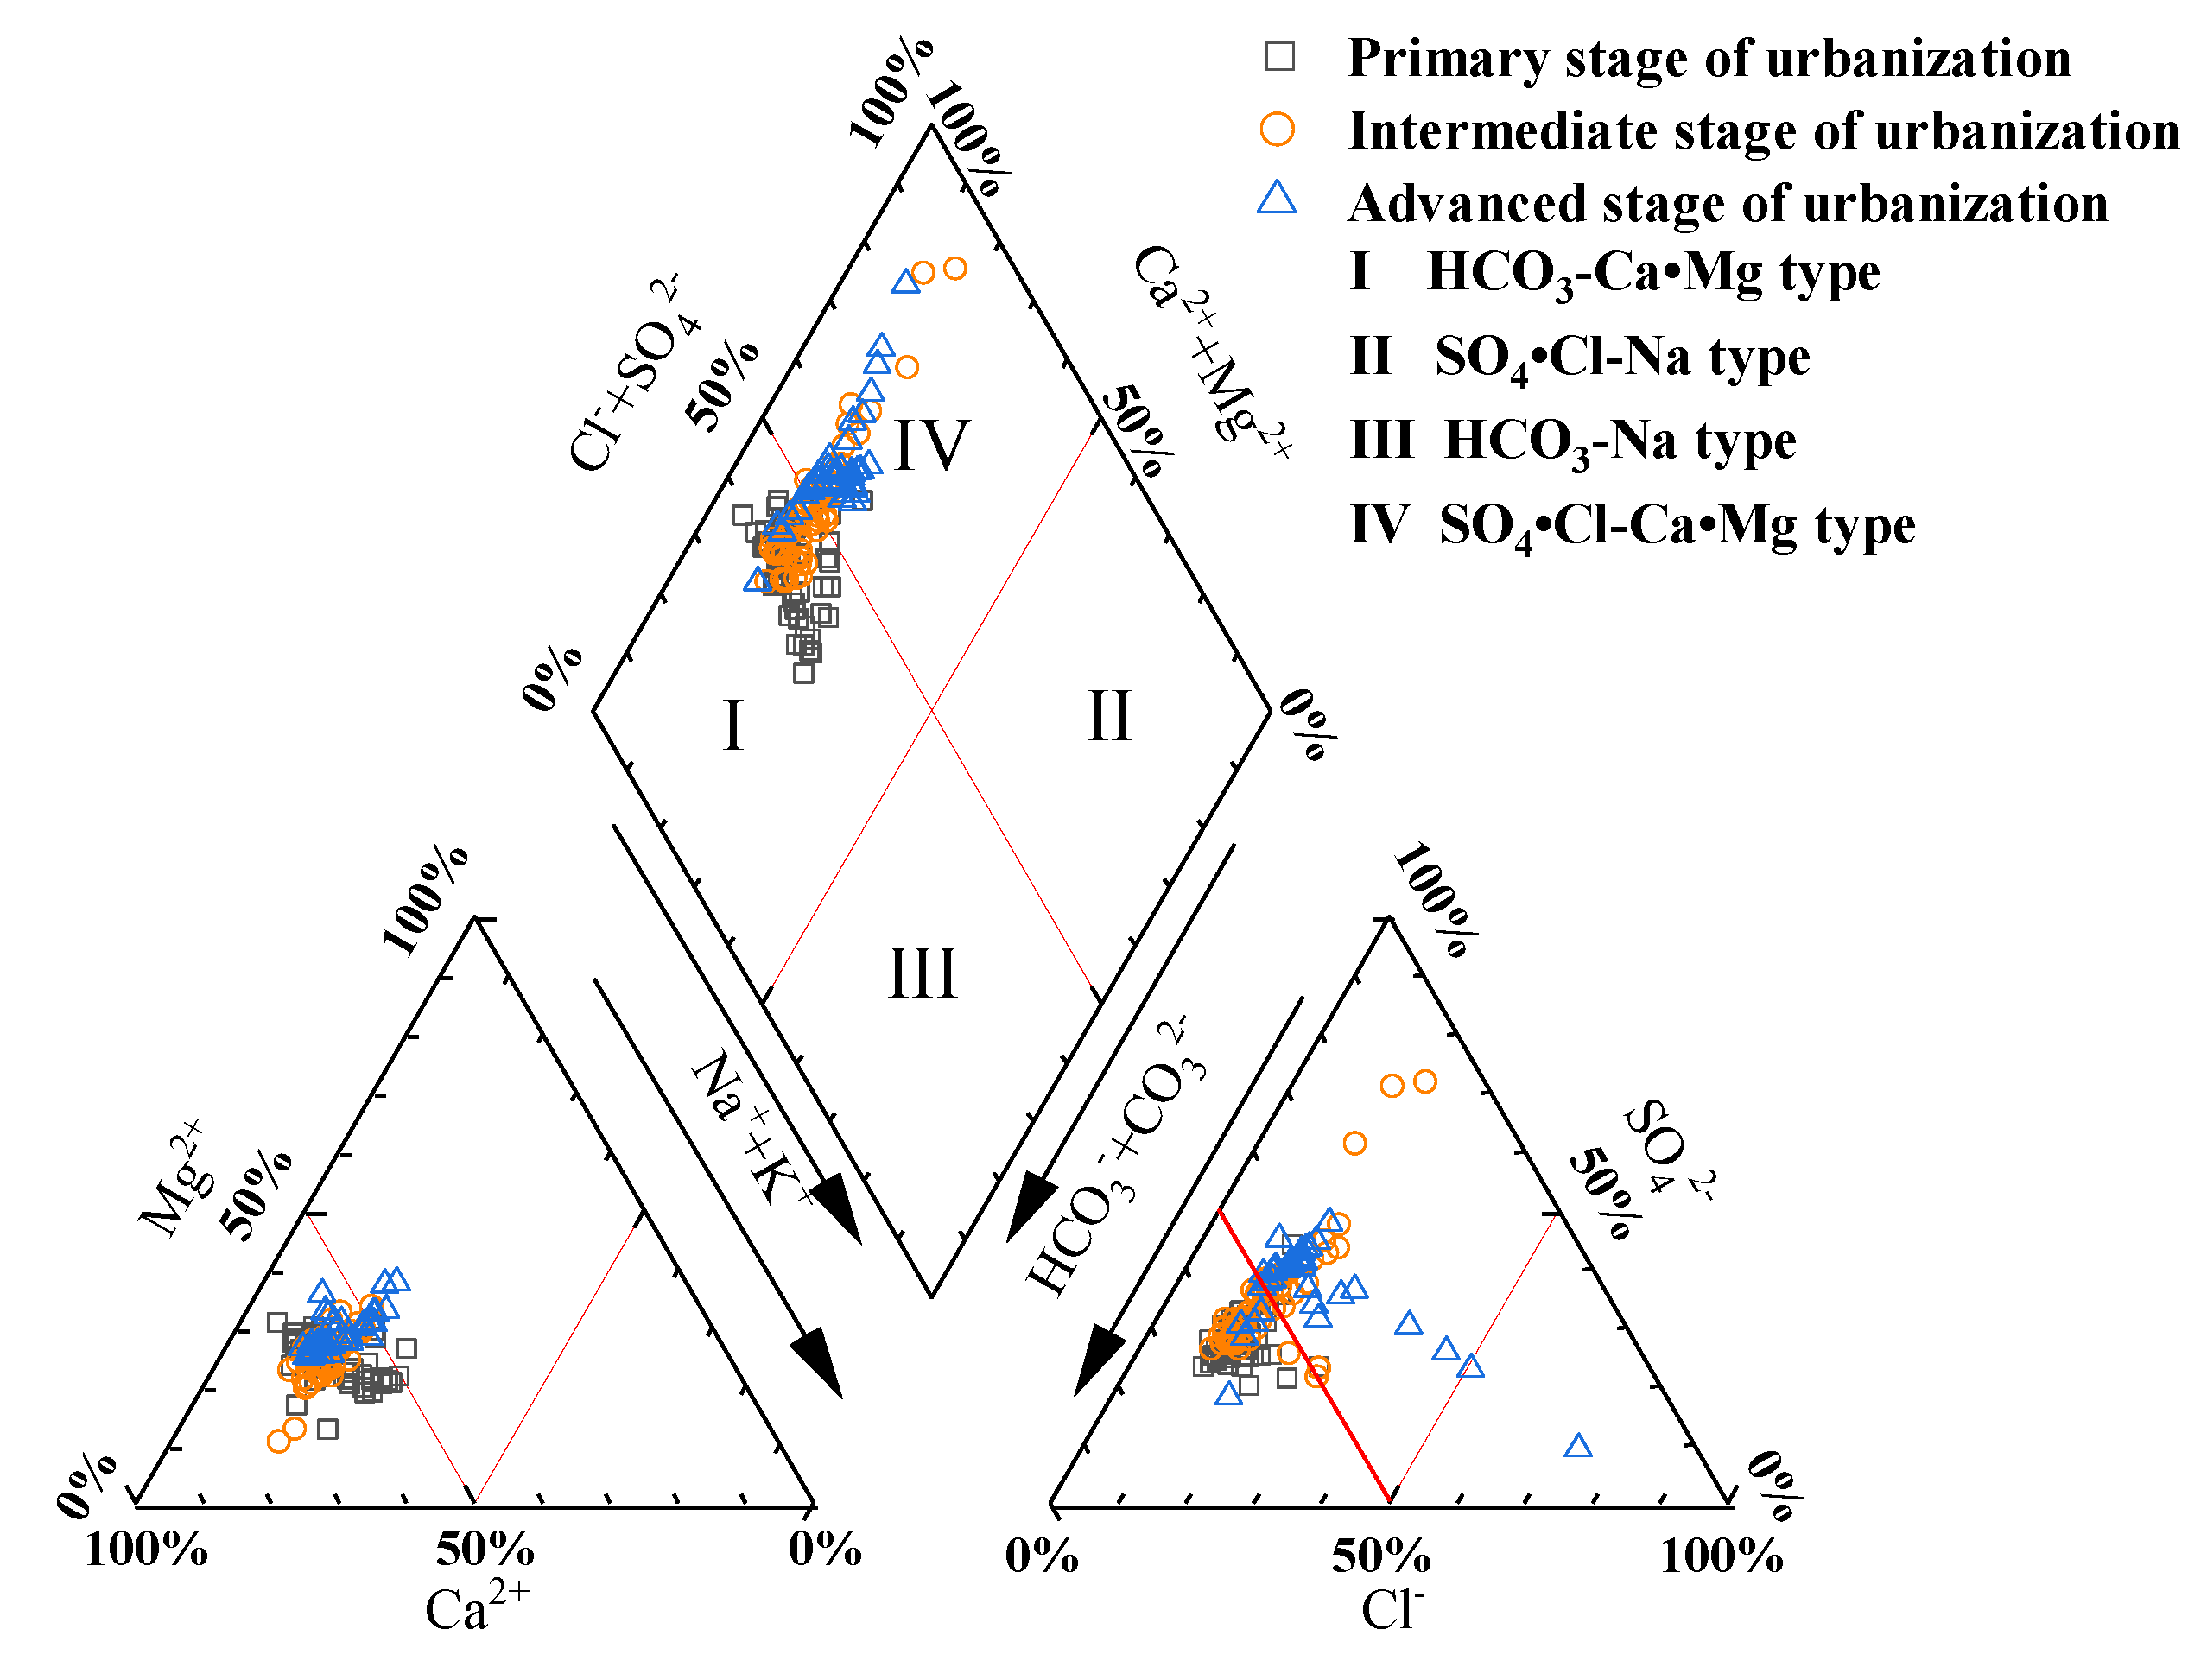
Based on the Piper trilinear diagrams, we studied the hydrochemical types of groundwater in the study area. The results show that the main hydrochemical type of groundwater in the study area is HCO3•SO4-Ca•Mg (Figure 4), which is specifically manifested as: during the PUS, the hydrochemical types are mainly HCO3•SO4-Ca•Mg or HCO3-Ca•Mg, accounting for 98.3%, with 1.70% of water samples being SO4•HCO3-Ca type. During the IUS, HCO3•SO4-Ca•Mg and HCO3-Ca•Mg account for 86.0% of the total water samples, and there was a significant decrease compared to the previous stage, while 14.0% of water samples are SO4•HCO3-Ca•Mg or SO4-Ca type. For the AUS, the proportion of HCO3•SO4-Ca•Mg or HCO3-Ca•Mg decreases to 73.7%, SO4•HCO3-Ca•Mg accounts for 15.8%, and an additional 10.5% of Cl•HCO3•SO4-Ca•Mg type water appears. It can be seen that different patterns of hydrochemical types are presented at different levels of urbanization. This changing trend is mainly due to the fact that during the PSU, the hydrochemical types of groundwater in the study area are less affected by human activities and mainly controlled by the characteristics of the strata. However, in the AUS, with the socio-economic development accelerates, the water demand for industrial and agricultural was increased sharply, along with the shortage of surface water sources, thus leading to severe over-extraction of groundwater. In addition, the non-compliant discharge of domestic and industrial wastewater causes an increase in the concentration of major ions in the groundwater, and result in a change in hydrochemical types. It can be seen that the impact of human activities on the hydrochemistry of groundwater gradually increases with the rapid development of urbanization and industrialization, resulting in a diversified and complex trend of hydrochemical types.

3.3. Factors driving hydrochemical evolution

3.3.1. Analysis of controlling factors based on Gibbs diagram

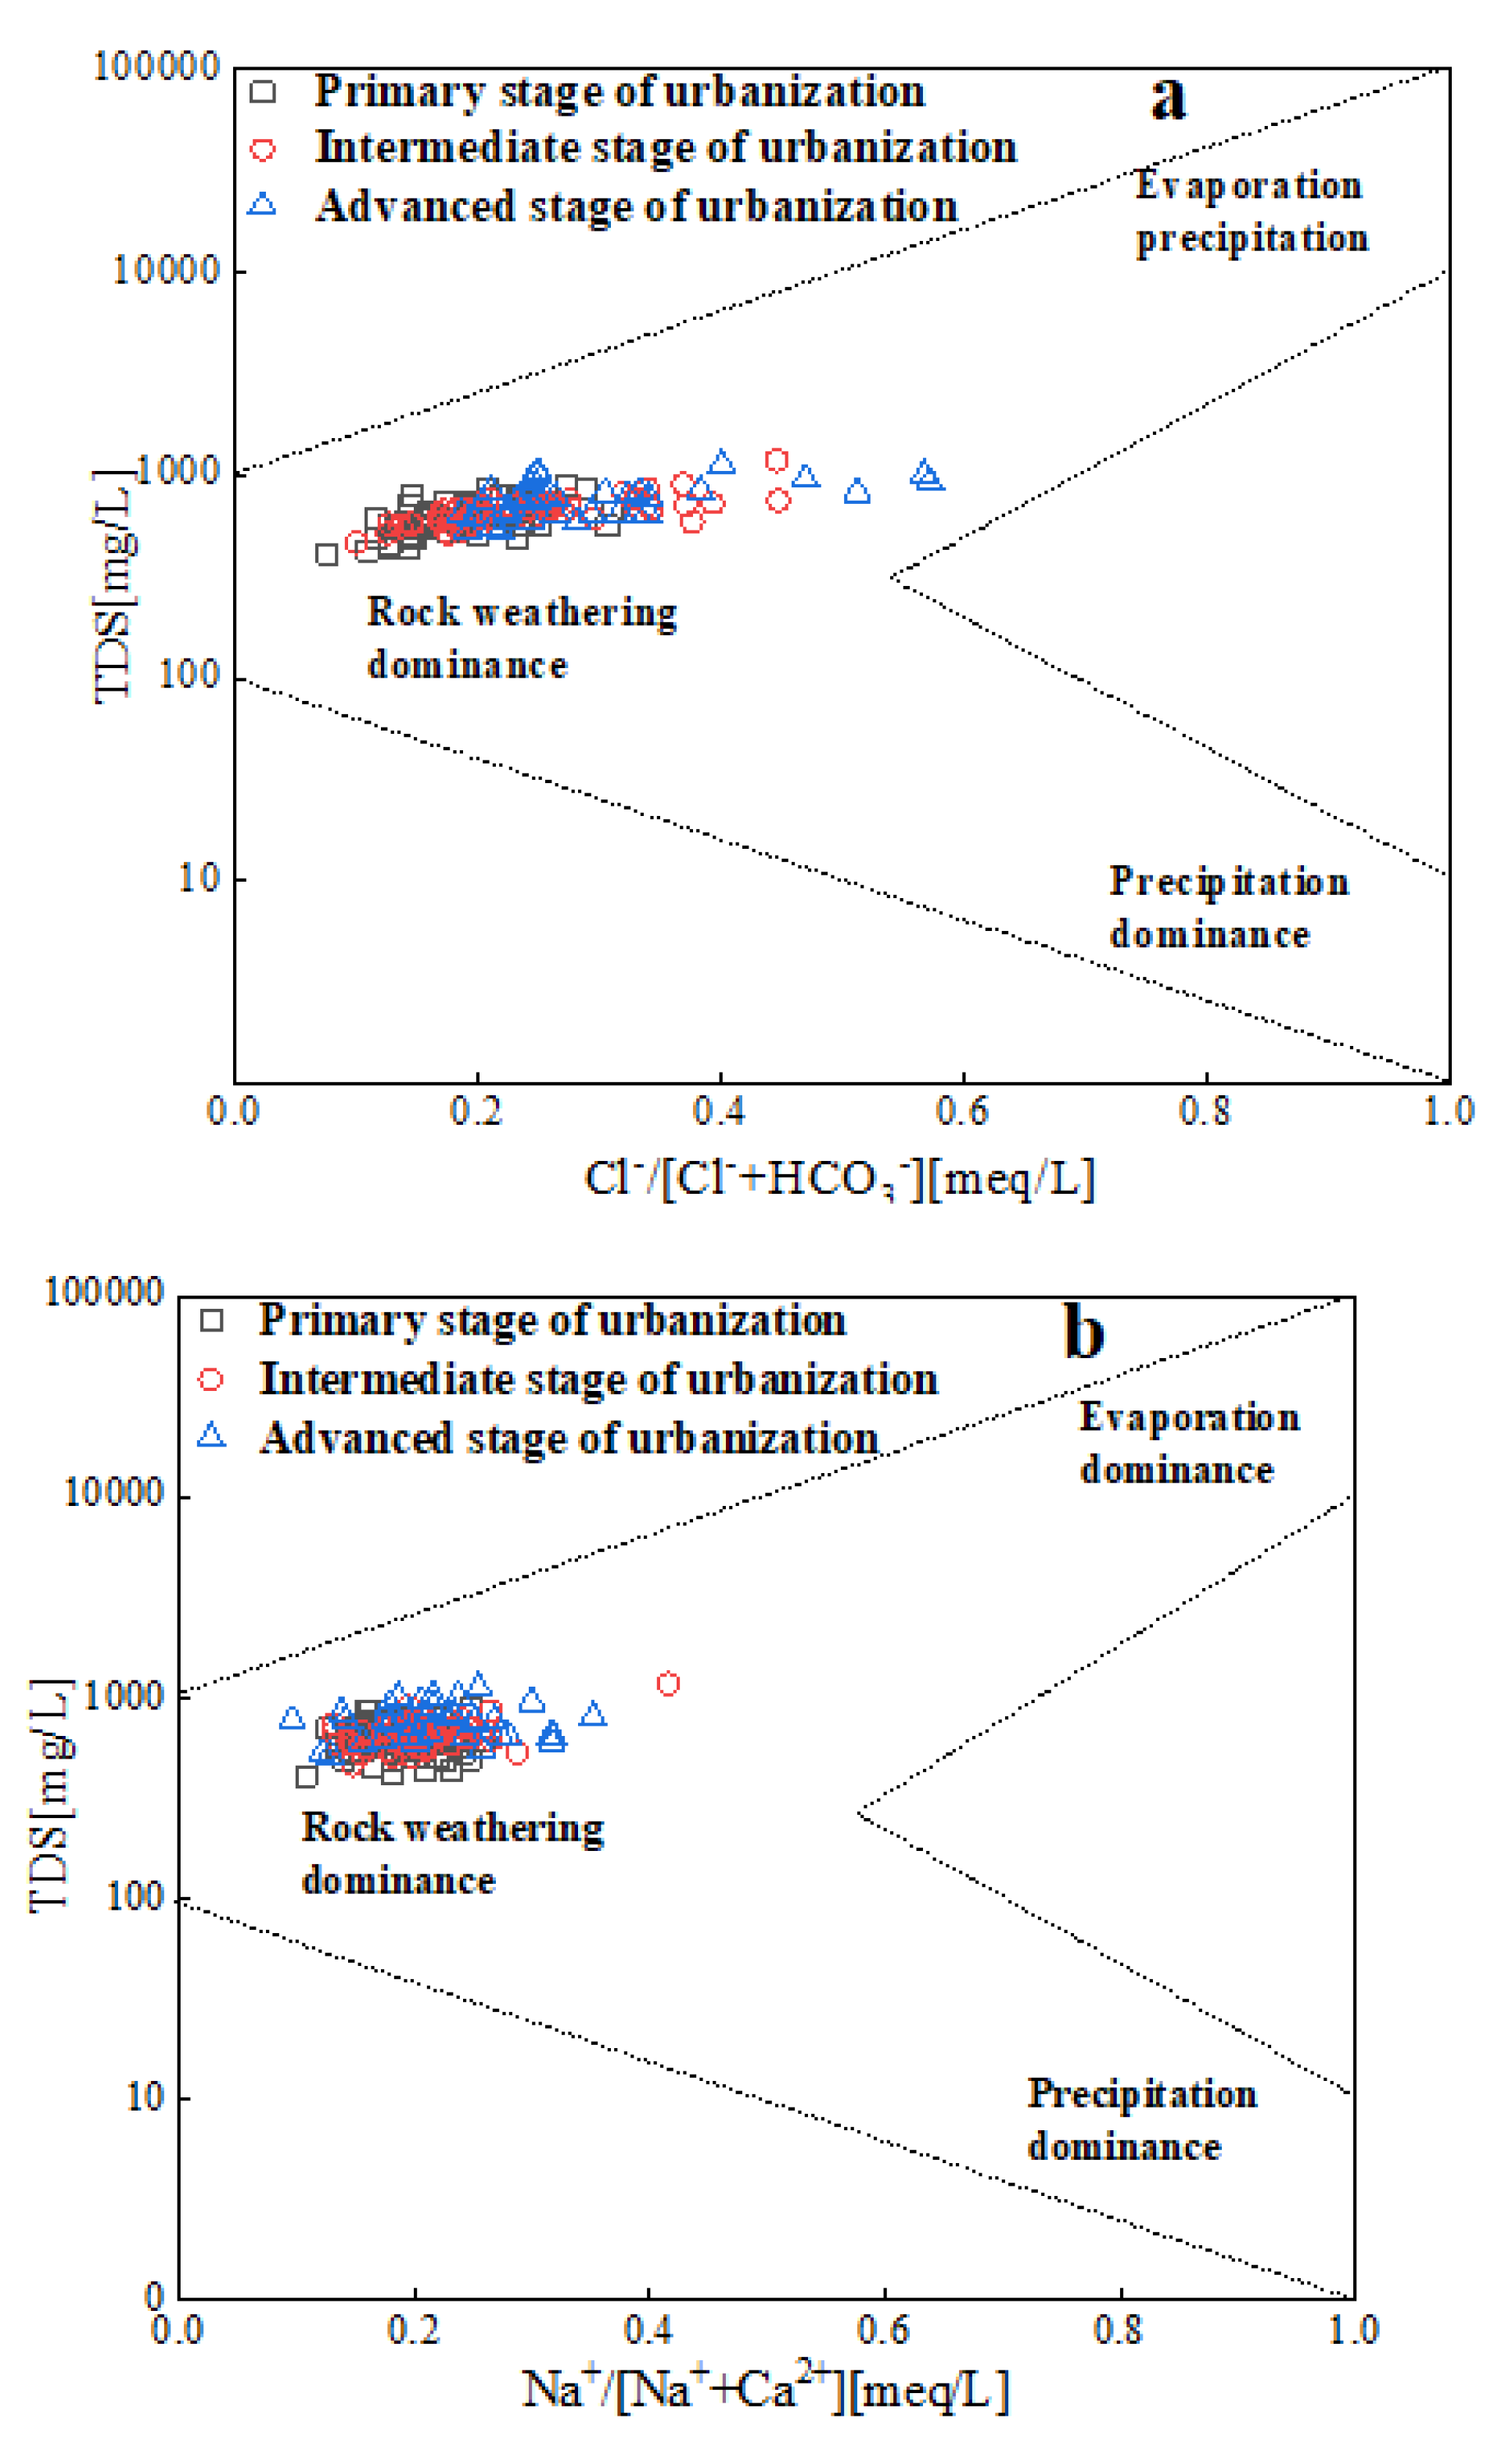
Rock weathering, precipitation, and evaporation control the changes in natural water chemical components. In the study, Gibbs diagram was used to analyze the main controlling factors of hydrochemical evolution in the three urbanization stages of the study area. As shown in Figures 5a and b, the groundwater sample points in the three urbanization stages are mainly distributed in the rock differentiation zone, indicating that rock weathering is the main controlling factor of the hydrochemistry in the study area. However, the Gibbs diagram can only qualitatively explain the natural factors controlling groundwater composition but cannot distinguish the influence of human activities. As section 2.2 shows, in recent years, with the rapid development of socio-economic, human activities have caused changes in the hydrochemical types of the study area, which will inevitably affect the controlling factors of its hydrochemistry. Further analysis will be conducted in the following sections.

3.3.2. Water-rock interactions

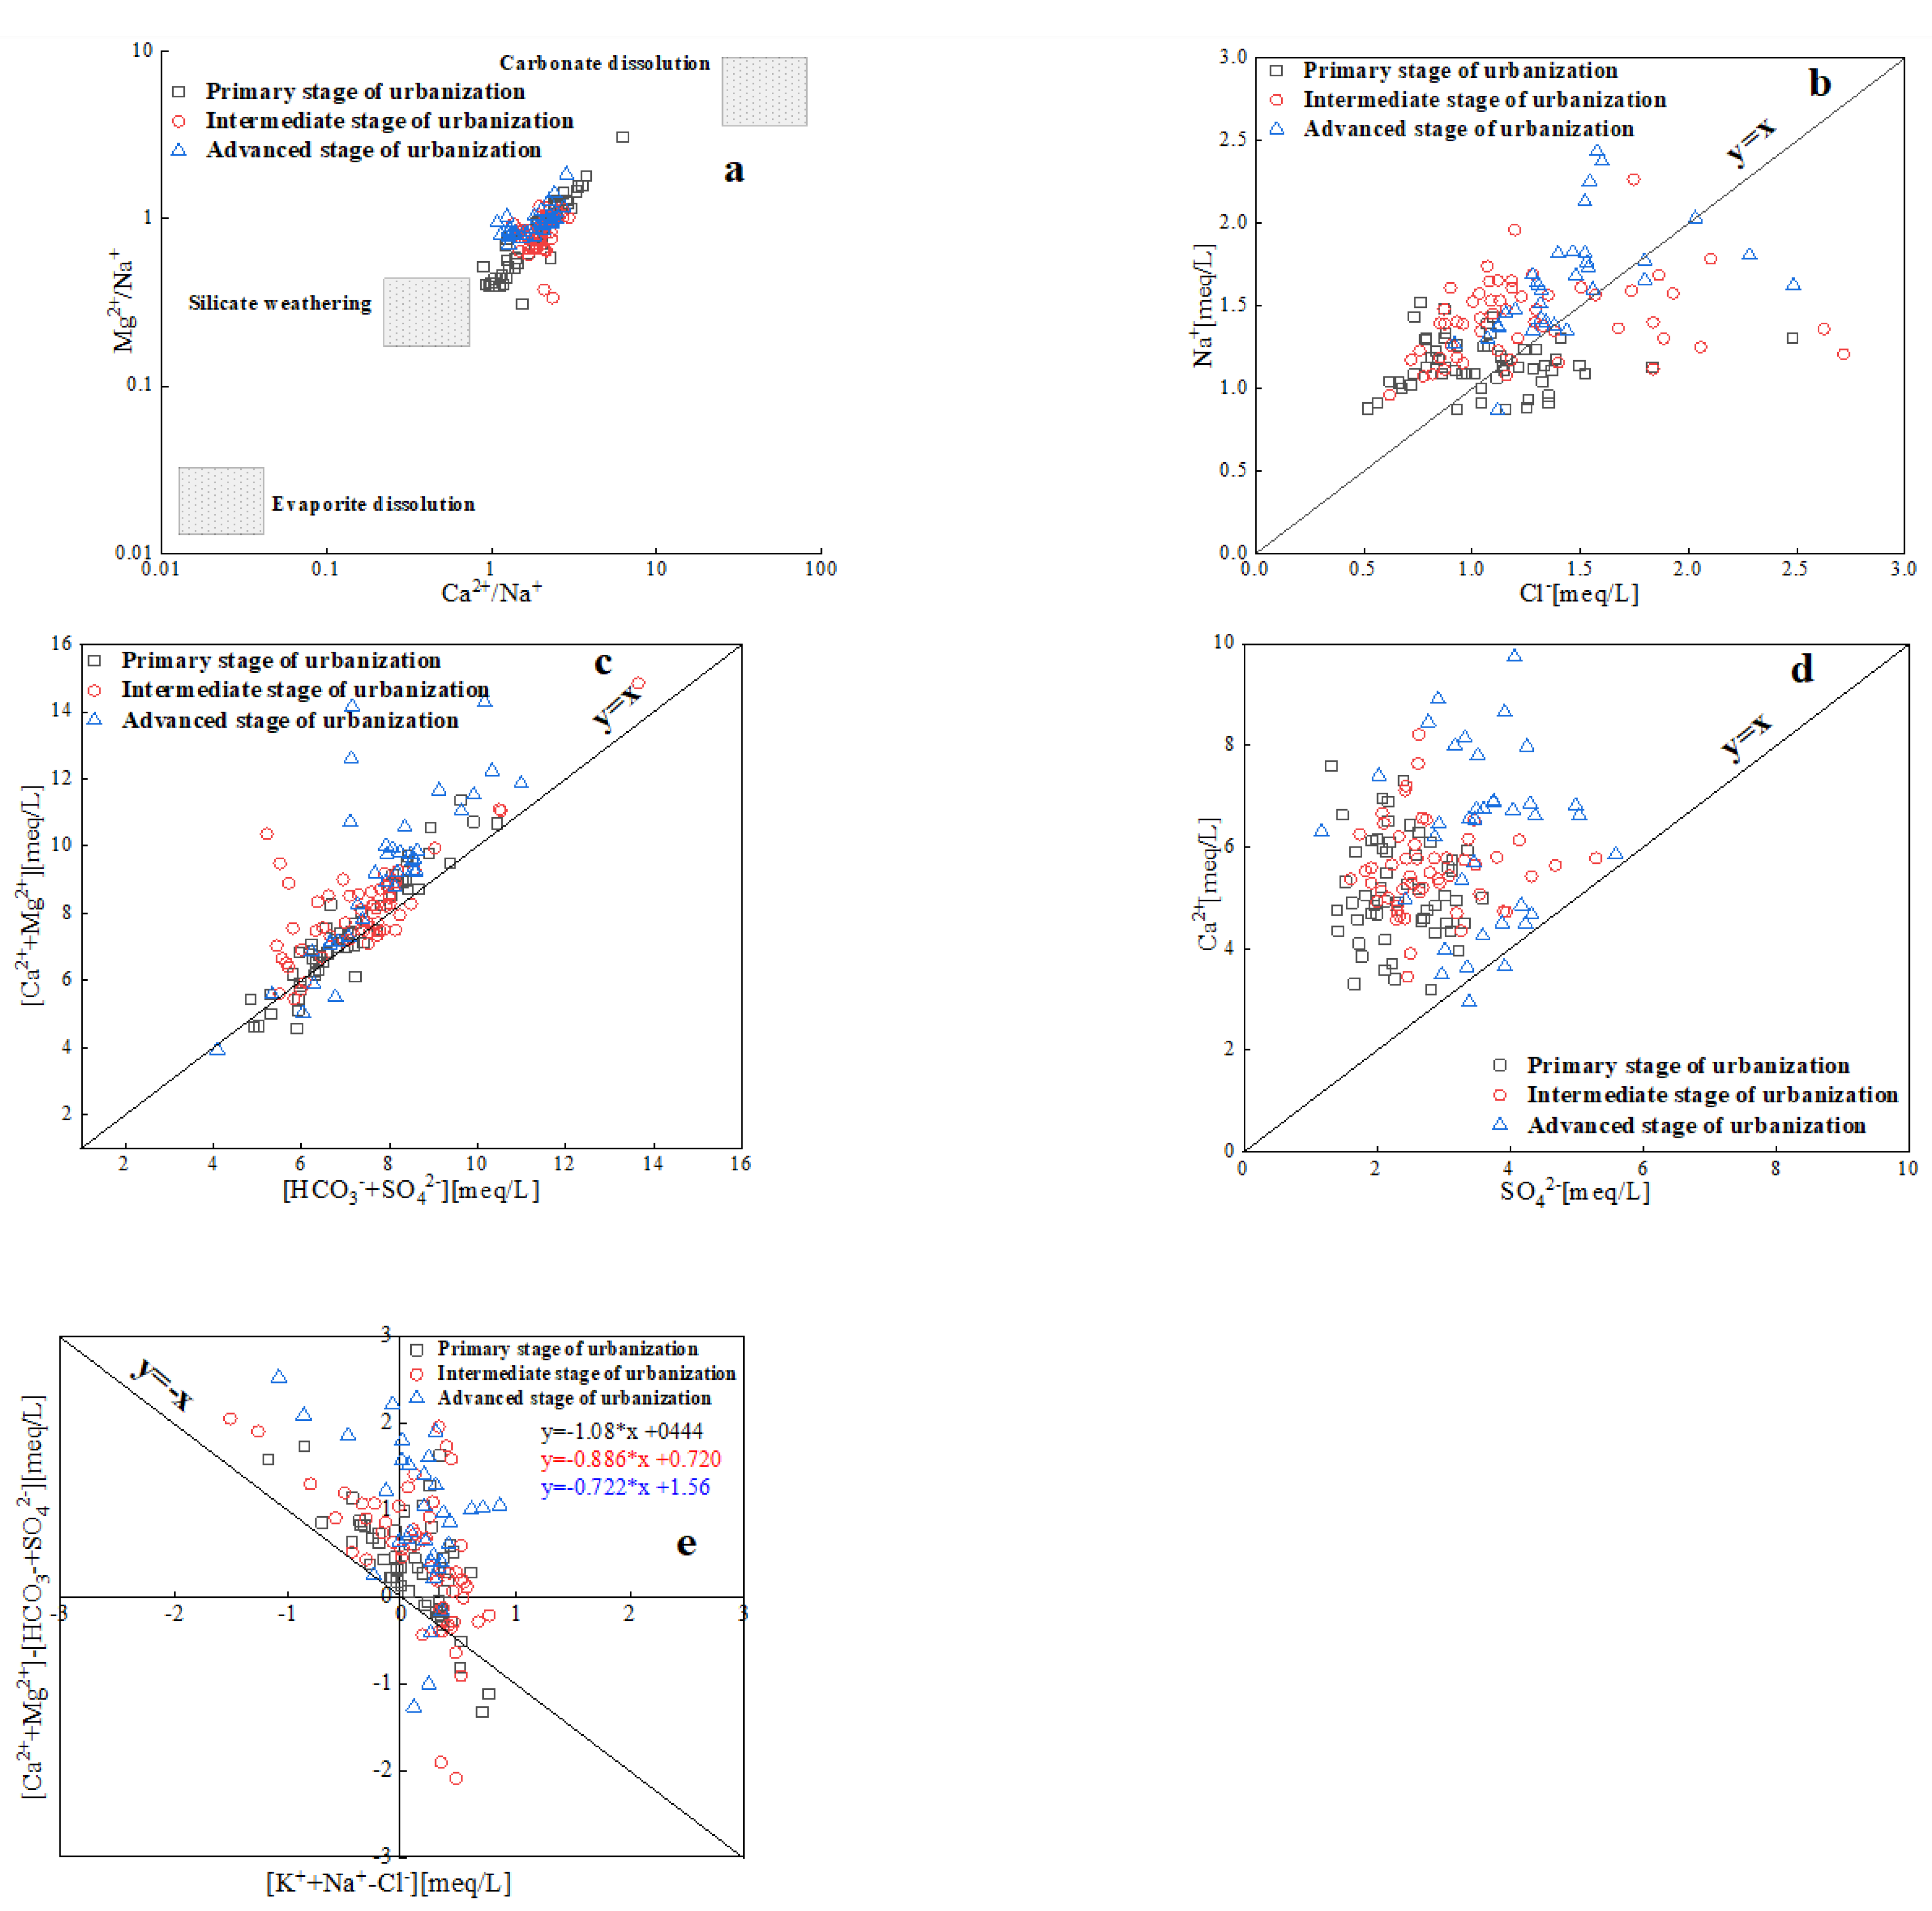
The source of groundwater chemistry components were identified (carbonates, silicates, and evaporites) through the relationship between Ca2+/Na+ and Mg2+/Na+ molar ratios (Tiwari et al.; 2017; Wang et al.; 2020). As shown in Figure 6 a, groundwater samples from the three urbanization stages mainly fall within the carbonate and silicate weathering control zones, indicating that the cations and bicarbonate anions in the water bodies of the study area mainly come from carbonate and silicate weathering dissolution.
By calculating the ratio of Na+ and Cl- in groundwater, we further determined the main hydrochemical processes and ion sources. As shown in Figure 6 b, Na+ and Cl- in water samples from different urbanization stages show a positive correlation, which suggesting that Na+ and Cl- may have a common source (such as halite dissolution). For the PSU, ISU, and ASU, 56%, 70%, and 68% of water sample points fall above the y=x line, indicating that Na+ in groundwater not only comes from halite dissolution but also originate from carbonate and silicate weathering dissolution or cation exchange (Xiao et al.; 2023).
Based on the equivalent ratio of [Ca2++Mg2+] and [HCO3-+SO42-], the influence of carbonates and silicates on the formation of water chemical components is distinguished (Figure 6c). Water samples from the PSU, ISU, and ASU mainly fall above the y=x line, with proportions of 70%, 79%, and 94% respectively. This indicates that carbonate weathering plays a dominant role in hydrochemical formation during these urbanization stages, and the effect increases gradually with increasing urbanization level. The reason may be that the exploitation of groundwater intensifies caused changes in the groundwater dynamic field, and increased the time and distance of groundwater runoff. Therefore, there were more carbonate mineral components and the pollutants generated from human activities enter into groundwater, which the carbonate dissolution was exacerbated. Based on the ratio diagram of Ca2+ and SO42- (Figure 6d), except for two water sample points below the y=x line in the ASU, the remaining water sample points are above the y=x line. Ion concentrations show an increasing trend at different urbanization stages, but the correlation between Ca2+ and SO42- is not significant, indicating that they are not from the same source. In addition, Ca2+ may also be affected by carbonate and silicate weathering dissolution and reverse cation exchange.
As mentioned above, cation exchange may have a significant impact on the hydrochemical components of the study area's water. The relationship between [Na++K+-Cl-] and [Ca2++Mg2+]-[HCO3-+SO42-] was used to demonstrate the effect. If they show a linear relationship with a slope close to -1, it indicates that cation exchange is an essential mechanism in the groundwater chemical evolution process.
As shown in Figure 6e, 44%, 30%, and 31% of water sample points fall in quadrant II during each stage, indicating that reverse cation exchange occurs between Na+ in groundwater and Ca2+ and Mg2+ in soil/rock at these sites; 24%, 28%, and 14% of water sample points fall in quadrant IV, indicating positive cation exchange between Ca2+ and Mg2+ in groundwater and Na+ in soil/rock. Additionally, 31%, 42%, and 55% of water sample points fall in quadrant I during the three urbanization stages, indicating that ion exchange is not the only factor determining Ca2+, Mg2+, and Na+ content in groundwater. From the results, it can be seen that during the PSU and ISU, cation exchange can be considered an essential mechanism for hydrochemical action in the study area. However, during the ASU, the proportion of water sample points falling in quadrants II and IV decreases, and the slope of the regression equation ( k= -0.722) increases, indicating that the influence of cation exchange on the groundwater evolution process has diminished. The reason for this temporal change is related to the relatively stable groundwater environment and slow infiltration rate in the early stages, which provided favorable conditions for cation exchange. However, with the development of social economy, the original groundwater environment has been damaged, the emergence of falling funnels has accelerated the seepage velocity of groundwater, resulting in the predominance of leaching effect, and at the same time, the return water from agricultural irrigation will also have a certain impact on the water chemistry (Lü et al.; 2020).

3.3.3. Impact of human activities on groundwater chemical composition

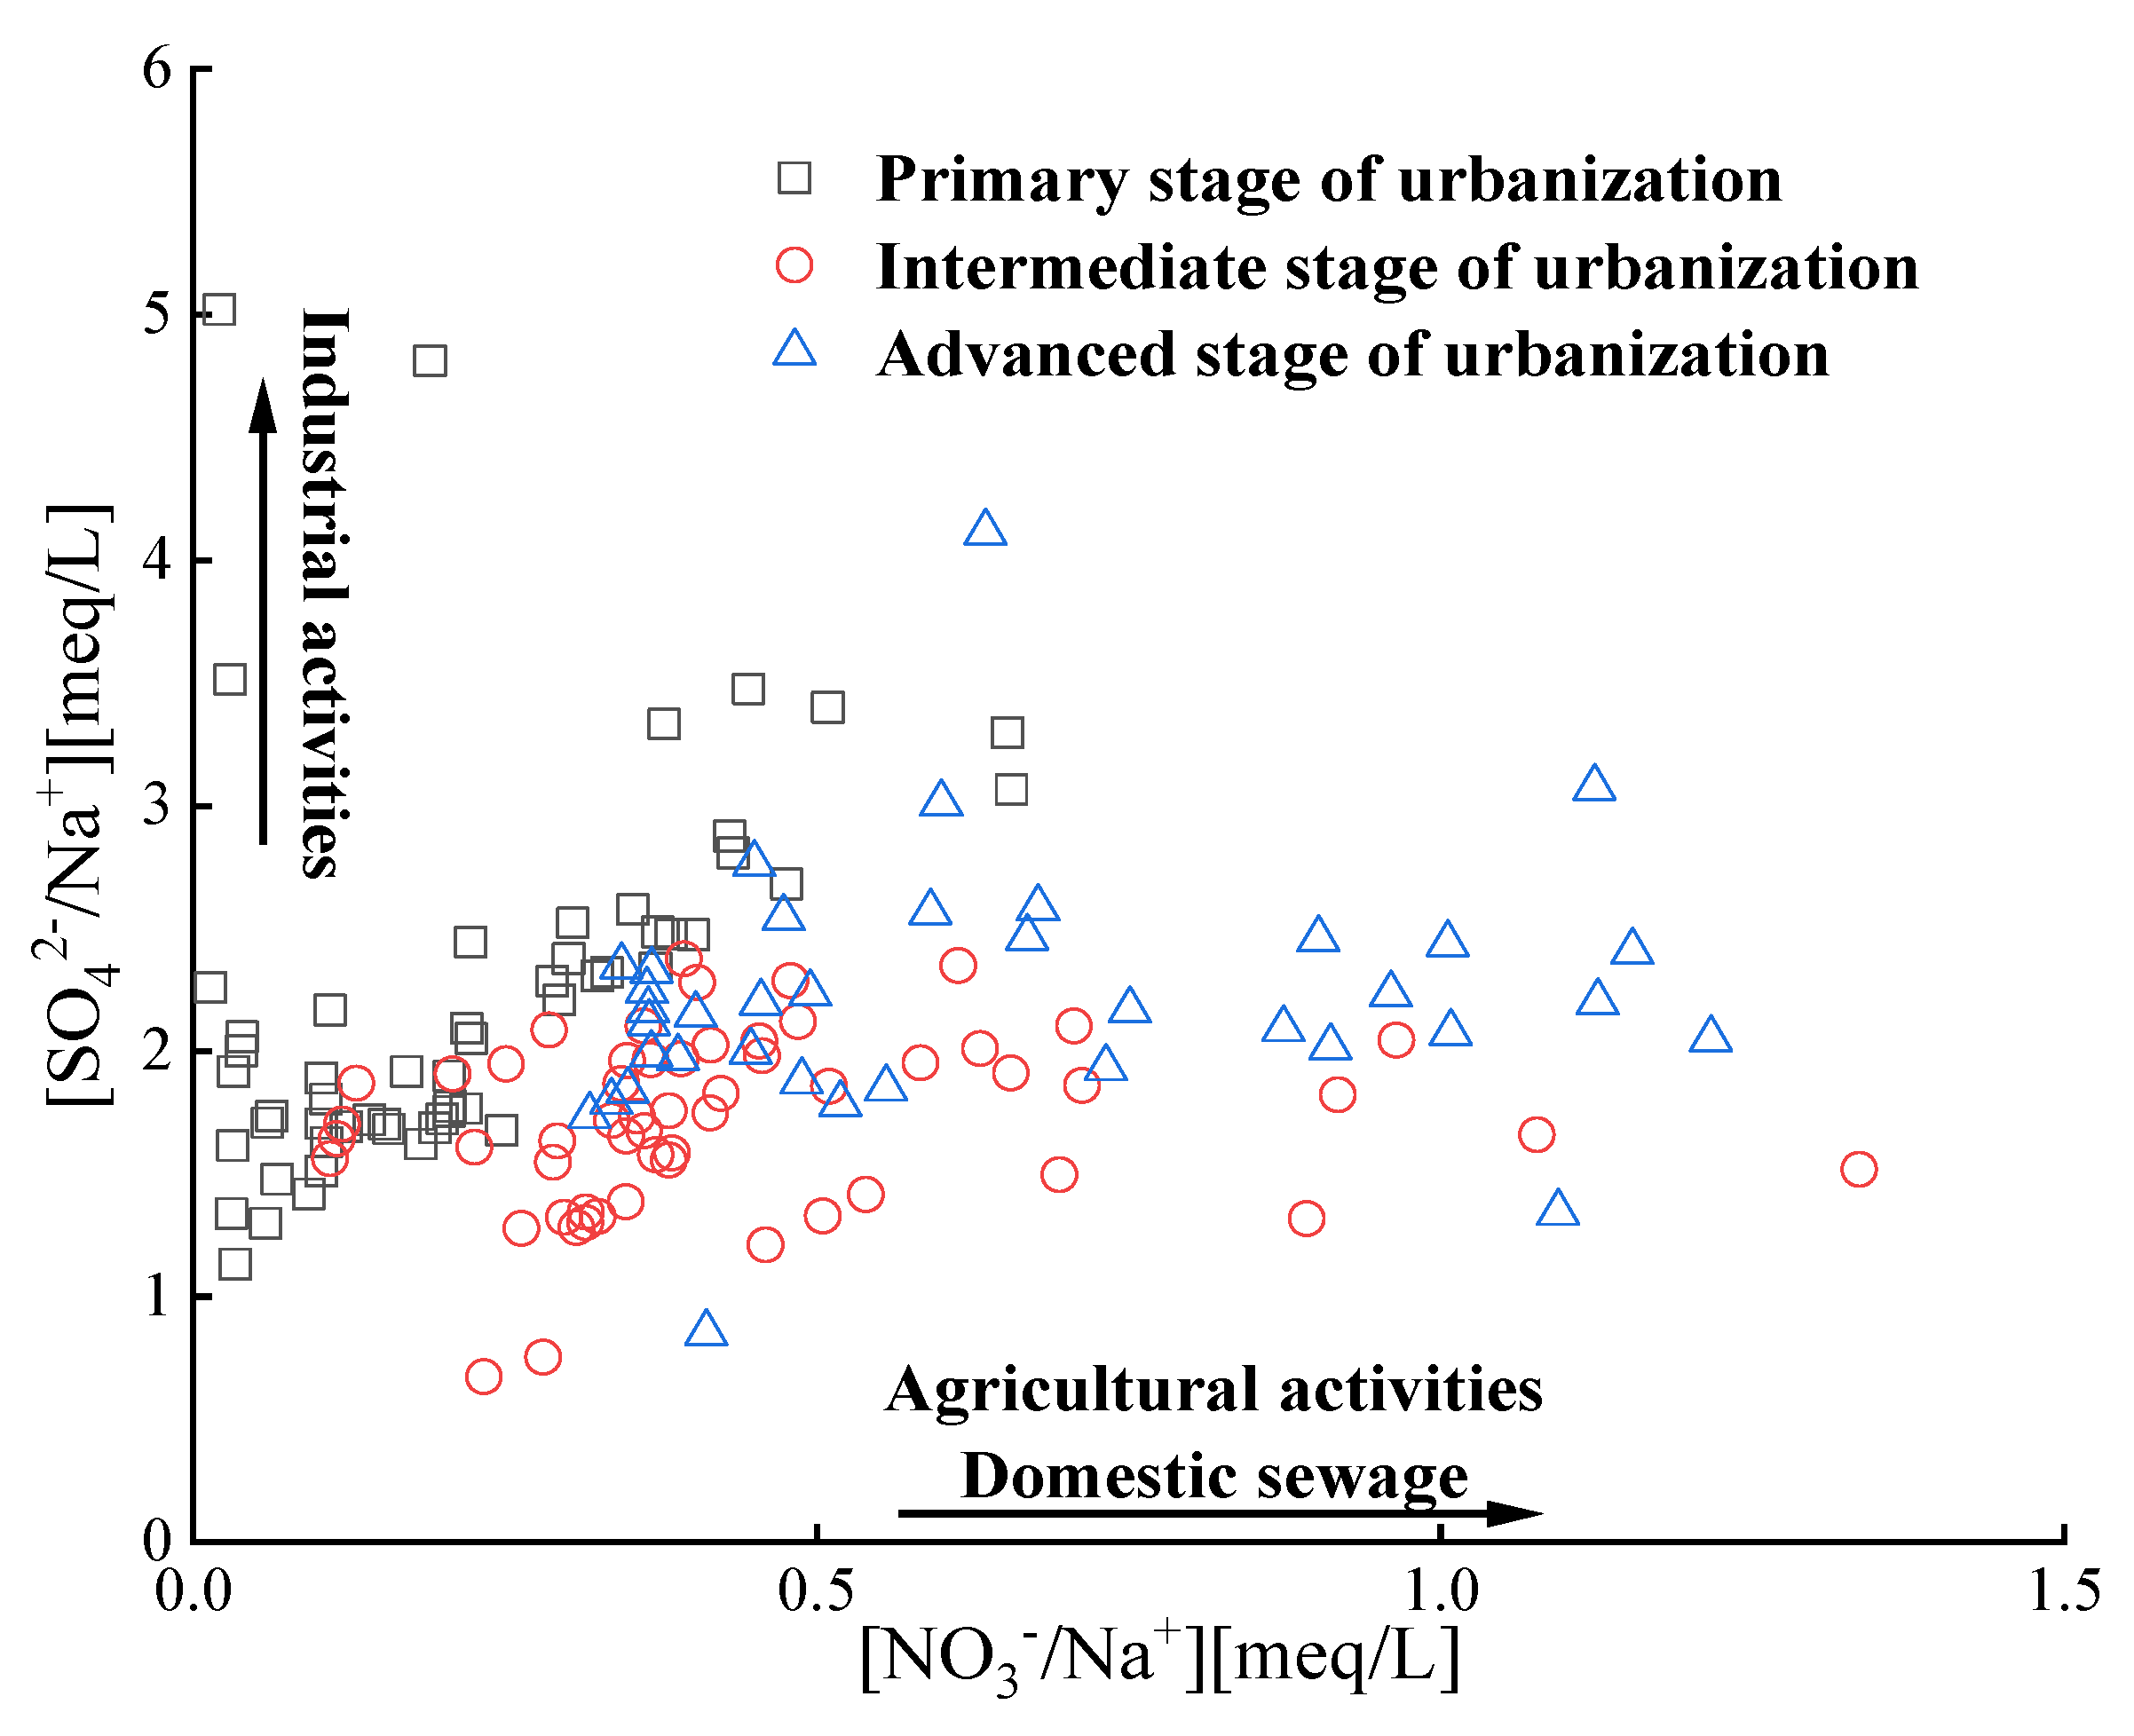
The influence of human activities on groundwater chemical composition during urbanization stages was studied using the relationship between NO3-/Na+ and SO42-/Na+ ratios. As can be seen from Figure 7, during the PSU, ISU, and ASU, the ratios of NO3-/Na+ are 0.140 to 1.32, 0.160 to 1.33, and 0.320 to 1.26, respectively, while those of SO42-/Na+ are 1.13 to 5.00, 0.670 to 2.37, and 0.850 to 4.11. The distribution of water samples on the graph indicates that both ratios show an overall increasing trend, but the main controlling factors are different. In the PSU, the groundwater chemistry in the study area is mainly affected by industrial activities; in the ISU and ASU, the groundwater is jointly affected by industrial and agricultural activities (circled areas in the Figure 7), and the influence of agricultural activities is more significant in the ASU. The main reasons are that during the initial stages of urbanization and industrial development, the industrial development mode was relatively extensive, environmental protection awareness was insufficient, and the discharge of industrial wastewater had a certain impact on hydrochemistry. At this time, agricultural development was relatively slow, with less fertilizer application (average of 0.324 t/hm2), and the impact of agricultural activities on groundwater chemistry was limited. Therefore, the impact of industrial activities on groundwater chemistry was greater than that of agricultural activities. During the ISU and ASU, due to government supervision and increased environmental awareness, the treatment and discharge of industrial pollutants were controlled to a certain extent, mitigating the impact of industrial pollution on water chemistry, thus, the content of SO42- remained relatively stable. At the same time, agriculture is in a period of rapid development, excessive agricultural fertilization (average application amounts of 0.742 t/hm2 and 0.940 t/hm2) causing the nitrogen fertilizer not used by plants to be carried into groundwater through agricultural irrigation, and leading to an increase in NO3- content in groundwater, which is manifested over time as the rate of increase in NO3- content is higher than that of SO42-. Compared to the ISU, the NO3- content in the ASU relatively stable, but the SO42- content has increased for some water samples. This may be due to intensified water-rock interactions (such as gypsum dissolution) related to groundwater over-extraction.

3.4. Driving mechanism of water chemistry temporal evolution

Groundwater chemistry evolution is influenced by a combination of various factors. In this study, PCA was used to identify the driving factors for water chemistry evolution during the three urbanization stages in the study area. Ten water quality parameters (pH, K+, Na+, Ca2+, Mg2+, Cl-, SO42-, HCO3-, NO3-, TDS, and TH) were selected for PCA analysis. Before entering the data into the model, Kaiser-Meyer-Olkin and Barlett's sphericity tests were performed on the research data, with the results showing KMO values of 0.502, 0.454, and 0.621 for the three urbanization stages and Barlett's sphericity test values of 820, 1272, and 468 (P<0.001), indicating that the water chemistry data met the requirements for PCA. Based on eigenvalues >1, two, two, and three main factors controlling water chemistry evolution in the PSU, ISU, and ASU were identified, explaining 74.4%, 69.9%, and 86.9% of all variables, respectively, representing all information from the ten water chemistry indicators (Table 1).
In the PSU, PC1 explained 62.4% of the total variable information, and the indicators exhibiting strong positive correlations with PC1 were TDS, Ca2+, Mg2+, NO3-, TH, SO42-, and HCO3-, while Cl- had a moderate positive correlation with PC1. As proven in section 3.3.2, TDS, Ca2+, Mg2+, TH, HCO3-, and Cl- are mainly related to carbonate dissolution. Previous studies have shown that NO3- in the water environment mainly comes from chemical fertilizers, sewage, manure, soil nitrogen, etc. (Zhang and Wang, 2020), and at this stage, the amount of agricultural fertilization is relatively small, population density is low (230 people/km2), and the concentration of nitrate in groundwater is relatively low (13.7 mg/L), indicating that the impact of agricultural activities is not significant. But, the coal was main fuel for the industrial activities (mining activities, coking plants, and power plants, etc) in the phase. The large discharge of industrial wastewater will inevitably lead to an increase in SO42- concentration in groundwater. Therefore, SO42- of groundwater mainly originated from industrial activities. Thus, PC1 represents the control of groundwater chemistry by carbonate dissolution and industrial activities. PC2 explained 12.0% of the total variable information, with Na+ and K+ showing strong positive correlations with PC2 and pH displaying a moderate positive correlation. Based on previous analyses, Na+ in the study area mainly originates from halite dissolution and cation exchange. Groundwater pH is influenced by various factors and does not have directionality, and the pH during this period was relatively stable (7.20~8.15). Therefore, PC2 represents groundwater chemistry were controlled by halite dissolution and cation exchange.
During the ISU, PC1 explained 62.4% of the total variable information, and indicators exhibiting strong positive correlations with PC1 included TDS, SO42-, Ca2+, TH, while Cl- and K+ + Na+ showed moderate positive correlations with PC1. Among them, TDS, SO42-, Ca2+, and TH are mainly related to carbonate and gypsum dissolution. As proven in section 3.3.3, with the gradual implementation of government environmental protection policies, strict supervision of industrial non-compliant emissions has reduced the impact of industrial pollution on groundwater chemistry, and SO42- concentration (151 mg/L) is relatively stable. Thus, PC1 represents the groundwater chemistry were controlled by carbonate and gypsum dissolution. PC2 explained 21.5% of the total variable information, with Mg2+ and pH showing strong positive correlations with PC2 and HCO3- and NO3- displaying moderate positive correlations. As known from sections 3.3.2 and 3.3.3, this stage belongs to a period of rapid agricultural development, and increased groundwater extraction intensity and high fertilizer application (0.742 t/hm2), this not only affect water-rock interactions but also allow unutilized nitrogen fertilizers to infiltrate groundwater through irrigation return water and rainfall runoff. The combined action of these factors leads to an increase in Mg2+, HCO3-, and NO3- concentrations. Additionally, livestock breeding and domestic sewage also affect groundwater chemistry. Therefore, PC2 represents the groundwater chemistry were controlled by groundwater extraction intensity, agricultural fertilization, and domestic sewage.
In the ASU, PC1 explained 49.5% of the total variable information, and indicators showing a strong positive correlation with PC1 included Mg2+, Cl-, and TH, while Ca2+ and K++Na+ had a moderate positive correlation with PC1. Mg2+, TH, and Ca2+ primarily originate from carbonate dissolution, while Cl- and Na+ mainly come from halite dissolution (as proven in section 3.3.2). Therefore, PC1 represents the groundwater chemistry were controlled by carbonate and halite dissolution. PC2 explained 24.8% of the total variable information, with indicators showing a strong positive correlation with PC2 including NO3-, HCO3-, and TDS, while pH had a moderate negative correlation. Section 3.3.3 has proven that high concentrations of NO3- primarily come from fertilizers and sewage during this stage. The negative correlation between HCO3- and pH indicates decarbonation occurring in groundwater (Zhang et al.; 2011). Under intense human exploitation of water, pressure and temperature changes in groundwater occur, and increased extraction intensity also affects water-rock interactions, ultimately influencing TDS variations. Therefore, PC2 represents the groundwater chemistry were controlled by agricultural activities, sewage, and extraction intensity. The main factor PC3 explained 12.6% of the total variable information, and the indicator showing a strong positive correlation with PC3 was SO42-. In this time period, the concentration of SO42- was close to that of the previous period (180 mg/L and 190 mg/L, respectively), both originating from gypsum dissolution. Thus, PC3 represents the groundwater were controlled chemistry composition by gypsum dissolution.

4. Conclusions

This study is the first to identify the characteristics and driving mechanisms of groundwater chemistry evolution at different urbanization stages. The results show that the concentration of various groundwater chemical components gradually increases as urbanization accelerates, especially NO3-, which has risen from 13.7 mg/L in the PSU to 65.1mg/L, exceeding the WHO drinking water standard (50ml/L), indicating that groundwater chemistry is significantly influenced by human activities. The water chemistry type is changing from HCO3•SO4-Ca•Mg-dominated water in the PSU to SO4•HCO3-Ca•Mg-dominated water in the ASU. Groundwater chemical processes have shifted from being primarily controlled by dissolution and filtration in the PSU to joint control by dissolution, filtration, and human activities in the ASU. Based on PCA analysis, the driving factors for groundwater chemistry evolution were identified. In the PSU, the driving factors of groundwater chemical evolution were carbonate and rock salt dissolution, cation exchange, and industrial activities. However, in the intermediate stage and advanced stage, the driving factors of groundwater chemical evolution were changed to carbonate and gypsum dissolution, groundwater over-exploitation, agricultural fertilization, and domestic sewage. Based on these conclusions, we recommend controlling the amount of agricultural fertilization, scientific fertilization, and prohibiting non-compliant sewage discharge in future groundwater management. Additionally, supervision of groundwater extraction should be strengthened to reduce the impact of urbanization on groundwater chemistry evolution.

Author Contributions

Wang Long: Investigation, Methodology, Software, Data curation, Writing- Original Author Contributions: draft preparation. Zhang Qianqian: Supervision, Methodology, Writing- Reviewing and Editing. Wang Huiwei: Investigation, Software, Supervision.

Funding

This work was supported by the open funds of Natural Science Foundation of Hebei Province of China (Grant No. D2022504015), the High-level talent funding project of Hebei Province, China (Grant No. A202101003), the Fundamental Research Funds for the Institute of Hydrogeology and Environmental Geology, Chinese Academy of Geological Sciences(No. SK202117 and No.SK202209) and China Geological Survey, China (Grant No. DD20221773).

Data Availability Statement

In this section, please provide details regarding where data supporting reported results can be found, including links to publicly archived datasets analyzed or generated during the study. Please refer to suggested Data Availability Statements in section “MDPI Research Data Policies” at https://www.mdpi.com/ethics. You might choose to exclude this statement if the study did not report any data.

Acknowledgments

The authors gratefully acknowledge the editor and anonymous reviewers for their valuable comments on this manuscript. The authors also appreciate the financial support from the different organizations.

Conflicts of Interest

The authors declare no conflict of interest.

References

  1. Akakuru, O.; Eze, C.; Okeke, O. Hydrogeochemical evolution, water quality indices, irrigation suitability and pollution index of groundwater pig around eastern niger delta, nigeria. International Journal of Energy and Water Resources, 2022, 6, 389–411. [Google Scholar] [CrossRef]
  2. Barron, O. V.; Barr, A. D.; Donn, M. J. Evolution of nutrient export under urban development in areas affected by shallow watertable. Science of the Total Environment. 2013, 443, 491–504. [Google Scholar] [CrossRef]
  3. Cotruvo, Joseph, A. 2017 who guidelines for drinking water quality: first addendum to the fourth edition. Journal - American Water Works Association. 2017, 109, 44–51.
  4. Fei, L.; Jza, B.; Jza, B.; Pza, B. Factors controlling groundwater chemical evolution with the impact of reduced exploitation. Catena. 2022, 214, 106261. [Google Scholar]
  5. Huang, G.; Sun, J.; Zhang, Y.; Chen, Z.; Liu, F. Impact of anthropogenic and natural processes on the evolution of groundwater chemistry in a rapidly urbanized coastal area, south china. Science of the Total Environment. 2013, 463–464, 209-221.
  6. Huang, Z.; Pan, Y.; Gong, H.; Yeh, J.F.; Li, X.; Zhou, D.; et al. Subregional-scale groundwater depletion detected by grace for both shallow and deep aquifers in north china plain. Geophysical Research Letters 2015, 426, 1791–1799. [Google Scholar] [CrossRef]
  7. Israr, M.; Nazneen, S.; Raza, A.; Ali, N.; Khan, S.A.; Khan, H.; et al. Assessment of municipal solid waste landfilling practices on the groundwater quality and associated health risks: a case study of mardan-pakistan. Arabian Journal of Geosciences. 2022, 1517, 1–11. [Google Scholar] [CrossRef]
  8. Kai, L.; Zhong, P.; Raza, A. Impact of rapid urbanization on water quality index in groundwater fed Gomati River, Lucknow, India. Current Science, 2018, 3, 650–654. [Google Scholar]
  9. Li, P.; Karunanidhi, D.; Subramani, T.; Srinivasamoorthy, K. Sources and Consequences of Groundwater Contamination. Archives of environmental contamination and toxicology. 2021, 80, 1–10. [Google Scholar] [CrossRef] [PubMed]
  10. Liu, J.; Yang, H.; Gosling, S.N.; Kummu, M.; Florke, M.; et al. Water scarcity assessments in the past, present, and future. Earth's Future. 2022, 5, 545–559. [Google Scholar] [CrossRef]
  11. Liu, J.; Yang, H.; Gosling, S.; Kummu, M.; Florke, M.; Pfister, S.; Hanasaki, N.; Wada, Y.; Zhang, X.; Zheng, C. Water scarcity assessments in the past, present, and future. Earth's Future, 2017, 5, 545–559. [Google Scholar] [CrossRef]
  12. Lü, X.; Liu, J.; Han, Z.; Zhu, L.; Chen, X. Effects of Yindaruqin irrigation project on groundwater chemical compositions in Qinwangchuan basin in Gansu Province Article. Transactions of the Chinese Society of Agricultural Engineering. 2020, 36, 166–174. [Google Scholar]
  13. Mukate, S.; Bhoominathan, S.; Solanky, V. Assessment of human health risk arising due to fluoride and nitrate in groundwater: a case study of bhokardan tehsil of maharashtra. Human and ecological risk assessment. 2022, 28, 594–620. [Google Scholar] [CrossRef]
  14. Pashaeifar, M.; Dehghanzadeh, R.; Ramazani, M.E.; Rafieyan, O.; Nejaei, A. Spatial and temporal assessment of groundwater quality and hydrogeochemical processes in urmia lake basin, iran. Water Supply, 2021, 21 8, 4328-4342.
  15. Peng, H.; Yang, W.; Ferrer, A.; Xiong, S.; Li, X.; Niu, G.; et al. Hydrochemical characteristics and health risk assessment of groundwater in karst areas of southwest china: a case study of bama, guangxi. Journal of Cleaner Production. 2022, 341, 130872. [Google Scholar] [CrossRef]
  16. Qin, R.; Song, Q.; Hao, Y.; Wu, G. Groundwater level declines in tianjin, north china: climatic variations and human activities. Environment, Development and Sustainability. 2023, 25, 1899–1913. [Google Scholar] [CrossRef]
  17. Quinn, N.; Oster, J.D. Innovations in sustainable groundwater and salinity management in california's san joaquin valley. Sustainability. 2021, 13, 6658. [Google Scholar] [CrossRef]
  18. Rai, S. C.; Saha, A. K. Impact of urban sprawl on groundwater quality: a case study of faridabad city, national capital region of delhi. Arabian Journal of Geoences. 2015, 810, 8039–8045. [Google Scholar] [CrossRef]
  19. Ren, C.; Zhang, Q.; Wang, H.; Wang, Y. Characteristics and source apportionment of polycyclic aromatic hydrocarbons of groundwater in hutuo river alluvial-pluvial fan, china, based on pmf model. Environmental science and pollution research. 2021, 288, 9647–9656. [Google Scholar] [CrossRef]
  20. Villegas, P.; Paredes, V.; Betancur, T.; Ribeiro, L. Assessing the hydrochemistry of the urabá aquifer, colombia by principal component analysis. Journal of Geochemical Exploration. 2013, 134, 120–129. [Google Scholar] [CrossRef]
  21. Saccò. ; Mattia.; Blyth, A.; Douglas, G.; et al. Stygofaunal diversity and ecological sustainability of coastal groundwater ecosystems in a changing climate: The Australian paradigm. Freshwater Biology. 2021, 6712, 2007–2023.
  22. Sinha, R.S.; Elango, L.J.W.g.C. Deterioration of groundwater quality: implications and management. Water Governance: Challenges and Prospects. 2019, 87-101.
  23. Stanley, Emily, H. ; Doyle, Martin. A geomorphic perspective on nutrient retention following dam removal. BioScience. 2002, 528, 693–693.
  24. Tiwari, A.K.; Singh, A.K.; Singh, A.K.; & Singh, M.P. ; & Singh, M. P. Hydrogeochemical analysis and evaluation of surface water quality of pratapgarh district, uttar pradesh, india. Applied Water Science. 2017, 74, 1–15. [Google Scholar]
  25. Wang, Q.; Dong, S.; Wang, H.; Yang, J.; Yu, B. Hydrogeochemical processes and groundwater quality assessment for different aquifers in the caojiatan coal mine of ordos basin, northwestern china. Environmental Earth Sciences. 2020, 79, 1–15. [Google Scholar] [CrossRef]
  26. Xiaohui, R.; Zhang, Z.; Yu, R.; Li, Y.; Li, Y.; et al. Hydrochemical variations and driving mechanisms in a large linked river-irrigation-lake system. Environmental Research, 2023, 225.
  27. Zhang, Q.; Wang, H. Assessment of sources and transformation of nitrate in the alluvial-pluvial fan region of north china using a multi-isotope approach. Journal of Environmental Sciences. 2020, 893, 9–22. [Google Scholar] [CrossRef] [PubMed]
  28. Zhang, Y.; Zhou, W.; Jin, X. Interaction analysis of magnaporthe grisea and rice varieties in heilongjiang province. Journal of Northeast Agricultural University. 2011, 421, 28–33(In Chinese). (In Chinese) [Google Scholar]
  29. Zheng, C.; Liu, J.; Cao, G.; Kendy, E.; Wang, H.; Jia, Y. Can China Cope with Its Water Crisis? —Perspectives from the North China Plain. Ground Water. 2010, 483, 350–354. [Google Scholar]
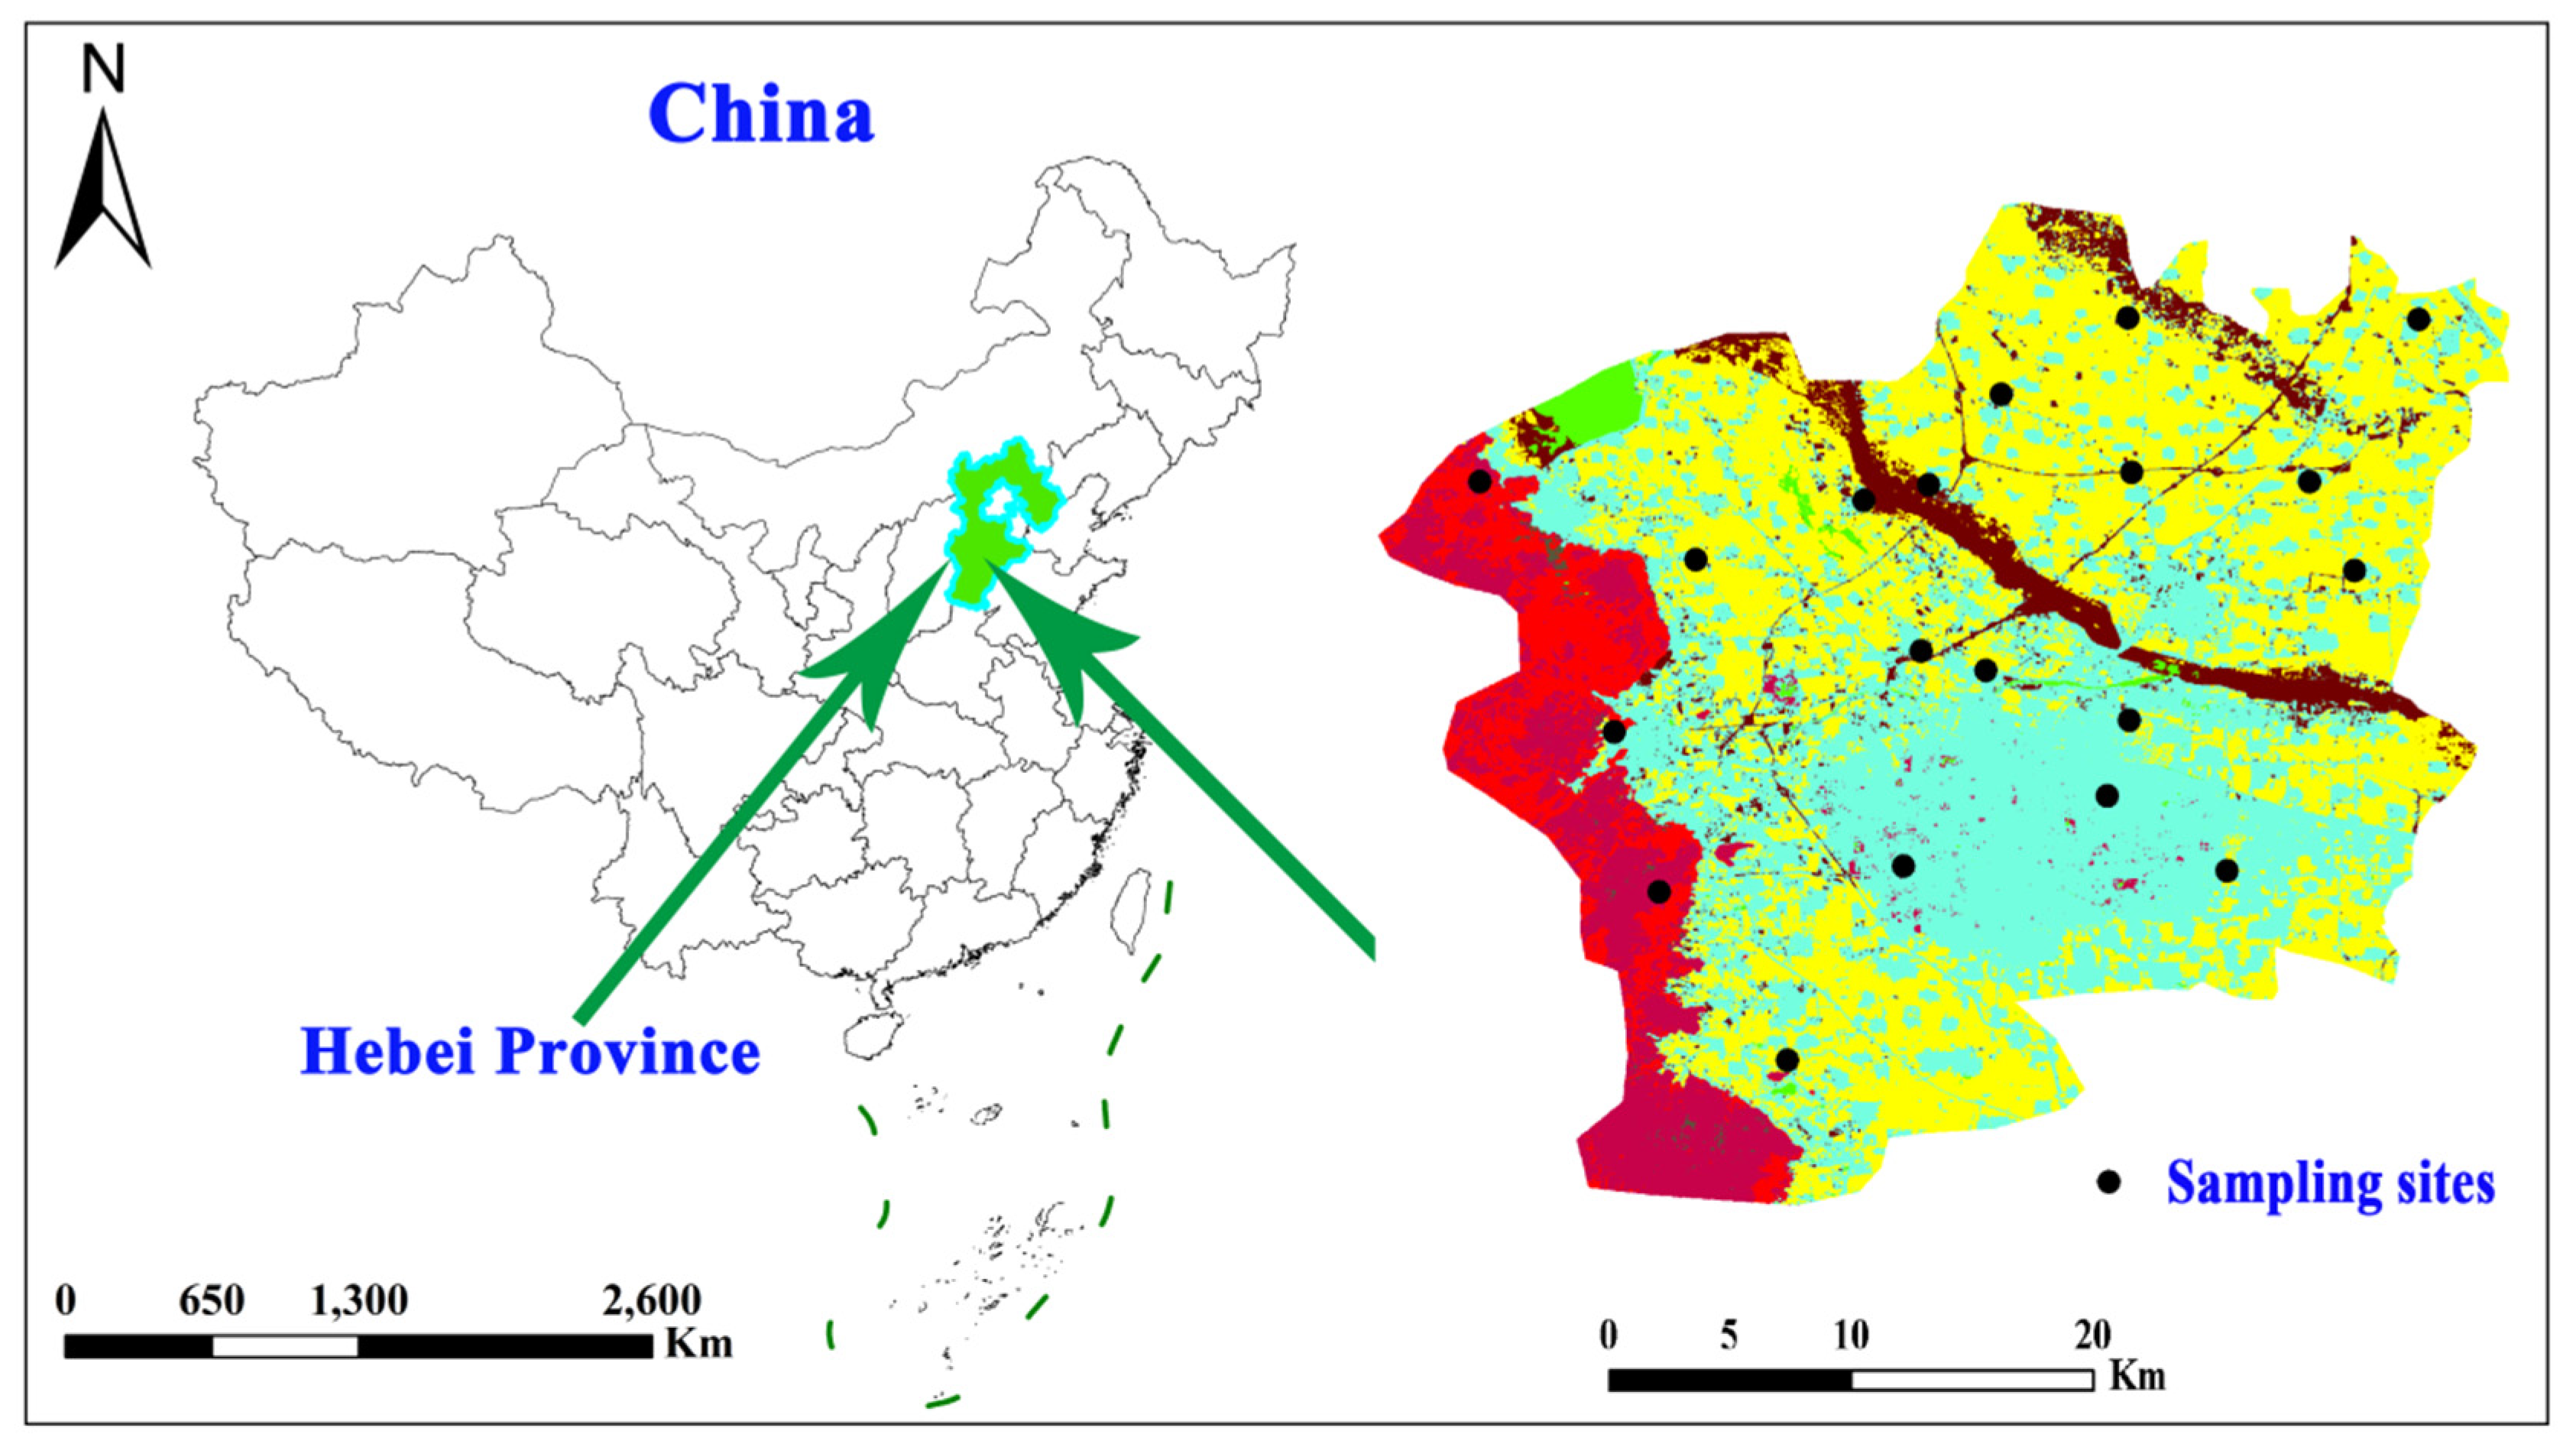
Figure 1. Distribution map of groundwater sample sites.
Preprints 78213 g001
Figure 2. Relationship of pH and the sum of major cations in groundwater.
Preprints 78213 g002
Figure 3. Characteristics of changes in the major chemical components of groundwater.
Preprints 78213 g003
Figure 4. Piper trilinear diagram of groundwater in different stages of urbanization.
Preprints 78213 g004
Figure 5. Gibbs diagrams for groundwater in different stages of urbanization.
Preprints 78213 g005
Figure 6. Relationships between major ions for groundwater samples in different stages of urbanization (a)(Ca2+/Na+)vs.(Mg2+/Na+);(b)Cl- vs.Na+;(c)[Ca2++Mg2+] vs. [HCO3-+SO42-]; (d)SO42- vs.Ca2+;(e):[Na++K+-Cl-] vs. [Ca2++Mg2+-HCO3--SO42-].
Preprints 78213 g006
Figure 7. Variation relationship of SO42-/Na+ and NO3-/Na+ in different stages of urbanization.
Preprints 78213 g007
Table 1. PCA analysis results at each stage of urbanization.
Parameters Primary stage of urbanization Intermediate stage of urbanization Advanced stage of urbanization
PC1 PC2 PC1 PC2 PC1 PC2 PC3
TDS 0.985 -0.089 0.957 0.106 0.272 0.708 0.511
Ca2+ 0.952 -0.205 0.925 -0.113 0.796 0.523 0.183
Mg2+ 0.922 -0.102 0.062 0.806 0.980 0.032 0.086
NO3- 0.882 -0.167 0.016 0.599 0.139 0.925 0.185
TH 0.868 0.011 0.870 0.013 0.834 0.331 0.227
SO42- 0.868 0.061 0.934 -0.188 -0.074 0.243 0.916
HCO3- 0.859 -0.183 -0.401 0.646 0.036 0.851 0.239
Cl- 0.612 -0.003 0.801 0.179 0.963 -0.052 -0.196
K++Na+ -0.039 0.827 0.765 0.014 0.744 -0.077 0.583
pH -0.082 0.704 0.209 0.793 -0.045 -0.787 0.138
Eigenvalue 6.23 1.20 4.84 2.15 4.95 2.48 1.27
Contribution rate% 62.3 12.0 48.4 21.5 49.5 24.8 12.6
Cumulative contribution rate% 62.3 74.4 48.4 69.9 49.5 74.3 86.9
Disclaimer/Publisher’s Note: The statements, opinions and data contained in all publications are solely those of the individual author(s) and contributor(s) and not of MDPI and/or the editor(s). MDPI and/or the editor(s) disclaim responsibility for any injury to people or property resulting from any ideas, methods, instructions or products referred to in the content.
Copyright: This open access article is published under a Creative Commons CC BY 4.0 license, which permit the free download, distribution, and reuse, provided that the author and preprint are cited in any reuse.
Prerpints.org logo

Preprints.org is a free preprint server supported by MDPI in Basel, Switzerland.

Subscribe

© 2024 MDPI (Basel, Switzerland) unless otherwise stated