Submitted:
30 June 2023
Posted:
03 July 2023
You are already at the latest version
Abstract
Keywords:
1. Introduction
2. Materials and Methods
2.1. LEACH Protocol
Mathematical Modeling of LEACH
2.2. Artificial Neural Network (ANN)
Mathematical Modeling of ANNs
2.3. Methodology
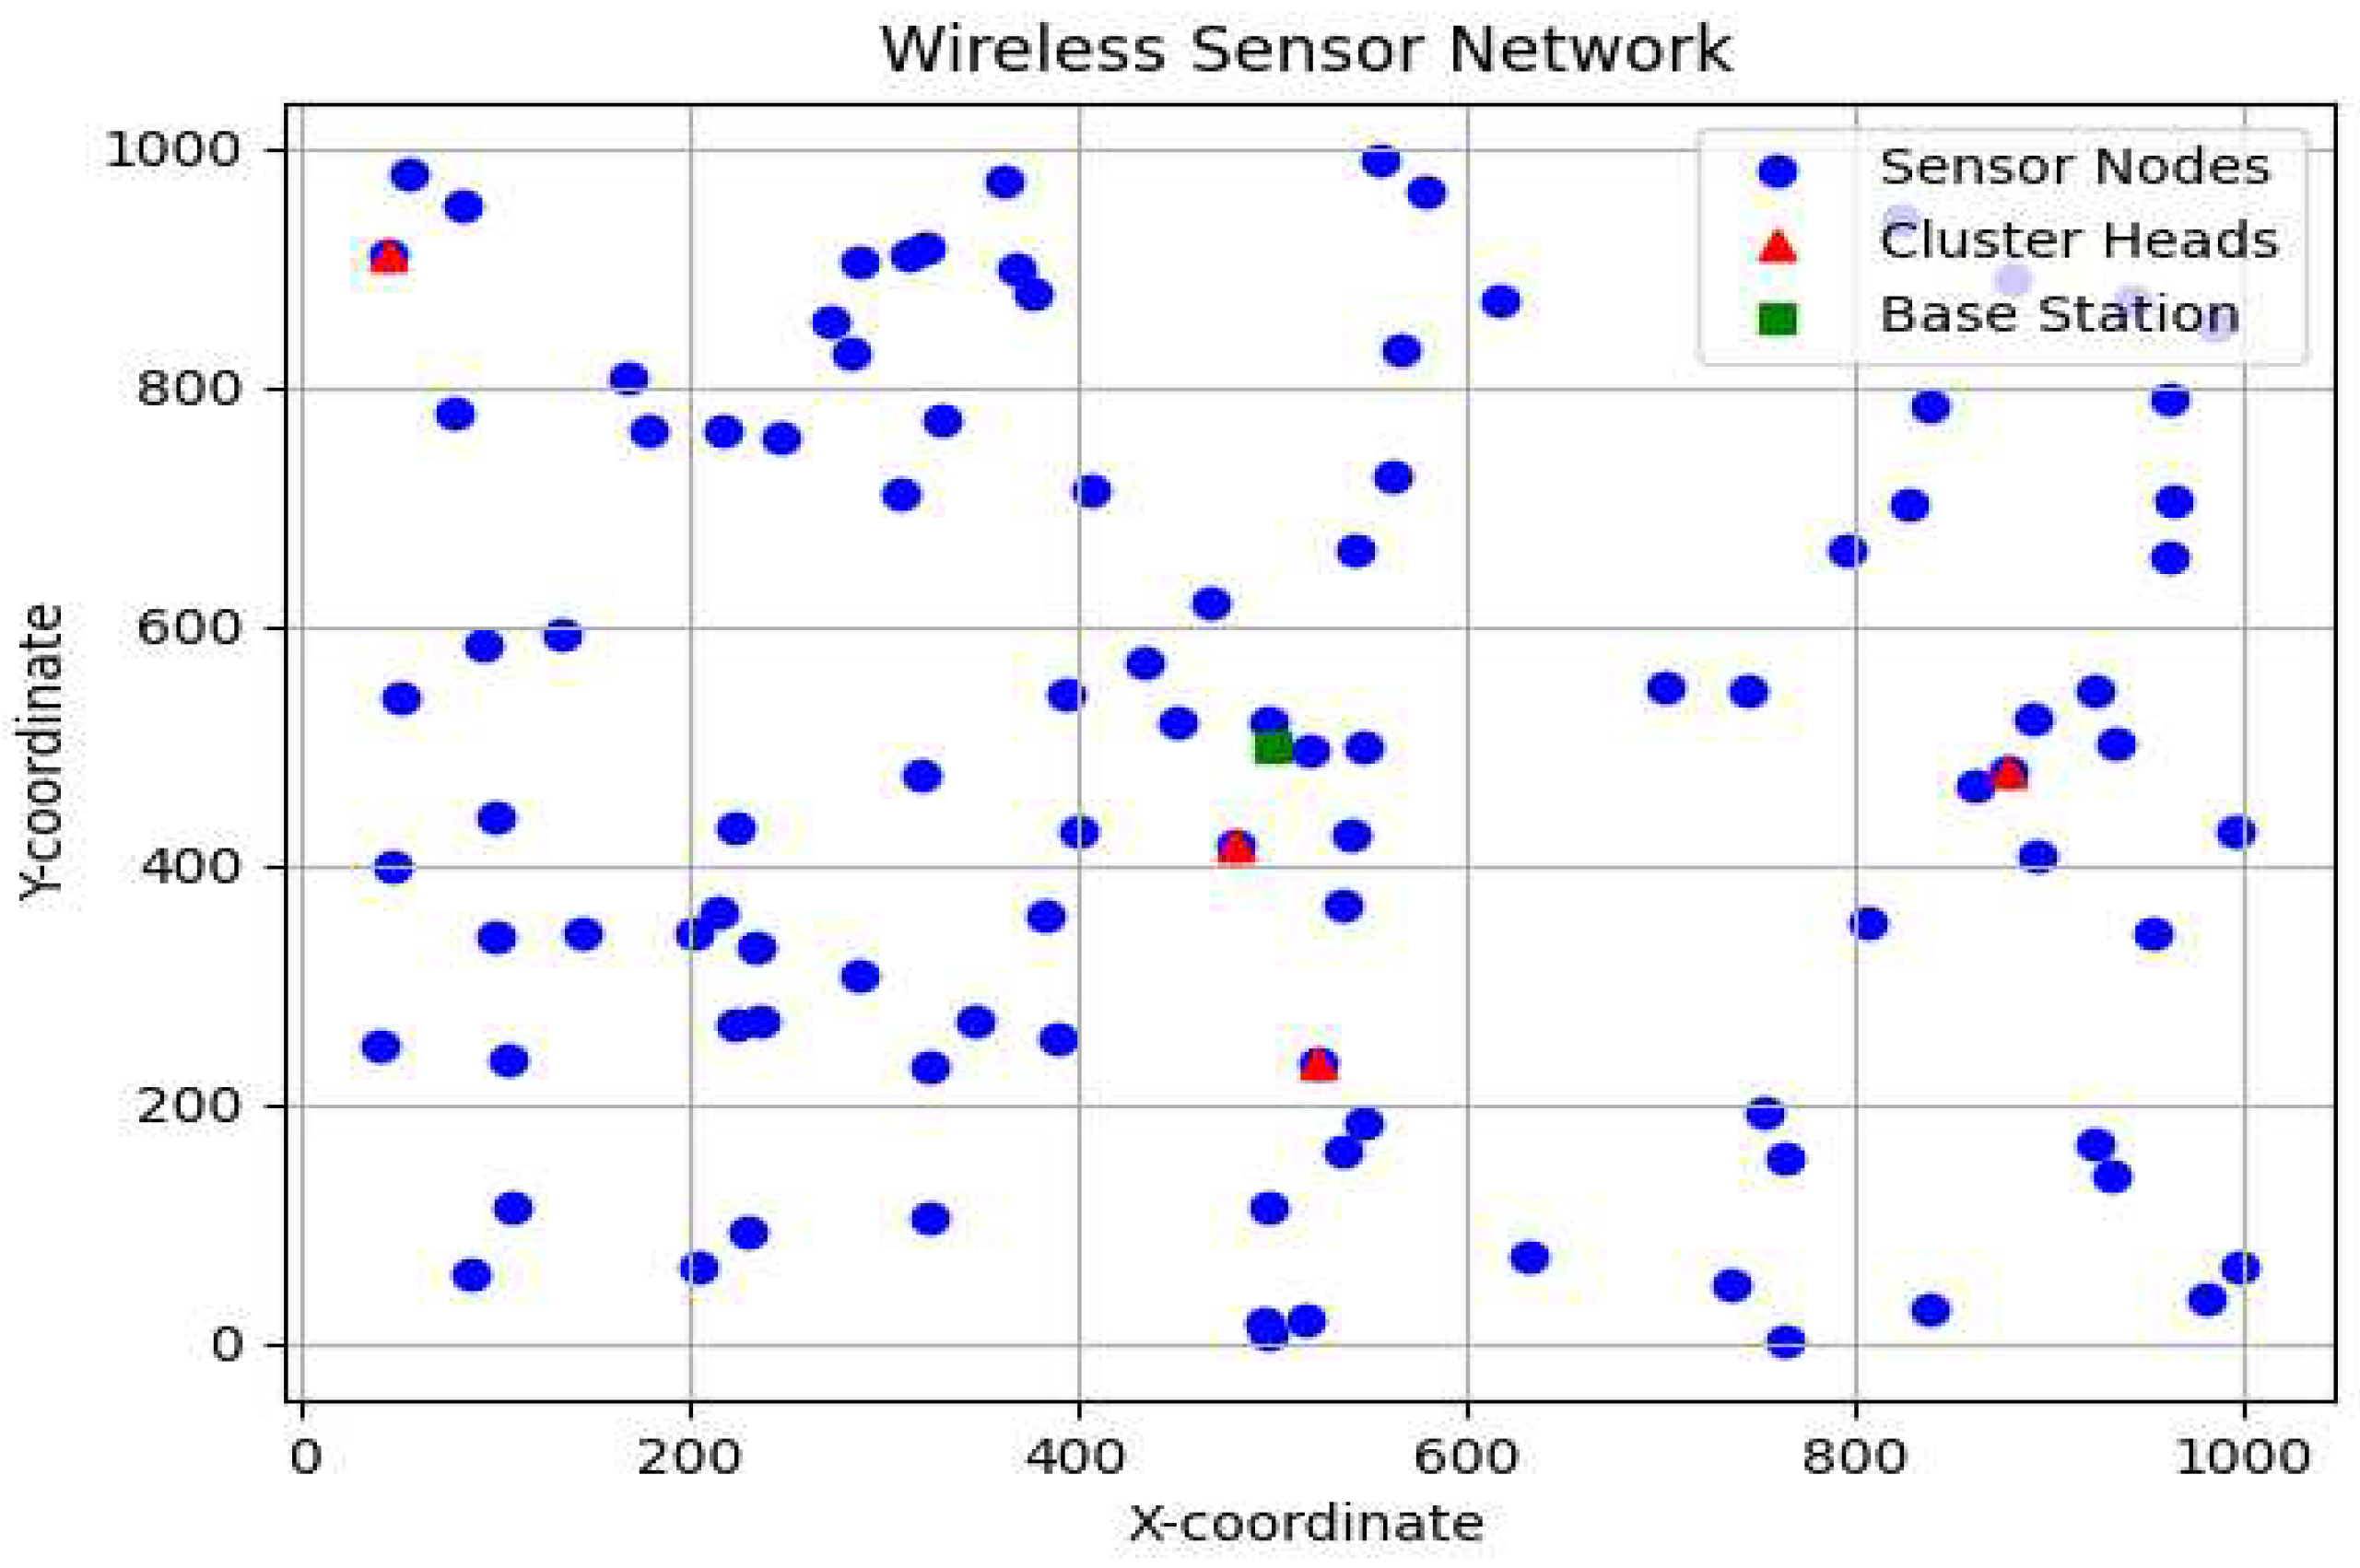
2.3.1. Installation of Network Nodes
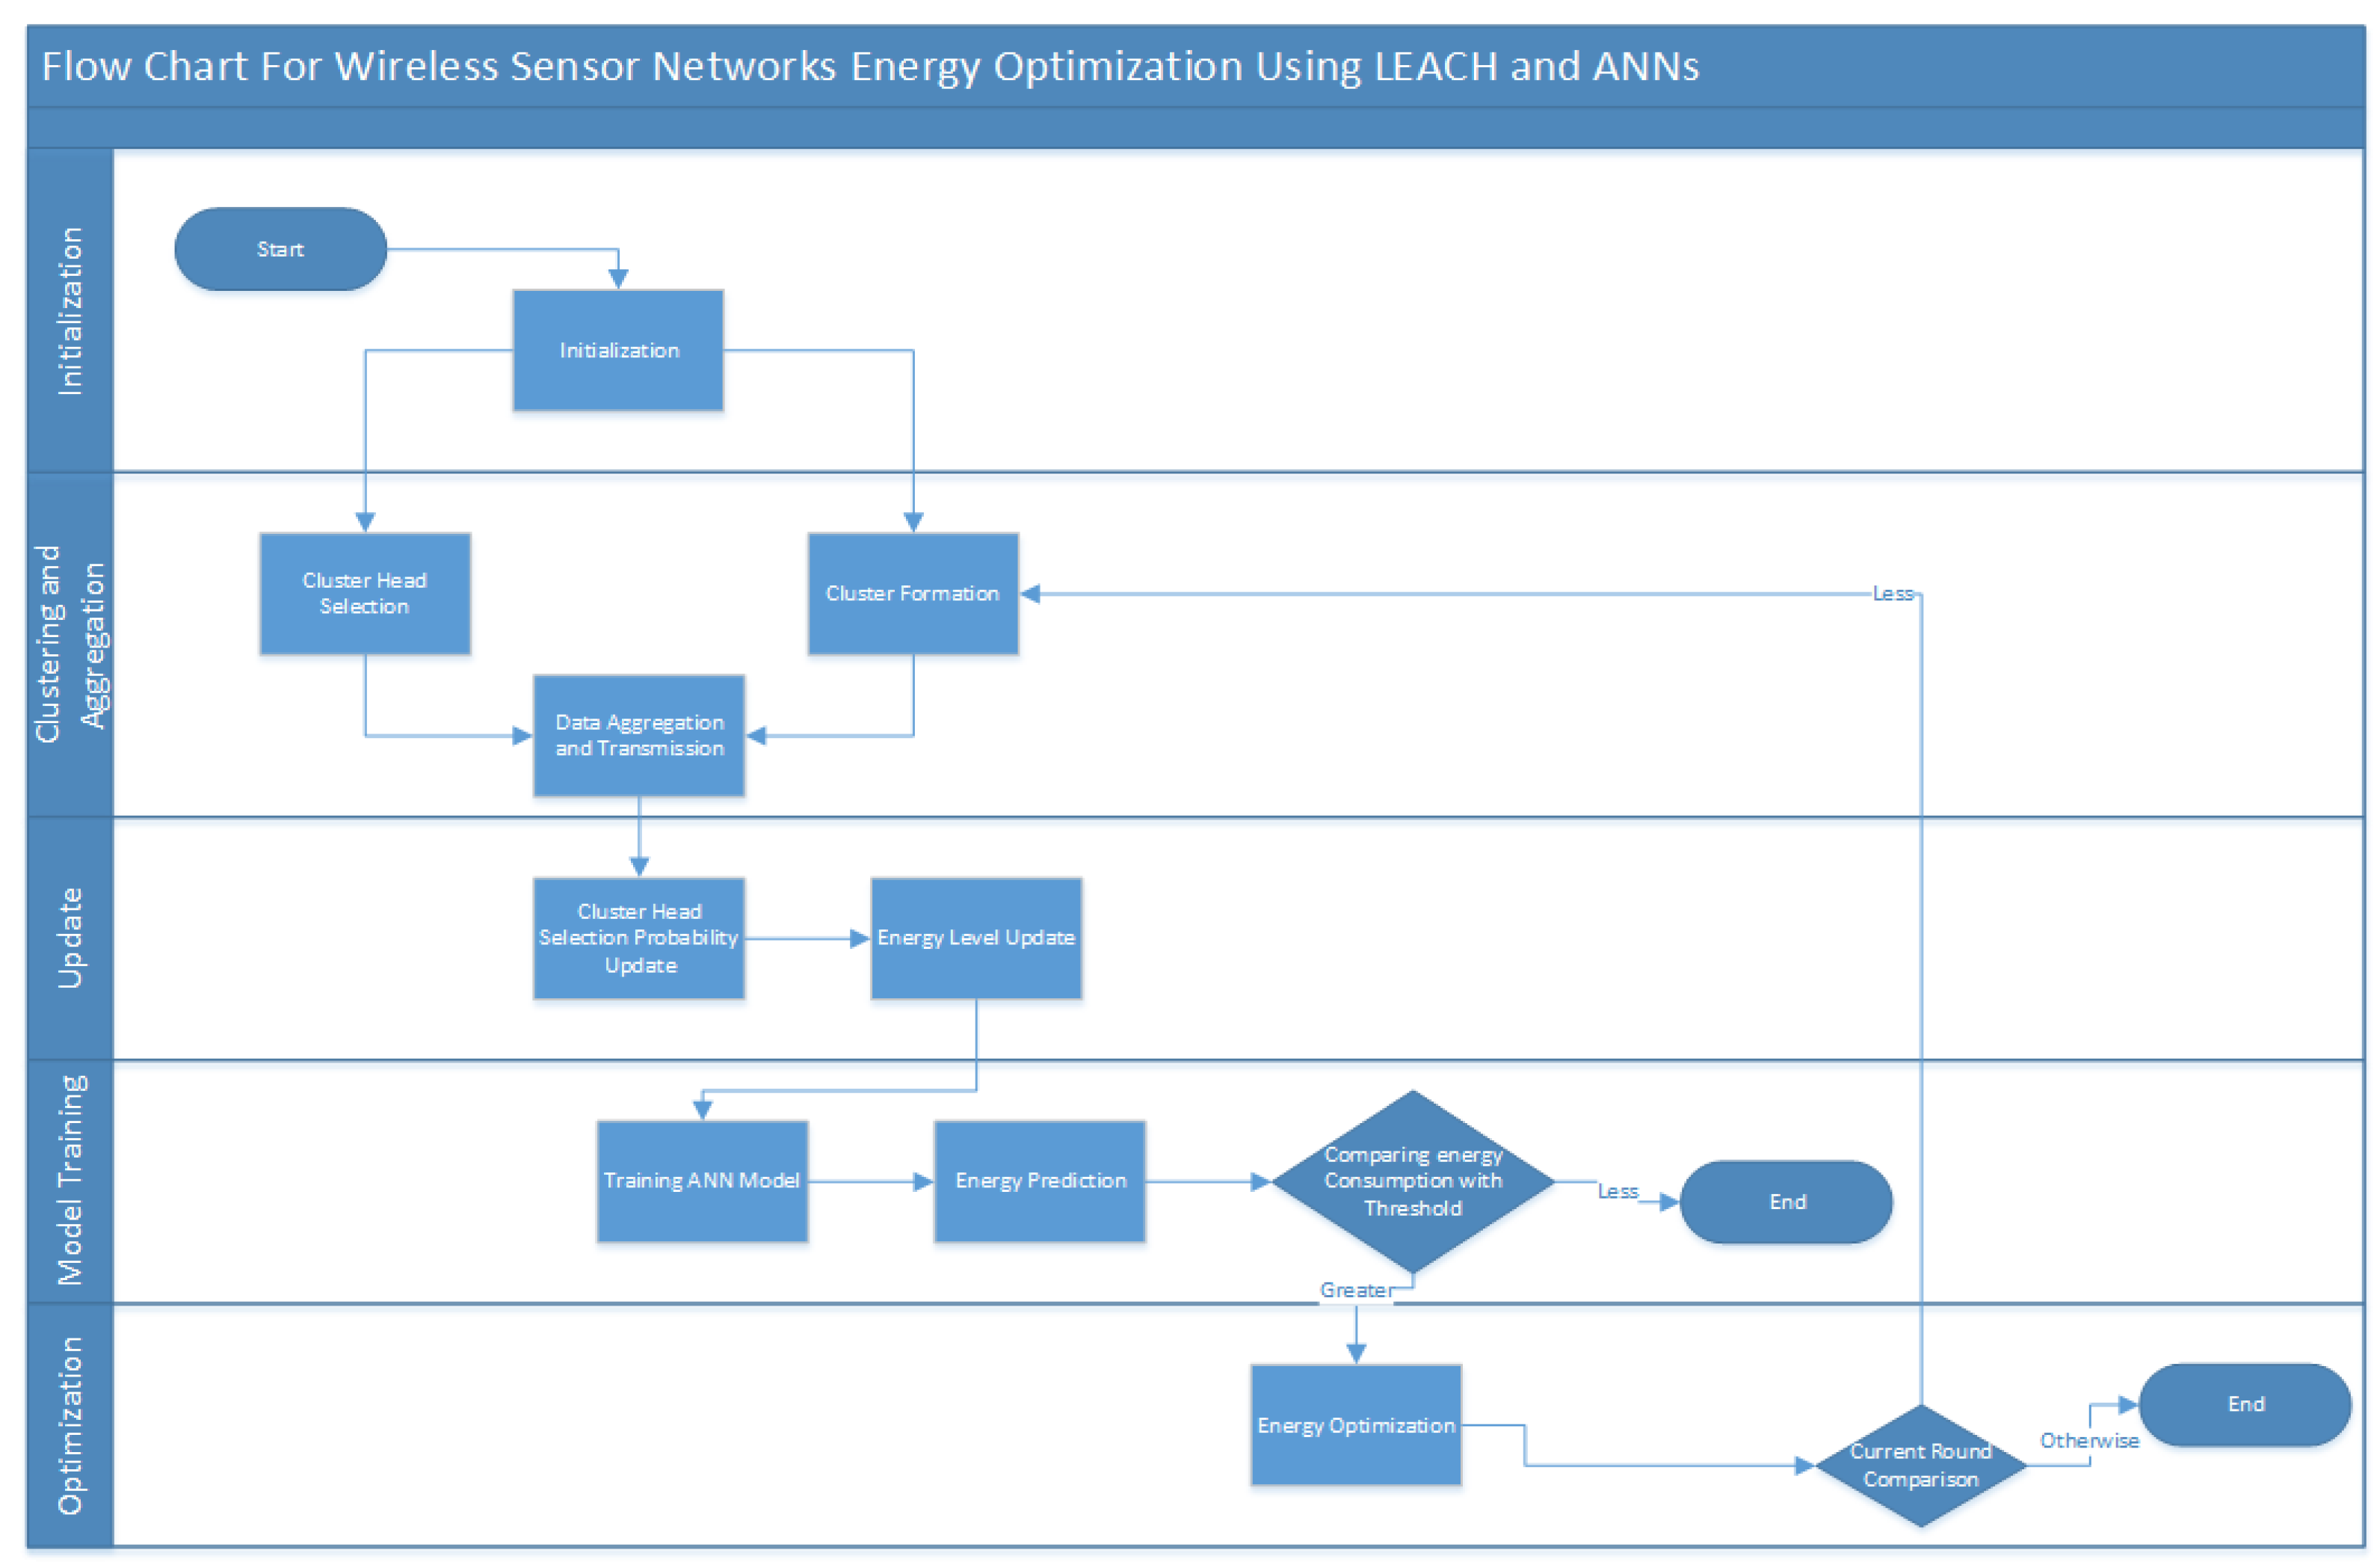
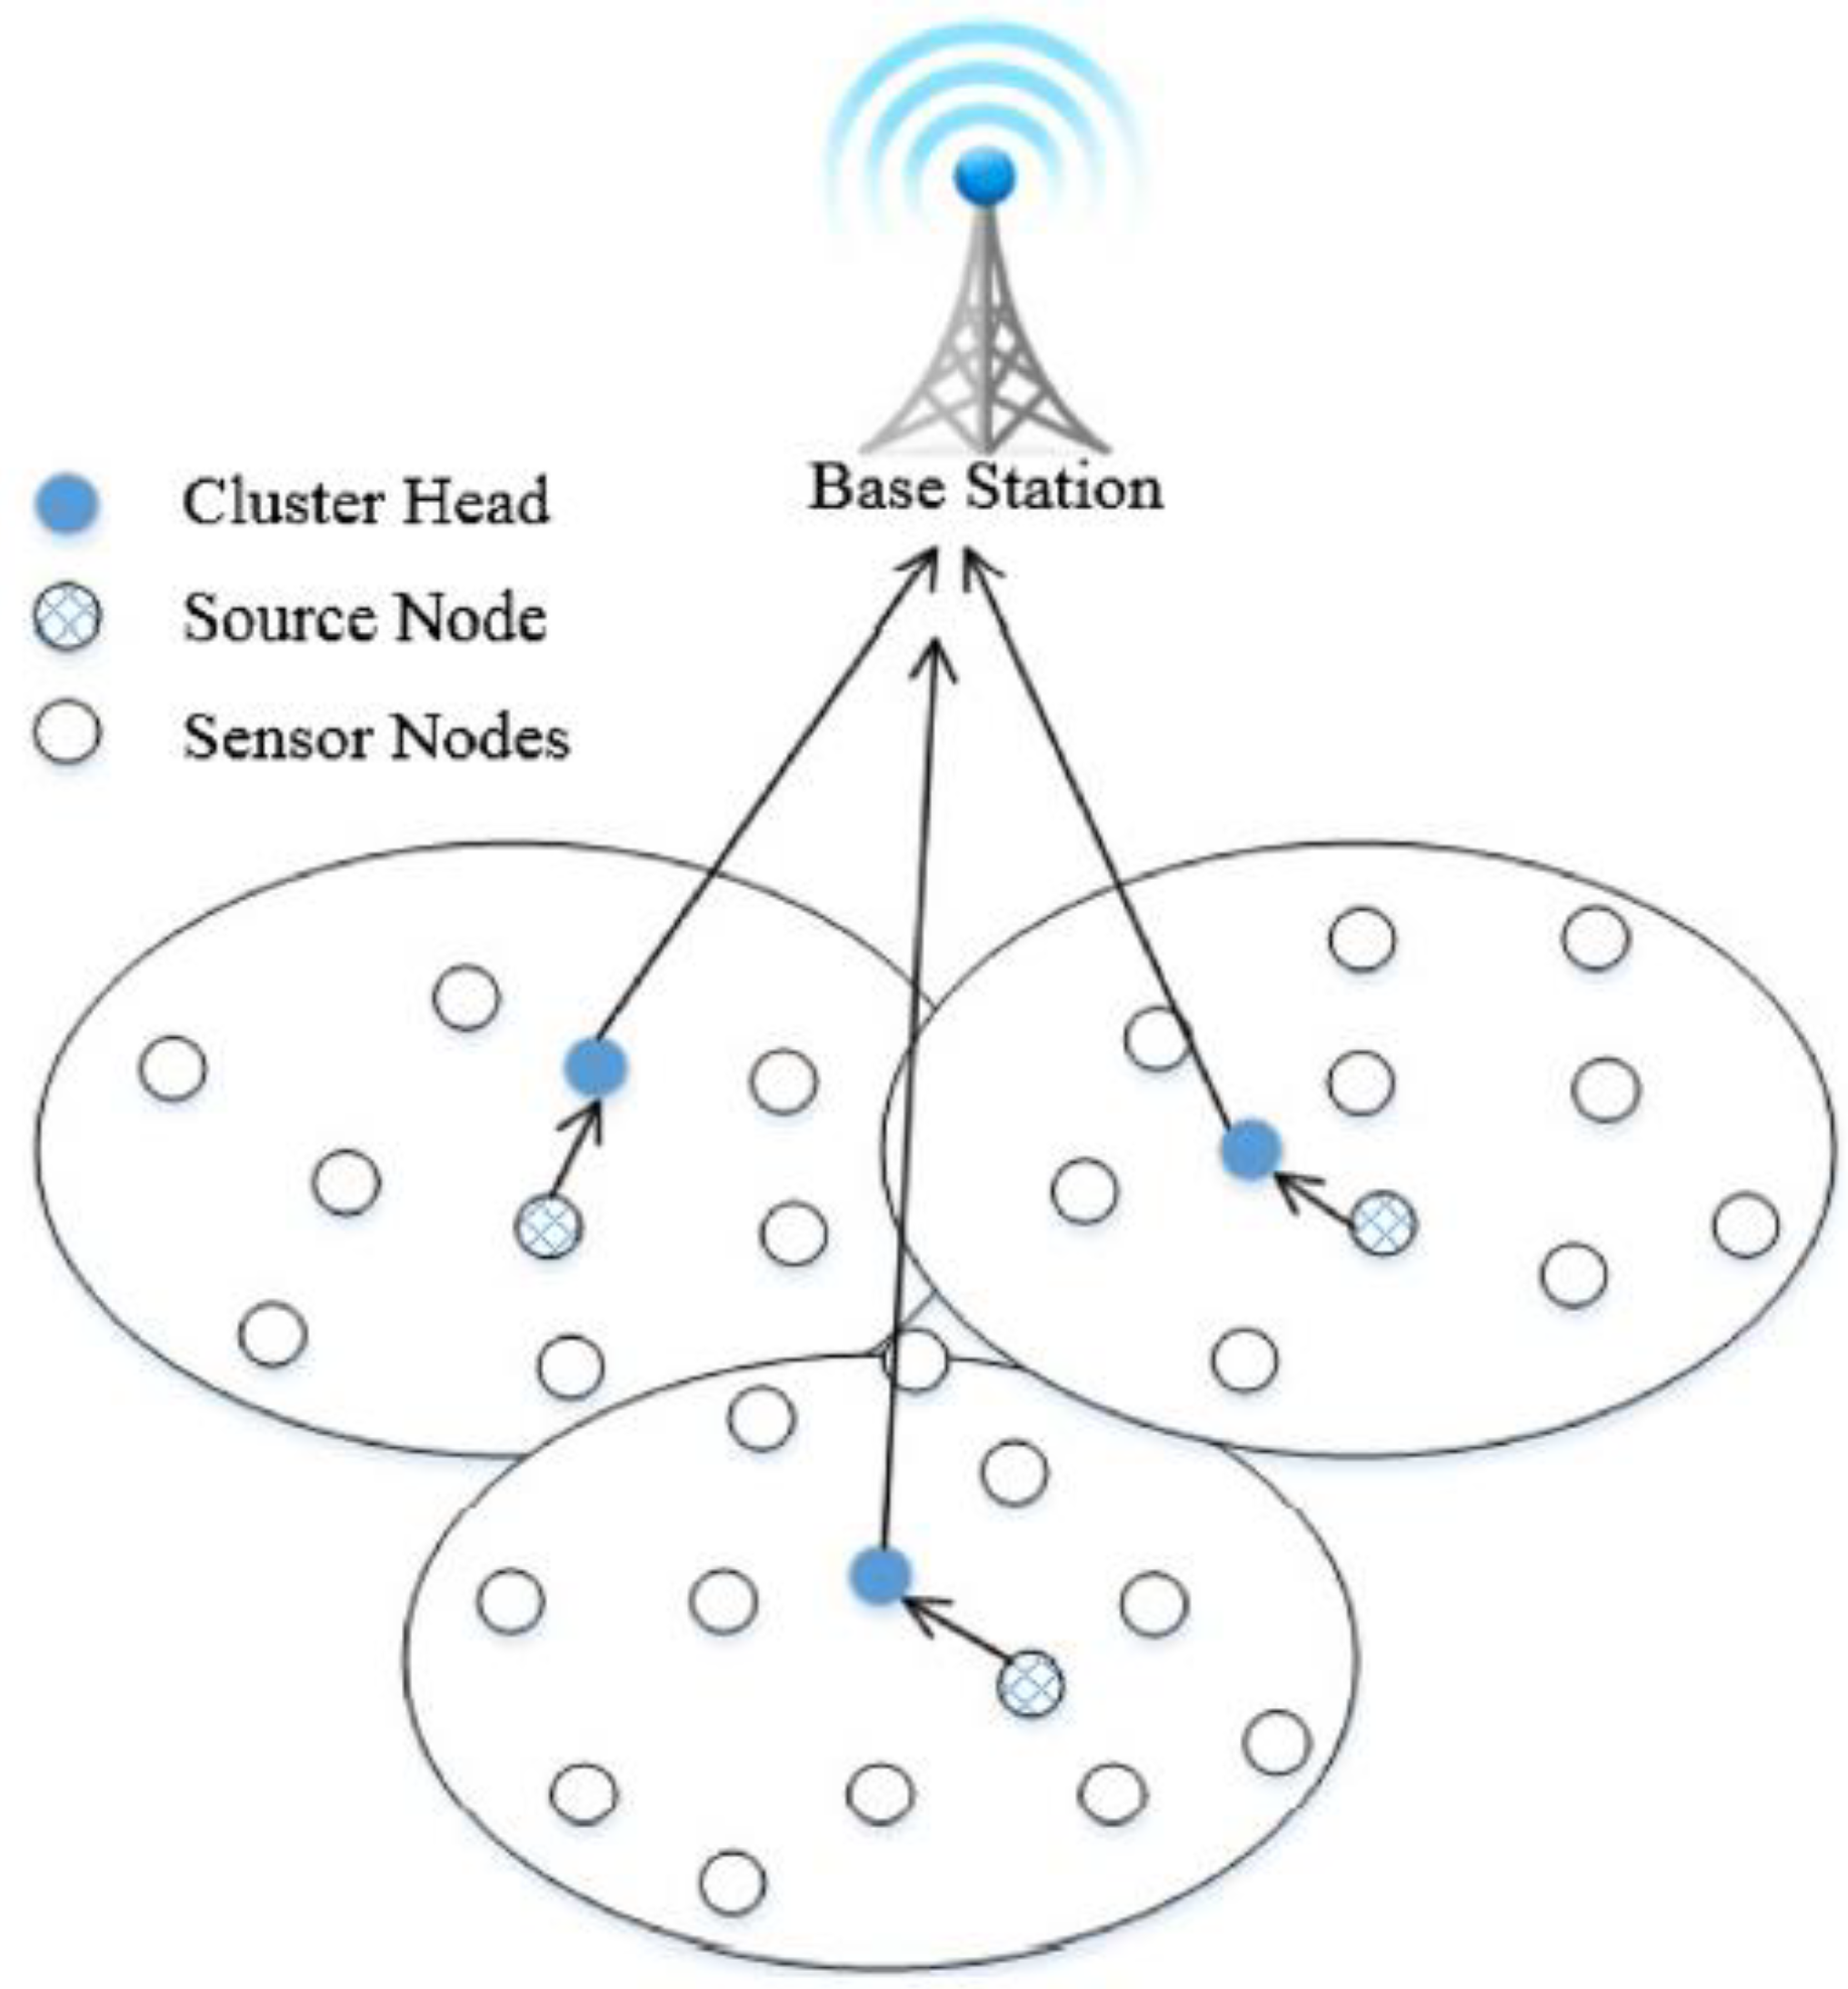
2.3.2. Clustering Using LEACH
3. Results and Discussion
| Parameters | Area | (Initial energy) | Number of nodes (N) | Eelec (Energy consumption) |
(Multi-path model of transmitter amplifier) |
(Free space model of transmitter amplifier) |
l(Packet size) |
|---|---|---|---|---|---|---|---|
| values | 100 m × 100 m | 0.8 J | 100-500 | 80nJ/bit | 0.001301pJ/bit/m4 | 10pJ/bit/m2 | 5000 bits |
| Parameters | Network Size | End-to-End Delay (ms) |
|---|---|---|
| 20 | 1002 | |
| 40 | 2465 | |
| values | 60 | 7558 |
| 80 | 9994 | |
| 100 | 12847 |
| Techniques | MSE | RMSE | Efficiency | |
|---|---|---|---|---|
| Proposed Technique (LEACH+ANN) | 0.16 | 0.40 | 44.9% | |
| Distributed Topology Control (DTC) [29] | 0.30 | 0.54 | 5.83% | |
| Cross-Layer Optimization (CLO) [30] | 0.21 | 0.46 | 13.3% | |
| Data Aggregation Methods DAM [31] | 0.42 | 0.64 | 2.99% |

4. Conclusions
Author Contributions
Funding
Data Availability Statement
Acknowledgments
Conflicts of Interest
Appendix A
| Algorithm 1: LEACH Protocol |
| Step 1: Initialization Set the number of rounds (N) and the desired percentage of cluster heads (P) for each round. Set the initial energy level (E) for all sensor nodes. Randomly select a percentage (P) of nodes as cluster heads for the current round. Step 2: Cluster Formation Each non-cluster head sensor node calculates the distance to the closest cluster head. Each non-cluster head sensor node joins the cluster with the nearest cluster head. Cluster heads receive the join requests and update their cluster membership lists. Step 3: Data Aggregation and Transmission Each sensor node collects data from its sensing area. Each cluster head aggregates the data received from its member nodes. Each cluster head compresses and prepares the aggregated data for transmission. Each cluster head transmits the aggregated data to the base station. Step 4: Cluster Head SelectionEach sensor node calculates its probability of becoming a cluster head for the next round using the following formula: Probability = P / (1 - P * (current round mod (1 / P))) Step 5: Energy Level Update Each sensor node decreases its energy level based on the energy consumption during data aggregation and transmission. Each cluster head uses the remaining energy level to calculate its energy dissipation for the next round. Step 6: RepeatIf the current round is less than N, go to Step 2. Otherwise, terminate the algorithm. |
| Algorithm 2: Artificial Neural Networks (ANNs) for Energy Optimization |
| Step 1: Training the ANN Model Collect a dataset of sensor node attributes (such as location, remaining energy, distance to the Base Station, etc.) and their corresponding energy consumption. Preprocess the dataset by normalizing the input attributes. Design the architecture of the ANN model, including the number of layers, neurons per layer, and activation functions. Split the dataset into training and testing sets. Train the ANN model using the training set, adjusting the weights and biases through backpropagation and gradient descent optimization. Evaluate the trained ANN model using the testing set and measure its performance metrics (e.g., accuracy, mean squared error, etc.). Step 2: Energy Prediction and Optimization Deploy the trained ANN model to each sensor node. Each sensor node periodically measures its attributes (such as remaining energy, distance to the base station, etc.). Input the measured attributes into the ANN model to predict the energy consumption. If the predicted energy consumption is above a threshold, perform energy optimization techniques, such as reducing transmission power, adjusting sleep/wake schedules, or applying duty cycling. Implement the energy optimization techniques and update the node’s energy consumption accordingly. Step 3: Repeat Repeat Steps 2 and 3 periodically or whenever necessary. |
References
- Al Aghbari, Z.; Khedr, A.M.; Osamy, W.; Arif, I.; Agrawal, D.P. Routing in Wireless Sensor Networks Using Optimization Techniques: A Survey. Wirel. Pers. Commun. 2019, 111, 2407–2434. [Google Scholar] [CrossRef]
- Almuzaini, K.K.; Joshi, S.; Ojo, S.; Aggarwal, M.; Suman, P.; Pareek, P.K.; Shukla, P.K. Optimization of the operational state's routing for mobile wireless sensor networks. Wirel. Netw. 2023, 1–15. [Google Scholar] [CrossRef]
- Balamurugan, A.; Janakiraman, S.; Priya, M.D.; Malar, A.C.J. Hybrid Marine predators optimization and improved particle swarm optimization-based optimal cluster routing in wireless sensor networks (WSNs). China Commun. 2022, 19, 219–247. [Google Scholar] [CrossRef]
- Sahoo, B.M.; Pandey, H.M.; Amgoth, T. GAPSO-H: A hybrid approach towards optimizing the cluster based routing in wireless sensor network. Swarm Evol. Comput. 2020, 60, 100772. [Google Scholar] [CrossRef]
- VPrasad, K.; Periyasamy, S. Energy Optimization-Based Clustering Protocols in Wireless Sensor Networks and Internet of Things-Survey. Int. J. Distrib. Sens. Netw. 2023, 2023, 1362417. [Google Scholar] [CrossRef]
- Sharma, H.; Haque, A.; Blaabjerg, F. Machine Learning in Wireless Sensor Networks for Smart Cities: A Survey. Electronics 2021, 10, 1012. [Google Scholar] [CrossRef]
- Biradar, M.; Mathapathi, B. Security and Energy Aware Clustering-Based Routing in Wireless Sensor Network: Hybrid Nature-Inspired Algorithm for Optimal Cluster Head Selection. J. Interconnect. Netw. 2022, 23, 1–24. [Google Scholar] [CrossRef]
- Vo, V.N.; Nguyen, T.G.; So-In, C.; Ha, D.-B. Secrecy Performance Analysis of Energy Harvesting Wireless Sensor Networks With a Friendly Jammer. IEEE Access 2017, 5, 25196–25206. [Google Scholar] [CrossRef]
- Nayyar, A.; Singh, R. IEEMARP- a novel energy efficient multipath routing protocol based on ant Colony optimization (ACO) for dynamic sensor networks. Multimed. Tools Appl. 2019, 79, 35221–35252. [Google Scholar] [CrossRef]
- Qamar, M.S.; Tu, S.; Ali, F.; Armghan, A.; Munir, M.F.; Alenezi, F.; Muhammad, F.; Ali, A.; Alnaim, N. Improvement of Traveling Salesman Problem Solution Using Hybrid Algorithm Based on Best-Worst Ant System and Particle Swarm Optimization. Appl. Sci. 2021, 11, 4780. [Google Scholar] [CrossRef]
- Alla, V.K.; Mallikarjuna, M. Routing Protocol Based on Bacterial Foraging Optimization and Type-2 Fuzzy Logic for Wireless Sensor Networks. In Proceedings of the 2020 11th International Conference on Computing, Communication and Networking Technologies (ICCCNT), Kharagpur, India, 1–3 July 2020. [Google Scholar] [CrossRef]
- Han, G.; Dong, Y.; Guo, H.; Shu, L.; Wu, D. Cross-layer optimized routing in wireless sensor networks with duty cycle and energy harvesting. Wirel. Commun. Mob. Comput. 2014, 15, 1957–1981. [Google Scholar] [CrossRef]
- Liu, Y.; Li, C.; Zhang, Y.; Xu, M.; Xiao, J.; Zhou, J. DCC-IACJS: A novel bio-inspired duty cycle-based clustering approach for energy-efficient wireless sensor networks. J. King Saud Univ. Comput. Inf. Sci. 2023, 35, 775–790. [Google Scholar] [CrossRef]
- Chéour, R.; Jmal, M.W.; Khriji, S.; El Houssaini, D.; Trigona, C.; Abid, M.; Kanoun, O. Towards Hybrid Energy-Efficient Power Management in Wireless Sensor Networks. Sensors 2021, 22, 301. [Google Scholar] [CrossRef]
- Hussein, A.M.; Idrees, A.K.; Couturier, R. A distributed prediction–compression-based mechanism for energy saving in IoT networks. J. Supercomput. 2023, 1–37. [Google Scholar] [CrossRef]
- Ding, Q.; Zhu, R.; Liu, H.; Ma, M. An Overview of Machine Learning-Based Energy-Efficient Routing Algorithms in Wireless Sensor Networks. Electronics 2021, 10, 1539. [Google Scholar] [CrossRef]
- Choi, S.-H.; Yoo, S.-J. Recurrent Neural Network-Based Optimal Sensing Duty Cycle Control Method for Wireless Sensor Networks. IEEE Access 2021, 9, 133215–133228. [Google Scholar] [CrossRef]
- Chen, B.; Yao, N.; Liu, W.; Liu, J.; Li, X.; Hao, X. Distributed Topology Control Algorithm Based on Load Balancing Evaluation Model in Wireless Sensor Networks. Wirel. Pers. Commun. 2019, 109, 2607–2625. [Google Scholar] [CrossRef]
- Liang, H.; Yang, S.; Li, L.; Gao, J. Research on routing optimization of WSNs based on improved LEACH protocol. EURASIP J. Wirel. Commun. Netw. 2019, 2019, 1–12. [Google Scholar] [CrossRef]
- Antony, S.M.; Indu, S.; Pandey, R. An efficient solar energy harvesting system for wireless sensor network nodes. J. Inf. Optim. Sci. 2020, 41, 39–50. [Google Scholar] [CrossRef]
- Priya, B.; Manohar, S.S. Adaptive power control and duty cycle based medium access control protocol for cluster based wireless sensor network. Sci. Technol. 2020, 23, 38–54. [Google Scholar]
- Kumar, A.; Dhaliwal, B.S.; Singh, D. Cross-Layer based Energy Efficient Wireless Sensor Network for Large Farms. Int. J. Intell. Eng.Syst. 2022, 15, 483–493. [Google Scholar]
- Cotrim, R.S.; Caldeira, J.M.L.P.; Soares, V.N.; Azzoug, Y. Power saving MAC protocols in wireless sensor networks: a survey. Telecommun. Comput. Electron. Control. 2021, 19, 1778–1786. [Google Scholar] [CrossRef]
- Sadeq, A.S.; Hassan, R.; Sallehudin, H.; Aman, A.H.M.; Ibrahim, A.H. Conceptual Framework for Future WSN-MAC Protocol to Achieve Energy Consumption Enhancement. Sensors 2022, 22, 2129. [Google Scholar] [CrossRef] [PubMed]
- Virk, M.-U.A.; Mysorewala, M.F.; Cheded, L.; Aliyu, A. Review of energy harvesting techniques in wireless sensor-based pipeline monitoring networks. Renew. Sustain. Energy Rev. 2022, 157, 112046. [Google Scholar] [CrossRef]
- Prajapati, H.K.; Joshi, R. Performance Analysis of LEACH with Deep Learning in Wireless Sensor Networks. Int. J. Electron.Telecommun. 2022, 68, 799–805. [Google Scholar] [CrossRef]
- Arumugam, G.S.; Ponnuchamy, T. Development of energy efficient leach protocol for data gathering in wireless sensor networks. EURASIP J. Wirel. Commun.Netw. 2015, 76, 264–274. [Google Scholar] [CrossRef]
- Mittal, N.; Singh, S.; Sohi, B.S. An Energy Efficient Stable Clustering Approach Using Fuzzy Type-2 Neural Network Optimization Algorithm For Wireless Sensor Networks. Adhoc Sens. Wirel. Netw. 2020, 48, 183–219. [Google Scholar] [CrossRef]
- Al-Waisi, M.; Chai, K.M.; Shuaib, K. Distributed topology control approach for reducing energy consumption by dynamic power adjustment in wireless sensor networks. IEEE Trans. Mob. Comput. 2021, 20, 2539–2552. [Google Scholar]
- Chen, S.; Wang, Q.; Zhang, L.; Li, Z. Cross-layer optimization framework considering physical layer, medium access control layer, and network layer settings in wireless sensor networks. IEEE Trans. Veh. Technol. 2021, 70, 13478–13492. [Google Scholar]
- Wagh, S.J.; Bhende, M.S.; Thakare, A.D. Energy Optimization Protocol Design for Sensor Networks in IoT Domains; CRC Press: Boca Raton, FL, USA, 2022. [Google Scholar] [CrossRef]
- Yalçın, S.; Erdem, E. TEO-MCRP: Thermal exchange optimization-based clustering routing protocol with a mobile sink for wireless sensor networks. J. King Saud Univ. Comput. Inf. Sci. 2022, 34, 5333–5348. [Google Scholar] [CrossRef]
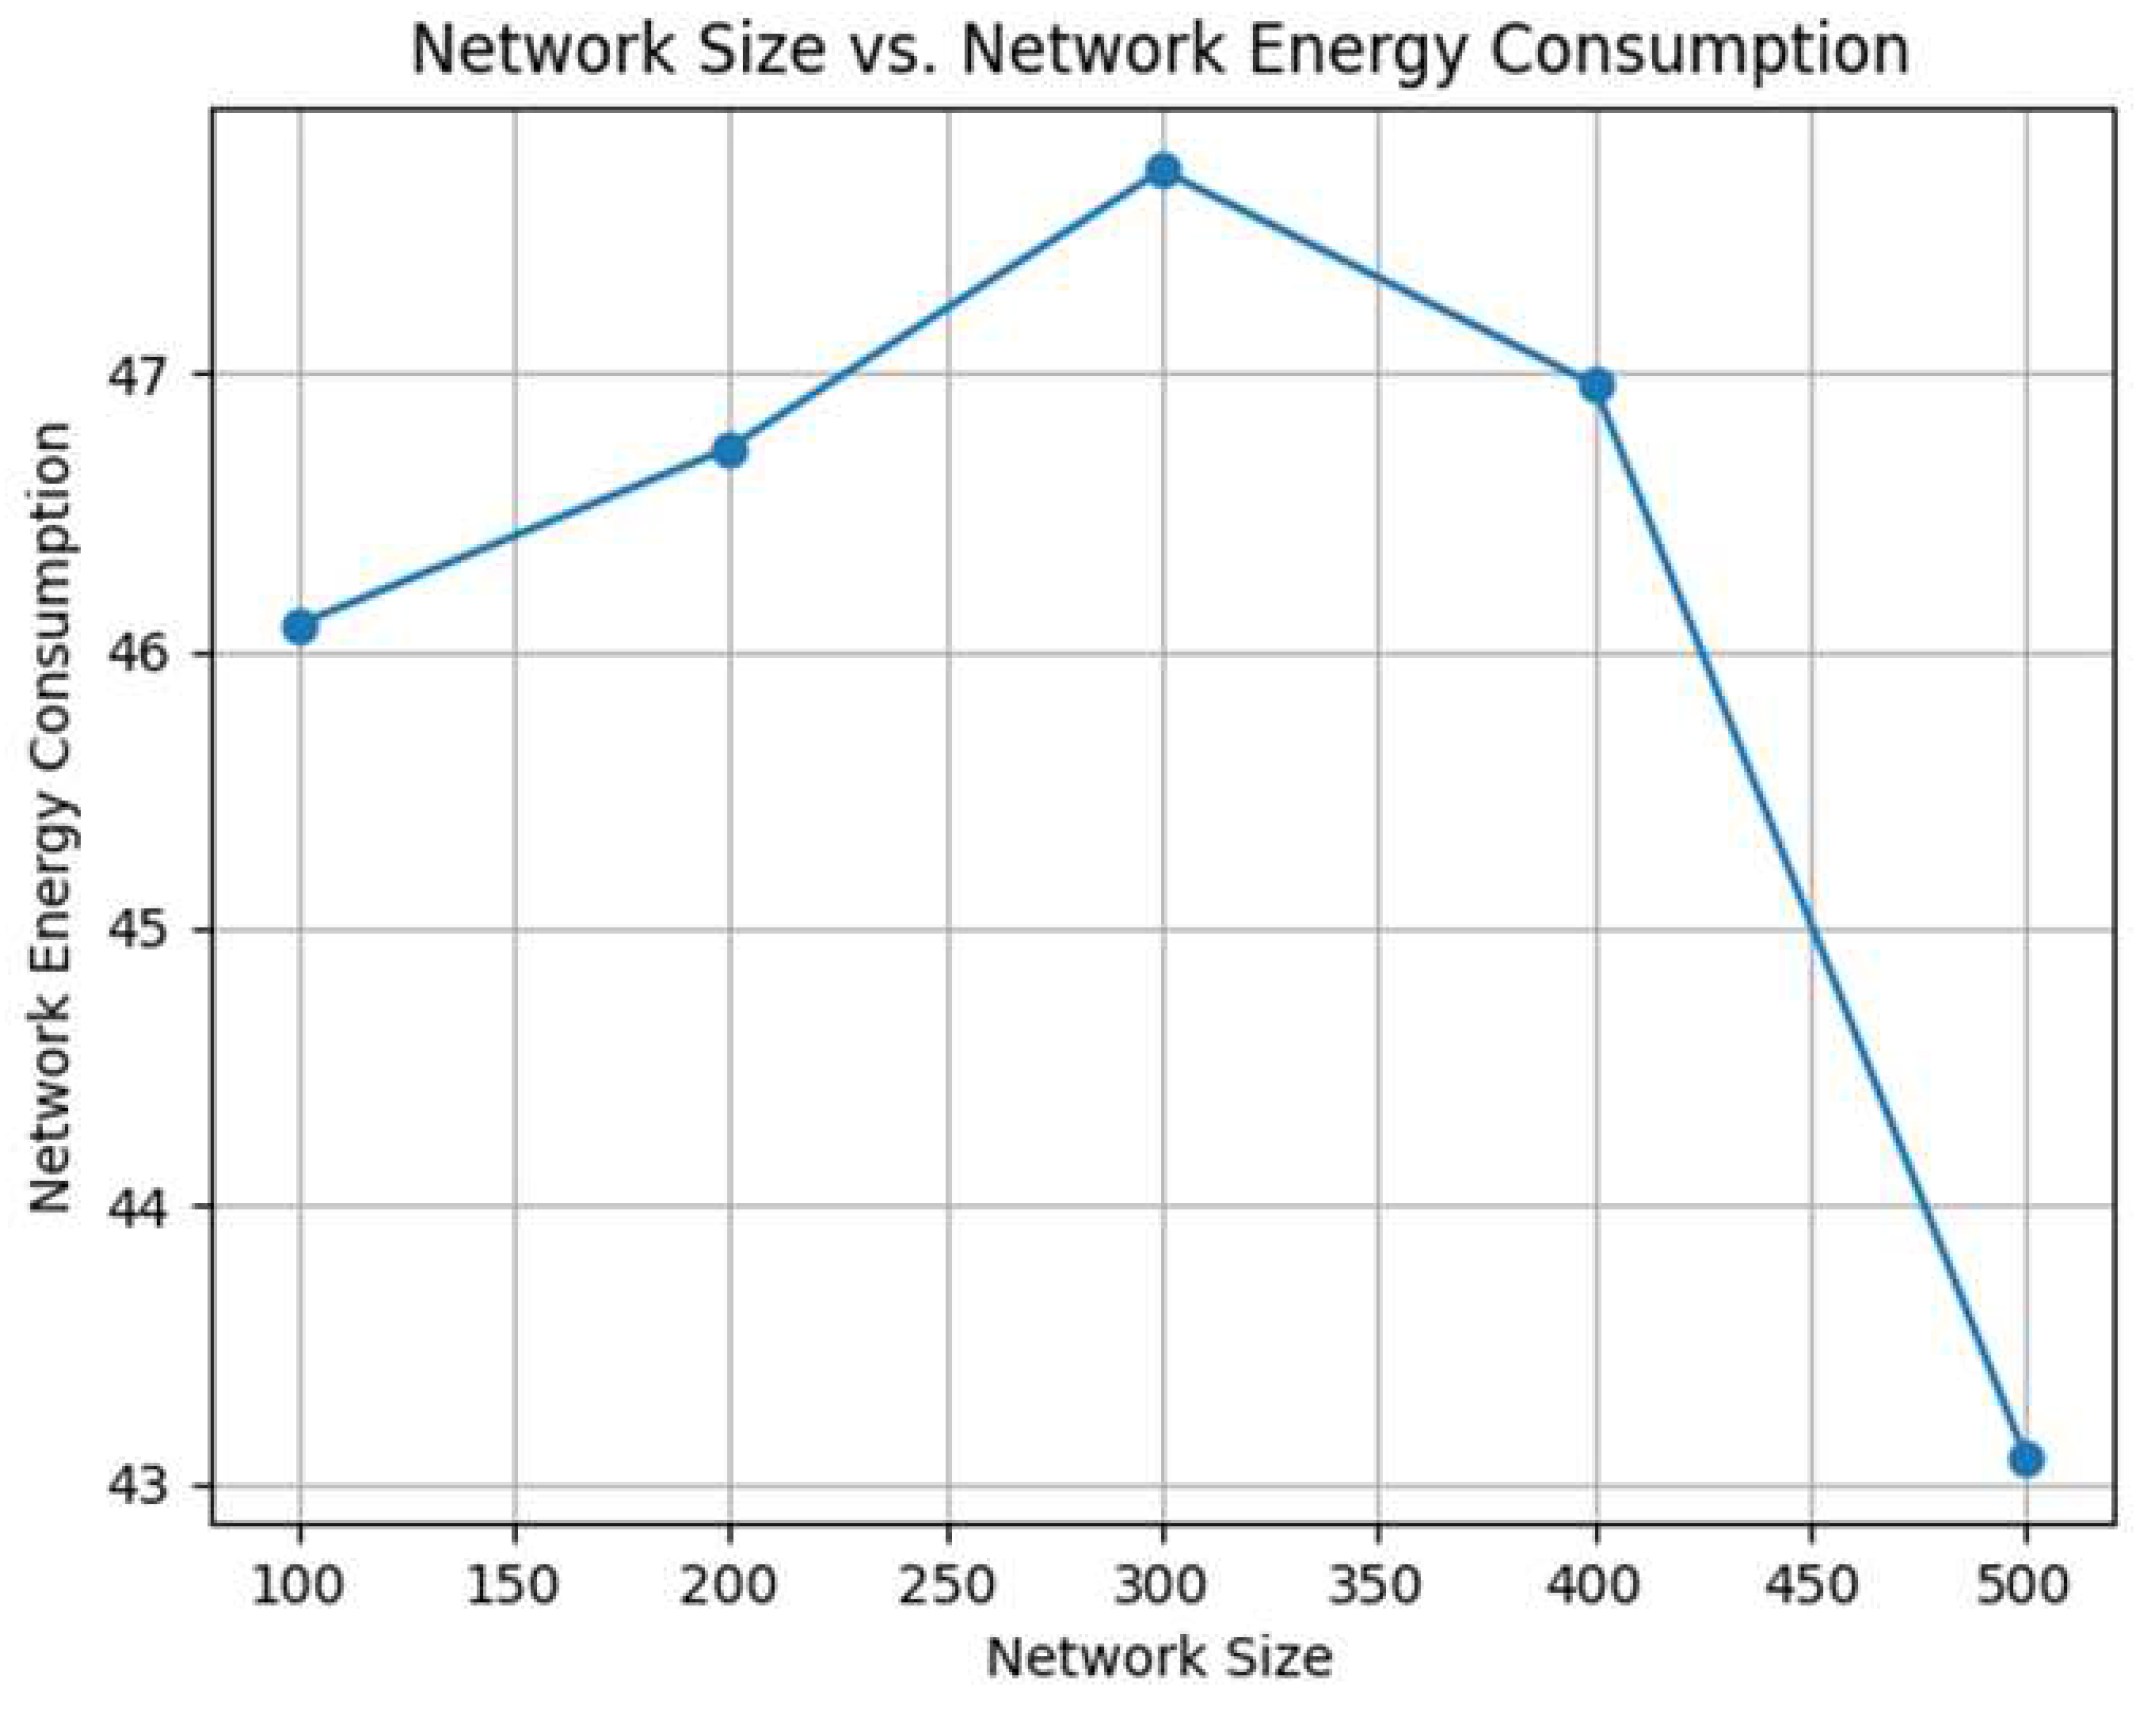
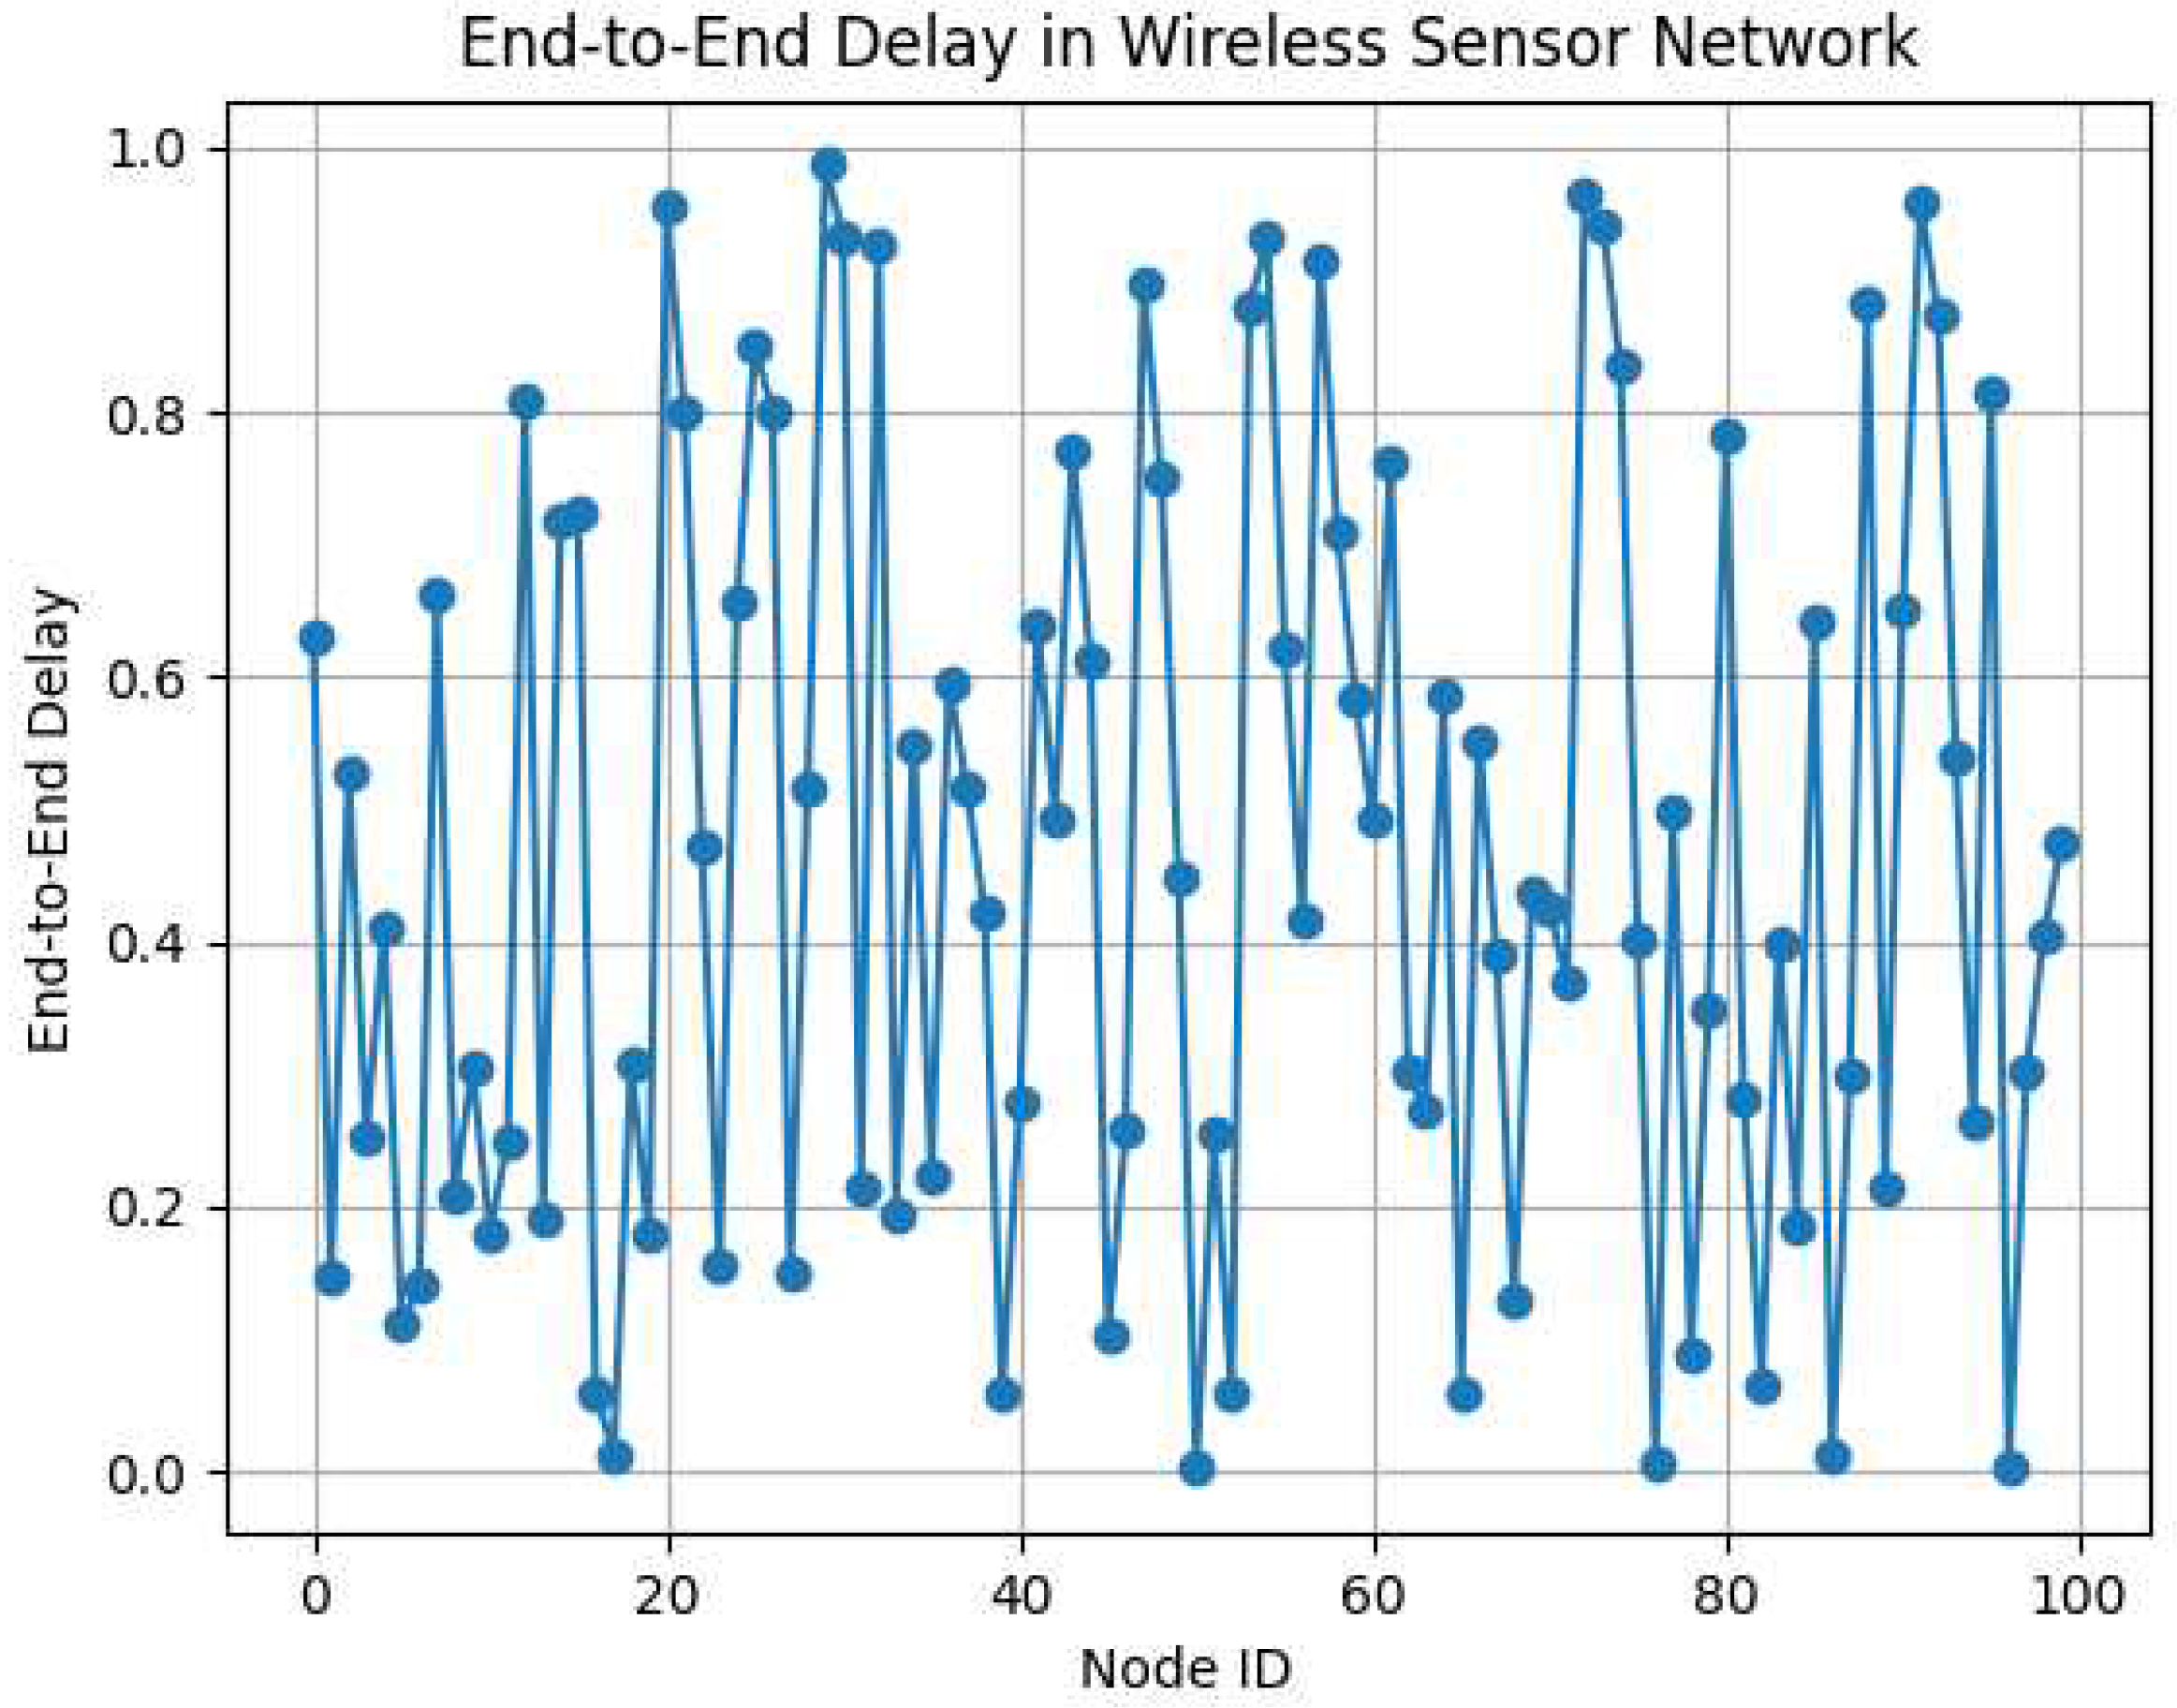
| Parameters | Network Size | Energy Consumption |
|---|---|---|
| 100 | 1450 (10%) | |
| 200 | 3320 (20%) | |
| values | 300 | 6280 (40%) |
| 400 | 16589 (60%) | |
| 500 | 30498 (80%) |
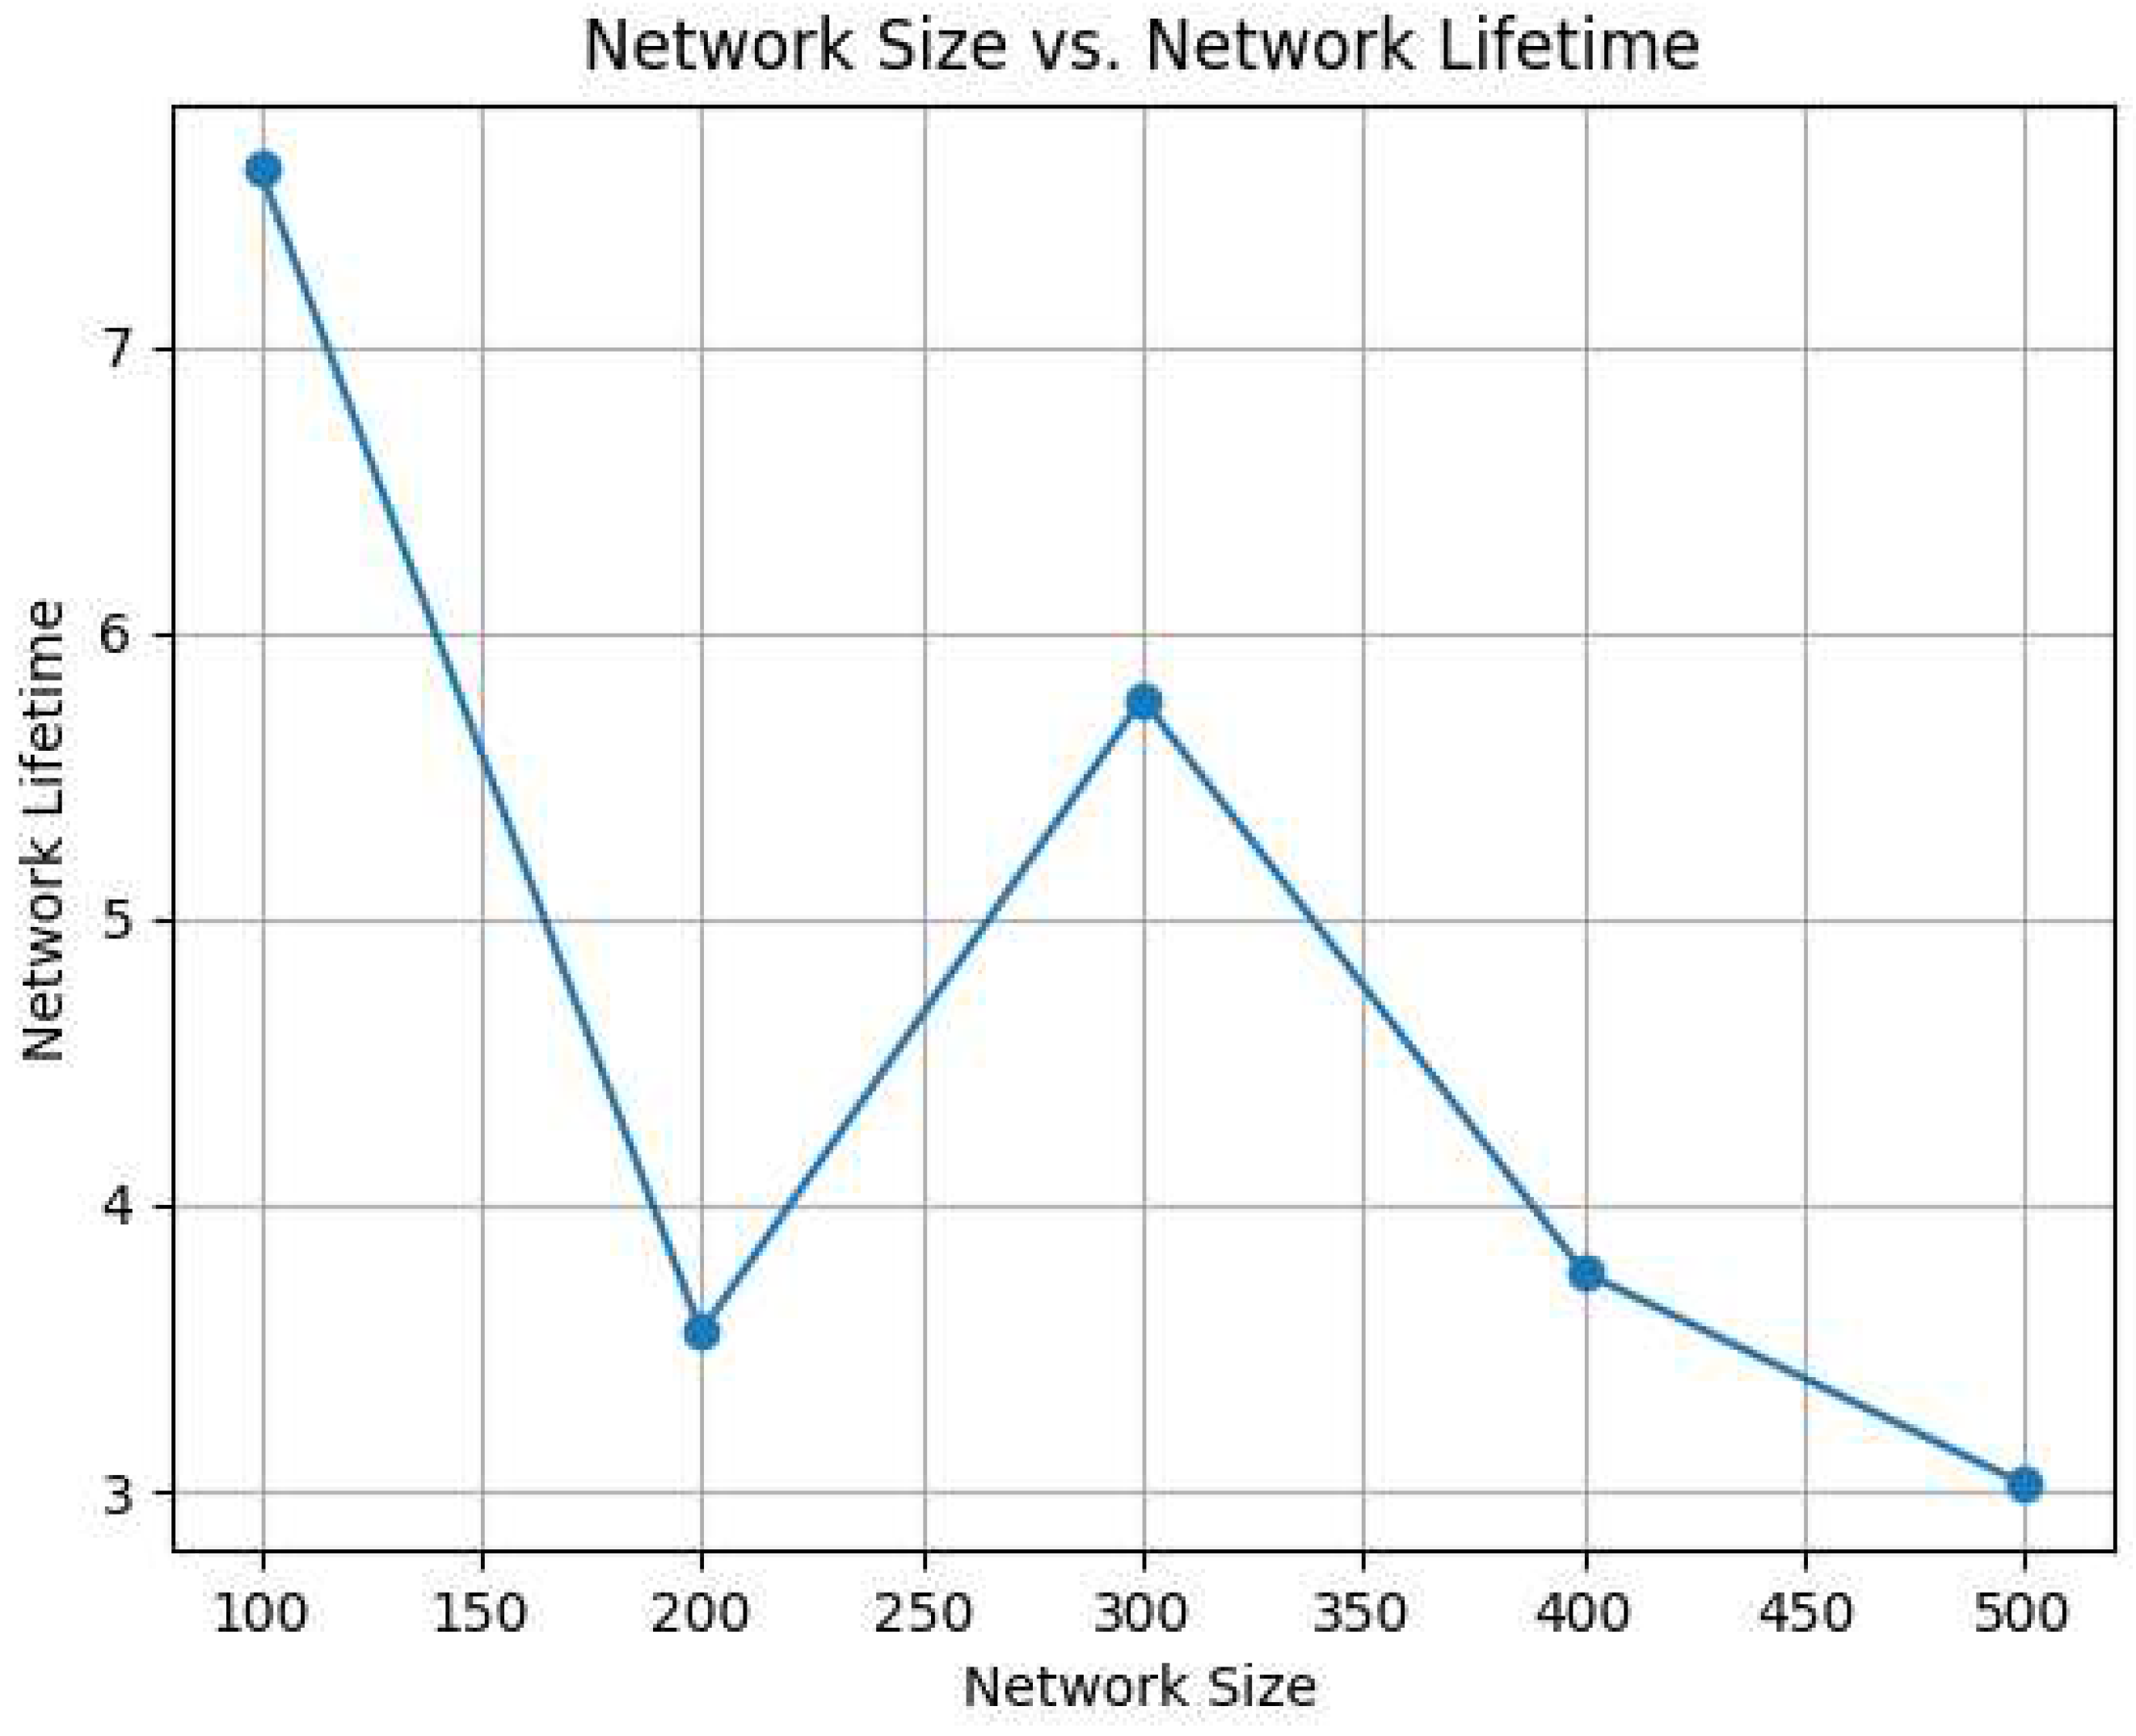
| Parameters | Network Size | Network Lifetime |
|---|---|---|
| 100 | 33502 | |
| 200 | 39548 | |
| values | 300 | 45289 |
| 400 | 52147 | |
| 500 | 59828 |
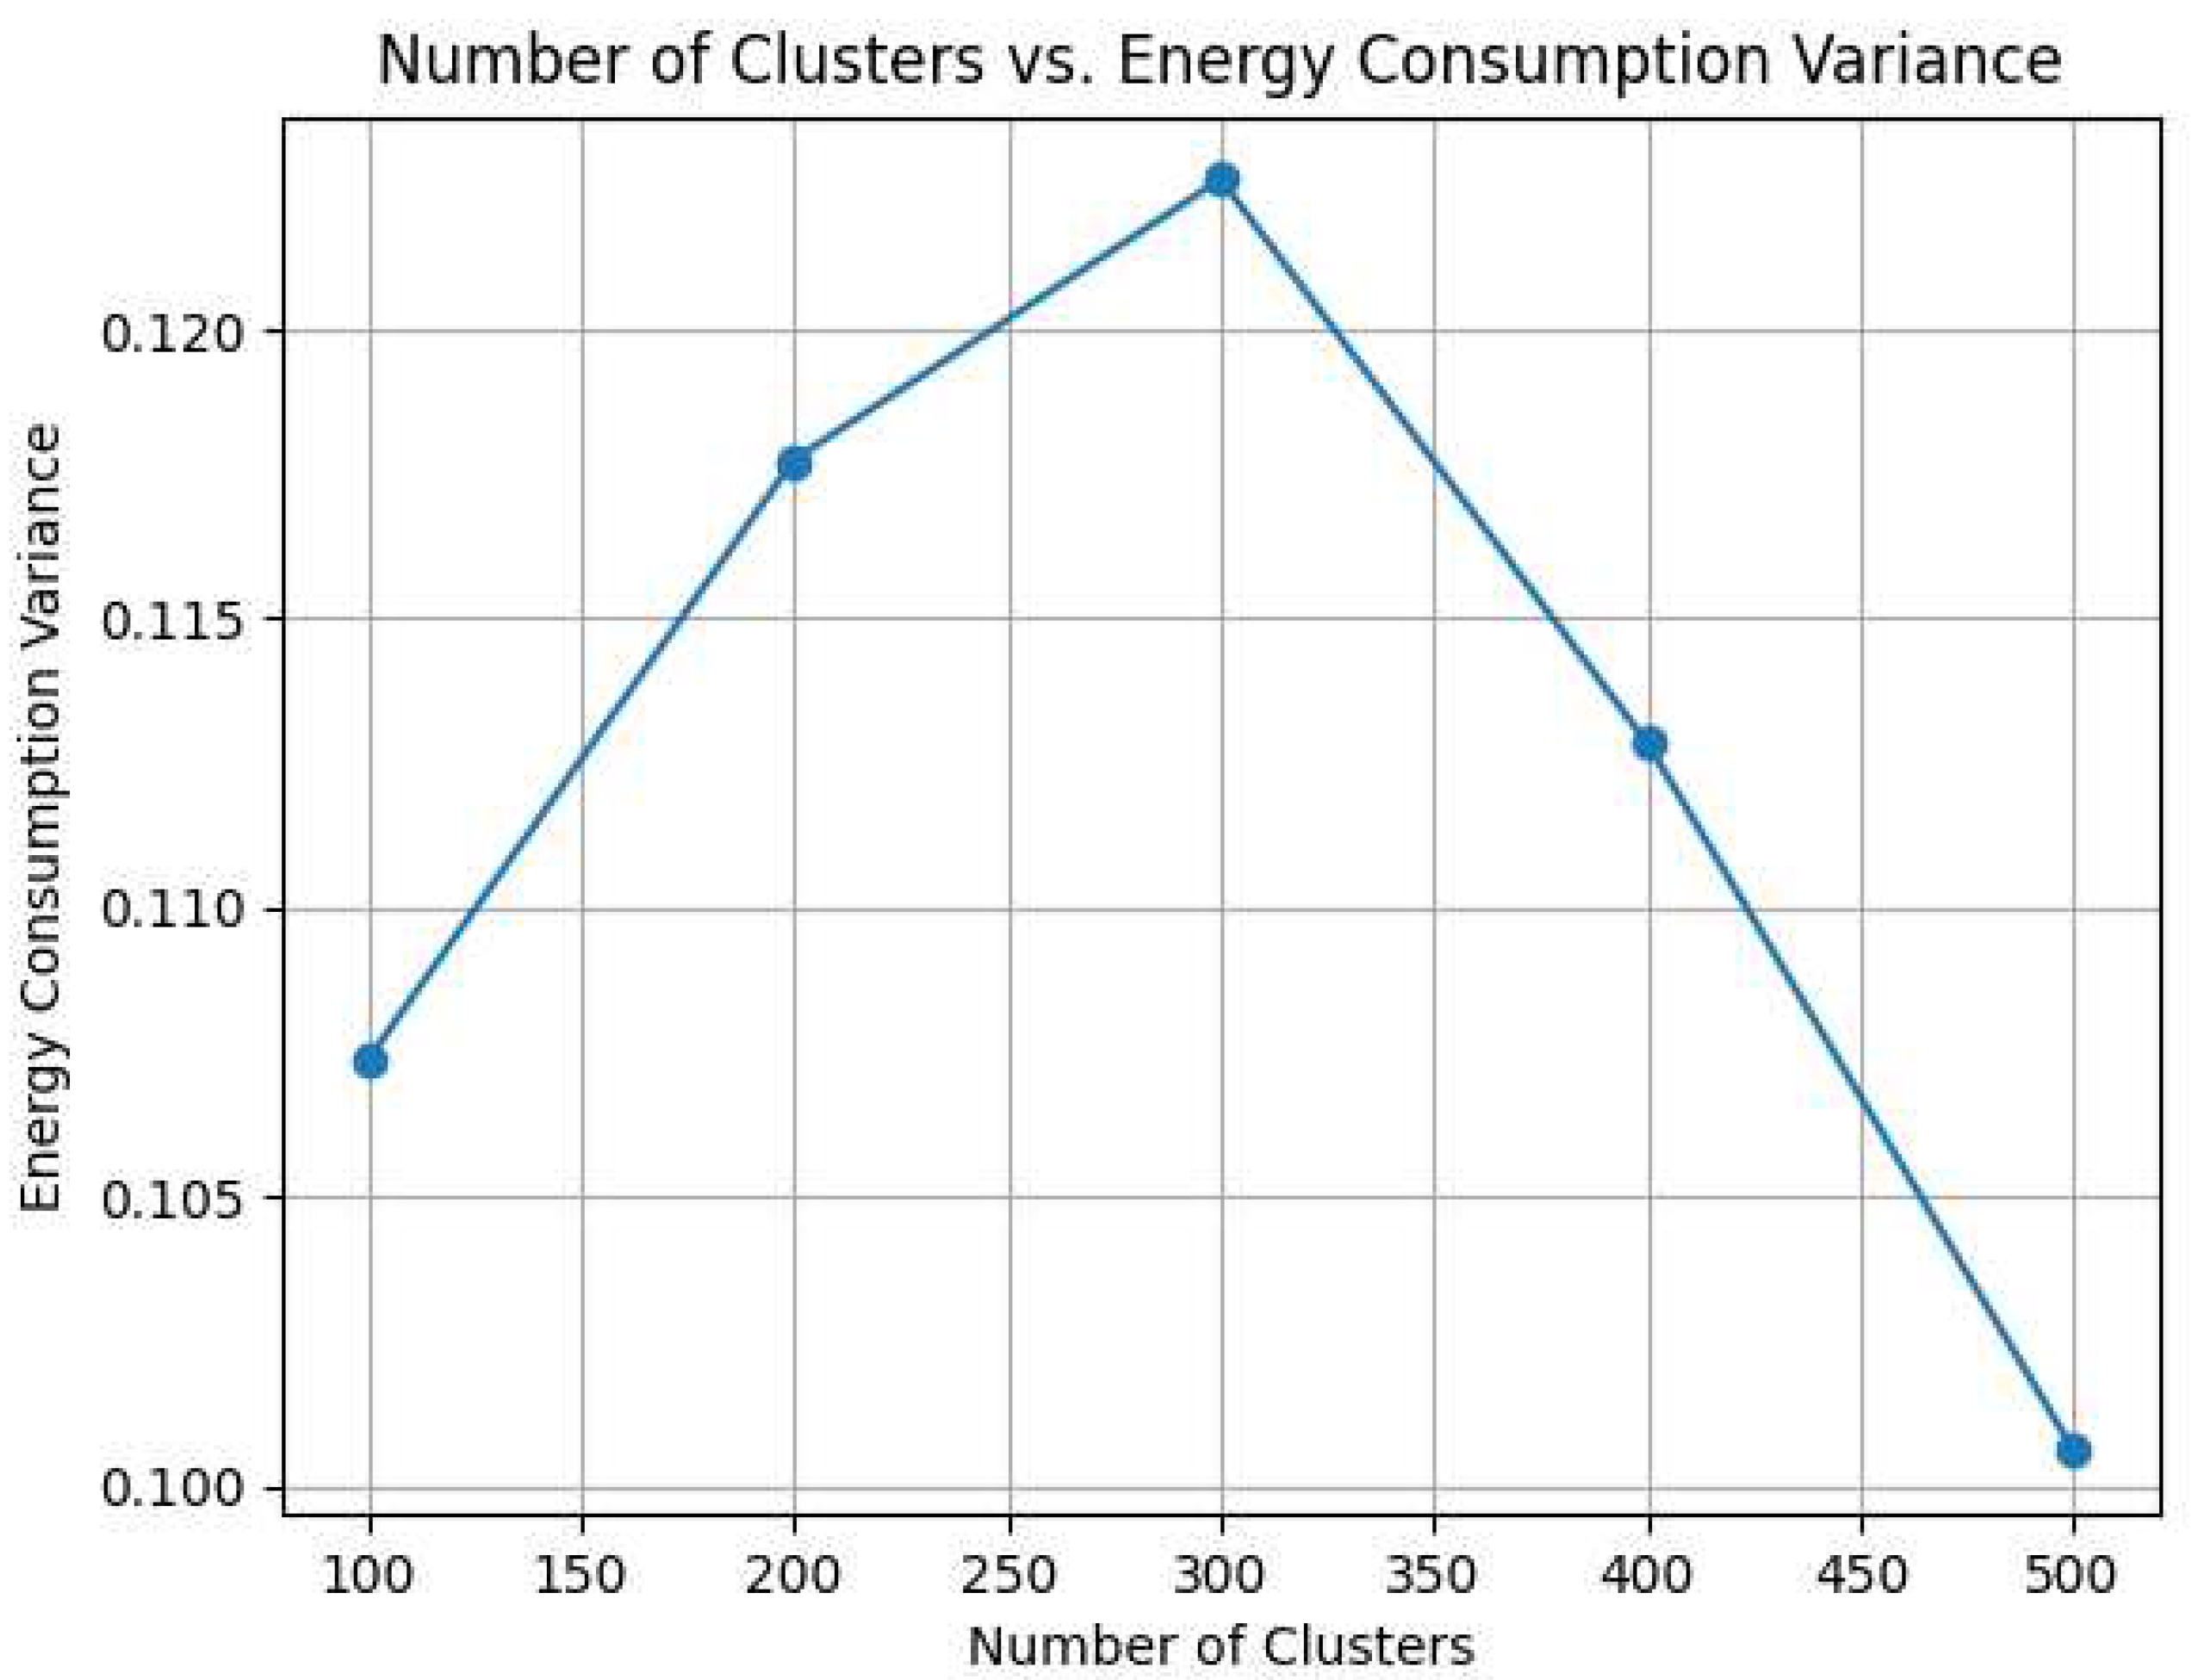
| Parameters | Number of Clusters | Energy Consumption Variance |
|---|---|---|
| 100 | 0.1055 | |
| 200 | 0.1156 | |
| values | 300 | 0.1206 |
| 400 | 0.1105 | |
| 500 | 0.1001 |
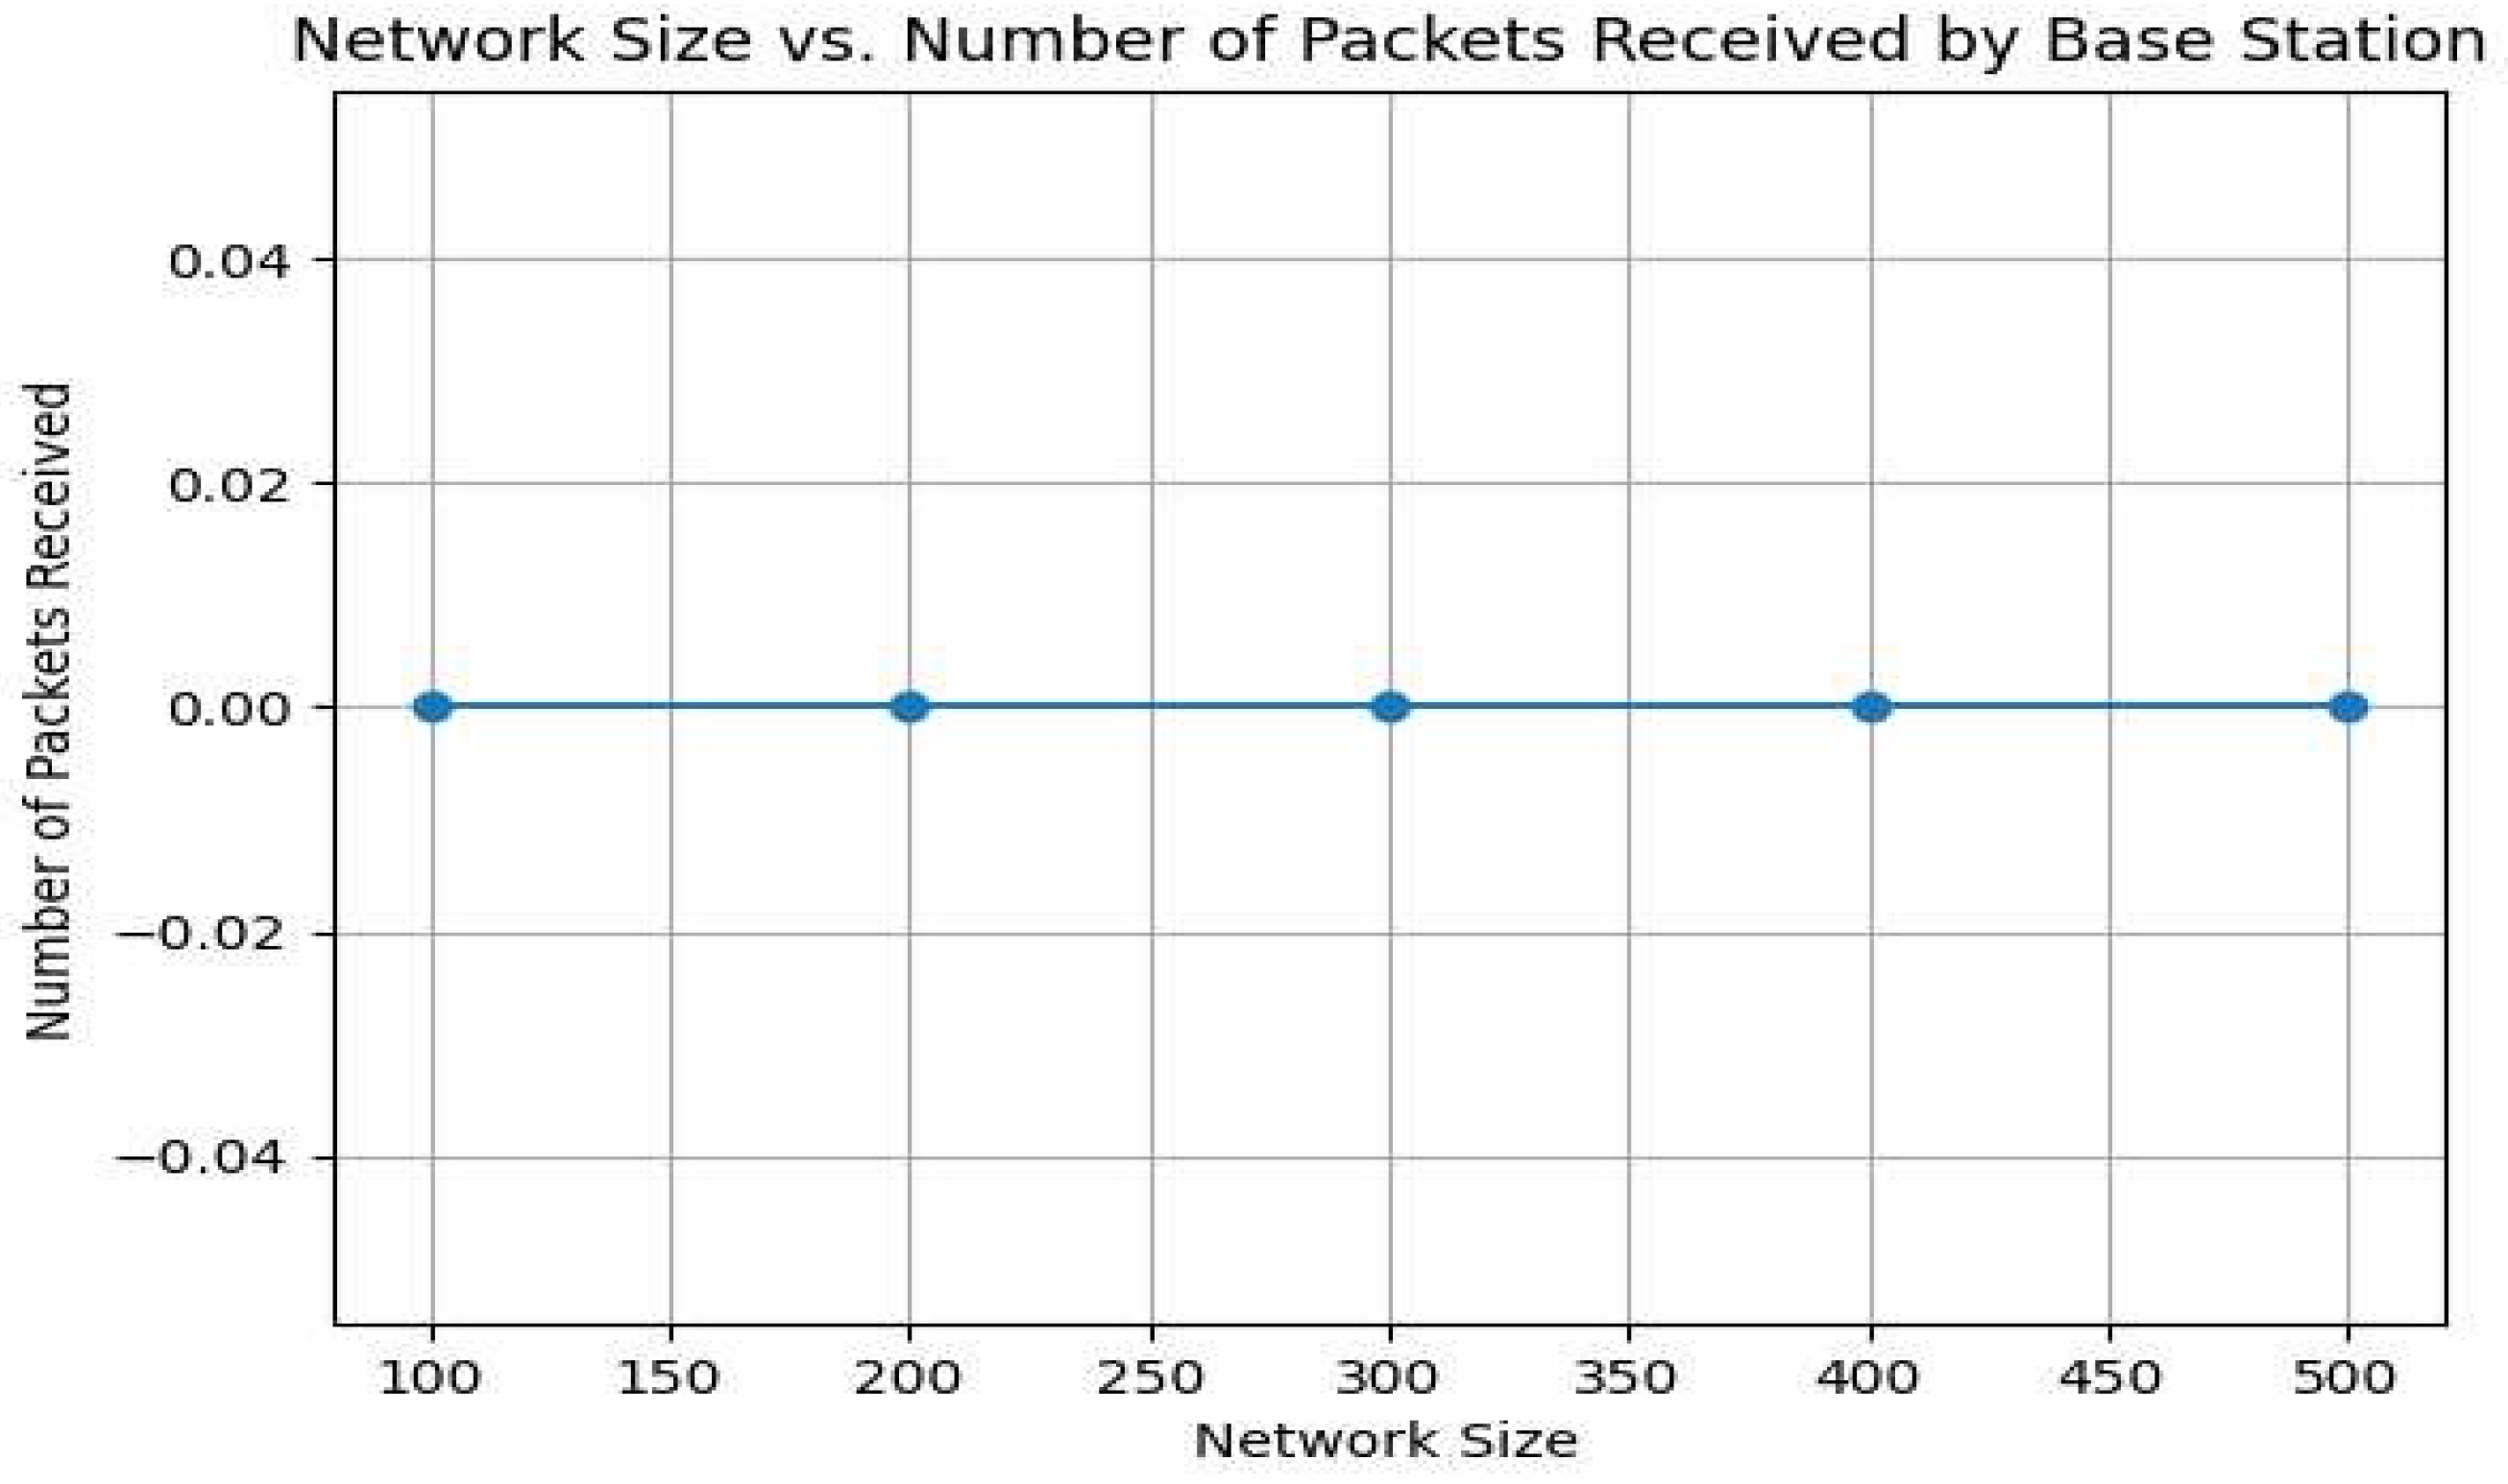
| Parameters | Network Size | Number of Packets Received by BS |
|---|---|---|
| values | 50 | 55322 |
| 100 | 712589 | |
| 150 | 825893 | |
| 200 | 893245 |
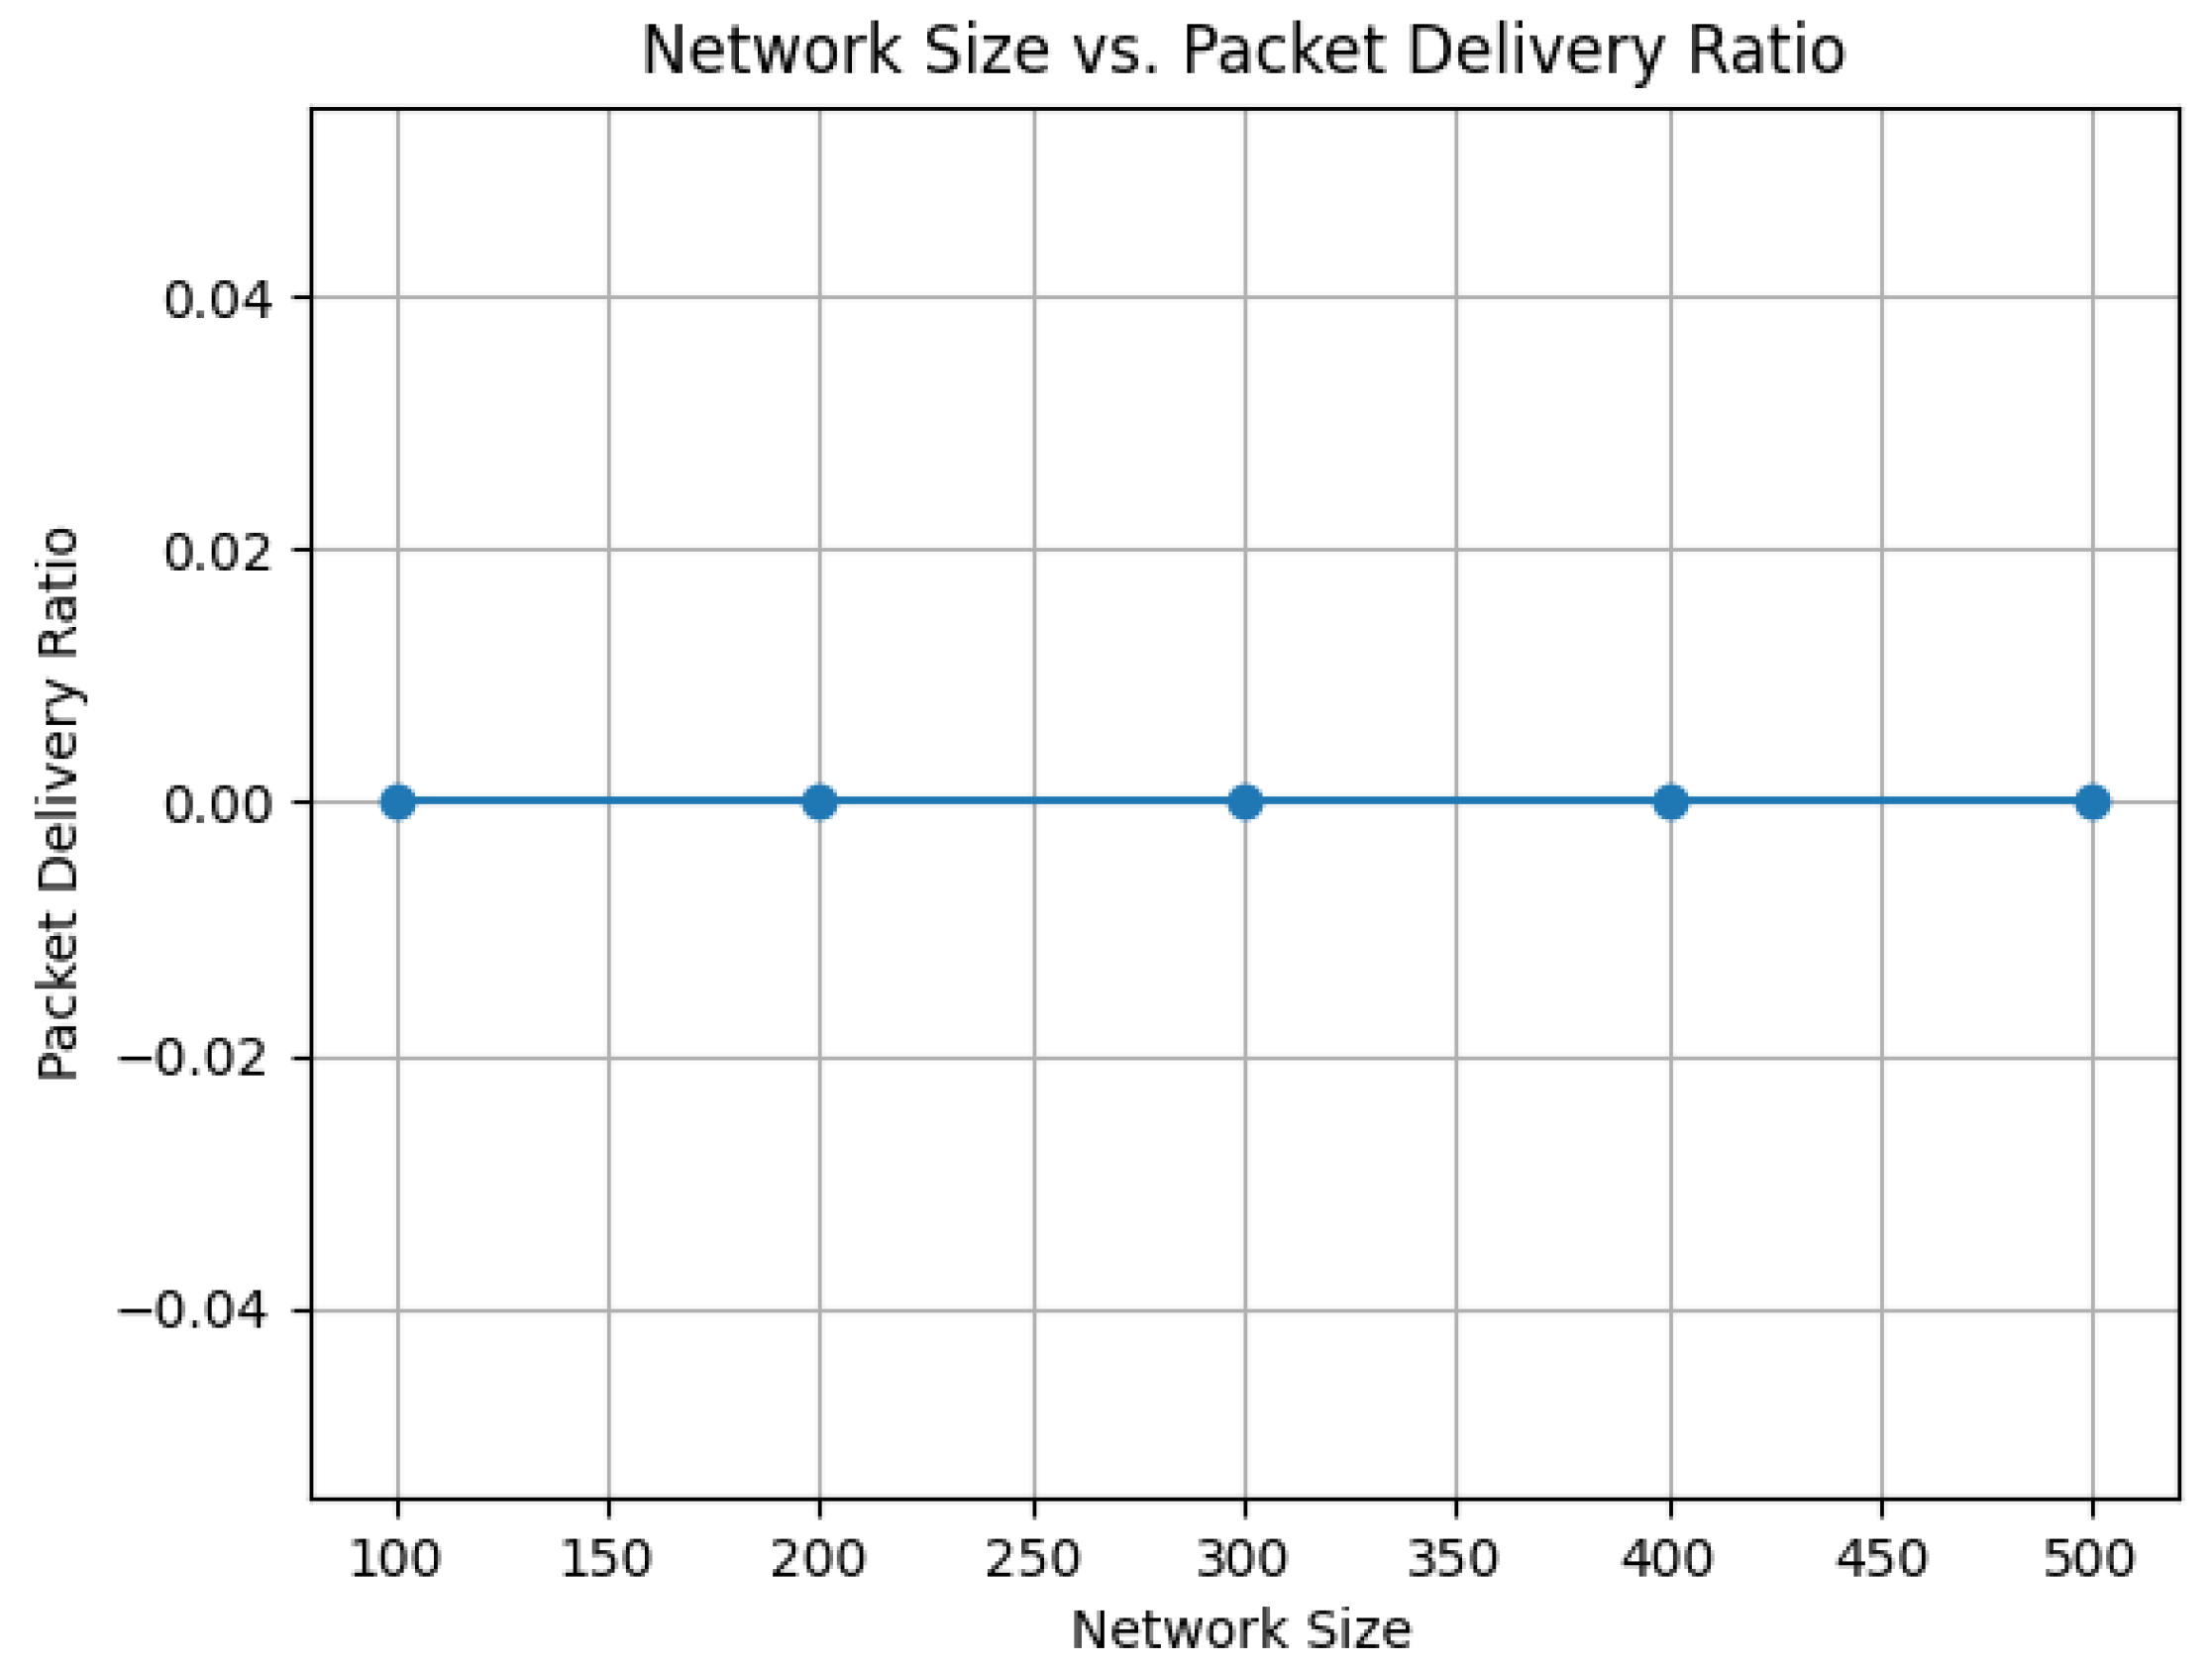
| Parameters | Network Size | Packet Delivery Ratio |
|---|---|---|
| values | 50 | 0.39 |
| 100 | 0.43156 | |
| 100 | 0.472 | |
| 200 | 0.511 |
| Parameters | Network Energy Consumption | Network Lifetime (in rounds) |
Energy Consumption Variance | Number of Packets Received by the (BS) | Packet Delivery Ratio | End-to-End Delay (ms) |
|---|---|---|---|---|---|---|
| LEACH-ANN (Proposed) |
1450 | 33502 | 0.1055 |
712589 |
0.43156 |
12847 |
| TEO-MCRP [32] |
1246 (10%) |
29,964 | ---- | 658,546 | 99.784 | 15.734 |
| PSO-ECSM [32] |
1056 (10%) |
27,631 | ---- | 637,880 | 98.385 | 17.852 |
Disclaimer/Publisher’s Note: The statements, opinions and data contained in all publications are solely those of the individual author(s) and contributor(s) and not of MDPI and/or the editor(s). MDPI and/or the editor(s) disclaim responsibility for any injury to people or property resulting from any ideas, methods, instructions or products referred to in the content. |
© 2023 by the authors. Licensee MDPI, Basel, Switzerland. This article is an open access article distributed under the terms and conditions of the Creative Commons Attribution (CC BY) license (http://creativecommons.org/licenses/by/4.0/).


