1. Introduction
For visually impaired people (VIP), Braille and its production techniques and equipment allow a blind or low-vision person to have access to texts and descriptions. However, the difficulty of translating the information that an image can contain narrows the portal for these people to access the areas of science, technology, engineering, and mathematics (STEM), expanding learning problems from the lowest age groups [
1].
A good identification rate requires training and accurate descriptions and context of use, as well as consideration of cognitive obstacles such as familiarity, memory and shape complexity [
2,
3,
4,
5,
6,
7,
8].
Due to the involved costs, the most used ways of producing tactile images are handcrafted ones through several different materials. It is a slow production with laborious reproduction [
9].
On the other hand, additive manufacturing is characterized by the immediate and easy production from a three-dimensional model of the desired object, which can be modified and customized for different demands without the need to manufacture new production apparatus. Furthermore, it can operate in diverse environments without the need for reserved spaces and generate an entire product in a unique step [
10,
11,
12].
With these characteristics and a constant price drop in recent years [
13] that led 3D printers to cost up to a tenth of the price of a Braille printer, additive manufacturing can be used as a production process for small runs to quickly meet the needs of specific groups [
14].
Thus, 3D printing can alleviate the problem of understanding the images facilitating learning by delivering tactile objects whose original files can be acquired and shared worldwide for free. And indeed, this happens. Several of these objects intended to help visually impaired people can be found on 3D printing file-sharing websites.
However, if the manufacturing characteristics influence the tactile image perception, which of these features can provide the best understanding of the information?
Seeking an answer to this question and to understand which of these variations are best suited to the 3D printed tactile image user perception, this study presented to visually impaired people tactile images with variations in printing characteristics: (1) contour lines height and (2) width, and (3) texture density. Their insights are presented in the next sections.
2. Methodology
This is an observational, transversal, exploratory, and randomized study to understand the influence of dimensional configurations on 3D printed tactile image perception.
The printing characteristics were evaluated in daily life skills-inspired activities of visually impaired people. The experimental procedures of the study were developed respecting the guidelines of the 466/12 Resolution of the National Health Council of Brazil. The experiments were applied within institutions that support VIP with their frequenters. Due to the SARS-CoV-2 pandemic, during the visits, all applicators wore PFF2-type masks and 70% alcohol for disinfecting the parts used in the tests.
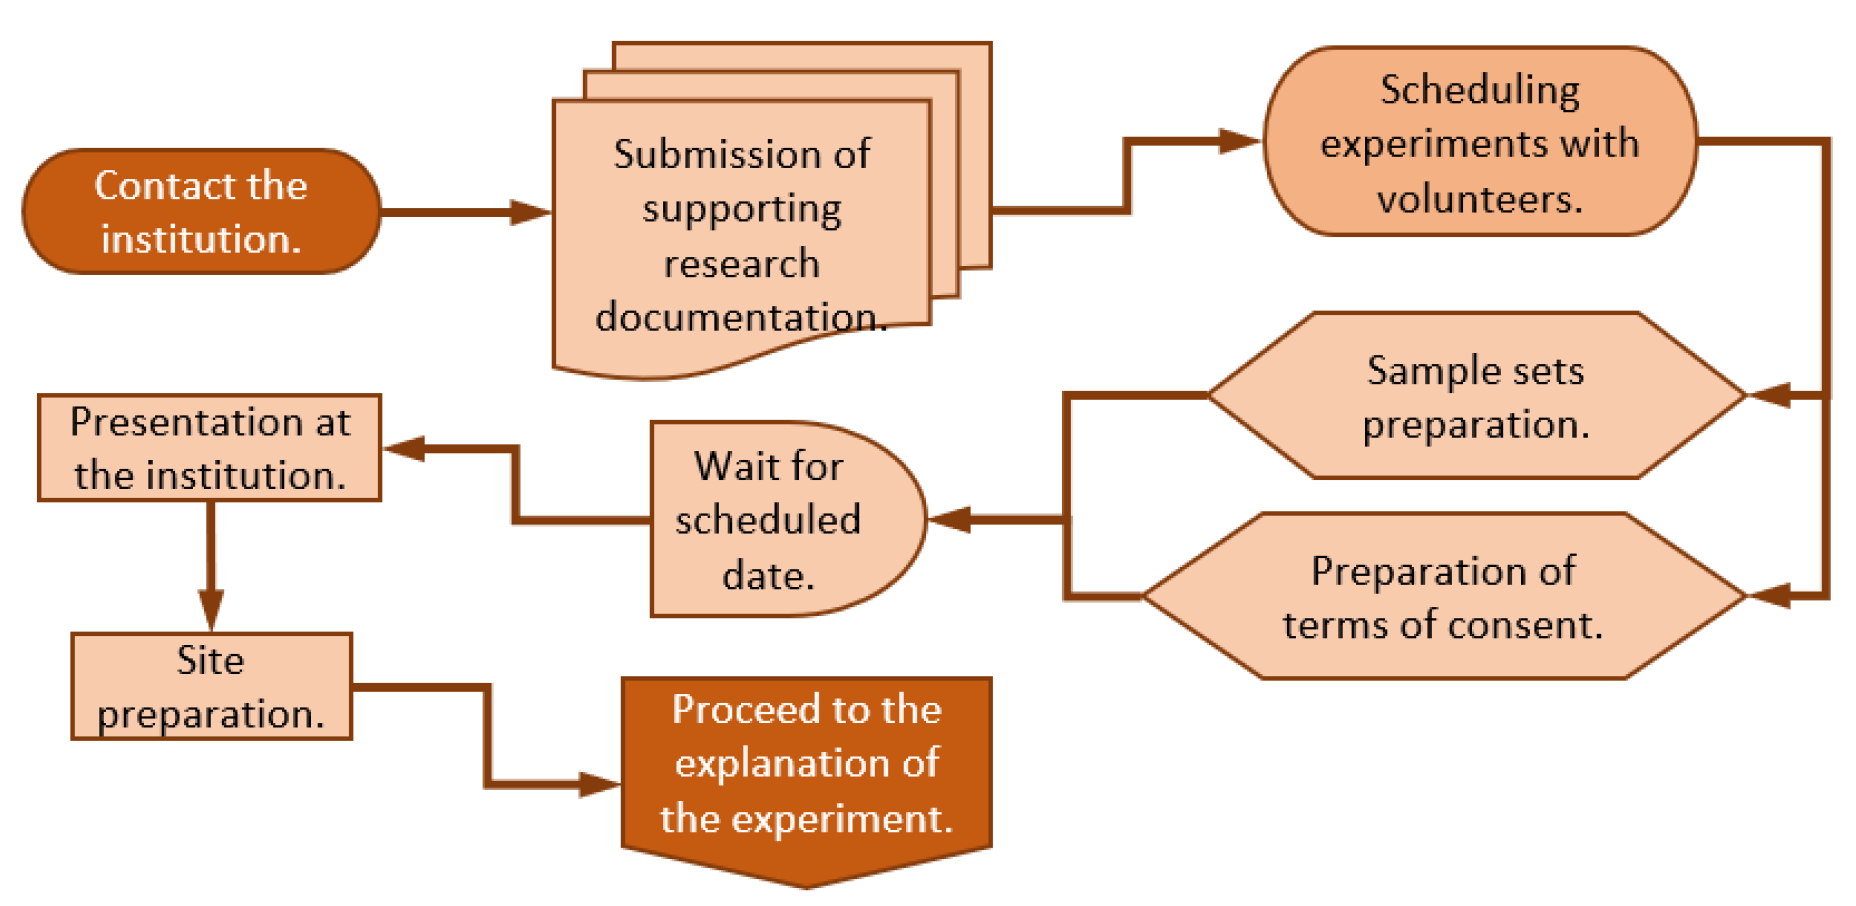
The indicated participants were referred by the institution to the appointed place. Once accommodated, they were presented to the procedures and their objectives, risks, and benefits.
To reduce the risk of psychological pressure, this initial conversation included (1) the nonexistence of a “correct answer” to be found, after all, the experiment was a search for the best configuration for the image printing; (2) the possibility of withdrawing without any cost at any time. Two other measures were added: (a) a maximum time to perform each task (after two minutes, they were invited to experiment a new sample); and (b) the possibility of new conversations aiming to calm down and prevent frustrations if the volunteer was nervous or anxious (
Figure 1).
2.1. Target Audience
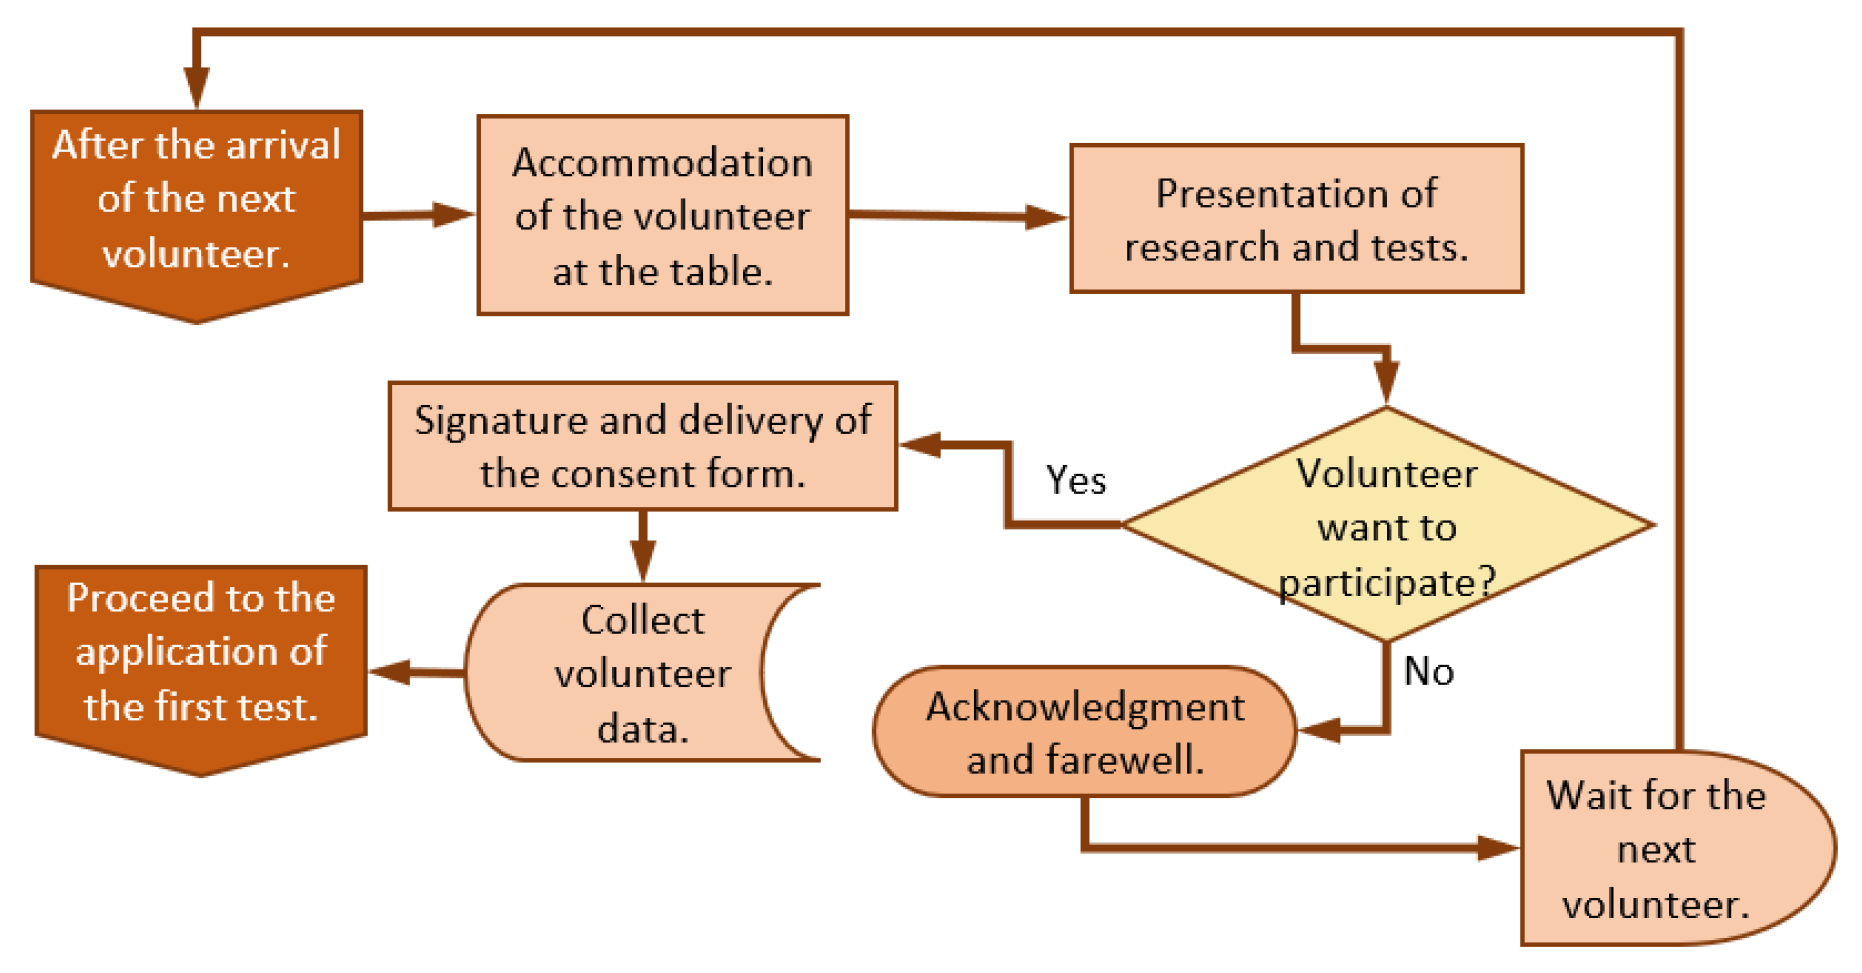
Participants sought for testing were restricted to individuals over eighteen years old; with complete or partial visual impairment; without hearing, speech, or cognitive impairment; who were students, professionals and/or frequenters of entities that support and teach VIP, and were visiting or during a break from working hours; and those who accepted, with free will and consent, to volunteer for the experiments presented in the previous explanation (
Figure 2).
In case of low vision, a rigid apparatus was placed between the participant’s eyes and the objects to be analyzed to avoid the element observation.
2.2. Test Methodology
According to Mazella, Albaret and Picard [
7], the perception and understanding of tactile elements are dependent on the user’s skills. The authors indicate (1) scanning (ability to explore, detect elements and follow lines without loss of contact), (2) tactile discrimination (ability to match shapes and textures), (3) spatial comprehension (figure positioning and orientation), (4) short-term memorization (retention of information), and (5) image comprehension (the component and its semantic element identification). These elements inspired the experiment set with users.
Four experiments were developed. The first one analyzed the print characteristics performance in the scanning ability; the second one investigated the texture perception in the tactile discrimination ability; the third one collected print characteristics data using spatial and (fourth test) image comprehension skills.
All elements were printed using PLA polymer filament. The slicer software was the PrusaSlicer 2.3.1 and the printer, Prusa MK3S with a table heated to 70 °C. The printer extrusion multiplier and linearity compensation were calibrated for greater accuracy of the deposited filament width, and for the deposition homogeneity. The printing was conducted on 180 g/m² sulphite paper, material chosen for its good adhesion combined with low wrinkling and absence of any tactile texture [
15].
The image contours were printed using the heights of 0.1 mm, 0.2 mm, 0.3 mm, and 0.4 mm, combined with the widths of 0.8 mm and 1.2 mm, following measurements of Barros et al. experiment [
15]. Larger and smaller dimensions for heights (0.5 mm to 1 mm) and widths (0.45 mm and 1.6 mm) did not show good adhesion to the paper [
15].
Due to the sulphite paper thickness, every content was printed over an initial height offset (z offset) of 0.2 mm. Also in the slicer software, the Elephant Foot Compensation parameter value was changed to zero to avoid a reduction in the width printed on the first layer.
2.2.1. Scanning
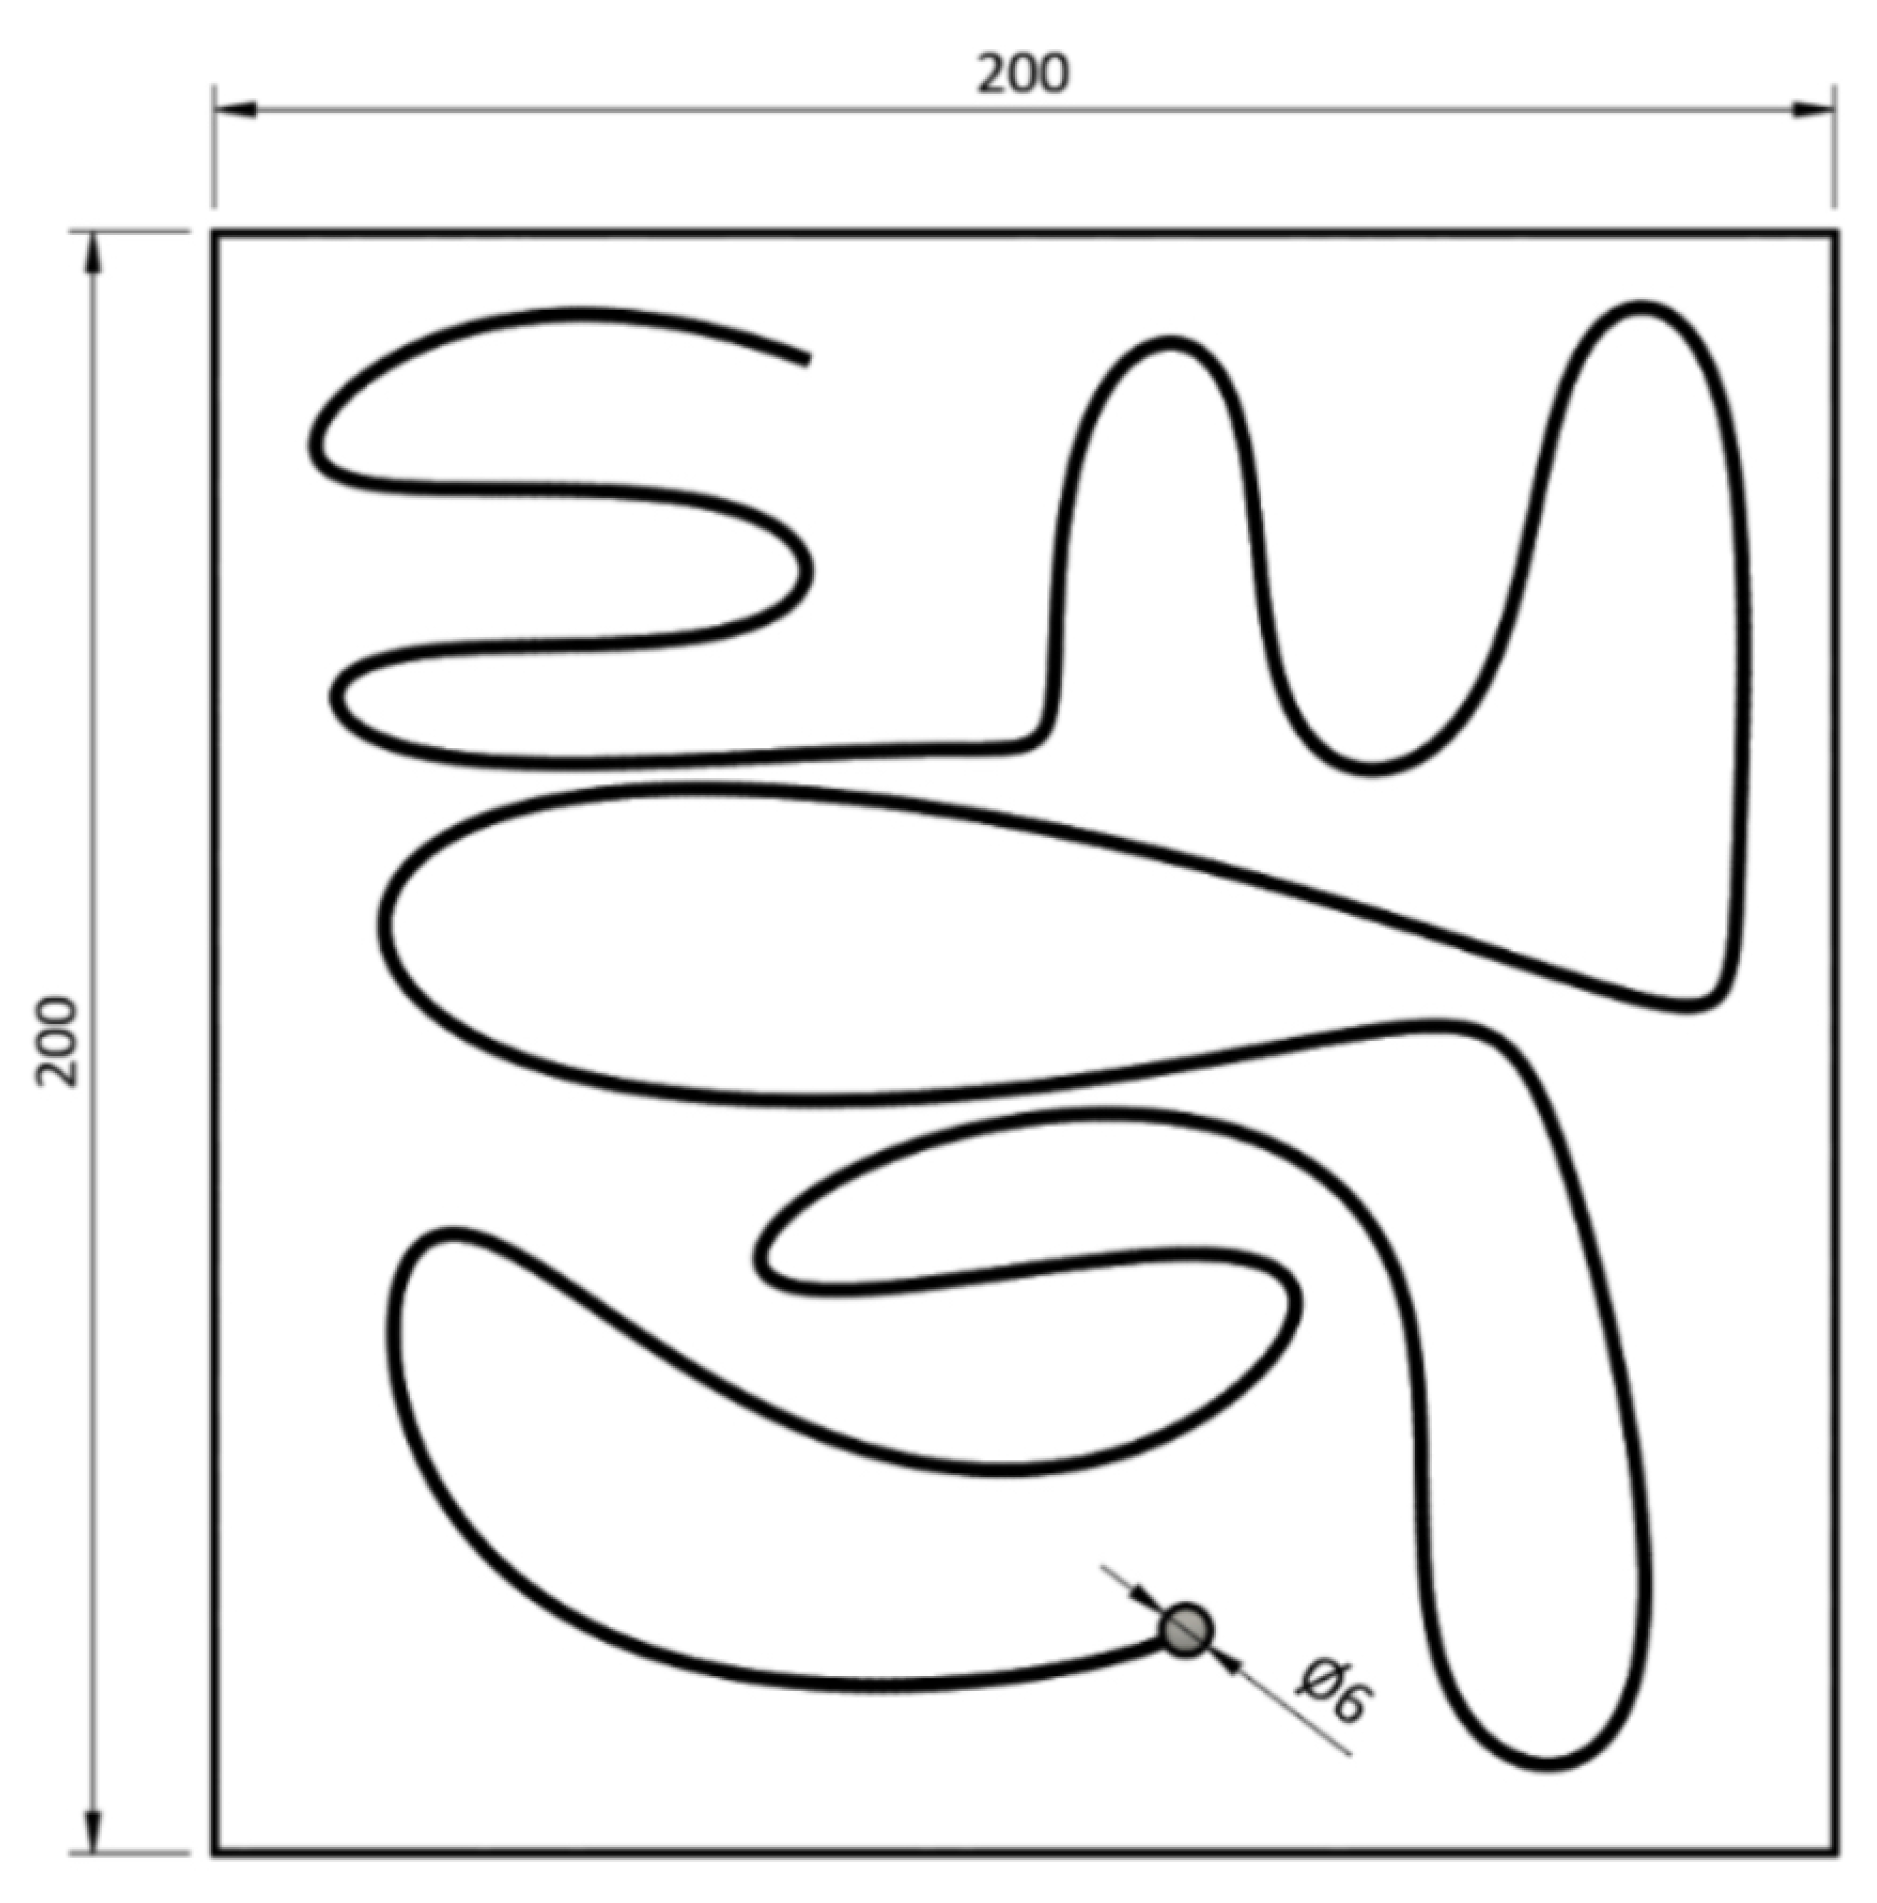
For the first test, a 6 mm diameter hemisphere was printed on a square sheet of paper with a side of 200 mm. Starting from the hemisphere, a line to be followed by the participant runs through the paper, describing a series of random curves until a final location (
Figure 3). This line was produced with the combinations of the four heights and the two widths totaling eight elements for experimentation.
To apply the test with the eight possible dimension variations, the order of samples was previously randomized for each participant. To make it difficult to memorize the path, another parameter was included and randomized: the angle at which the volunteer received the paper. By varying the rotation in multiples of 90°, there was a variation in the hemisphere position and in the path orientation. For the effectiveness of this feature, randomization had a rule to prevent equal angles to be presented in immediate sequence.
At the time of handing over the paper, the tester was requested to find the hemisphere. When found, he was asked to follow the line from the hemisphere along its entire length without losing contact with it. Both the time for the hemisphere location and for the course completeness were recorded. The process was repeated for the eight sizing variations.
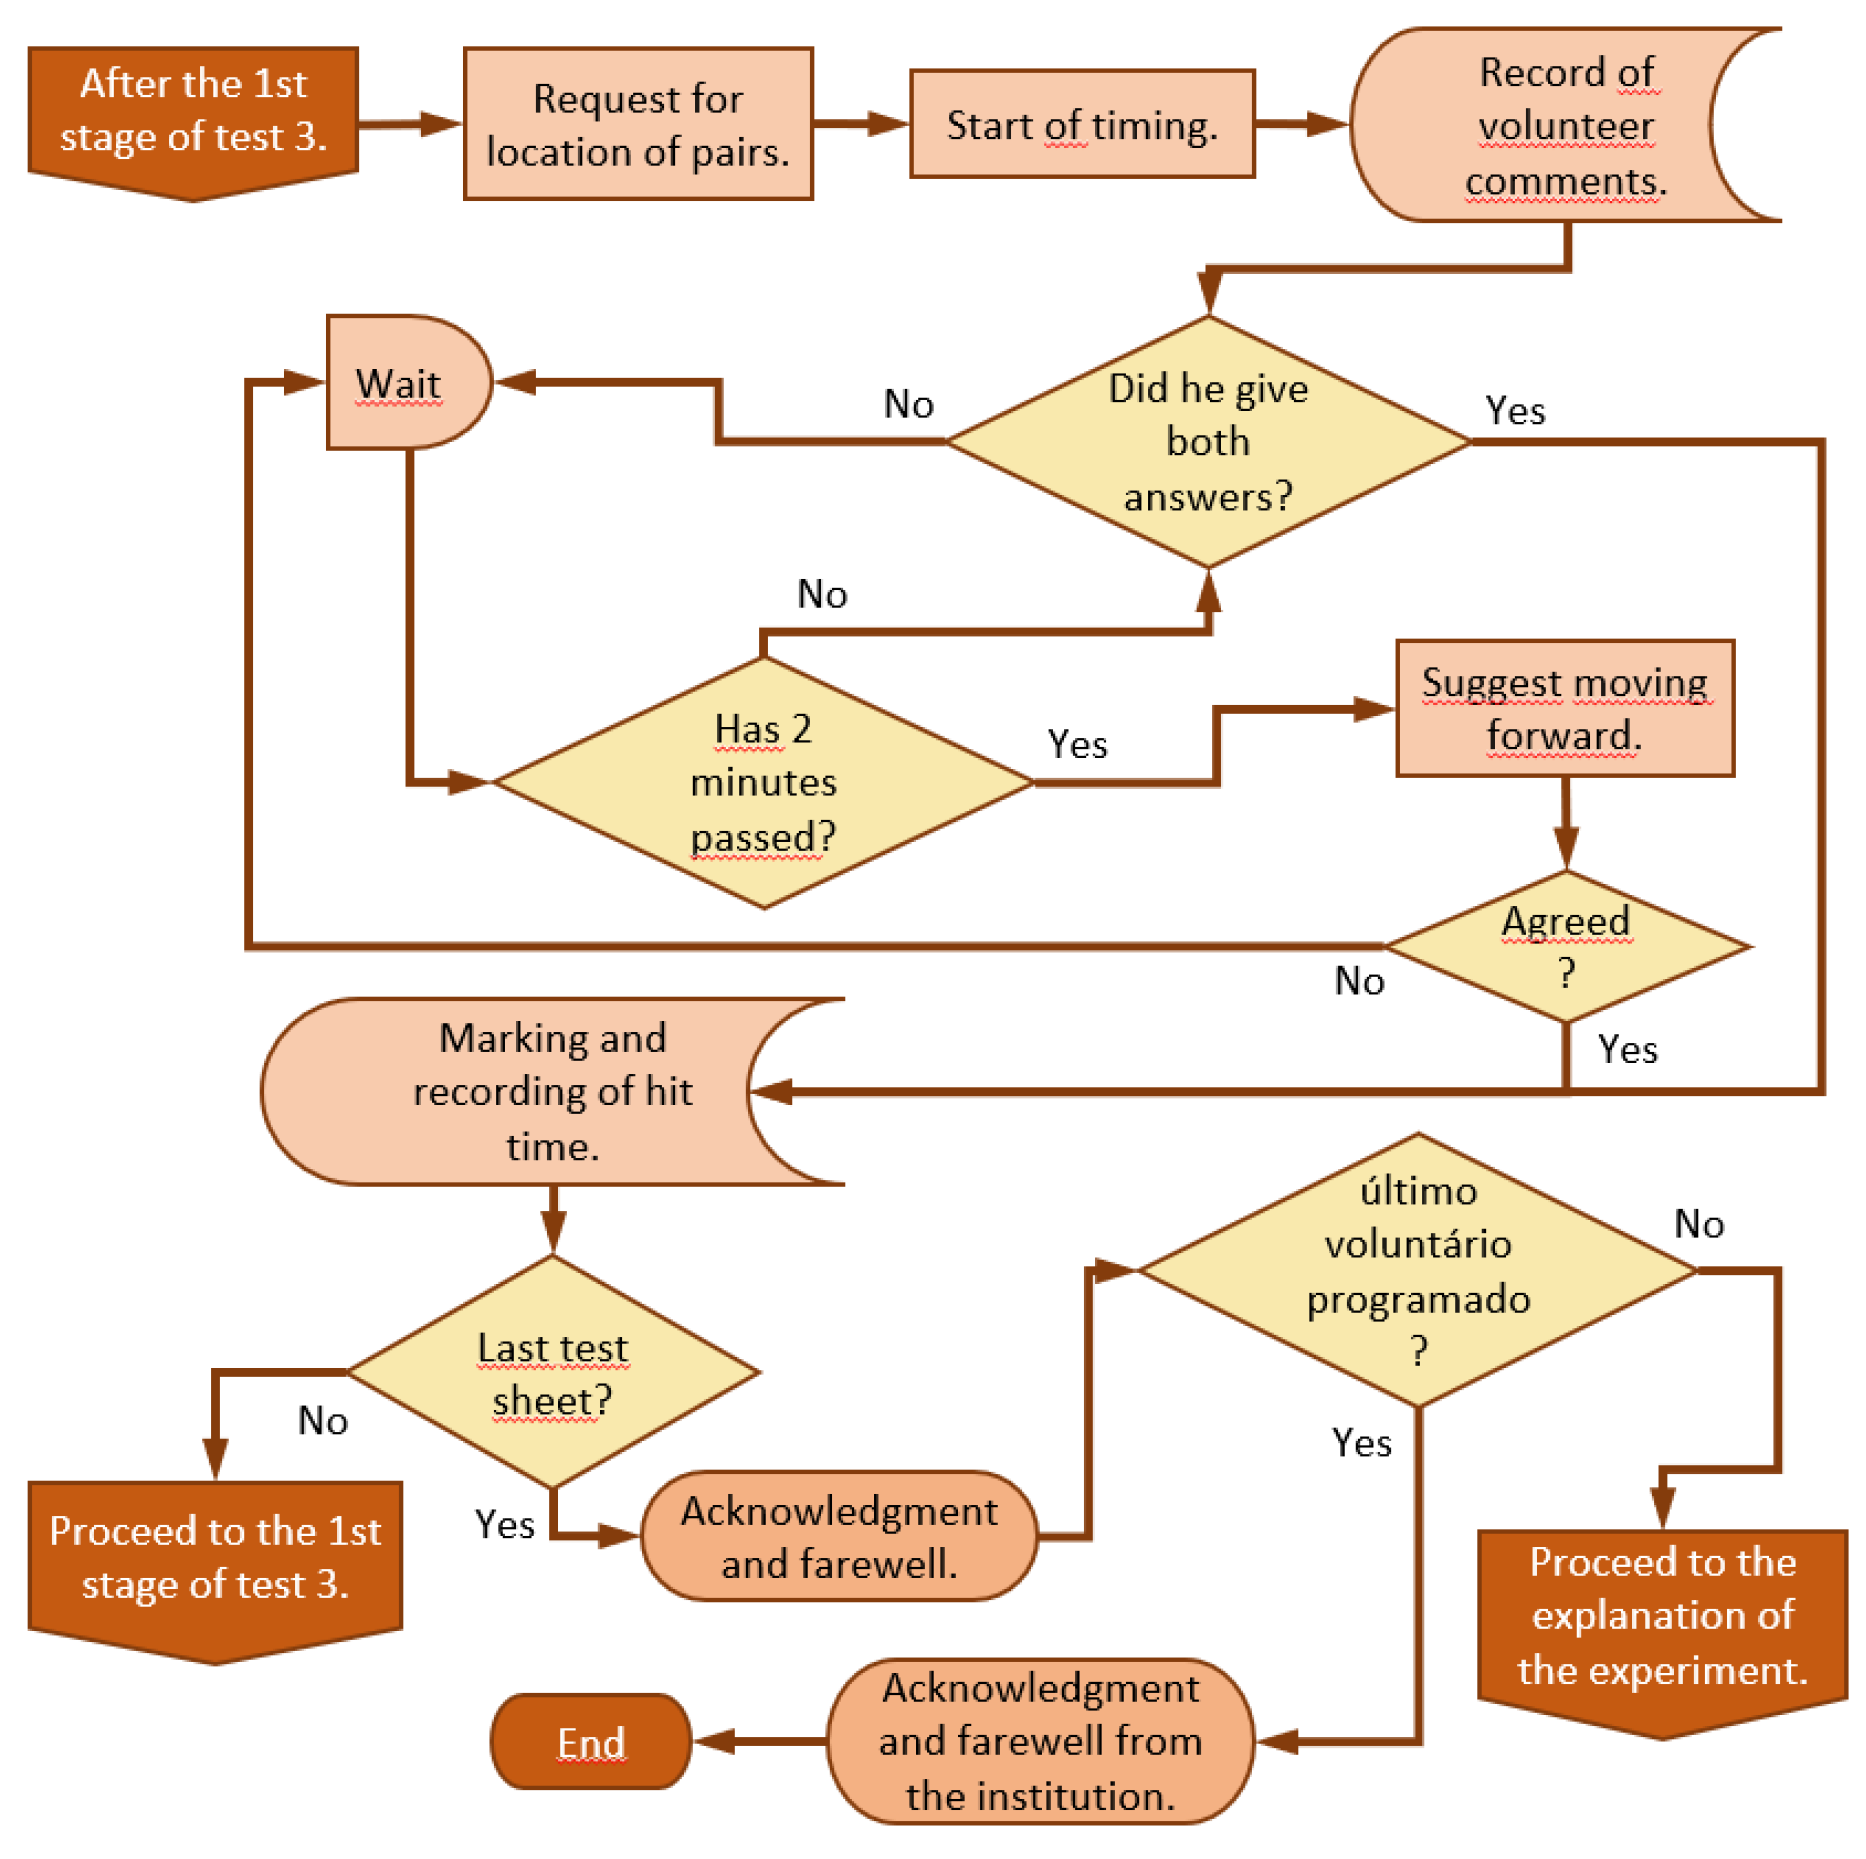
Figure 4 summarizes the steps of these procedures in a flowchart.
2.2.2. Tactile Discrimination
Using the discrimination ability, the second test sought to identify the limit of identifiable density variation for printed textures. These textures were obtained by the internal fill (infill) generated automatically by the slicer software. For this, the top layer, the surface pattern that would normally close the part, was zeroed out so as the number of contours (perimeters), exposing the infill pattern chosen.
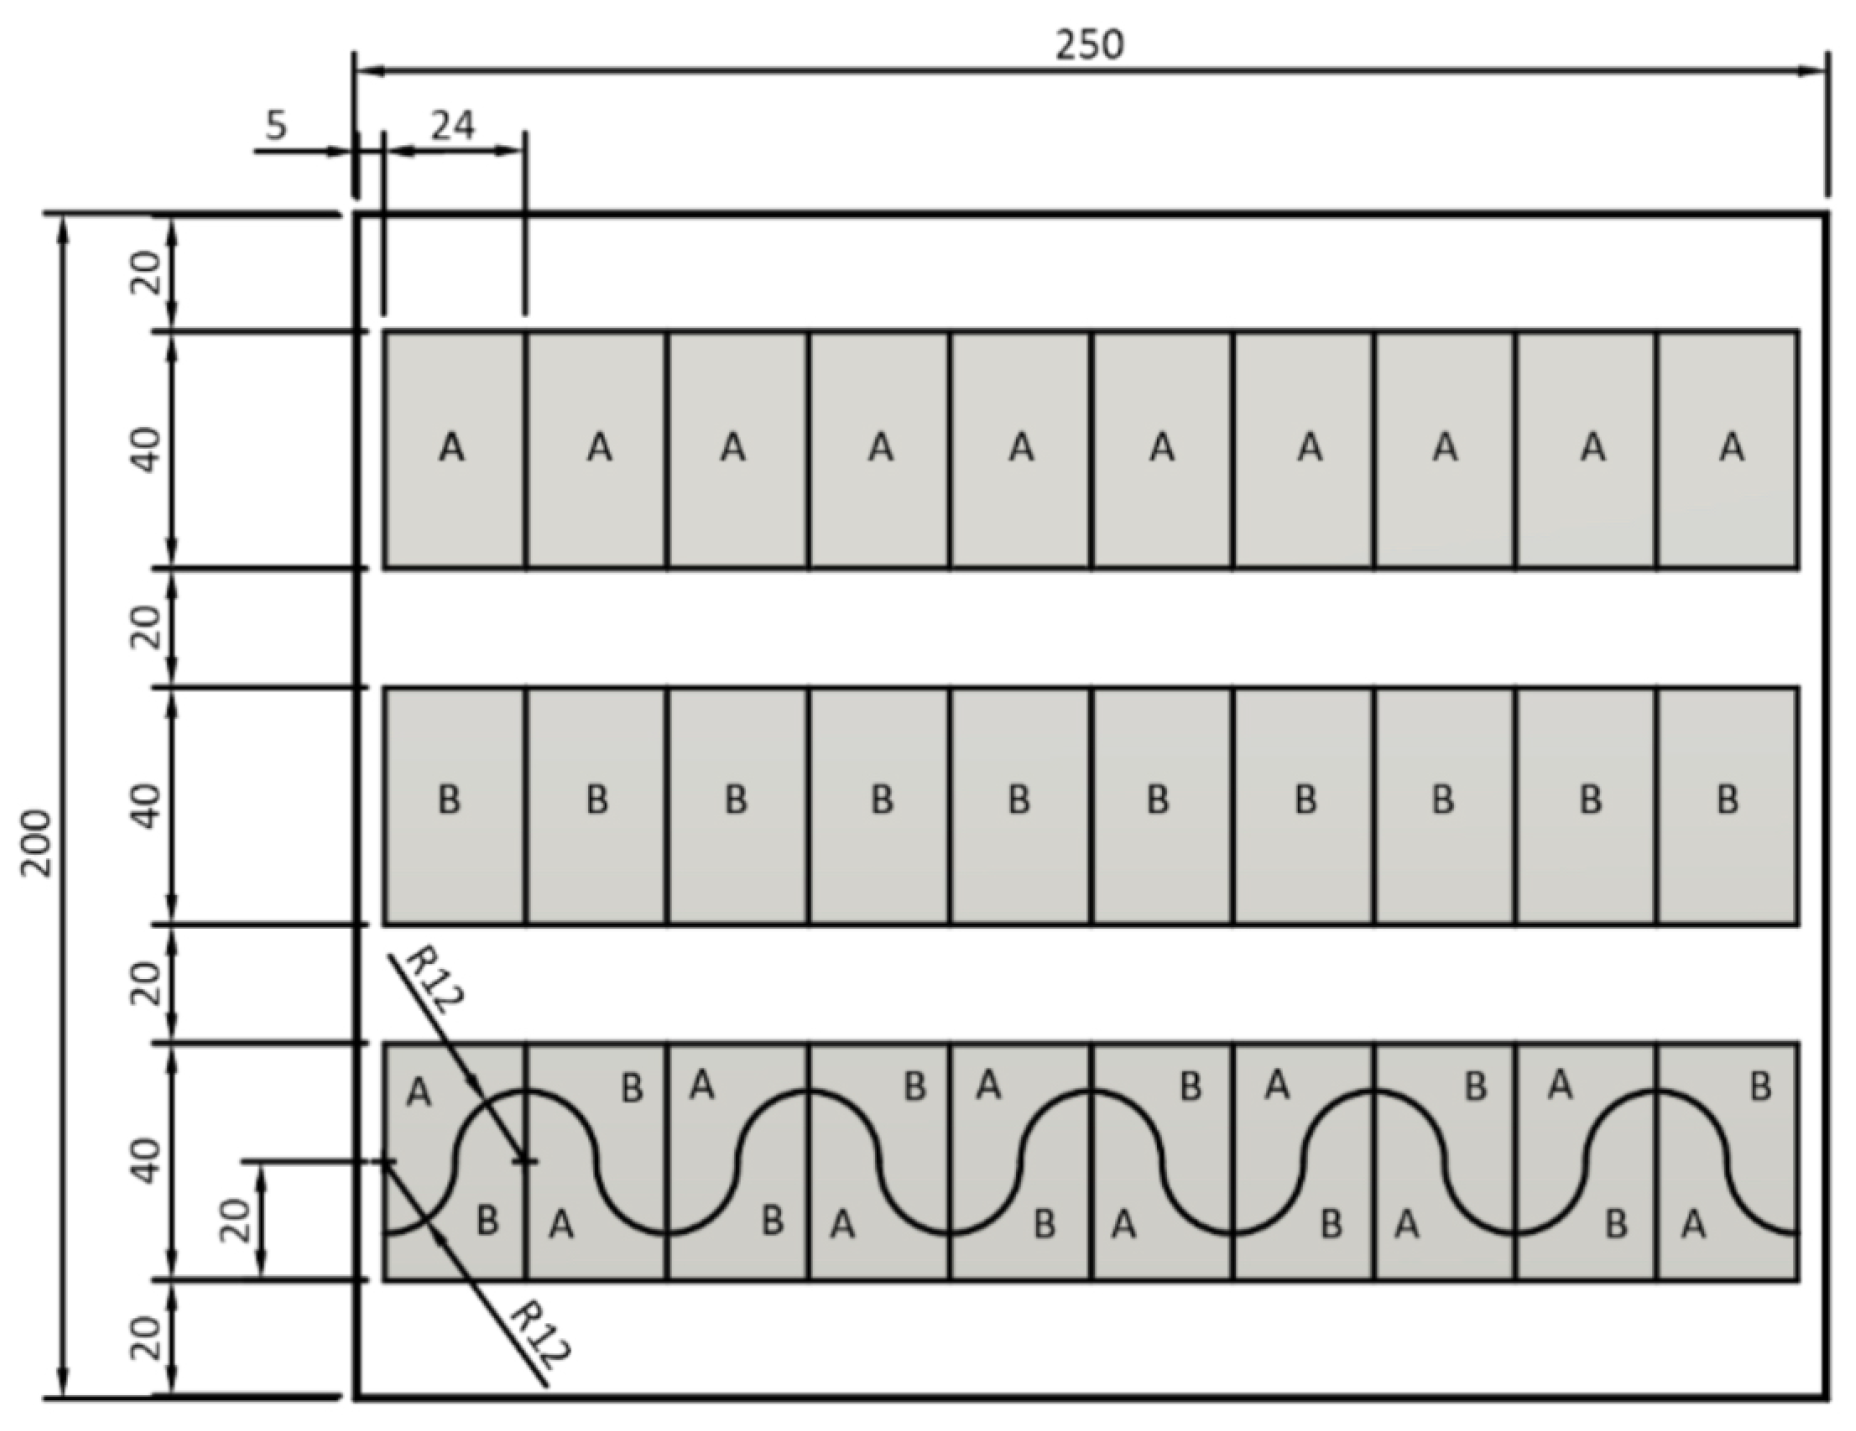
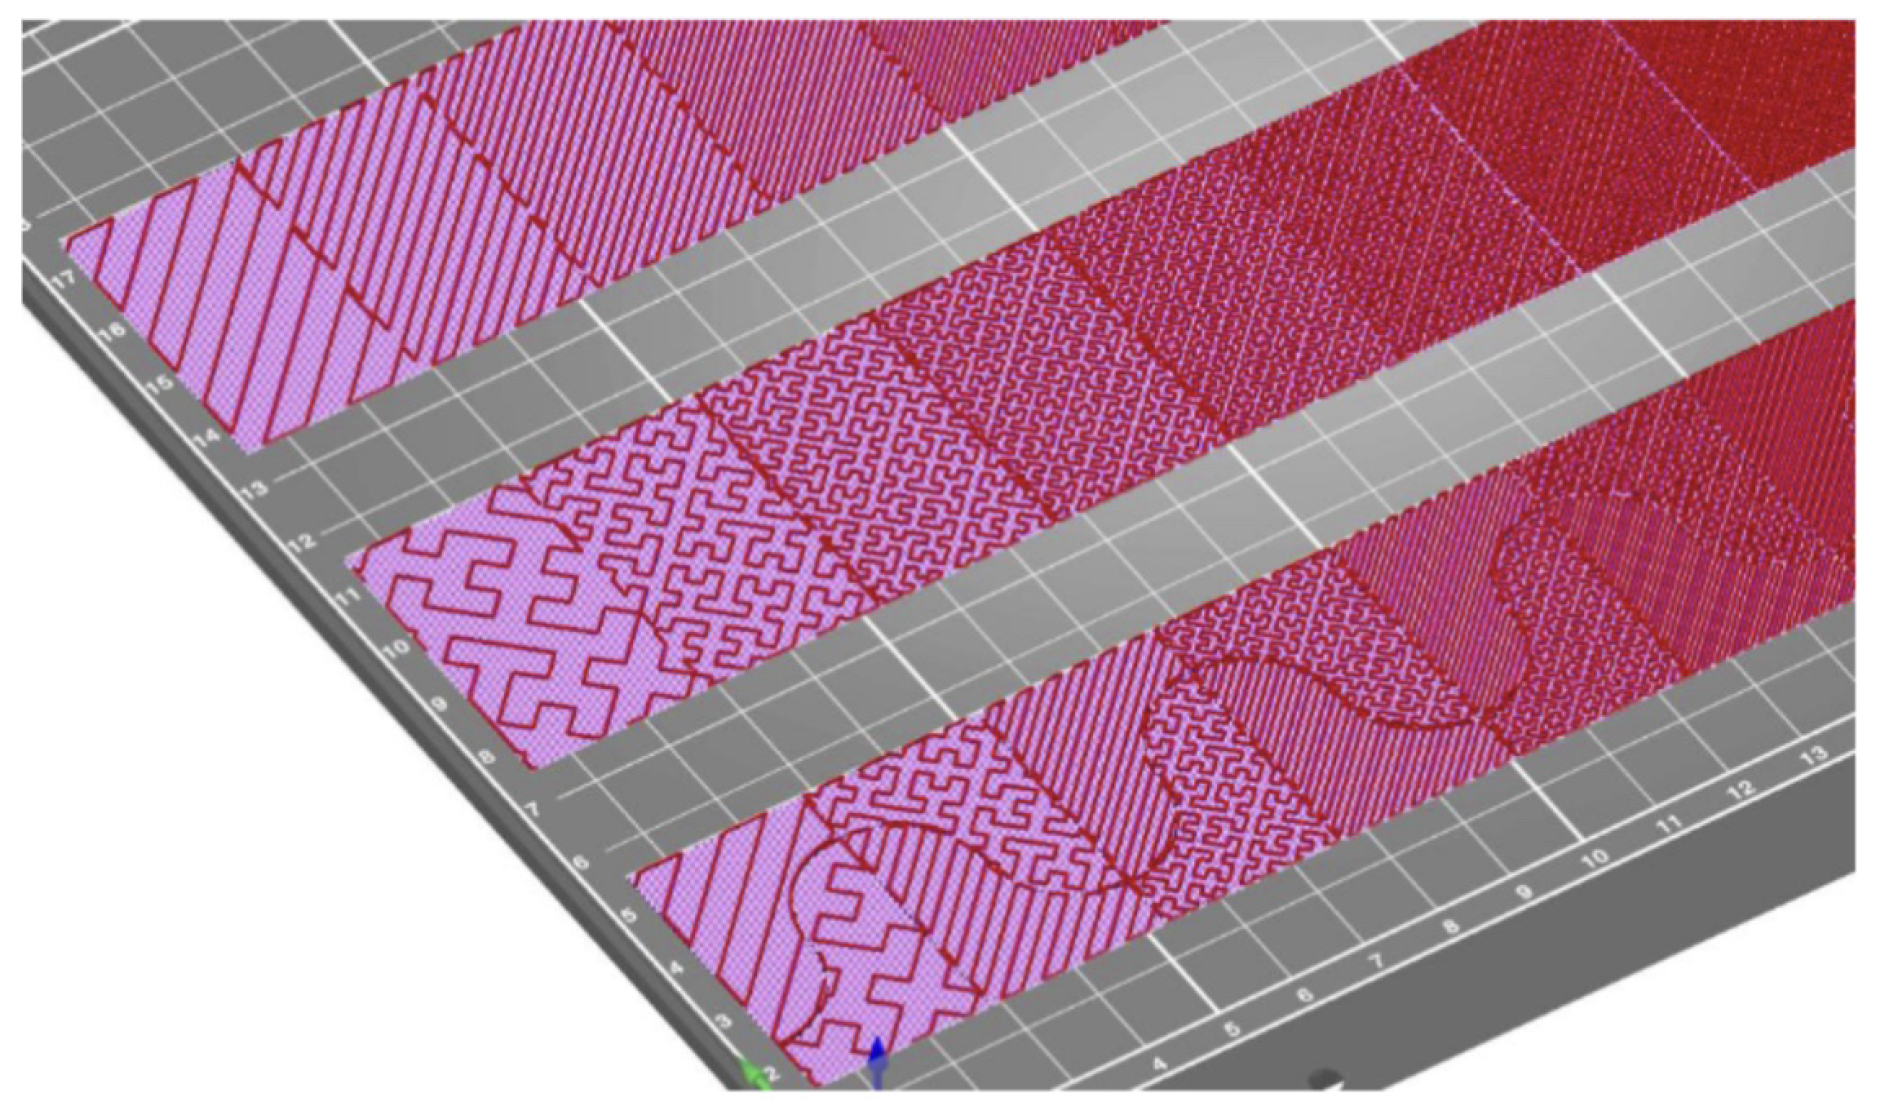
For the test application, on a paper of 200 mm by 250 mm, the textures were distributed in three stripes with ten rectangles in each one. These rectangles were 24 mm long by 40 mm wide and 0.6 mm high, positioned side-by-side without spacing (
Figure 5).
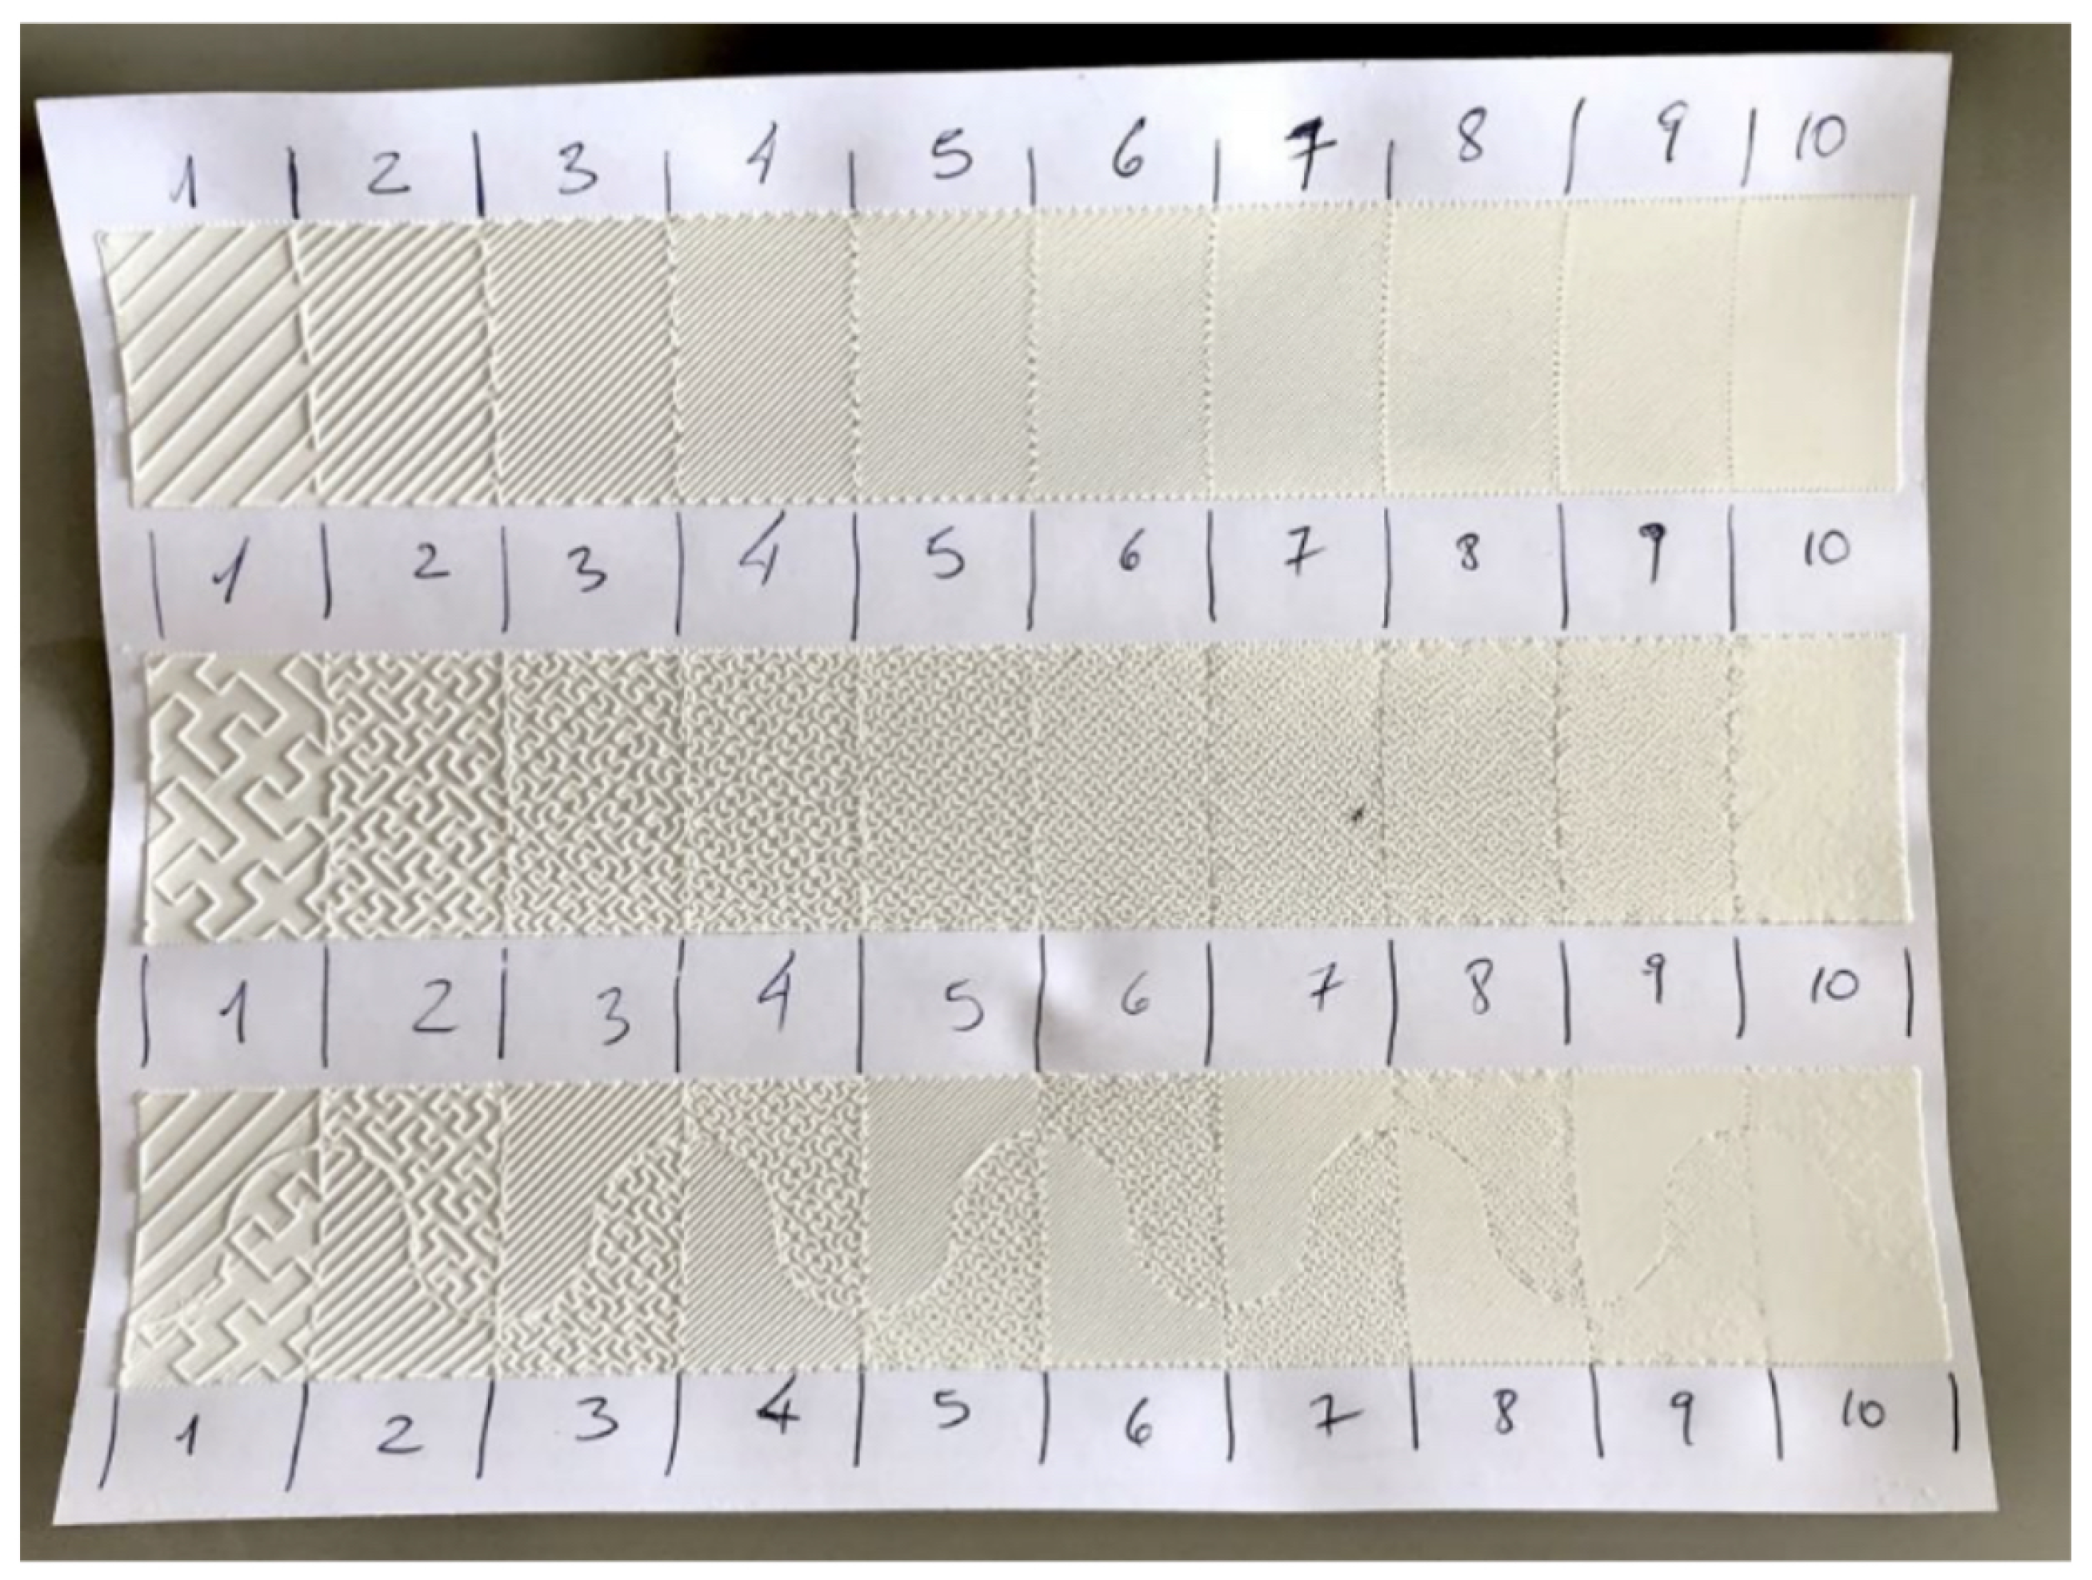
In each of them, the infill was 3D printed with a different density, starting from 10%, at the left, to 100%, at the right. Each stripe received a different texture shape. In the first one, Aligned Rectilinear was used. In the second stripe, the Hilbert Curve. This choice was made because not all infill patterns allow 100% density.
The third stripe featured a different setup: each rectangle was divided into two areas by concordant curves. At each area, one of the textures mentioned above was placed. In the neighboring rectangle, the separation curve has been mirrored, and the texture positioning was inverted. This mirroring and inversion were repeated until reaching the tenth rectangle. With this, the discrimination would occur, not only over different densities, but also over different texture patterns (
Figure 6).
For this test, the infill was kept 0.45 mm wide. To reinforce the adhesion, the bottom solid layer of the rectangle was kept and set at 0.2 mm. Above this base, the texture rose 0.4mm.
During the application, the sample was delivered, and its exploration was encouraged by requesting the identification of the three texture stripes. Then, the perception of the difference between the first and the second density of the first strip was indicated.
The participant was then asked to scan the entire stripe and locate at which point he stopped detecting differences between the surfaces. Once located, the two densities that delimited the non-change were noted. This procedure was repeated for the second stripe.
In the third, it included the request to explore the texture rectangles also vertically to identify the exchange of textures.
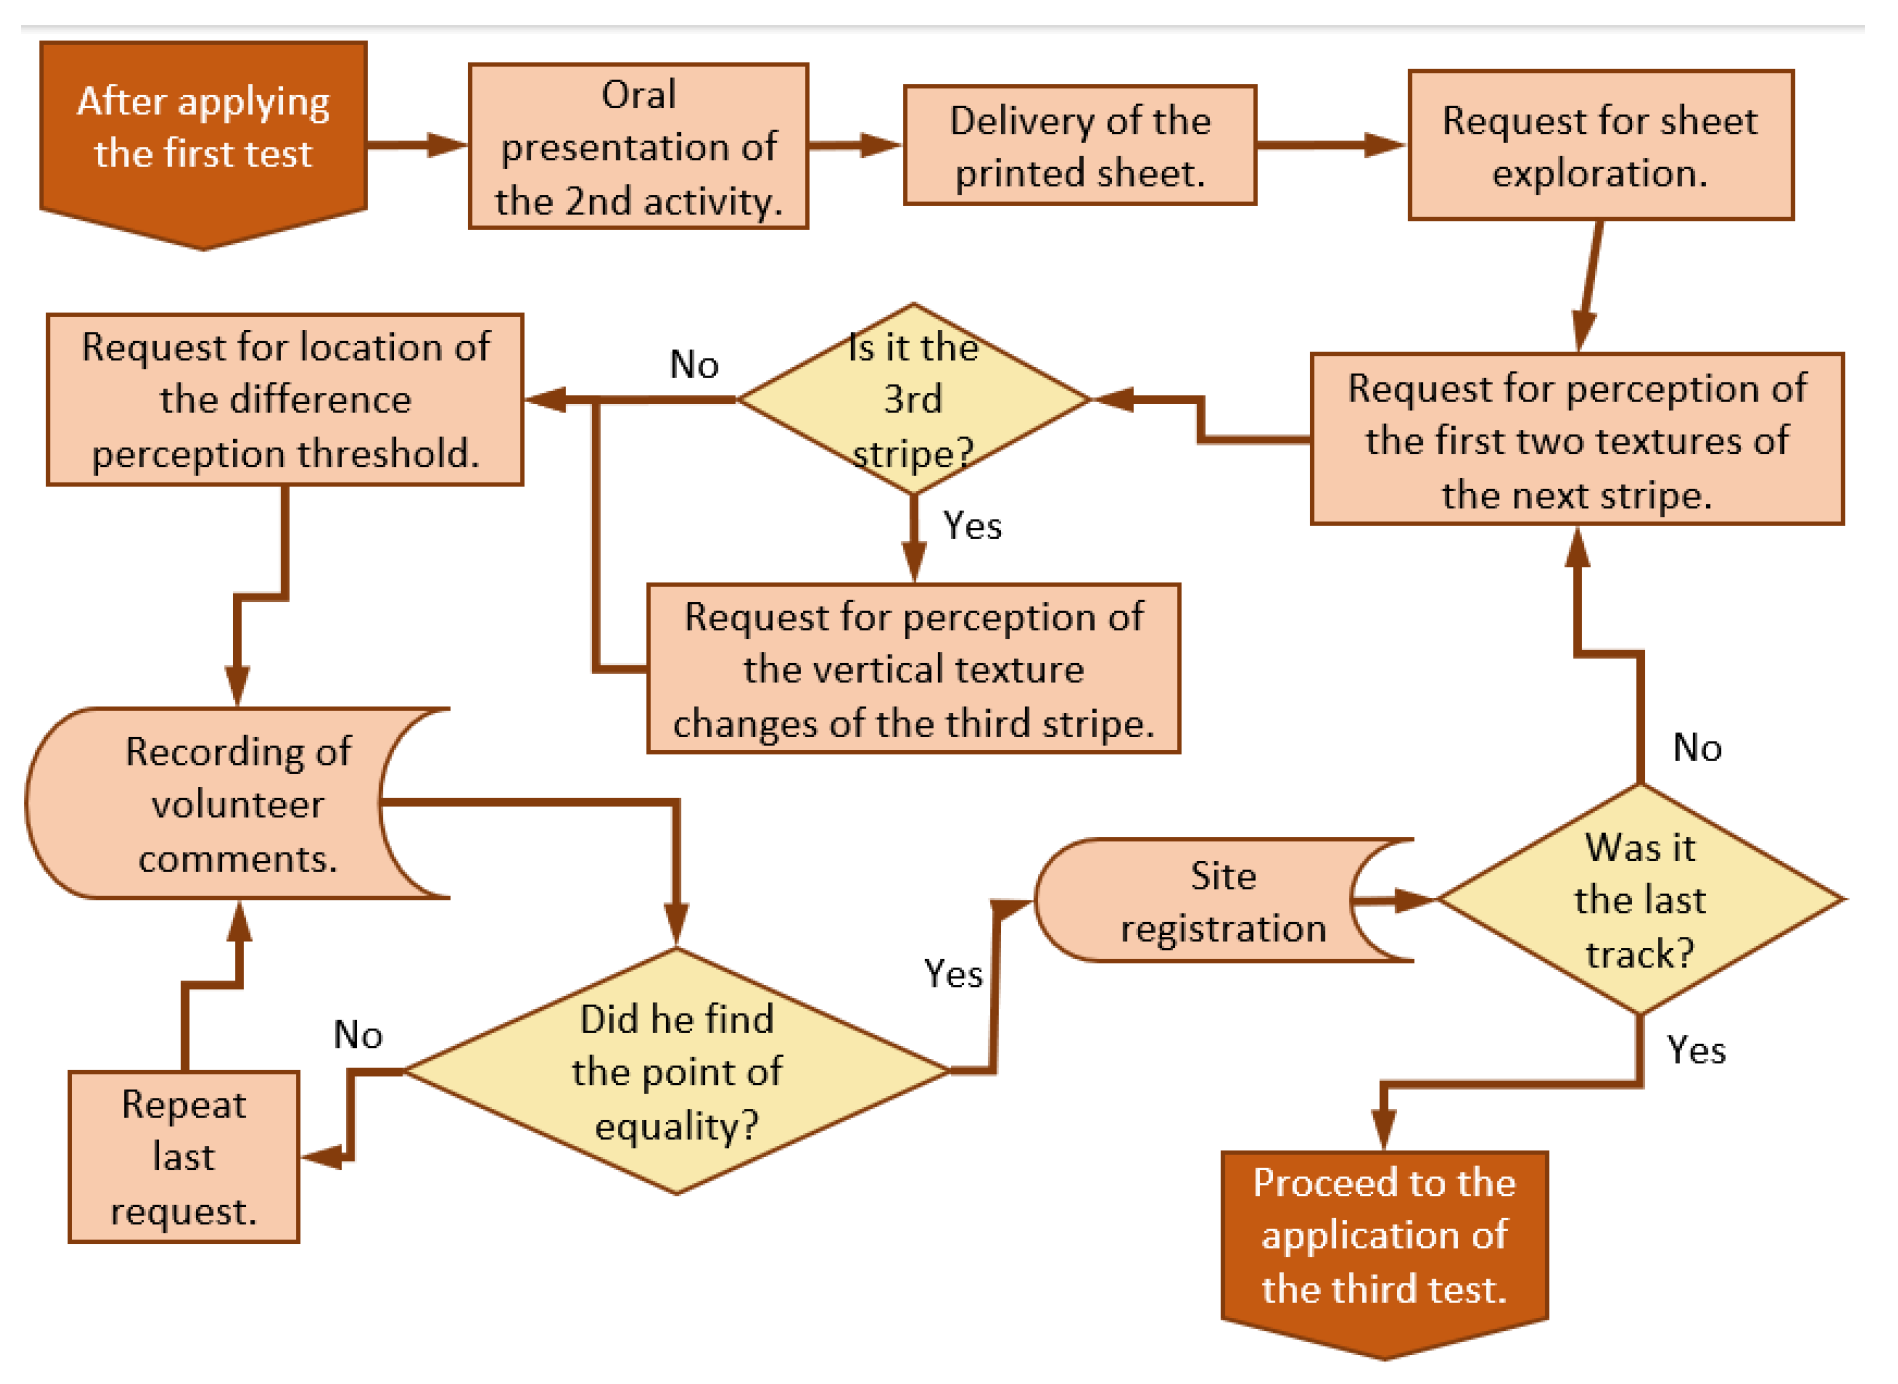
The application of this second test is shown in
Figure 7’s flowchart.
2.2.3. Spatial And Image Comprehension
The last test with users worked with images. They were defined from the 260 figures listed by Snodgrass and Vanderwart [
16]. As (1) the recognition-related brain activity of a visual image is more linked to the tactile shape perception when the objects are familiar [
17]; (2) this familiarity is one of the criteria for the agility in locating an image amid memory [
16]; and (3) the accumulation of contour lines is capable of inhibiting or impairing identification [
3,
16,
18]; the mentioned study’s figure list was classified by combining the highest familiarity scores and the lowest complexity scores that they received in that investigation.
The list was filtered to objects that are: (1) accessible to touch, since for blind users, familiarity also falls on this aspect [
3,
5,
6,
7]; and (2) not represented in perspective (not intuitive when using touch instead of vision without previous training) [
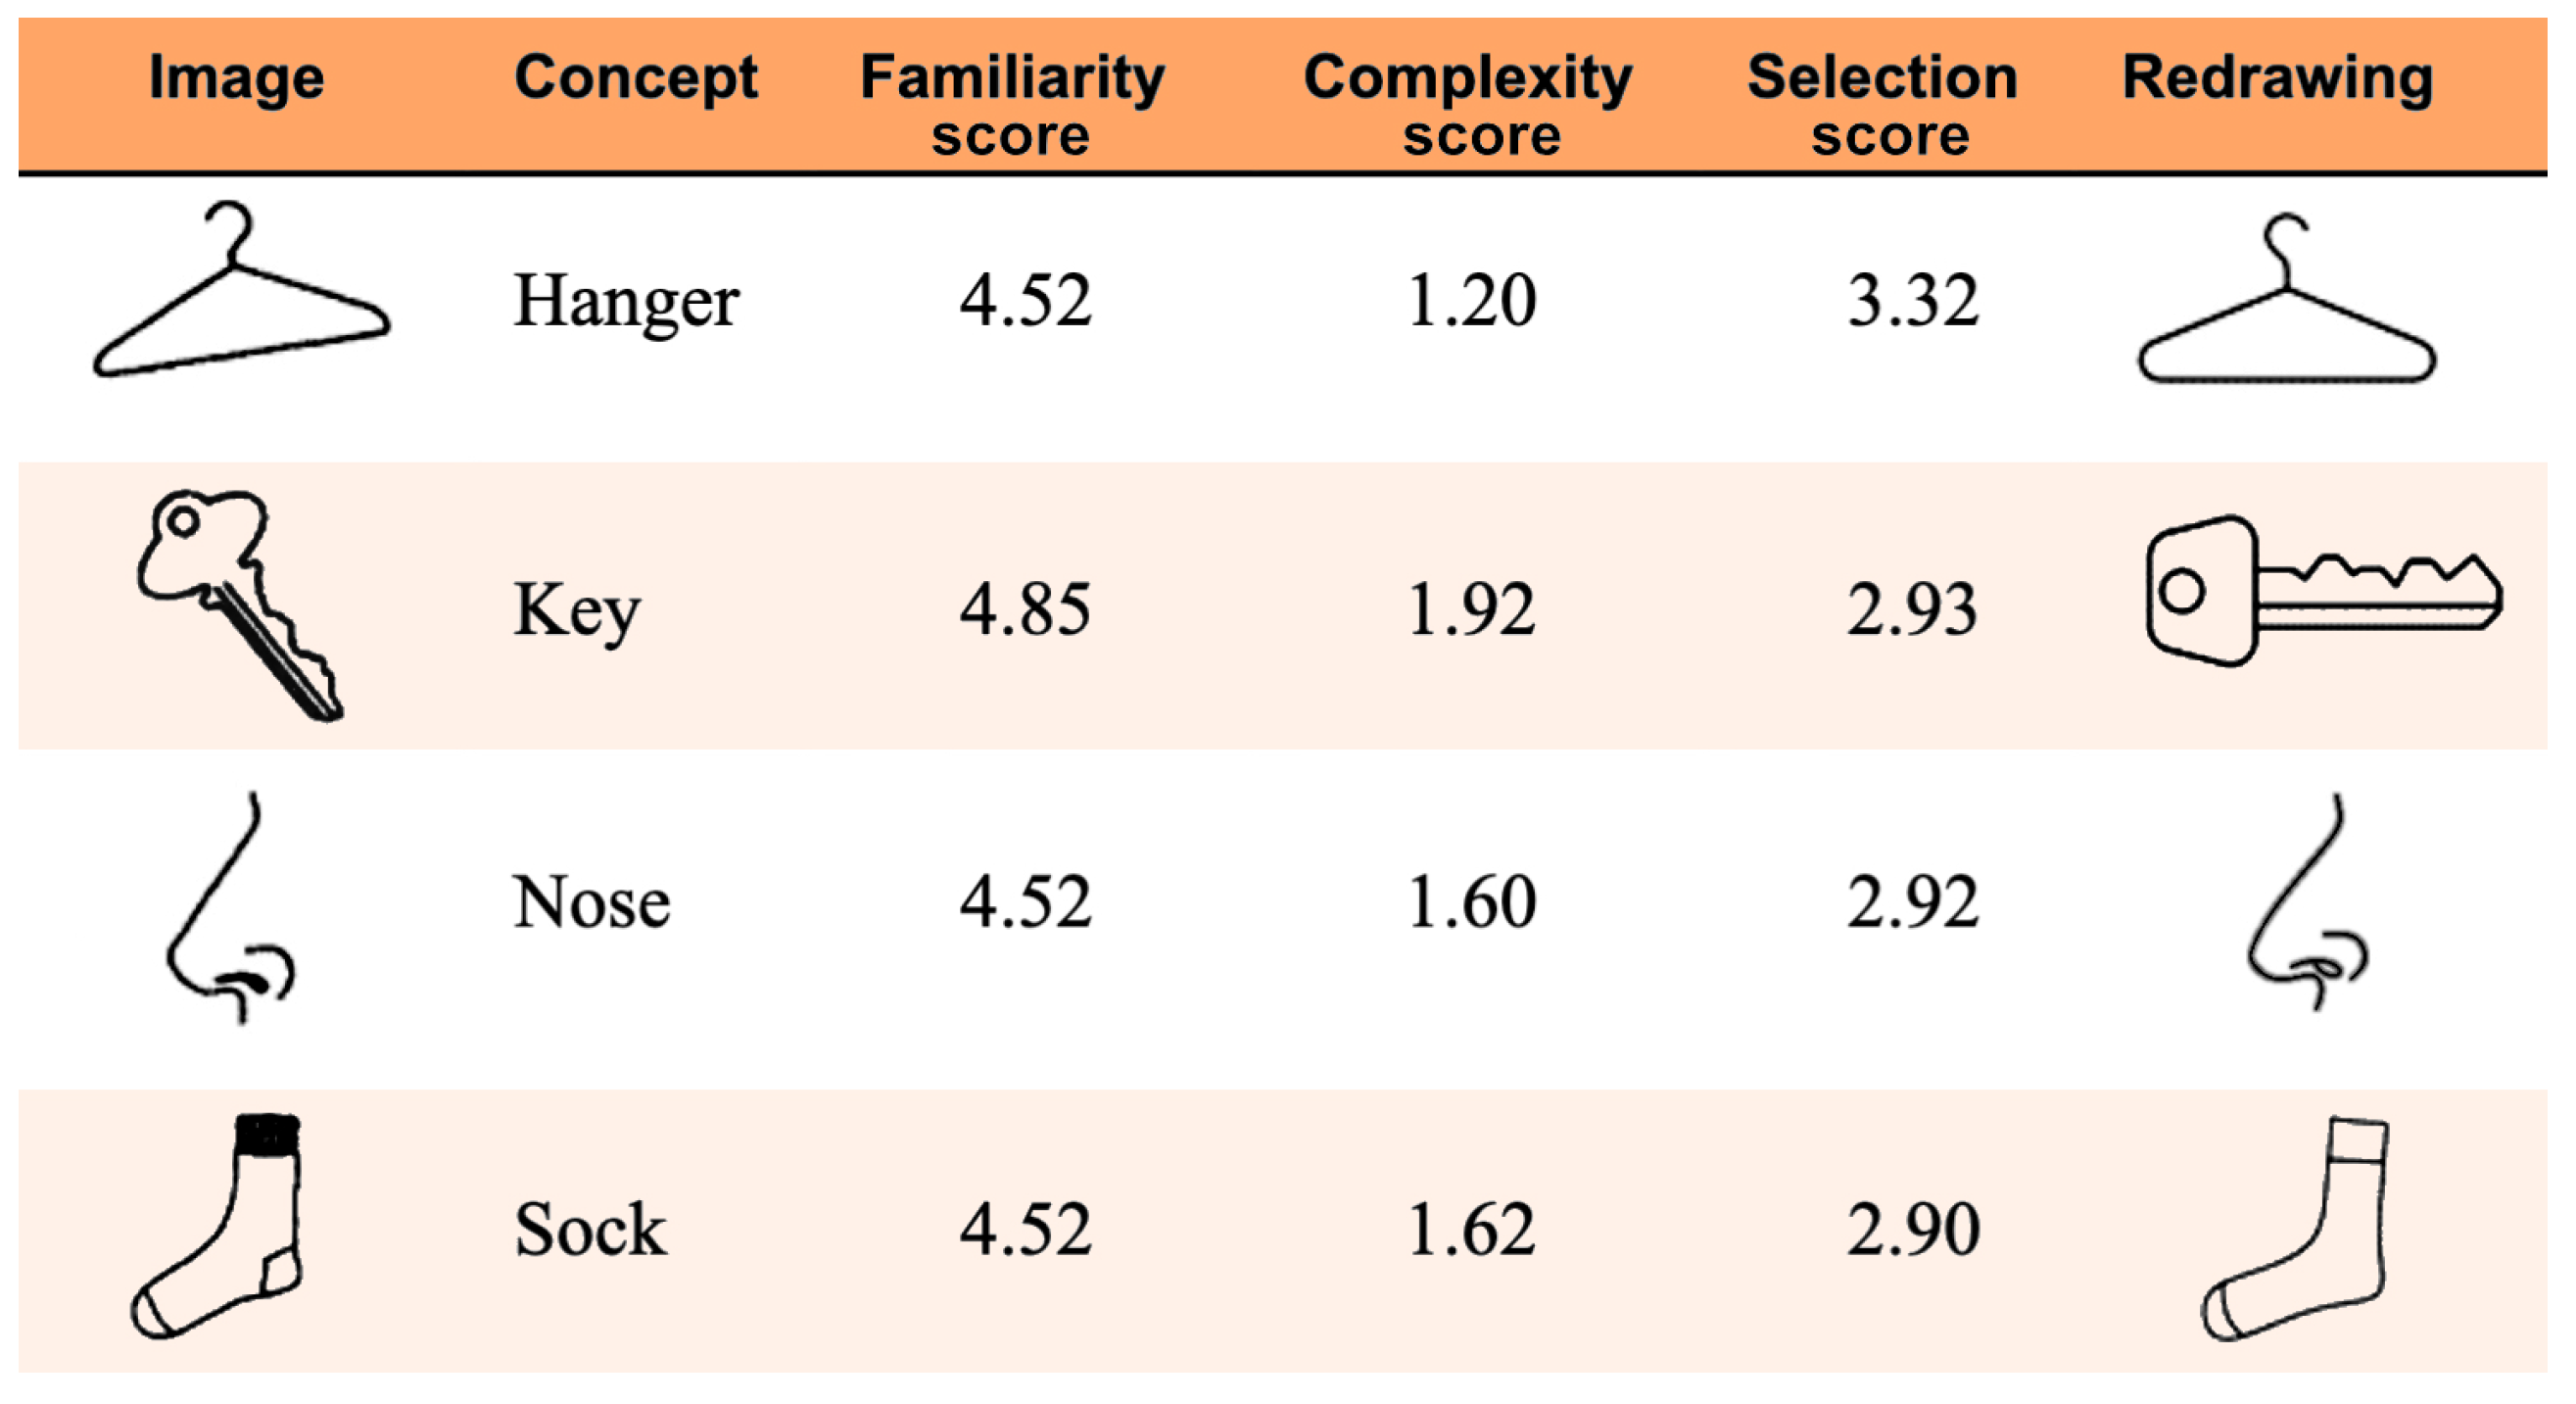
19]. The resultant classification has hanger, key, nose, and sock (
Table 1).
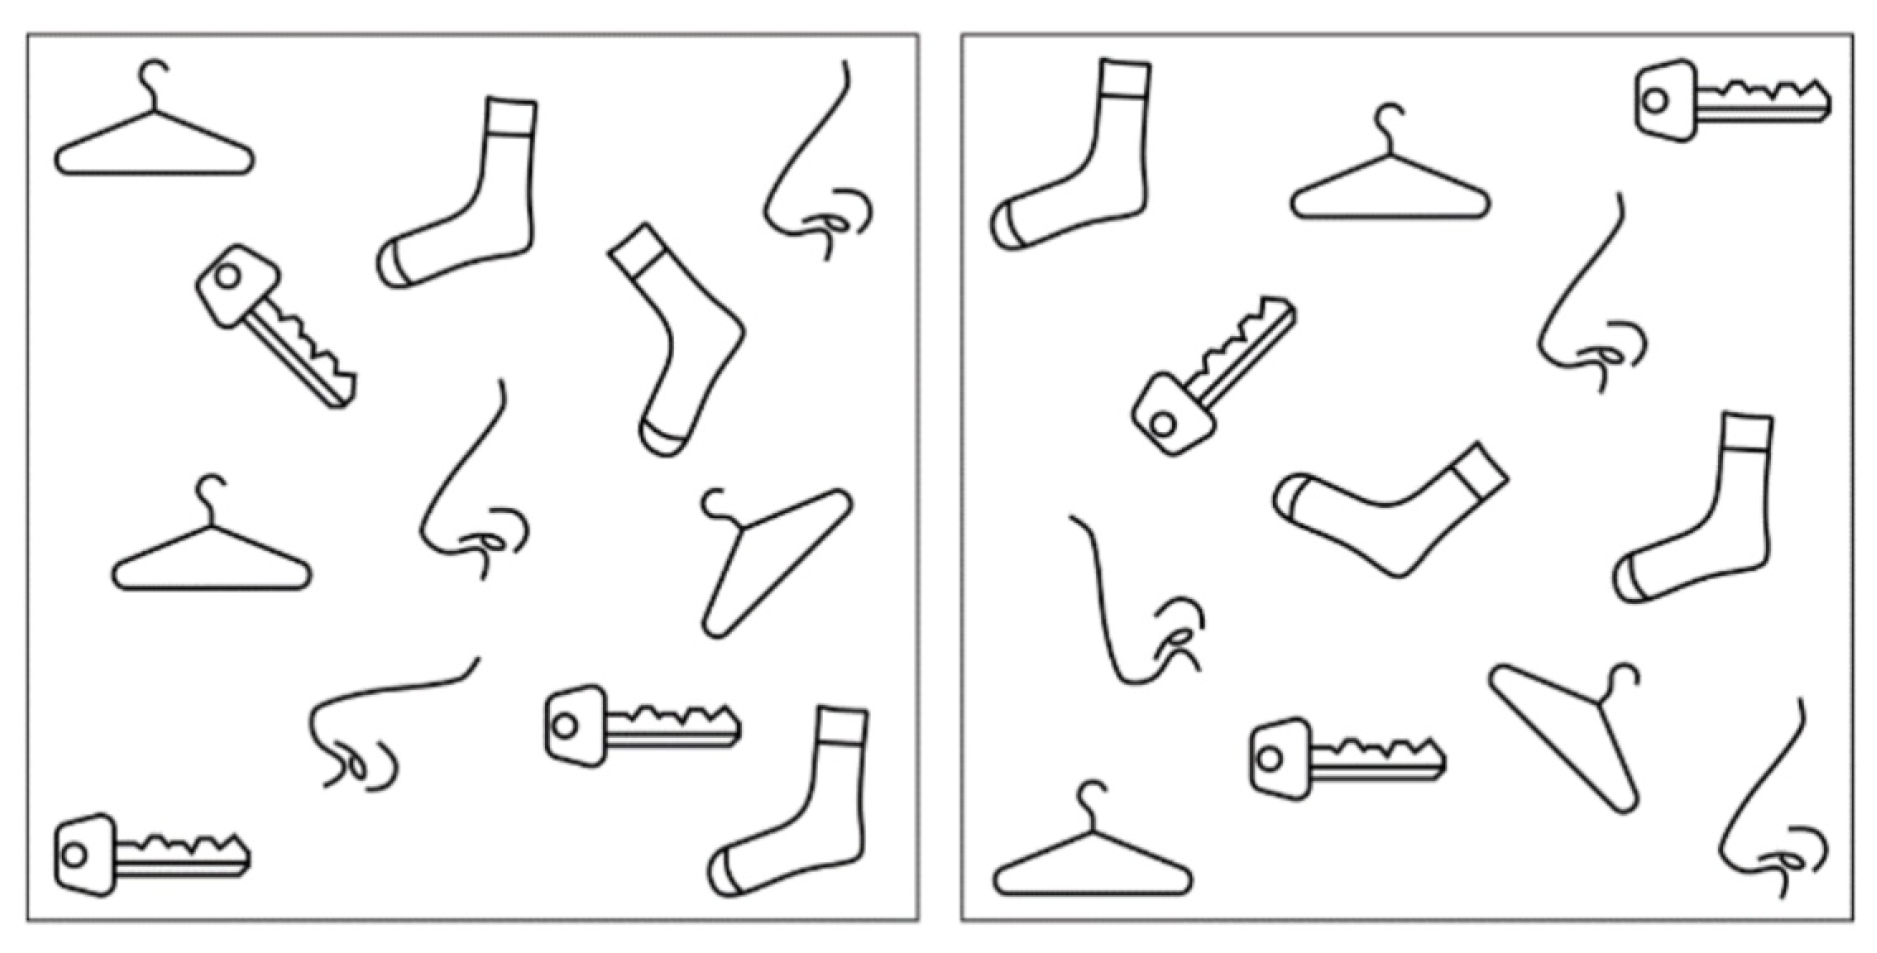
The four drawings were redrawn and positioned in the corners of a square sheet of paper with a side of 200 mm. After, two copies of each figure were randomly distributed across the paper. One of these copies of each figure was rotated by ±45°. The set was prepared for printing in the eight combinations of widths and heights. To ensure the variability of positions for all possible combinations, two figure distributions were created (
Figure 8).
In this test, the user was asked to identify the image, by having hints, and then locate the two copies, using their image comprehension and exploration skills, and spatial notion for positioning and orientations.
For this, the sample presentation sorting was previously randomized so that the participants received all achievable combinations of width and height in such way that, in both times each figure was required, it was not repeated in the same print settings or in the same position. This last test application began with the explanation that the volunteer should identify the requested image and then locate the two similar figures, and that the test would be timed.
As soon as each paper was placed on the table, it was indicated in which corner was the target image, given by the sorting, and, as soon as he reached it, the time counting began.
Tips were given to facilitate identification. However, these tips could not be as accurate as an audio description should be to avoid identification through the tips and not by the figure’s perception. So, the tips given were:
Hanger: object normally present in bedrooms. It is used with clothes.
Key: metal object. When you leave the house, you take him.
Nose: organ of the human body. It is found in the upper part of the body.
Sock: garment. Not everyone uses it.
When there was a convincing answer, the time was recorded, as well as the occurrence of success or failure, and the second activity was conducted. Otherwise, if the participant gave up, the time was also recorded, as well as the occurrence of the miss, and then he was invited to the second activity.
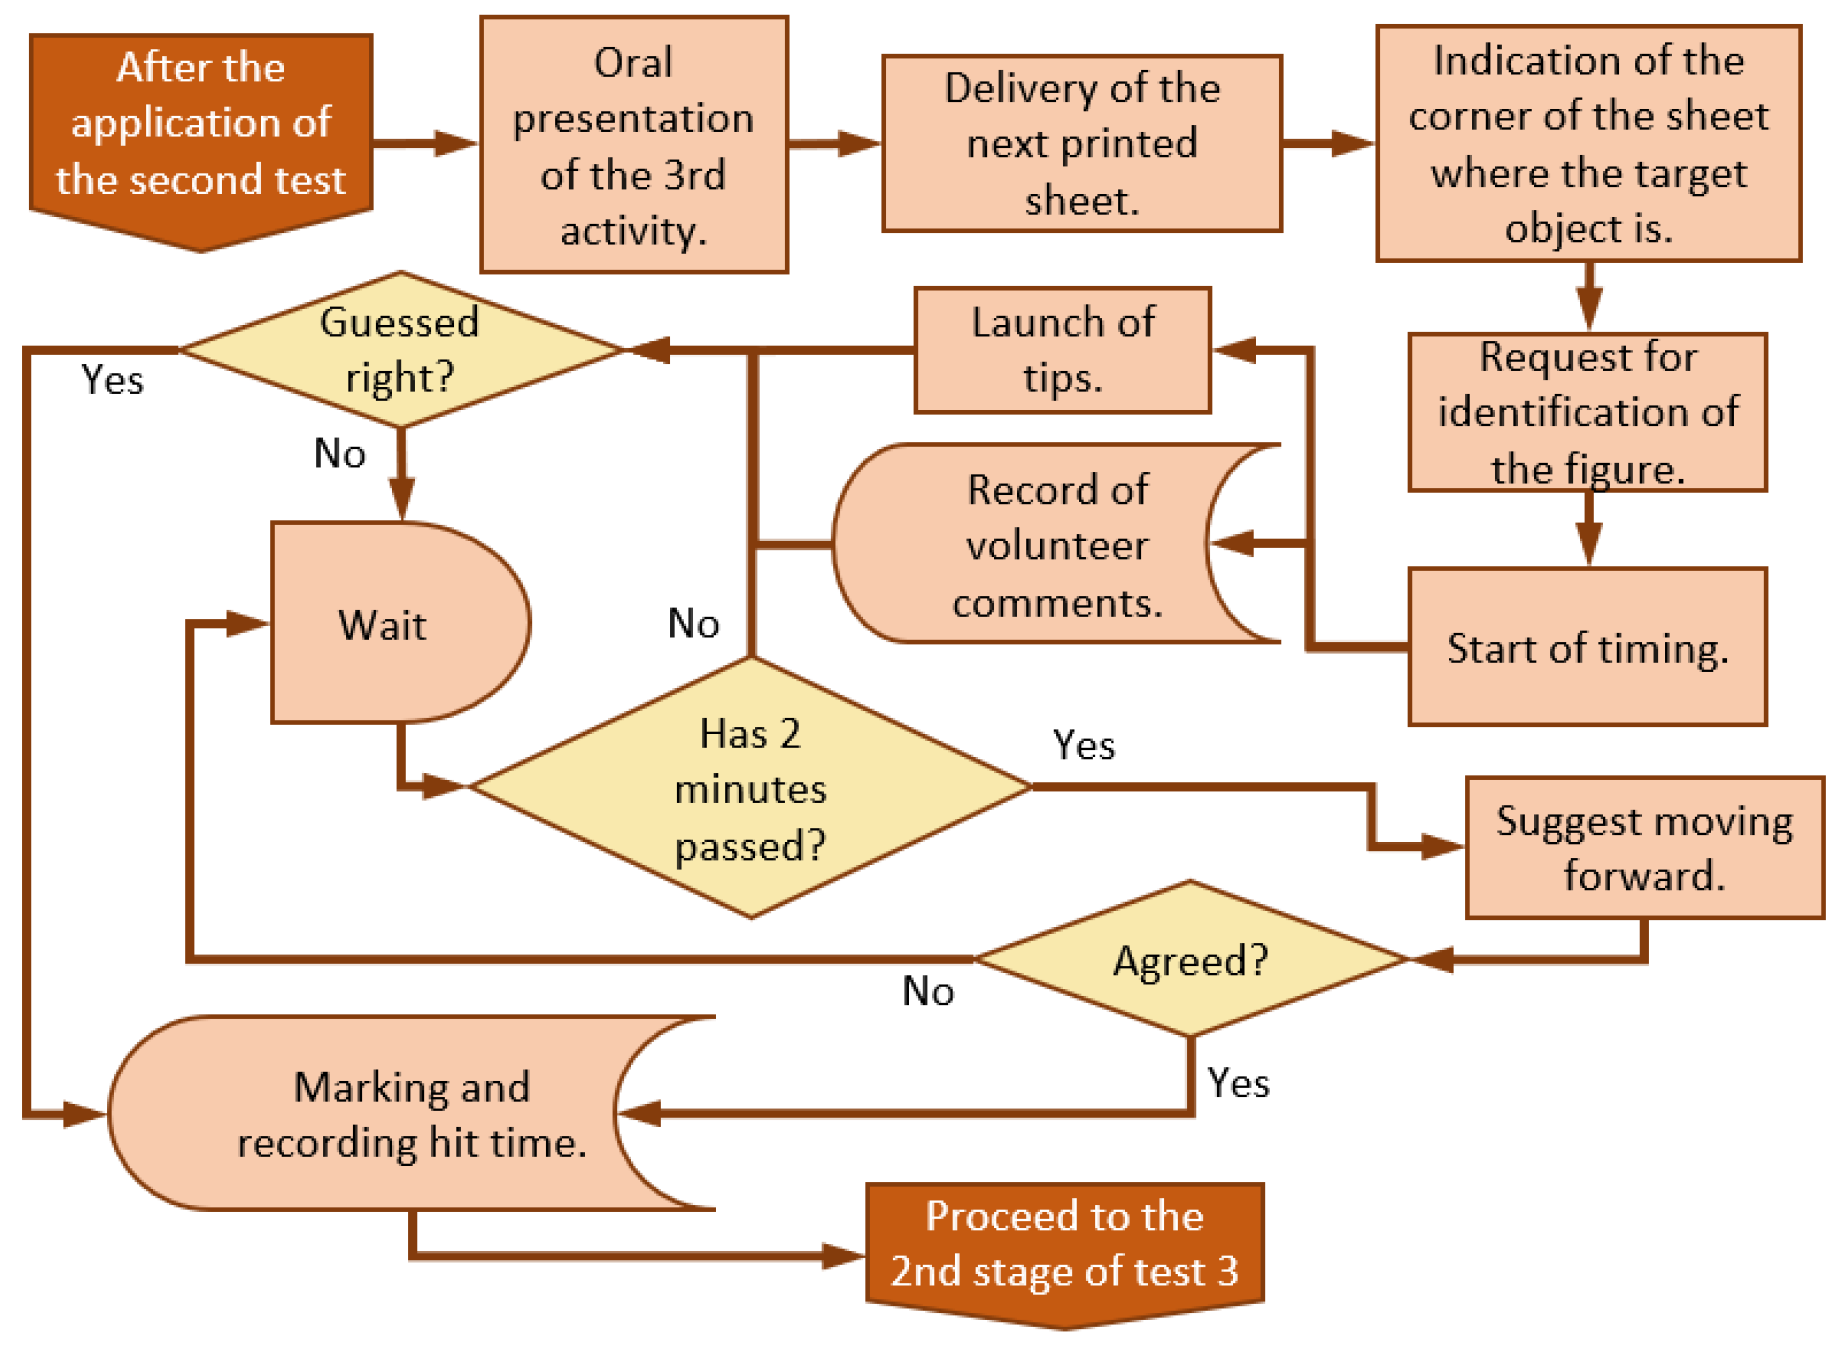
Figure 9 shows this test’s first part flowchart.
Then, the timing was started for the second activity, the copies’ localization, and stopped after the participant confirmed the two copies’ locations, regardless of whether they were correct (to all participants’ definitive answers, the test applicator answered as being correct) (
Figure 10).
The use of both hands was encouraged, as recommended by Eriksson [
3], to identify the images and to maintain a reference while comparing with the other scattered figures in search of similarities.
2.2.4. Other evaluations
To evaluate if the visual condition, the vision loss moment, the schooling, and repetition of some elements have influence in the task execution time, we analyzed (1) the sum of the times for each user following the line, (2) the sum of the times required for each volunteer to identify each object (considering only the correct identification attempts), and (3) the sum of the average times of a participant to identify each figure copies. This average was given by the time for each search divided by the number of copies located in each test of each participant.
3. Data Analysis
The collected results were paired by participants to compare the answers according to each person’s perception. Thus, for example, the result of a test at a contour height was compared with the result of this same volunteer at another height.
Numerical data and their dispersion were exposed through quartiles (25th, 50th 75th percentiles) because it is a small sample data (N ≤ 50), reducing the distortions that the averages can suffer in samples of these dimensions.
To verify the significance of differences in populations with non-parametric frequency distributions, with variable pairings, we used the statistical tests of Wilcoxon [
20] (between pairs of variables) and of Friedman [
21] (with more than two variables). In this last case, Conover’s post hoc technique [
22] was added to identify differences and similarities on a case-by-case basis.
For non-parametric samples with independent variables, the Mann-Whitney’s [
23] test was used (for variable pairs). For independent parametric samples, the tests used were the Student’s T-Test [
24] (variable’s pairs) and the ANOVA technique [
25] (higher numbers of variables). In this further case, with Dunn’s post hoc [
26].
With these tests, it was possible to establish if the relationship between the variables had significant differences [
27].
4. Results
The perception survey with volunteers was approved by the UFPE Research Ethics Committee. In the middle of the second half of 2021, with the evolution of vaccination for the SARS-CoV-212, institutions began to be contacted in different cities of Brazil. Almost all of them were still in quarantine, keeping their students and regulars in remote access. For this reason, some of them did not accept to participate.
With adaptations, such as the use of alcohol at the end of the tests and application with PFF2 type masks, the visit took place in October 2021 at ACACE (Association of the Blind of Caruaru), ASSOBECER (Beneficent Association of the Blind of Recife), APEC (Pernambucan Association of the Blind), CAP (Pedagogical Support Center for Assistance to Visually Impaired People of Pernambuco), and IFPE (Federal Institute of Education, Science and Technology of Pernambuco).
4.1. Participants’ Characterization
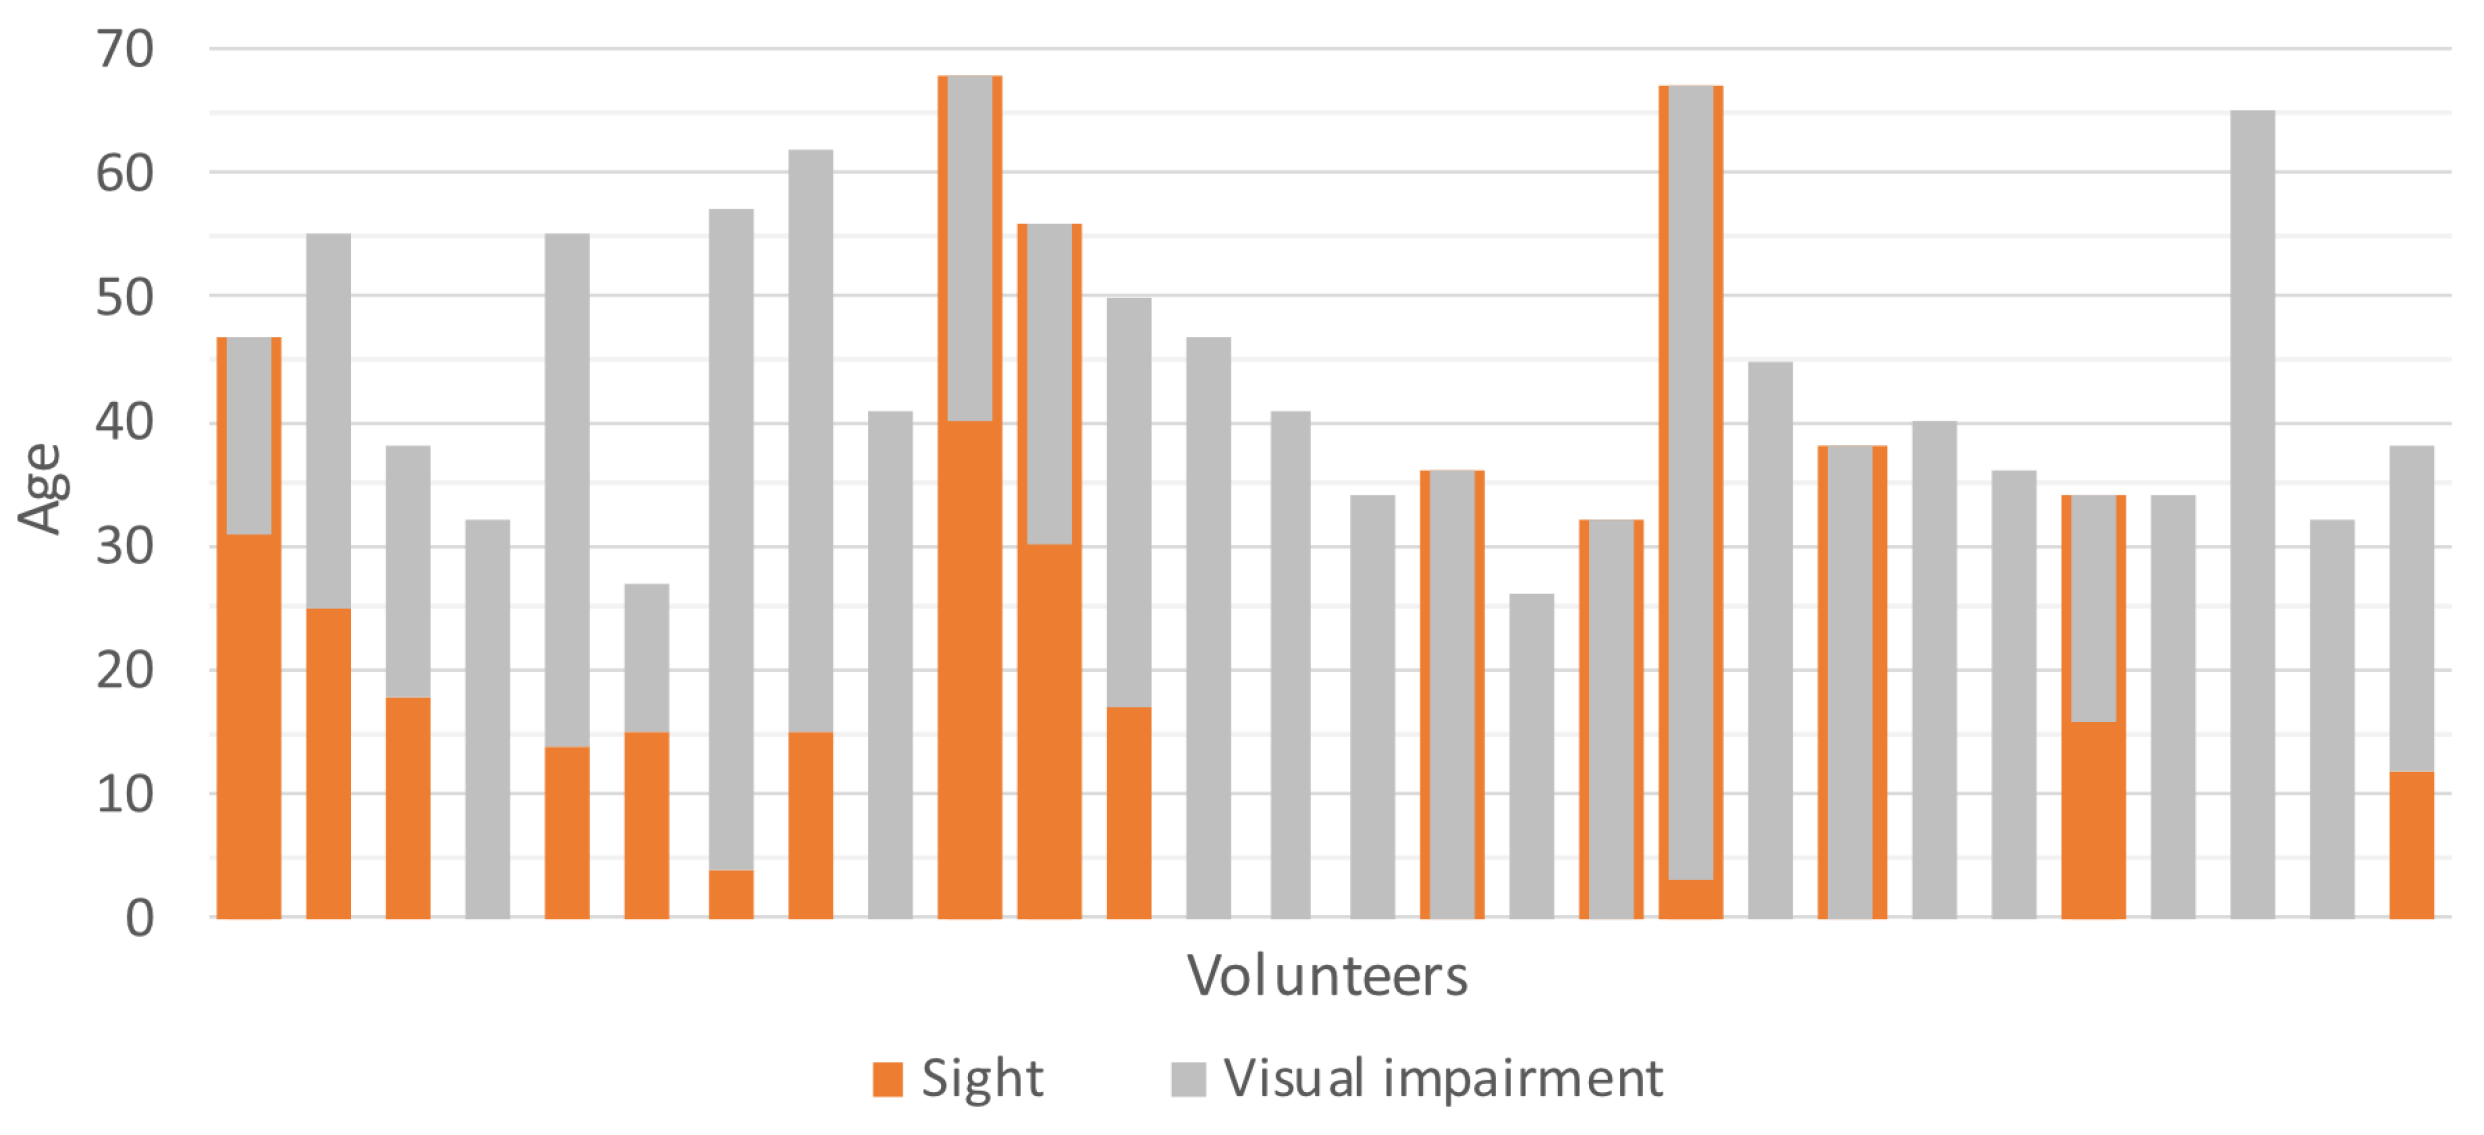
The tests were applied to students, regulars and employees of those institutions mentioned in the previous topic during one to three visits to each of those places. They captured responses, opinions, and comments of 28 participants, aged between 26 and 68 years, with a median of 41 years.
Of these, 53.57% were congenitally blind, and 46.43% lost full vision after birth, 25% during adolescence and 7.14% in childhood. 28.57% have some visual perception, in general, restricted to the discernment of silhouettes.
Figure 11 summarizes this data.
Regarding education, 35.71% had incomplete or complete high school education; 46.42% were in college or completed this stage; 17.85% completed or were in a post graduation (specialization or master’s degree).
One person reported that he had a disease that affected his tactile discrimination: diabetes. This participant failed to complete the scanning and the spatial and picture comprehension test in several attempts. The results of these two experiments were taken out of the calculations. The test with textures went normally.
Three other individuals had similar difficulty performing the action of following the line, even after several attempts. Thus, in the same way, it was decided to proceed to the next test after trying four configuration options. The times in this test were disregarded from the calculations. The tests of tactile discrimination and of spatial and picture comprehension ran normally and were computed.
For those reasons, the first and last tests have smaller samples, with 24 and 27 valid sets of responses respectively, while the second test, with tactile discrimination on the texture densities, presents a valid sample with all volunteers, 28.
4.2. Observations Made
During the applications, what was freely commented by the participants was noted.
4.2.1. Scanning
In the first sample, 25% of the participants took three or more times to locate the hemisphere for the first time than their own average time to locate it in the following samples. Their times dropped significantly already in the second sample received. There was no noticeable variation like this in the subsequent activity of following the lines.
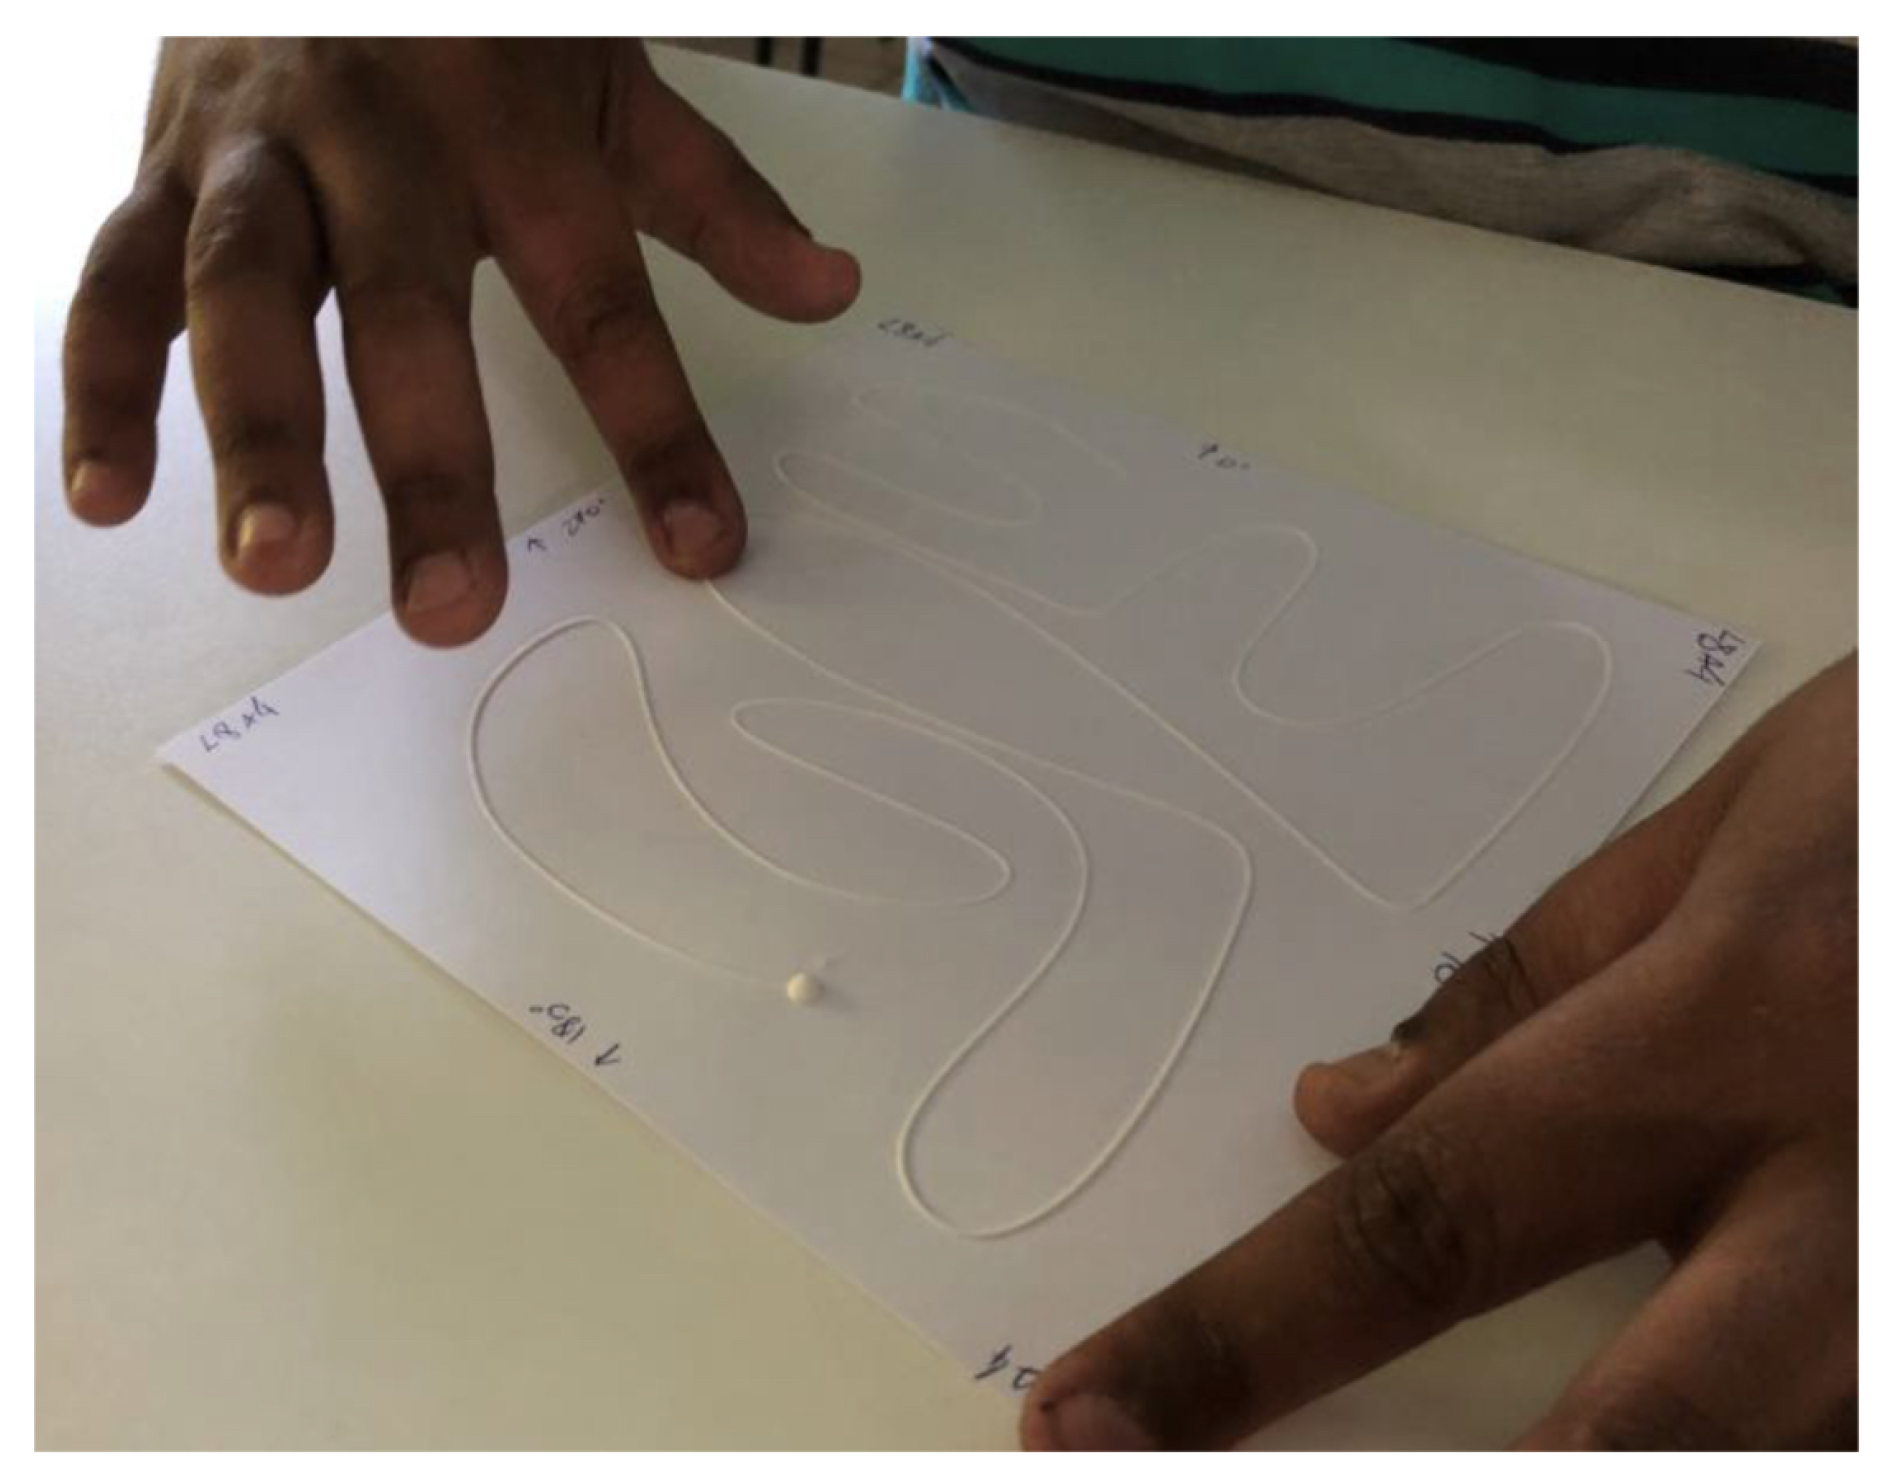
When following the lines, some participants were confused at the points where the line approaches itself and, continued to follow in the wrong way, arriving back at the initial hemisphere, and restarting the activity. Time measurement has not been reset (
Figure 12).
No performance differences were noted with the sample rotation, but one of the volunteers reported that following a horizontal line is easier than when it is presented vertically.
4.2.2. Tactile Discrimination
The change in the fill density generated a dividing. Even though there were no contour lines, many participants easily identified this division and used it to delimit the area to be verified (
Figure 13).
While checking the textures, some volunteers rubbed them, others used their nails (one of them reported that they allowed greater precision in touch). All 3D printed samples withstood the manipulations of all participants.
4.2.3. Picture Comprehension
There was no disagreement with the hanger shape, but some participants did not agree with the key representation, looking for an older shape. One volunteer complained about the high complexity of the figure, while another praised and was impressed by its richness of detail.
The sock was quite compared to boots, differentiating itself by not having laces. The shape at its top and at its tip dispersed the identification. There was often mention of underwear and at once it was mentioned that it was a scarf.
The drawing of a nose in profile generated the greatest difficulty and was the least recognized. Ear was the most heard answer, followed by shoulders.
Table 1 illustrates the shapes.
Some participants complained about the tips, for being too generic for a description (as it had been planned), but there was one of them who stated that he recognized an image by the tip, not by the perceived contours.
4.2.4. Spatial Comprehension
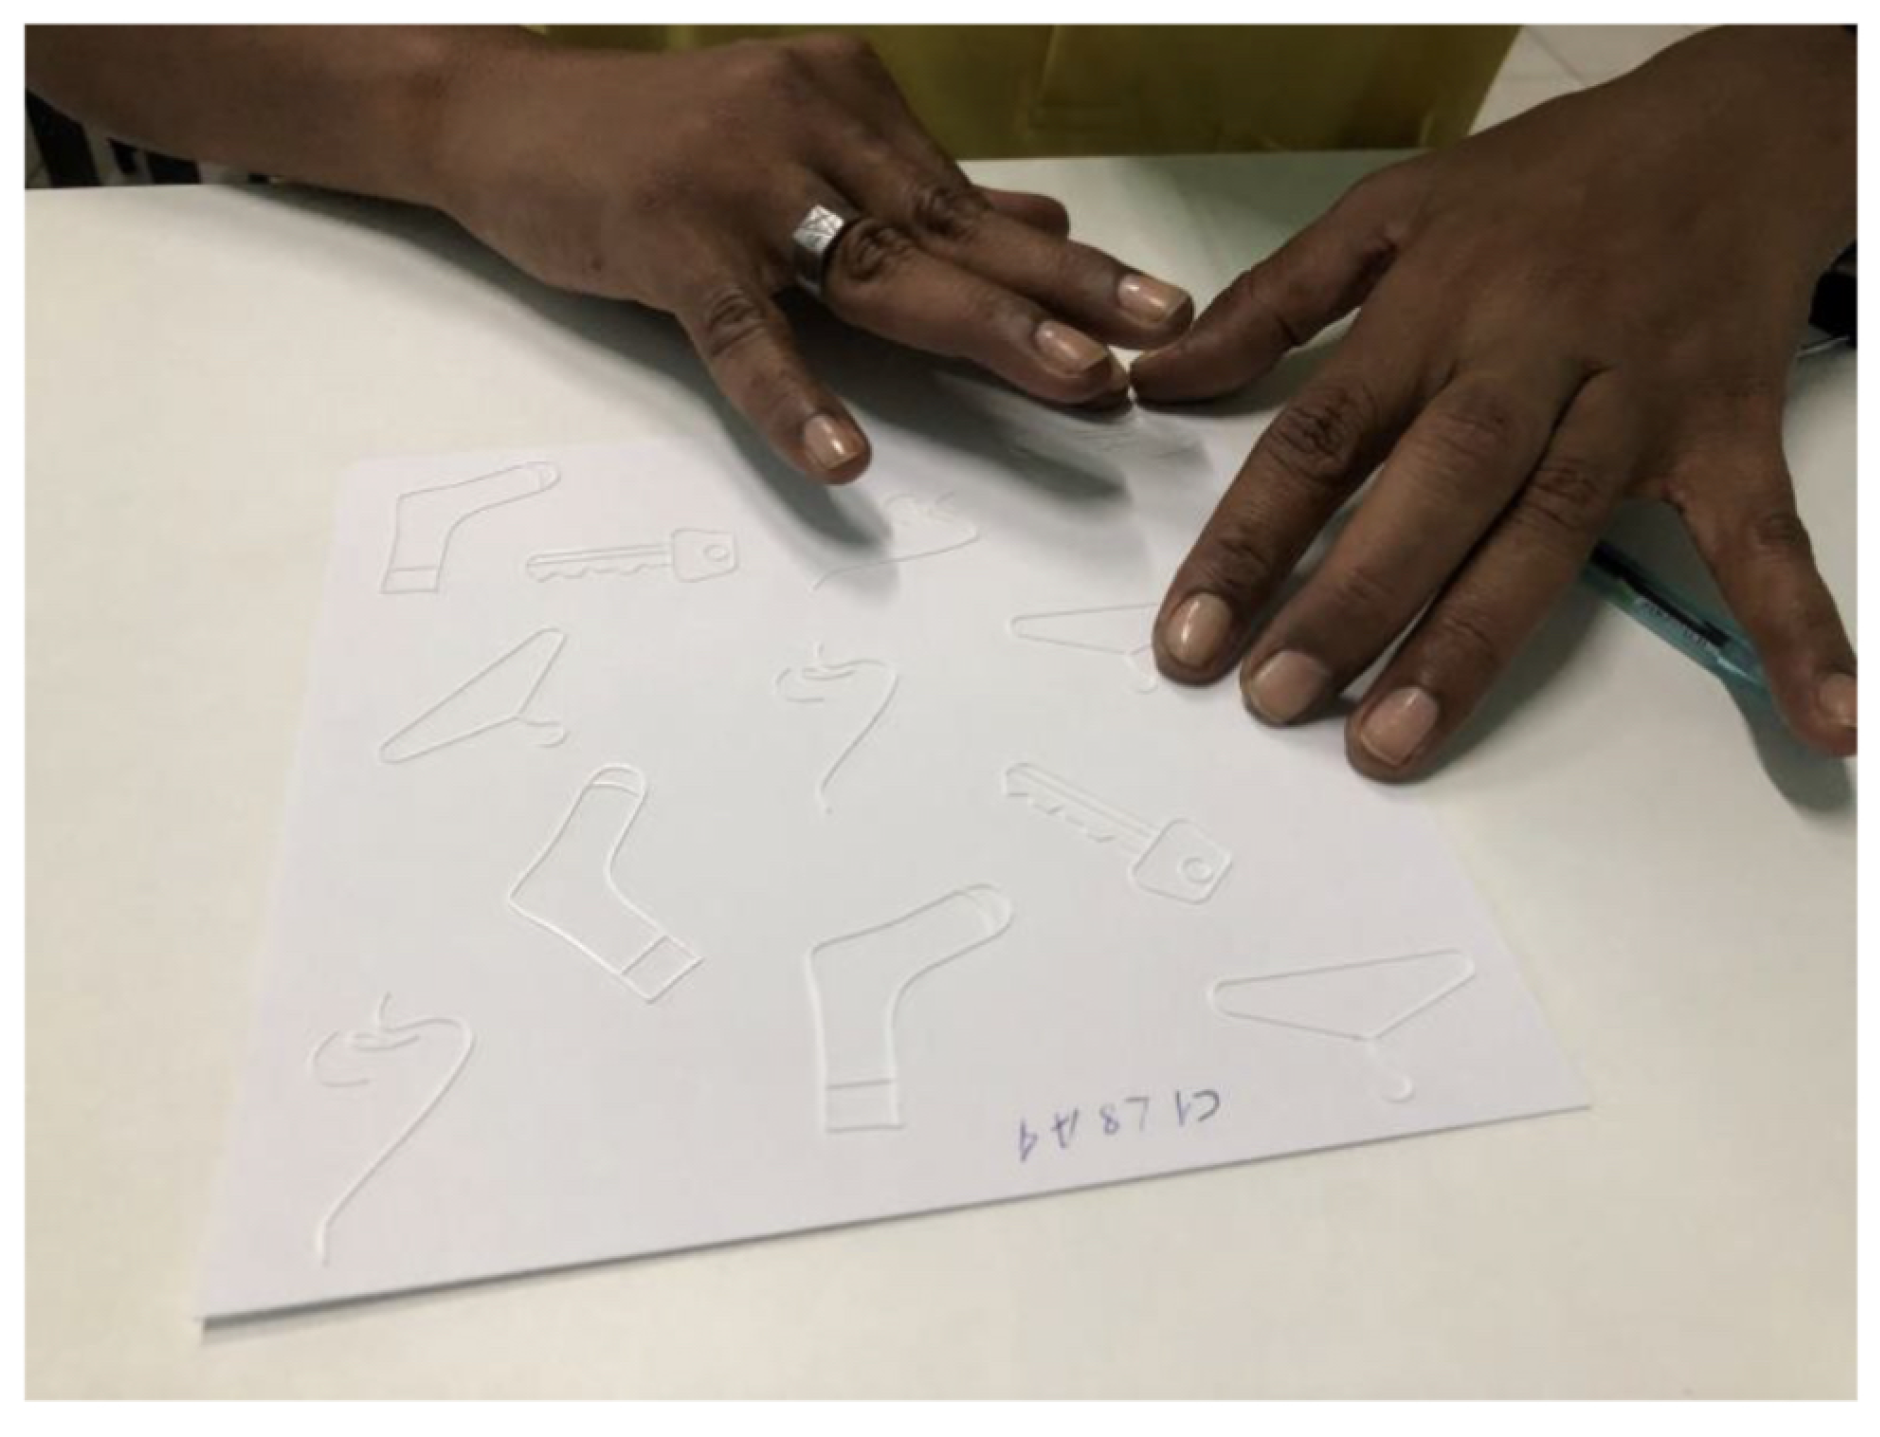
It was observed that some individuals did not explore the entire paper. They focused on specific points (
Figure 14). After a while, they expanded their exploration and then quickly found image copies, as illustrated on the video
1. Those were the results with the most prolonged time in the localization task.
The 45° image rotation did not affect the pairs detection, as the participants themselves sometimes deliberately rotated the paper during the process in search of a more comfortable reading position.
In the search for copies, they often focused on a specific element of each figure and looked for the occurrence of that element. They repeatedly used the hook on the hanger, the circle on the key, the line towards the top of the nose, and the square on the top of the sock.
4.2.5. Participants’ Reactions
The institutions’ leaders and participants’ reactions varied. In general, the leaders were fully supportive and showed great interest in 3D printing as manufacturing technology.
Although some of them were a little apathetic, the vast participant majority reaction was of fun, of being something different from their daily tasks. Some commented on the contribution that the line-follow test could make in motor coordination activities and asked to take the sample “to train at home”.
When they became aware that a colleague had taken the test, it was common to see a light competitive atmosphere, wanting to know their time to compare it to that colleague’s, which was kindly denied.
This atmosphere of fun and competitiveness commonly led to the verification of a strong persistence: they did not want to stop/give up, even after the time defined for the task had ended.
There were also some extreme reactions, such as the volunteer who, when leaving the room, jumped in joy telling friends what had happened, that she had felt figures and got right what they represented. There was also a participant who, impressed by the accuracy of the printed elements, took a key from his pocket to compare it with the one that was drawn, surprised by the richness of detail.
In an informal conversation with one of the leaders, it was learned about the difficulty in presenting to a people, blind from birth, some visual concepts, such as Brazil’s flag geometry. For the next visit to the same location, two flag models were printed. They caused immense joy and were introduced by the leader to everyone who was and who arrived at the institution throughout all day. One of the regulars, after groping the model, commented: “I’ll give you my TV if you bring me a world map”.
On the other hand, one of the participants reported that researchers usually show up, collect their data, consuming the volunteers’ time, and then leave without giving any more news or feedback. This fact discouraged participation.
Those reactions helped to outline an idea of how much knowledge, experience, and experience in graphic representations have space, potential and impact on the VIP’s lives.
They were reinforced by the testimony of one of the institution’s leaders who emphasized the lack of didactic material in this area. She recalled the difficulty of teaching animal body parts and shapes. This lack, according to her, leads schools to a state of “make-believe” teaching for VIP, in which the student would pretend to have learned the content. Excessive family care was cited as another obstacle to the development of knowledge and independence of VIPs.
4.3. Printed Heights
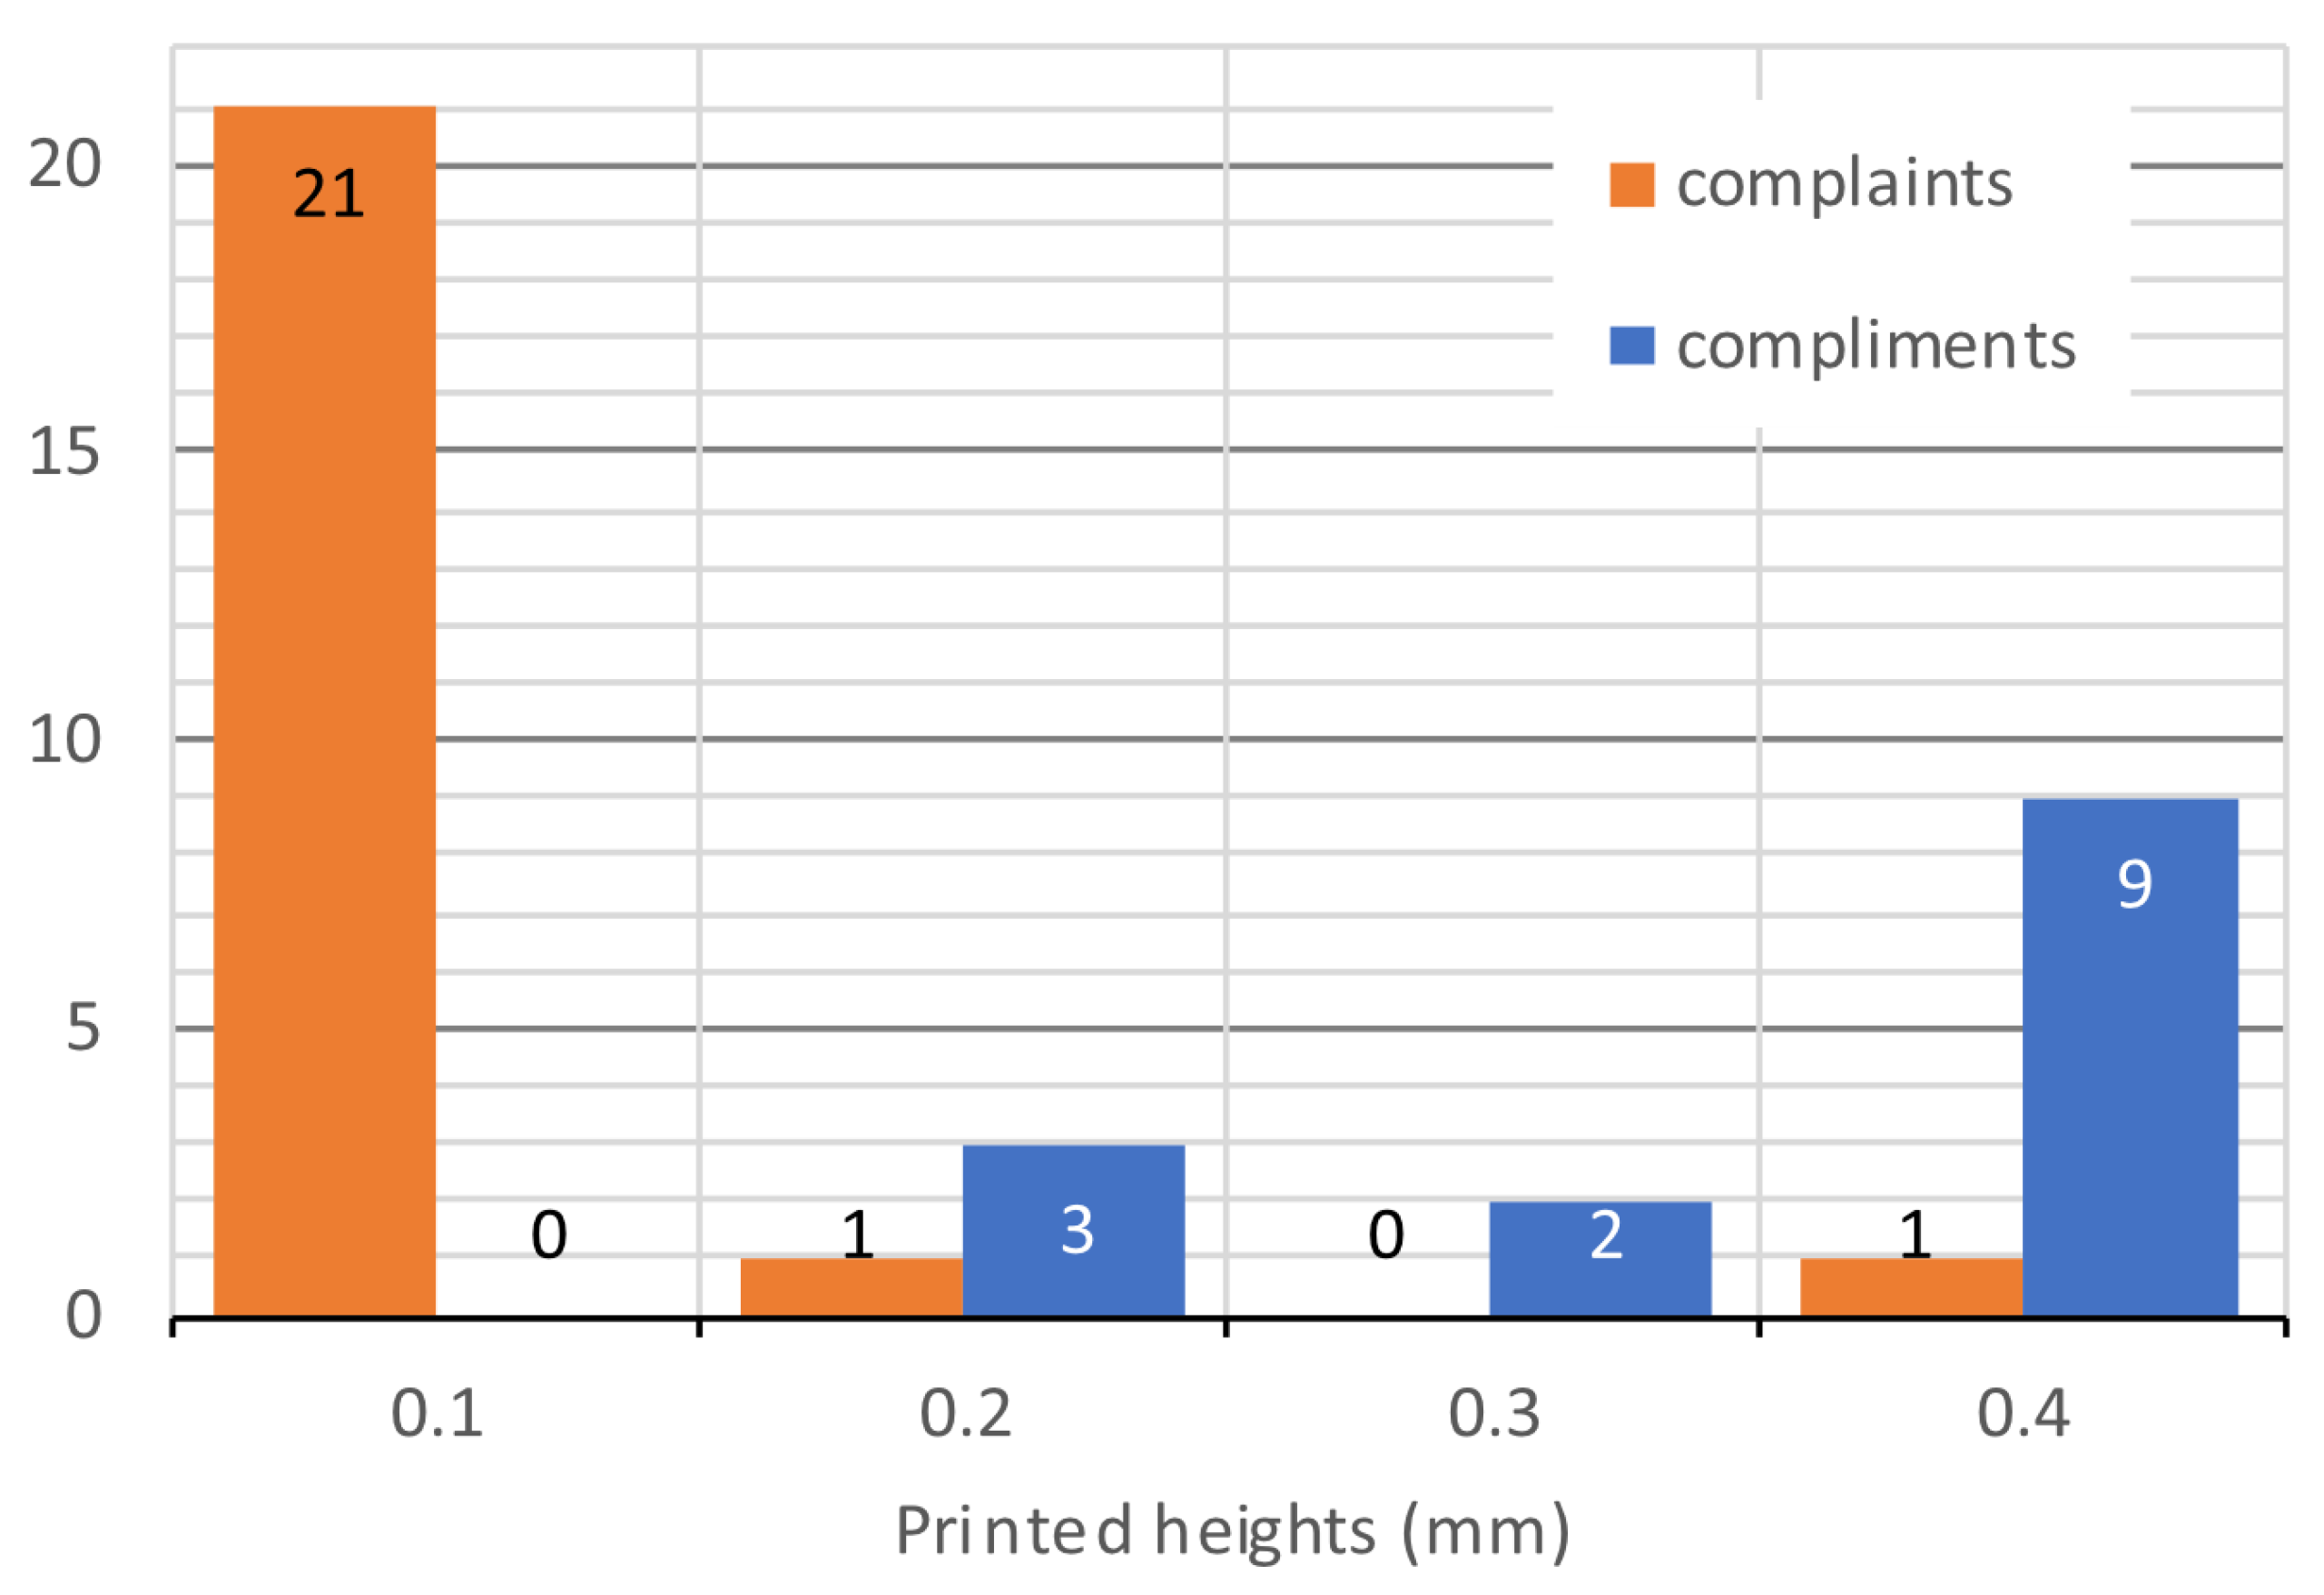
The difference in heights was the most perceived manufacturing characteristic by the participants during the tests. Most of the comments focused on the line and figure shapes and on the process itself, however, there were 38 comments oriented to print dimensions during the tests. 63.16% of these were complaints and 36.84% were compliments.
Of the complaints, 91.3% occurred under the height of 0.1 mm. Under the 0.4 mm height, the only complaint indicated a smaller contrast with the hemisphere (diameter = 6 mm). The 0.2 mm height complaint came after a 0.4 mm height test was applied.
In the compliments, the order was reversed: none for the 0.1 mm height, 21.43% for the 0.2 mm, 14.29% for 0.3 mm, and 64.29% for 0.4 mm height (
Figure 15). Of these compliments, 21.43% occurred at the test sample print height used after a 0.1 mm height sample test, and 7.14% after a 0.2 mm height sample.
4.3.1. Scanning
In this test, 192 applications were timed. Of these, 43 samples could be matched for each of the four heights by all users.
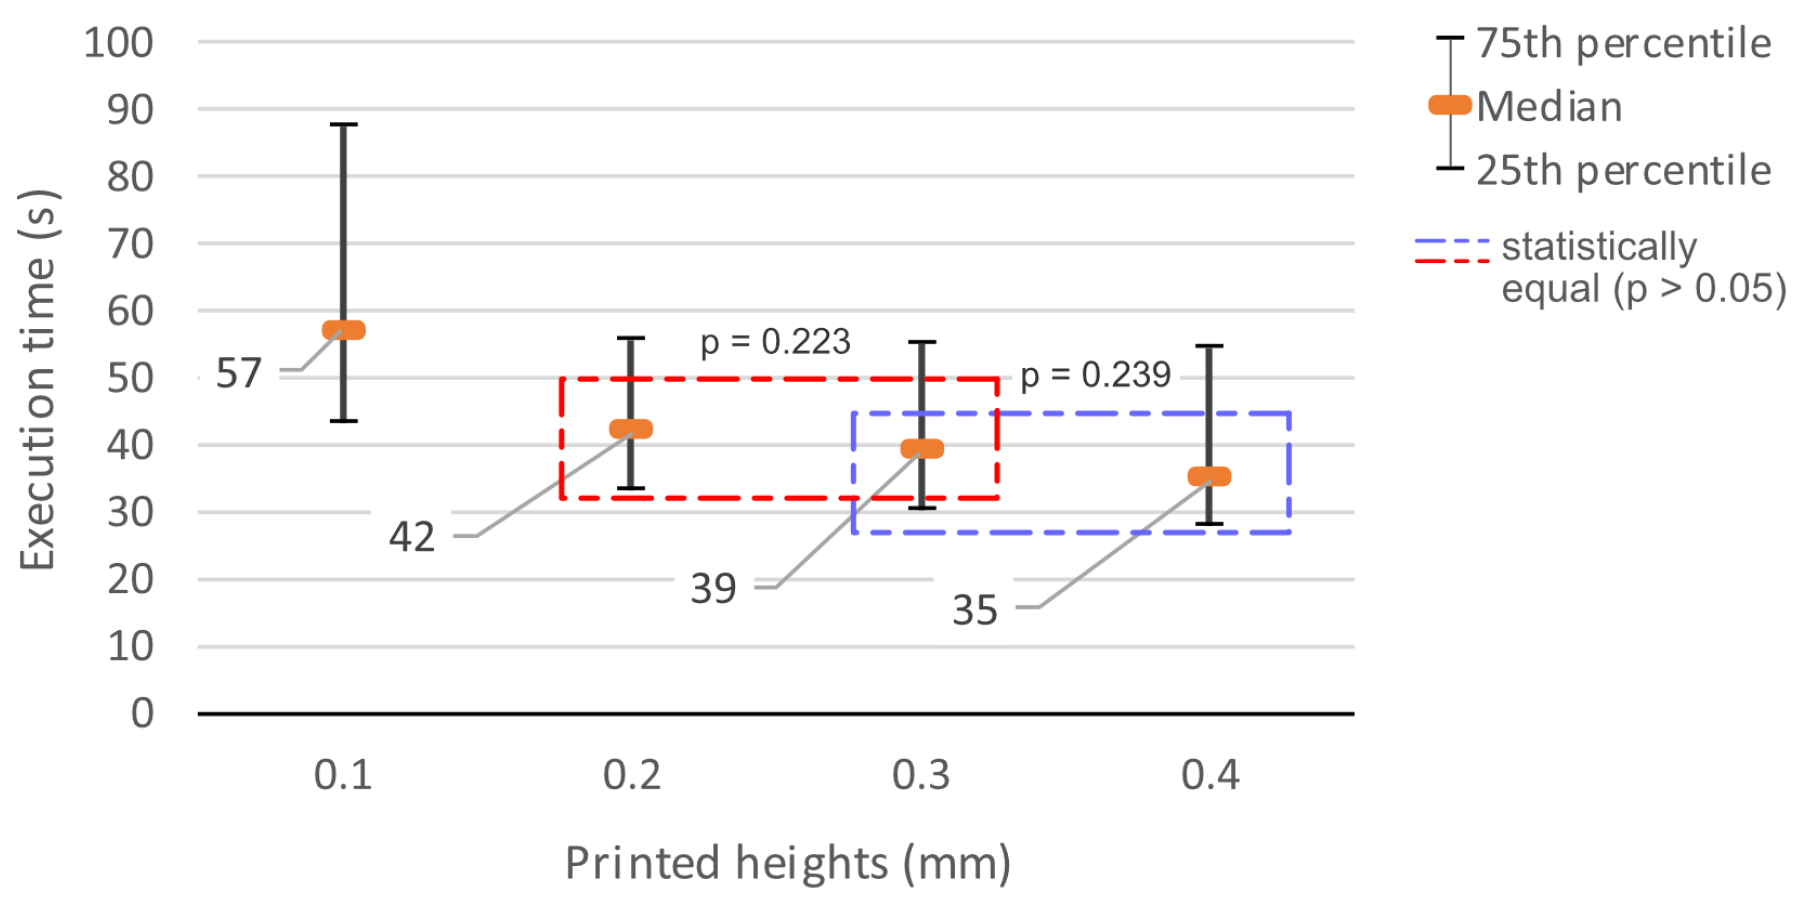
The time to complete the task reduced with height increase. The medians were 57 s, 42 s, 39 s, and 35 s for the heights of 0.1 mm, 0.2 mm, 0.3 mm, and 0.4 mm, respectively. Data dispersion also was greater at this first height, generated by the loss of the path and by rubbing the fingers at the same point on the paper to feel better or find the line (
Figure 16).
The Shapiro-Wilk test [
28] indicated that it was a non-parametric sampling (p≤0.003). The Friedman’s test application [
21] led to significant differences between the results (p<0.001). These differences were located by Conover’s post hoc test [
22], whereby the results of the 0.1 mm height stood out from the others. Statistically, there were no significant differences between the results of heights 0.2 mm and 0.3 mm (p=0.223), nor between 0.3 mm and 0.4 mm (p=0.239).
4.3.2. Picture Comprehension
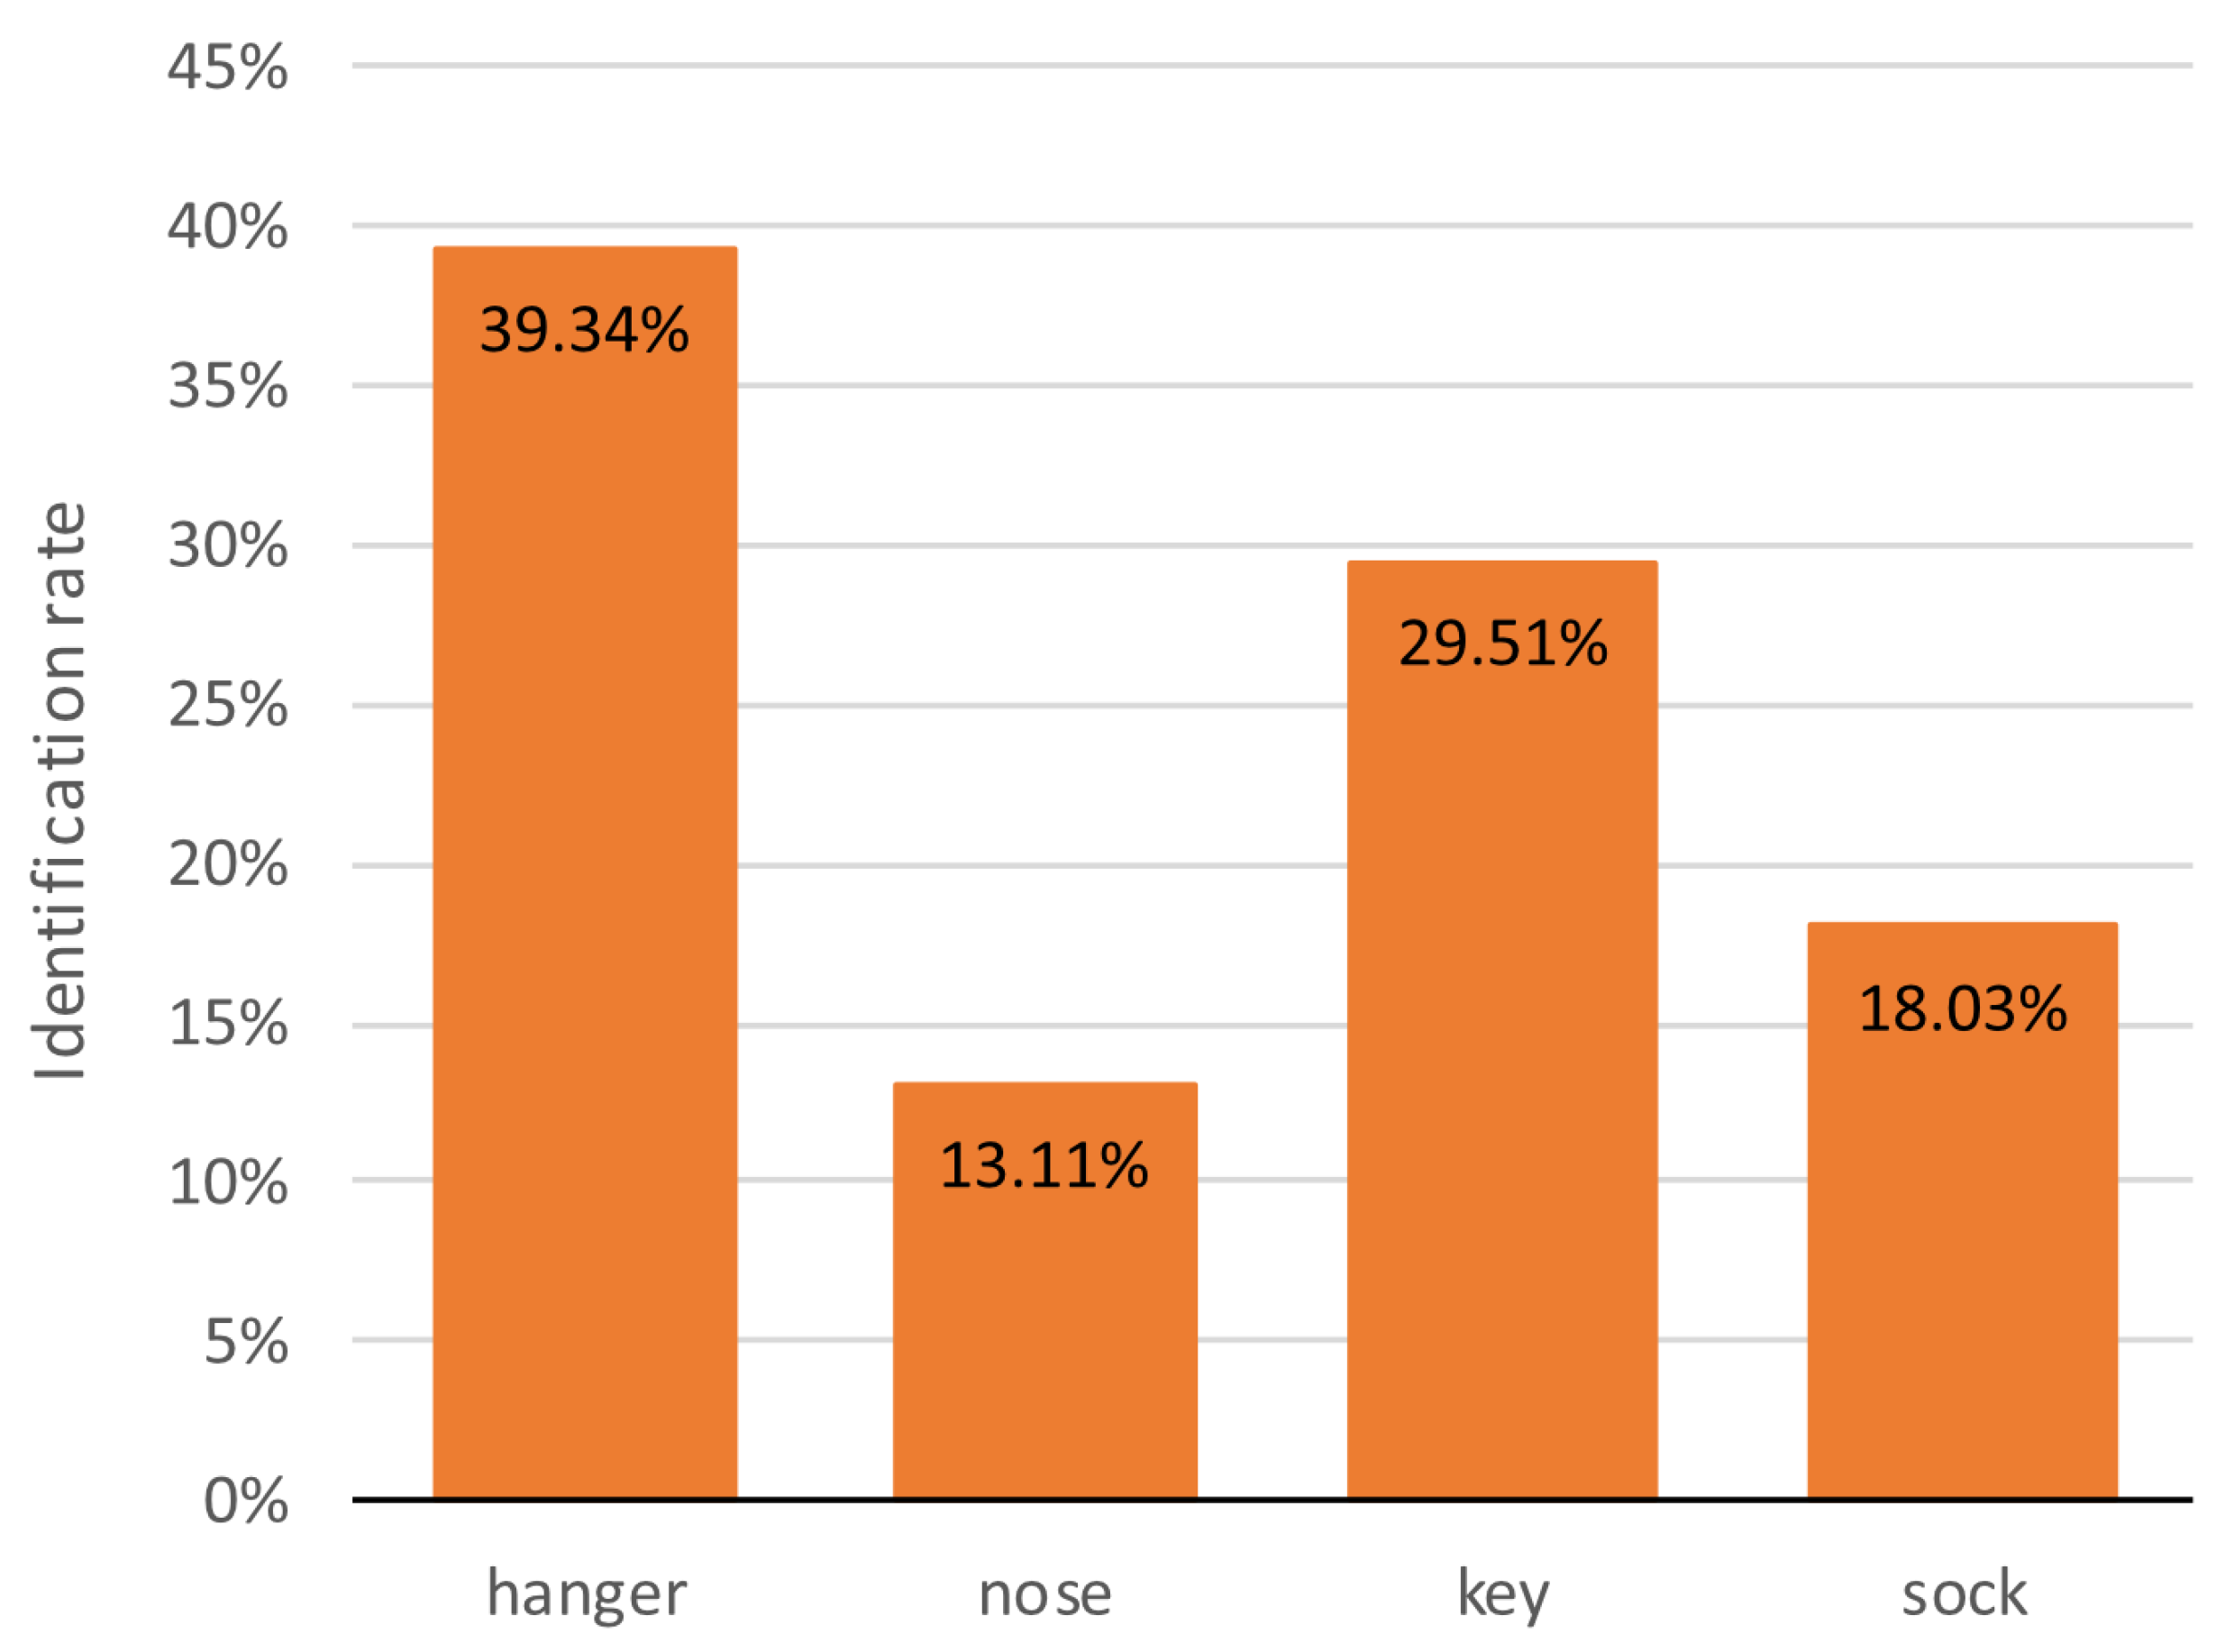
In the printed image identifications after tips had been given, 56.48% of the images were correctly identified. The hanger had 39.34% of the total, considering only the identifications. It was followed by the key (29.51%), sock (18.03%), and nose (13.11%) (
Figure 17).
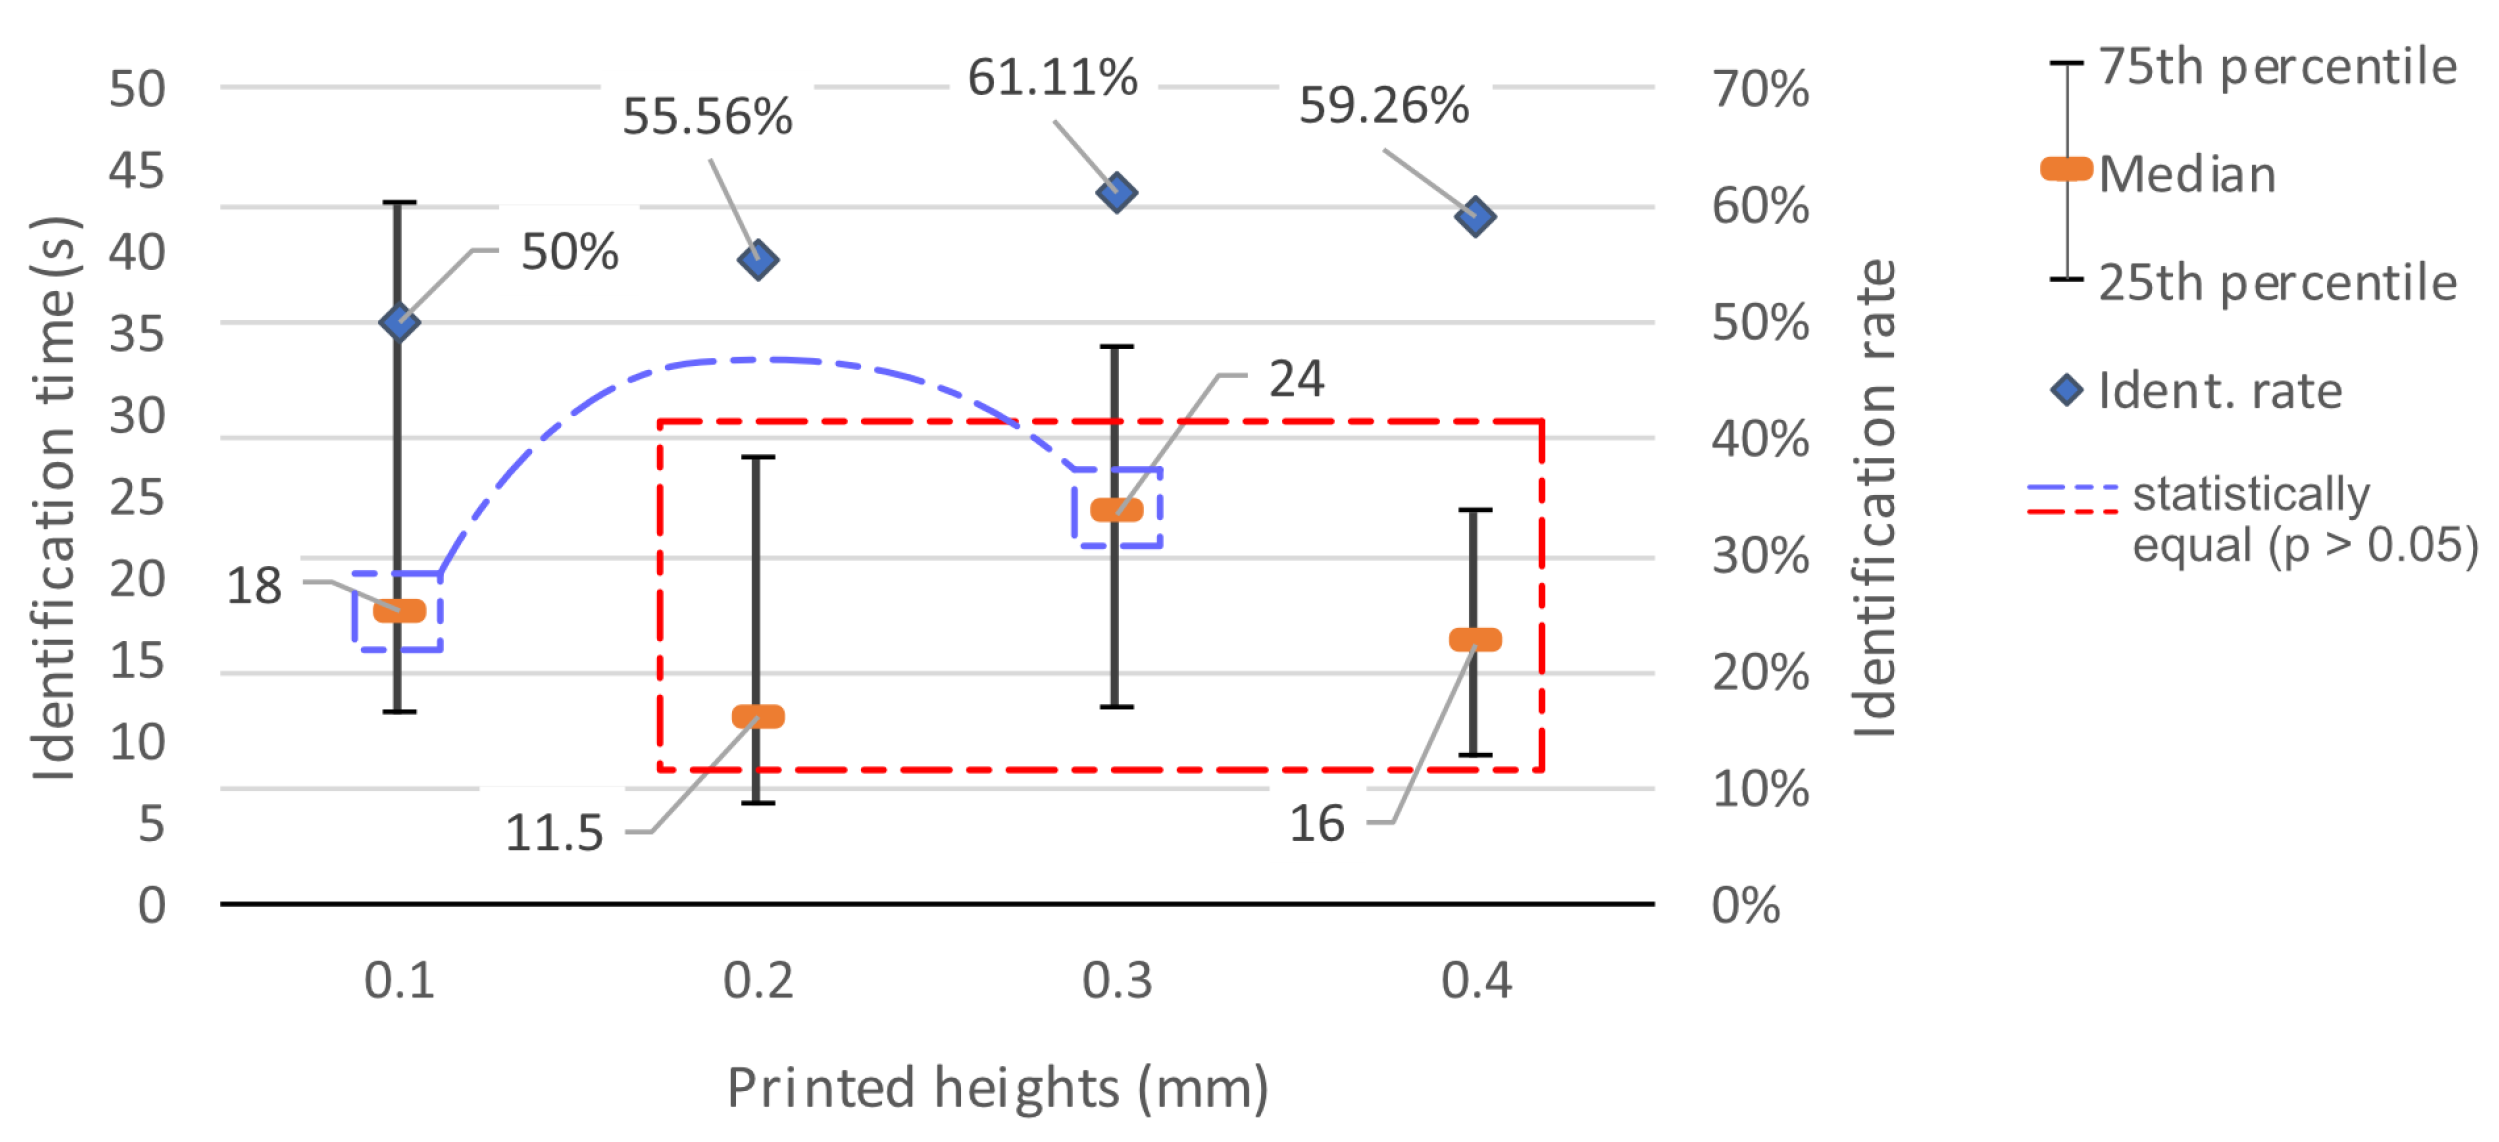
At 0.1 mm high, only half of the images were identified. This number slowly grows to 55.56% when 0.2 mm is used with the same figures, and to 61.11% when using the 0.3 mm height in the contour printing and reduces to 59.26% when using the 0.4 mm height (blue points in
Figure 18).
The times for object identification were briefer than those for exploring and discovering copies. Considering the median, in half of the attempts, the object identifications occurred within 18 seconds adopting a height of 0.1 mm. At 0.2 mm, the median time drops to 11.5 s. With 0.3 mm, the median rises to 24 s and falls back to 16 s at height 0.4 mm (orange dashes in
Figure 18). The dispersion was inversely proportional to height growth.
With the reduced number of positive identifications, the statistical analysis of the time used to identify the images counted with only 40 samples, ten per height. As they showed a non-parametric distribution in the Shapiro-Wilk’s test [
28], the Friedman’s test [
21] was used to detect the differences, and these were discriminated by the post hoc of Conover [
22]. The results showed that statistically, the equality relationships between the results of heights 0.1 mm and 0.3 mm and between 0.2 mm and 0.4 mm were strongly significant (p=0.5 and p=1, respectively), but there is also a small significance relationship of equality between the heights 0.2 mm and 0.3 mm and between 0.3 mm and 0.4 mm (p=0.099 in both).
4.3.3. Spatial Comprehension
The task of localizing identical figures using spatial comprehension grouped 216 responses, totaling 363 image copy localizations. In 9.72% of the situations, the copies were not found. In 12.5%, only one copy was found. Both identical images were found in 77.78% of attempts.
In 11.11% of the tests performed with figures printed with height 0.1 mm, the pairs were not found. This represents 57.14% of the total occurrences with no localization. In this equivalent condition, the 0.2 mm and 0.4 mm heights had 3.7% (each one) of their respective samples not situated. The 0.3 mm height had the lowest localization failure rate at 0.93%.
Applications in which only one figure was found occurred in 7.41% of the images printed in 0.1 mm; in 3.7% of applications involving figures printed in 0.2 mm; in 8.33% of those of 0.3 mm and in 5.56% of those with 0.4 mm.
For the two copies localization, the results were similar to each other, except for the height of 0.1 mm, under which it occurred in 62.96% of the applications. The localization occurred in 85.19% of the tests conducted with a height of 0.2 mm; and in 81.48% of those carried both with heights 0.3 mm and 0.4 mm.
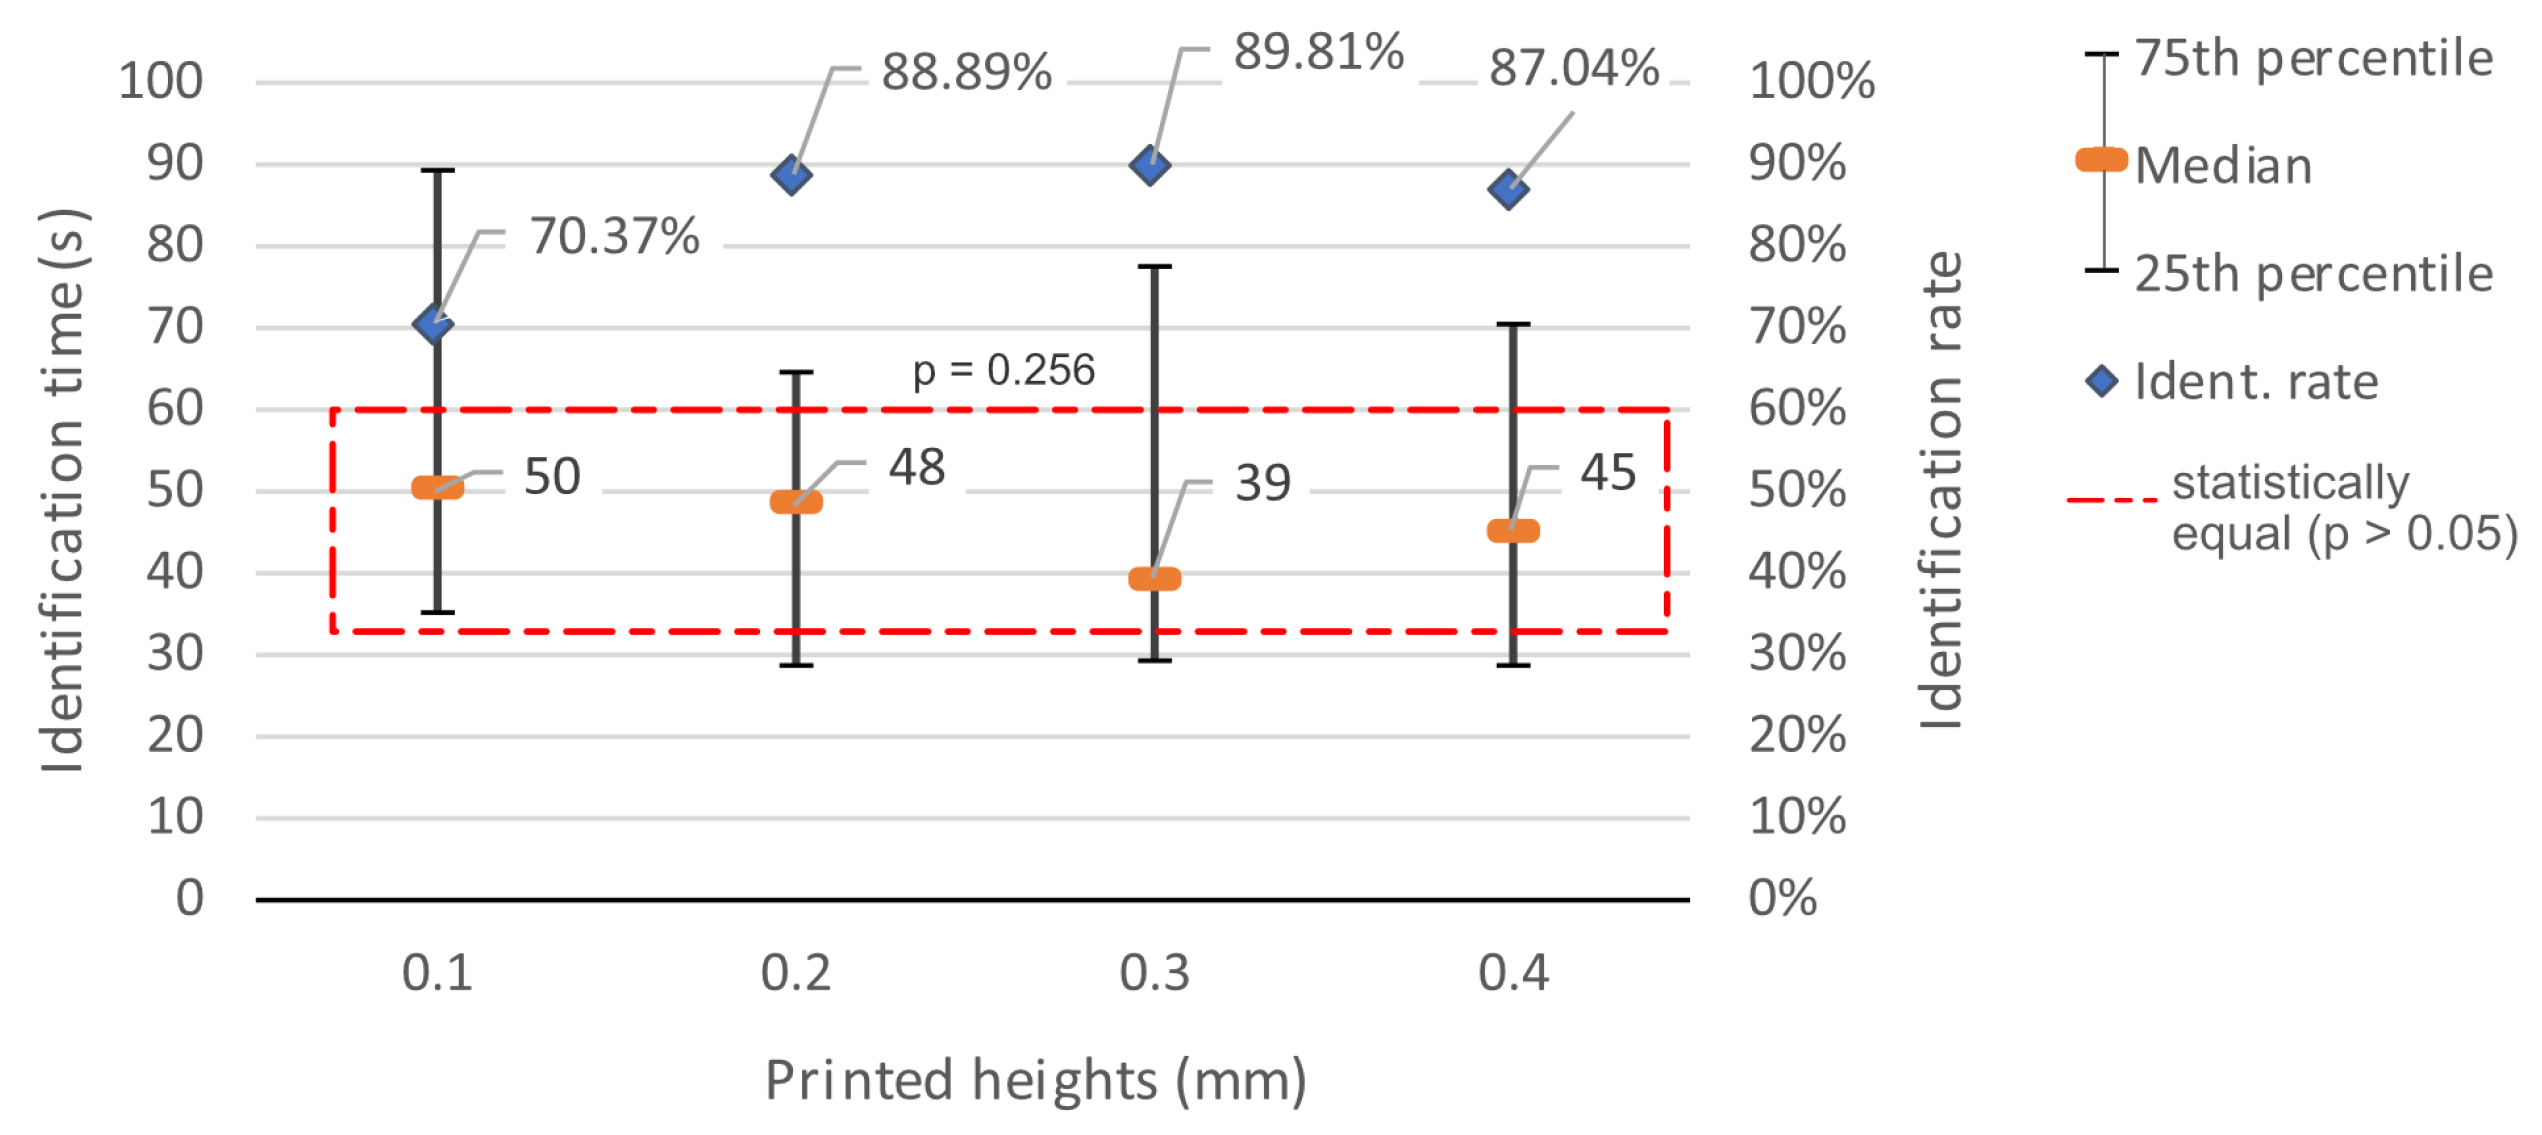
Adding up all the localizations (one and two copies), 70.37% of the figures, when printed with a height of 0.1 mm, were located. Using 0.2 mm and 0.3 mm, this number grows to 88.89% and 89.81%. With 0.4 mm, the rate was 87.04% (
Figure 19, blue points).
Considering the time used for the positive localization of each figure, the results show that the identification rate is lower than the copy localization rate at all printed heights, including situations in which the copy was of an object that was not previously identified.
They also were closer to each other. The highest median, 50 s, came from the lowest printed height, 0.1 mm. From then on, the medians decrease: 48 s in the height 0.2, and 39 s with 0.3; then the time increased to 45 s in the height 0.4 mm (
Figure 19, orange dashes).
With the Shapiro-Wilk’s test [
28] revealing that it was a non-parametric sample (p<0.001), the Friedman’s test [
21] performed on the 172 positive identifications revealed that these numbers do not represent significant differences between the result times for the pairs’ localizations at different heights (p=256).
4.4. Printed Widths
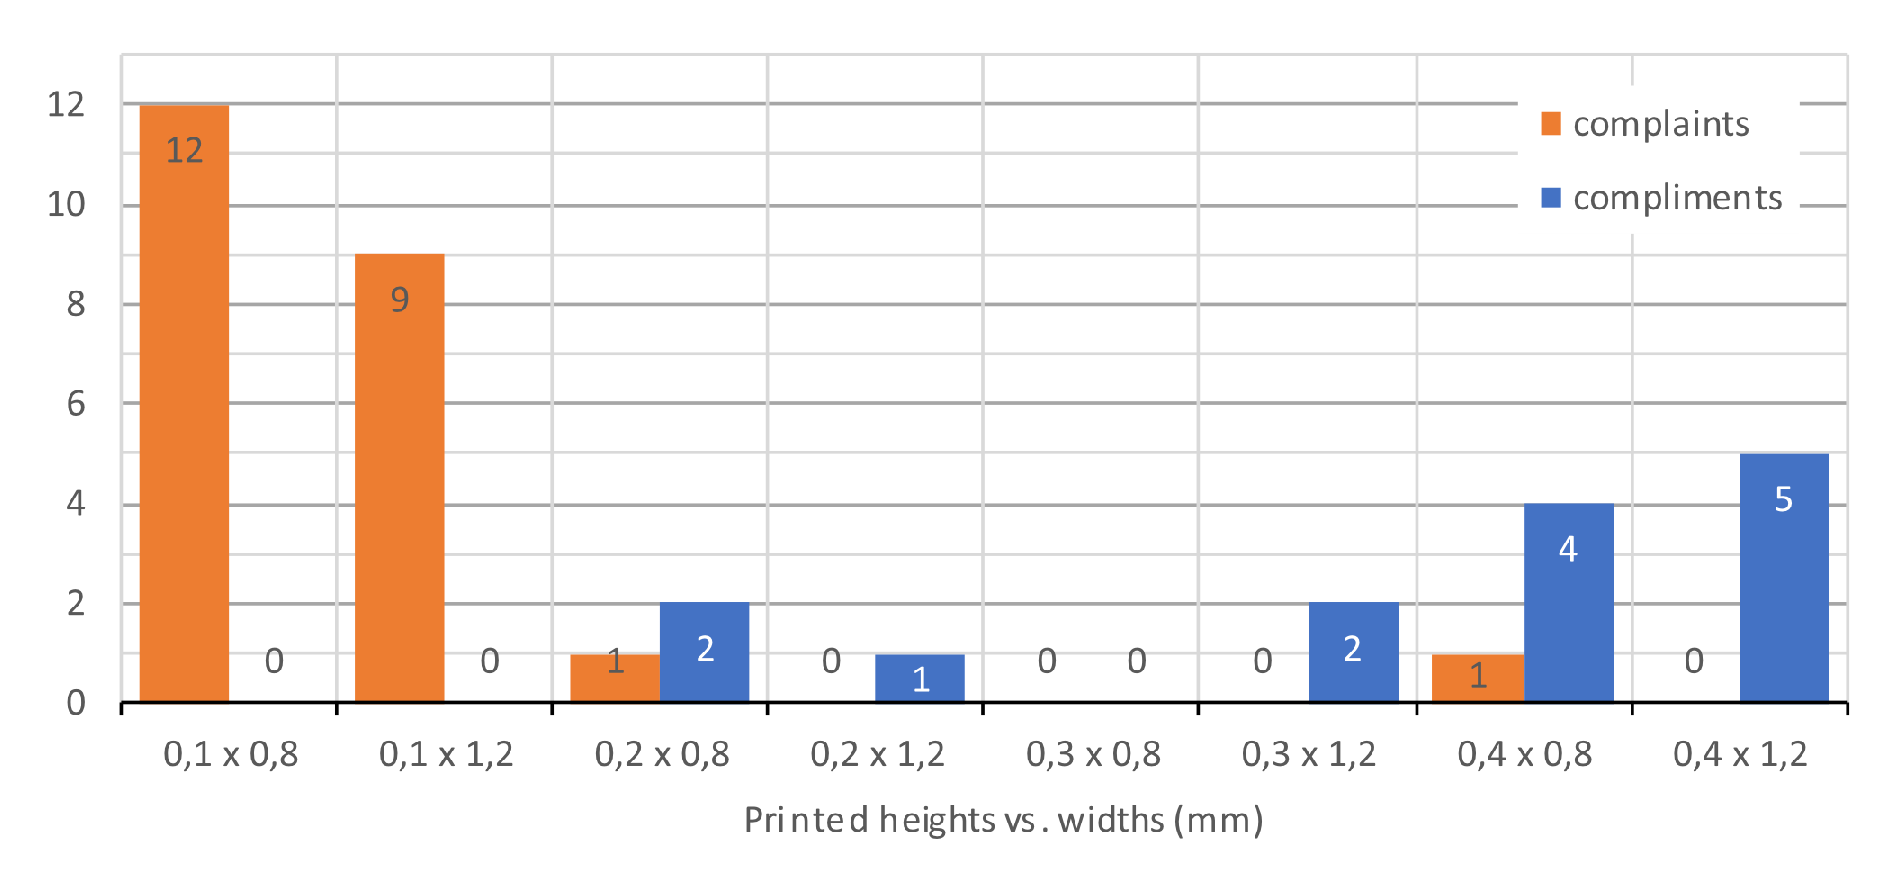
Crossing the height information with the width information on the 38 participants’ comments, it was possible to see that, under the same height, the complaints were greater in tests using the 0.8 mm print width, except for the 0.3 mm height, where there were no complaints.
Praise was more frequent on the width 1.2 mm width when it joined the two biggest heights. At the 0.1 mm height, they did not happen, and the 0.2 mm received more praise when combined with the width 0.8 mm width (
Figure 20).
4.4.1. Scanning
Considering widths, the 192 samples were divided into two groups of 96 for each dimension in this line-follow test.
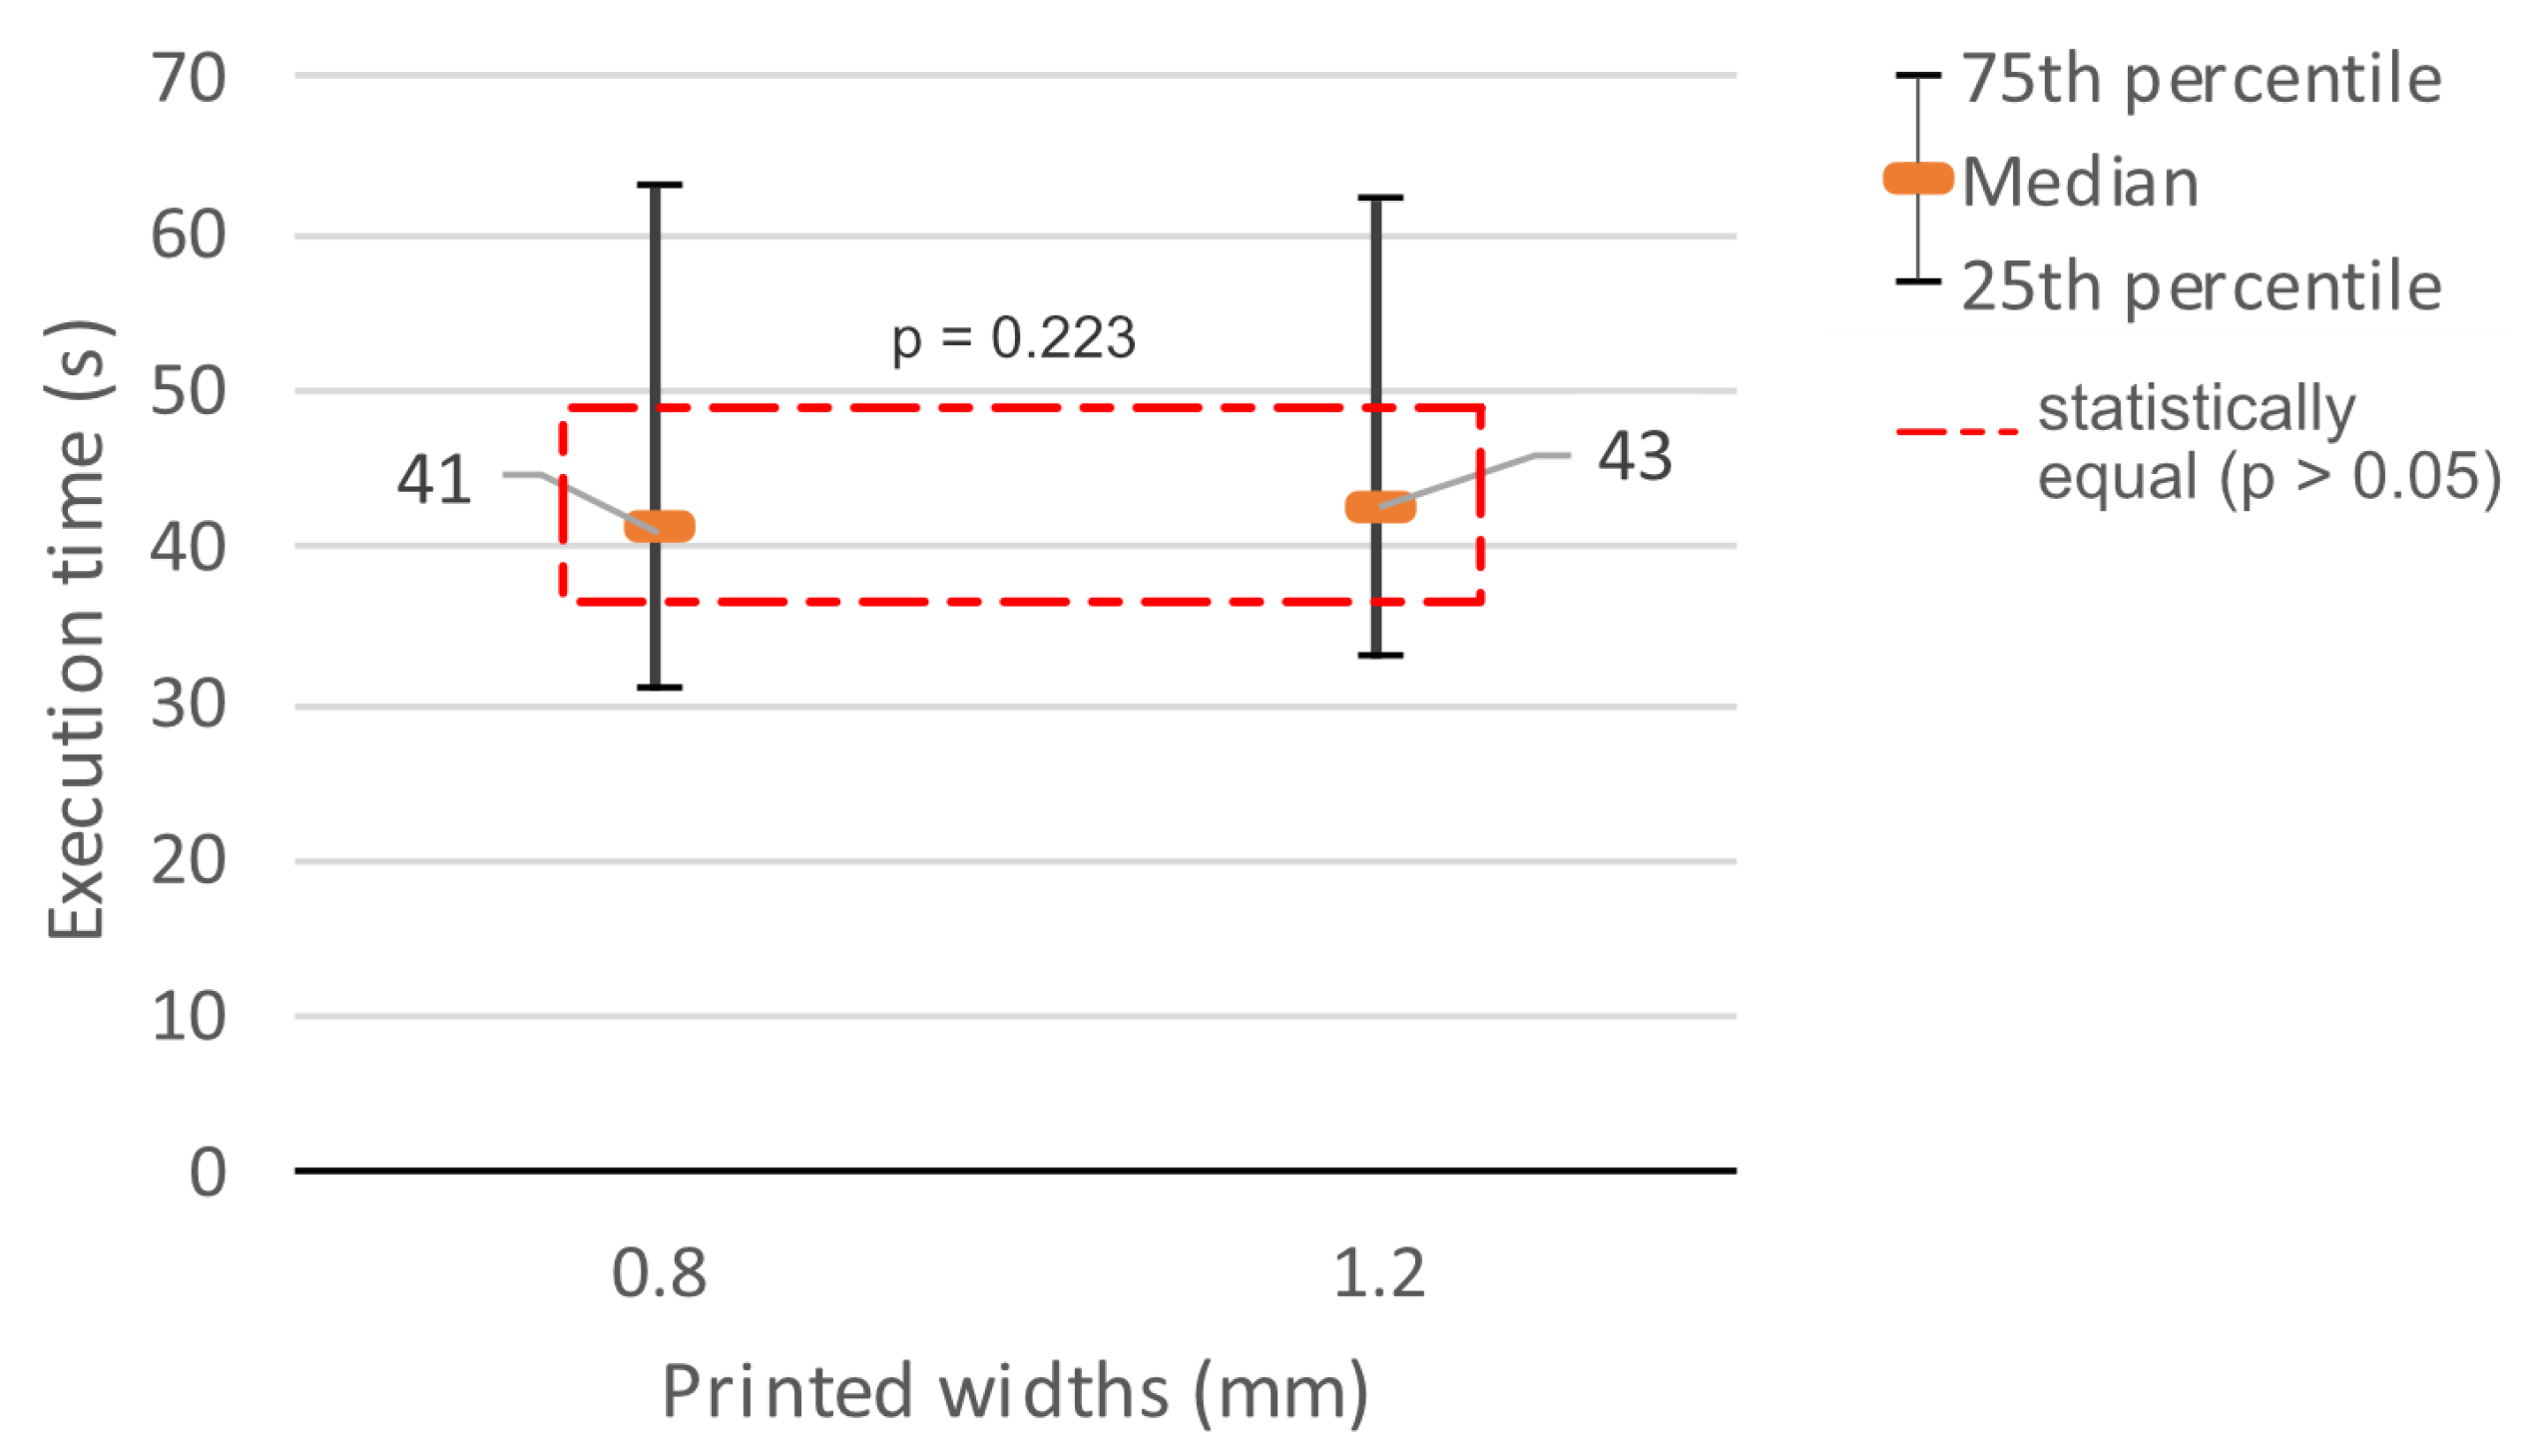
There was a proximity in the results with a slight gain in time for the 0.8 mm width, in which a median of 41 s was obtained against 42.5 s using the 1.2 mm width (
Figure 21).
The Shapiro-Wilk’s test [
28] resulted in a non-parametric sample, leading to the Wilcoxon’s test [
20] for paired pairs of variables. It was concluded that this difference between the samples with 0.8 mm and those with 1.2 mm was not significant (N=192, p=0.224).
4.4.2. Picture Comprehension
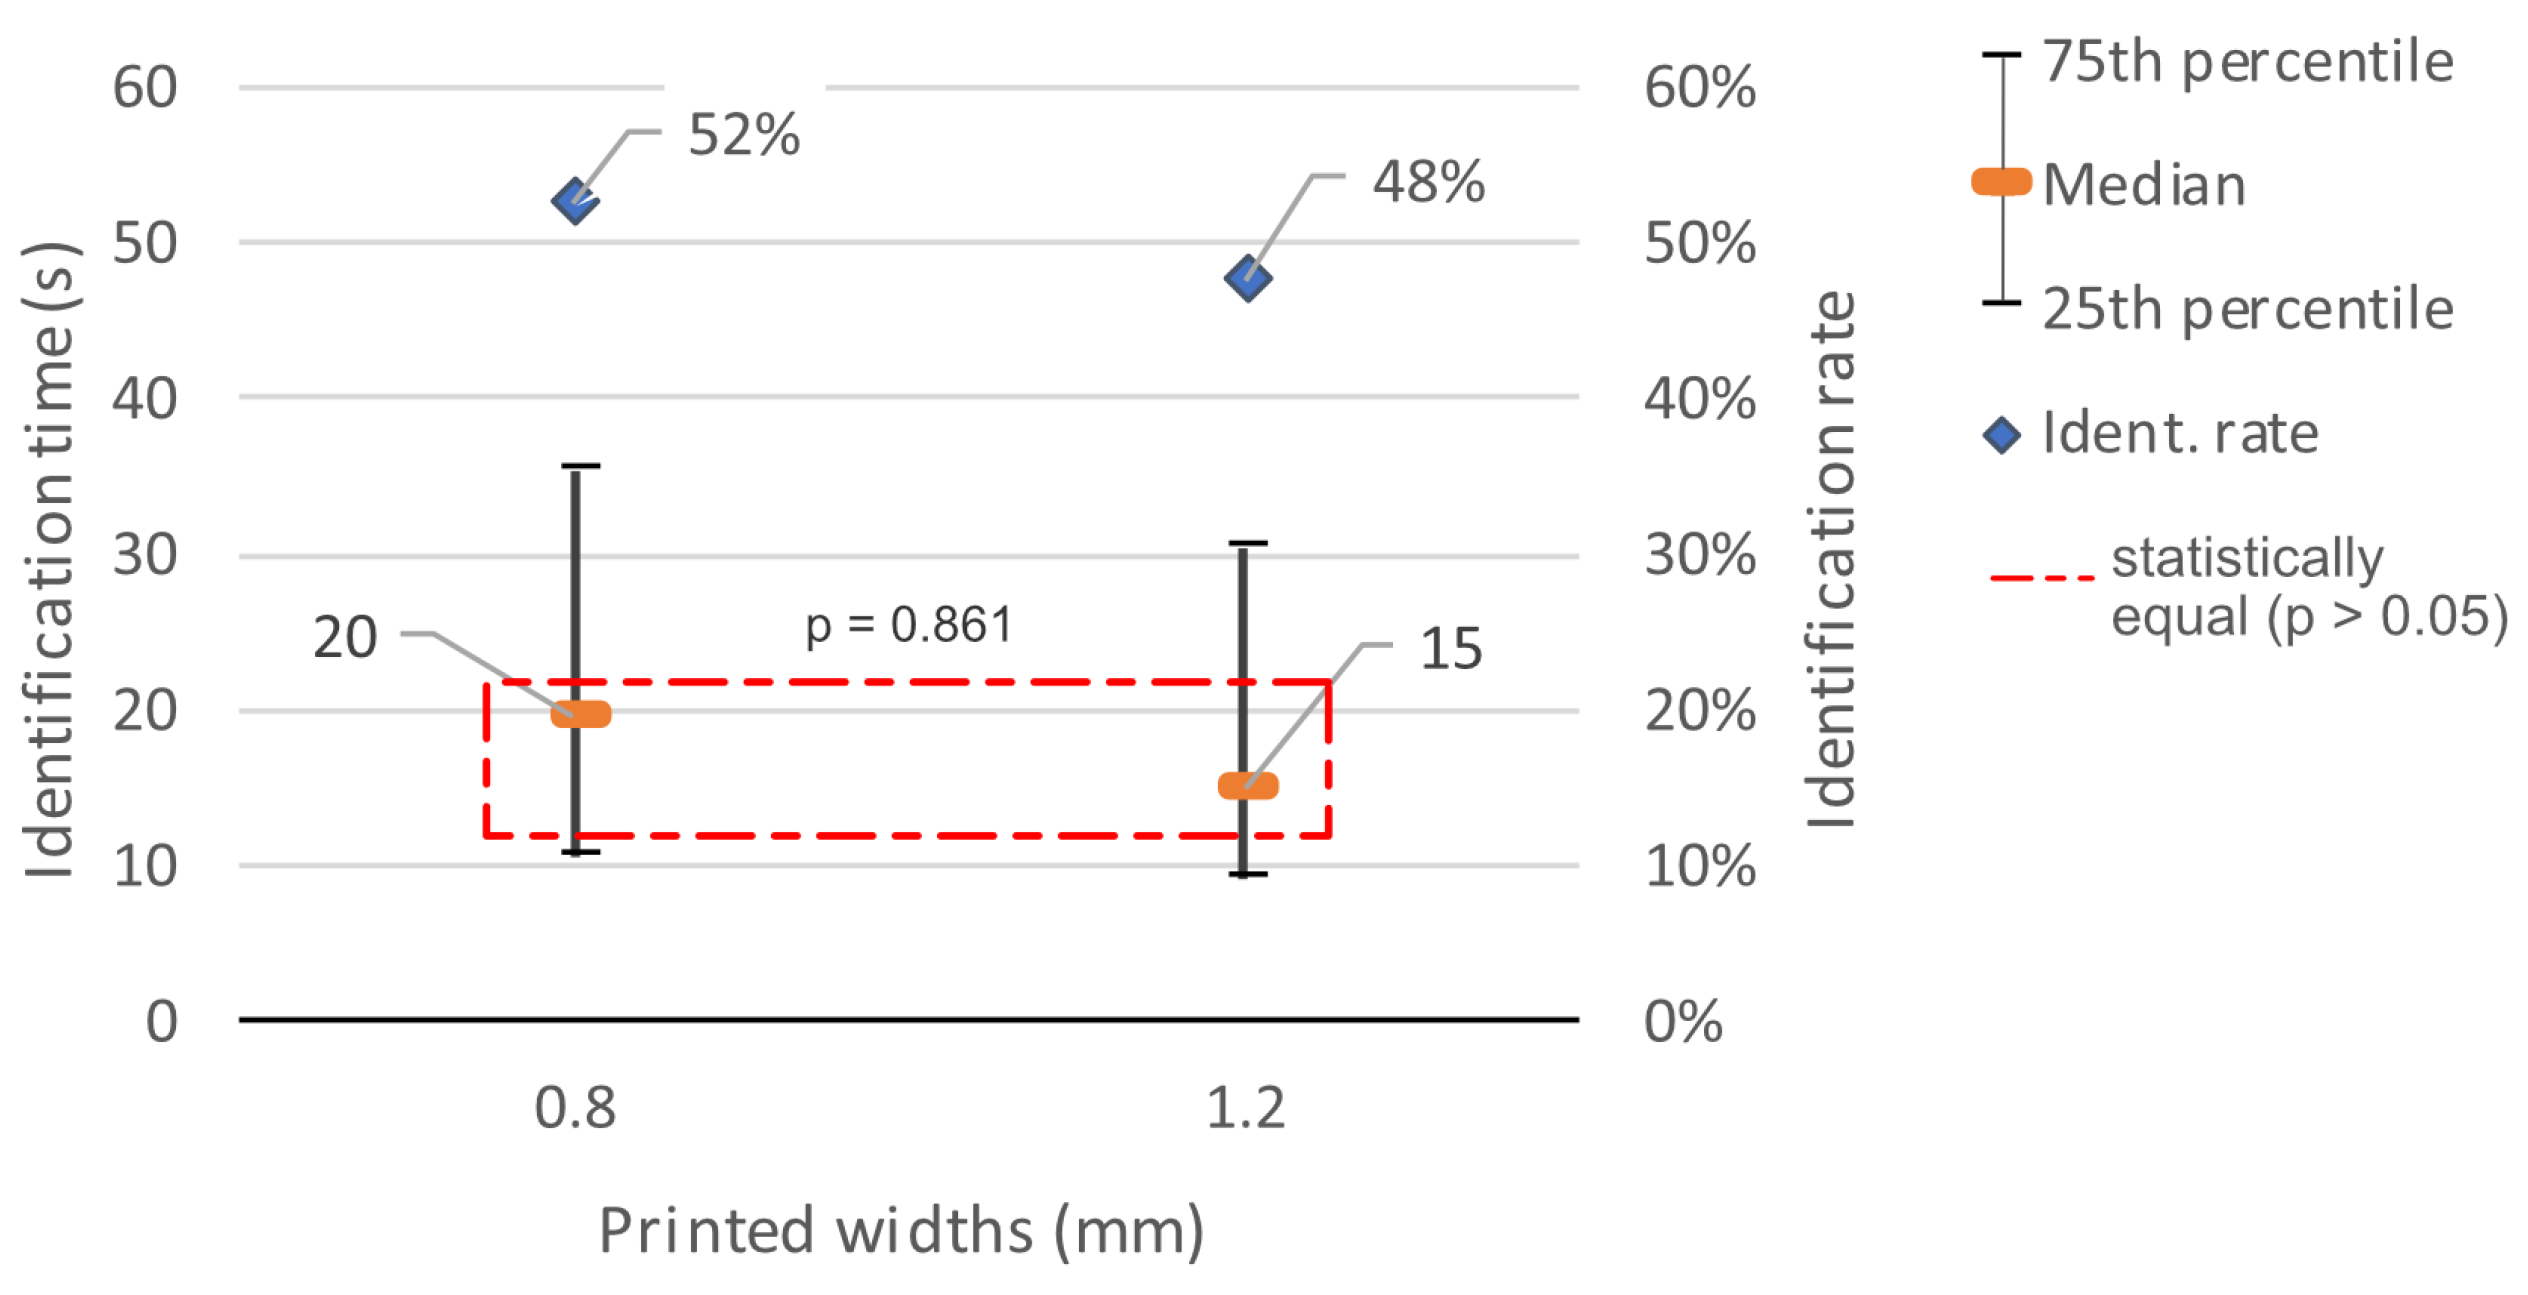
Considering the 216 attempts to identify the objects represented in the printed figures, success occurred in only 56.48% of applications. There were 59.26% with width 0.8 mm and 53.7% with width 1.2 mm.
Those printed with width 1.2 mm were identified faster. 50% of the 58 recognitions were up to 15 seconds against up to 19.5 seconds in the fastest half of the 64 identifications that occurred under the width 0.8 mm (
Figure 22).
The Shapiro-Wilk’s test [
28] determined that it was a non-parametric sampling (p<0.001). With the non-recognition of objects occurring in various applications, only 56 pairing of identification time samples under the same configurations could be grouped at width 0.8 mm and 52 in width 1.2 mm for the Wilcoxon’s test [
20]. Its application pointed out that there are no significant differences between the results of recognition times (p=0.861).
4.4.3. Spatial Comprehension
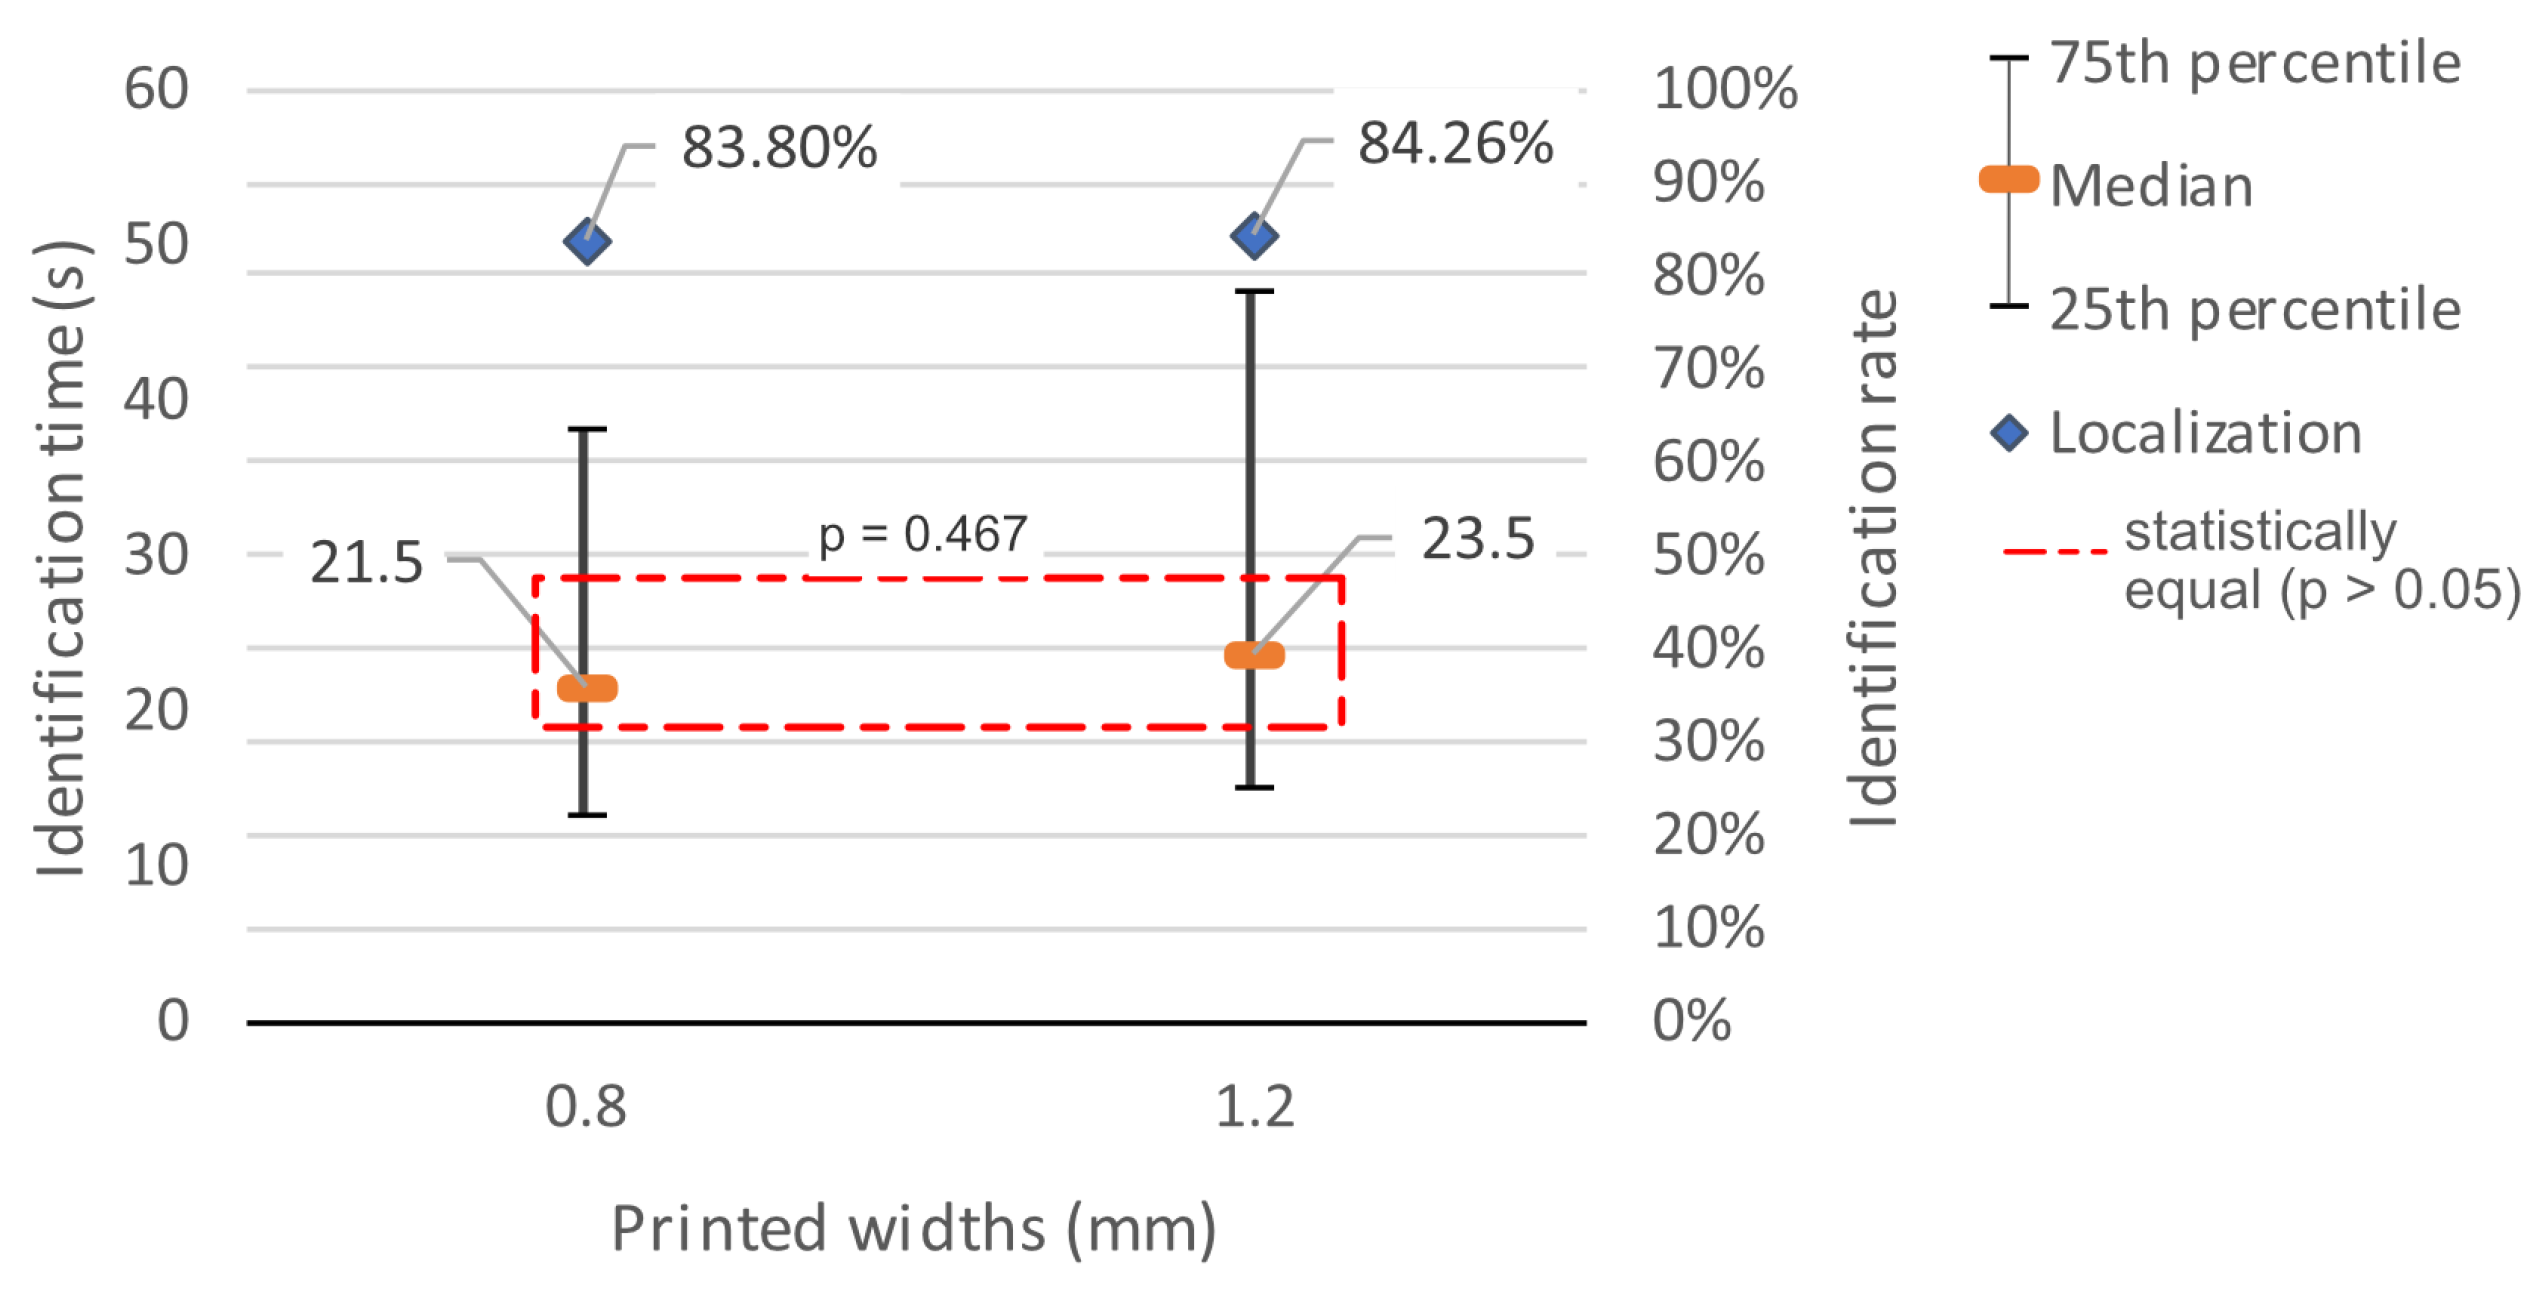
In this test, the 216 answers were divided into 108 responses for each contour width in the search for figure copies. Of this number, 9.26% of the copies were not found when printed at the width 0.8 mm. In the width 1.2 mm, the number rose to 10.19%. With 0.8 mm, the remaining 90.74% were divided into 13.89% of occurrences locating only one copy and 76.85% finding both. In width 1.2 mm, these numbers went 11.11% and 78.7%, respectively. The total locations of each copy reached 83.8% at the width 0.8 mm and 84.26% when 1.2 mm was analyzed (
Figure 23, blue points).
On the time required to find the copies, it was found that it was slightly lower when the width 0.8 mm was used: medians 21.5 s against 23.5 s (
Figure 23, orange dashes).
The Shapiro-Wilk’s test [
28] presented p<0.001 for both widths and Wilcoxon’s test [
20] on times for positive copy location confirmed that these small differences are not statistically significant (n=194, p=0.467).
4.5. Density of Printed Textures
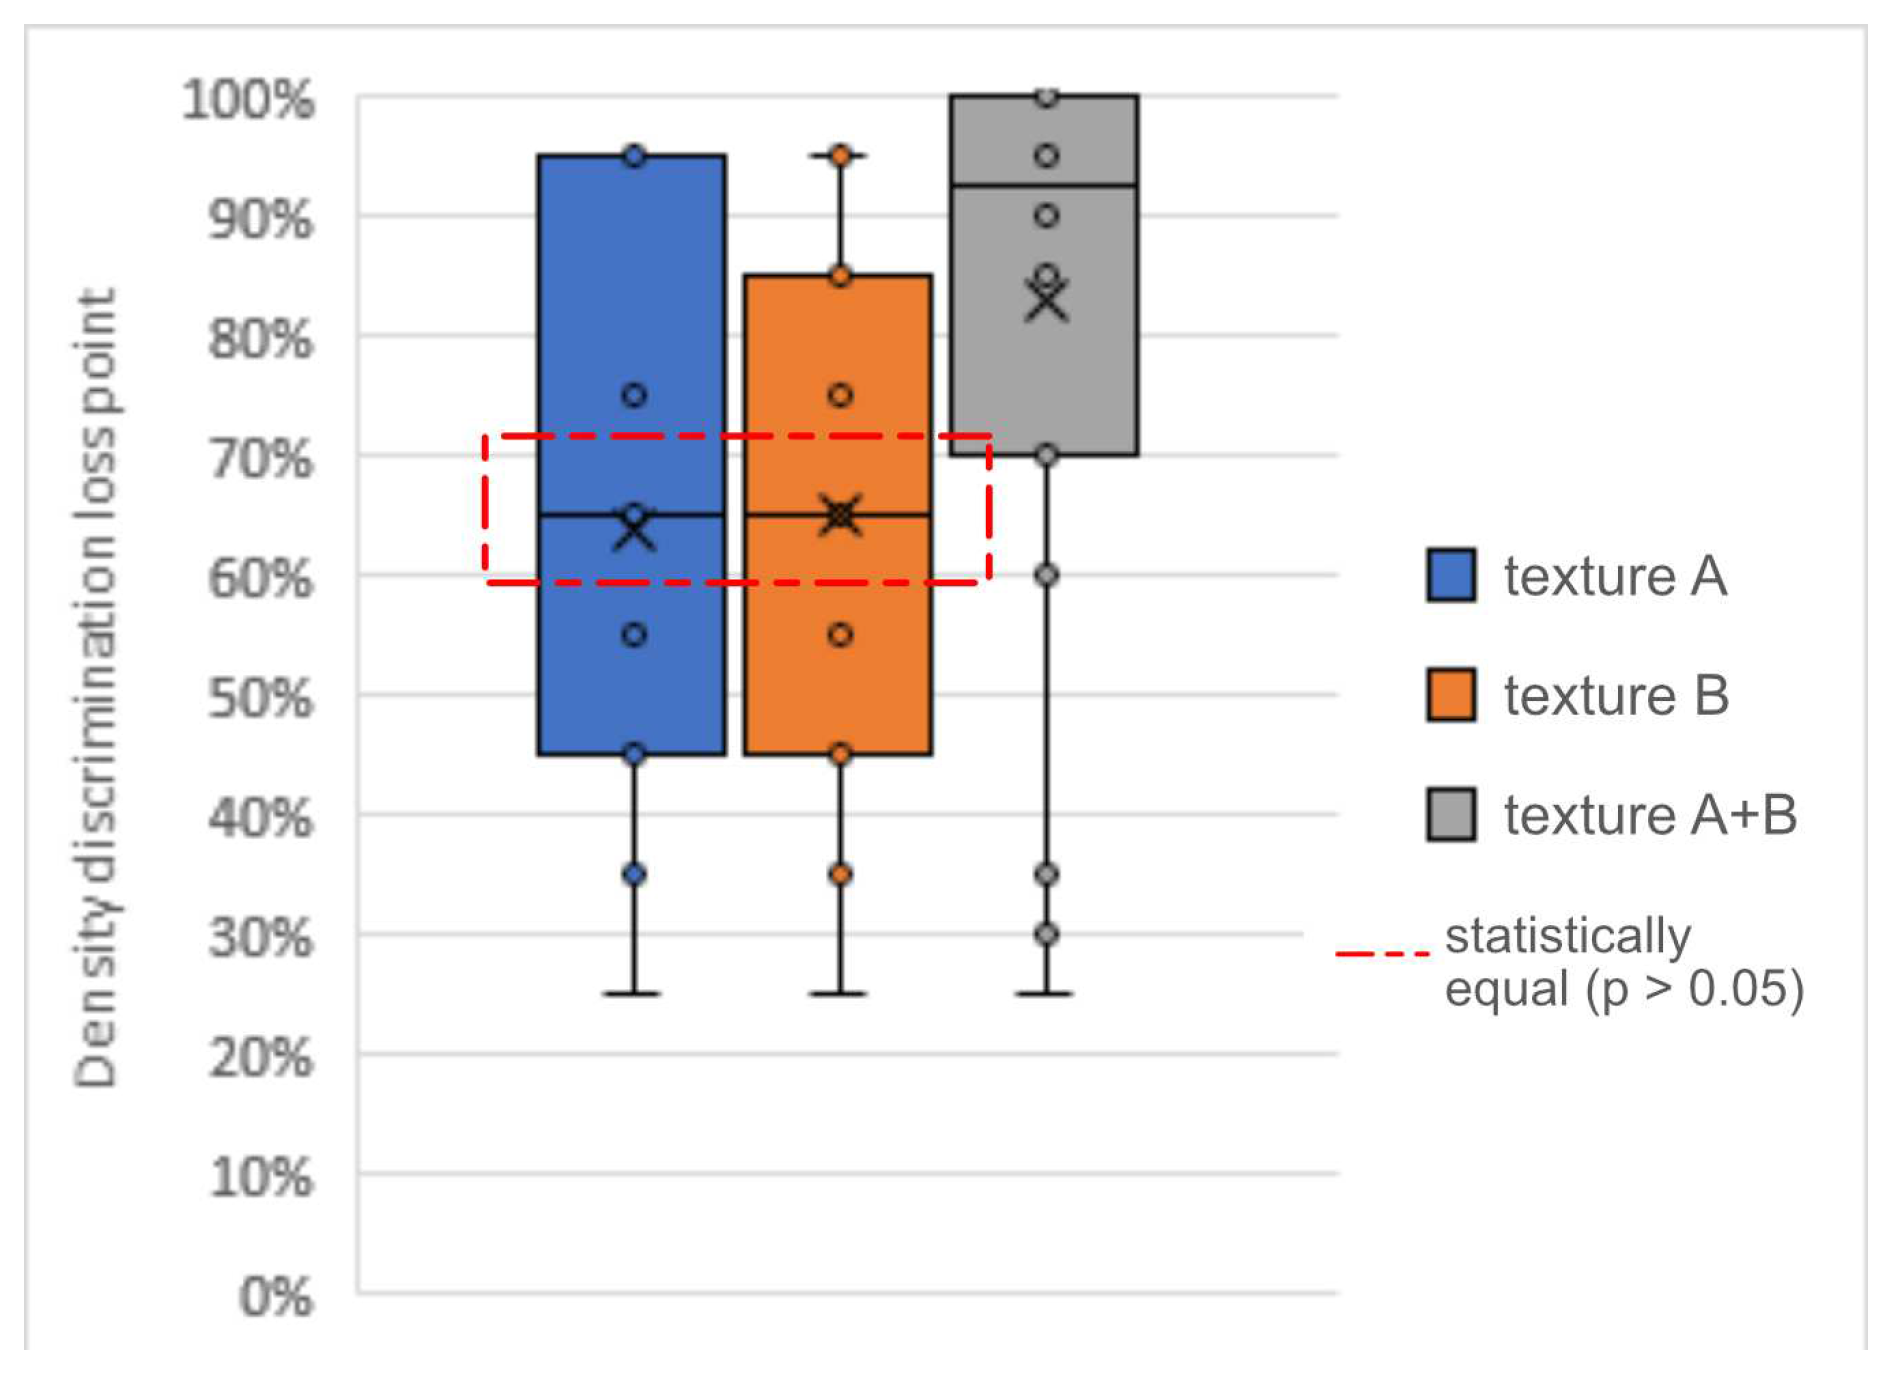
This test totaled 28 responses for each texture range. It was noticed that the use of different textures in the same object expanded the ability to discriminate them.
Using the Aligned Rectilinear pattern (A) (parallel lines at 45°), half of the volunteers reported feeling differences between two fill densities distant by 10% until they reached the existing variation between the 60% and 70% density rectangles. However, 25% of volunteers were able to distinguish all variations between 10% and 100% filling (75th percentile). Another 25% could distinguish up to the point 40%-50% of densities difference (25th percentile).
With texture B, the Hilbert Curve (the maze-resemble pattern), the results show that the median point of responses falls on the same density position: 60%-70%. The 25th percentile was also the same: 40%-50%. However, they were a little more concentrated toward high densities with 25% of participants detecting differences above the 80%-90% transition (75th percentile).
With the combined textures in the third lane, the median for the difference perception rose to the transition point between the two textures at 90% and the 90%-100% density transition. 25% reached the texture transition inside the 70% density rectangle (25th percentile). Among the finer distinctions, 25% pointed no differences between the textures even at 100% density (
Figure 24).
Friedman’s test [
21] indicated differences between the results (N=84, p=0.011) and Conover’s post hoc test [
22] indicated that they focused on the relationship between the third range of rectangles and the others (p= 0.011) while the first two textures showed to be statistically identical results (p=1).
4.6. Other Results
This topic addresses the influence of visual conditions, vision loss moment, schooling, and element repetition in the task execution time.
4.6.1. Vision Condition
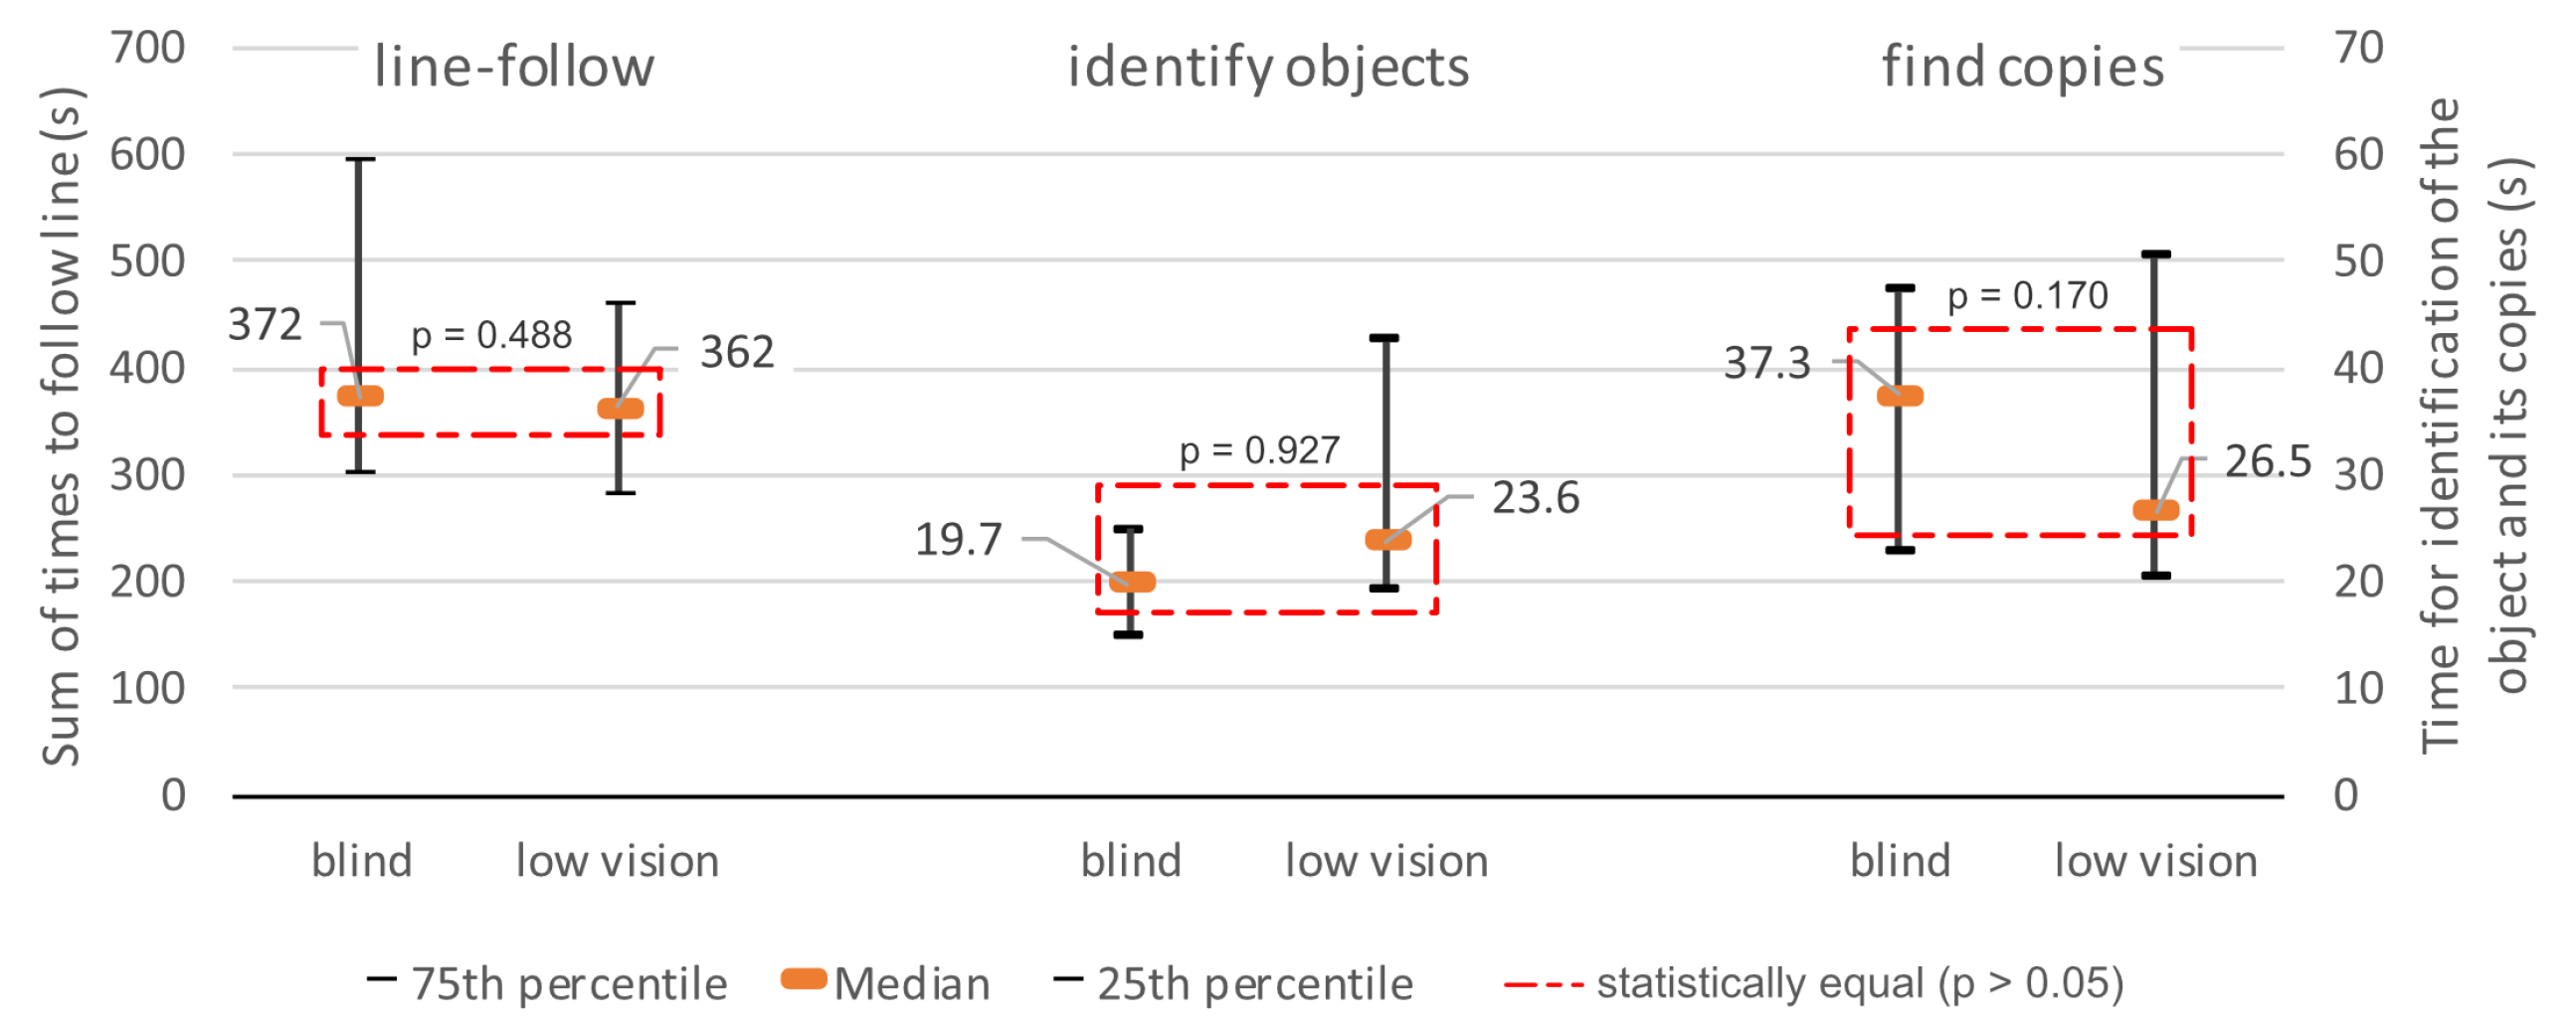
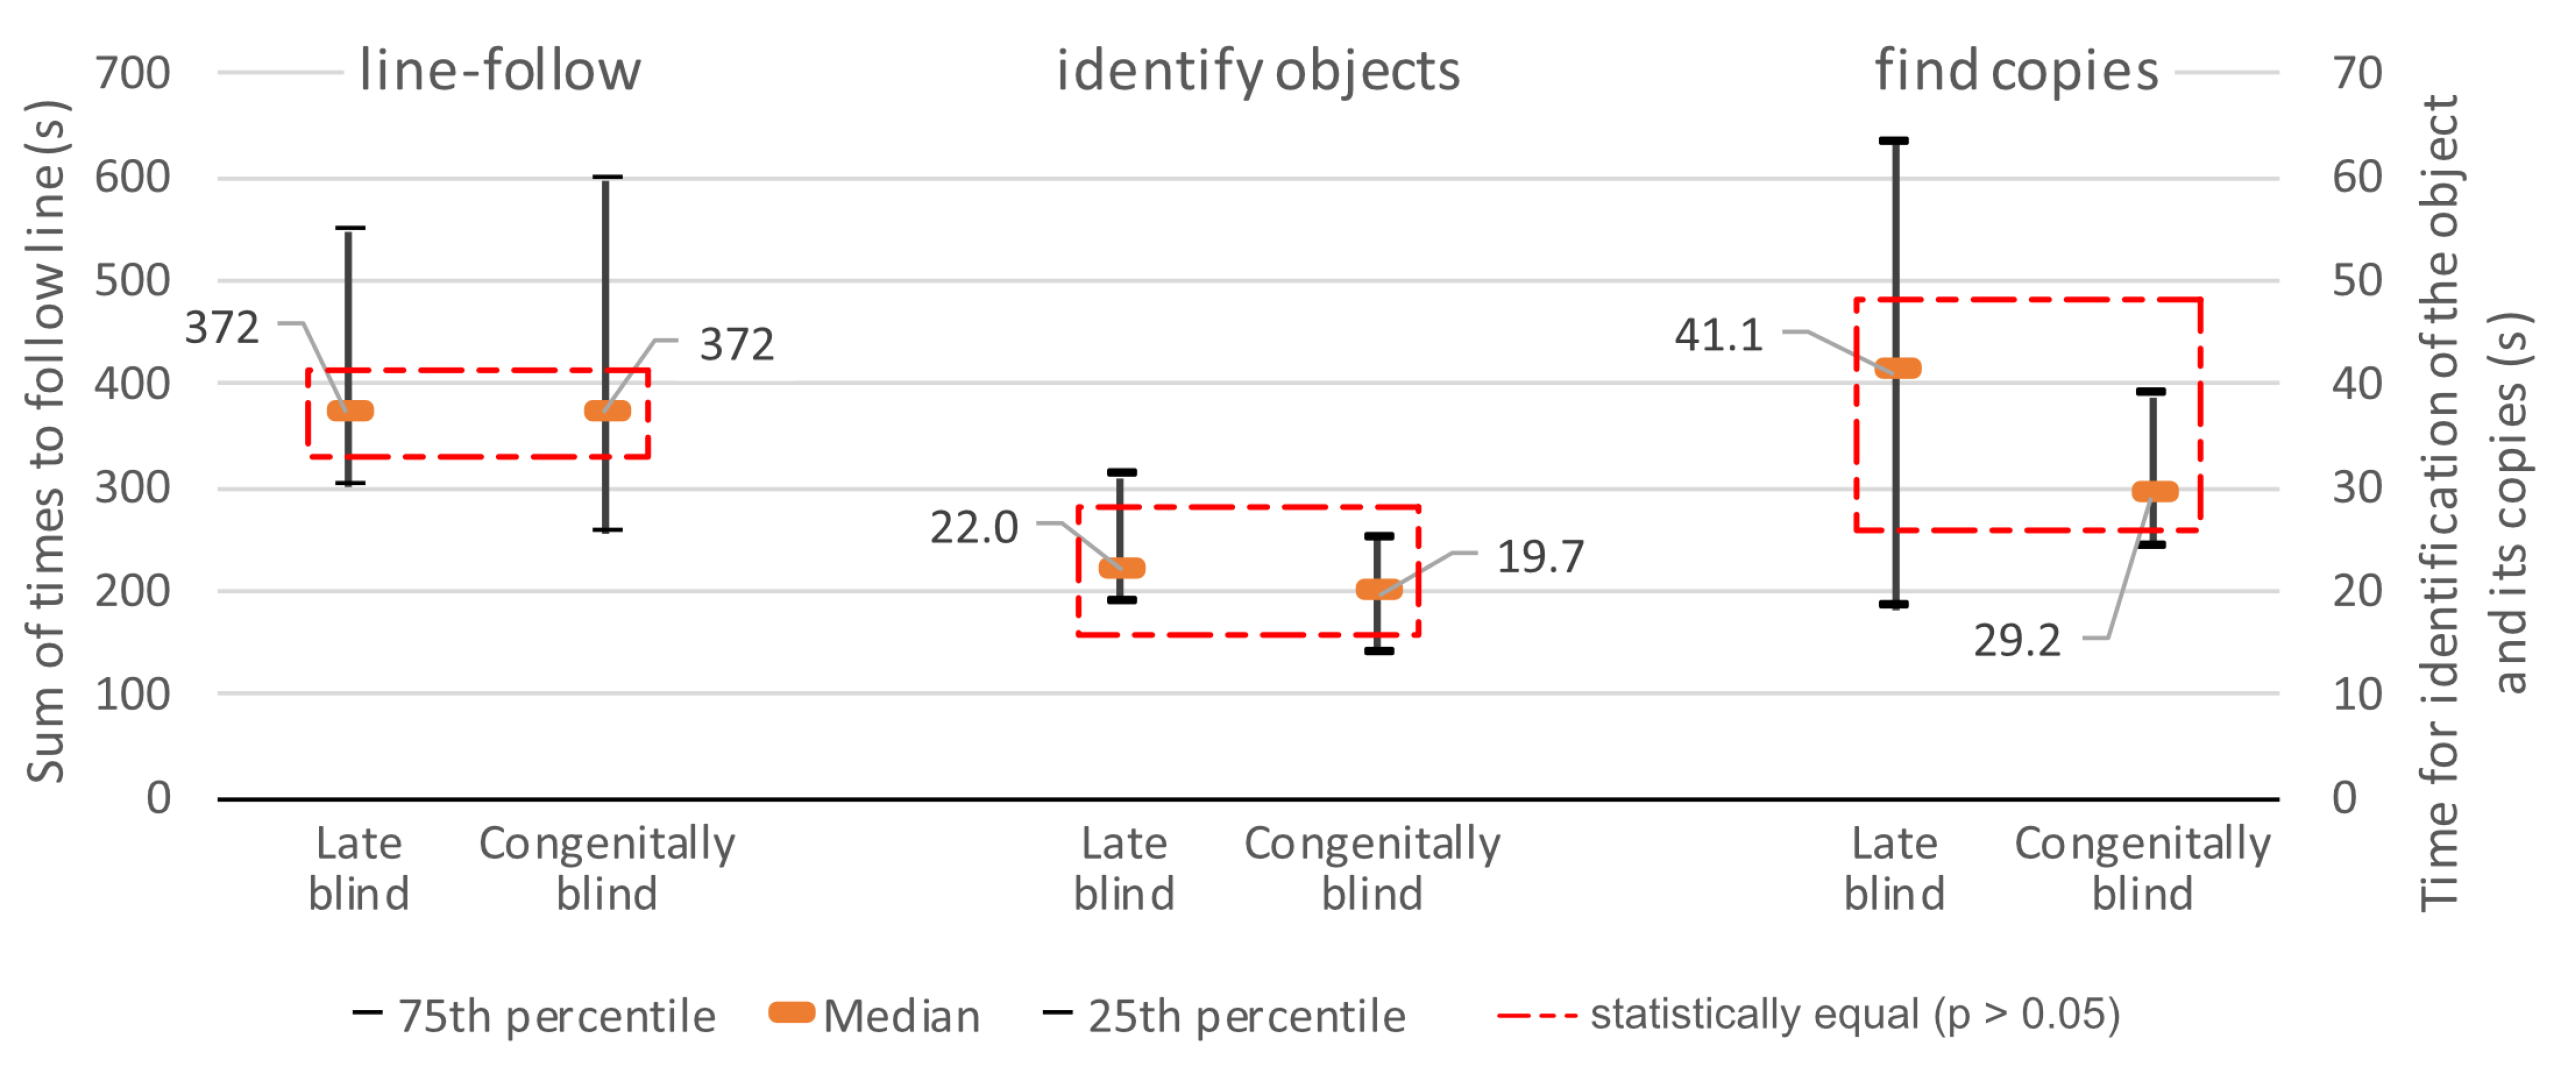
Regarding line-following, the median of the sum of times of the blind participants was 2.69% longer than that of the low-vision volunteers: 372 s versus 362 s.
The results are inverted in the time to identify objects, where those with complete vision loss were 16.61% faster (medians of 19.7 s and 23,625 s for each sample).
To locate figure copies, low-vision participants were 31,6% faster with a median of 26.5 s in the blinded condition, while the blind participants showed a median of 37.281 s in finding each copy (
Figure 25).
Statistically, there was no distinction in task execution time between blind and low-vision participants. To reach this conclusion, the Student’s test [
24] was used in each task after confirming that each one had a normal distribution. In the line-following activities, the test reported p=0.488 (N=24). In the image copies localization, a high proximity: p=0.927 (N=27).
To analyze the object identification activity, it was used the Welch’s test [
29], a generalization of the Student’s test for different population variances, to avoid a possible violation of the assumption of equal variance used in this test, which could make the result unreliable. The result was p=0.170 (N=25).
4.6.2. Vision Loss
By categorizing and analyzing the medians of participants’ performance between congenital blind and late blind, the first group was faster in locating the copies (median 29.2 s versus 41.1 s: 71%) and presented a smaller dispersion. In the image identifications, the congenitally blind also had the advantage (19.7 s vs. 22 s: 89%), but they were tied in the line-following activity (
Figure 26).
However, statistically, none of these results showed significant differences. Line-following and locating copies turned out to be normal distributions leading to the check made by Student’s test (1908): N=24, p=0.934 for the first activity.
The Welch’s test [
29] was used to locate the copies to avoid a possible violation of the assumption of equal variance. The result was p=0.170 (N=27). The non-parametric results’ distribution of the object identification test with the vision loss condition led to the Mann-Whitney’s test (1947) with the result p=0.341 (N=25).
4.6.3. Textures
The perception of texture differences did not vary with vision condition, schooling, or time of vision loss (
Figure 27).
Those born sightless indicated a lower threshold with greater dispersion in the results for the perception of differentiation than the late blinders (median of density 66.7% vs. 73.3%).
In terms of schooling, the university education group indicated a higher threshold for the perception of differences than the other two groups (medians 76.7% against 73.3% of postgraduate and 71.7% of high school), as well as participants with low vision in relation to the blind ones (median 78.3% versus 71.7%).
However, analyzing with the Student’s test [
24], for the first and for the last category, and ANOVA [
25] with Dunn’s post hoc [
26] for schooling, since all of them presented parametric distributions in frequency, none of these differences are statistically significant: N=28, p=0.599 for the time of vision loss; N=28, p=926 for education; and N=28, p=0.860 for the amount of vision.
4.6.4. Shape Repetition
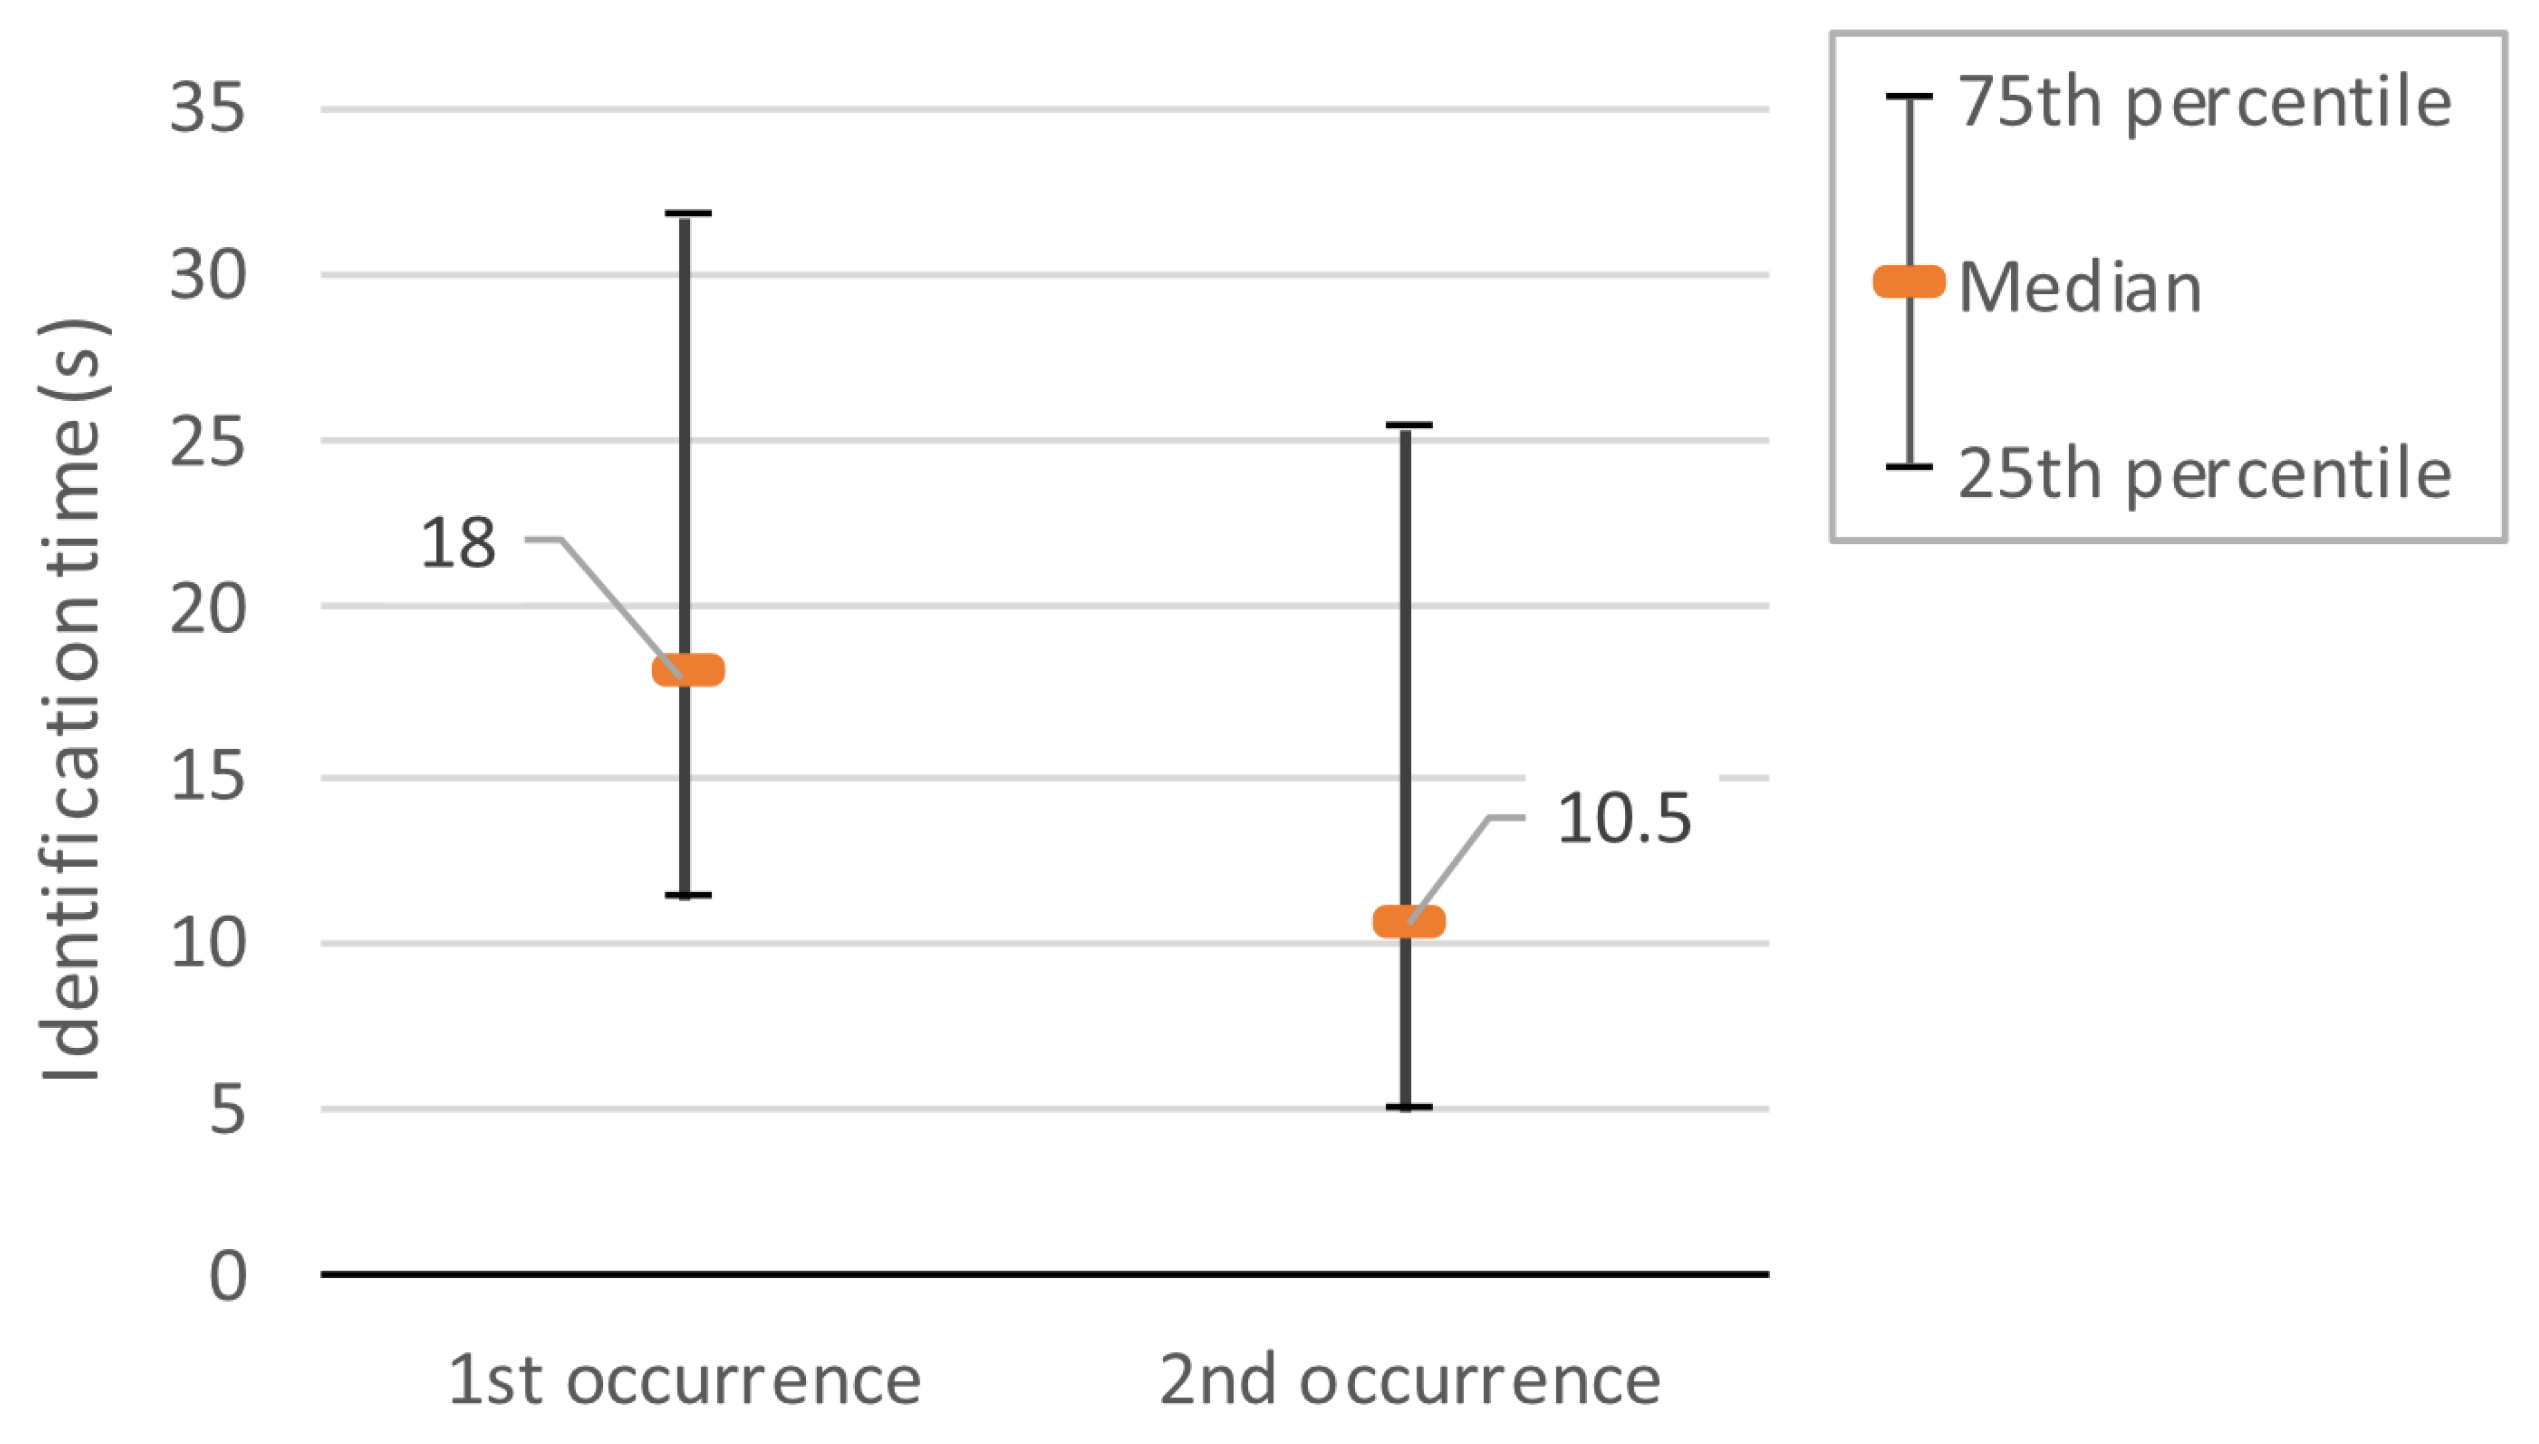
The times for the figure identifications were separated and compared between those counted in the first encounter of the participant with each object shape, and those captured when the same volunteer found the same object again, after going through other shape identifications and searching for those other copies.
There was a drop in the time needed to assimilate the object. The median dropped from 18 s to 10.5 seconds, a reduction to 55.55% of the time (
Figure 28). The Wilcoxon’s test [
20] confirmed this as a significant difference (N=122; p<0.001).
5. Conclusion
It was observed that the height of the contour lines attracted more attention from the participants than the width of these lines. The collected data showed that locating elements in space is easier at higher heights (0.2 mm, 0.3 mm, and 0.4 mm). These data corroborated the statement by Jehoel, Dinar et al. [
30] in which the minimum height between two layers of materials for an optimized information exploitation would be 0.16 mm.
The width was influential on the part details. They can be lost for perception if the contour lines became too close. The outline width was one of the main determinants for the figure’s minimum size to be printed.
Spaced textures made by infill are better perceived between 10% and 60% density. The contrast provided by two textures together increased this number from 90% to 100%. However, textures can generate tactile fatigue and therefore should be used sparingly.
The 45º rotation did not influence the performance in locating image copies. The most considerable influence perceived came from memorizing a specific and unique element of each image as a reference for comparison, not the whole figure, and working back from the copy candidate to the original figure to check the shapes.
In figure identification, familiarity was more influential than fabrication aspects. The participants agreed or disagreed with their representation, in addition to making associations with their memories.
Statistically, there were no significant task performance differences between individuals with low vision and blindness, nor between congenital and late blind. Schooling has no influence on exploring tasks but reduce the time to identify image (on individuals at the university) and to locate image copies.
The time reduction for image identification verified between the first and second encounter with the same figure shows that at least a part of the figure or its signature element was retained, even after going through other activities. Thus, it can be stated that the more contact people have with illustrations, the faster their recognition. And, expanding to different representation shapes for the same object, there would be an expansion of the imagery collection and, consequently, of the potential for familiarity and for image identification.
Although the absolute numbers indicate small differences, the existence of previous image memory or low vision condition or even variations in schooling does not influence the perception of differences between textures, corroborating the results of Heller [
5] when they state that late blind people can perform a little better than those born blind.
The aspects observed during those skills use in the tests reinforce the Eriksson’s [
3] and Heller’s [
6] discourses, by which people should be tactilely stimulated from childhood to develop their perceptions of shape, direction, distance and dimension.
It is important to point out that although they influence the performance in tasks employing tactile images, the print settings must be considered in addiction with the tactile image design. This involves much more than identify an object. It means understanding the lines and the relationships between them, the existing context among the objects in the information construction. The objective of producing tactile images must first be what information wants to convey and then how to construct this information.
Thus, the designer must consider: (1) the fabrication guidelines presented here (height and width of contour lines, and the texture densities); (2) cognitive obstacles; (3) the touch is not capable of perceiving minimal details; (4) integrating a sequence of tactile information collected to generate the whole imposes a heavy memory load; and (5) conceptual graphic representations must be supported by interpretation [
8].
In this last item, it is recommended in the descriptive support: (1) giving a figure overview, (2) locating the elements in space, (3) describing the elements in detail of appearance and functionality, (4) making a final summary explaining the whole of the image [
3], and (5) during the process, encourage exploration and identification employing both hands or more than one finger [
5,
7].
Author Contributions
Conceptualization, Gutenberg Barros and Walter Correia; methodology, Gutenberg Barros, Alana da Gama and Walter Correia; validation, Gutenberg Barros, Alana da Gama and João Marcelo Teixeira; investigation, Gutenberg Barros; writing—original draft preparation, João Marcelo Teixeira and Gutenberg Barros; writing—review and editing, João Marcelo Teixeira and Gutenberg Barros; supervision, Walter Correia. All authors have read and agreed to the published version of the manuscript.
Funding
This research received no external funding.
Institutional Review Board Statement
The study was conducted in accordance with the Declaration of Helsinki, and approved by the Ethics Committee of the Federal University of Pernambuco / Brazil.
Informed Consent Statement
Informed consent was obtained from all subjects involved in the study.
Conflicts of Interest
The authors declare no conflict of interest.
References
- Hasper, E.; Windhorst, R.A.; Hedgpeth, T.; Van Tuyl, L.; Gonzales, A.; Martinez, B.; Yu, H.; Farkas, Z.; Baluch, D.P. Methods for creating and evaluating 3D tactile images to teach STEM courses to the visually impaired. Journal of College Science Teaching 2015, 44, 92–99. [Google Scholar] [CrossRef]
- D’Angiulli, A.; Kennedy, J.M.; Helle, M.A. Blind children recognizing tactile pictures respond like sighted children given guidance in exploration. Scandinavian Journal of Psychology 1998, 39, 187x–190. [Google Scholar] [CrossRef]
- Eriksson, Y. How to make tactile pictures understandable to the blind reader. Proceedings of the 65th IFLA Council and General Conference, 1999.
- Heller, M.A. Tactual perception of embossed Morse code and braille: The alliance of vision and touch. Perception 1985, 14, 563–570. [Google Scholar] [CrossRef] [PubMed]
- Heller, M.A. Picture and pattern perception in the sighted and the blind: the advantage of the late blind. Perception 1989, 18, 379–389. [Google Scholar] [CrossRef] [PubMed]
- Heller, M.A. Texture perception in sighted and blind observers. Perception & psychophysics 1989, 45, 49–54. [Google Scholar]
- Mazella, A.; Albaret, J.M.; Picard, D. Haptic-2D: A new haptic test battery assessing the tactual abilities of sighted and visually impaired children and adolescents with two-dimensional raised materials. Research in developmental disabilities 2016, 48, 103–123. [Google Scholar] [CrossRef] [PubMed]
- Stangl, A.; Hsu, C.L.; Yeh, T. Transcribing across the senses: community efforts to create 3D printable accessible tactile pictures for young children with visual impairments. Proceedings of the 17th International ACM SIGACCESS Conference on Computers & Accessibility, 2015, pp. 127–137.
- Ferreira, M.E.d.S.; Silva, L.F.C.F.d. A aplicação das tecnologias de prototipagem rápida na confecção de matrizes táteis. Boletim de Ciências Geodésicas 2014, 20, 411–426. [Google Scholar] [CrossRef]
- Gorni, A.A. Prototipagem rápida: o que é, quem faz e por que utilizá-la. Plástico Industrial 2001, 1, 230–239. [Google Scholar]
- Sachs, E.; Cima, M.; Cornie, J.; Brancazio, D.; Bredt, J.; Curodeau, A.; Fan, T.; Khanuja, S.; Lauder, A.; Lee, J.; others. Three-dimensional printing: the physics and implications of additive manufacturing. CIRP annals 1993, 42, 257–260. [Google Scholar] [CrossRef]
- Volpato, N. Prototipagem rápida: tecnologias e aplicações; Editora Blucher, 2007.
- Rayna, T.; Striukova, L. From rapid prototyping to home fabrication: How 3D printing is changing business model innovation. Technological forecasting and social change 2016, 102, 214–224. [Google Scholar] [CrossRef]
- Spirandelli, A.J.; Libório, F.H.V.; Monteiro, R.T.; Medola, F.O.; Domiciano, C.L.C. Revisão sistemática da literatura sobre Design de sinalização e autonomia das pessoas com deficiência visual. In Tecnologia assistiva: abordagens teóricas; Canal 6: Bauru, 2021; pp. 42–49. [Google Scholar]
- Barros, G.; Correia, W.; Teixeira, J.M. Towards the Effectiveness of 3D Printing on Tactile Content Creation for Visually Impaired Users. Polymers 2023, 15, 2180. [Google Scholar] [CrossRef] [PubMed]
- Snodgrass, J.G.; Vanderwart, M. A standardized set of 260 pictures: norms for name agreement, image agreement, familiarity, and visual complexity. Journal of experimental psychology: Human learning and memory 1980, 6, 174. [Google Scholar] [CrossRef] [PubMed]
- Lacey, S.; Flueckiger, P.; Stilla, R.; Lava, M.; Sathian, K. Object familiarity modulates the relationship between visual object imagery and haptic shape perception. Neuroimage 2010, 49, 1977–1990. [Google Scholar] [CrossRef] [PubMed]
- Zebehazy, K.T.; Wilton, A.P. Straight from the source: Perceptions of students with visual impairments about graphic use. Journal of Visual Impairment & Blindness 2014, 108, 275–286. [Google Scholar]
- Heller, M.A.; Kennedy, J.M. Perspective taking, pictures, and the blind. Perception & Psychophysics 1990, 48, 459–466. [Google Scholar]
- Wilcoxon, F. Some uses of statistics in plant pathology. Biometrics Bulletin 1945, 1, 41–45. [Google Scholar] [CrossRef]
- Friedman, M. The use of ranks to avoid the assumption of normality implicit in the analysis of variance. Journal of the american statistical association 1937, 32, 675–701. [Google Scholar] [CrossRef]
- Conover, W.J. Practical nonparametric statistics; Vol. 350, john wiley & sons, 1999.
- Mann, H.B.; Whitney, D.R. On a test of whether one of two random variables is stochastically larger than the other. The annals of mathematical statistics.
- Student. The probable error of a mean. Biometrika 1908, 6, 1–25. [Google Scholar] [CrossRef]
- St, L.; Wold, S.; others. Analysis of variance (ANOVA). Chemometrics and intelligent laboratory systems 1989, 6, 259–272. [Google Scholar]
- Dunn, O.J. Multiple comparisons among means. Journal of the American statistical association 1961, 56, 52–64. [Google Scholar] [CrossRef]
- Triola, M.F. Introdução à estatística. In Introdução à estatística; 2008; pp. xxvi–310.
- Shaphiro, S.; Wilk, M. An analysis of variance test for normality. Biometrika 1965, 52, 591–611. [Google Scholar] [CrossRef]
- Welch, B.L. The generalization of ‘STUDENT’S’problem when several different population varlances are involved. Biometrika 1947, 34, 28–35. [Google Scholar]
- Götzelmann, T. LucentMaps: 3D printed audiovisual tactile maps for blind and visually impaired people. Proceedings of the 18th international ACM Sigaccess conference on computers and accessibility, 2016, pp. 81–90.
Figure 1.
Flowchart of the institution contact, and samples and site preparations.
Figure 1.
Flowchart of the institution contact, and samples and site preparations.
Figure 2.
Flowchart of the research presentation and user data collection.
Figure 2.
Flowchart of the research presentation and user data collection.
Figure 3.
Scanning test constructive drawing.
Figure 3.
Scanning test constructive drawing.
Figure 4.
First test application flowchart.
Figure 4.
First test application flowchart.
Figure 5.
Tactile discrimination test constructive drawing.
Figure 5.
Tactile discrimination test constructive drawing.
Figure 6.
Texture streaks used in the test.
Figure 6.
Texture streaks used in the test.
Figure 7.
Second test application flowchart.
Figure 7.
Second test application flowchart.
Figure 8.
The two figure layouts used in the test.
Figure 8.
The two figure layouts used in the test.
Figure 9.
Test’s first part flowchart.
Figure 9.
Test’s first part flowchart.
Figure 10.
Test’s second part flowchart.
Figure 10.
Test’s second part flowchart.
Figure 11.
Population characterization, analyzed by viewing time.
Figure 11.
Population characterization, analyzed by viewing time.
Figure 12.
Volunteer performing line-follow activity.
Figure 12.
Volunteer performing line-follow activity.
Figure 13.
One of the samples used in the texture density test.
Figure 13.
One of the samples used in the texture density test.
Figure 14.
Participant performing an object-related activity.
Figure 14.
Participant performing an object-related activity.
Figure 15.
Comments made about the line heights.
Figure 15.
Comments made about the line heights.
Figure 16.
Volunteers’ time in the line-follow test with different printed heights.
Figure 16.
Volunteers’ time in the line-follow test with different printed heights.
Figure 17.
Object identification rate.
Figure 17.
Object identification rate.
Figure 18.
Time and rate of object identification by printed heights.
Figure 18.
Time and rate of object identification by printed heights.
Figure 19.
Time and rate of figure copies localization by printed heights.
Figure 19.
Time and rate of figure copies localization by printed heights.
Figure 20.
Distribution of annotated comments on print heights and widths.
Figure 20.
Distribution of annotated comments on print heights and widths.
Figure 21.
Participants’ time in the line-follow test with different printed widths.
Figure 21.
Participants’ time in the line-follow test with different printed widths.
Figure 22.
Time and rate of object identification by printed widths.
Figure 22.
Time and rate of object identification by printed widths.
Figure 23.
Time and rate of figure copies localization by printed widths.
Figure 23.
Time and rate of figure copies localization by printed widths.
Figure 24.
Maximum point of tactile density distinction.
Figure 24.
Maximum point of tactile density distinction.
Figure 25.
Influence of vision condition on task performance.
Figure 25.
Influence of vision condition on task performance.
Figure 26.
Influence of full vision loss acquisition on task performance.
Figure 26.
Influence of full vision loss acquisition on task performance.
Figure 27.
Influence of personal aspects on texture detection.
Figure 27.
Influence of personal aspects on texture detection.
Figure 28.
Time difference to identify the objects in the two apparitions.
Figure 28.
Time difference to identify the objects in the two apparitions.
Table 1.
Image selection: 1st to 5th column data adapted from [
16].
Table 1.
Image selection: 1st to 5th column data adapted from [
16].
|
Disclaimer/Publisher’s Note: The statements, opinions and data contained in all publications are solely those of the individual author(s) and contributor(s) and not of MDPI and/or the editor(s). MDPI and/or the editor(s) disclaim responsibility for any injury to people or property resulting from any ideas, methods, instructions or products referred to in the content. |
© 2023 by the authors. Licensee MDPI, Basel, Switzerland. This article is an open access article distributed under the terms and conditions of the Creative Commons Attribution (CC BY) license (http://creativecommons.org/licenses/by/4.0/).

