1. Introduction
Super absorbent polymers (SAP) are macromolecules with long chains have soft network structure with high ability to absorb huge amount of water due to their three dimensional structure [
1].
Recently, many researches have utilize hydrogels which get a significant attention in agricultural applications as water management polymers that reduce the consumption of irrigation water and controlled the release of different fertilizers in soil [
2,
3]. Hydrogels have the ability for water retention in high quantities, therefore hydrogels can be used in agriculture irrigation especially in the especially in the agricultural lands of the arid and semi-arid regions [
4] and the improvements of soil and its fertility is done by increasing the soil water and improve the uptake of nutrient by plants [
5]. Generally, under drought conditions the hydrogels could absorb a huge quantities of water by irrigation or during the time of rainfall and act as water reservoir [
6,
7]. The mixed hydrogels with soil in agriculture field could increase the moisture content in soil which is important for plants. Similarly, the hydrogels could release fertilizers to the soil for a longer time [
8]. High swelling rate and absorbance of water by agricultural hydrogels with high mechanical properties are important hydrogel characters which are depends on the nature of their monomers and the polymerization process used [
9].
Hydrogels from synthetic polymers are possess multi tunable properties, but sometimes have few limitations, therefore they modified chemically with natural polymers in order to get precisely controlled micro-environments and bioactive features come from natural polymer [
10].
In this study, different hydrogels were prepared by copolymerization of natural polymer with synthetic and semi-synthetic polymers. The aim was to improve the hydrogel properties for sustained release of agrochemicals and absorb and retain huge quantities of water and then release it in soil for plant irrigation. The gum Arabic was copolymerized with chitosan and poly(vinyl alcohol), and the prepared hydrogels were characterized for their structure, thermal, crystalline, and morphological properties using 1H NMR, FTIR, TGA and DSC, XRD and SEM analysis. The degree of swelling of the hydrogels were studied and two of the higher DS hydrogels were selected for loading with urea and allowed to release in different medium solutions and degree of temperatures.
2. Experimental
2.1. Materials and chemicals
Poly(vinyl alcohol) (PVA) was supplied from Fisher Scientific, USA. Chitosan (CS) of highly viscous, and gum Arabic (GA) were supplied from Sigma-Aldrich. N,’N-methylenebisacrylamide (MBA), sodium hexametaphosphate (SHMP), ammonium persulphate (APS) and the fertilizer model urea were supplied from BDH, U.K. Phosphate buffer pH4 and boric buffer pH9 and other chemicals were of analytical grade reagents and received from Fluka, Swiss. River water (RW) of 250ppm hardness was brought from Tigris river / Mosul.
2.2. Preparation of (CS-co-GA) and (PVA-co-GA) copolymers
Chitosan solution was prepared from 1.0g of CS in 100ml 2%(v/v) acetic acid in distilled water. Gum Arabic solution was prepared from 1.0g of GA in 100ml distilled water. GA solution 10.0ml of 1.0%(w/v) was heated in 250ml three-necked round flask at 65°C using mantle with magnetic stirring. The flask was connected to nitrogen line passed on alkaline pyrogallol solution for free of oxygen. APS initiator solution 5.0ml of 10.0%(w/v) was added, then followed with 10.0ml of 1.0%(w/v) of CS solution which was added stepwise using separating funnel and the temperature of the solution was kept at 65°C with continuous stirring. Either 5.0ml of 2%(w/v) of MBA the chemical cross-linker or 5.0ml of 6%(w/v) of SHMP the physical cross-linker was added also stepwise and at 65°C with stirring. 5.0 min later, the heating was stopped but stirring was kept for 1hr extra. The formed hydrogel was filtered, washed many times with distilled water and finally dried in vacuum oven at 30°C.
Similarly, the (PVA-co-GA) hydrogel was prepared using aforesaid procedure, only 20.0ml of 1.0%(w/v) PVA solution was used instead of 10ml of 1.0%(w/v) of CS solution and keeping the final solution of PVA/GA in water bath at 80°C for 24h before filtration.
2.3. Degree of Swelling
Dry hydrogel of 100mg was immersed in 20ml swell solution using one of the followings (distilled water (D.W), river water (R.W), or buffer solutions (pH4 or pH9)). The hydrogel was left inside the swelling solution for 24h in order to reach its maximum swelling. The degree of temperature of the swelling medium was fixed on one of the following temperatures 10°C, 25°C, or 50°C. The hydrogel after 6h was taken out, filtered by sieve of 100 mesh and left 10 min inside for drain of solution. The swelled hydrogel was weighted and then returned to the solution and the process was repeated after 6h for four times, and the degree of swelling was calculated using the following equation [
11];
Where Wt is the weight of the wet sample at (t) time, and W0 is the weight of dry sample.
2.4. Water-retention percentage (WR%) of soil-hydrogel mixture
Agricultural dry soil 200g sample was mixed with 0.1g of the prepared hydrogel in ventilated paper cup. Thereafter 100ml of river water (RW) represent the minimum rain fall level recorded in most arid and semi-arid regions [
12] was added slowly on the mixture. A control sample was prepared in a separate cup using same amount of dry soil with same procedure except no hydrogel was added. The examined cups were maintained in the same place and under the same conditions which were 20°C and 25% humidity. The samples weighted daily one time and WR% was calculated as follows [
13];
Where, Wt represent the decrease in sample weight, and W0 is the initial weight.
2.5. Loading of urea fertilizer on hydrogel microspheres
The concentrations of the loaded urea in the hydrogels were measured by UV-Visible JASCOV-630 spectrophotometer, Japan. Where the calibration curve was done at different known concentrations of urea and their absorbance have been measured at λ
max 278nm. The calibration curve was then used for calculation of unknown concentrations of the loaded urea in the hydrogels. Moreover, 100mg of hydrogel was kept in 100%(w/v) of urea in distilled water used as loading medium. The loading temperature was fixed at room temperature. The time of loading was varied between (6, 12 and 24) h in order to record maximum loading percentage. The following equations was used for calculation of maximum loading percentage (L
max%) and efficient loading percentage (EL%) [
14];
2.6. Studying the controlled release of urea from hydrogel microspheres
Loaded hydrogel 100mg was allowed to release in 20ml solution of DW, RW or buffer solution pH9. The temperatures of the release medium were fixed at (10, 25 and 50) °C. The concentrations of the released urea from the loaded hydrogel inside the medium were measured at a fixed time interval each 3h by taking 3ml solution and replaced with 3ml of the native solvent. The calibration curve was used for calculation of the concentration of the released urea. The release process was continued until the concentration of urea become zero. The release percentage of urea was calculated in a two steps as maximum controlled release(CR
max) and maximum burst release (BR
max) according and as follows [
15];
3. Results and discussion
Attention to agricultural soil in terms of providing irrigating water and important nutritional elements of the plants like fertilizers is considered one of the important basics in agricultural science. Hydrogels have the capacity to achieve many important and necessary applications include agricultural uses. The prepared hydrogels PVA-co-GA and CS-co-GA cross-linked chemically and physically were examined for their water-retention after mixing with agricultural soil, and for loading and releasing of urea as a coal for this study.
3.1. Characterization of the hydrogels
3.1.1. FTIR studies
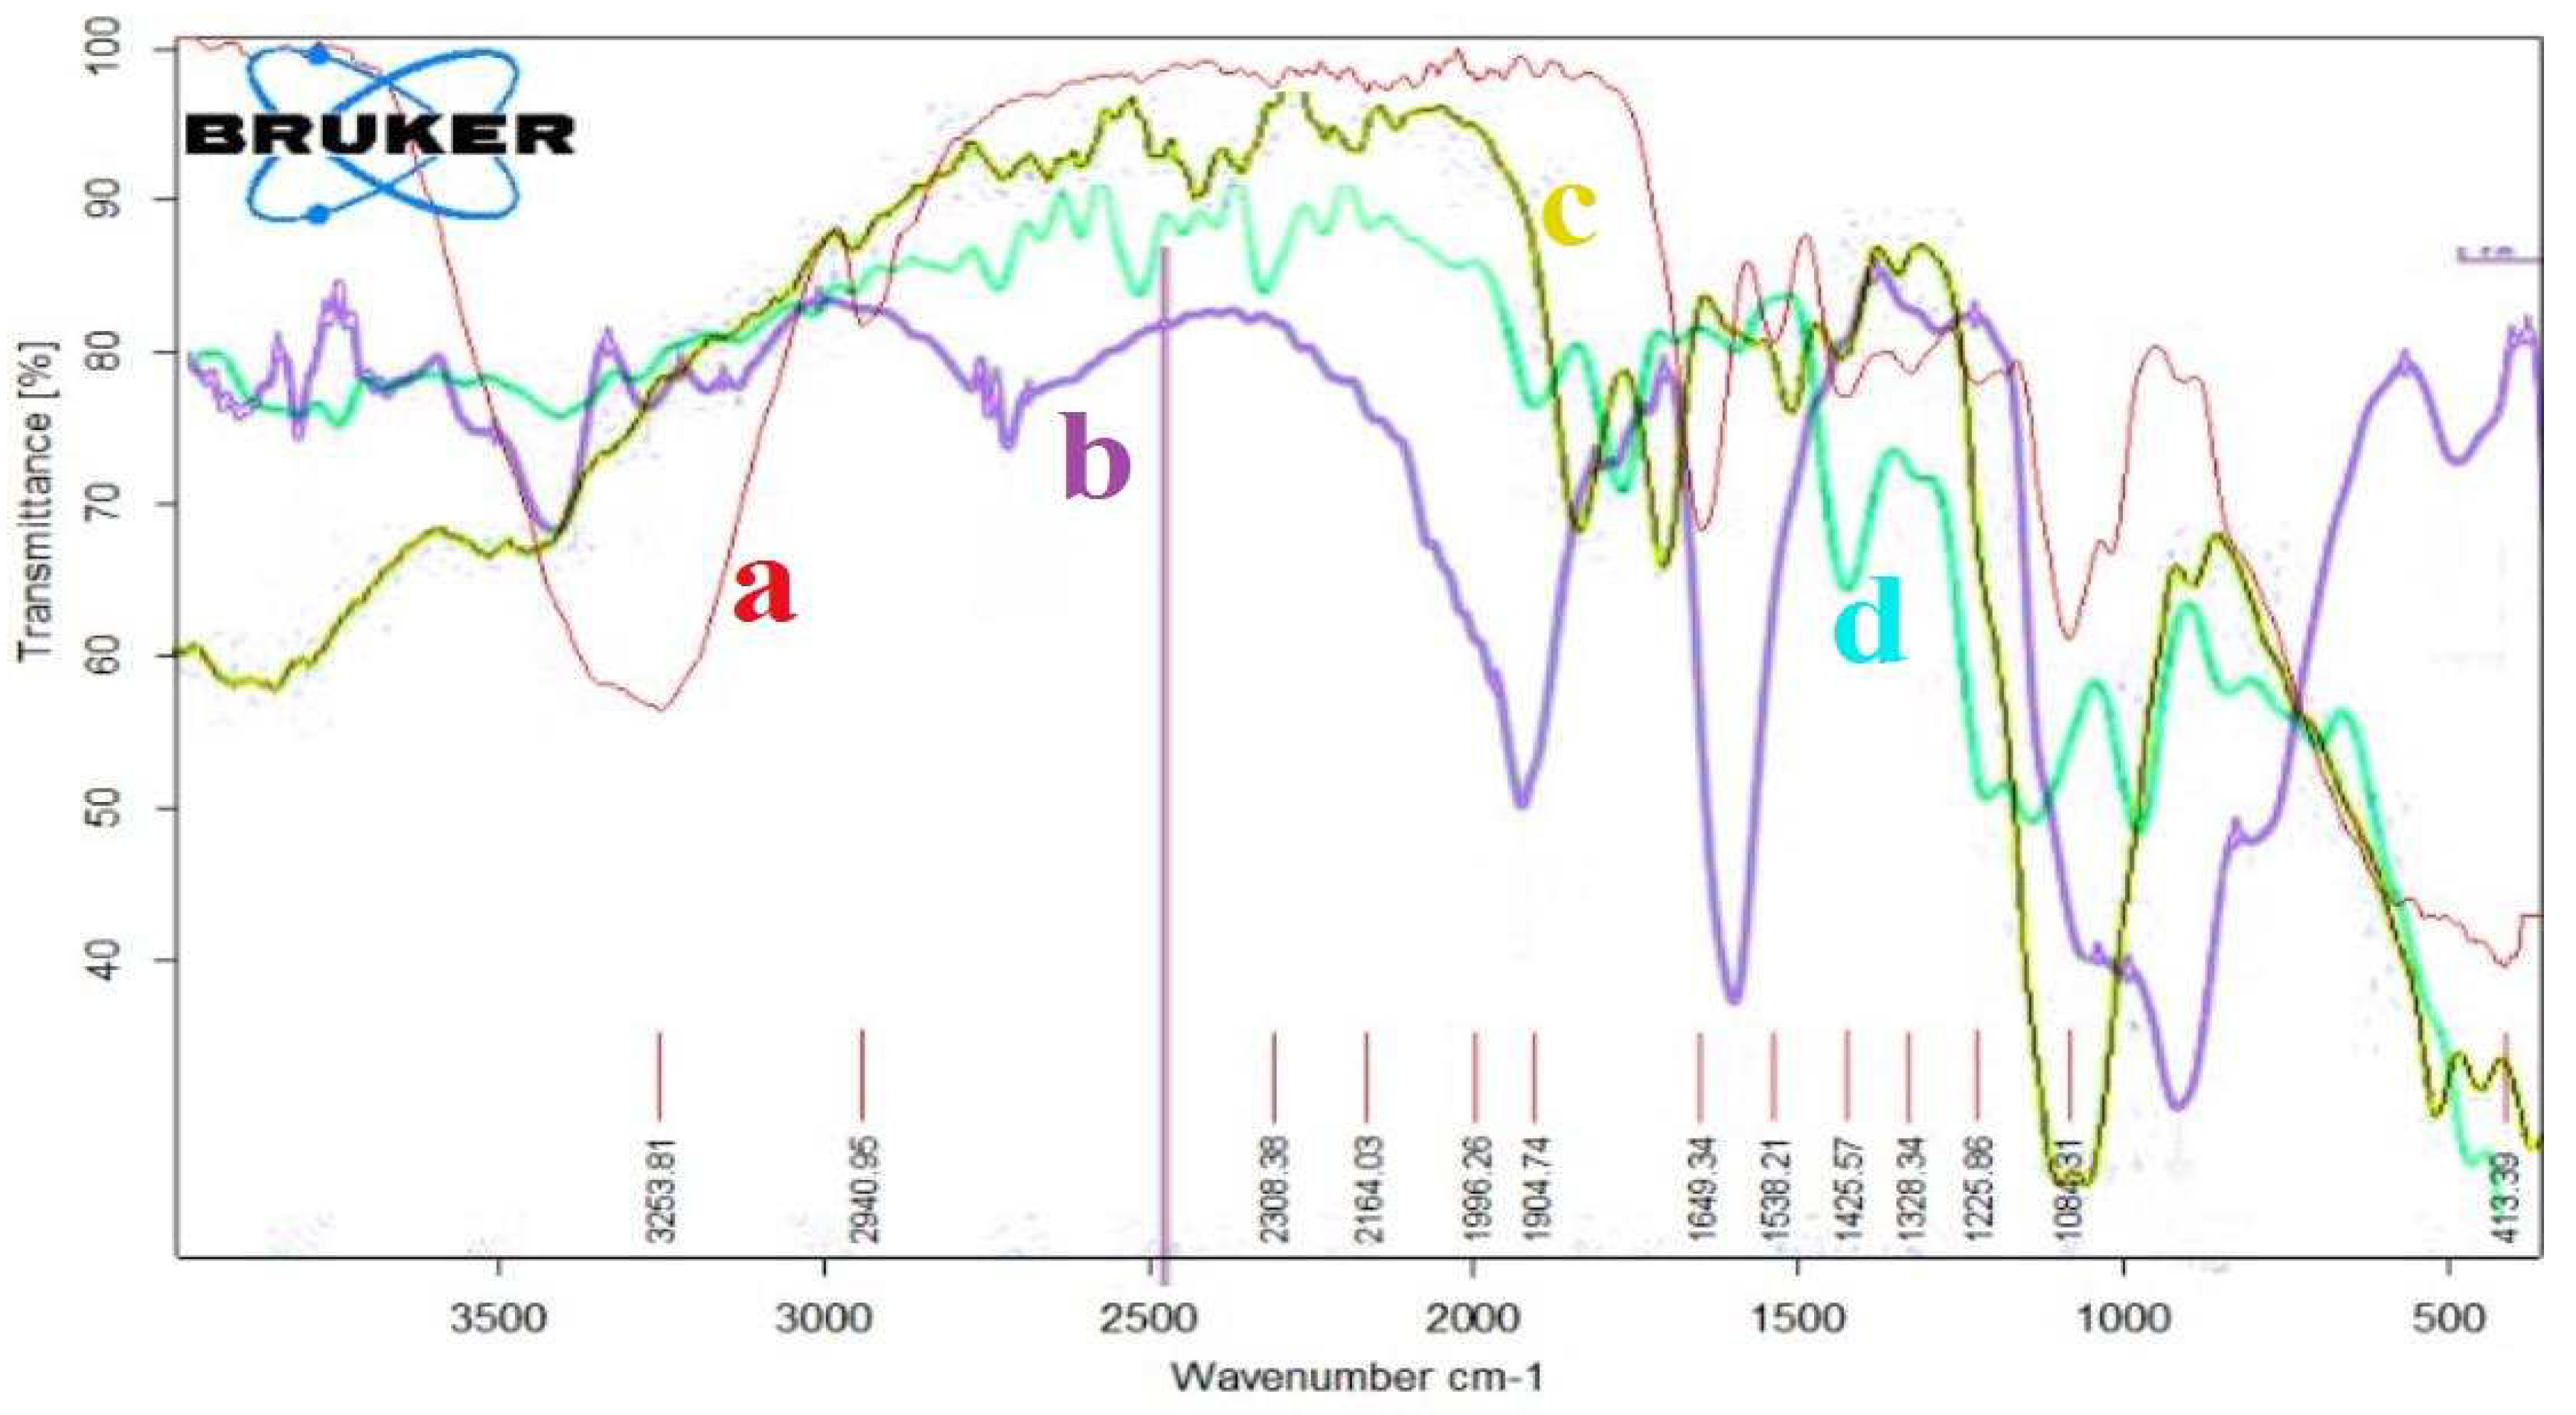
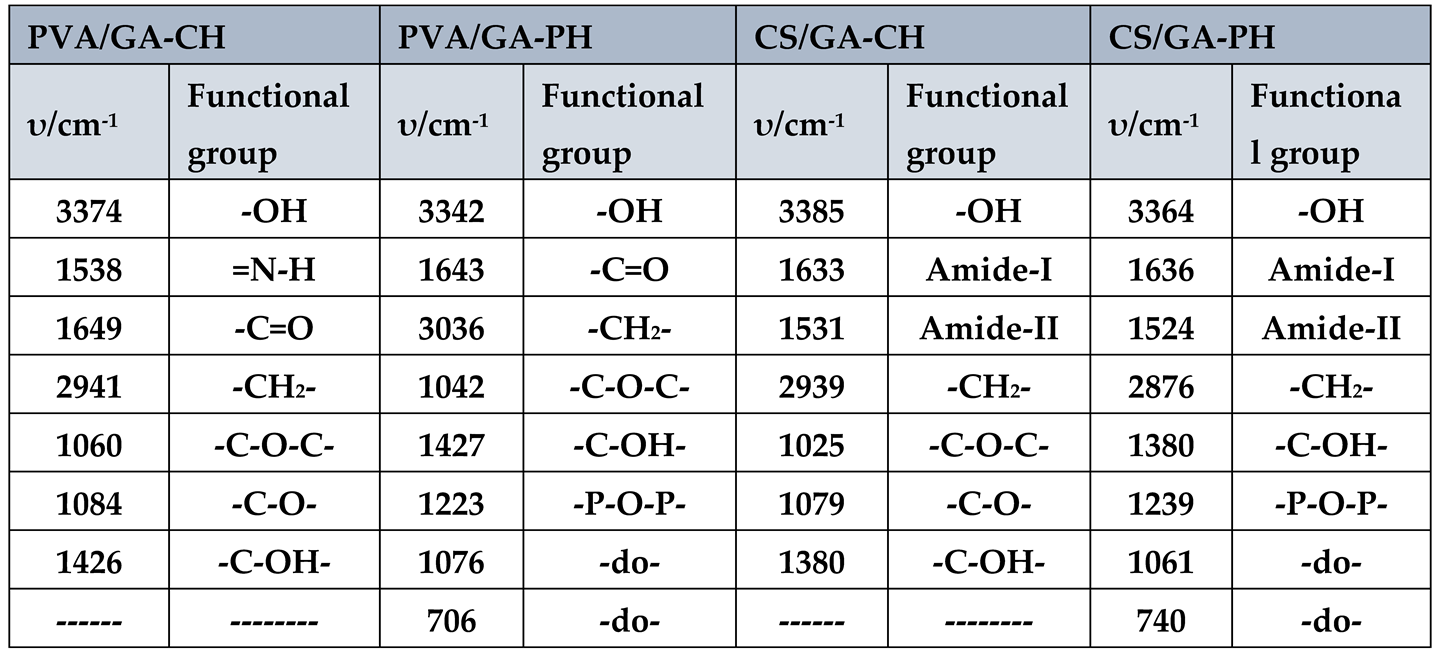
The FTIR spectrum (
Figure 1(a, b, c and d)), have shown the absorption frequencies of the functional groups of the prepared hydrogels. Moreover, the important FTIR characteristic frequencies were recorded in
Table 1. The absorption frequency of PVA/GA-CH hydrogel (
Figure 1a and
Table 1) at 3374cm
-1 is represent the hydroxyl groups of both PVA and GA, whereas the band at 1538cm
-1 is belongs to the amide group of the cross-linker MBA. The absorption frequency at 1649cm
-1 is of carbonyl groups of GA, and the band at 2941cm
-1 is representing the methylene group present in PVA, GA and MBA. Finally, the absorption frequency at 1060cm
-1 is belongs to (-C-O-C-) of the glucopyranose units of GA, and those at 1084cm
-1 and 1426cm
-1 are belongs to (-C-O-) and (-C-OH) respectively of both PVA and GA.
The FTIR spectrum of PVA/GA-PH hydrogel (
Figure 1b, Table1) has shown almost the same functional groups of PVA/GA-CH hydrogel only the absence of amide groups at 1538cm
-1 of MBA, and the appearance of new absorption band (-P-O-P-) of SHMP at 1223cm
-1, 1076cm
-1 and 706cm
-1.
Similarly, the CS/GA hydrogel with both cross-linkers has shown FTIR spectra (
Figure 1c, Table1) for chemical cross-linking, and (
Figure 1d, Table1) for physical cross-linking. The important functional groups of chitosan represent by absorption frequencies at 1633cm
-1 and 1531cm
-1 which are belongs to its carbonyl group (Amide-I) and its amine group (Amide-II) respectively.
1H NMR studies
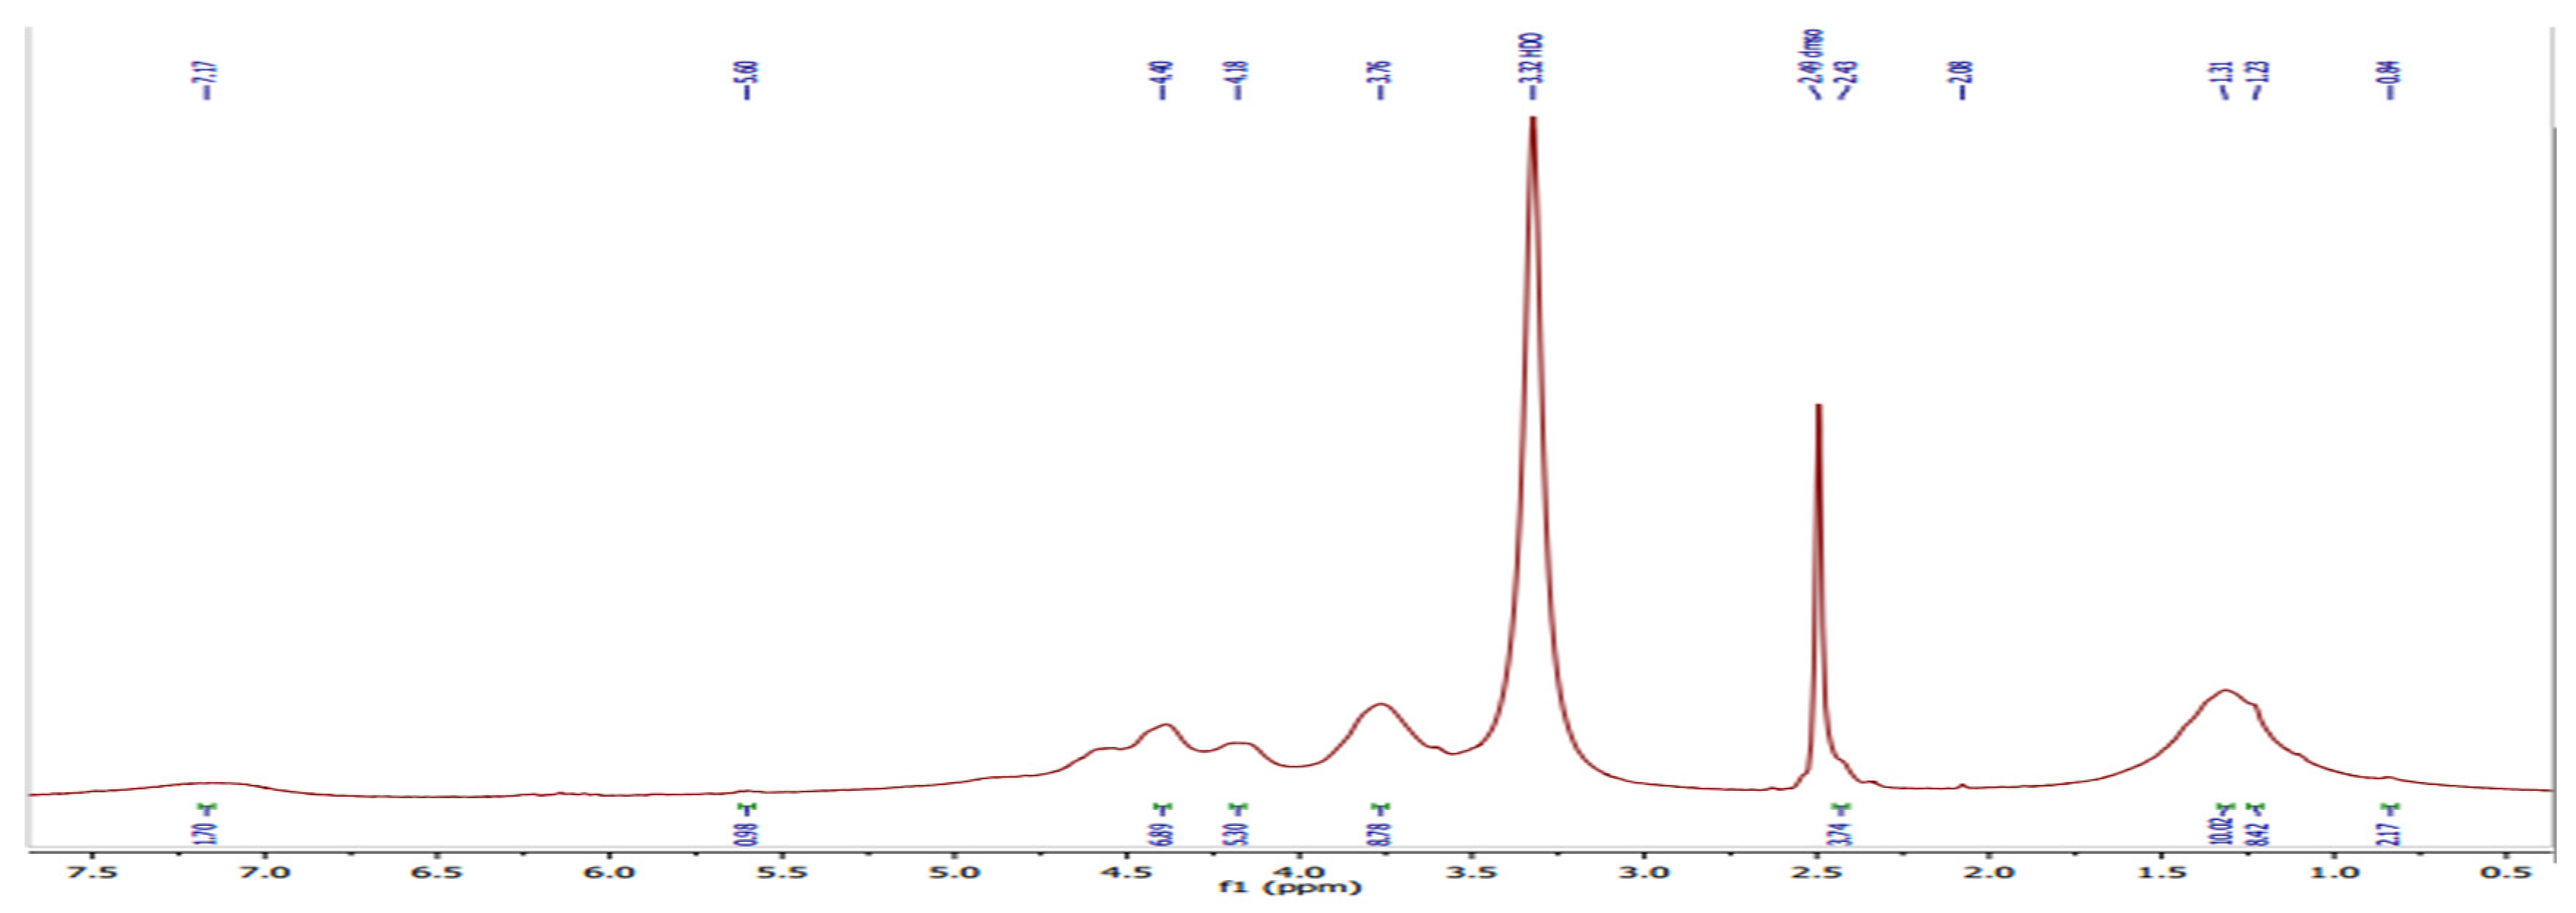
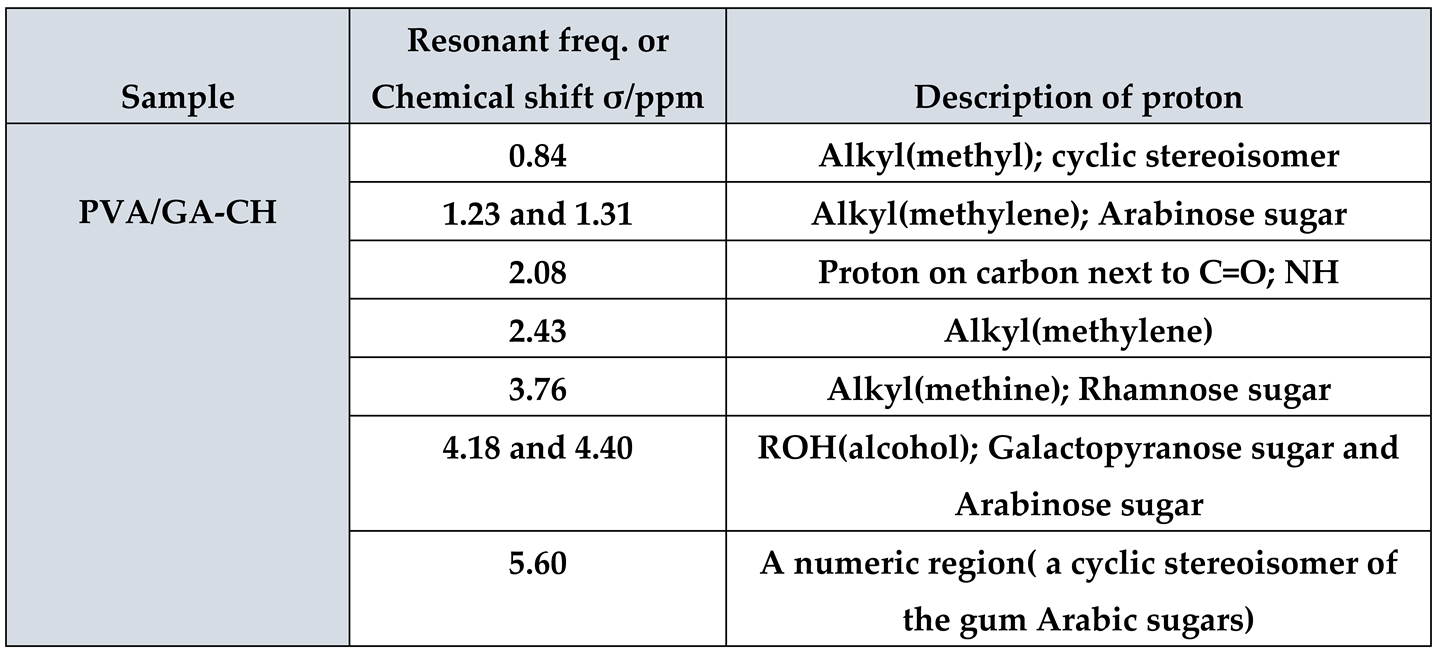
1H NMR of PVA/GA-CH hydrogel (
Figure 2 and
Table 2) have shown the resonance of (3H, s) at 0.84ppm which belongs to methyl protons of cyclic stereoisomer in a numeric region of GA sugars. Whereas, the resonances of (2H, m) at (1.23 and 1.31) ppm are belongs to methylene protons of PVA and MBA beside the protons present in arabinose sugar of GA. The resonance of (1H, s) at 2.08ppm is belongs to methine proton of MBA, while that of (2H, s) at 2.43ppm and that of (1H m) at 3.76ppm are of methylene and methine protons of PVA. The resonance of (1H, m) at (4.18 and 4.40) ppm are belongs to hydroxyl proton of PVA and those of galactopyranose and arabinose sugars present in GA. Finally, the resonance of (1H, s) at 5.60ppm are represent numeric regions belongs to the cyclic stereoisomer of GA.
3.1.2. Thermal analysis studies
The TGA and DSC of PVA/GA-PH and CS/GA-CH hydrogels were studied.
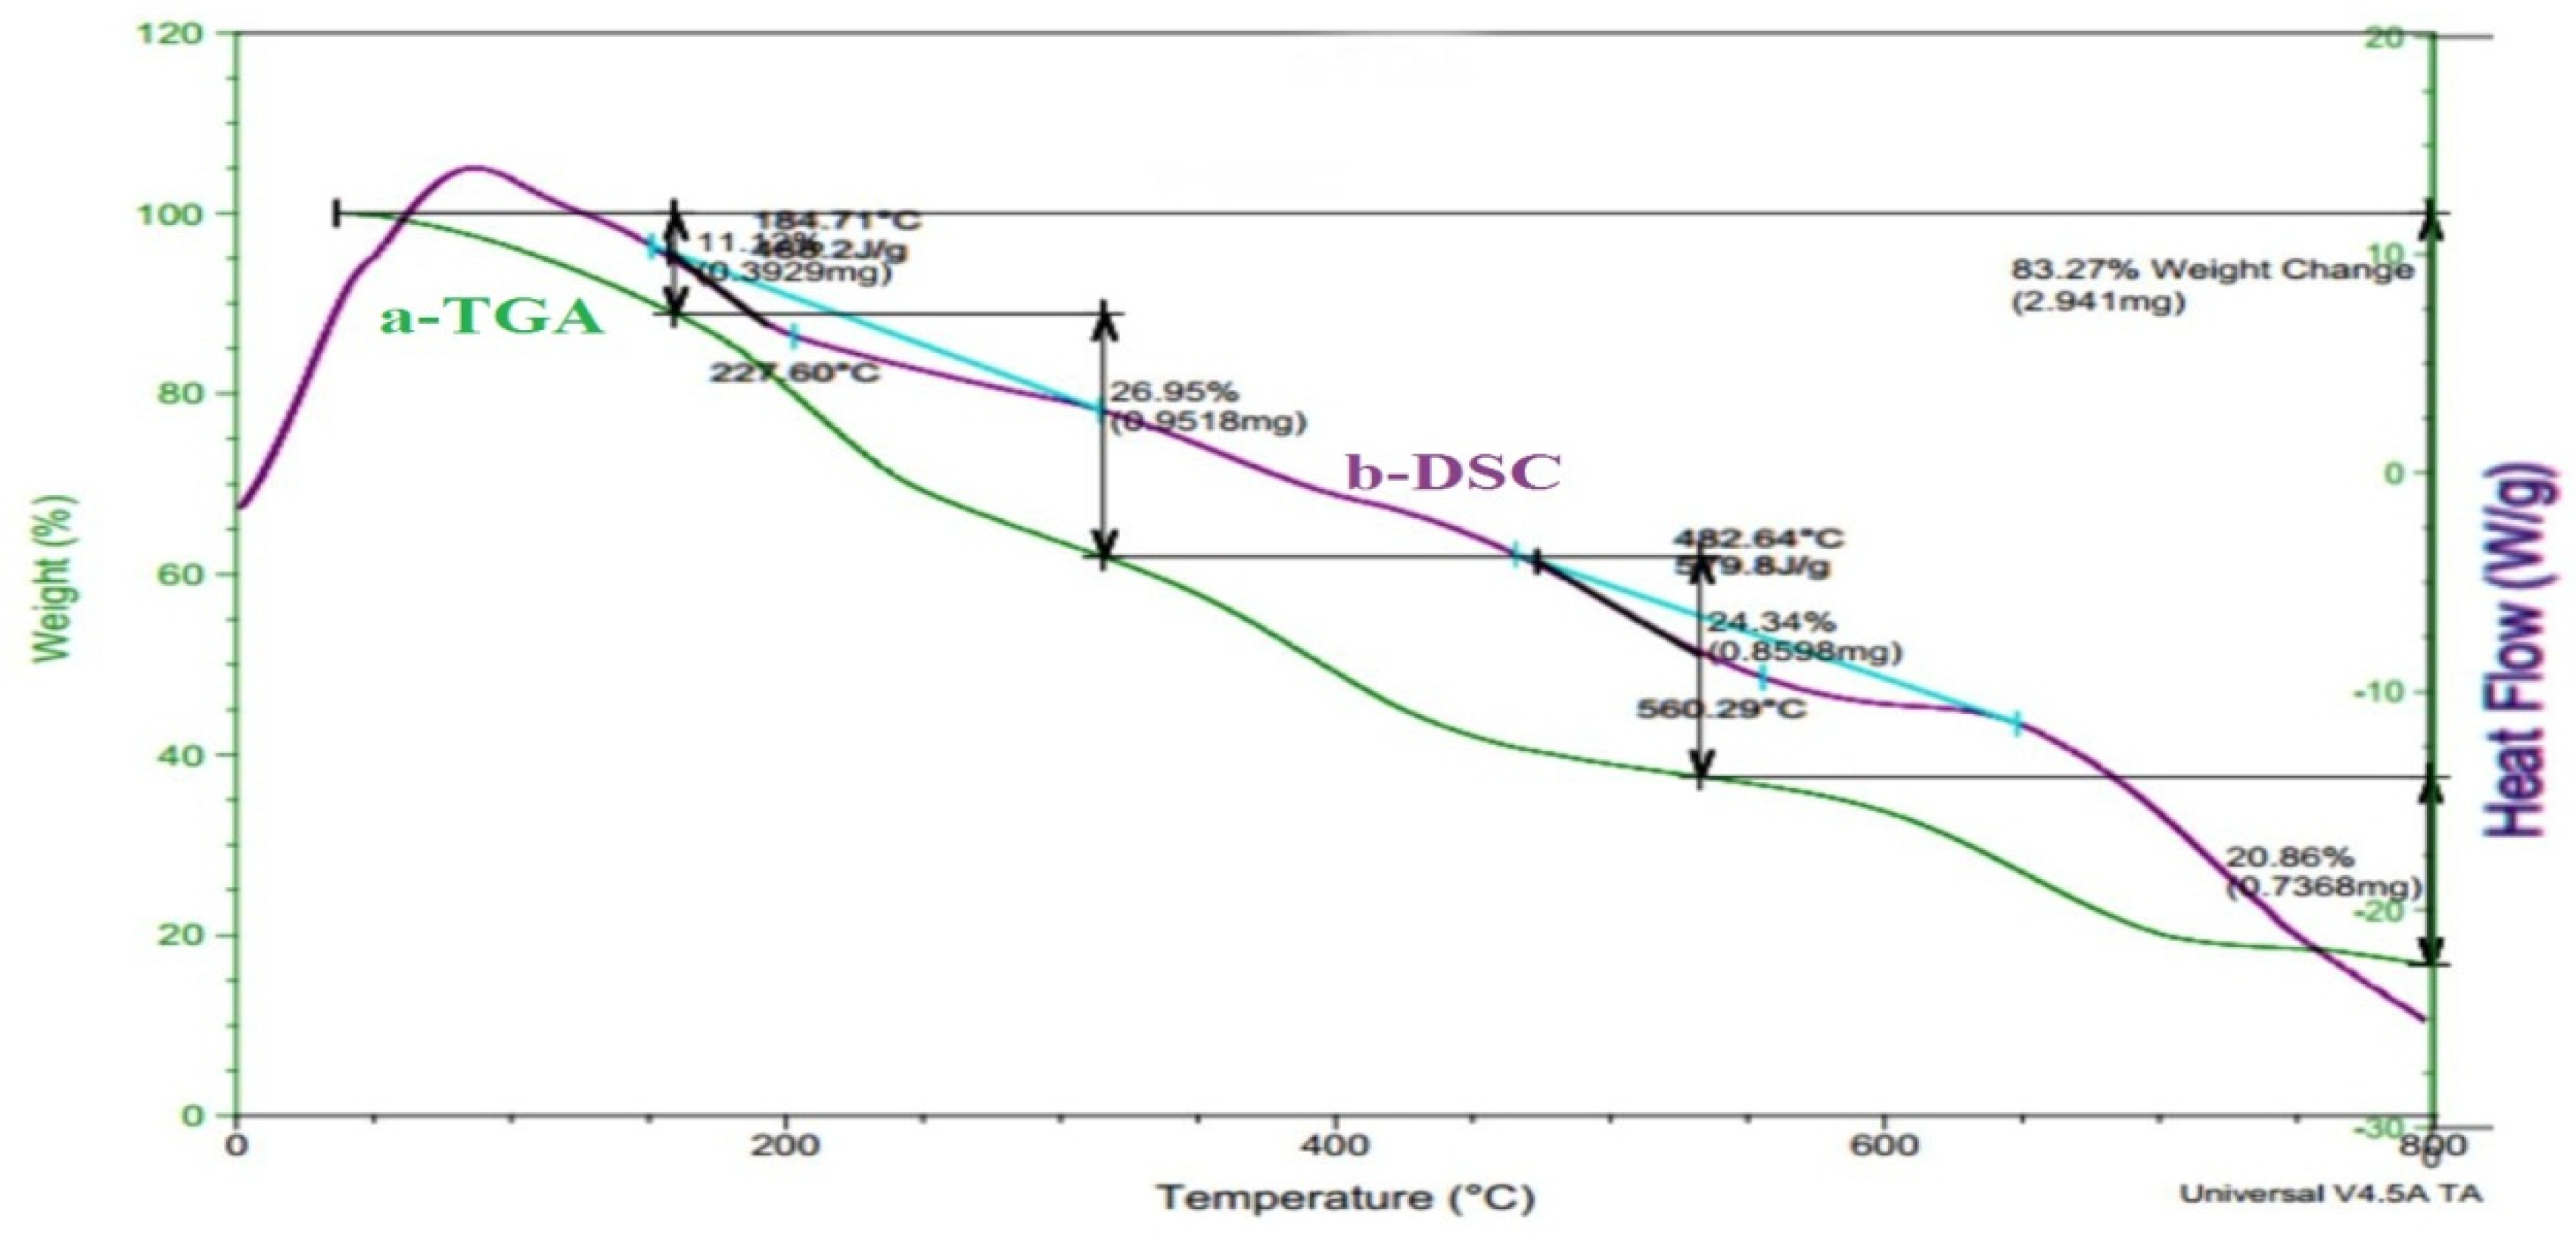
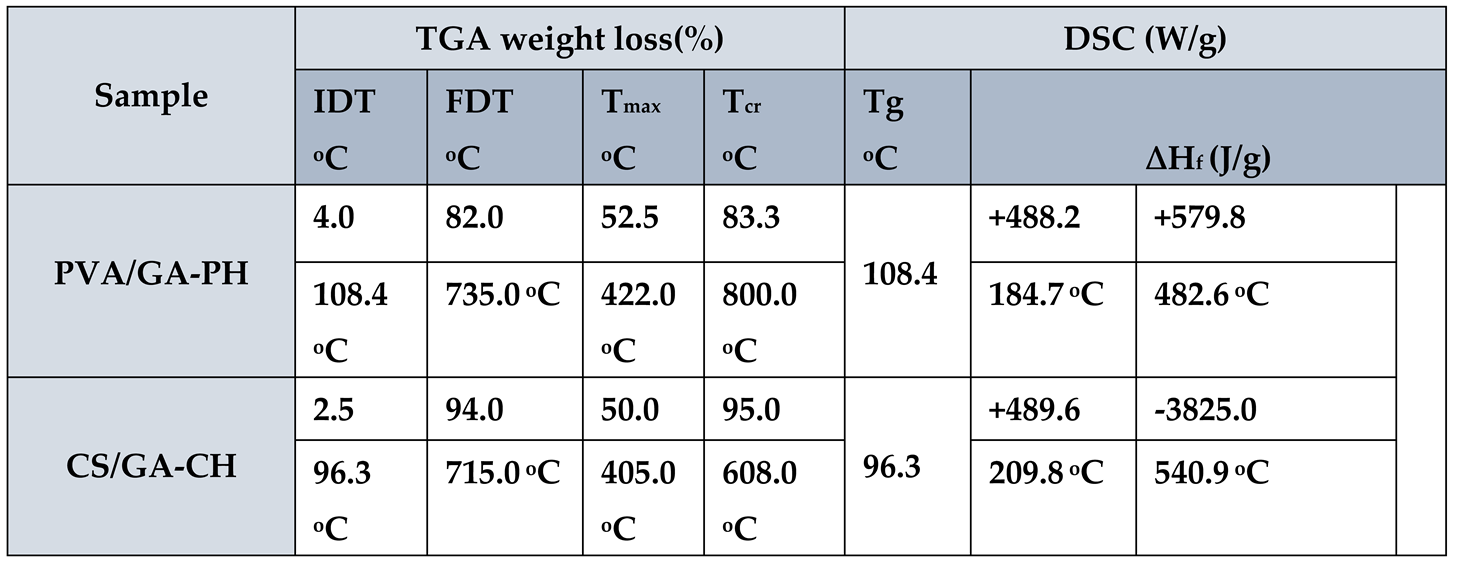
The sample PVA/GA-PH was analyzed and (
Figure 3(a and b)) beside the thermal data recorded in (
Table 3) have shown the sample has high thermal stability. Where the TGA thermogram (
Figure 3a) has shown weight loss of 4.0% at 108.4°C the initial decomposition temperature (IDT), and weight loss of 82.0% at 735°C, represent final decomposition temperature (FDT).
The TGA thermogram (
Figure 3a) also give weight loss of 52.5% at 422°C represent maximum decomposition temperature (T
max) and weight loss of 83.3% at 800°C represent crystalline decomposition temperature (T
cr). The DSC thermogram (
Figure 3b and
Table 3) has shown endothermic behavior of PVA/GA-PH hydrogel, and mainly at two positions represent the heat of fusion (∆H
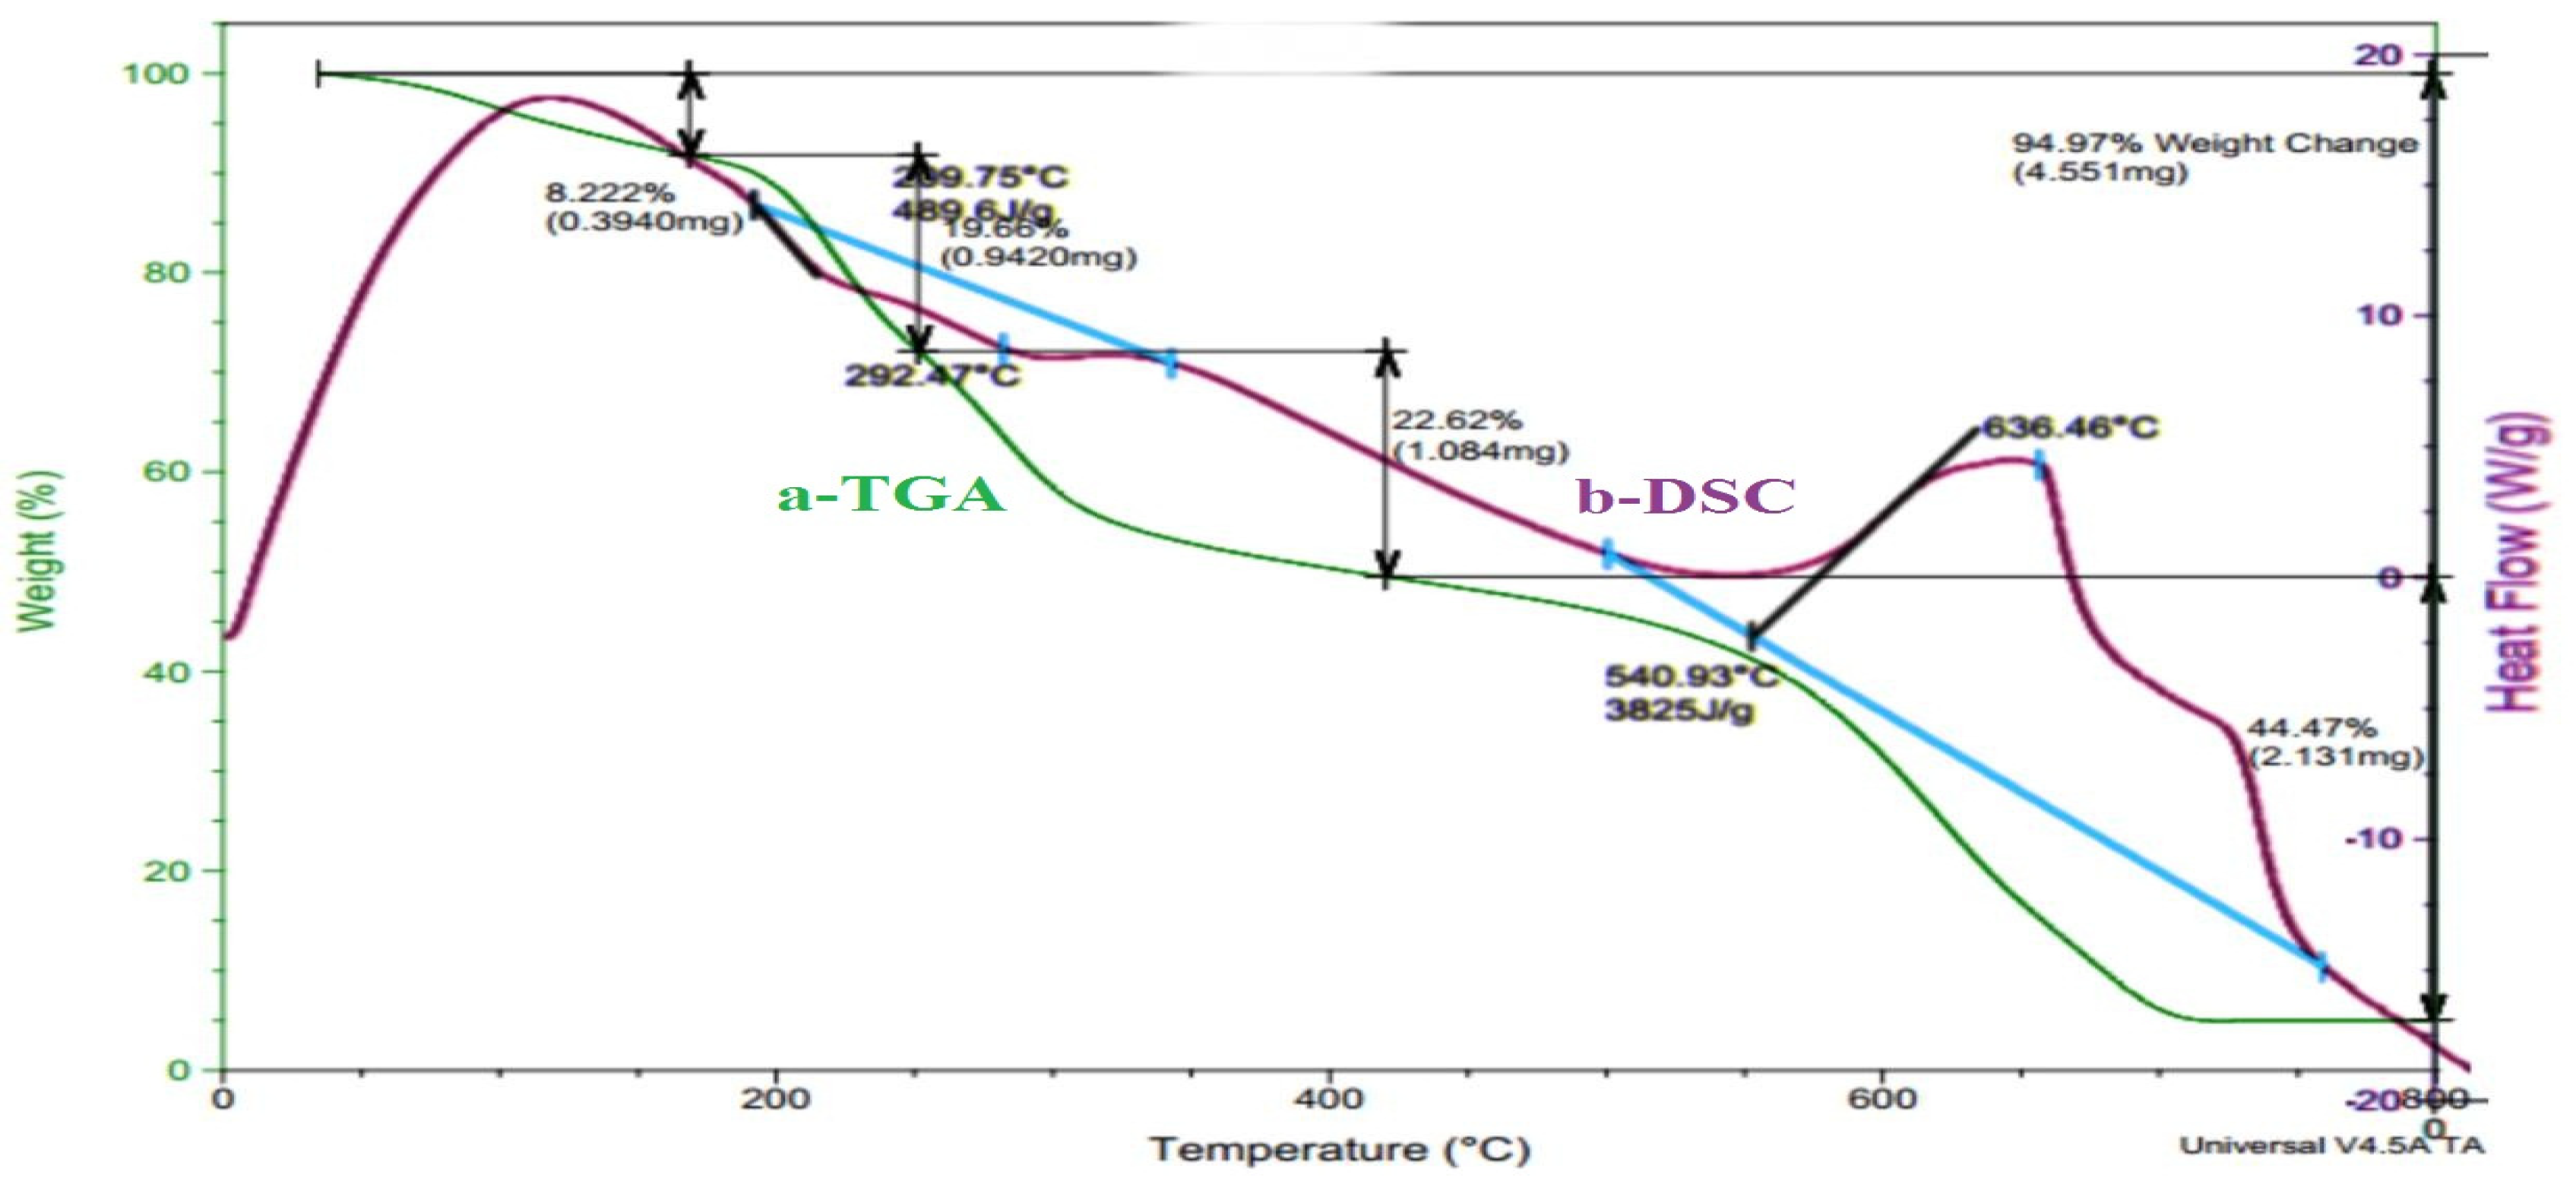
f) +488.2 J/g at 184.7°C and +579.8 J/g at 482.6°C means the hydrogel composites has crystalline structure and the final hydrogel has stable structure need high energy for thermal decomposition. Whereas, the thermal analysis of CS/GA-CH hydrogel has less thermal stability as shown in (
Figure 4(a and b) and
Table 3). Where the all weight loss percentages of the hydrogel at IDT, FDT, T
max and T
cr (
Table 3) shows less values in comparison with those of PVA/GA-PH hydrogel. Even the DSC thermogram (
Figure 4b and
Table 3) has shown one ∆H
f with endothermic behavior +489.6J/g at 209.8°C and one ∆H
f with high value exothermic behavior -3825J/g at 540.9°C. Where the endothermic behavior was belonged to GA and MBA due to their crystalline structure, while the exothermic behavior was belonged to CS due to its amorphous structure.
3.1.3. XRD studies
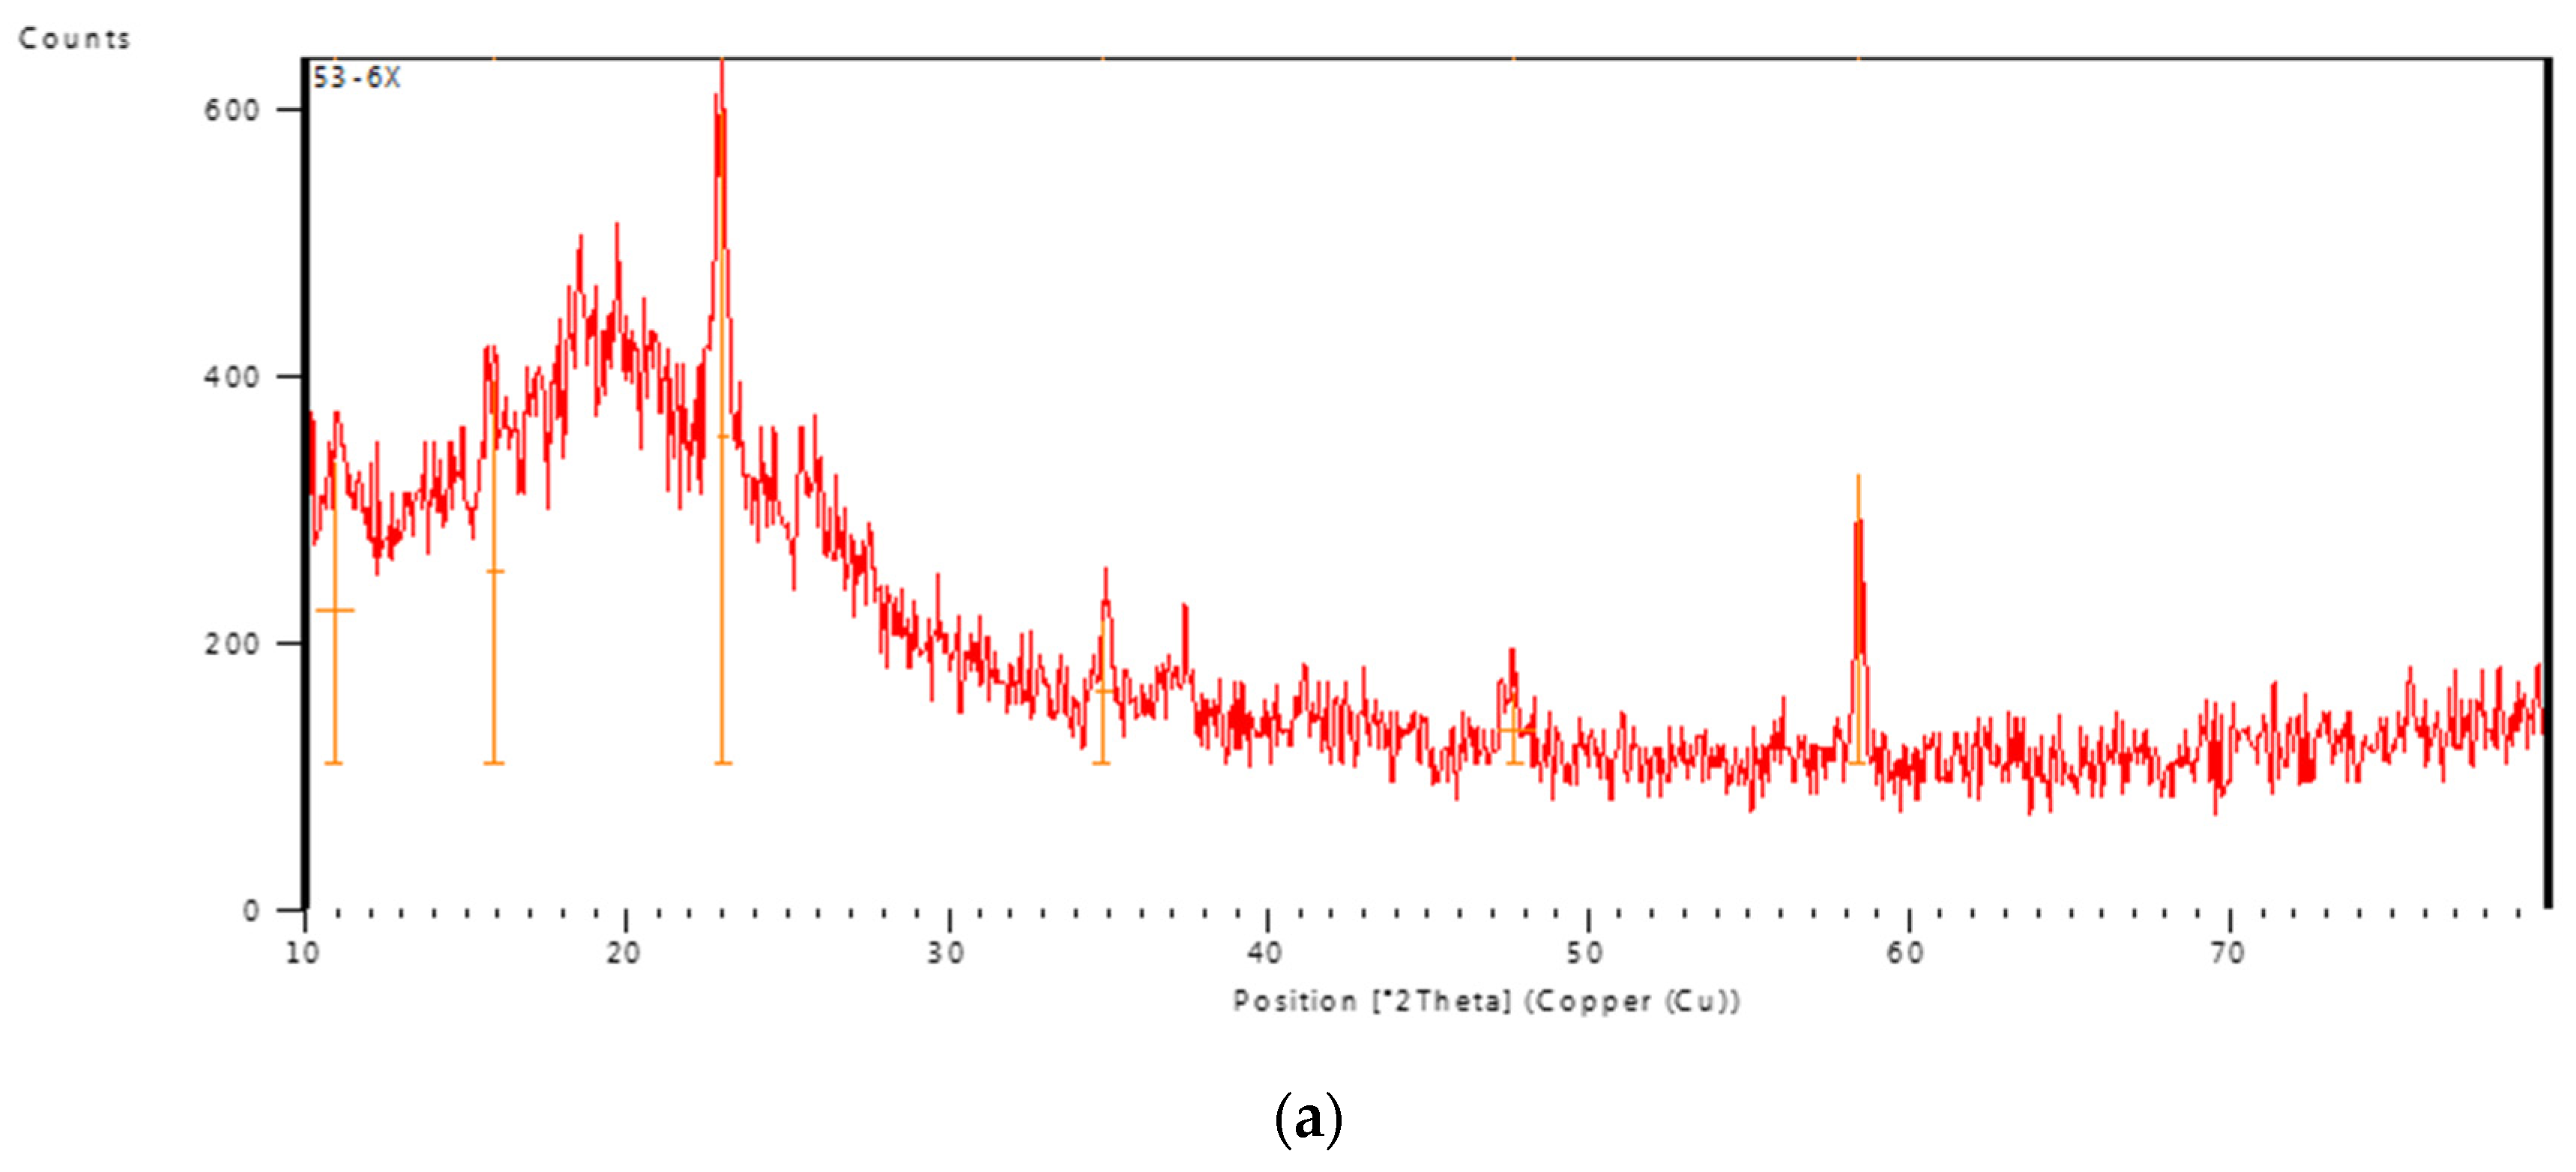
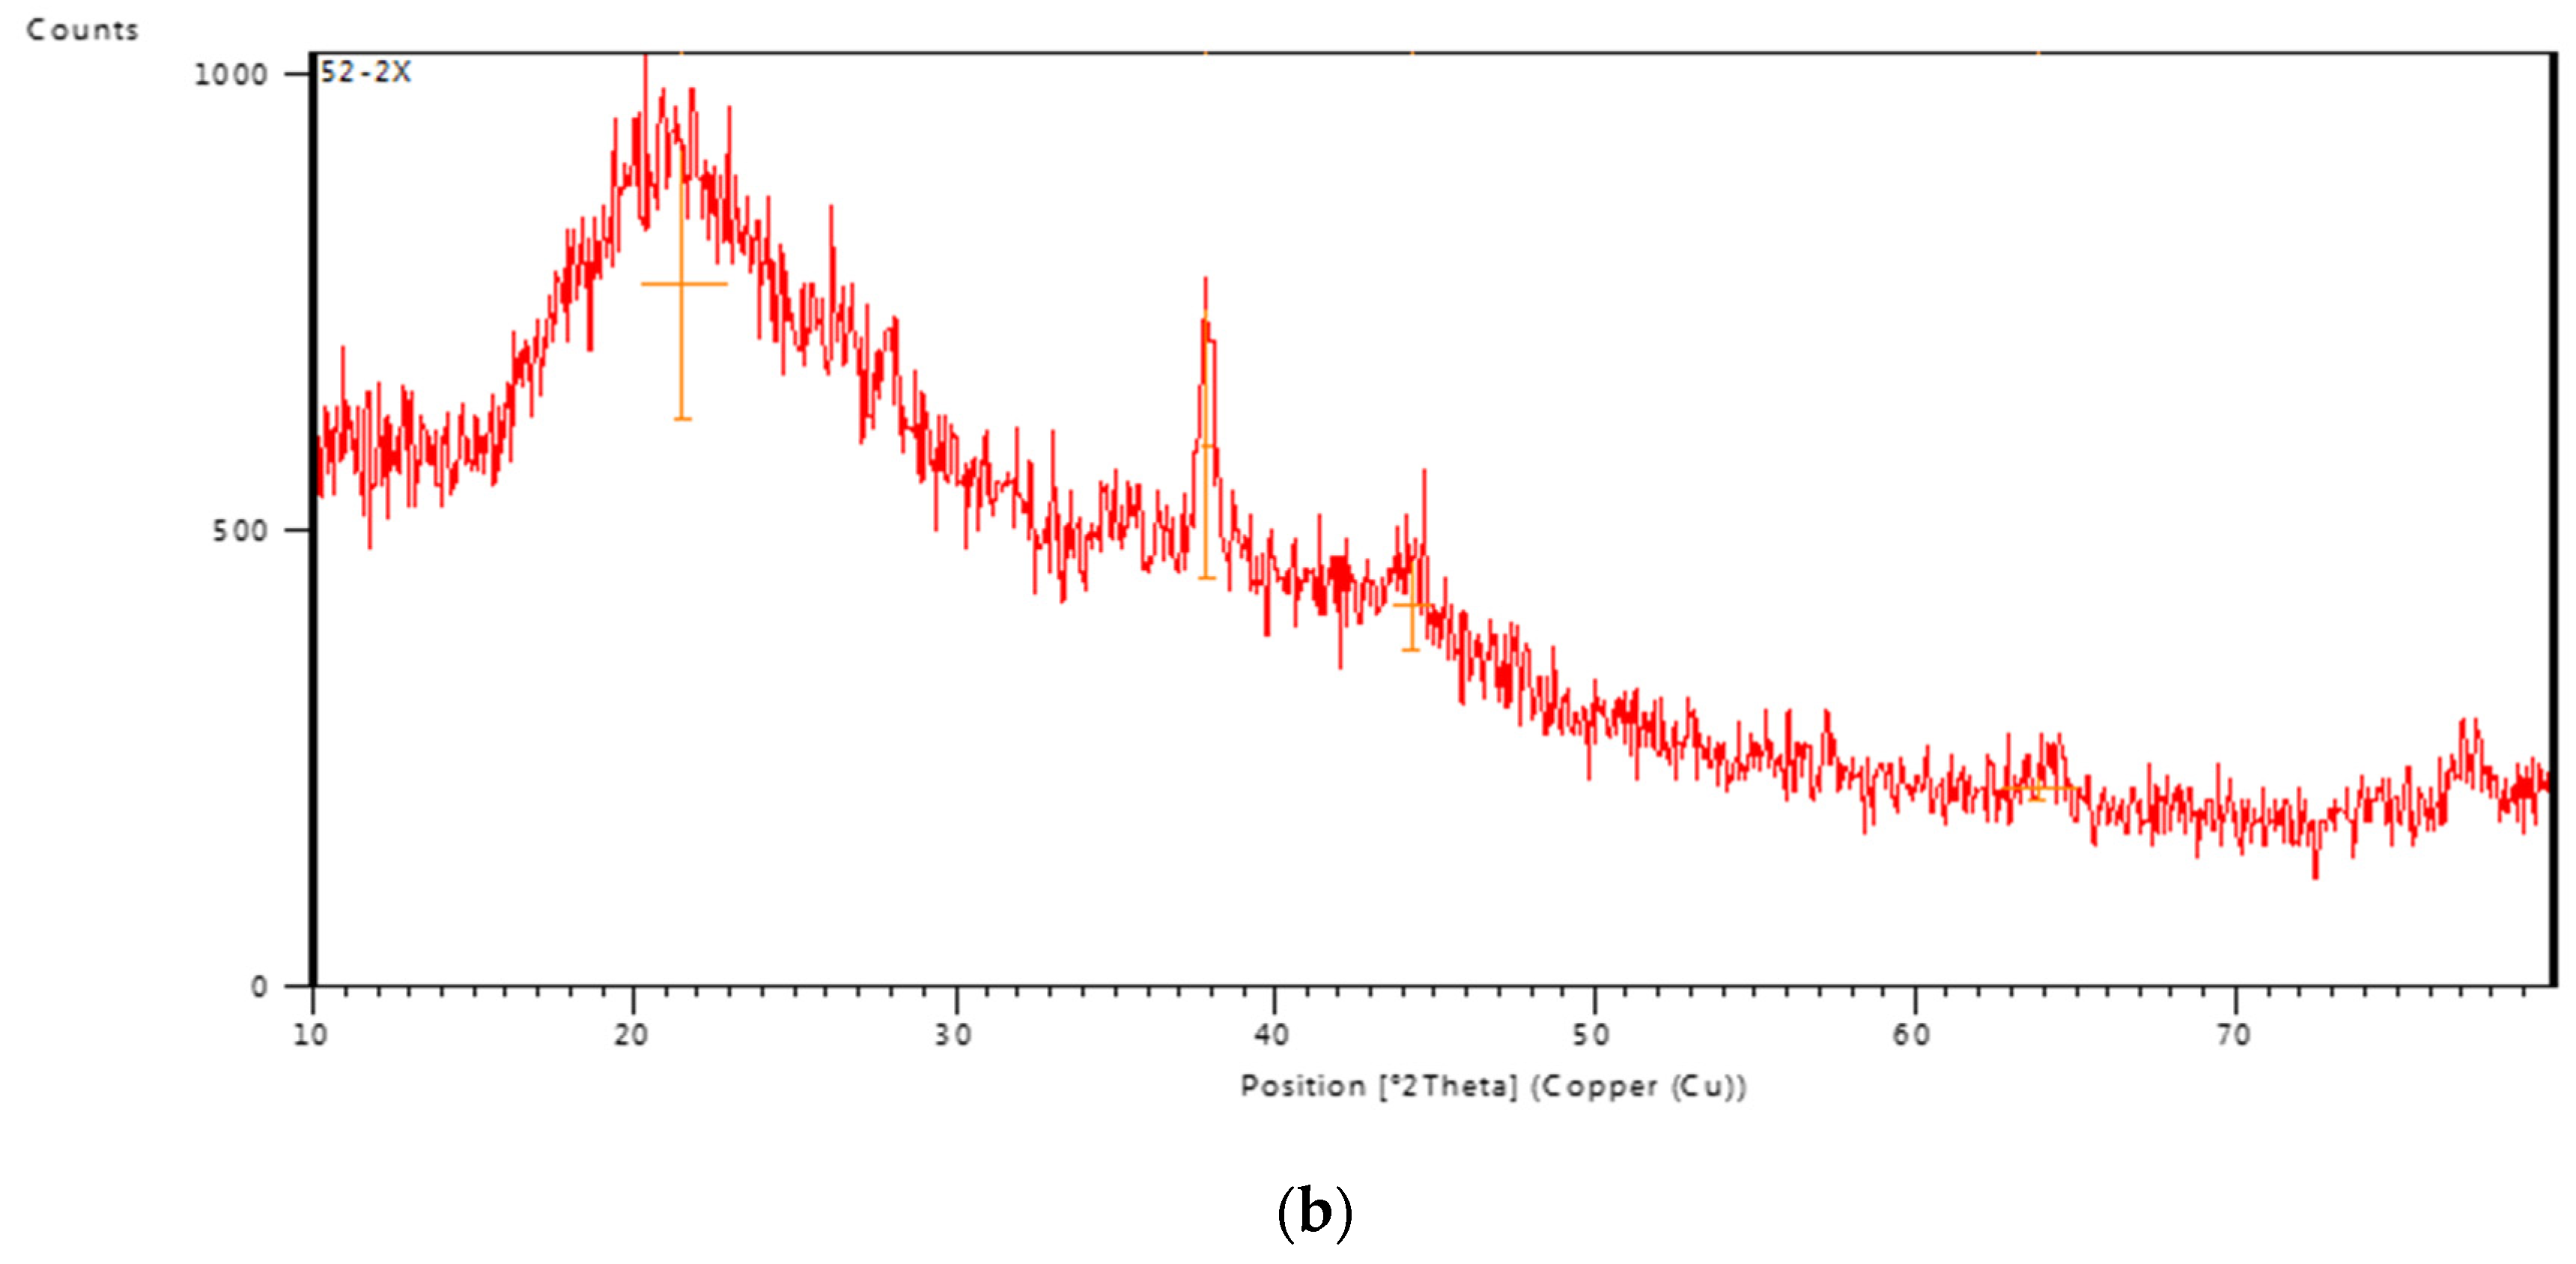
X-ray diffraction pattern of PVA/GA-CH hydrogel (
Figure 5a) showed the PVA in the hydrogel has crystalline structure because of the presence of partially crystalline structure [
16], beside the enhancement of its crystallinity through the chemical cross-linking of the hydrogel. Whereas, the XRD pattern of CS/GA-PH hydrogel (
Figure 5b) shows less crystallinity due to the amorphous structure of both polysaccharide polymers. Moreover, the physical cross-linking could enhance the crystallinity of the hydrogel structure through the ionic interaction [
17].
3.1.4. SEM studies.
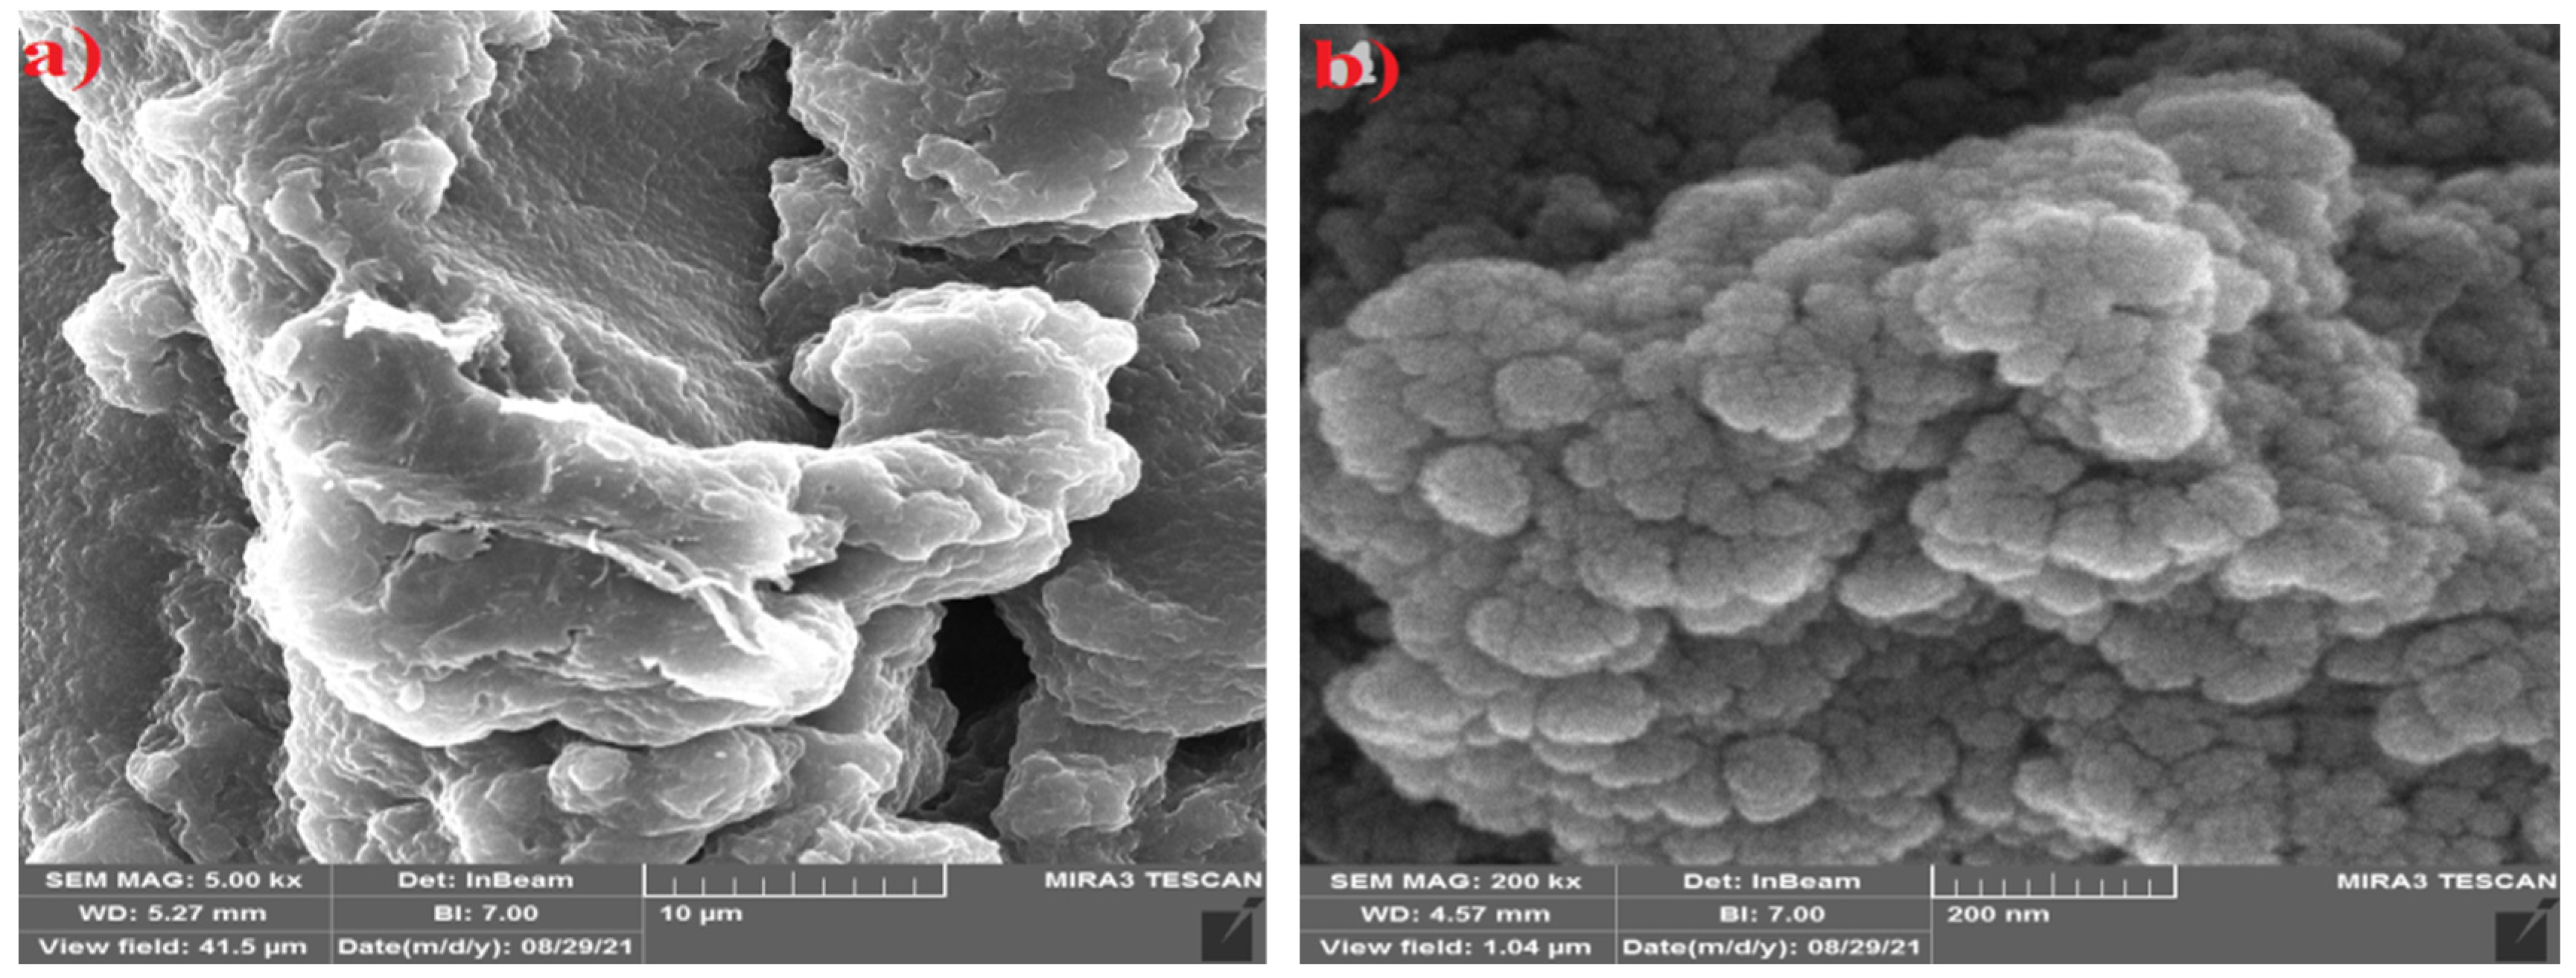
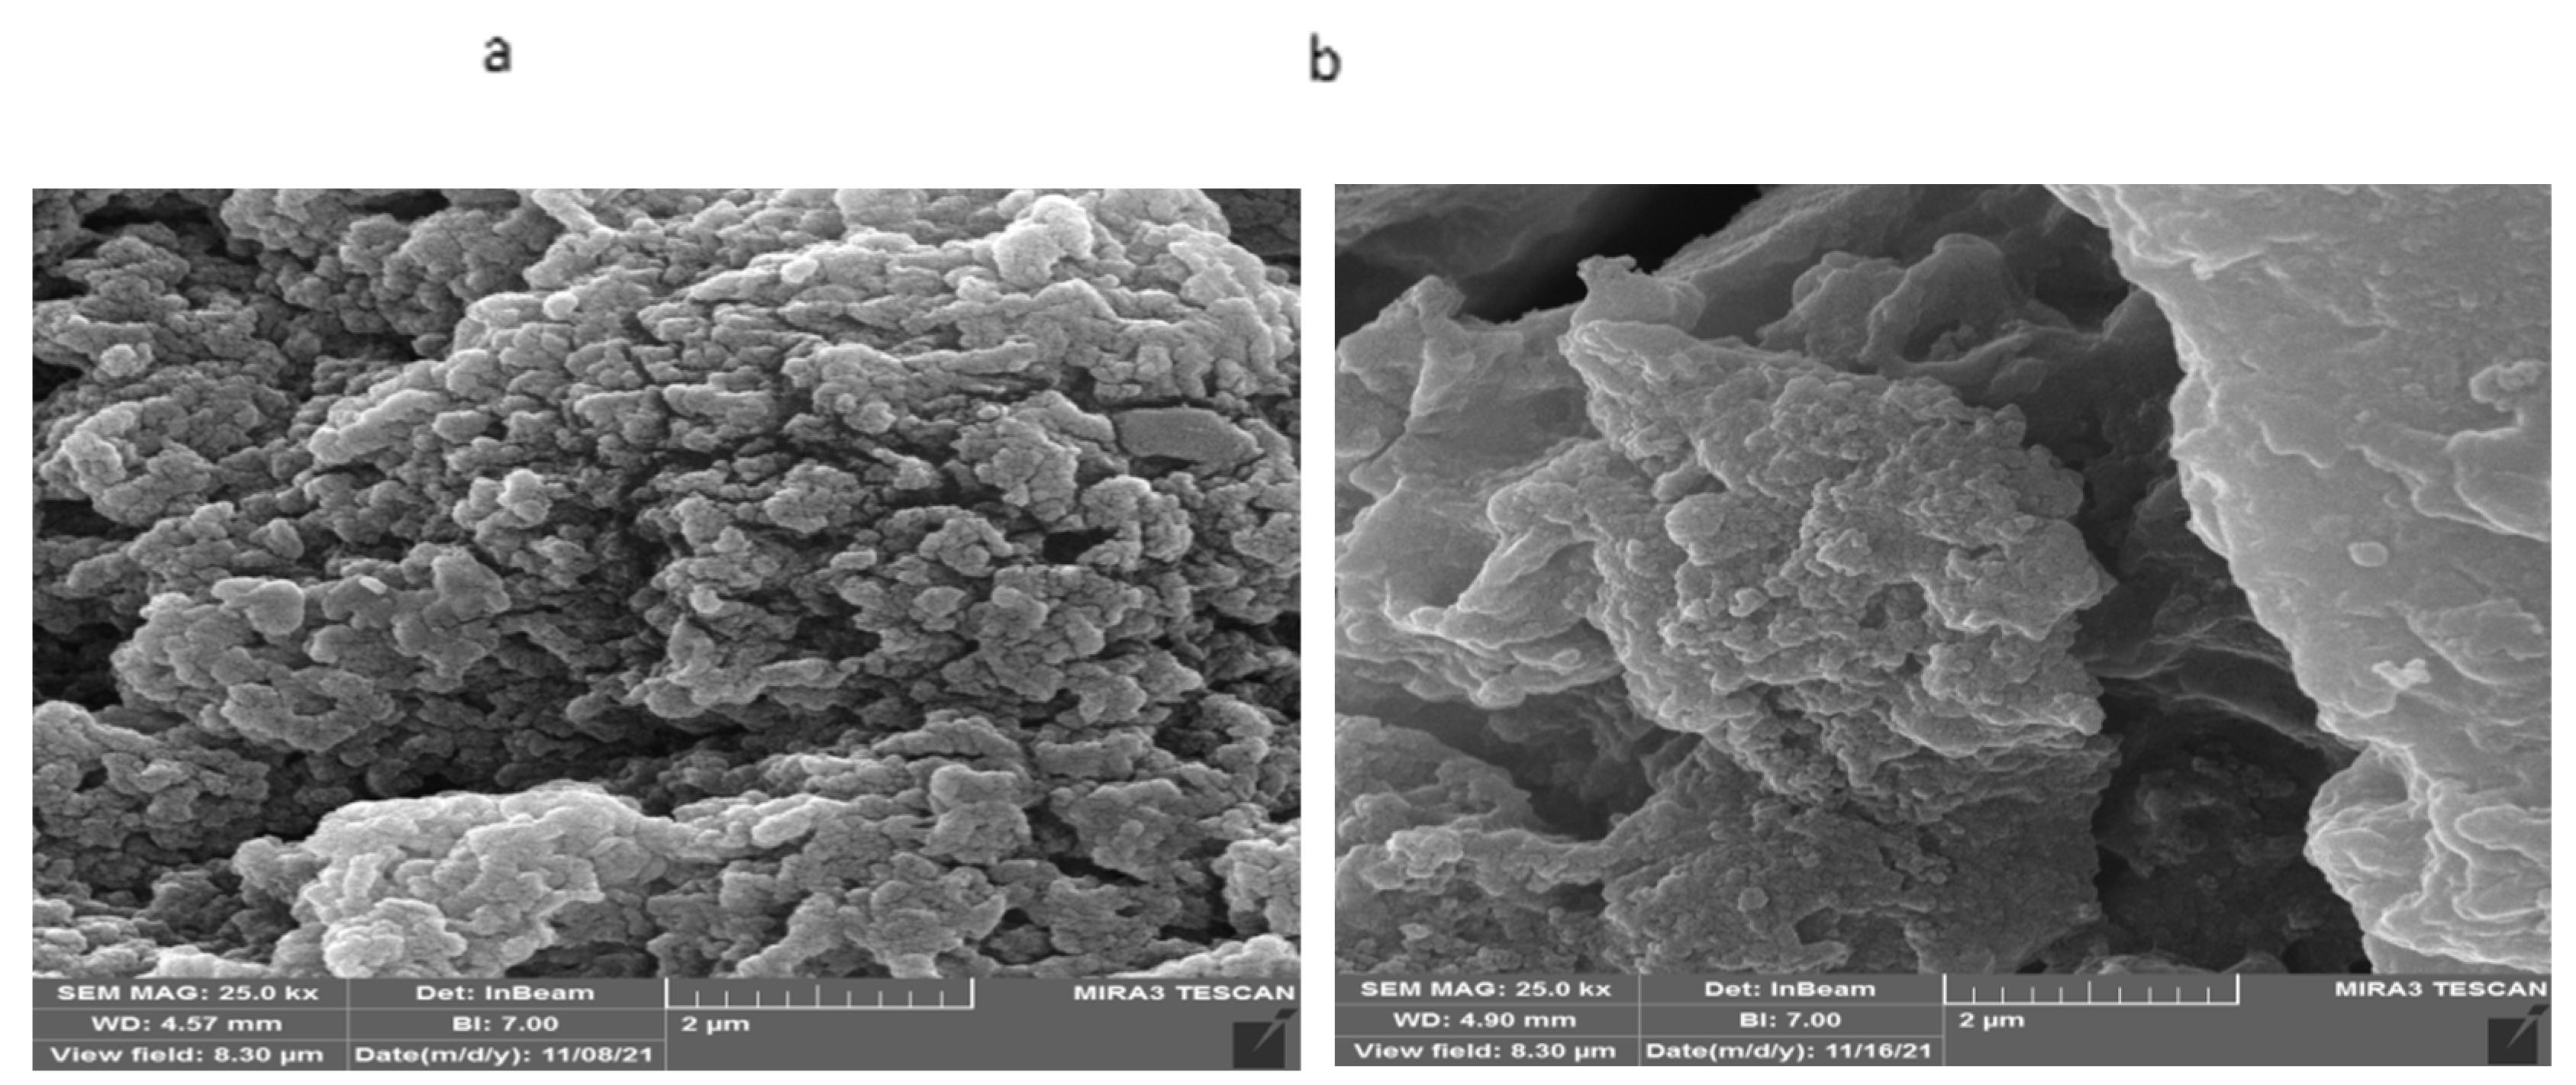
The SEM images of PVA/GA-CH and CS/GA-PH hydrogels were studied. The SEM image of PVA/GA-CH hydrogel (
Figure 6a) has shown corrugate and folded surface of homogenous composite with holes, beside an irregular morphological surface. The white portion indicate the presence of the crystalline region among the hydrogel specimen.
The SEM image of CS/GA-PH hydrogel (
Figure 6b) has shown gathering clusters of particles have microsphere shapes and the morphological surface shows low crystalline structure and has homogeneous composite.
3.1.5. Swelling studies .
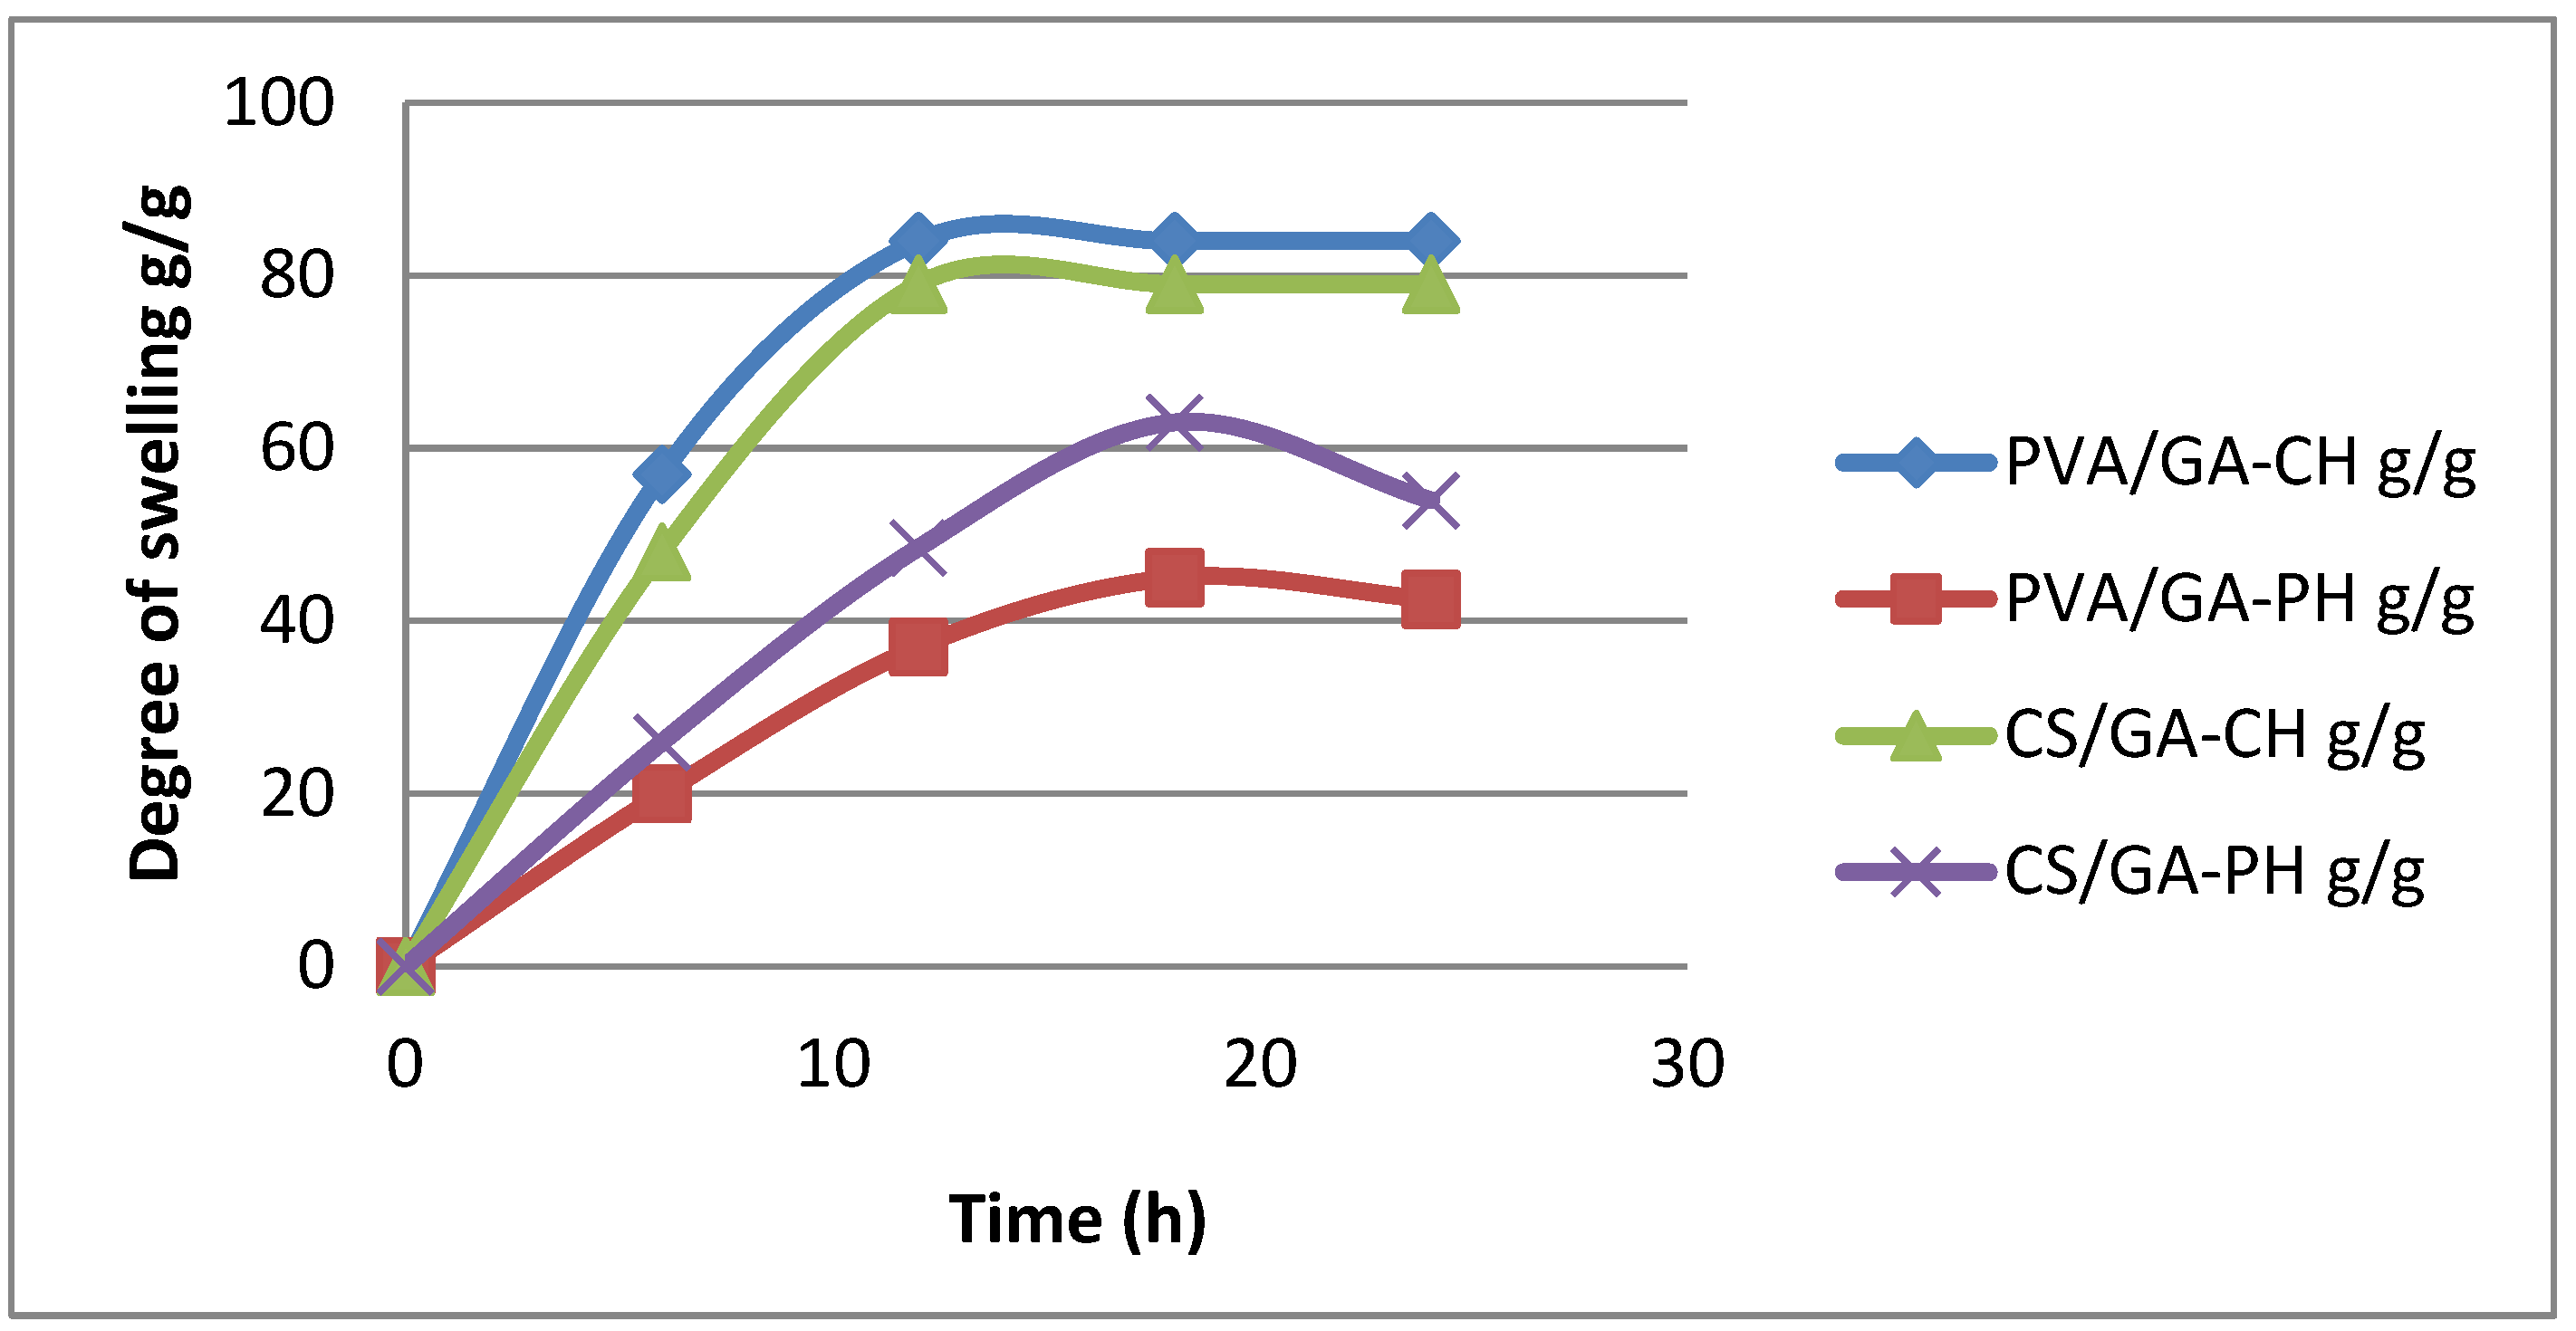
In general, the prepared hydrogels gave disparate DS in different swelling medium and at different range of temperatures. However, PVA/GA-CH hydrogel show up (
Figure 7) high DS 84g/g in RW and at 10
oC which means the functional groups of the hydrogel are hydrolyze and create ionic repulsion force between the hydrogel chains which elevate its degree of swelling [
18,
19]. Whereas, its DS in pH4 was 45g/g because of its functional groups in pH4 medium which are hydrolyze and cause ionic attractions between the hydrogel chains and decrease its DS [
20].
Similarly, the PVA/GA-PH hydrogel has shown (
Figure 7) high DS 75g/g in PH9 at 30
oC. Most probably because of the repulsion occur between the hydrogel chains in pH9 solution which enhance the repulsion which already occur because of the physically cross-linking. Whereas, the DS of the hydrogel in pH4 is 41g/g, where the acid medium may decrease the repulsion between the hydrogel chains.
The DS of CS/GA-CH hydrogel (
Figure 7) was 63g/g in pH4 at 30
oC. While, the CS/GA-PH hydrogel shows DS 79g/g in pH9 and at 30
oC. Where the chitosan in the chemical cross-linked hydrogel is protonated in acidic medium (pH4) and promote the DS of the CS/GA-CH hydrogel. While in CS/GA-PH hydrogel, the gum Arabic molecules and because of its slight acidic nature may cause repulsion between the hydrogel chains beside those caused by the physical cross-linking of the hydrogel, the DS was high [
21].
3.1.6. Water-retention studies
The water-retention in agricultural soil mixed with suitable percentage of the hydrogel was studied. In general, the agricultural soil has limited capacity for water retain, especially in hot region and because the hydrogels can imbibe water many times their weights and retain the water for a long time and not dispense with it easily [
22], therefor the hydrogel can be used for irrigation of the plants.
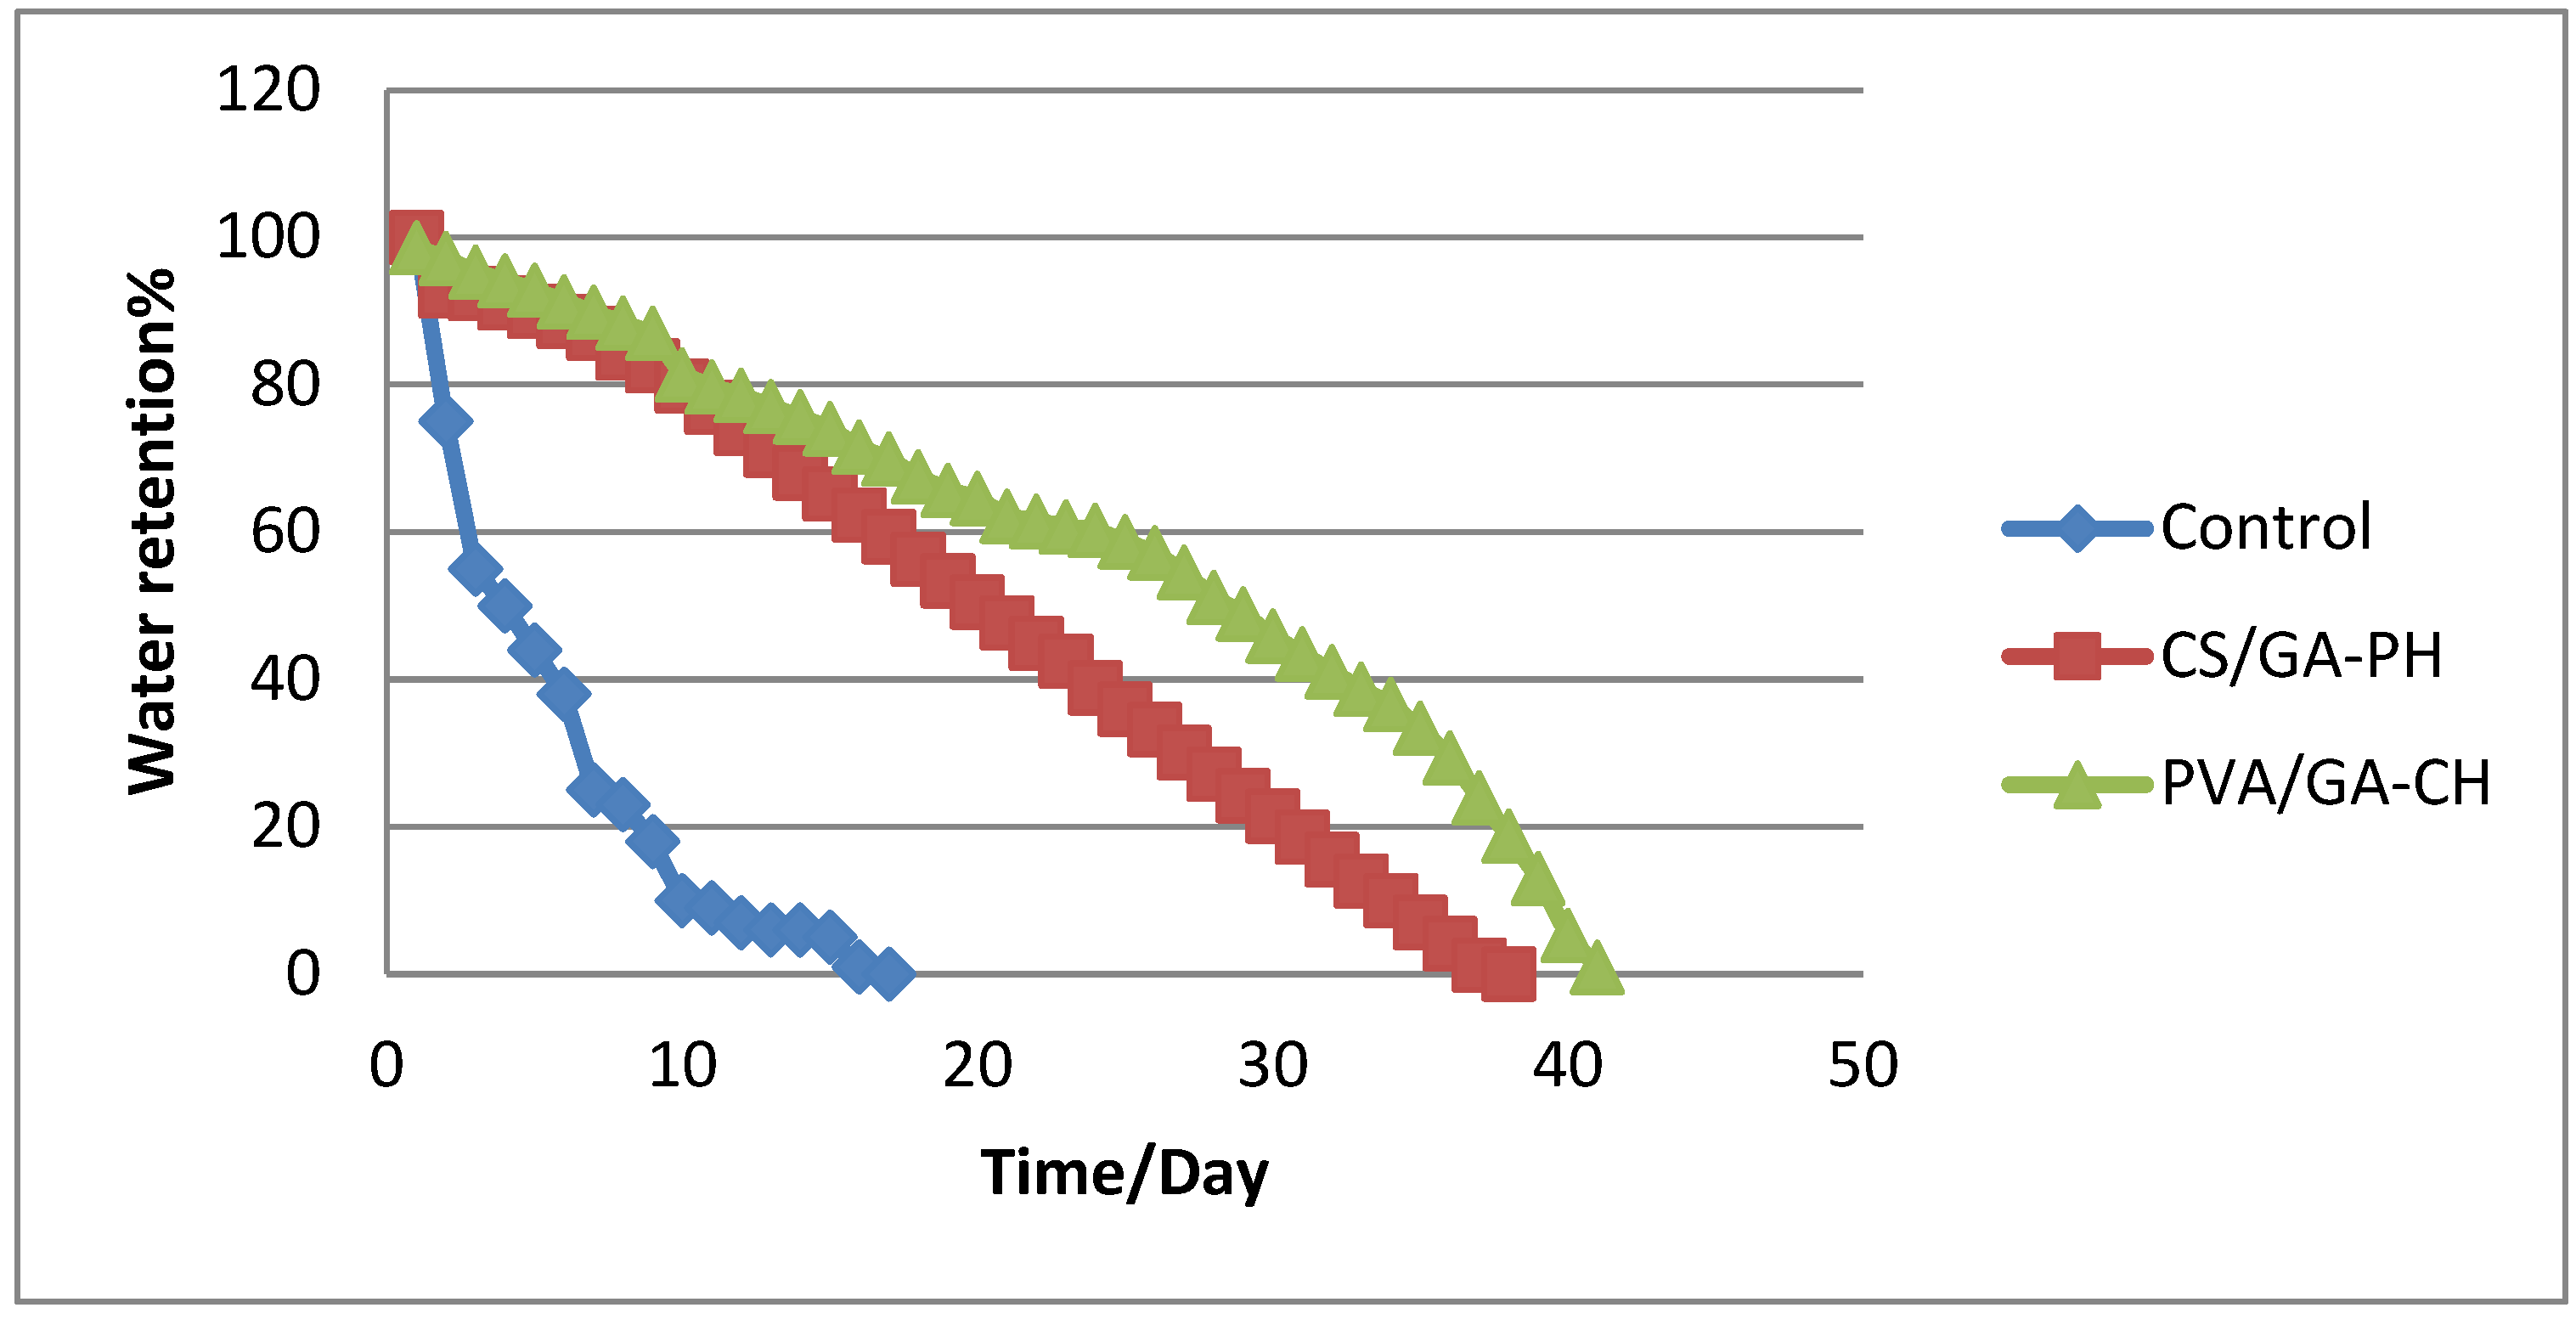
Therefore, the water-retention percentage (WR%) was calculated using Eq.2 for a composite of soil with PVA/GA-CH hydrogel which studied because of its high DS and the cohesion of its structure. Where the sample of soil/hydrogel composite shows retention of water in the soil and maintain moisture for 42 days (
Figure 8), In the same time, the composite of soil/ CS/GA-PH hydrogel has shown 38 days (
Figure 8). But the control sample show up only 20 days of water retention inside the soil sample under the same conditions.
3.1.7. Loading of urea fertilizer on hydrogel microspheres
The Studied maximum loading percentage (Lmax%) of urea in the PVA/GA-CH hydrogel was 89% after 12h, means the hydrogel need time to reach its maximum degree of swelling. The high loading percentage in the hydrogel was due to the corrugates and folds beside holes present in the hydrogel of irregular morphology which increase the efficient loading.
Whereas, the Lmax% of urea in the PVA/GA-PH hydrogel was 36.35% after 6h and keep low even after long time. In general, the physical cross-linking may cause interfere between urea ions and SHMP ions and stop the loading process of urea inside the core of the hydrogel particles.
Similarly, the Lmax% of urea inside CS/GA-CH hydrogel was 45% at 12h. The low percentage of loading attributed to the ionic status of the hydrogel with those of urea are in repulsion situation cause depression in loading process inside the hydrogel.
Whereas, the Lmax% of urea in the CS/GA-PH hydrogel was 79.75% at 12h. The high loading percentage means cationic nature of chitosan could decrease the interfere between urea ions and those of cross-linker and allow urea molecules to reach the core of the hydrogel easily.
The aforesaid results of the maximum loading percentages of urea have shown that the PVA/GA-CH and CS/GA-PH hydrogels were high and they are more appropriate to study their release behavior.
3.2. Characterization of loaded hydrogels
3.2.1. FTIR spectroscopy analysis
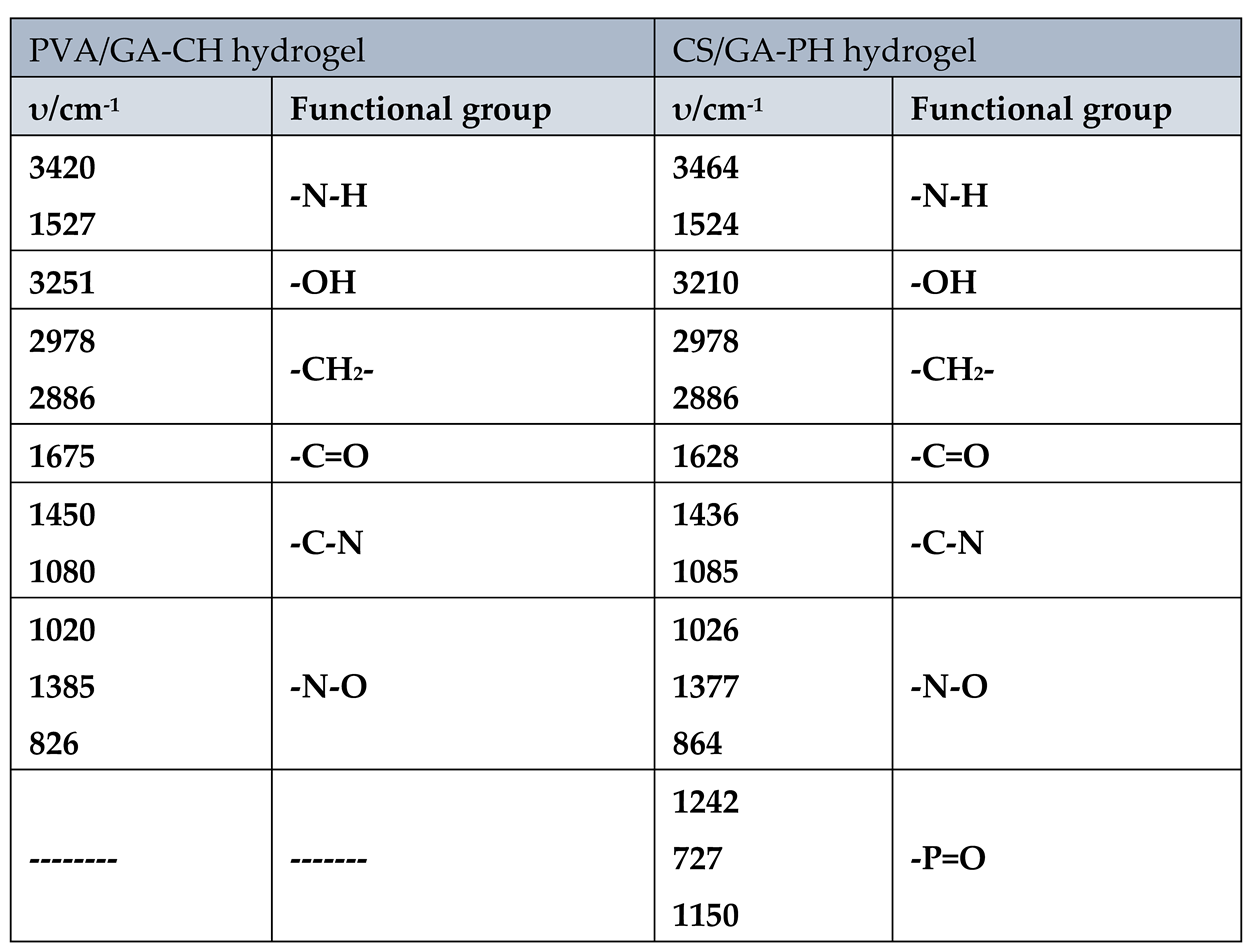
The FTIR characteristic frequencies of the important functional groups of urea loaded PVA/GA-CH and CS/GA-PH hydrogels were listed in
Table 4.
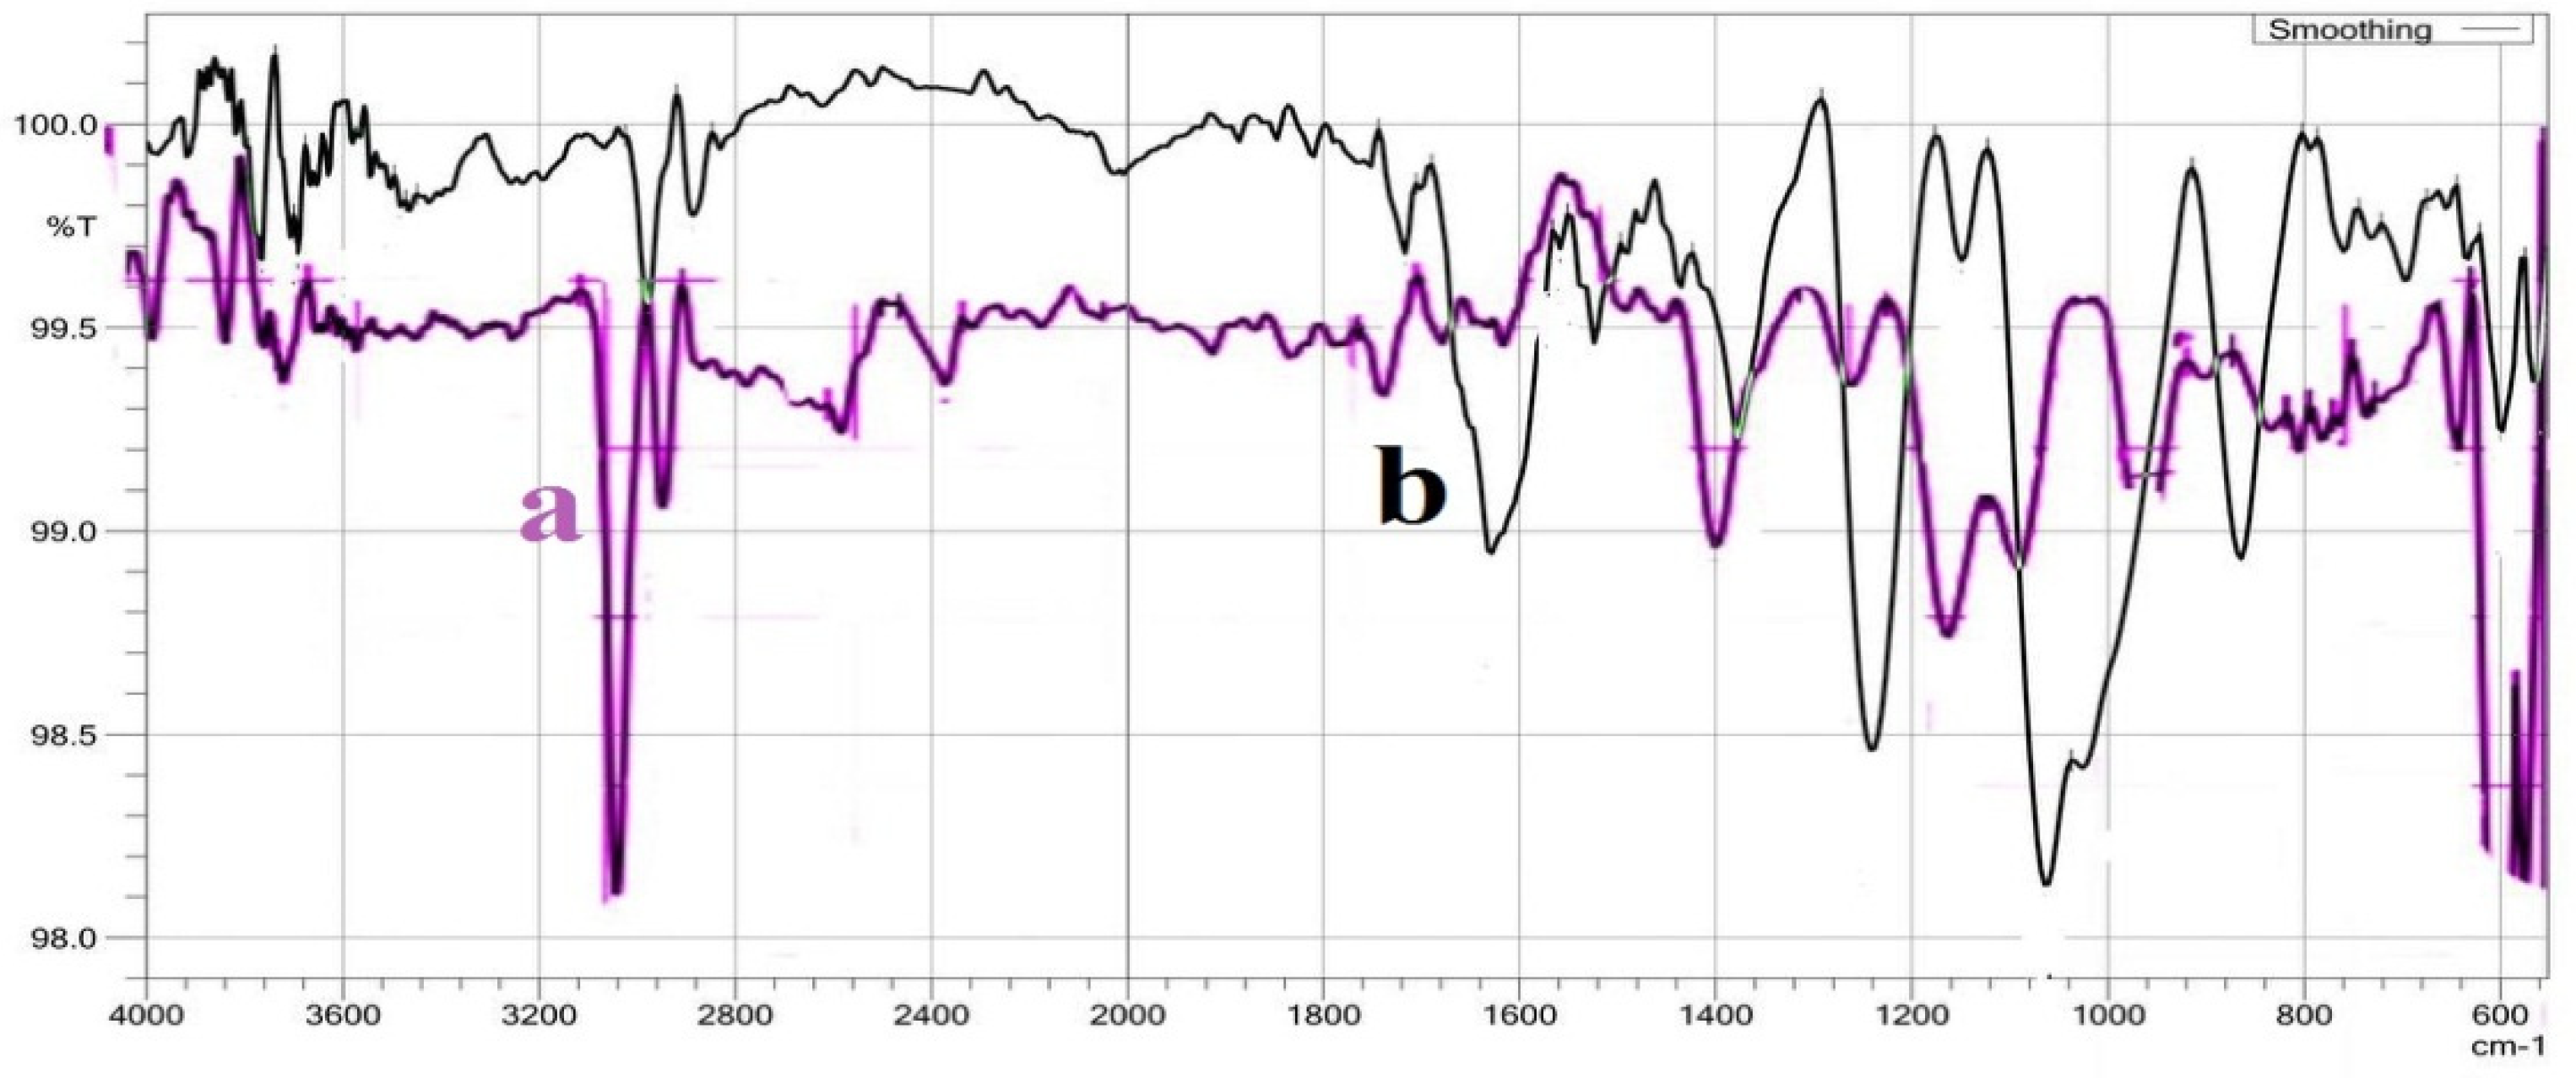
The FTIR spectra of PVA/GA-CH hydrogel (
Figure 9a and
Table 4), where shows the important functional groups of urea. The absorption bands at (3420 and 1527) cm
-1 are represent the –N-H of urea. Whereas, the absorption band at 3251 cm
-1 is belongs to –OH of PVA and GA polymers. The bands at (1450 and 1080) cm
-1 are belongs to the C-N of urea.
Whereas, the bands at (1020, 1385 and 826) cm
-1 are belong to the loaded urea. Similarly, the FTIR spectra of CS/GA-PH hydrogel (
Figure 9b,
Table 4), shows absorption bands similar to those of PVA/GA-CH hydrogel (
Figure 9a,
Table 4), only some extra bands appear at (1242,727 and1150) cm
-1 which are represent (–P=O) functional group of SHMP in CS/GA-PH hydrogel.
3.2.2. SEM studies of loaded hydrogels
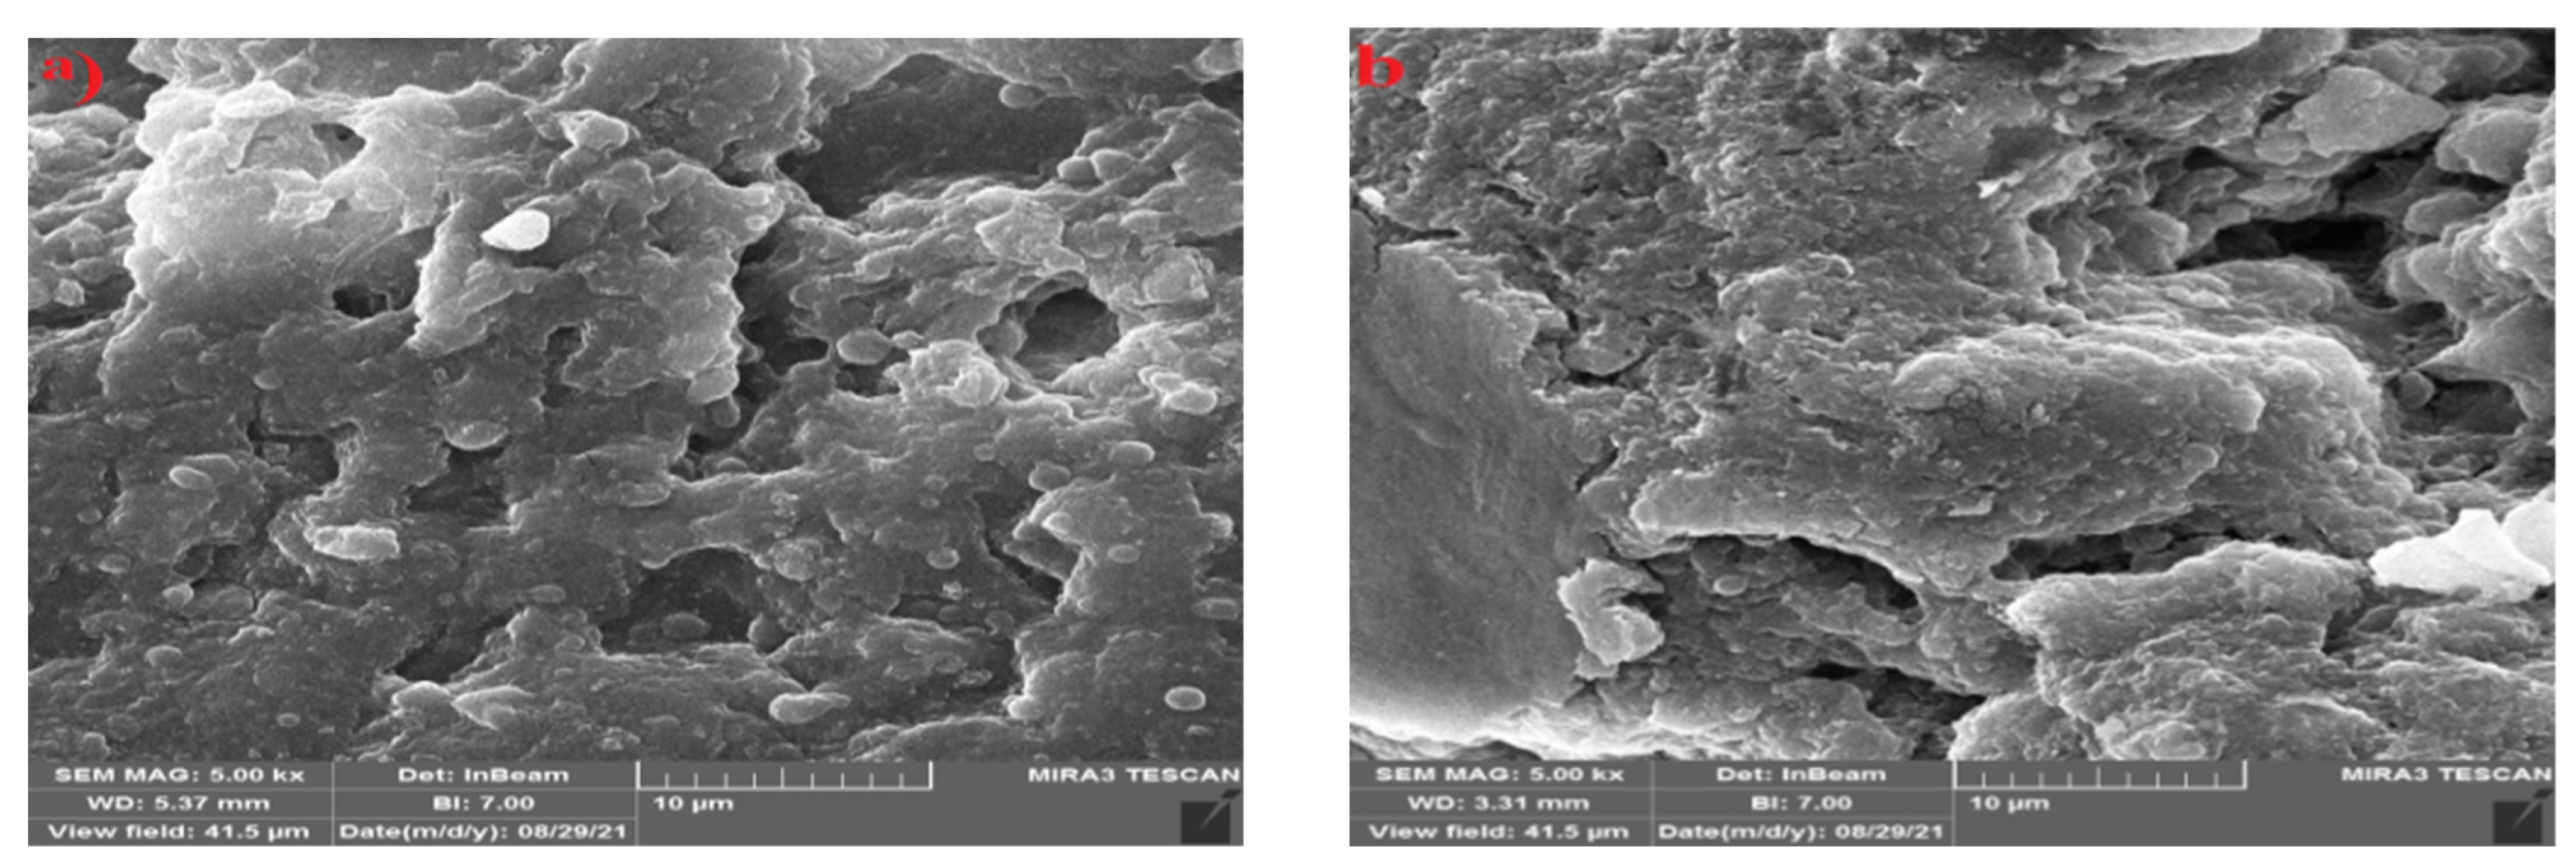
The SEM images of the loaded hydrogels have shown the urea particles interspersed between the hydrogel folds. The SEM images of PVA/GA-CH hydrogel (
Figure 10a) after loading shows the crystalline structures of urea appear as shinning regions nested between the hydrogel folds.
In the same time the SEM images of CS/GA-PH hydrogel after loading (
Figure 10b) shows the homogeneity of the hydrogel with urea particles which seems as shiny particles and the composite appears as coherent paste (
Figure 10b) with a lot of holes and folds
3.2.3. Release of urea from the loaded hydrogels
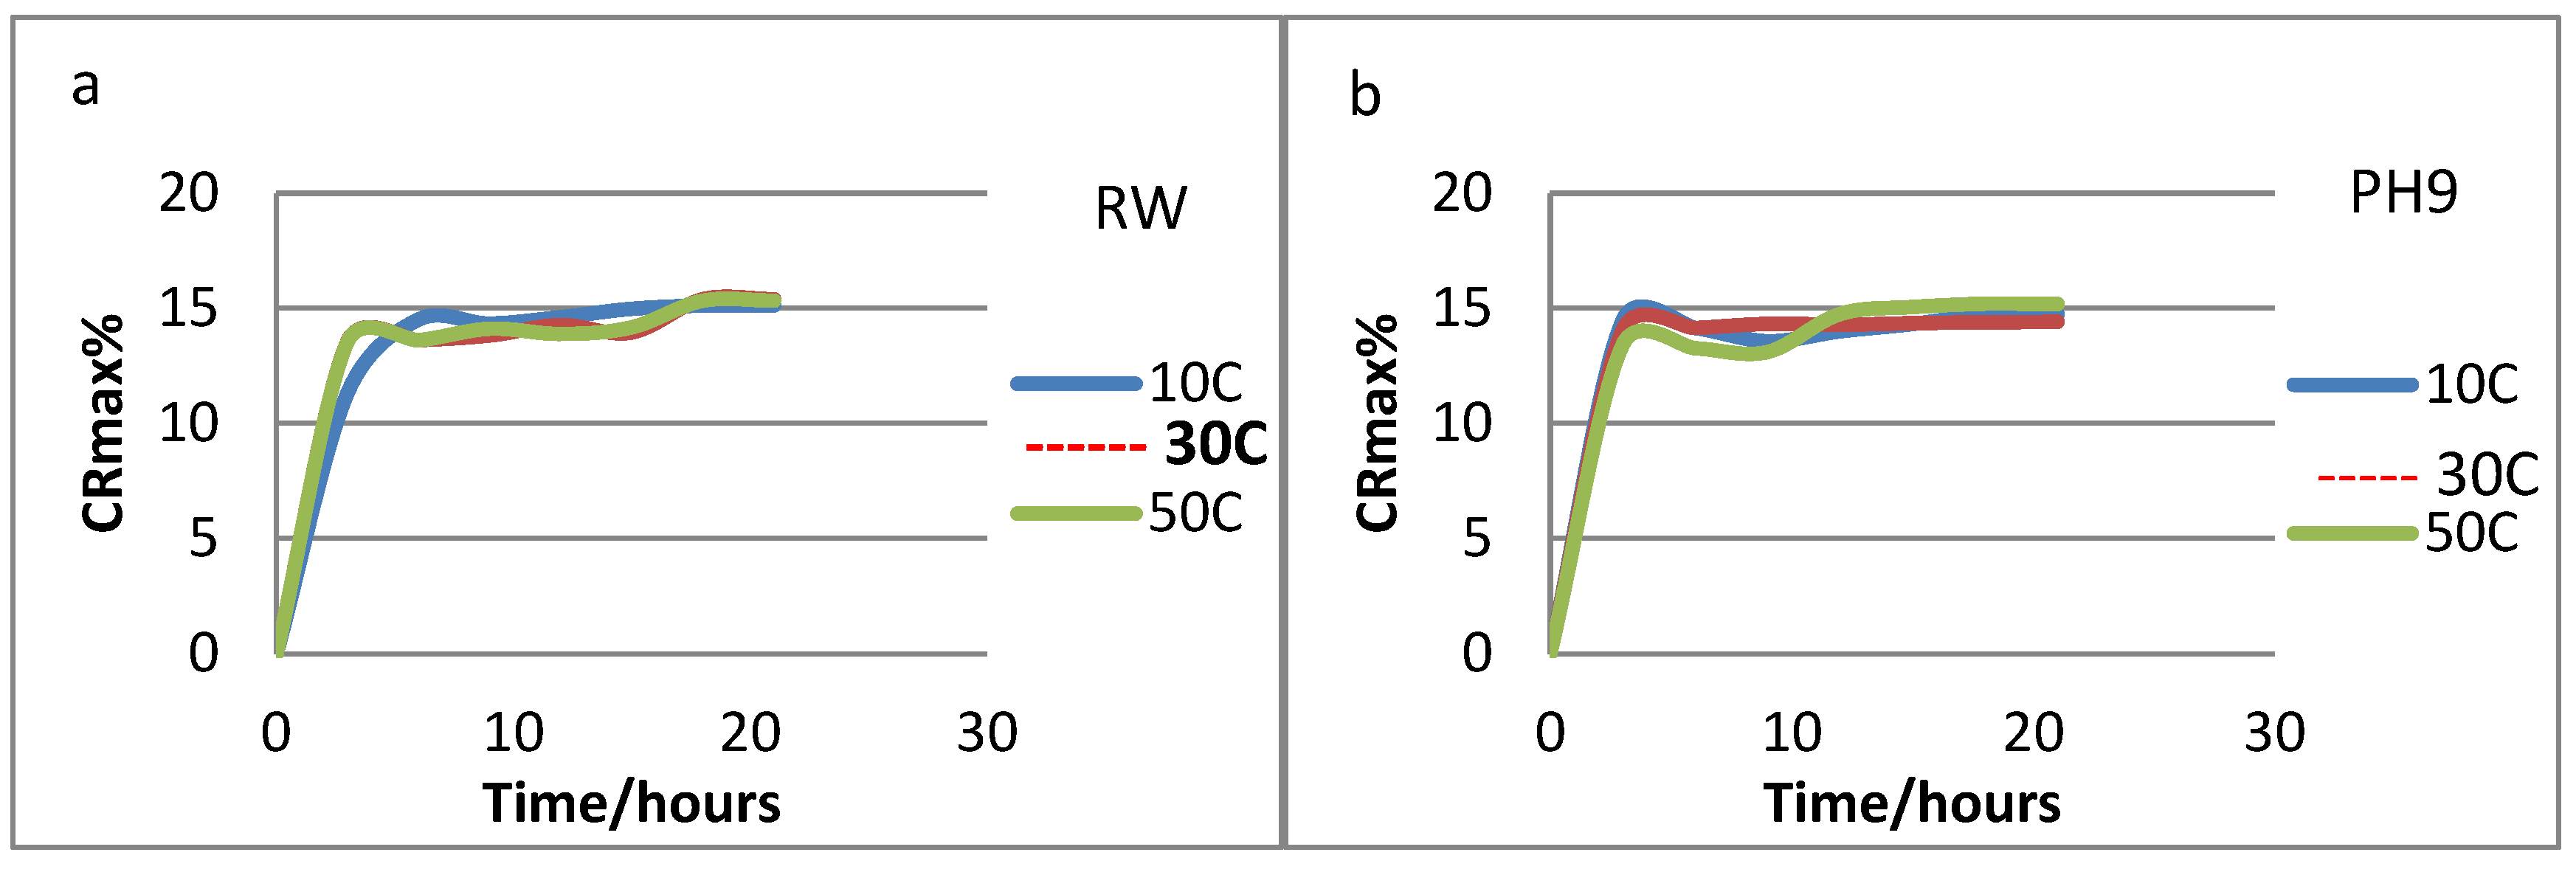
The release of urea from PVA/GA-CH and CS/GA-PH hydrogels were studied with two variables are the temperatures and the types of the release solution. The concentration of the released urea was measured each 3h and Eqs. (5 and 6) were depends. It was found that the suitable release medium for PVA/CS-CH hydrogel was RW (
Figure 11a), were the hydrogel start with burst release of urea for about 5hr, and then followed with controlled release for about 20hr, where it liberates most of its loaded urea at 10
oC, and most probably because of its maximum degree of swelling at that temperature.
Similarly, the CS/GA-PH hydrogel (
Figure 11b) has shown a controlled release behavior in a pH9 release medium and at 30
oC and this was because of its high degree of swelling. The behavior of the release curves of CS/GA-PH hydrogel was shown (
Figure 11b) more controlled behavior curve in comparison with the release curve of PVA/GA-CH hydrogel (
Figure 11a). Means the CS/GA-PH hydrogel chains are necessarily swell in order in pH9 solution to a point which allow the polymer to release in a controlled way. Therefore, most probably charges of chitosan and its functional groups beside those of the cross-linker (SHMP) would enhance the hydrogel to release in a controlled manner.
3.3. Characterization of the hydrogels after release
3.3.1. FTIR studies
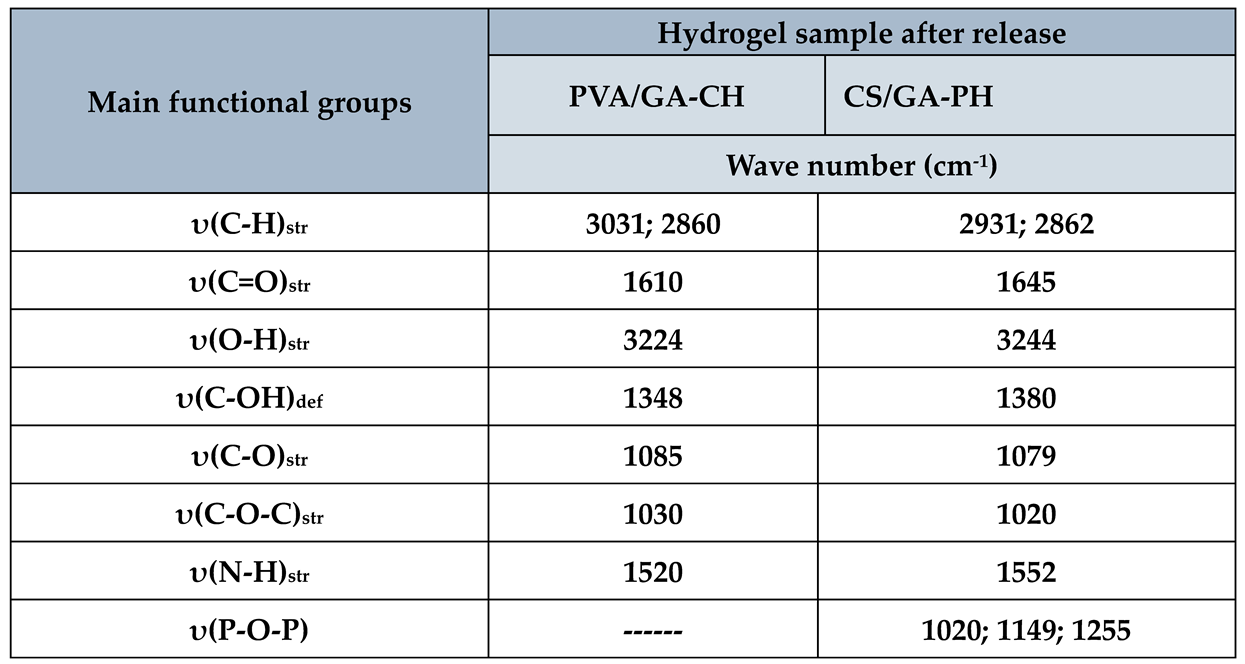
The FTIR spectrum of PVA/GA-CH and CS/GA-PH hydrogels after release have shown (
Table 5) the important characteristic functional groups of the hydrogel without loaded urea. Certainly, the presence of the main functional groups of the hydrogel beside its cross-linker after release process, means the hydrogel is able to retain its basis composition many times for loading and releasing of agrochemicals.
3.3.2. SEM studies
The SEM images of the studied hydrogels after release shows that the hydrogels are capable to keep their textures and fabric complete and well knit. The SEM image of PVA/GA-CH hydrogel (
Figure 12a) shows microspheres contain empty holes most probably those holes are representing the release molecules of urea. The disappear of the whiten spots (
Figure 10a) indicate the release of the crystalline particles of loaded urea.
Similarly, the SEM image of CS/GA-PH hydrogel (
Figure 12b) shows no whiten spots in morphological surface of the hydrogel with deep holes and folds in the hydrogel composite. In addition, the SEM image (
Figure 12b) shows pure hydrogel form with no crystalline particles of the loaded urea and its composition is compact and appears in a flexible form.
4. Conclusion
Two main hydrogels were prepared from the polysaccharides chitosan (CS) and gum Arabic (GA) were copolymerized with the well-known synthetic polymer poly(vinyl alcohol) (PVA) and the cross-linked chemically by MBA and physically by SHMP. The study included the exploitation of the large-scale water storage tendency of hydrogels in storing water or agrochemicals in hydrogels and then allow to release regularly. The degree of swelling of the hydrogels showed great variation depending on their compositions, type and temperature of the swelling medium. Therefore, PVA/GA-CH and CS/GA-PH hydrogels getting high DS in RW at 10oC and pH9 at 30oC respectively. The prepared hydrogels have shown high water-retention in agricultural soil and for a long time especially PVA/GA-CH and CS/GA-PH hydrogels getting high DS in RW at 10oC and pH9 at 30oC respectively. The prepared hydrogels have shown high water-retention in agricultural soil and for a long time especially PVA/GA-CH and CS/GA-PH hydrogels where showed retain water for 42 days and 38 days respectively, whereas the control sample retain water for 20day only. Urea fertilizer was used as model for loading the prepared hydrogels and the Lmax% of urea was reached its maximum in PVA/GA-CH hydrogel 89% after 12h in loading medium. The second high Lmax% was recorded for CS/GA-PH hydrogel 79.75% after 12h and both are loaded high due to their high DS. The loaded urea was allowed to release from their host hydrogels in a suitable medium. Both hydrogels released their loaded urea in a controlled manner and for 24h.The studied hydrogels were characterized using FTIR, 1H NMR, XRD, thermal analysis and SEM analysis.
Author Contributions
Methodology, Fawzi Habeeb Jabrail; Software, Maysam Salih Mutlaq; Investigation, Fawzi Habeeb Jabrail and Maysam Salih Mutlaq; Resources, Roua a Kassim Al-Ojar; Writing – original draft, Fawzi Habeeb Jabrail.
References
- Kabir: M. H., Ahmed, K., Furukawa, H. A low cost sensor based agriculture monitoring system using polymeric hydrogel. Journal of the Electrochemical Society 2017, 164, B3107. [CrossRef]
- Ajuik, T.A; Nokes, S.E.; Montross, M.D.; Wendroth, O. The Impacts of Bio-Based and Synthetic Hydrogels on Soil Hydraulic Properties. Polymer, 2022, 14, 4721–4744. [Google Scholar] [CrossRef] [PubMed]
- Neethu, T. M., Dubey, P. K., Kaswala, A. R. Prospects and applications of hydrogel technology in agriculture. Int. J. Curr. Microbiol. App. Sci. 2018, 7, 3155–3162. [CrossRef]
- Jeong, D. , Kim, C., Kim, Y., Jung, S. Dual crosslinked carboxymethyl cellulose/polyacrylamide interpenetrating hydrogels with highly enhanced mechanical strength and superabsorbent properties. European Polymer Journal 2020, 127, 109586. [Google Scholar] [CrossRef]
- Garbowski,T. ; Bar-Mickalczyk, D.; Charazirnska, S.; Grabowska-Polanowska, B; Kowalczyk, A;Lochynski, P. An Overview of Natural Soil Amendments in agriculture. Soil Tillage Res. 2023, 225, 105462. [Google Scholar] [CrossRef]
- Saha, A.; Sekharan, S.; Manna, U. Superabsorbent Hydrogel (SAH) as a SOIL Amendment for Drought Management: A Review. Soil Tillage Res. 2020, 204, 104736. [Google Scholar] [CrossRef]
- Hasan, H.H.; Razali, M.; Fatin, S.; Muhammad, N. S.; Ahmad, A. Research Trends of Hydrological Drought: A Systamatic Review. Water 2019, 11, 2252. [Google Scholar] [CrossRef]
- Smagin, A.; Sadovnikova, N.; Smagina, M. Synthetic Gel Structures in Soil for Sustainable Potato Farming. Sci. Rep. 2019, 9, 1–15. [Google Scholar] [CrossRef]
- Palmqvist, NGM. Nanoparticles: Case Studies of their Synthesis, Properties and Biological Interaction. 2017.
- Park, S.; Park, K. M. Engineered polymeric hydrogels for 3D tissue models. Polymers 2016, 8, 23. [Google Scholar] [CrossRef]
- Rynkowska, E.; Fatyeyeva, K.; Marais, S.; Kujawa, J.; Kujawski, W. Chemically and Thermally Crosslinked PVA-Based Membranes: Effect on Swelling and Transport Behavior. Polymer 2019, 11, 1799. [Google Scholar] [CrossRef]
- Wu, L.; Liu, M. Preparation and Characterization of Cellulose Acetate-coated Compound Fertilizer with Controlled–release and Water Retention. Polym. Adv. Tech. 2008, 19, 785–792. [Google Scholar] [CrossRef]
- Mutlaq, M.S.; Jabrail, F.H. Controlled Delivery System for NPK Agrochemical Release from Chitosan Copolymer Hydrogels; Amer. J. Appl. Sci. 2022, 19, 84–92. [Google Scholar]
- Gupta, K.C.; Jabrail, F.H. Glutaraldehyde Cross-Linked Chitosan Microspheres for Controlled Release of Centochroman. Carbohy. Res. 2007, 342, 2244–2252. [Google Scholar] [CrossRef]
- Gupta, K.C.; Jabrail, F.H. Controlled-Release Formulations for Hydroxy Urea and Rifampicin Using Polyphosphate-Anion-Crosslinked Chitosan Microspheres. J. Appl. Polym. Sci. 2007, 104, 1942–1956. [Google Scholar] [CrossRef]
- Gaaz, T.S.; Sulong, A.B.; Akhtar, M.N.; Kadhum, A.H.; Mohamad, A.B.; Al-Amiery, A. Properties and Applications of Poly (vinyl alcohol) Halloysite Nanotubes and their Nanocomposites. Molecules 2015, 20, 22833–22847. [Google Scholar] [CrossRef] [PubMed]
- Jampafuang, Y., Tongta, A., & Waiprib, Y. Impact of crystalline structural differences between α-and β-chitosan on their nanoparticle formation via ionic gelation and superoxide radical scavenging activities. Polymers 2019, 11, 2010.
- Djumaev, A., Tashmukhamedova. Physical and chemical properties of PVA-CMC based hydrogel carrier loaded with herbal hemostatic agent for application as wound dressings. National Journal of Physiology. Pharmacy and Pharmacology 2020, 10, 905–909. [Google Scholar]
- Mazuki, N. F. , Majeed, A. A., Nagao, Y., Samsudin, A. S. Studies on ionics conduction properties of modification CMC-PVA based polymer blend electrolytes via impedance approach. Polym. Testing 2020, 81, 106234. [Google Scholar] [CrossRef]
- Žuržul, N. , Ilseng, A., Prot, V. E., Sveinsson, H. M., Skallerud, B. H., Stokke, B. T. Donnan Contribution and Specific Ion Effects in Swelling of Cationic Hydrogels are Additive: Combined High-Resolution Experiments and Finite Element Modeling. Gels 2020, 6, 31. [Google Scholar] [CrossRef]
- Jastram, A. , Lindner, T., Luebbert, C., Sadowski, G., Kragl, U. Swelling and Diffusion in Polymerized Ionic Liquids-Based Hydrogels. Polymers 2021, 13, 1834. [Google Scholar] [CrossRef]
- Kabiri, K. , Zohuriaan-Mehr, M. J. Superabsorbent hydrogel composites. Polym. Advanc. Techn. 2003, 14, 438–444. [Google Scholar] [CrossRef]
Figure 1.
FTIR spectrum of a) PVA/GA-CH; b) PVA/GA-PH; c) CS/GA-CH; and d) CS/GA-PH hydrogels.
Figure 1.
FTIR spectrum of a) PVA/GA-CH; b) PVA/GA-PH; c) CS/GA-CH; and d) CS/GA-PH hydrogels.
Figure 2.
1H NMR spectrum of PVA/GA-CH hydrogel.
Figure 2.
1H NMR spectrum of PVA/GA-CH hydrogel.
Figure 3.
Thermal analysis thermogram with a)TGA; and b)DSC of PVA/GA-PH hydrogel.
Figure 3.
Thermal analysis thermogram with a)TGA; and b)DSC of PVA/GA-PH hydrogel.
Figure 4.
Thermal analysis thermogram with a) TGA; and b) DSC of CS/GA-CH hydrogel.
Figure 4.
Thermal analysis thermogram with a) TGA; and b) DSC of CS/GA-CH hydrogel.
Figure 5.
XRD pattern of a) PVA/GA-CH, and of b) CS/GA-PH hydrogel.
Figure 5.
XRD pattern of a) PVA/GA-CH, and of b) CS/GA-PH hydrogel.
Figure 6.
SEM images of a) PVA/GA-CH hydrogel, and b) CS/GA-PH hydrogel.
Figure 6.
SEM images of a) PVA/GA-CH hydrogel, and b) CS/GA-PH hydrogel.
Figure 7.
Degree of swelling of the prepared hydrogels with time (h) at different temperatures.
Figure 7.
Degree of swelling of the prepared hydrogels with time (h) at different temperatures.
Figure 8.
Water-retention (%) of soil-hydrogel composite with time (day) at 20°C and 25% humidity using PVA/GA-CH and CS/GA-PH hydrogels.
Figure 8.
Water-retention (%) of soil-hydrogel composite with time (day) at 20°C and 25% humidity using PVA/GA-CH and CS/GA-PH hydrogels.
Figure 9.
FTIR spectra of a) PVA/GA-CH/Urea, and b) CS/GA-PH/Urea loaded hydrogels.
Figure 9.
FTIR spectra of a) PVA/GA-CH/Urea, and b) CS/GA-PH/Urea loaded hydrogels.
Figure 10.
SEM of a) PVA/GA-CH/Urea loaded hydrogel, and b) CS/GA-PH/Urea loaded hydrogel.
Figure 10.
SEM of a) PVA/GA-CH/Urea loaded hydrogel, and b) CS/GA-PH/Urea loaded hydrogel.
Figure 11.
CRmax% of urea from a) PVA/GA-CH in RW, and b) CS/GA-PH in pH9 with time (h) at different temperatures.
Figure 11.
CRmax% of urea from a) PVA/GA-CH in RW, and b) CS/GA-PH in pH9 with time (h) at different temperatures.
Figure 12.
SEM images of a) PVA/GA-CH hydrogel, and b) CS/GA-PH hydrogel after releasing of urea.
Figure 12.
SEM images of a) PVA/GA-CH hydrogel, and b) CS/GA-PH hydrogel after releasing of urea.
Table 1.
FTIR characteristic frequencies of the important functional groups of the prepared hydrogels.
Table 1.
FTIR characteristic frequencies of the important functional groups of the prepared hydrogels.
Table 2.
1H NMR chemical shift with the important protons of PVA/GA-CH hydrogel.
Table 2.
1H NMR chemical shift with the important protons of PVA/GA-CH hydrogel.
Table 3.
TGA and DSC thermal analysis data of some studied hydrogels.
Table 3.
TGA and DSC thermal analysis data of some studied hydrogels.
Table 4.
FTIR characteristic frequencies of the important functional groups of the hydrogels loaded with urea.
Table 4.
FTIR characteristic frequencies of the important functional groups of the hydrogels loaded with urea.
Table 5.
FTIR characteristic frequencies of the important functional groups of the studied hydrogels after release.
Table 5.
FTIR characteristic frequencies of the important functional groups of the studied hydrogels after release.
|
Disclaimer/Publisher’s Note: The statements, opinions and data contained in all publications are solely those of the individual author(s) and contributor(s) and not of MDPI and/or the editor(s). MDPI and/or the editor(s) disclaim responsibility for any injury to people or property resulting from any ideas, methods, instructions or products referred to in the content. |
© 2023 by the authors. Licensee MDPI, Basel, Switzerland. This article is an open access article distributed under the terms and conditions of the Creative Commons Attribution (CC BY) license (http://creativecommons.org/licenses/by/4.0/).
