Submitted:
30 June 2023
Posted:
04 July 2023
You are already at the latest version
Abstract
Keywords:
1. Introduction
2. Materials and Methods
3. Results and discussion
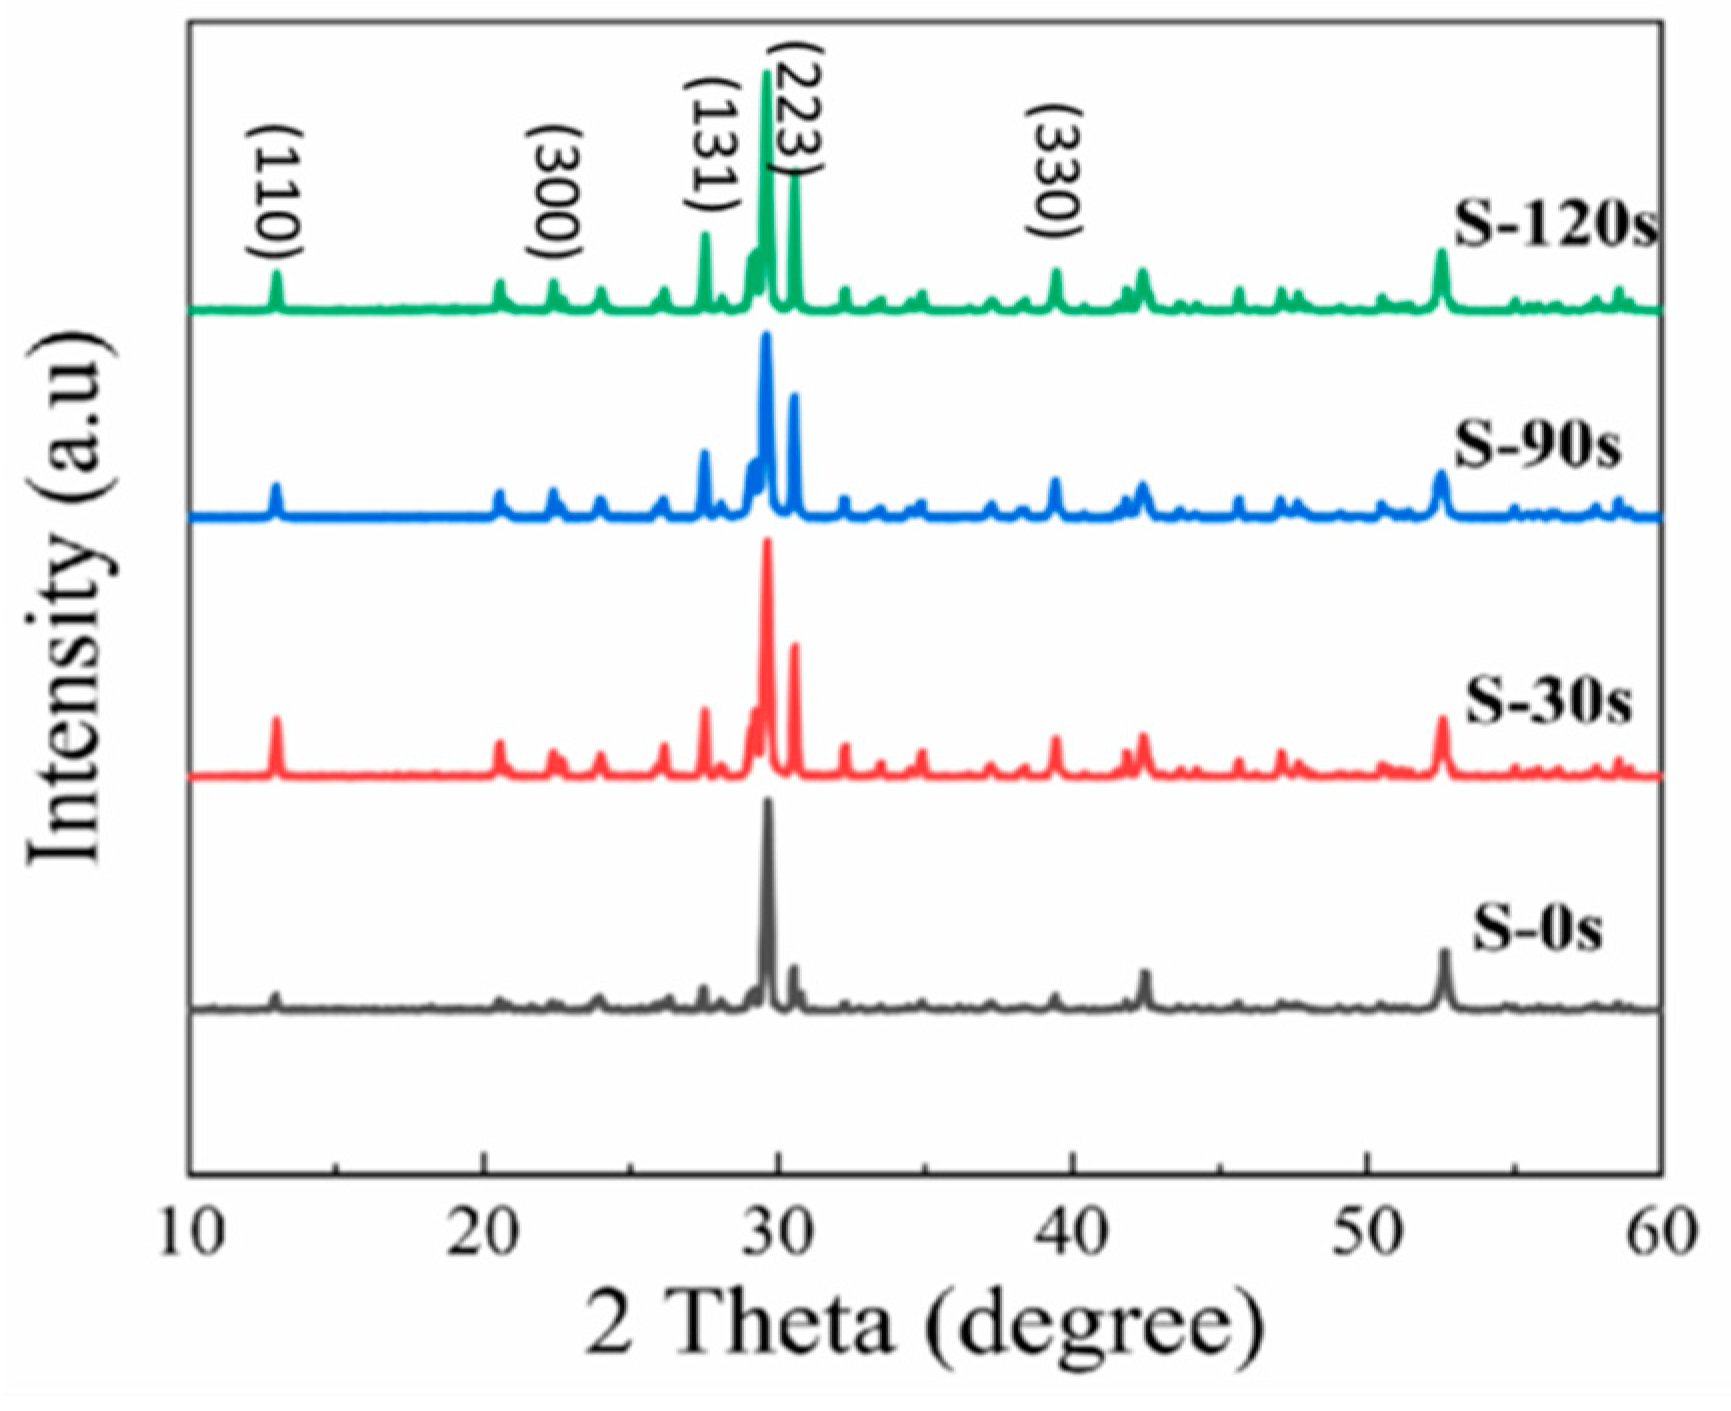
4. Conclusions
Author Contributions
Funding
Data Availability Statement
Conflicts of Interest
References
- Li, M.; Xia, Z. Recent progress of zero-dimensional luminescent metal halides. Chem. Soc. Rev. 2021, 50, 2626–2662. [Google Scholar] [CrossRef] [PubMed]
- Akkerman, Q.A.; Abdelhady, A. L.; Manna, L. Zero-dimensional cesium lead halides: history, properties, and challenges. J. Phys. Chem. Lett. 2018, 9, 2326–2337. [Google Scholar] [CrossRef] [PubMed]
- Zhou, C.; Xu, L.J.; Lee, S.; Lin, H.; Ma, B. Recent Advances in Luminescent Zero-Dimensional Organic Metal Halide Hybrids. Adv. Opt. Mater. 2021, 9, 2001766. [Google Scholar] [CrossRef]
- Sun, S.; Lu, M.; Gao, X.; Shi, Z.; Bai, X.; Yu, W.W.; Zhang, Y. 0D perovskites: Unique properties, synthesis, and their applications. Adv. Sci. 2021, 8, 2102689. [Google Scholar] [CrossRef] [PubMed]
- Yakunin, S.; Benin, B.M.; Shynkarenko, Y.; Nazarenko, O.; Bodnarchuk, M.I.; Dirin, D.N.; Hofer, C.; Cattaneo, S.; Kovalenko, M.V. High-resolution remote thermometry and thermography using luminescent low-dimensional tin-halide perovskites. Nat. Mater. 2019, 18, 846–852. [Google Scholar] [CrossRef]
- Tan, Z.; Chu, Y.; Chen, J.; Li, J.; Ji, G.; Niu, G.; Gao, L.; Xiao, Z.; Tang, J. Lead-free perovskite variant solid solutions Cs2Sn1–xTexCl6: bright luminescence and high anti-water stability. Adv. Mater. 2020, 32, 2002443. [Google Scholar] [CrossRef]
- Chang, T.; Wei, Q.; Zeng, R.; Cao, S.; Zhao, J.; Zou, B. Efficient energy transfer in Te4+-doped Cs2ZrCl6 vacancy-ordered perovskites and ultrahigh moisture stability via A-site Rb-alloying strategy. J. Phys. Chem. Lett. 2021, 12, 1829–1837. [Google Scholar] [CrossRef]
- Chen, D.; Wan, Z.; Chen, X.; Yuan, Y.; Zhong, J. Large-scale room-temperature synthesis and optical properties of perovskite-related Cs4PbBr6 fluorophores. J. Mater. Chem. C 2016, 4, 10646–10653. [Google Scholar] [CrossRef]
- Fan, Q.; Biesold-McGee, G.V.; Ma, J.; Xu, Q.; Pan, S.; Peng, J.; Lin, Z. Lead-free halide perovskite nanocrystals: crystal structures, synthesis, stabilities, and optical properties. Angew. Chem. Int. Ed. 2020, 59, 1030–1046. [Google Scholar] [CrossRef]
- Li, X.; Gao, X.; Zhang, X.; Shen, X.; Lu, M.; Wu, J.; Shi, Z.; Colvin, V.L.; Hu, J.; Bai, X.; Yu, W.W.; Zhang, Y. Lead-Free Halide Perovskites for Light Emission: Recent Advances and Perspectives. Adv. Sci. 2021, 8, 2003334. [Google Scholar] [CrossRef]
- Wang, A.; Guo, Y.; Zhou, Z.; Niu, X.; Wang, Y.; Muhammad, F.; Li, H.; Zhang, T.; Wang, J.; Nie, S.; Deng, Z. Aqueous acid-based synthesis of lead-free tin halide perovskites with near-unity photoluminescence quantum efficiency. Chem. Sci. 2019, 10, 4573–4579. [Google Scholar] [CrossRef] [PubMed]
- Wang, X.; Zhang, T.; Lou, Y.; Zhao, Y. All-inorganic lead-free perovskites for optoelectronic applications. Mater. Chem. Front. 2019, 3, 365–375. [Google Scholar] [CrossRef]
- Liu, Q.; Yin, J.; Zhang, B.B.; Chen, J.K.; Zhou, Y.; Zhang, L.M.; Wang, L.M.; Zhao, Q.; Hou, J.; Shu, J.; Song, B.; Shirahata, N.; Bakr, O.M.; Mohammed, O.F.; Sun, H.T. Theory-guided synthesis of highly luminescent colloidal cesium tin halide perovskite nanocrystals. J. Am. Chem. Soc. 2021, 143, 5470–5480. [Google Scholar] [CrossRef] [PubMed]
- Benin, B.M.; Dirin, D.N.; Morad, V.; Wörle, M.; Yakunin, S.; Rainò, G.; Nazarenko, O.; Fischer, M.; Infante, I.; Kovalenko, M. V. Highly emissive self-trapped excitons in fully inorganic zero-dimensional tin halides. Angew. Chem. Int. Ed. 2018, 57, 11329–11333. [Google Scholar] [CrossRef] [PubMed]
- Zhang, X.; Wang, H.; Wang, S.; Hu, Y.; Liu, X.; Shi, Z.; Colvin, V.L.; Wang, S.; Yu, W.W.; Zhang, Y. Room temperature synthesis of all inorganic lead-free zero-dimensional Cs4SnBr6 and Cs3KSnBr6 perovskites. Inorg. Chem. 2019, 59, 533–538. [Google Scholar] [CrossRef]
- Tan, L.; Wang, W.; Li, Q.; Luo, Z.; Zou, C.; Tang, M.; Zhang, L.; He, J.; Quan, Z. Colloidal syntheses of zero-dimensional Cs4SnX6 (X= Br, I) nanocrystals with high emission efficiencies. Chem. Commun. 2020, 56, 387–390. [Google Scholar] [CrossRef]
- Jellicoe, T.C.; Richter, J.M.; Glass, H.F.; Tabachnyk, M.; Brady, R.; Dutton, S.E.; Rao, A.; Friend, R.H.; Credgington, D.; Greenham, N.C.; Böhm, M.L. Synthesis and optical properties of lead-free cesium tin halide perovskite nanocrystals. J. Am. Chem. Soc. 2016, 138, 2941–2944. [Google Scholar] [CrossRef]
- Kang, C.; Rao, H.; Fang, Y.; Zeng, J.; Pan, Z.; Zhong, X. Antioxidative stannous oxalate derived lead-free stable CsSnX3 (X= Cl, Br, and I) perovskite nanocrystals. Angew. Chem. Int. Ed. 2021, 60, 660–665. [Google Scholar] [CrossRef]
- Zhang, Q.; Liu, S.; He, M.; Zheng, W.; Wan, Q.; Liu, M.; Liao, X.; Zhan, W.; Yuan, C.; Liu, J.; Xie, H.; Guo, X.; Kong, L.; Li, L. Stable Lead-Free Tin Halide Perovskite with Operational Stability > 1200 h by Suppressing Tin (II) Oxidation. Angew. Chem. Int. Ed. 2022, 61, e202205463. [Google Scholar] [CrossRef]
- Zhou, C.; Lin, H.; He, Q.; Xu, L.; Worku, M.; Chaaban, M.; Lee, S.; Shi, X.; Du, M.H.; Ma, B. Low dimensional metal halide perovskites and hybrids. Mater. Sci. Eng. R Rep. 2019, 137, 38–65. [Google Scholar] [CrossRef]
- Smith, M.D.; Connor, B.A.; Karunadasa, H.I. Tuning the luminescence of layered halide perovskites. Chem. Rev. 2019, 119, 3104–3139. [Google Scholar] [CrossRef] [PubMed]
- Lin, H.; Zhou, C.; Tian, Y.; Siegrist, T.; Ma, B. Low-dimensional organometal halide perovskites. ACS Energy Lett. 2017, 3, 54–62. [Google Scholar] [CrossRef]
- Hu, T.; Smith, M.D.; Dohner, E.R.; Sher, M.J.; Wu, X.; Trinh, M.T.; Fisher, A.; Corbett, J.; Zhu, X.Y.; Karunadasa, H.I.; Lindenberg, A.M. Mechanism for broadband white-light emission from two-dimensional (110) hybrid perovskites. J. Phys. Chem. Lett. 2016, 7, 2258–2263. [Google Scholar] [CrossRef] [PubMed]
- Li, S.; Luo, J.; Liu, J.; Tang, J. Self-trapped excitons in all-inorganic halide perovskites: fundamentals, status, and potential applications. J. Phys. Chem. Lett. 2019, 10, 1999–2007. [Google Scholar] [CrossRef] [PubMed]
- Dohner, E.R.; Jaffe, A.; Bradshaw, L.R.; Karunadasa, H.I. Intrinsic white-light emission from layered hybrid perovskites. J. Am. Chem. Soc. 2014, 136, 13154–13157. [Google Scholar] [CrossRef] [PubMed]
- Han, P.; Luo, C.; Yang, S.; Yang, Y.; Deng, W.; Han, K. All-inorganic lead-free 0D perovskites by a doping strategy to achieve a PLQY boost from< 2% to 90%. Angew. Chem. 2020, 132, 12809–12813. [Google Scholar]
- Ma, Z.; Liu, Z.; Lu, S.; Wang, L.; Feng, X.; Yang, D.; Wang, K.; Xiao, G.; Zhang, L.; Redfern, S.A.; Zou, B. Pressure-induced emission of cesium lead halide perovskite nanocrystals. Nat. Commun. 2018, 9, 4506. [Google Scholar] [CrossRef]
- Ulloa, J.M.; Llorens, J.M.; Alén, B.; Reyes, D.F.; Sales, D.L.; González, D.; Hierro, A. High efficient luminescence in type-II GaAsSb-capped InAs quantum dots upon annealing. Appl. Phys. Lett. 2012, 101, 253112. [Google Scholar] [CrossRef]
- Lin, Z.; Wang, A.; Huang, R.; Wu, H.; Song, J.; Lin, Z.; Hou, D.; Zhang, Z.; Guo, Y.; Lan, S. Manipulating the sublattice distortion induced by Mn2+ doping for boosting the emission characteristics of self-trapped excitons in Cs4SnBr6. J. Mater. Chem. C 2023, 11, 5680–5687. [Google Scholar] [CrossRef]
- Bergman, L.; Chen, X.B.; Morrison, J.L.; Huso, J.; Purdy, A.P. Photoluminescence dynamics in ensembles of wide-band-gap nanocrystallites and powders. J. Appl. Phys. 2004, 96, 675–682. [Google Scholar] [CrossRef]
- Guo, Q.; Zhao, X.; Song, B.; Luo, J.; Tang, J. Light Emission of Self-Trapped Excitons in Inorganic Metal Halides for Optoelectronic Applications. Adv. Mater. 2022, 34, 2201008. [Google Scholar] [CrossRef] [PubMed]
- Sun, C.; Jiang, K.; Han, M.F.; Liu, M.J.; Lian, X.K.; Jiang, Y.X.; Shi, H.S.; Yue, C.Y.; Lei, X.W. A zero-dimensional hybrid lead perovskite with highly efficient blue-violet light emission. J. Mater. Chem. C 2020, 8, 11890–11895. [Google Scholar] [CrossRef]
- Wang, X.; Zhang, X.; Yan, S.; Liu, H.; Zhang, Y. Nearly-Unity Quantum Yield and 12-Hour Afterglow from a Transparent Perovskite of Cs2NaScCl6: Tb. Angew. Chem. Int. Ed. 2022, 61, e202210853. [Google Scholar] [CrossRef] [PubMed]
- Chiara, R.; Ciftci, Y.O.; Queloz, V.I.; Nazeeruddin, M.K.; Grancini, G.; Malavasi, L. Green-emitting lead-free Cs4SnBr6 zero-dimensional perovskite nanocrystals with improved air stability. J. Phys. Chem. Lett. 2020, 11, 618–623. [Google Scholar] [CrossRef]
- Lin, K.H.; Liou, S.C.; Chen, W.L.; Wu, C.L.; Lin, G.R.; Chang, Y.M. Tunable and stable UV-NIR photoluminescence from annealed SiOx with Si nanoparticles. Opt. Express 2013, 21, 23416–23424. [Google Scholar] [CrossRef]
- Stadler, W.; Hofmann, D.M.; Alt, H.C.; Muschik, T.; Meyer, B.K.; Weigel, E.; Müller-Vogt, G.; Salk, M.; Rupp, E.; Benz, K.W. Optical investigations of defects in Cd1−x Zn x Te. Phys. Rev. B 1995, 51, 10619. [Google Scholar] [CrossRef]
- Kuok, M.H.; Tan, L.S.; Shen, Z.X.; Huan, C.H.; Mok, K.F. A Raman study of RbSnBr3. Solid State Commun. 1996, 97, 497–501. [Google Scholar] [CrossRef]
- Qin, Z.; Dai, S.; Hadjiev, V.G.; Wang, C.; Xie, L.; Ni, Y.; Wu, C.; Yang, G.; Chen, S.; Deng, L.; Yu, Q.; Feng, G.; Wang, Z.M.; Bao, J. Revealing the origin of luminescence center in 0D Cs4PbBr6 perovskite. Chem. Mater. 2019, 31, 9098–9104. [Google Scholar] [CrossRef]
Disclaimer/Publisher’s Note: The statements, opinions and data contained in all publications are solely those of the individual author(s) and contributor(s) and not of MDPI and/or the editor(s). MDPI and/or the editor(s) disclaim responsibility for any injury to people or property resulting from any ideas, methods, instructions or products referred to in the content. |
© 2023 by the authors. Licensee MDPI, Basel, Switzerland. This article is an open access article distributed under the terms and conditions of the Creative Commons Attribution (CC BY) license (https://creativecommons.org/licenses/by/4.0/).


