1. Introduction
Hydrothermal carbonization (HTC) is an environmentally friendly, cost-effective, and efficient process for converting agricultural waste into valuable porous carbon (hydrochar). In recent years, hydrochars have received growing attention due to their low production cost and potential applications in many industrial fields. The synthesized hydrochars are generally manifested in the form of carbon microspheres (CMs). Carbon microspheres/hydrochars can be synthesized via a two-step HTC process: (1) dehydration of carbohydrates to form a furan-like molecule (either 5-hydroxymethyl-2-furaldehyde, or furfural); and (2) subsequent condensation and polymerization of the furan compound(s) to form carbon materials [
1,
2]. In general, CMs can be produced by digesting various organic feedstocks such as biomass or saccharides at moderate temperatures (160–250 °C) and pressures. This approach is simple, straightforward, environmentally friendly and cost-effective. Many researchers prepared CMs/hydrochar from different materials such as agricultural biomass [
3,
4], sewage sludge [
5,
6], food waste [
7,
8], saccharides [
9,
10], algae [
11], and date palm molasses [
12]. Hydrochar has proven to be very effective in various industrial applications, especially in the absorption of toxic substances from water, such as dyes, pigments and heavy metals [
3,
13].
In line with the global awareness of sustainable development, many researchers have worked to sustainably convert waste from various sources into useful materials. Therefore, it is favorable to repurpose these agricultural wastes and convert them into carbon-concentrated materials apply them in wastewater treatment. The use of date palm-based waste in wastewater treatment is therefore a two-pronged solution – solves the issue of abundance of palm wastes and not burn it indiscriminately and converts them into useful absorbent materials for removal of toxic pollutants such as dye contaminants from wastewater.
In the Kingdom of Saudi Arabia, there are more than 31 million date palms [
14] in which each palm produces approximately 20 kg of waste per year [
15]. The total waste of date palms is about 620,000 MT. Several attempts have been made to convert palm date biomass into valuable materials such as activated carbon [
16], hydrogel [
17], biodiesel [
18] and syngas [
19]. However, most of the date palm wastes, such as leaves, twigs, and fibers, are not fully utilized in most cases and are usually burned leading to numerous environmental problems (e.g. unrestricted release of hazardous flue gas consisting of soot, CO
2, NOx, SO
x,
etc.
Annual production of synthetic dyes is increasing worldwide as demand for consumer goods increases. It has been estimated that textile mills currently produce more than 10,000 different types of dyes and pigments with an approximated annual production of about 7×10
5 tons [
20]. About 10-15% of this amount is discharged directly into the environment in the form of wastewater [
21,
22]. As the consumption of dyes is rapidly increasing due to high demand in various sectors, especially in the textile industry, the production of dyes is expected to increase, which will certainly lead to an increase in waste generated from the textile industry. Dye concentrations in textile effluents were reported in a wide range of values (10-800 mg/l) [
23].
Hydrochar can be synthesized at mild reaction conditions [
24] which makes the production cost-effective. In addition, the presence of oxygen functional groups such as hydroxyl, phenol, carbonyl and carboxyl on the surface of hydraulic enable the material to have enhanced pollutant sorption ability [
25]. On the other hand, the main disadvantages of hydrochar are its poor surface area and porosity, which hinder its ability to adsorb contaminants. Therefore, increasing the surface area and porosity can increase the adsorptive effectiveness of CMs. In previous studies, researchers concluded that activated hydrochar prepared from biomass waste had a much better adsorption capacity than non-activated hydrochar. Islam and co-researchers [
26] synthesized activated hydrochar from coconut shells and sodium hydroxide and obtained methylene blue (MB) adsorption capacity of 200.01 mg/g. Tran and co-researchers [
27] prepared activated hydrochar using potassium hydroxide from coffee husk waste and obtained a maximum adsorption capacity of 418.8 mg/g for MB. Zhou and co-researchers [
28] activated hydrochar made from sugarcane bagasse using phosphoric acid and sodium hydroxide. A maximum adsorption capacity of MB, 357.14 mg/g was obtained.
As far as we know, there is no known investigation focused on the use of a variety of date palm-based wastes for synthesis of phosphoric acid-activated CMs as applied for dye-based wastewater treatment. It should be noted that these different types of date palm-based wastes are not homogenous and their hydrothermal carbonization processes need to be properly optimized – this represents a novelty aspect in the field of HTC. The findings from such study would bode well for the sustainable use and repurpose of date palm-based wastes which reflects our underlying motivation. We prepared three samples of CMs from several types of biomass precursor of date palm (Phoenix dactylifera), namely, seeds, leaflets and inedible crystallized date palm molasses. The prepared samples were subsequently activated with phosphoric acid to impart adsorptive enhancement characteristics for enhanced methylene blue removal.
2. Materials and Methods
2.1. Raw Materials and Chemicals
Date palm seeds and leaflets were obtained from a local farm located in the outskirts of Riyadh, Saudi Arabia while inedible crystallized palm molasses were obtained from a date factory located in Riyadh. The seeds and leaflets were cleaned and ground for the HTC process as described in our previous studies [
3,
12]. Deionized (DI) water was utilized to clean the solid samples and for the HTC and dye adsorption processes. MB (purity 95%) was obtained from LOBA Chemie, India. Absolute ethanol was obtained from VWR, Spain, and used only for washing of the solid materials prepared by HTC process.
2.2. Hydrothermal Carbonization
An amount of 4 g seeds, 2.5 g leaflets and 4 g inedible crystallized date palm molasses were placed in Erlenmeyer flasks with deionized water (25 mL) and magnetically stirred for 5 h. The samples were then placed in 45 mL Teflon-lined Paar reactors for HTC. The Paar vessels were hermetically sealed and heated in a muffle oven at 230 °C for 4 h for seeds, 3 h for inedible crystallized molasses and 8 h for leaflets. The reason for the different reaction times is attributed to the chemical composition of the parts which reflect the difficulty in biomass digestion processes associated with different types of wastes. It was found that molasses which contain about 47% glaucous [
29] and seeds were relatively easier to convert to CMs than the leaflets. It requires less temperature and reaction time [
30,
31]. This could be due to the high cellulose content in the leaflets (47.14% cellulose, 36.73% lignin, and 16.13% hemicellulose) [
32]. In contrast, the seeds and date molasses contain (32.77% cellulose, 30.20% hemicellulose, and 37.03% lignin) [
32] and (47.1% glucose, 28% fructose, and 4.7% sucrose), respectively [
29]. The dark-colored liquids were filtered to produce solid products of HTC. They were then washed a few times with DI water and absolute ethanol. The wet products were dried at a temperature of 110 °C for 12 h in an oven. Subsequently, the dry final products were ground with a laboratory mortar and then stored in sealed bottles in a desiccator prior to the activation process.
2.3. Activation after HTC
The samples were activated with phosphoric acid according to the method of incipient wetness impregnation [
33,
34]. The effects of phosphoric acid/sample ratio and activation temperature were studied. One gram of the CM sample prepared by the HTC process was impregnated by dropwise addition of phosphoric acid solution. The sample was vigorously stirred until a thin liquid film of phosphoric acid was formed on the sample surface. The effects of phosphoric acid concentrations and activation temperature were investigated. The following ratios of phosphoric acid/CM sample were investigated: 0.5, 0.75, 1, 1.3, 1.7, 2.3, 3, 4 and 5. The impregnated sample was then dried overnight at 80
oC. Then, the impregnated sample was carbonized in the horizontal tube furnace (OTF-1200X-S, MTI, USA) at three different temperatures (450, 500 and 650
oC) for 1.5 hours and N
2 flow of 50 CCM. The obtained products were washed several times with deionized water to remove any residual phosphoric acid, filtered off and dried at 80
oC for 24 hours. The samples are referred to as "NAS" (non-activated seed), “AS” (activated seed), and "AAS" (activated seed after adsorption). Finally, the prepared samples were stored in a dry place before being used for dye removal.
2.4. Characterizations
The adsorbent before and after activation were characterized using Tuscan VEGA II LSU (Tuscan USA Inc.) scanning electron microscopy (SEM) to study the surface morphology of the prepared materials. The ImageJ software (version 1.53t) was used to determine the diameter of CMs. The adsorbents were further characterized using the Micromeritics TriStar II PLUS (USA) surface analyzer to evaluate the surface area, pore diameter and pore volume. The samples were degassed for 90 minutes at 250
oC under vacuum. The data obtained from this analysis, which included pore size and surface area, were further analyzed and compared to determine changes in the surface characteristics of the CMs due to various chemical treatments and their effects on dye removal. Fourier Transform-Infrared (FTIR) analysis was performed for the three samples before and after activation. The wavelength ranges in the infrared region absorbed by the adsorbents was measured using an FTIR spectrophotometer (model: Shimadzu IRPrestige-21). Elemental analysis of the samples was conducted via PerkinElmer series II CHNS/O 2400, USA analyzer. The oxygen content was established via calculation of the remaining mass. Boehm titration [
35,
36] was performed for sample produced to quantify the acidic (oxygenated) functional groups on the surface of the inactivated and activated samples.
2.5. Adsorption Studies
The adsorptive abilities of the inactivated and activated prepared CMs were tested for MB removal using batch adsorption series. The effects of the following parameters on the adsorption process were evaluated: pH, contact time, adsorbent dosage and initial dye concentration. A stock solution (1000 mg/L of MB) (95% purity) was produced by dissolving MB in deionized water. Sodium hydroxide or sulfuric acid (0.1 mol/L) was used to adjust the pH and maintained at 6. pH of the MB solutions was analyzed with a pH meter. The batch adsorption experiment was conducted in 300-mL Erlenmeyer flasks with 250-mL solutions of MB added to each flask at initial concentration range from 25 to 500 mg/L. Samples (0.125 g) with a particle size < of 0.25 mm were put into the MB solution (250 mL) and agitated in a shaker (150 rpm) at 25 °C. For the equilibrium studies, the batch was run for 540 minutes to ensure that the equilibrium conditions were achieved.
For the batch adsorption experiment, after certain times (e.g. 15, 30 min, 60 min, ….,540 min), 10 ml was taken with a pipette from the supernatant of each flask and centrifuged at 5000 rpm for 6 minutes in a Hettich EBA 20 centrifuge to separate suspended particles of the prepared material. A small amount (2 ml) of supernatant solution was obtained from each flask and diluted with suitable amounts of deionized water and then stored in a sealed bottle for analysis by UV-Vis spectrophotometer (Jasco V-770). The remaining 8 ml was returned to the flask to avoid loss of absorbent. The concentration of MB was established by comparing the absorbance with a calibration curve. Equation (1) was used to determine the total MB adsorbed,
qt (mg/g) onto the CMs at time
t:
where, q
t (mg/g) is the amount of adsorption at time, C
o represents the initial concentration of the solution (mg/L), C
t represents the concentration of the solution at time t (mg/L), V represents the volume of the solution (L) while M represents the mass of the dry adsorbent (g).
The amount of MB adsorbed at equilibrium,
qe (mg/g) was calculated using Equation (2):
where, q
e (mg/g) represents the amount of adsorption at equilibrium while C
e represents the solution equilibrium concentration (mg/L).
The removal efficiency can be calculated using Equation (3):
2.6. Reusability and Recovery of adsorbent
The desorption study, or regeneration study, was conducted to assess the ability of the adsorbate to be removed from the mobile phase. This analysis is important to explain the transfer process of the adsorbate between the aqueous phase and the solid phase. Five cycles of adsorption – desorption was studied in this experimental work. Ethanol was used as the regenerative solution, as the MB is soluble in ethanol. The adsorption and desorption process was conducted using a method elucidated by Genli et al. [
37], and Al-Awadi et al. [
3]. Briefly, three activated samples were mixed with 100 mL of ethanol solution in a series of conical flasks separately and the mixture were agitated at 150 rpm for 2 hours using a digital orbital shaker (Jeio tech rotary shaker, SI -600, Korea). The conical flasks were closed with rubber stoppers to avoid vaporization of the regenerative solution. After the mixing process were completed, the solutions were then separated from the solid particles using centrifuge (Bioevopeak CFG-18.5B, China) at 6000 rpm speed and for 6 min, followed by measuring the absorbance values by using the UV-Vis spectrophotometer (UV-Vis, UV5, Mettler Toledo, Switzerland). The absorbance value (nm) of the filtrates were then recorded. The adsorbent was then dried at 80 °C overnight. The adsorption and desorption cycles of MB on activated materials were carried out by washing with water and ethanol followed by regeneration and then subsequent reuse. The activated samples were regenerated into the previous original form and reutilized for five adsorptions–desorption cycles. The percentage removal (%) for each cycle in the batch adsorption process were then calculated. The AM sample was tested for the reusability study and multistage adsorption. Experiments were performed with 200 mL of the solution of MB and 100 mg of activated material at room temperature. The operating conditions were 240 min of contact time and an initial concentration of 300 mg/L MB.The
3. Results and Discissions
3.1. Formation and Morphologies of Carbon Microspheres
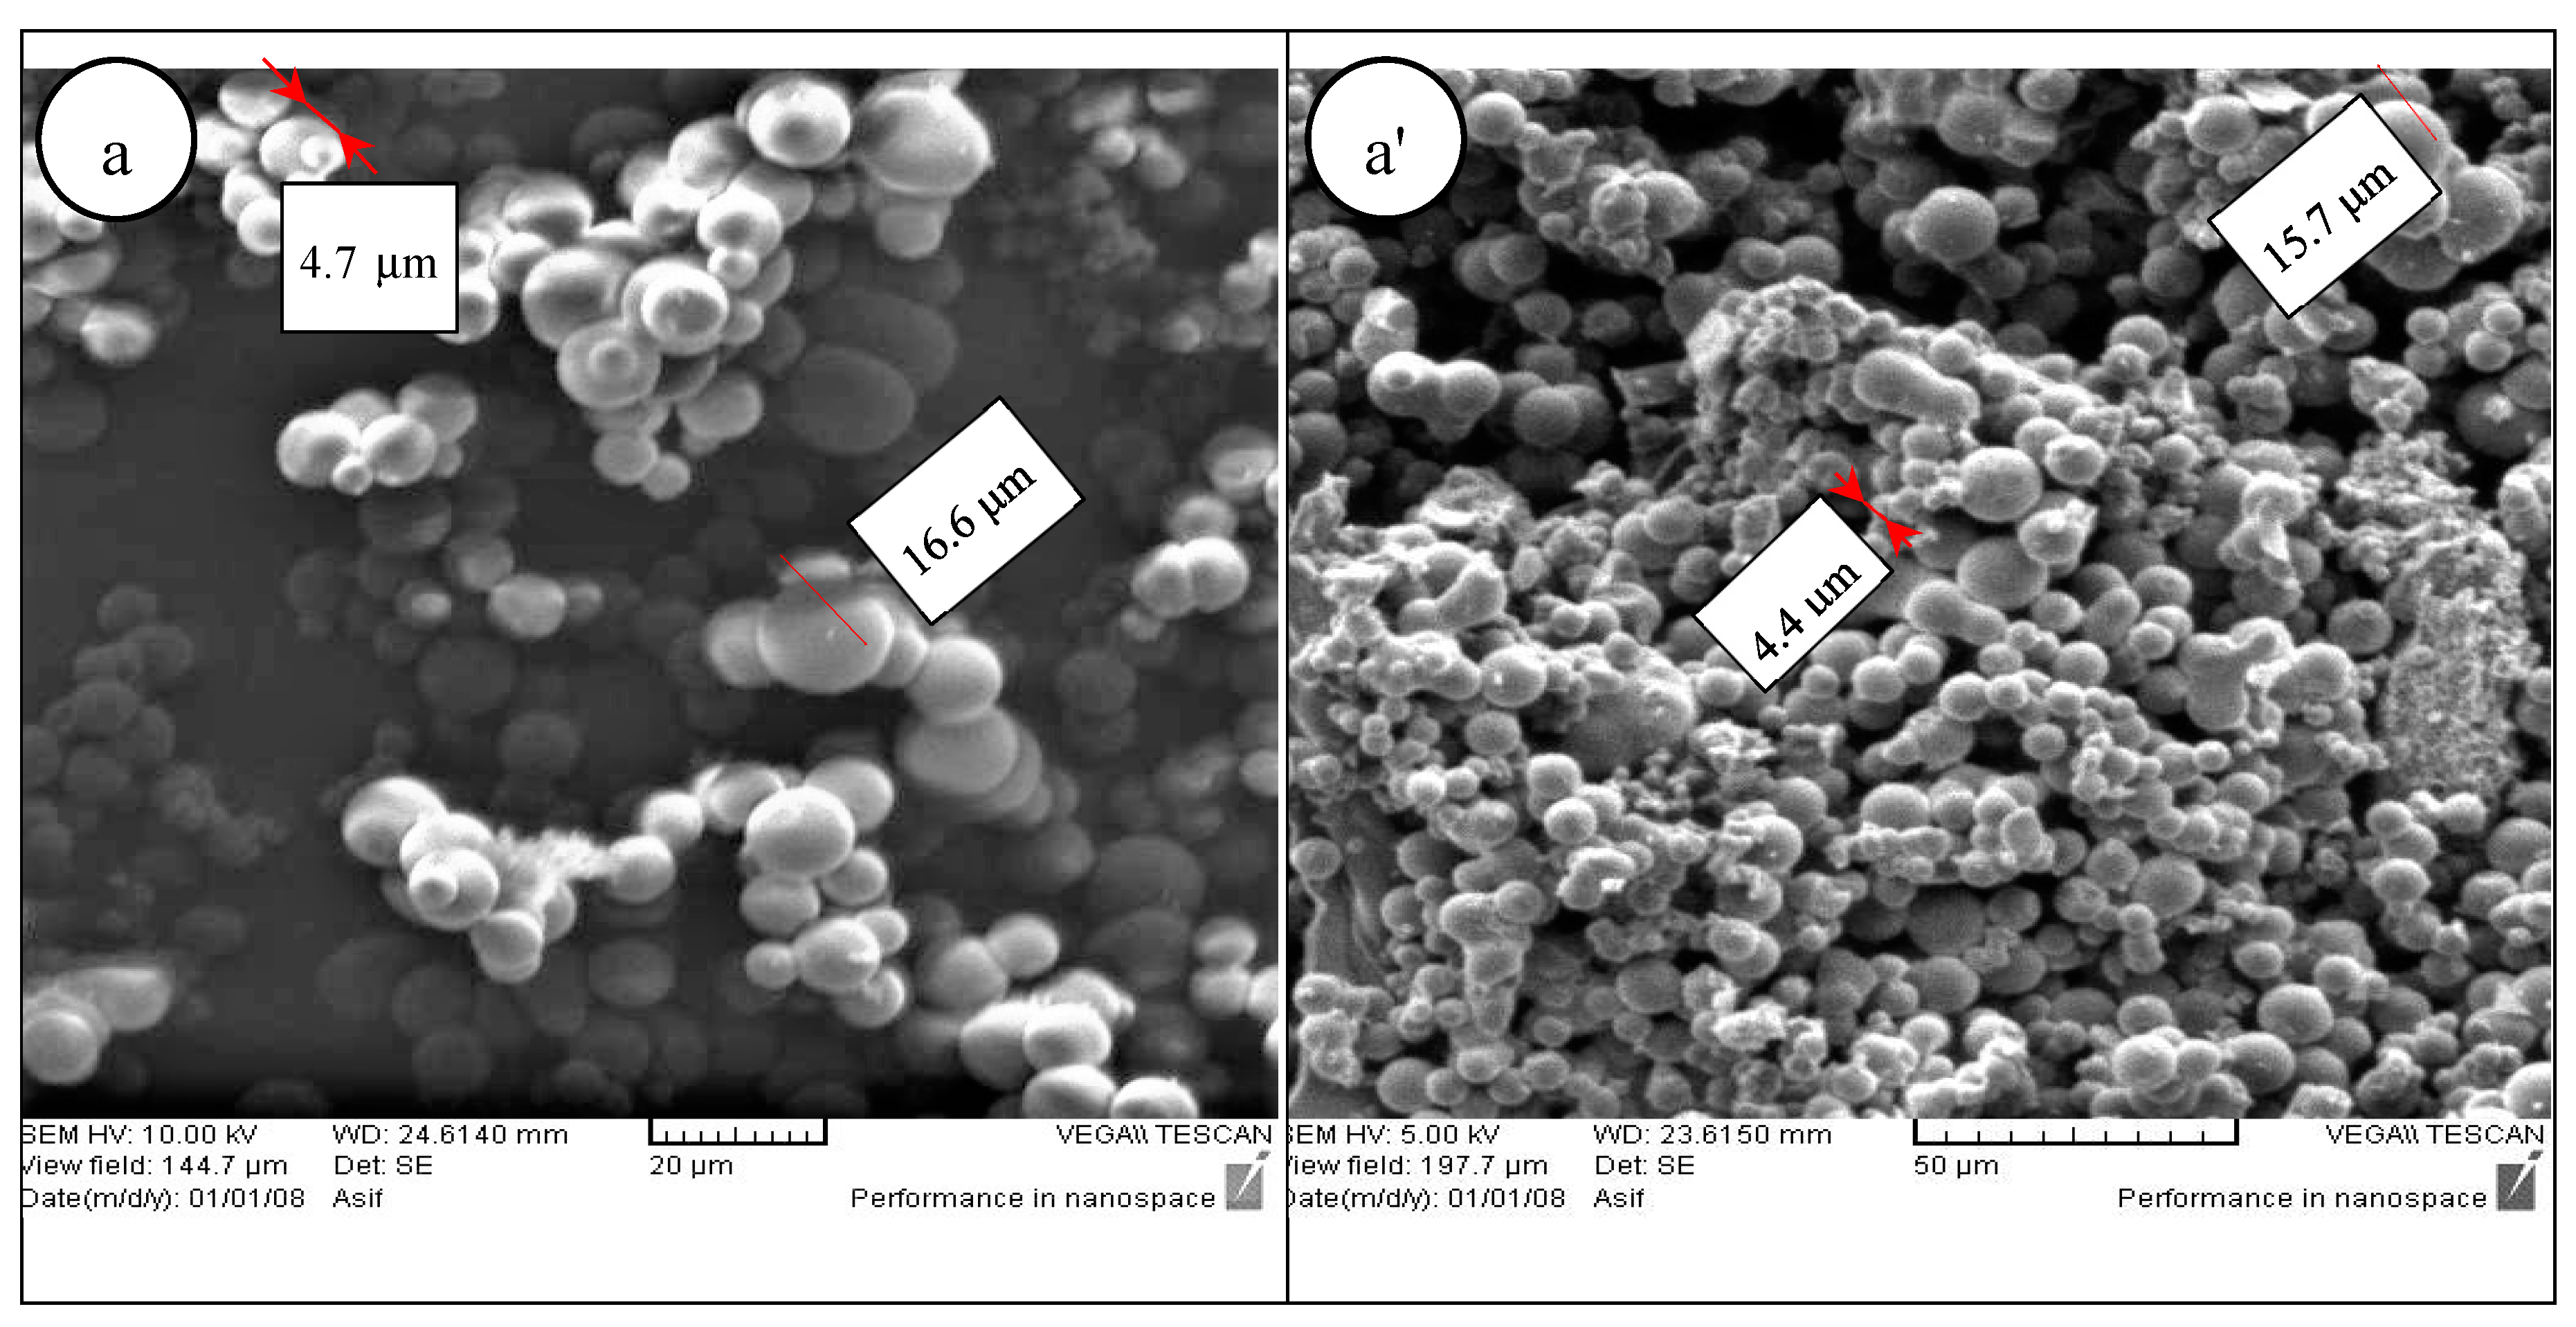
The micrographs of CMs for the three samples are presented in
Figure 1.
Figure 1a shows that CMs were dispersed on the surface of the seed sample at 230 °C and 4 h before activation with phosphoric acid. The CMs appear to possess high degrees of sphericity, well-developed and reasonably homogeneous. As shown in
Figure 1a, the largest and smallest CM diameters are 16.6 and 4.7 m, respectively. The average diameter of the CMs is 8.6 m.
Figure 1a’ shows that the CMs have slightly deformed from their original morphology after the activation process. The largest and smallest CM diameters are 15.7 and 4.4 m respectively. However, the average size of the particles remains in the same range at about 8.2 m.
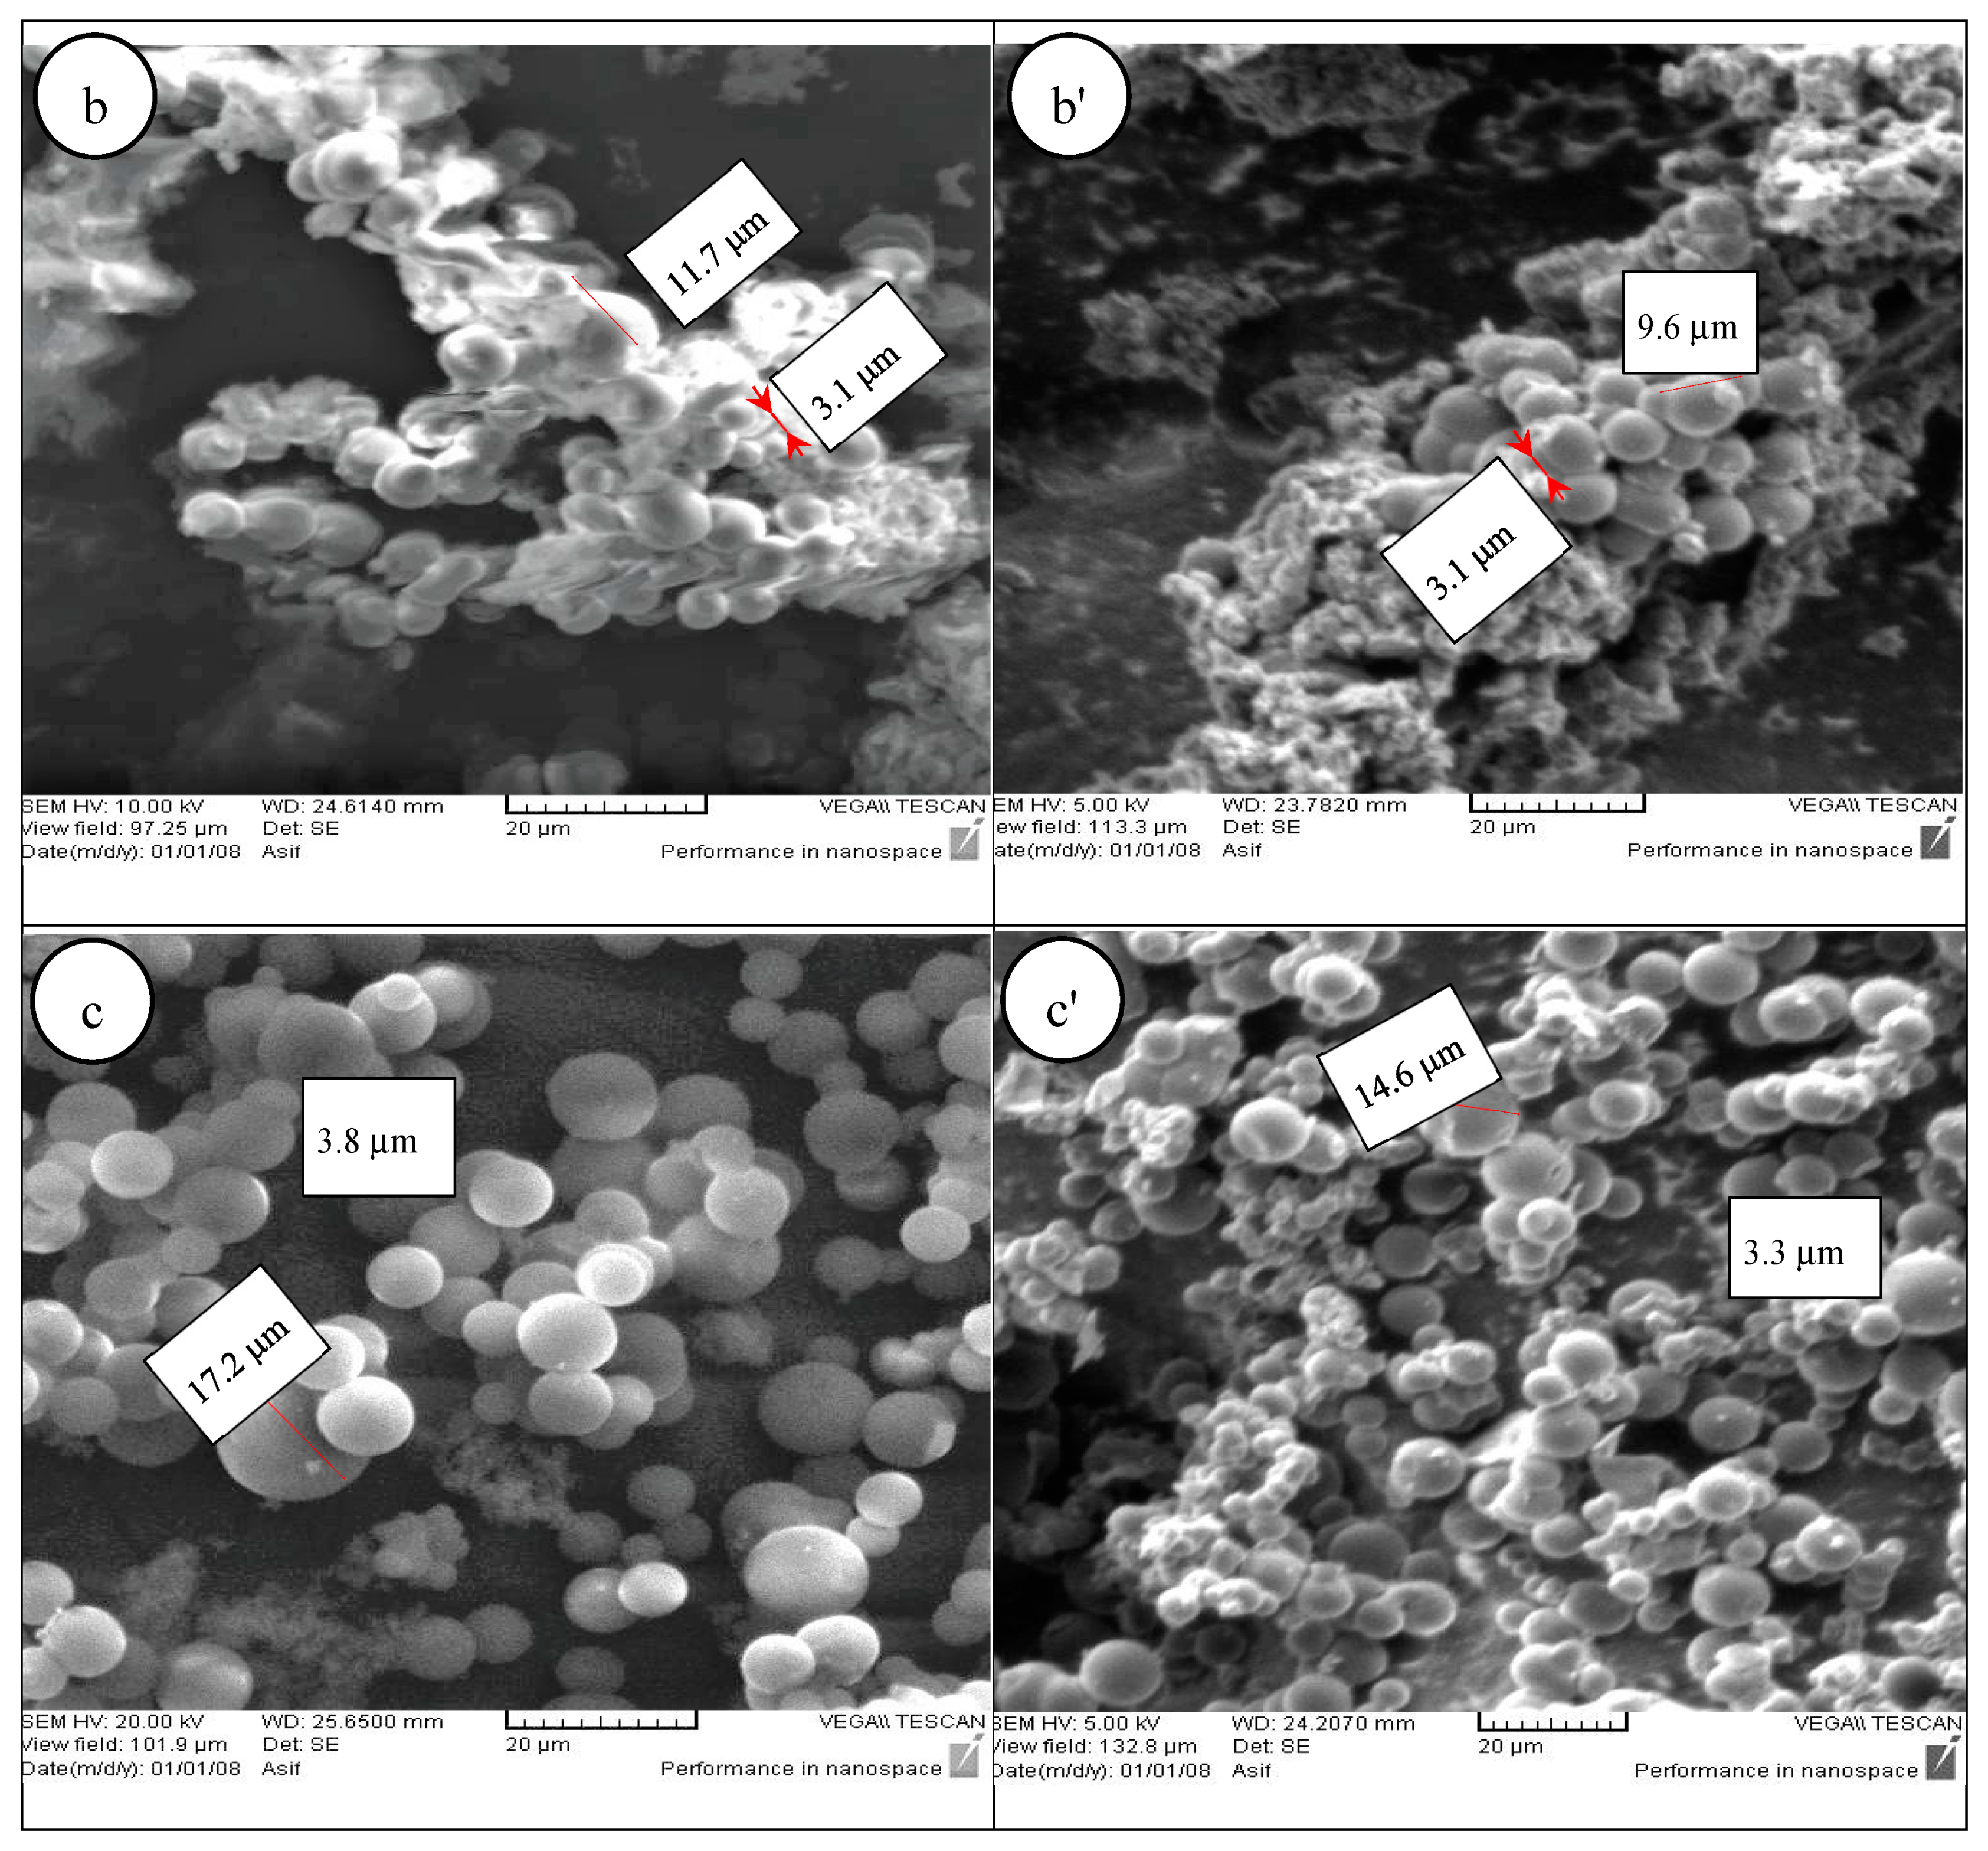
Figure 1b,b’ shows the CMs for the leaflets samples before (NAL) and after activation (AL), respectively. It should be noted that the CMs are not very well-developed and homogeneous as compared to the seeds and palm date molasses. In addition, the size of the spheres is slightly smaller than that of the seeds or palm date molasses. From
Figure 1b, it can be seen that the diameter of the smallest CM is 3.1 m while the diameter of the largest CM is 11.7 m. In contrast, for the activated sample (
Figure 1b’), the smallest and largest diameters are 3.1 m and 9.6 m, respectively. The average diameter is 5.8 m.
Figure 1c,c’ illustrates the CMs developed for the palm date crystallized molasses before (NAM) and after activation (AM), respectively. The CMs appear to be fully formed and very regular. The average sizes of the particles before and after activation are about 7.5 and 7.2 m respectively. It is important to note that obtaining CMs from cellulosic materials is more complex than from saccharides such as glucose, sucrose and fructose due to the compact structure of highly crystallized cellulose. Consequently, CMs formed from leaflet samples required 8 h residence time which was longer than the time for CMs obtained from seed sample and crystallized molasses. Figures 1a’,c’ show that the CMs retain their original spherical morphology without any noticeable change in the diameter of the particles. The average sizes of the particles before and after activation are about 8.5 and 8.2 m respectively.
3.2. Surface Textural Properties of Carbon Microspheres
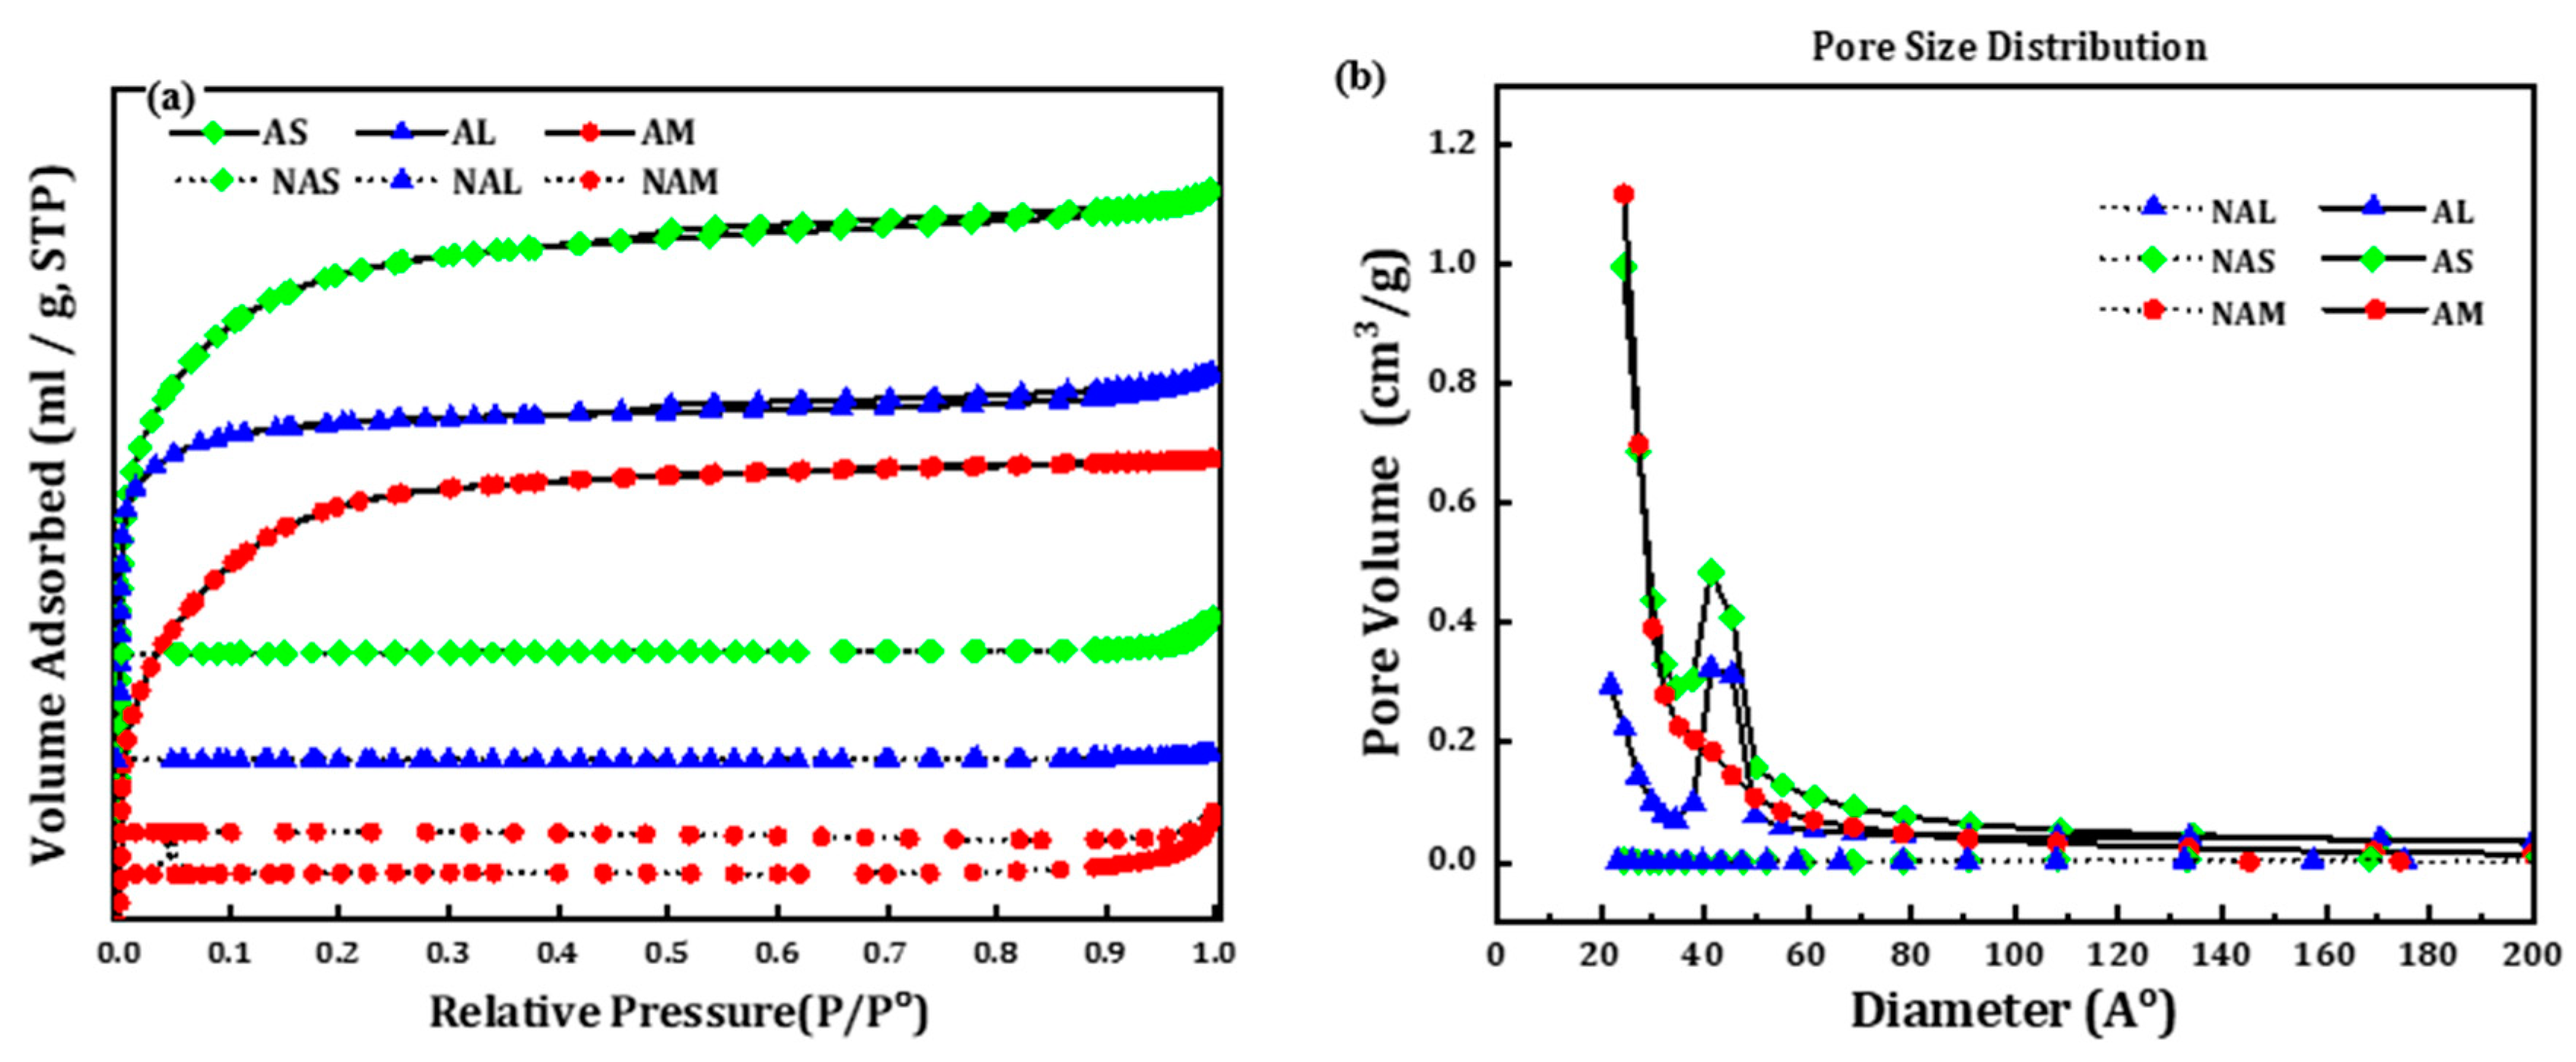
Figure 2 shows the N
2 adsorption-desorption isotherms of activated and non-activated CMs samples. The isotherms for all non-activated samples can be generically classified as type 1 of IUPAC classification. N
2 adsorption on these materials was observed only at a very low relative pressure (
P/Po), indicative of predominantly microporosity of the samples, even though there are slight uptake (deviation) at
P/Po higher than 0.95. On the other hand, the activated CMs (AS and AL) show slight presence of mesoporosity in their textures through their marginal hysteresis loops –
quasi type IV IUPAC classification. The palpable absence of a plateau at the end of the hysteresis implies that it is not solely type-IV. The figure on pore size distribution suggests the increases of pore volume as attributed to the addition of mesoporosity within the 20-50 Angstrom range. The existence of marginal hysteresis loops in the AS and AL samples indicate the existence of peripheral mesopores which may be promising for adsorption in a solution environment.
Table 1 shows the BET surface areas for the three synthesized samples before and after activation. The three samples before activation possessed small surface areas (< 60 m
2/g), indicating that the internal pores on the CM particles were not fully developed. However, upon chemical treatment with phosphoric acid, pores develop on the surface of the microspheres, greatly increasing the surface areas (808 - 1584 m
2/g).
Table 1 reveals that the pore sizes of the activated samples increased substantially after activation. In reference to the International Union of Pure and Applied Chemistry (IUPAC) categorization [
38], all samples could be classified as mesoporous. The molecular size of MB is 0.95 nm in width and the length (1.382 nm–1.447 nm) [
39,
40]. This indicates that the size of MB molecules is smaller, compared to the pore size of all developed adsorbents. Thus, the MB molecules could be easily attached and fitted into the pores of the inactivated and activated materials, which facilitated MB removal from the aqueous solution.
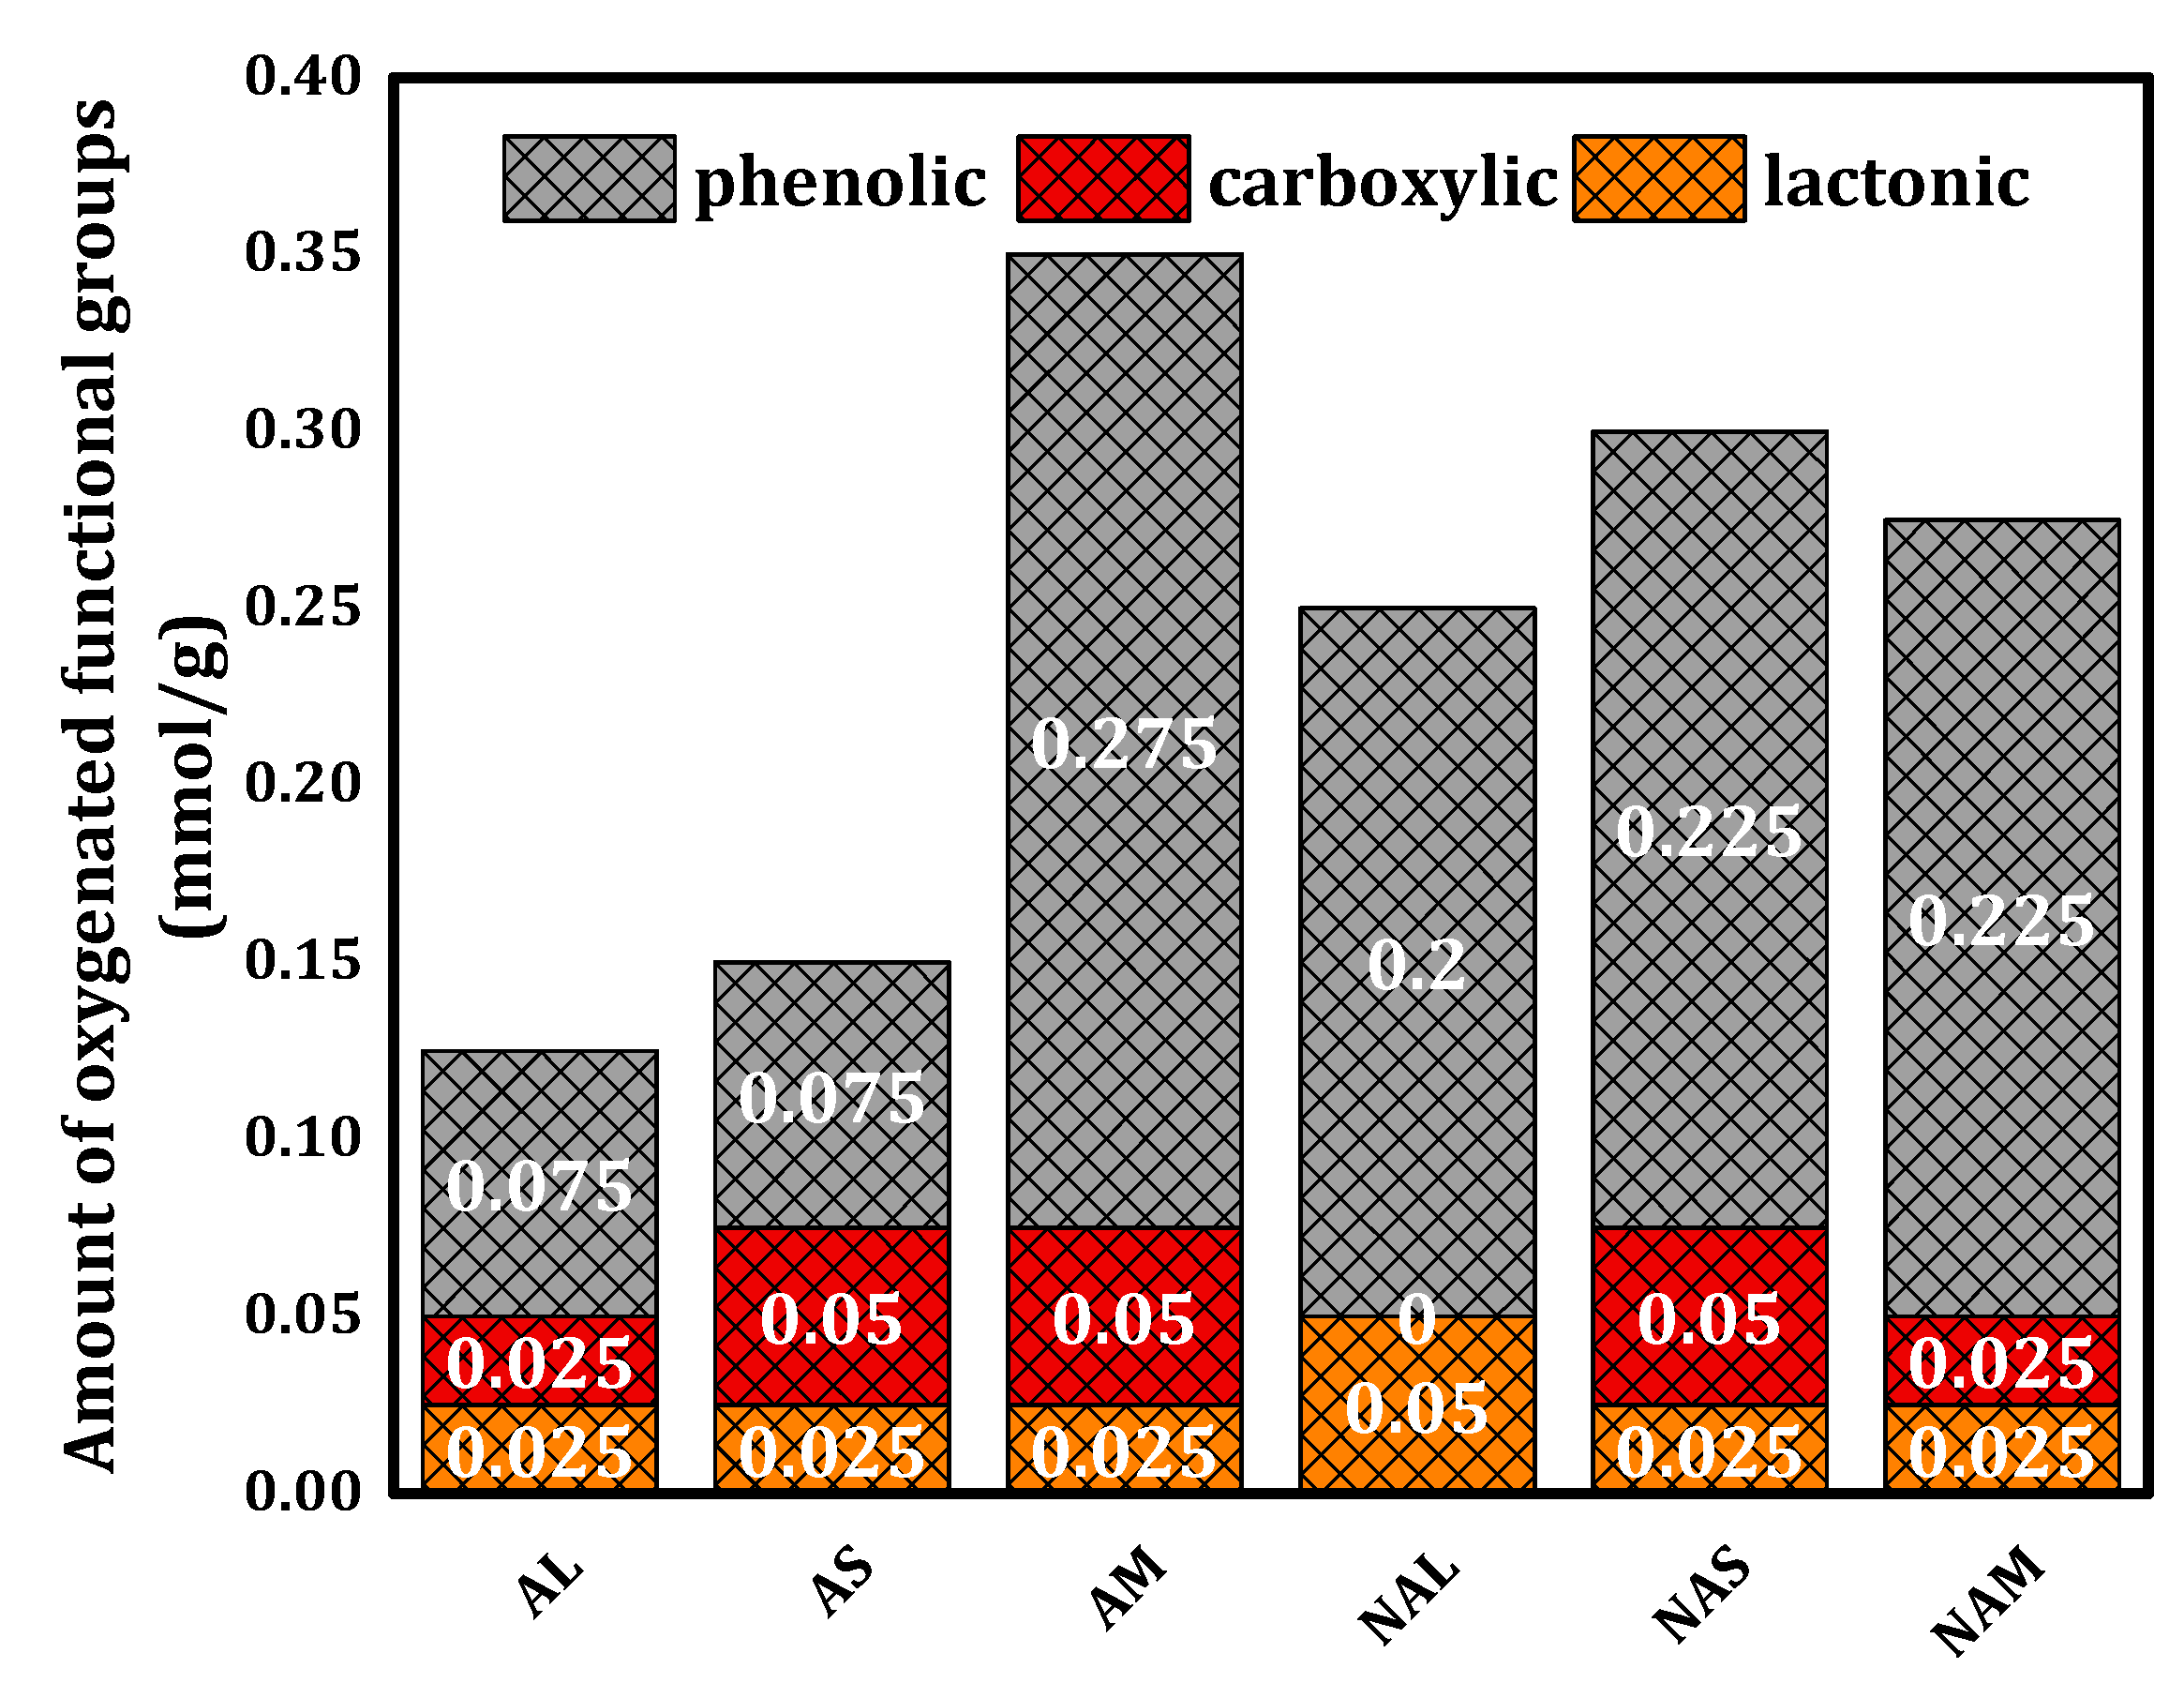
The Boehm titration was performed for all prepared samples. The results are showed in
Figure 3, indicating that the AM samples contain more phenolic groups that the other samples. Indeed, the phenolic groups dominate the surfaces of the both the activated as well as the non-activated samples. Total oxygenated (acidic) functional groups for all samples range from 0.1 to 0.4 mmol/g. Elemental analysis results are summarized in
Table 2 for all samples. In general, activated samples possess higher carbon and lower hydrogen contents than non-activated samples with the exception of AS. The results also show that AS has a higher carbon content than the other samples. A high oxygen concentration in the AM sample could indicate that many oxygen-containing groups were present in addition to the carboxyl groups [
41].
The variations related to elemental composition from the biomass to hydrothermal-based carbon microspheres can be studied using the conventional Van Krevelen diagram (not shown for brevity). From this plot, it appears that the H/C and O/C atomic ratios adhere to the trend assigned to a dehydration process, with a slight deviation in the direction of the H/C atomic ratio indicating a low occurrence of the decarboxylation process [
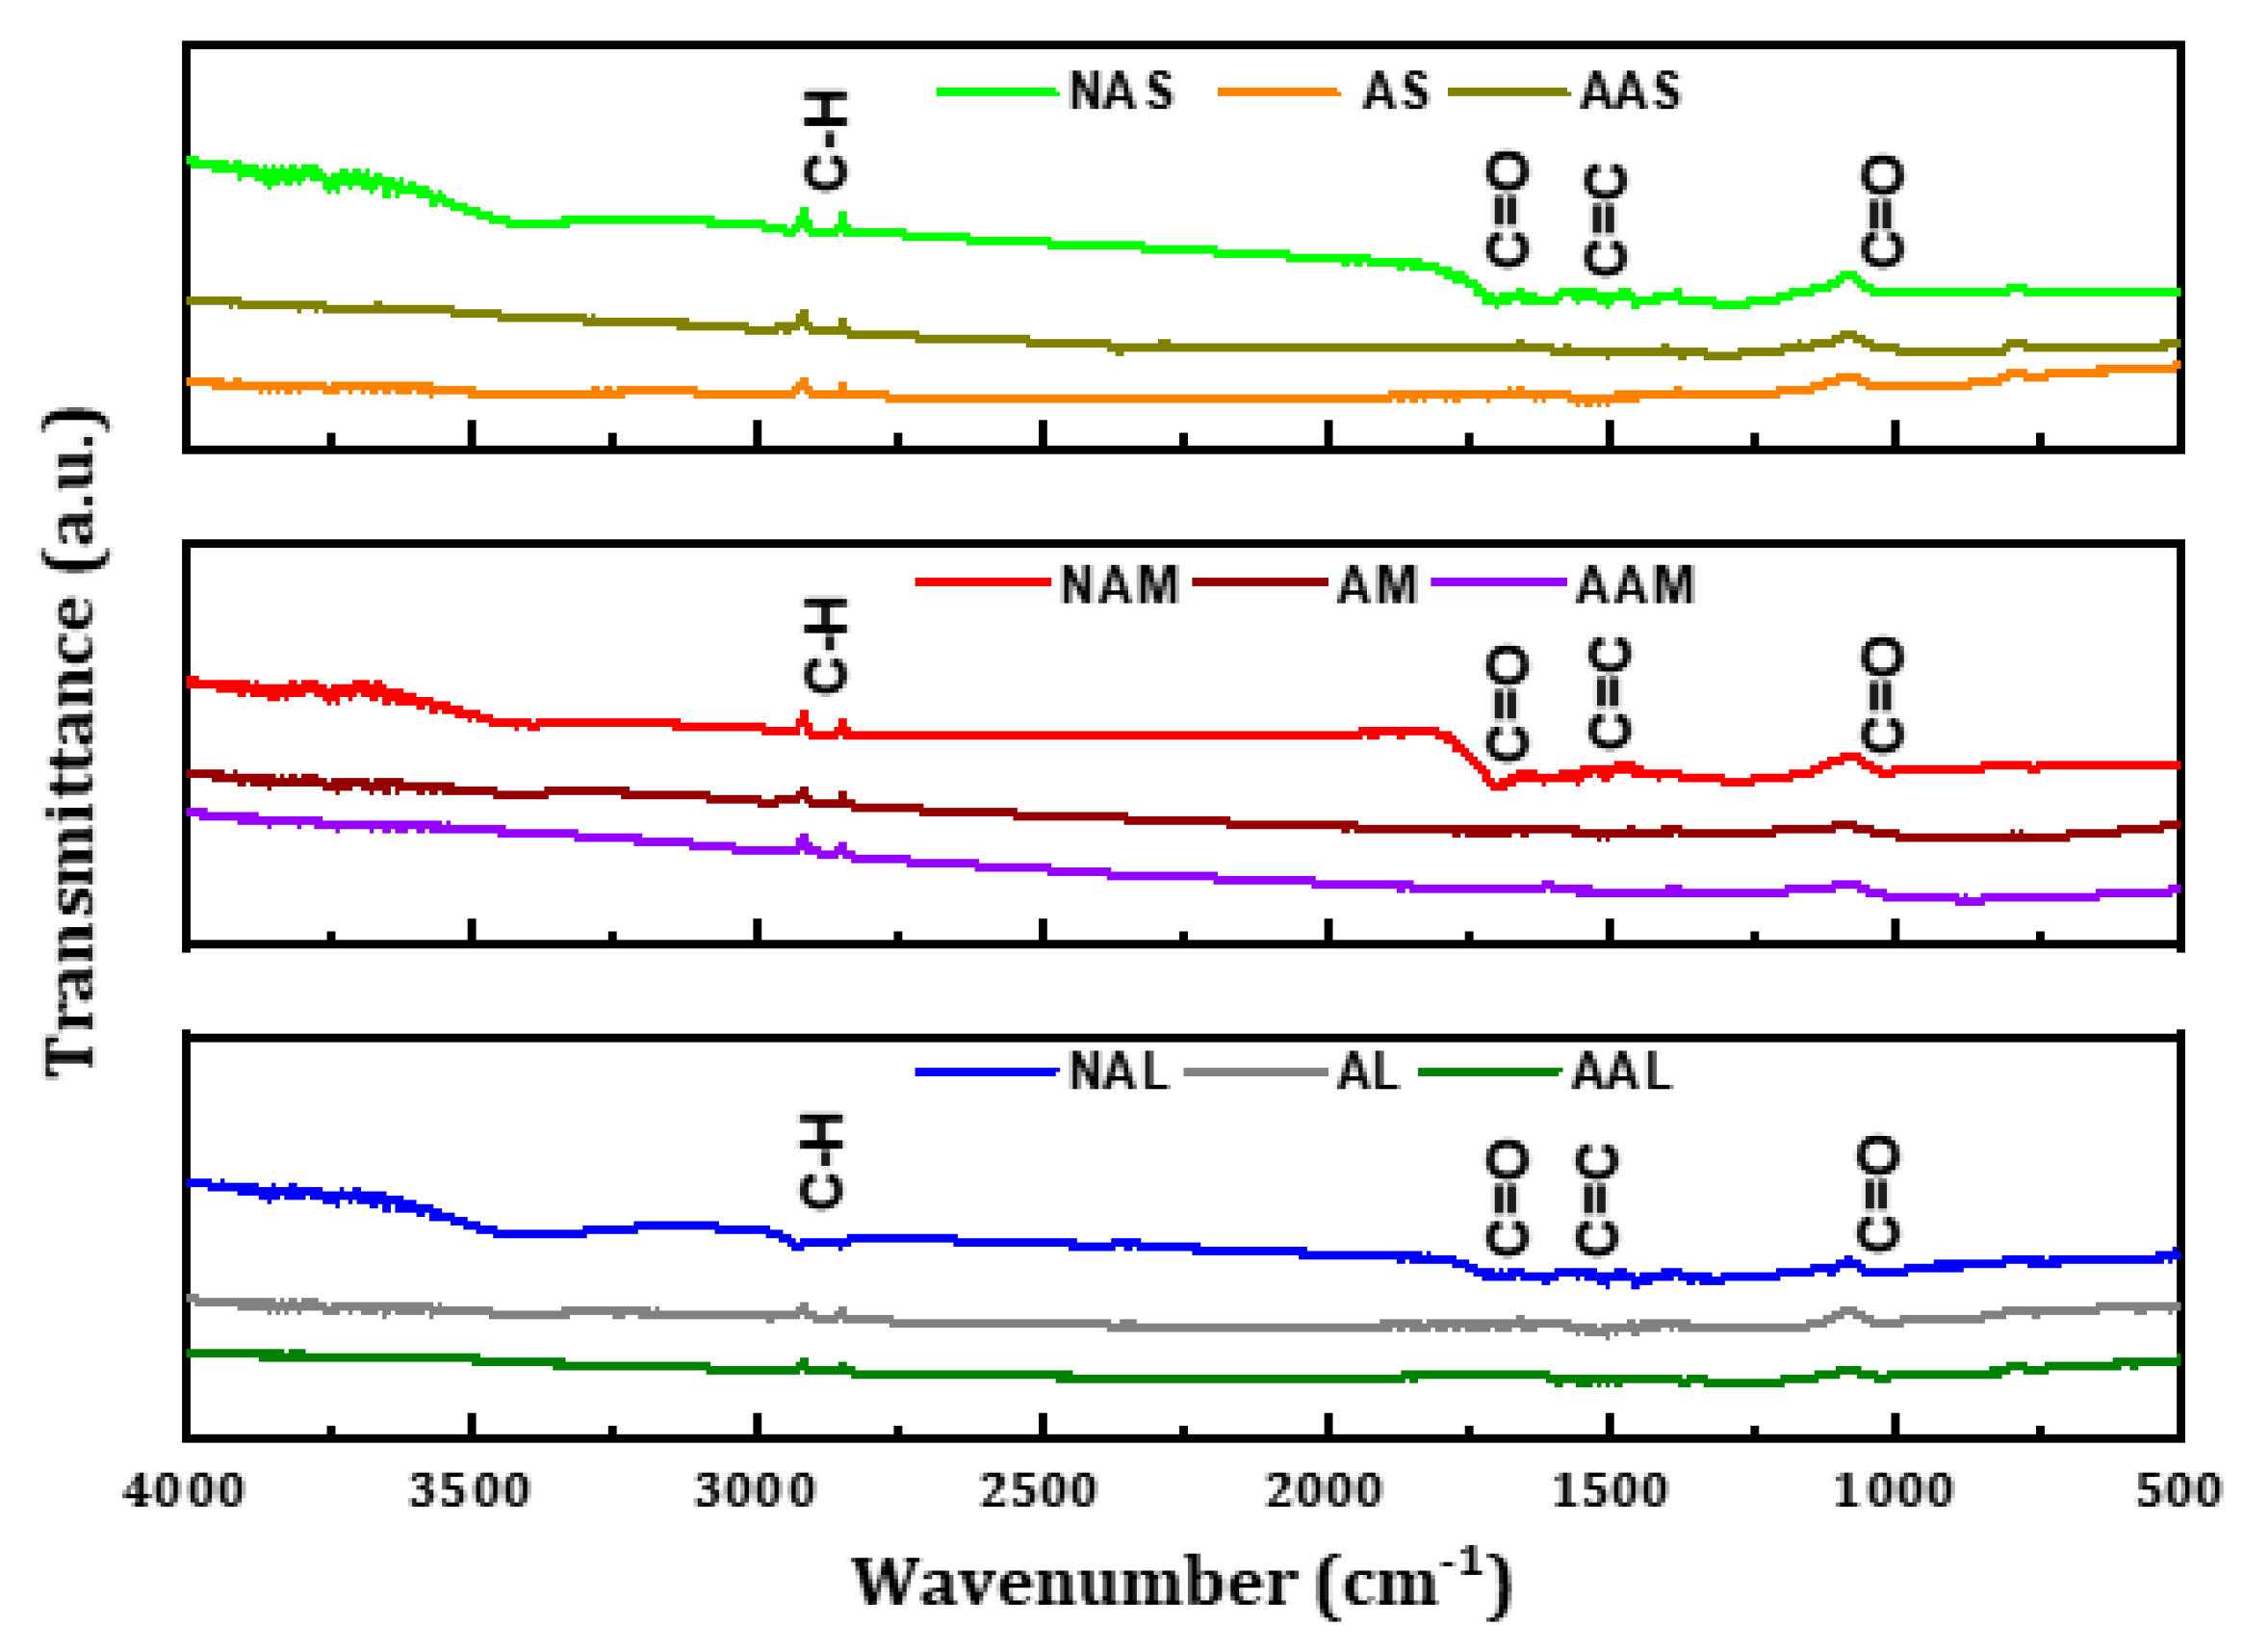
42]. The FTIR spectra for the CMs samples are shown in
Figure 4. The stretching vibrations attributed to aliphatic C–H groups are exhibited at around 2920 cm
−1 [
10]. The bands at approximately 1700 and 1610 cm
−1 can be assigned to C=O and C=C, respectively, implying the existence of aromatic rings (
ibid).
3.3. Adsorption Studies
3.3.1. Effect of pH
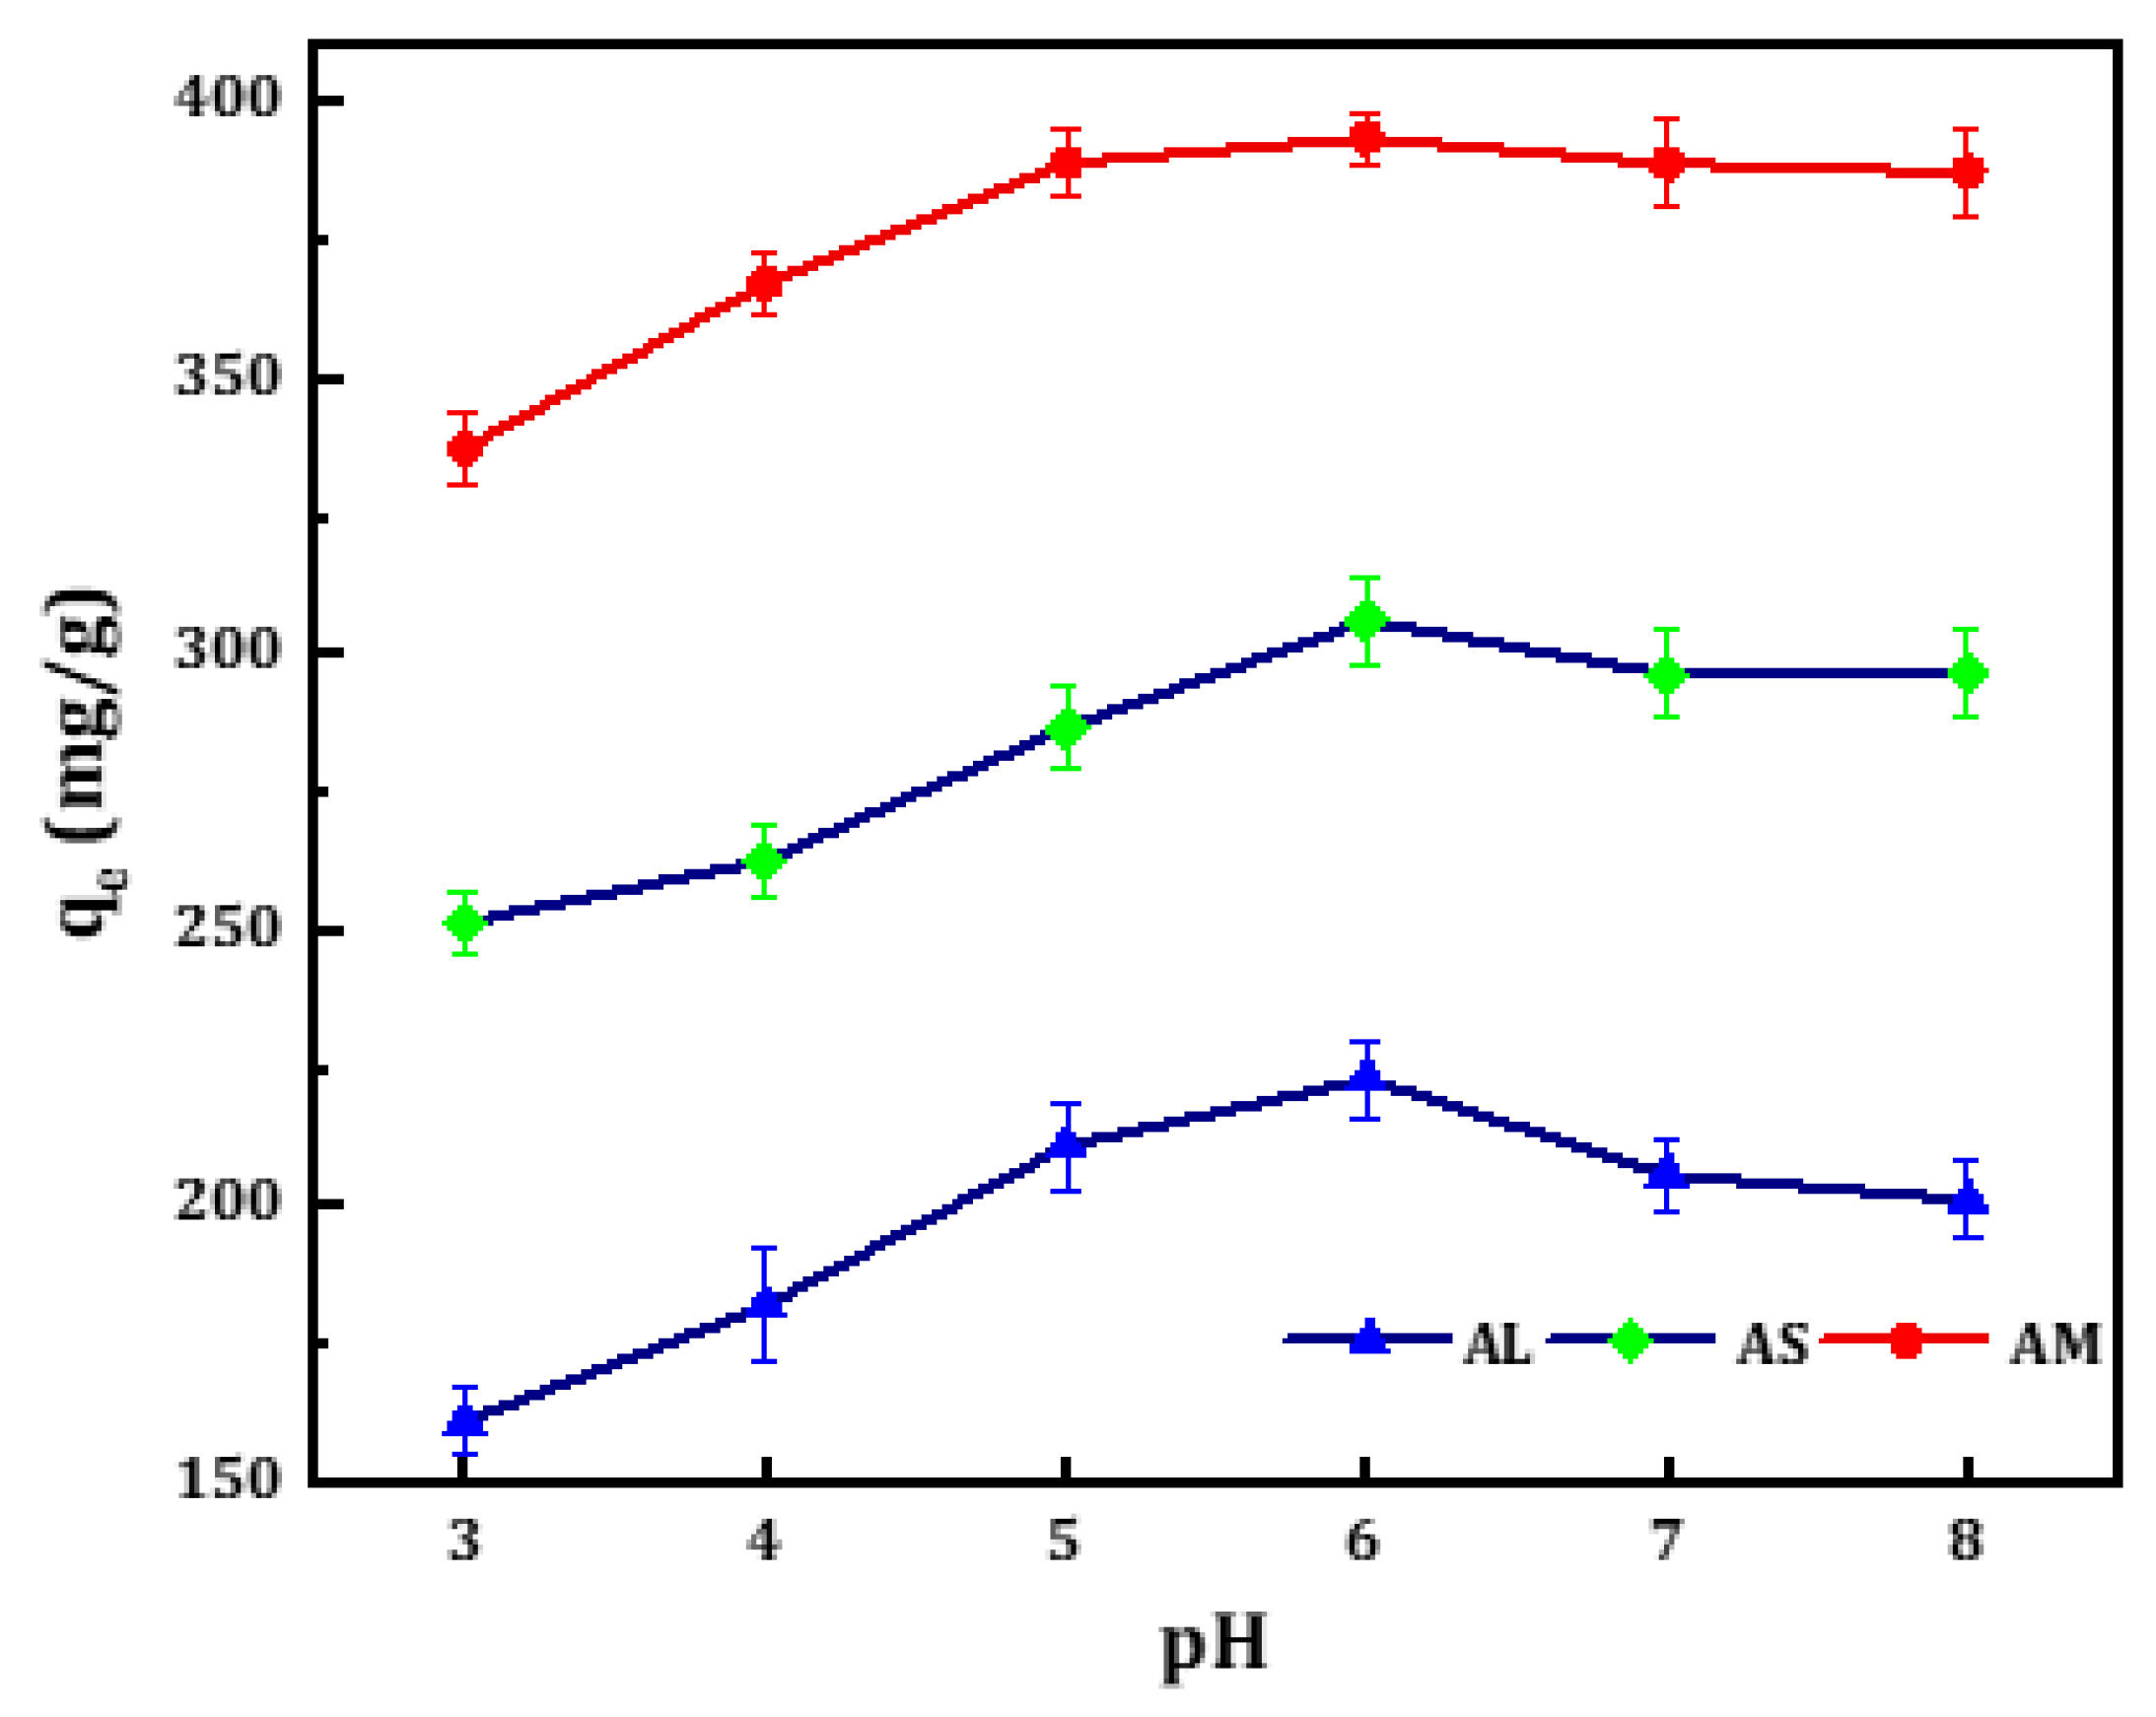
Adsorption efficiency is closely related to pH, since a change in pH can cause the surface charge of the adsorbent to be affected by protonation and deprotonation. The pH effect on the adsorption process of MB on the three activated samples was examined by varying the pH values from 3 to 8 under the following conditions: adsorbent dosage of 25 mg, MB concentration of 300 ppm, 50 mL MB solution and stirring speed of 150 rpm for 2 hours. The amount of adsorbed MB,
q against pH for the activated samples was plotted as shown in
Figure 5. The uptake of MB enhances with increasing pH from 3 to 6. The optimum pH of the solution was found to be 6 for all adsorbents and equilibrium was reached after about 120 min of contact time. The maximum adsorption capacity of MB on the activated CM samples (AS, AL, AM) were 306±8, 223±7, and 393.4±4.7 mg/g, respectively. After pH 6, the maximum amounts of MB gradually decrease.
3.3.2. The Influence of Initial Concentration and Contact Time
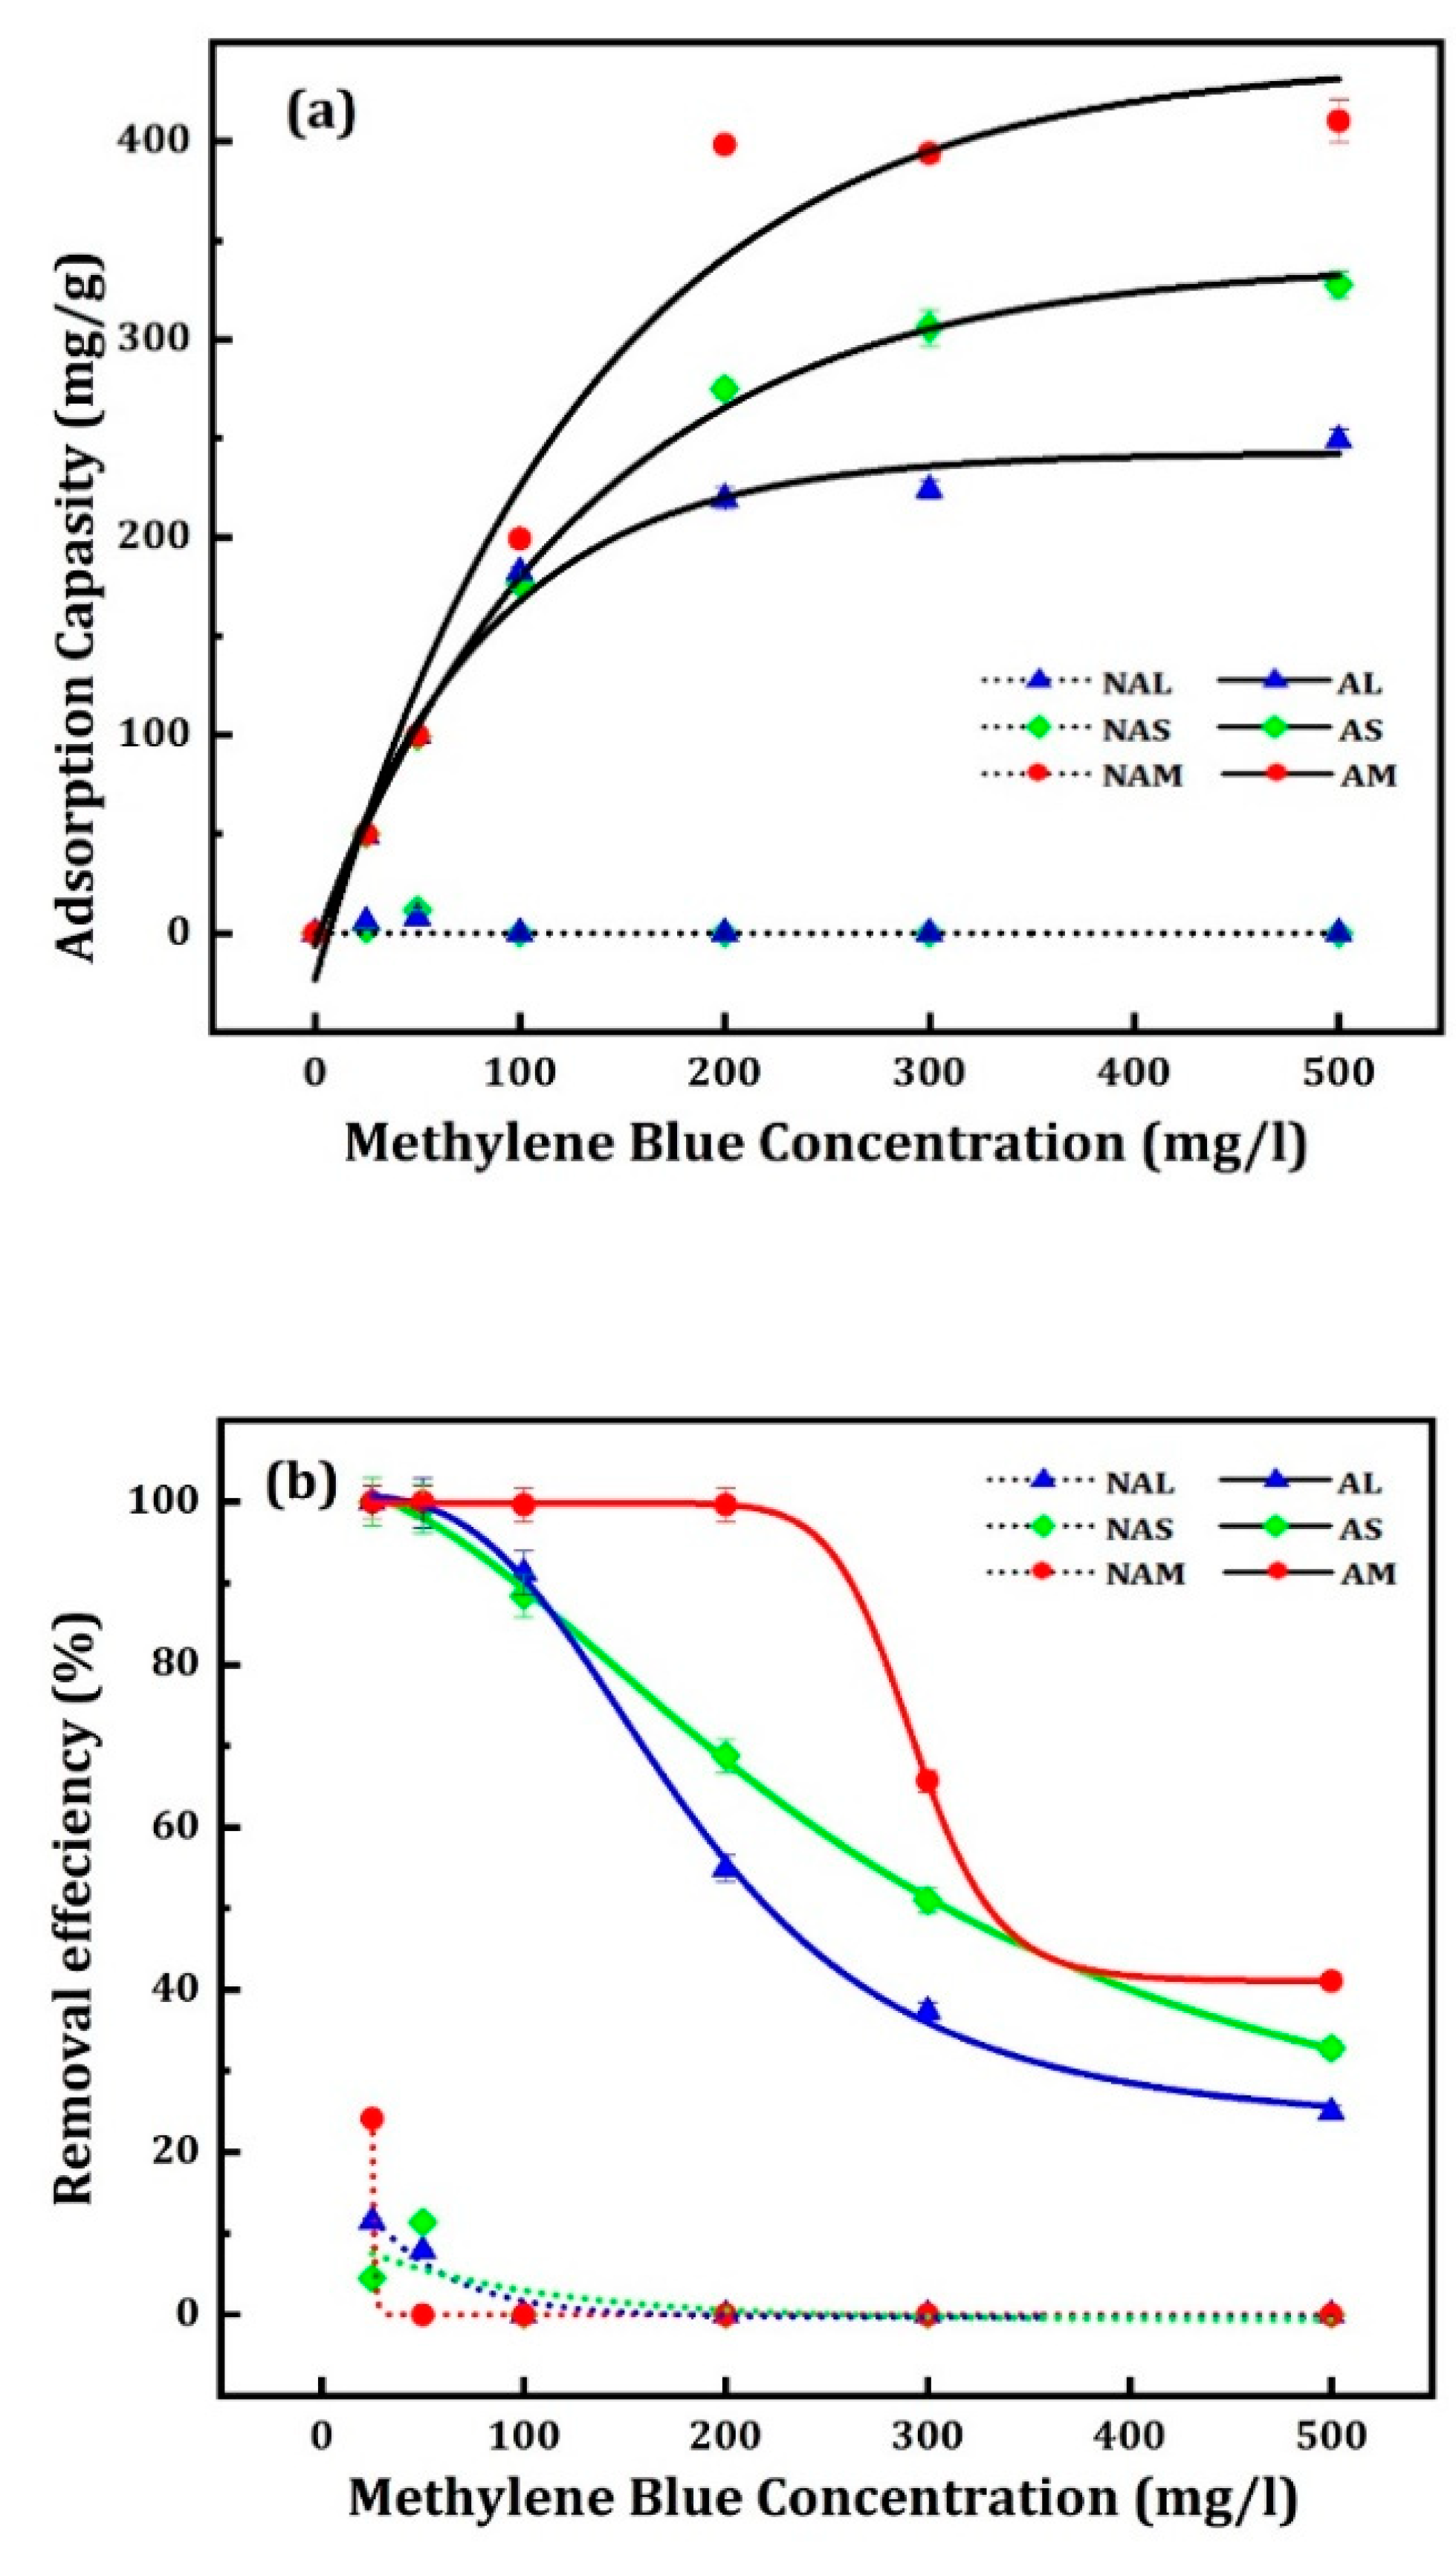
The effect of the initial concentration of MB solution on the adsorption capacity of the activated CM samples was investigated at dye concentrations from 25 to 500 mg/L and a fixed contact time of 540 minutes. The adsorption capacities of the adsorbents were determined. The equilibrium was achieved after 120 minutes. The removal of MB was faster in the initial stage, then gradually decreased and became constant after reaching equilibrium.
Figure 6 shows the adsorption capacities for MB at 25°C for inactivated and activated samples. It should be noted that the inactivated samples (NAS, NAL and NAM) adsorbed MB only at low concentrations (e.g., 25 and 50 ppm). This can be attributed to the differences in the surface area and pore size of the adsorbents, which affect the adsorption capacity. The maximum amounts of MB adsorbed, q
e, at 25 ppm were 2.25, 5.77 and 12.06 mg/g, respectively. Whereas for the activated samples, the adsorption capacity of the prepared samples increased with the increase of the concentration of MB. The maximum adsorption capacities were observed for (AM), 410.4±11.1 mg/g, followed by (AS), 327.8±6.7 mg/g, and (AL), 249.2±5.4 mg/g. The results showed that the three activated samples’ adsorption capacities enhanced with increasing initial dye concentration. The error values for the results of inactivated samples are less than 0.5%.
3.3.3. Adsorption Isotherm
The adsorption isotherm explains how adsorbent particles interact with the adsorbent material, which is vital for optimizing adsorption mechanisms, elucidation of surface properties and adsorption capacity and designing effective adsorption systems. Therefore, various adsorption models in their non-linear forms were used to analyze the obtained data. The program OriginPro - Graphing and Data Analysis was used for the non-linear regression and the parameters of the models were determined and compared to establish the adsorption behavior of studied system.
Langmuir Isotherm
The Langmuir adsorption model [
43] is applied to one-layer adsorption on active locations of the adsorbent (Equation (4)):
in which
qm (mg/g) represents the amount of adsorbed MB per unit mass of CMs relative to complete monolayer coverage and
K denotes to the Langmuir constant. The non-linear form of this model was conducted and its parameters were listed in
Table 3. It can be seen that the experimental data fit the Langmuir isotherm model quite well, with determination coefficients, R
2, close to 0.90 for all prepared samples. The maximal monolayer adsorption capacity obtained for the samples was in the order AM>AS>AL, with AM having the highest q
m (414.6 mg/g).
In addition, the Langmuir isotherm is linked to a dimensionless constant - the separation factor (R
L) (Equation (5)). The values of R
L can be obtained from the results of the experiment and a plot of the separation factor against the initial concentration (C
o) can be generated. The dimensionless constant in the mathematical expression can be written as follows:
in which C
o represents the highest initial MB concentration (mg/L). The value of R
L indicates the type of adsorption process: R
L < 1, the adsorption is favorable, R
L = 1, the adsorption is linear, R
L > 1, the adsorption is unfavorable, and R
L = 0, the adsorption is irreversible. The values of R
L have been obtained for AS, AL, and AM to be 0.993, 0.980, and 0.0033 respectively suggesting that adsorption is a favorable process, for all range of dye concentrations in this experimental work.
Freundlich Isotherm
The Freundlich adsorption model [
44] is given by Equation (6):
where,
KF and
n are constants, estimated from the slope and intercept of the linear plot of log
qe versus log
Ce (Equation (6)). The 1/
n value is observed to be between the range of 0-1 and the adsorption becomes more heterogeneous when the value of 1/
n approaches 0. A steep slope is seen when 1/
n is closer to 1 and it reflects a higher adsorption capacity at higher equilibrium concentrations, which decreases rapidly at a low equilibrium concentration [
45]. Fitting of the experimental data to non-linear form of Freundlich adsorption resulted in R
2 values of 0.967, 0.953, and 0.842 for AS, AL and AM, respectively.
Temkin Isotherm
The Temkin isotherm model [
47] is expressed by the Equation (7):
where
R gas constant, and
T is study temperature
oC, while
bT, and
AT are model constants and it depends on system and adsorbent. Temkin isotherm observes that the heat of adsorption of all molecules in the layer reduces linearly with coverage due to interactions between adsorbate molecules [
47]. Unlike the Freundlich isotherm, the Temkin isotherm assumes an unvarying dispersal of binding energies on the surface. Therefore, the Temkin isotherm is often used to model adsorption on homogeneous surfaces, whereas the Freundlich isotherm is more appropriate for heterogeneous surfaces [
2].The constants of the Temkin model were determined and listed in
Table 3. The coefficients of determination were 0.964, 0.955 and 0.844 for AS, AL and AM, respectively.
In comparison to all R
2 values, it was seen that the experimental data fitted well with the investigated models for activated seeds and leaflet samples and to a lesser extent, the molasses sample. Hence, it can be deduced that monolayer adsorption has taken place in the batch adsorption process utilizing the activated samples, as the experimental data best fitted the Langmuir adsorption isotherm quite well. It also revealed that the dye molecules in the solution were not being deposited onto the other dye molecules which had been adsorbed onto the adsorptive sites of the activated samples.
Table 4 lists the comparison of maximum adsorption capacities of MB on different adsorbents. It shows that the activated molasses (AM) in this work possess outsized and superior adsorption capacities as compared with other previously reported biomass, which bode well to the application of dye contaminant removals from wastewaters.
3.3.4. Adsorption Kinetics
The adsorption kinetic analysis was performed to assess the adsorptive capability of the adsorbent as well as to investigate the mechanism of mass transfer and the reaction rate. In addition, this analysis will afford insights into the adsorption pathway and probable mechanism involved. Pseudo-second order kinetic model [
55] were adopted in this work in order to outline the dynamic of the adsorption process.
The Pseudo-second-order model is expressed by Equation (8):
in which
k2 is the rate constant of the second-order reaction (g/mg. min), and
qe and
qt are the amounts of adsorbate (mg/g) adsorbed at equilibrium and time
t (min), respectively. The Pseudo-second-order model is centered on the notion that the rate-determining step of adsorption is chemisorption relating to valence forces via the sharing or swap of electrons between the adsorbent and adsorbate. Pseudo-second order constant (k
2) were established for the three activated samples and listed in
Table 5. It was observed that the value of the linear regression for AS, AL, and AM were 0.994, 0.985 and 0.9999, respectively. This agrees with Ho and McKay [
56] in which it was concluded that in all adsorption systems that they analyzed, pseudo-second-order (PSO) kinetics provided the best correlation with experimental data. The theoretical, q
theo, and experimental, q
exp,
. Adsorption values were compared and presented in
Table 5.
3.4. Multistage Extraction, Reusability, and Recovery Studies
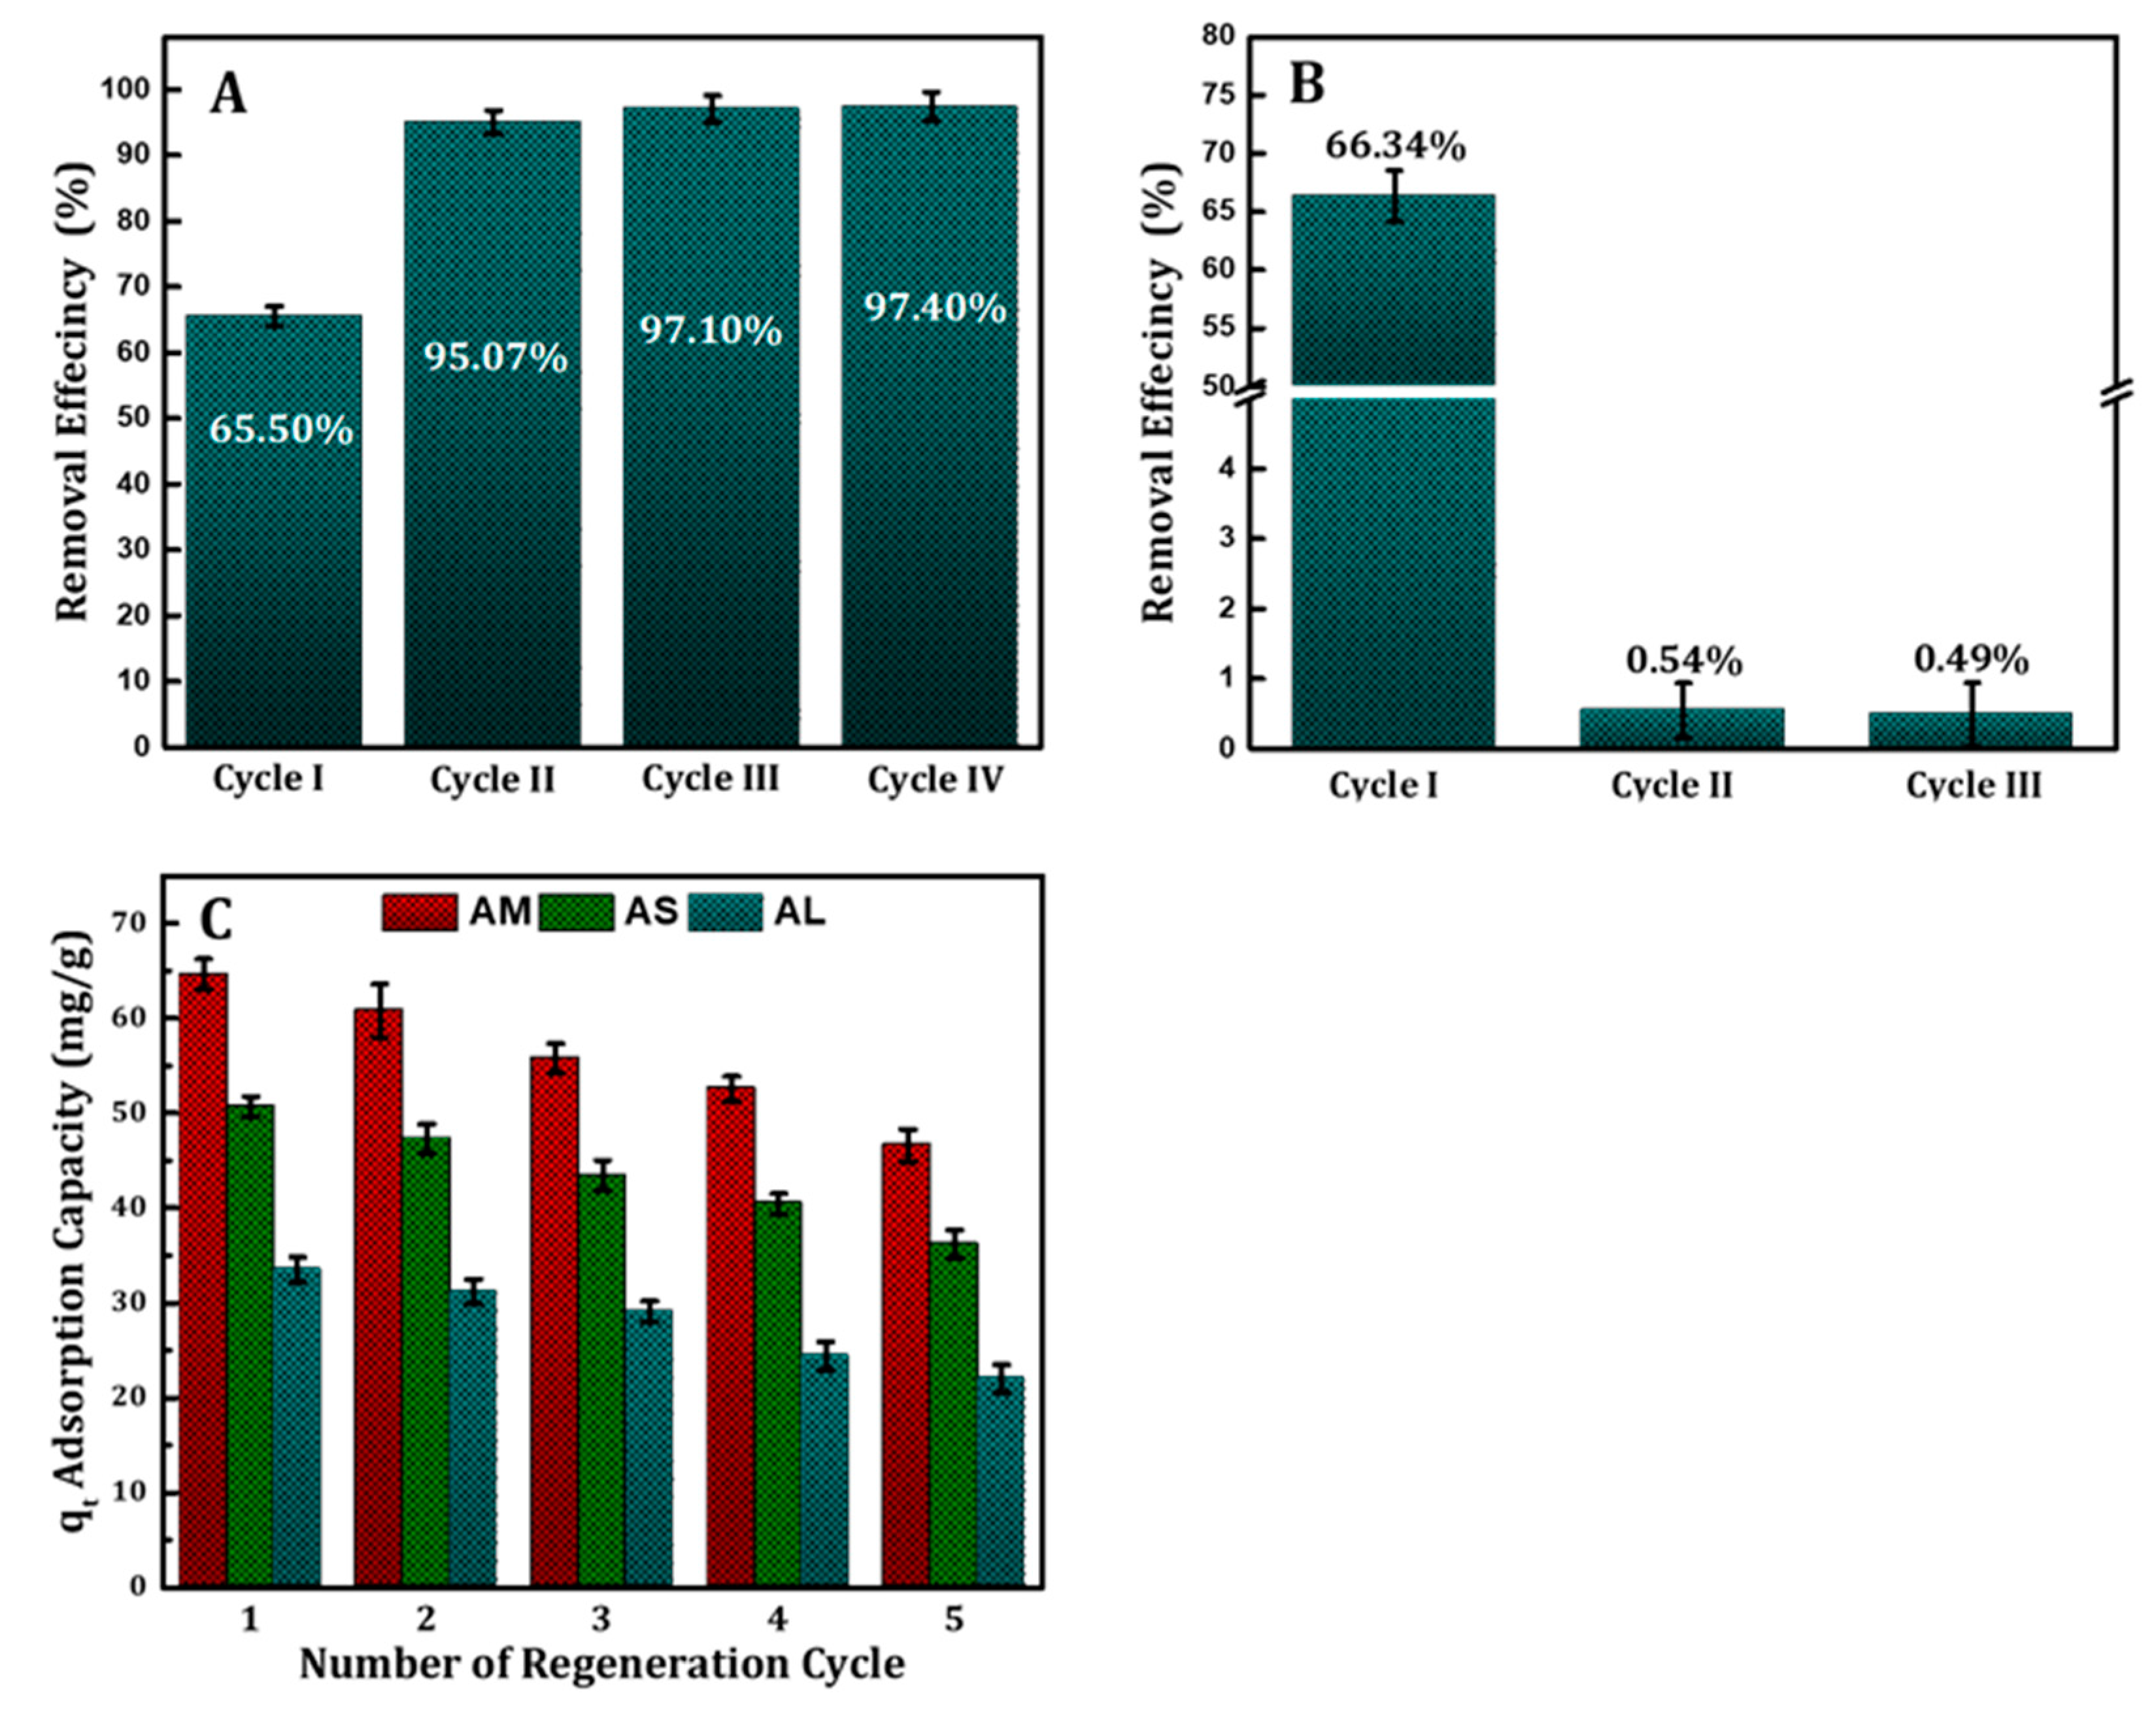
The MB was not completely removed in a single cycle of adsorption. Thus, it is worthwhile to consider a multistage extraction approach. The evolution of the amount of MB along the extraction cycles is depicted in
Figure 7A. As expected, after three successive extraction steps, less than 3% of MB the amount is detected. On the other hand, the reusability of AM without any treatment was limited where the surface of sample was saturated by MB and less than 1% removal was recorded for the second and third time as shown in
Figure 7B. The regenerated adsorbent samples were studied for five adsorptions–desorption cycles as shown in
Figure 7C. According to the results, the AM, AS, and AL retained reuse efficiencies of 46.6, 36.2 and 22.01% respectively from the original concentration in MB removal subsequent to five successive adsorption–desorption cycles.
4. Conclusions
By utilizing a method of hydrothermal carbonization integrated with incipient wetness impregnation, we have synthesized distinctive and comparatively well-defined CMs with outsized BET surface area values from a variety of palm-based biowastes. In terms of surface functionality, phenolic groups dominate the surfaces of the both the activated as well as the non-activated samples. Our physisorption analysis suggests that the phosphoric acid activated process induce higher pore volumes while generating more mesoporosities on the surface of the CMs – such mesoporosities are favorable for liquid-based adsorption processes. The highest MB adsorption capacity in excess of 400 mg/g recorded by palm date molasses activated hydrochar represents the suitability of our CMs for adsorption of MB in a fluidic environment. Results from our study are vital because it affords a three-pronged outcome in the form of repurposing and reuse of bio-waste resources, synthesis of valuable microparticles and application in dye-based wastewater treatment. The model fitting findings from our work can be employed to scale-up bench-scale adsorption system for wastewater treatment applications.
Author Contributions
Conceptualization, M.E.-H., A.S.A.-A., L.E.B., M.M.A. and C.-Y.Y.; Methodology, M.E.-H., A.S.A.-A. and S.A.; Validation, L.E.B. and C.-Y.Y.; Formal analysis, M.E.-H., A.S.A.-A. and C.-Y.Y.; Investigation, L.E.B., A.S.A.-A., A.A. and C.-Y.Y.; Resources, L.E.B. and S.A.; Data curation, C.-Y.Y.; Writing—original draft, M.E.-H.; Writing—review & editing, C.-Y.Y.; Supervision, M.E.-H., L.E.B. and C.-Y.Y.; Funding acquisition, M.E.-H. and M.M.A. All authors have read and agreed to the published version of the manuscript.
Acknowledgments
The authors would like to thank the Deputyship for Research & Innovation, "Ministry of Education" in Saudi Arabia for funding this research work through project number IFKSUDR_F158.
References
- Ryu, J.; Suh, Y.W.; Suh, D.J.; Ahn, D.J. Hydrothermal preparation of carbon microspheres from mono-saccharides and phenolic compounds. Carbon 2010, 48, 1990–1998. [Google Scholar] [CrossRef]
- Demir-Cakan, R.; Baccile, N.; Antonietti, M.; Titirici, M. –M. Carboxylate-rich carbonaceous materials via one-step hydrothermal carbonization of glucose in the presence of acrylic acid. Chem. Mater. 2009, 21, 484–490. [Google Scholar] [CrossRef]
- Al-Awadi, A.S.; El-Harbawi, M.; Algarawi, A.; Alalawi, A.; Alrashed, M.M.; Yin, C.Y. Synthesis of carbon microspheres via hydrothermal carbonization of Sabal palms (Sabal palmetto) biomass for adsorption of methylene blue. Biomass Conv. Bioref. 2022, 1–11. [Google Scholar] [CrossRef]
- Yek, P.N.Y.; Liew, R.K.; Mahari, W.A.W.; Peng, W.; Sonne, C.; Kong, S.H.; Tabatabaei, M.; Aghbashlo, M.; Park, Y.K.; Lam, S.S. Production of value-added hydrochar from single-mode microwave hydrothermal carbonization of oil palm waste for de-chlorination of domestic water. Sci. Total Environ. 2022, 833, 154968. [Google Scholar] [CrossRef] [PubMed]
- Tasca, A.L.; Puccini, M.; Gori, R.; Corsi, I.; Galletti, A.M.R.; Vitolo, S. Hydrothermal carbonization of sewage sludge: A critical analysis of process severity, hydrochar properties and environmental implications. Waste Manage. 2019, 93, 1–13. [Google Scholar] [CrossRef]
- Zhang, J.H.; Lin, Q.M.; Zhao, X.R. The hydrochar characters of municipal sewage sludge under different hydrothermal temperatures and durations. J. Integr. Agric. 2014, 13, 471–482. [Google Scholar] [CrossRef]
- Liu, Y.; Sun, Y.; Wan, Z.; Jing, F.; Li, Z.; Chen, J.; Tsang, D.C. Tailored design of food waste hydrochar for efficient adsorption and catalytic degradation of refractory organic contaminant. J. Cleaner Prod. 2021, 310, 127482. [Google Scholar] [CrossRef]
- Saqib, N.U.; Baroutian, S.; Sarmah, A.K. Physicochemical, structural and combustion characterization of food waste hydrochar obtained by hydrothermal carbonization. Bioresour. Technol. 2018, 266, 357–363. [Google Scholar] [CrossRef] [PubMed]
- Pak, S.; Ahn, J.; Kim, H. Synthesis of Saccharide-based Hydrochar with Macroporous Structure for Effective Organic Pollutant Removal. Fibers Polym. 2022, 23, 1789–1796. [Google Scholar] [CrossRef]
- Sevilla, M.; Fuertes, A.B. Chemical and structural properties of carbonaceous products obtained by hydrothermal carbonization of saccharides. Chem. Eur. J. 15, 4195–4203. [CrossRef] [PubMed]
- Jabeen, S.; Gao, X.; Hayashi, J.I.; Altarawneh, M.; Dlugogorski, B.Z. Effects of product recovery methods on the yields and properties of hydrochars from hydrothermal carbonization of algal biomass. Fuel 2023, 332, 126029. [Google Scholar] [CrossRef]
- El-Harbawi, M.; Alhawtali, S.; Al-Awadi, A.S.; El Blidi, L.; Alrashed, M.M.; Alzobidi, A.; Yin, C.Y. Synthesis of Carbon Microspheres from Inedible Crystallized Date Palm Molasses: Influence of Temperature and Reaction Time. Mater. 2023, 16, 1672. [Google Scholar] [CrossRef] [PubMed]
- Zhang, Y.N.; Guo, J.Z.; Wu, C.; Huan, W.W.; Chen, L.; Li, B. Enhanced removal of Cr (VI) by cation functionalized bamboo hydrochar. Bioresour. Technol. 2022, 347, 126703. [Google Scholar] [CrossRef] [PubMed]
- Ali, A.M.; Shahbaz, M.; Shahzad, K.; Inayat, M.; Naqvi, S.; Al-Zahrani, A.A.; Rashid, M.I.; Rehan, M.; Mahpudz, A.B. Polygeneration syngas and power from date palm waste steam gasification through an Aspen Plus process modeling. Fuel 2023, 332, 126120. [Google Scholar] [CrossRef]
- Faiad, A.; Alsmari, M.; Ahmed, M.M.; Bouazizi, M.L.; Alzahrani, B.; Alrobei, H. Date palm tree waste recycling: treatment and processing for potential engineering applications. Sustainability 2022, 14, 1134. [Google Scholar] [CrossRef]
- Danish, M.; Hashim, R.; Ibrahim, M.M.; Sulaiman, O. Optimized preparation for large surface area activated carbon from date (Phoenix dactylifera L.) stone biomass. Biomass Bioenergy, 2014, 61, 167–178. [Google Scholar] [CrossRef]
- Sabzevari, A.; Kabiri, K. Converting date seed biomass into highly absorbing hydrogel. Iran. Polym. J. 2016, 25, 597–606. [Google Scholar] [CrossRef]
- Abu-Jrai, A.M.; Jamil, F.; Ala’a, H.; Baawain, M.; Al-Haj, L.; Al-Hinai, M.; Al-Abri, M.; Rafiq, S. Valorization of waste Date pits biomass for biodiesel production in presence of green carbon catalyst. Energy Convers. Manag. 2017, 135, 236–243. [Google Scholar] [CrossRef]
- Elnajjar, E.; Syam, M.M.; Al-Omari, S.A.B. Experimental investigations of bio-syngas production using microwave pyrolysis of UAE’S palm date seed pits. Fuel 2021, 303, 121348. [Google Scholar] [CrossRef]
- Bhatia, D.; Sharma, N.R.; Singh, J.; Kanwar, R.S. Biological methods for textile dye removal from wastewater: A review. Crit. Rev. Environ. Sci. Technol. 2017, 47, 1836–1876. [Google Scholar] [CrossRef]
- Bayomie, O.S.; Kandeel, H.; Shoeib, T.; Yang, H.; Youssef, N.; El-Sayed, M.M. Novel approach for effective removal of methylene blue dye from water using fava bean peel waste. Sci. Rep. 2020, 10, 7824. [Google Scholar] [CrossRef]
- Góralczyk-Bińkowska, A.; Długoński, A.; Bernat, P.; Długoński, J.; Jasińska, A. Environmental and molecular approach to dye industry waste degradation by the ascomycete fungus Nectriella pironii. Sci. Rep. 2021, 11, 1–13. [Google Scholar]
- Yaseen, D.A; Scholz, M. Textile dye wastewater characteristics and constituents of synthetic effluents: a critical review. Int J Environ Sci Technol. 2019, 16, 1193–1226. [Google Scholar] [CrossRef]
- Li, Y.; Meas, A.; Shan, S.; Yang, R.; Gai, X.; Wang, H.; Tsend, N. Hydrochars from bamboo sawdust through acid assisted and two-stage hydrothermal carbonization for removal of two organics from aqueous solution. Bioresour. Technol. 2018, 261, 257–264. [Google Scholar] [CrossRef] [PubMed]
- Qian, W.C.; Luo, X.P.; Wang, X.; Guo, M.; Li, B. Removal of methylene blue from aqueous solution by modified bamboo hydrochar. Ecotoxicol. Environ. Saf. 2018, 157, 300–306. [Google Scholar] [CrossRef] [PubMed]
- Islam, M.A.; Ahmed, M.J.; Khanday, W.A.; Asif, M.; Hameed, B.H. Mesoporous activated coconut shell-derived hydrochar prepared via hydrothermal carbonization-NaOH activation for methylene blue adsorption. J. Environ. Manage. 2017, 203, 237–244. [Google Scholar] [CrossRef] [PubMed]
- Tran, T.H.; Le, A.H.; Pham, T.H.; Nguyen, D.T.; Chang, S.W.; Chung, W.J.; Nguyen, D.D. Adsorption isotherms and kinetic modeling of methylene blue dye onto a carbonaceous hydrochar adsorbent derived from coffee husk waste. Sci. Total Environ. 2020, 725, 138325. [Google Scholar] [CrossRef]
- Zhou, F.; Li, K.; Hang, F.; Zhang, Z.; Chen, P.; Wei, L.; Xie, C. Efficient removal of methylene blue by activated hydrochar prepared by hydrothermal carbonization and NaOH activation of sugarcane bagasse and phosphoric acid. RSC Adv. 2022, 12, 1885–1896. [Google Scholar] [CrossRef]
- Lotfiman, S.; Awang Biak, D.R.; Ti, T.B.; Kamarudin, S.; Nikbin, S. Influence of date syrup as a carbon source on bacterial cellulose production by Acetobacter xylinum 0416. Adv. Polym. Technol. 2018, 37, 1085–1091. [Google Scholar] [CrossRef]
- Sevilla, M.; Fuertes, A.B. The production of carbon materials by hydrothermal carbonization of cellulose. Carbon 47, 2281–2289. [CrossRef]
- Sun, X.; Li, Y. Colloidal carbon spheres and their core/shell structures with noble-metal nanoparticles. Angew. Chem. Int. Ed. Engl. 2004, 116, 607–611. [Google Scholar]
- Nasser, R.A.; Salem, M.Z.; Hiziroglu, S.; Al-Mefarrej, H.A.; Mohareb, A.S.; Alam, M.; Aref, I.M. Chemical analysis of different parts of date palm (Phoenix dactylifera L.) using ultimate, proximate and thermo-gravimetric techniques for energy production. Energies 2016, 9, 374. [Google Scholar] [CrossRef]
- Romero-Anaya, AJ.; Lillo-Ro´denas, MA.; Salinas-Martı´nez de Lecea, C.; Linares-Solano, A. Hydrothermal and conventional H3PO4 activation of two natural bio-fibers. Carbon 2012, 50, 3158–3169. [Google Scholar] [CrossRef]
- Romero-Anaya, A.J., Ouzzine, M., Lillo-Rodenas, M.A. and Linares-Solano, A. Spherical carbons: Synthesis, characterization and activation processes. Carbon 2014, 68, 296–307. [CrossRef]
- Boehm, H.-P. Chemical identification of surface groups. In: Eley DD, Pines H, Weisz PB (eds) Advances in catalysis. Academic Press, Cambridge, 1966, pp. 179–274.
- Boehm, H.-P. Surface chemical characterization of carbons from adsorption studies. Adsorption by Carbons 2008, pp. 301–327.
- Genli, N.; Kutluay, S.; Baytar, O.; Şahin, Ö. Preparation and characterization of activated carbon from hydrochar by hydrothermal carbonization of chickpea stem: an application in methylene blue removal by RSM optimization. Int. J. Phytoremediation 2021, 1–13. [Google Scholar] [CrossRef]
- Everett, D.H. Manual of symbols and terminology for physicochemical quantities and units, appendix II: Definitions, terminology and symbols in colloid and surface chemistry. Pure Appl. Chem. 1971, 31, 577–638. [Google Scholar] [CrossRef]
- De Souza Macedo, J.; da Costa Júnior, N.B.; Almeida, L.E.; da Silva Vieira, E.F.; Cestari, A.R.; de Fátima Gimenez, I.; Villarreal Carreno, N.L.; Barreto, L.S. Kinetic and calorimetric study of the adsorption of dyes on mesoporous activated carbon prepared from coconut coir dust. J. Colloid Interface Sci. 2006, 298, 515–522. [Google Scholar] [CrossRef] [PubMed]
- Jia, P.; Tan, H.; Liu, K.; Gao, W. Removal of Methylene Blue from Aqueous Solution by Bone Char. Appl. Sci. 2018, 8, 1903. [Google Scholar] [CrossRef]
- Fernandez, M.E.; Ledesma, B.; Román, S.; Bonelli, P.R.; Cukierman, A.L. Development and characterization of activated hydrochars from orange peels as potential adsorbents for emerging organic contaminants. Bioresour. Technol. 2015, 183, 221–228. [Google Scholar] [CrossRef]
- Zheng, Q.; Morimoto, M.; Takanohashi, T. Production of carbonaceous microspheres from wood sawdust by a novel hydrothermal carbonization and extraction method. RSC Adv. 2017, 7, 42123–42128. [Google Scholar] [CrossRef]
- Langmuir, I. The constitution and fundamental properties of solids and liquids. Part I. Solids. Part I. Solids. J. Am. Chem. Soc. 1916, 38, 2221–2295. [Google Scholar] [CrossRef]
- Freundlich, H. Über die adsorption in lösungen. Zeitschrift für physikalische Chemie 1907, 57, 385–470. [Google Scholar] [CrossRef]
- Fytianos, K.; Voudrias, E.; Kokkalis, E. Sorption-desorption Behaviour of 2, 4-dichlorophenol by Marine Sediments. Chemosphere 2000, 40, 3–6. [Google Scholar] [CrossRef]
- Redlich, O.; Peterson, D.L. A Useful Adsorption Isotherm. J. Phys. Chem. 1959, 63, 1024–1024. [Google Scholar] [CrossRef]
- Temkin, M. I. Adsorption equilibrium and kinetics of processes on nonhomogeneous surfaces and at interaction between adsorbed molecules. Zh. Fiz. Khim. 1941, 15, 296–332. [Google Scholar]
- Sun, Z.; Liu, Y.; Srinivasakannan, C. Green Preparation and Environmental Application of Porous Carbon Microspheres. ChemistrySelect 2020, 5, 9308–9312. [Google Scholar] [CrossRef]
- Salimi, M.; Balou, S.; Kohansal, K.; Babaei, K.; Tavasoli, A.; Andache, M. Optimizing the preparation of meso-and microporous canola stalk-derived hydrothermal carbon via response surface methodology for methylene blue removal. Energy Fuels 2017, 31, 12327–12338. [Google Scholar] [CrossRef]
- Ferrentino, R.; Ceccato, R.; Marchetti, V.; Andreottola, G.; Fiori, L. Sewage sludge hydrochar: an option for removal of methylene blue from wastewater. Appl. Sci. 2020, 10, 3445. [Google Scholar] [CrossRef]
- Madduri, S.; Elsayed, I. Novel oxone treated hydrochar for the removal of Pb (II) and methylene blue (MB) dye from aqueous solutions. Chemosphere 2020, 260, 127683. [Google Scholar] [CrossRef]
- Li, B.; Guo, J.; Lv, K.; Fan, J. Adsorption of methylene blue and Cd (II) onto maleylated modified hydrochar from water. Environ. Pollut. 2019, 254, 113014. [Google Scholar] [CrossRef]
- Zou, W.; Li, K.; Bai, H.; Shi, X.; Han, R. Enhanced cationic dyes removal from aqueous solution by oxalic acid modified rice husk. J. Chem. Eng. Data 2011, 56, 1882–1891. [Google Scholar] [CrossRef]
- Lagergren, S. Zur Theorie der Sogenannten Adsorption Gelöster Stoffe, Kungliga Svenska Vetenskapsakademiens. Handlingar 1898, 24, 1–39. [Google Scholar]
- Ho, Y.S.; McKay, F.G. Kinetic Models for the Sorption of Dye from Aqueous Solution by Wood. Process Saf. Environ. Prot. 1998, 76, 183–191. [Google Scholar] [CrossRef]
- Ho, Y.S.; McKay, F.G. Pseudo-Second Order Model for Sorption Processes. Process Biochemistry, 1999, 34, 451–465. [Google Scholar] [CrossRef]
|
Disclaimer/Publisher’s Note: The statements, opinions and data contained in all publications are solely those of the individual author(s) and contributor(s) and not of MDPI and/or the editor(s). MDPI and/or the editor(s) disclaim responsibility for any injury to people or property resulting from any ideas, methods, instructions or products referred to in the content. |
© 2023 by the authors. Licensee MDPI, Basel, Switzerland. This article is an open access article distributed under the terms and conditions of the Creative Commons Attribution (CC BY) license (http://creativecommons.org/licenses/by/4.0/).
