Submitted:
28 June 2023
Posted:
03 July 2023
You are already at the latest version
Abstract
Keywords:
1. Introduction
2. Materials and Methods
2.1. Study design
2.2. Patients and measurements
2.3. Histological evaluation of vascular mimicry
2.4. Statistical analysis
2.5. Data availability
3. Results
3.1. Patient characteristics
3.2. The Outcomes of GBM with or without EVF
3.3. Prognostic factors within our study population
3.4. Subgroup analyses
3.5. Relationship between EVF and vascular mimicry
4. Discussion
4.1. EVF and its regional specificity in GBM
4.2. Clinical significance of EVF
4.3. Relationship between EVF and vascular mimicry
4.4. Potential efficacy of preoperative angiography in GBM patients
4.5. Limitations
5. Conclusions
Supplementary Materials
Author Contributions
Funding
Institutional Review Board Statement
Informed Consent Statement
Data Availability Statement
Acknowledgments
Conflicts of Interest
References
- Kondo, T. Glioblastoma-initiating cell heterogeneity generated by the cell-of-origin, genetic/epigenetic mutation and microenvironment. Semin Cancer Biol 2022, 82, 176–183. [Google Scholar] [CrossRef]
- Li, D.; Zhang, Z.; Xia, C.; Niu, C.; Zhou, W. Non-coding RNAs in glioma microenvironment and angiogenesis. Front Mol Neurosci 2021, 14, 763610. [Google Scholar] [CrossRef]
- Hardee, M. E.; Zagzag, D. Mechanisms of glioma-associated neovascularization. Am J Pathol 2012, 181, 1126–1141. [Google Scholar] [CrossRef]
- Yang, J.P.; Liao, Y.D.; Mai, D.M.; Xie, P.; Qiang, Y.Y.; Zheng, L.S.; Wang, M.Y.; Mei, Y.; Meng, D.F.; Xu, L.; Cao, L.; Yang, Q.; Yang, X.X.; Wang, W.B.; Peng, L.X.; Huang, B.J.; Qian, C.N. Tumor vasculogenic mimicry predicts poor prognosis in cancer patients: a meta-analysis. Angiogenesis 2016, 19, 191–200. [Google Scholar] [CrossRef]
- Maniotis, A.J.; Folberg, R.; Hess, A.; Seftor, E.A.; Gardner, L.M.; Pe'er, J.; Trent, J.M.; Meltzer, P.S.; Hendrix, M.J. Vascular channel formation by human melanoma cells in vivo and in vitro: vasculogenic mimicry. Am J Pathol 1999, 155, 739–752. [Google Scholar] [CrossRef]
- Ferris, E.J.; Gabriele, O.F.; Hipona, F.A.; Shapiro, J.H. Early venous filling in cranial angiography. Radiology 1968, 90, 553–557. [Google Scholar] [CrossRef]
- El Hallani, S.; Boisselier, B.; Peglion, F.; Rousseau, A.; Colin, C.; Idbaih, A.; Marie, Y.; Mokhtari, K.; Thomas, J.L.; Eichmann, A.; Delattre, J.Y.; Maniotis, A.J.; Sanson, M. A new alternative mechanism in glioblastoma vascularization: tubular vasculogenic mimicry. Brain 2010, 133, 973–982. [Google Scholar] [CrossRef]
- Zhang, H.; Huang, Z.; Zou, X.; Liu, T. Bevacizumab and wound-healing complications: a systematic review and meta-analysis of randomized controlled trials. Oncotarget 2016, 7, 82473–82481. [Google Scholar] [CrossRef]
- Balana, C.; De Las Penas, R.; Sepúlveda, J.M.; Gil-Gil, M.J.; Luque, R.; Gallego, O.; Carrato, C.; Sanz, C.; Reynes, G.; Herrero, A.; Ramirez, J.L.; Pérez-Segura, P.; Berrocal, A.; Vieitez, J.M.; Garcia, A.; Vazquez-Estevez, S.; Peralta, S.; Fernandez, I.; Henriquez, I.; Martinez-Garcia, M.; De la Cruz, J.J.; Capellades, J.; Giner, P.; Villà, S. Bevacizumab and temozolomide versus temozolomide alone as neoadjuvant treatment in unresected glioblastoma: the GENOM 009 randomized phase II trial. J Neurooncol 2016, 127, 569–579. [Google Scholar] [CrossRef]
- Gilbert, M.R.; Dignam, J.J.; Armstrong, T.S.; Wefel, J.S.; Blumenthal, D.T.; Vogelbaum, M.A.; Colman, H.; Chakravarti, A.; Pugh, S.; Won, M.; Jeraj, R.; Brown, P.D.; Jaeckle, K.A.; Schiff, D.; Stieber, V.W.; Brachman, D.G.; Werner-Wasik, M.; Tremont-Lukats, I.W.; Sulman, E.P.; Aldape, K.D.; Curran, W.J.; Mehta, M.P. A randomized trial of bevacizumab for newly diagnosed glioblastoma. N Engl J Med 2014, 370, 699–708. [Google Scholar] [CrossRef]
- Chinot, O.L.; Wick, W.; Mason, W.; Henriksson, R.; Saran, F.; Nishikawa, R.; Carpentier, A.F.; Hoang-Xuan, K.; Kavan, P.; Cernea, D.; Brandes, A.A.; Hilton, M.; Abrey, L.; Cloughesy, T. Bevacizumab plus radiotherapy-temozolomide for newly diagnosed glioblastoma. N Engl J Med 2014, 370, 709–722. [Google Scholar] [CrossRef] [PubMed]
- Mariani, L.; Schroth, G.; Wielepp, J.P.; Haldemann, A.; Seiler, R.W. Intratumoral arteriovenous shunting in malignant gliomas. Neurosurgery 2001, 48, 353–7; discussion 357-8. [Google Scholar] [CrossRef] [PubMed]
- Ho, R.L.Y.; Ho, I.A.W. Recent Advances in Glioma Therapy: Combining Vascular Normalization and Immune Checkpoint Blockade. Cancers (Basel) 2021, 13, 3686. [Google Scholar] [CrossRef] [PubMed]
- Yoshikawa, A.; Nakada, M.; Kita, D.; Watanabe, T.; Kinoshita, M.; Miyashita, K.; Furuta, T.; Hamada, J.I.; Uchiyama, N.; Hayashi, Y. Visualization of angiographical arteriovenous shunting in perisylvian glioblastomas. Acta Neurochir (Wien) 2013, 155, 715–719. [Google Scholar] [CrossRef]
- Nabavizadeh, S.A.; Akbari, H.; Ware, J.B.; Nasrallah, M.; Guiry, S.; Bagley, S.J.; Desai, A.; Levy, S.; Sarchiapone, W.; Prior, T.; Detre, J.; Wolf, R.L.; O'Rourke, D.M.; Brem, S.; Davatzikos, C. Arterial Spin Labeling and Dynamic Susceptibility Contrast-enhanced MR Imaging for evaluation of arteriovenous shunting and tumor hypoxia in glioblastoma. Sci Rep 2019, 9, 8747. [Google Scholar] [CrossRef]
- Sahara, N.; Hartanto, R.; Yoshuantari, N.; Dananjoyo, K.; Widodo, I.; Malueka, R.G.; Dwianingsih, E.K. Diagnostic accuracy of immunohistochemistry in detecting MGMT methylation status in patients with glioma. Asian Pacific Journal of Cancer Prevention 2021, 22, 3803–3808. [Google Scholar] [CrossRef]
- Mei, X.; Chen, Y.S.; Zhang, Q.P.; Chen, F.R.; Xi, S.Y.; Long, Y.K.; Zhang, J.; Cai, H.P.; Ke, C.; Wang, J.; Chen, Z.P. Association between glioblastoma cell-derived vessels and poor prognosis of the patients. Cancer Commun (Lond) 2020, 40, 211–221. [Google Scholar] [CrossRef]
- Li, J.; Wang, M.; Won, M.; Shaw, E.G.; Coughlin, C.; Curran, W.J.; Mehta, M.P. Validation and simplification of the Radiation Therapy Oncology Group recursive partitioning analysis classification for glioblastoma. Int J Radiat Oncol Biol Phys 2011, 81, 623–630. [Google Scholar] [CrossRef]
- Hegi, M.E.; Diserens, A.C.; Gorlia, T.; Hamou, M.F.; de Tribolet, N.; Weller, M.; Kros, J.M.; Hainfellner, J.A.; Mason, W.; Mariani, L.; Bromberg, J.E.; Hau, P.; Mirimanoff, R.O.; Cairncross, J.G.; Janzer, R.C.; Stupp, R. MGMT gene silencing and benefit from temozolomide in glioblastoma. N Engl J Med 2005, 352, 997–1003. [Google Scholar] [CrossRef]
- McGahan, B.G.; Neilsen, B.K.; Kelly, D.L.; McComb, R.D.; Kazmi, S.A.; White, M.L.; Zhang, Y.; Aizenberg, M.R. Assessment of vascularity in glioblastoma and its implications on patient outcomes. J Neurooncol 2017, 132, 35–44. [Google Scholar] [CrossRef]
- Baumann, C.; Tichy, J.; Schaefer, J.H.; Steinbach, J.P.; Mittelbronn, M.; Wagner, M.; Foerch, C. Delay in diagnosing patients with right-sided glioblastoma induced by hemispheric-specific clinical presentation. J Neurooncol 2020, 146, 63–69. [Google Scholar] [CrossRef]
- Fan, X.; Wang, Y.; Wang, K.; Liu, S.; Liu, Y.; Ma, J.; Li, S.; Jiang, T. Anatomical specificity of vascular endothelial growth factor expression in glioblastomas: a voxel-based mapping analysis. Neuroradiology 2016, 58, 69–75. [Google Scholar] [CrossRef] [PubMed]
- Zlatescu, M.C.; TehraniYazdi, A.; Sasaki, H.; Megyesi, J.F.; Betensky, R.A.; Louis, D.N.; Cairncross, J.G. Tumor location and growth pattern correlate with genetic signature in oligodendroglial neoplasms. Cancer Res 2001, 61, 6713–6715. [Google Scholar]
- Pries, A.R.; Höpfner, M.; le Noble, F.; Dewhirst, M.W.; Secomb, T.W. The shunt problem: control of functional shunting in normal and tumour vasculature. Nat Rev Cancer 2010, 10, 587–593. [Google Scholar] [CrossRef]
- Emami Nejad, A.; Najafgholian, S.; Rostami, A.; Sistani, A.; Shojaeifar, S.; Esparvarinha, M.; Nedaeinia, R.; Haghjooy Javanmard, S.; Taherian, M.; Ahmadlou, M.; Salehi, R.; Sadeghi, B.; Manian, M. The role of hypoxia in the tumor microenvironment and development of cancer stem cell: a novel approach to developing treatment. Cancer Cell Int 2021, 21, 62. [Google Scholar] [CrossRef] [PubMed]
- Ohta, H.; Nakano, S.; Yokogami, K.; Iseda, T.; Yoneyama, T.; Wakisaka, S. Appearance of early venous filling during intra-arterial reperfusion therapy for acute middle cerebral artery occlusion: a predictive sign for hemorrhagic complications. Stroke 2004, 35, 893–898. [Google Scholar] [CrossRef] [PubMed]
- Treps, L.; Faure, S.; Clere, N. Vasculogenic mimicry, a complex and devious process favoring tumorigenesis - Interest in making it a therapeutic target. Pharmacol Ther 2021, 223, 107805. [Google Scholar] [CrossRef]


| Patient characteristics | |||||
|---|---|---|---|---|---|
| All glioblastoma (n=91) | Non-Early venous filling (n=44) | Early venous filling (n=47) | P | ||
| Age in years, median, IQR | 64 [52–71] | 59 [45–71.8] | 66 [57–71] | 0.15 | |
| Men, n (%) | 61 (67.0) | 28 (63.6) | 33 (70.2) | 0.5 | |
| Lesion of tumor | |||||
| Right, n (%) | 42 (46.2) | 13 (29.6) | 29 (61.7) | 0.007 | |
| Left, n (%) | 41 (45.1) | 25 (56.8) | 16 (34.0) | ||
| Middle, n (%) | 8 (0.9) | 6 (13.6) | 2 (4.3) | ||
| Neopallium, n (%) | 81 (90.0) | 37 (86.1) | 44 (93.6) | 0.23 | |
| Non-neopallium, n (%) | 9 (10) | 6 (13.9) | 3 (4.4) | ||
| Baseline neurological findings | |||||
| Modified Rankin Scale, median, IQR | 2 [1–4] | 2 [1–4] | 3 [2–4] | 0.54 | |
| Karnofsky Performance Status, median, IQR | 70 [50–80] | 70 [52.5–90] | 70 [50–80] | 0.39 | |
| MRI findings | |||||
| Tumor size enhanced lesion, mm median, IQR | 4.9 [3.9–5.8] | 4.9 [2.8–6] | 4.9 [4.1–5.7] | 0.47 | |
| Tumor size FLAIR high-intensity lesion, mm median, IQR | 7.7 [5.6–9.2] | 7.8 [5.3–9.3] | 7.5 [6.1–9.0] | 0.74 | |
| Angiographical findings | |||||
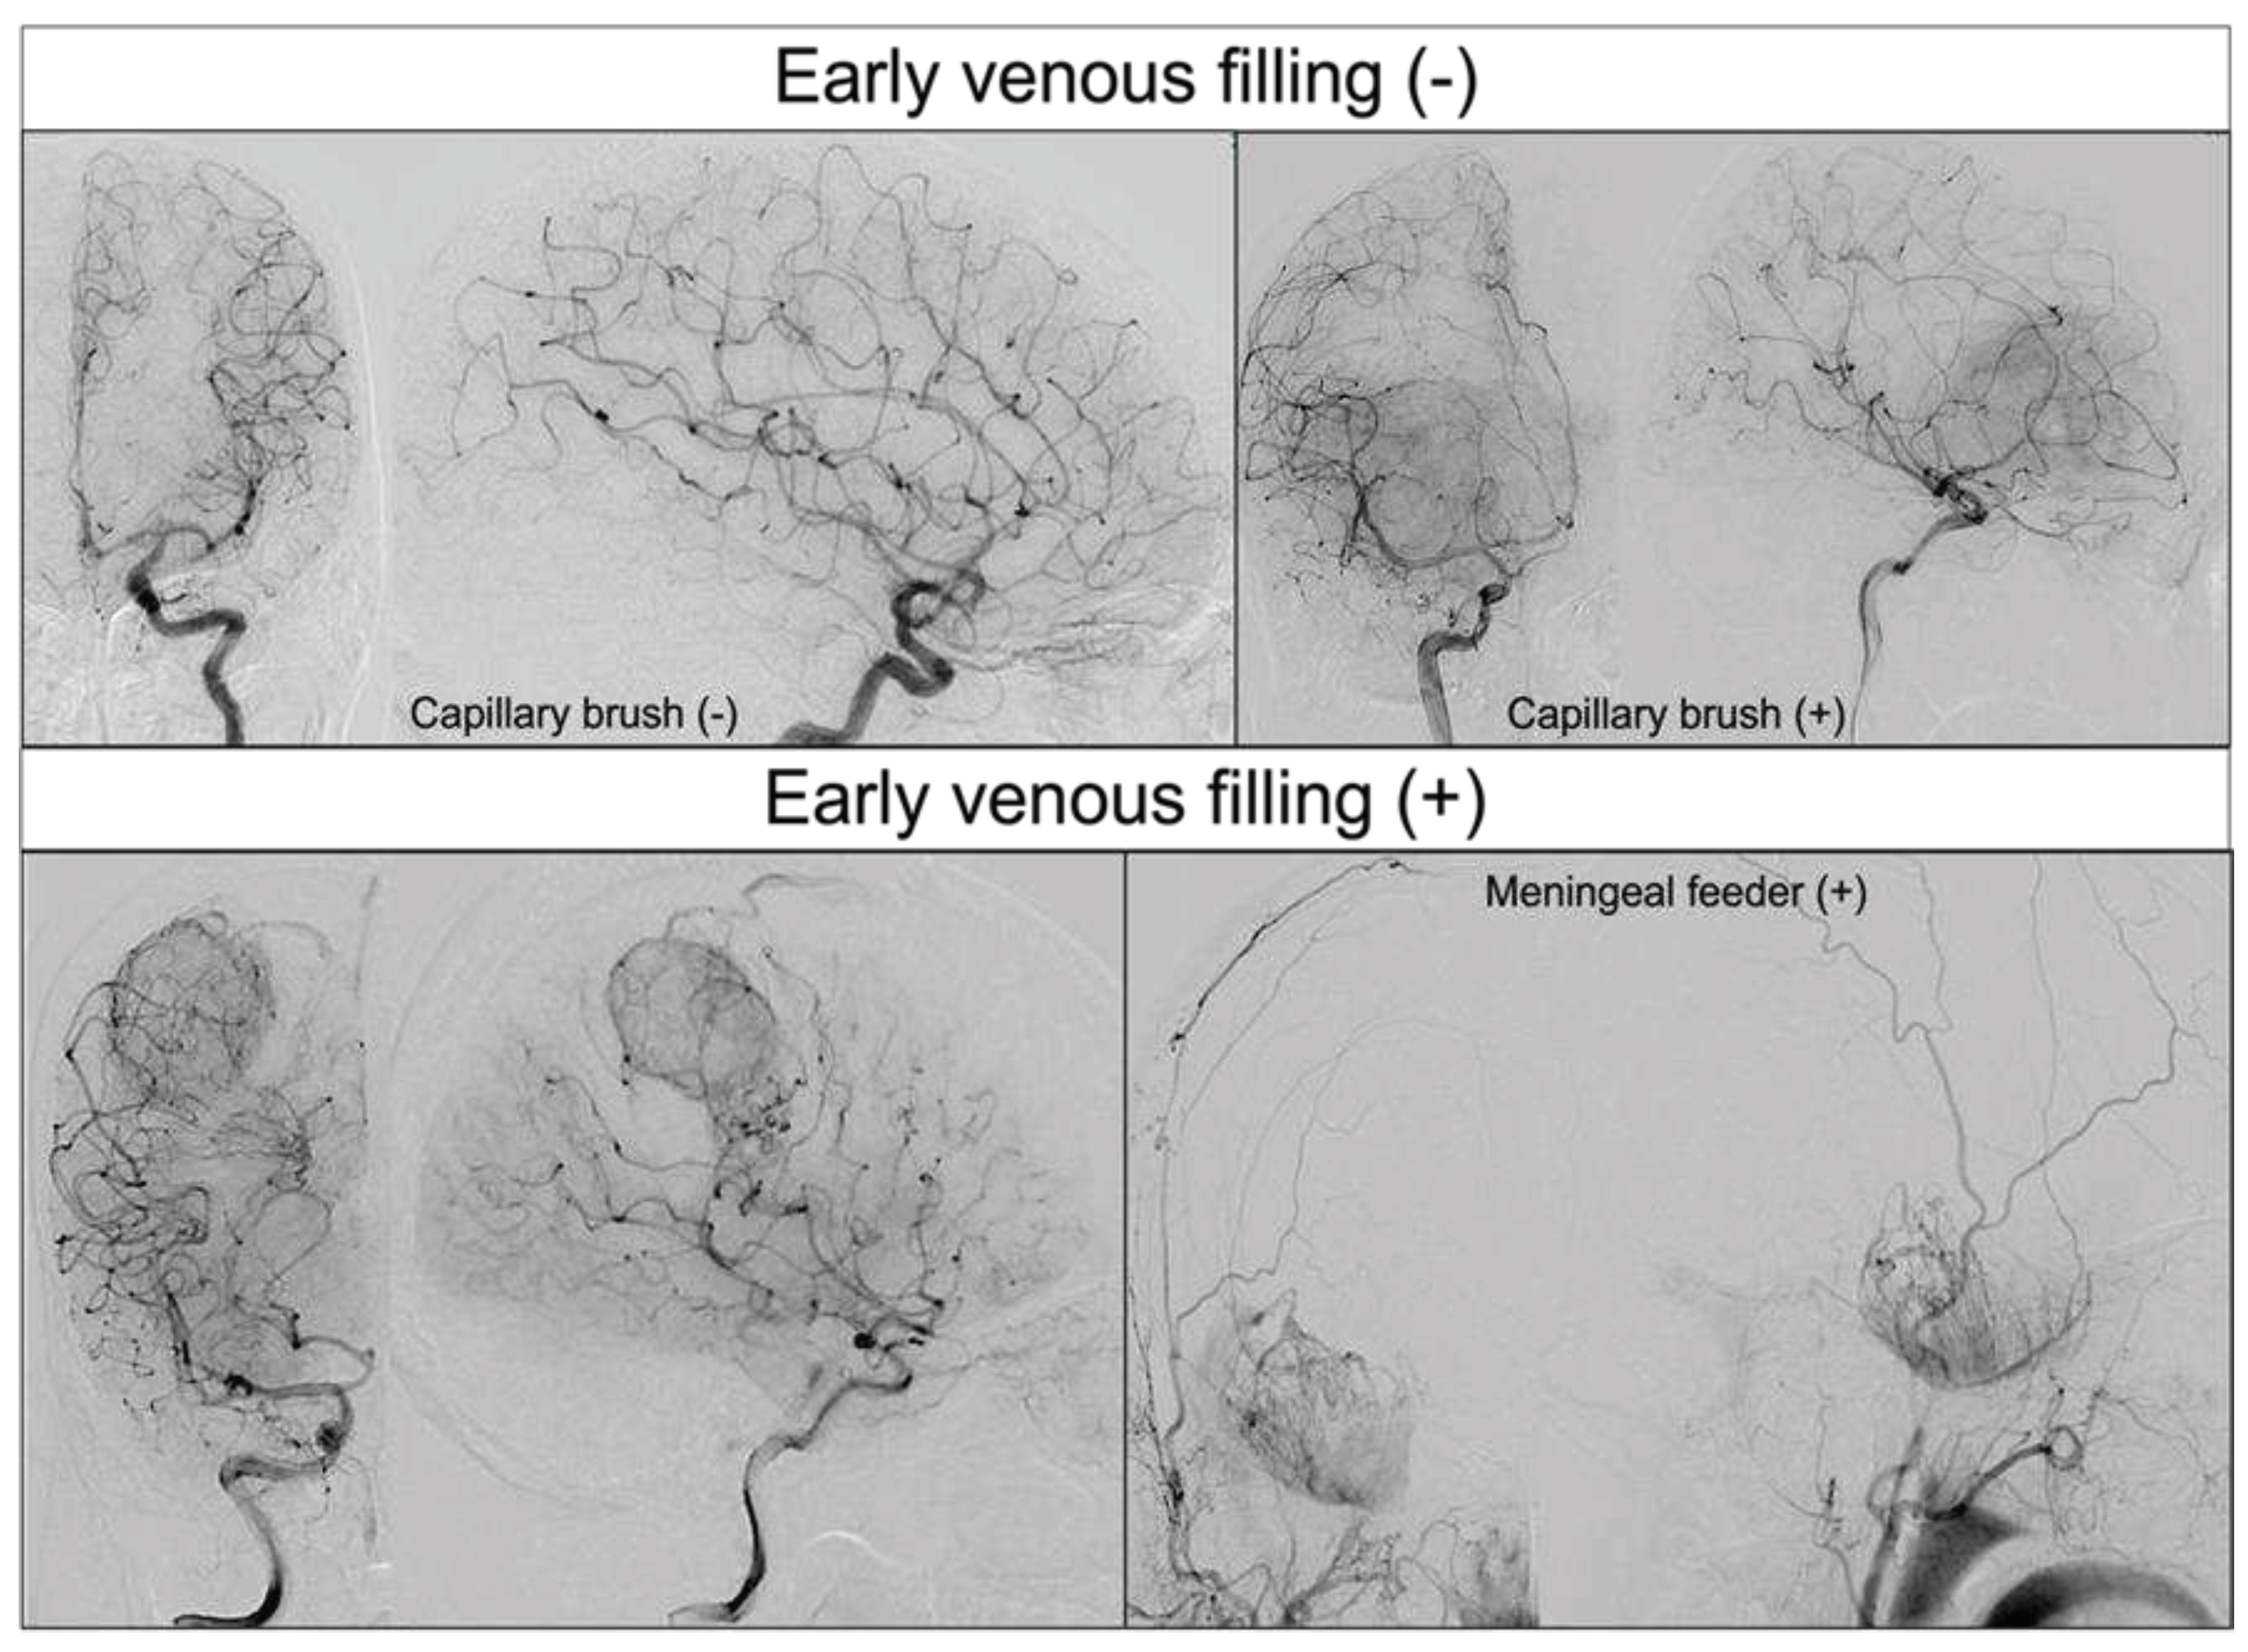
| Dural feeder, n (%) | 8 (8.9) | 0 (0) | 8 (17.4) | 0.006 | |
| The degree of removal | |||||
| Biopsy, n (%) | 10 (11.0) | 7 (15.9) | 3 (6.4) | 0.19 | |
| Maximum safe removal, n (%) | 81 (89.0) | 37 (84.1) | 44 (93.6) | ||
| Maximum safe removal | Partial removal, n (%) | 20 (22.0) | 10 (22.7) | 10 (21.3) | 0.65 |
| Total (>90%) removal, n (%) | 61 (67.0) | 27 (61.4) | 34 (72.3) | ||
| Adjuvant therapy | |||||
| Non-adjuvant therapy, n (%) | 2 (2.2) | 2 (4.6) | 0 (0) | 0.22 | |
| Chemotherapy and radiation therapy, n (%) | 87 (95.6) | 40 (90.9) | 47 (100) | ||
| Only radiation therapy, n (%) | 1 (1.1) | 1 (2.3) | 0 (0) | ||
| Others, n (%) | 1 (1.1) | 1 (2.3) | 0 (0) | ||
| Avastin, n (%) | 26 (28.6) | 13 (29.6) | 13 (27.7) | 1 | |
| Molecular features | |||||
| IDH mutation, n (%) | 3 (3.8) | 3 (8.1) | 0 (0) | 0.09 | |
| MGMT methylation, n (%) | 23 (32.4) | 13 (39.4) | 10 (26.3) | 0.24 | |
| MIB1 index, median, IQR | 0.3 [0.2–0.4] | 0.3 [0.2–0.4] | 0.3 [0.2–0.4] | 0.83 | |
| Follow-up | |||||
| Reoperation, n (%) | 17 (18.7) | 9 (17.0) | 8 (20.5) | 0.67 | |
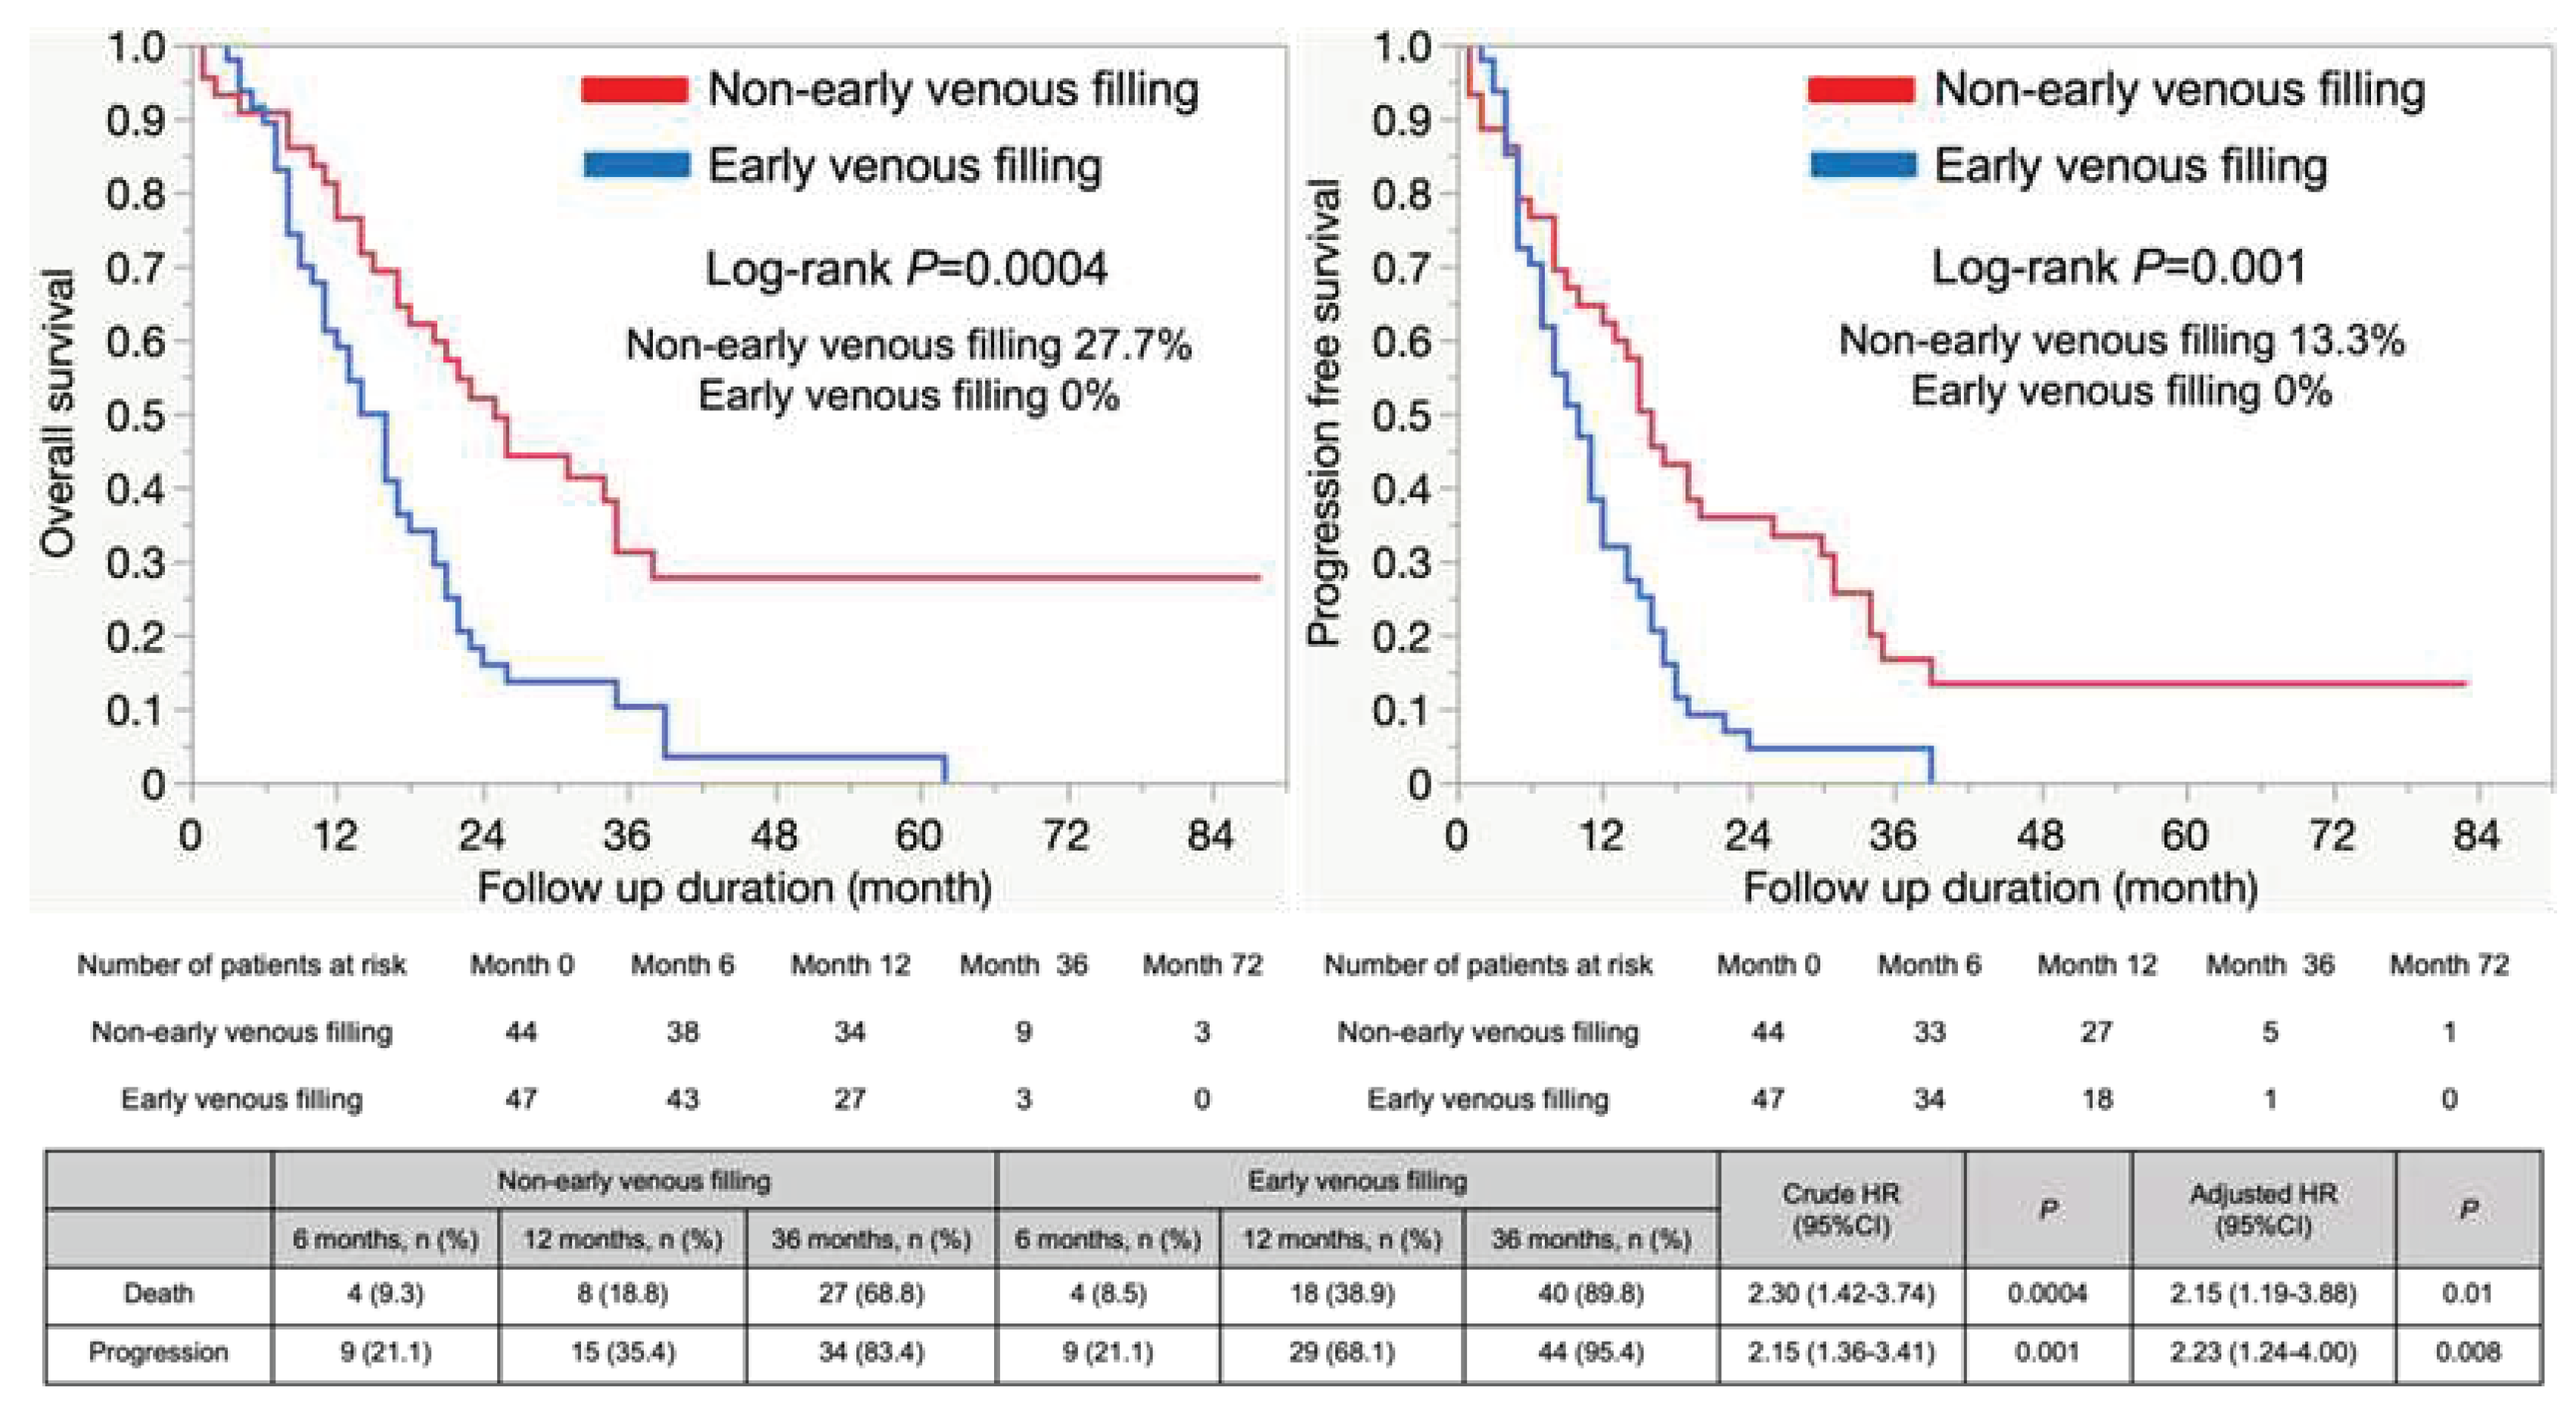
| Follow-up duration, months median, IQR | 17 [9–26] | 21.5 [12–34.8] | 14 [8–21] | 0.01 | |
| Crude HR (95% CI) | P | |
|---|---|---|
| Right, n (%) | 1.25 (0.77–2.04) | 0.37 |
| Total (>90%) removal, n (%) | 0.79 (0.49–1.29) | 0.35 |
| Reoperation, n (%) | 0.98 (0.53–1.78) | 0.94 |
Disclaimer/Publisher’s Note: The statements, opinions and data contained in all publications are solely those of the individual author(s) and contributor(s) and not of MDPI and/or the editor(s). MDPI and/or the editor(s) disclaim responsibility for any injury to people or property resulting from any ideas, methods, instructions or products referred to in the content. |
© 2023 by the authors. Licensee MDPI, Basel, Switzerland. This article is an open access article distributed under the terms and conditions of the Creative Commons Attribution (CC BY) license (http://creativecommons.org/licenses/by/4.0/).


