
Submitted:
29 June 2023
Posted:
03 July 2023
You are already at the latest version
Abstract
To improve the understanding of soil–pile interaction of laterally loaded piles, the quasi-static test of pile group foundation in silty clay with 5 foundation piles arranged in cross shape is carried out. The direct measurement-based p–y curves at different depths showed nonlinear behavior, in which the initial stiffness and ultimate soil reaction increased as the depth increased. The loading displacement amplitude corresponding to the failure of each foundation pile in the high axial compression reinforced concrete pile group foundation is given as follows: the front-end nappe foundation pile (#3 pile) is 6mm, the middle pile is 16mm, the front-end nappe foundation pile is 20mm, and the loading displacement amplitude of side pile is 24mm. In silty clay, due to the existence of pile group effect, the edge effect has little effect on the horizontal foundation bed coefficient of foundation pile in pile group, while the influence of masking effect on the horizontal foundation bed coefficient of each foundation pile in pile group is not related to the position of pile, but only to the existence of masking effect, and the influence of different columns of masking effect on the horizontal foundation bed coefficient is the same.
Keywords:
RC pile group
; high axial compression ratio
; soil-structure interaction (SSI)
; quasi-static test
; p–y curves
; silty clay
1. Introduction
Reinforced concrete (RC) pile groups are widely used in civil engineering due to their high strength, fine durability, good seismic performance, economy, and wide application sites. Structures like skyscrapers, bridges, transmission towers, nuclear power plants, offshore platforms, wind turbine towers, and other critical infrastructures are supported on RC pile groups to adapt to lateral loads imposed by serious earthquakes, strong wind, heavy traffic, and so on [1, 2]. Actually, in many cases, the design of RC pile groups is mainly governed by lateral loads [3]. Therefore, it is critically important to accurately calculate the lateral load bearing capacity of RC pile groups [4]. Lateral responses of a pile group are commonly determined by using the beam on Winkler foundation (BWF) method with consideration of group effect, where the pile is modelled as a beam supported by nonlinear Winkler-springs positioned along its length. The soil resistance is simulated as pre-defined nonlinear springs using p-y curves which relate soil resistance, p, and horizontal pile deflection, y[5-9]; The most critical problem of seismic performance of reinforced concrete pile group foundation is analyzed. Because reinforced concrete pile group foundation is a pile-soil composite resistance system, The pile-soil interaction is calculated. Only when the pile-soil interaction is clear can the calculation model be established for analysis. The most common method used to understand the soil–structure interaction (SSI) of laterally loaded piles is the beam on nonlinear elastic foundation method because it combines simplicity with the ability to incorporate the nonlinear soil–pile interaction force displacement relationship (or p–y curve) into the analysis. The p–y curve models the relationship between the soil–pile interaction force per unit length (or soil reaction, p) and the lateral displacement of the pile (y) as a compression-only, nonlinear spring. p–y curves have been extensively studied and several procedures have been developed to calculate the curves. Recognizing the limitations and inaccuracy of the p–y curves developed using the procedures described above for laterally loaded piles, many researchers have tried to simultaneously and directly measure the soil–pile interaction pressure (p) and the lateral displacement along the pile length (y), but were unsuccessful. Therefore the most effective method is developing p–y curves based on simultaneous direct measurements of the soil–pile interaction pressure (p) and lateral pile displacement (y) along the length of the pile using advanced sensors[10].
The test methods of pile-soil interaction in pile group foundation mainly include pseudo-static test, centrifuge shaking table test and shaking table test. Compared with the other two test methods, the pseudo-static test can record the whole process of pile group foundation from elastic stage to failure, and the load is simplified, clear and easy to implement. It can reflect the cumulative damage characteristics of reinforced concrete and soil under the reciprocating load. Moreover, by controlling the loading process, stable and reliable test data of soil pressure around the pile and pile deflection can be obtained. Therefore, it is widely used in the study of pile-soil interaction.
Some scholars have carried out the quasi-static experimental study on the seismic behavior of reinforced concrete pile group foundation. Under vertical load, axial compression ratio is an important factor affecting the working behavior of pile foundation, which can reflect the relationship between the initial stress state of reinforced concrete pile group foundation and the mechanical properties of pile materials under horizontal and vertical load coupling. Different from common structural forms, nuclear island structures are generally made of high-strength and high-performance concrete with thick walls and unique characteristics such as "large mass and stiffness". In addition, since the upper part of the nuclear island structure has concentrated load distribution, the foundation pile will undoubtedly be in the working state of high axial compression ratio. However, according to the literature survey, it can be found that due to the relatively high cost of pseudo-static test of pile group foundation and the complicated process of making test model, in order to reflect the failure evolution process of pile group, gradual slow loading is required in the test, which is difficult to operate, and the test of pile group foundation must be redesigned and made under different coaxial-pressure ratios. Therefore, pseudo-static experimental studies of pile group foundation considering the coupling effect of vertical load and horizontal load are scarce at home and abroad. In particular, the axial compression ratio used in current tests is all small, less than 0.15, or even less than 0.1 in most tests[11-16].
Through the literature survey, it is found that the existing test soil used in the study of pile-soil interaction is sandy soil, and basically no clay is used, or even if clay is used, it is completely saturated clay, and there is almost no test in clay. However, in practical projects, especially in North China, the groundwater level of most sites is very deep, and the pile group foundation is located in soil, so it is very important to study the pile-soil interaction of pile group foundation in soil.
In this paper, the mechanical analysis of the bad characteristics of reinforced concrete pile group foundation with high axial compression ratio under seismic load and the measured p-y curve of soil around the pile are given based on the "Multi-module high temperature nuclear island plant pile Test" funded by the national science and technology major special project. For the purpose above, a quasi-static test was carried out on a pile group foundation in silty clay with 5 foundation piles arranged in a cross shape. In order to simulate superstructures with large mass and stiffness such as nuclear island containment, steel plate counterweight blocks were used to increase vertical loads, and the initial axial compression ratio of each foundation pile was 0.45.
This paper summarizes the methodology, instrumentation, soil–pile interaction measurements, and the procedure used to investigate the soil–pile interaction and to develop directly measured p–y curves using advanced sensors. The paper presents: (i) The target displacement which can be used for elastic-plastic analysis of reinforced concrete pile group foundation is given by the sudden change of the principal compressive strain and curvature of the pile body after the transformation of the pile system under the horizontal reciprocating load.; (ii) the measured displacement along the length of the pile; (iii) the magnitude and distribution of the soil–pile interaction pressures and the corresponding force per unit length obtained from the directly measured interaction pressures along the pile length; and (iv) the soil–pile interaction force – displacement relationships (i.e., p–y curves) developed using the directly = measured pressures and displacements. In addition, Combined with the simplified model of pile group effect, the horizontal foundation bed coefficient of soil around pile is calculated and analyzed.
2. Materials and Methods
Generally, the similarity relationship should be considered in the model test, so that the mechanical process occurring in the prototype can be reproduced on the model after scaling under the condition of physical similarity, and the mechanical parameters in the model can be recorded and analyzed, and converted into the prototype according to the similarity relationship, so as to achieve the purpose of studying the prototype mechanical process. When using model test method to study soil-junction interaction problem, because the physical and mechanical properties of structure and soil are very different, and the undisturbed soil is a discrete body with strong structure, it is difficult to give a unified similarity relationship between structure and soil, especially for the reinforced concrete pile group foundation buried in the soil, it is more difficult to fully satisfy the similarity theorem. Therefore, this test does not fully consider the problem of similarity relationship, but focuses on the unique force characteristics of the nuclear island structure, such as "large mass, large stiffness" and concentrated upper load distribution, and qualitatively studies the seismic performance and failure mechanism of reinforced concrete pile group foundation with high axial compression ratio of nuclear island structure in non-bedrock sites.
2.1. Pile properties
Figure 3c shows the reinforcing configuration of individual piles. The longitudinal steel ratio was 0.0256, provided by four Ф8 rebars, with 20mm concrete cover. The pile was confined by Ф4transverse hooped bars at vertical intervals of 10 cm in the region beneath the cap. Additionally, to ensure rigid pile-cap connections, the rebars were extended into the RC cap with sufficient lengths (50 cm for all piles) .The uniaxial compressive strength of concrete was fc =7.2 MPa. According to tension tests of the longitudinal rebars, a well-defined yield stress of fy=300.00 MPa was obtained, together with an elastic modulus of 200 GPa. By contrast, the transverse bar did not have a well-defined yield stress. The sectional deformation of the specimen becomes negligible during the test. The nominal yield stress corresponding to 0.2% strain was fy=250 MPa.In addition, consideration is also given to the pile aspect ratio (embedded length over diameter, L/D) and pile relative stiffness (KR).
where Ep is Young’s modulus of the pile, Ip is the moment of inertia of the pile, Es is the elastic modulus of the soil, and L is the embedded pile length.
Because young's modulus in soil is deformation modulus and deformation modulus is also measured under constant confining pressure, pseudo static test pile is flexible pile. the model pile corresponds to a flexible pile with KR = 0.0020 ~ 0.0026 .The above formula is used to judge that the test model pile belongs to semi-rigid pile.As for the semi-rigid pile, the deformation and bending point of the pile was found to be 1.35m below the pile bottom through deformation analysis. Therefore, in this test, the pile bottom at 1.35 was fixed and rotated around the deformation and bending point. As for the semi-rigid pile, the pile body deflection curve analysis below found that the pile deformation inverse bending point is 1.35m below the pile bottom, so in this test, the pile bottom 1.35 was fixed to rotate and deform around the deformation rotation center point.
2.2. Tested soil and preparation
This test employed the clay common in Hebei province of China, to act as the foundation soil layer. The main physical and mechanical parameters of the tested clay are summarized in Table 1. By mass controlling, the soil was poured into the container layer by layer.
Using the data in Table 1, the three-phase conversion of the test soil is obtained.
2.3. Data acquisition equipment and measuring point arrangement
In the experiment the “accuracy of deformation” is more important. The SAAF is one of the most versatile types of ShapeArray that Measurand manufactures. SAAF measures ground and structural deformation, settlement, and subsidence. SAAF’s design—rigid stainless steel sensorized segments connected by flexible joints—is durable. SAAF may be installed near vertical to track the magnitude and direction of lateral deformation, or near horizontal to track vertical deformation. SAAF is available in 200 mm, 305 mm, and 500 mm segment-length configurations. SAAF can be manufactured to a maximum length of 150 m. All ShapeArrays are manufactured in an ISO 9001 certified facility. The ShapeAccelArray Field (SAAF) is a type of SAA that is most commonly used. All SAA types have rigid segments separated by flexible joints. Triaxial MEMS gravity sensors measure tilt in each individual segment. SAAFs produce data equivalent to inclinometer data. Each SAA is a fully-calibrated measuring instrument delivered on a reel, and installable in a very small ungrooved casing. As a result, installation is rapid and lower in cost, and much larger deformations can be monitored. [10]The pile was also instrumented with a SAAF200 to measure the lateral pile displacement along its length. To install the SAAF200 along the pile length, a square wooden dowel with cross-section dimensions of 19 mm × 19 mm was placed in the cylindrical PVC form used to cast the pile. After the concrete hardened, the wooden dowel was removed to create a groove along the pile length that the SAAF200 was inserted into as shown in Figure 2b and Figure 3a. SAAFs the segment length is either 200 mm, The sensor length is 1.8m, which can meet the measurement requirements of the model pile with the length of 1.35m.The typical accuracy of deformation value given for a 32 m long ShapeArray is 1.5 mm. Although the accuracy degrades for longer ShapeArrays, it does so in relation with the square root of the length of the ShapeArray rather than degrading linearly. For example, a 64 m SAA will have an accuracy of deformation of 2.1 mm, rather than 3.0mm.Therefore, it is estimated that the intensive reading of SAAF200 we adopted is between 0.477mm and 0.4725mm, which is relatively high and meets the needs of measurement.
CYY9 piezoresistive soil pressure sensor was used in this laboratory test. Due to its high sensitivity, ability to measure weak soil pressure increment, and small volume, it is approximately believed that the free field soil will not be affected. The range is 0-200kpa and the intensive reading is 0.3%.
2.4. Test setup and instrumentation
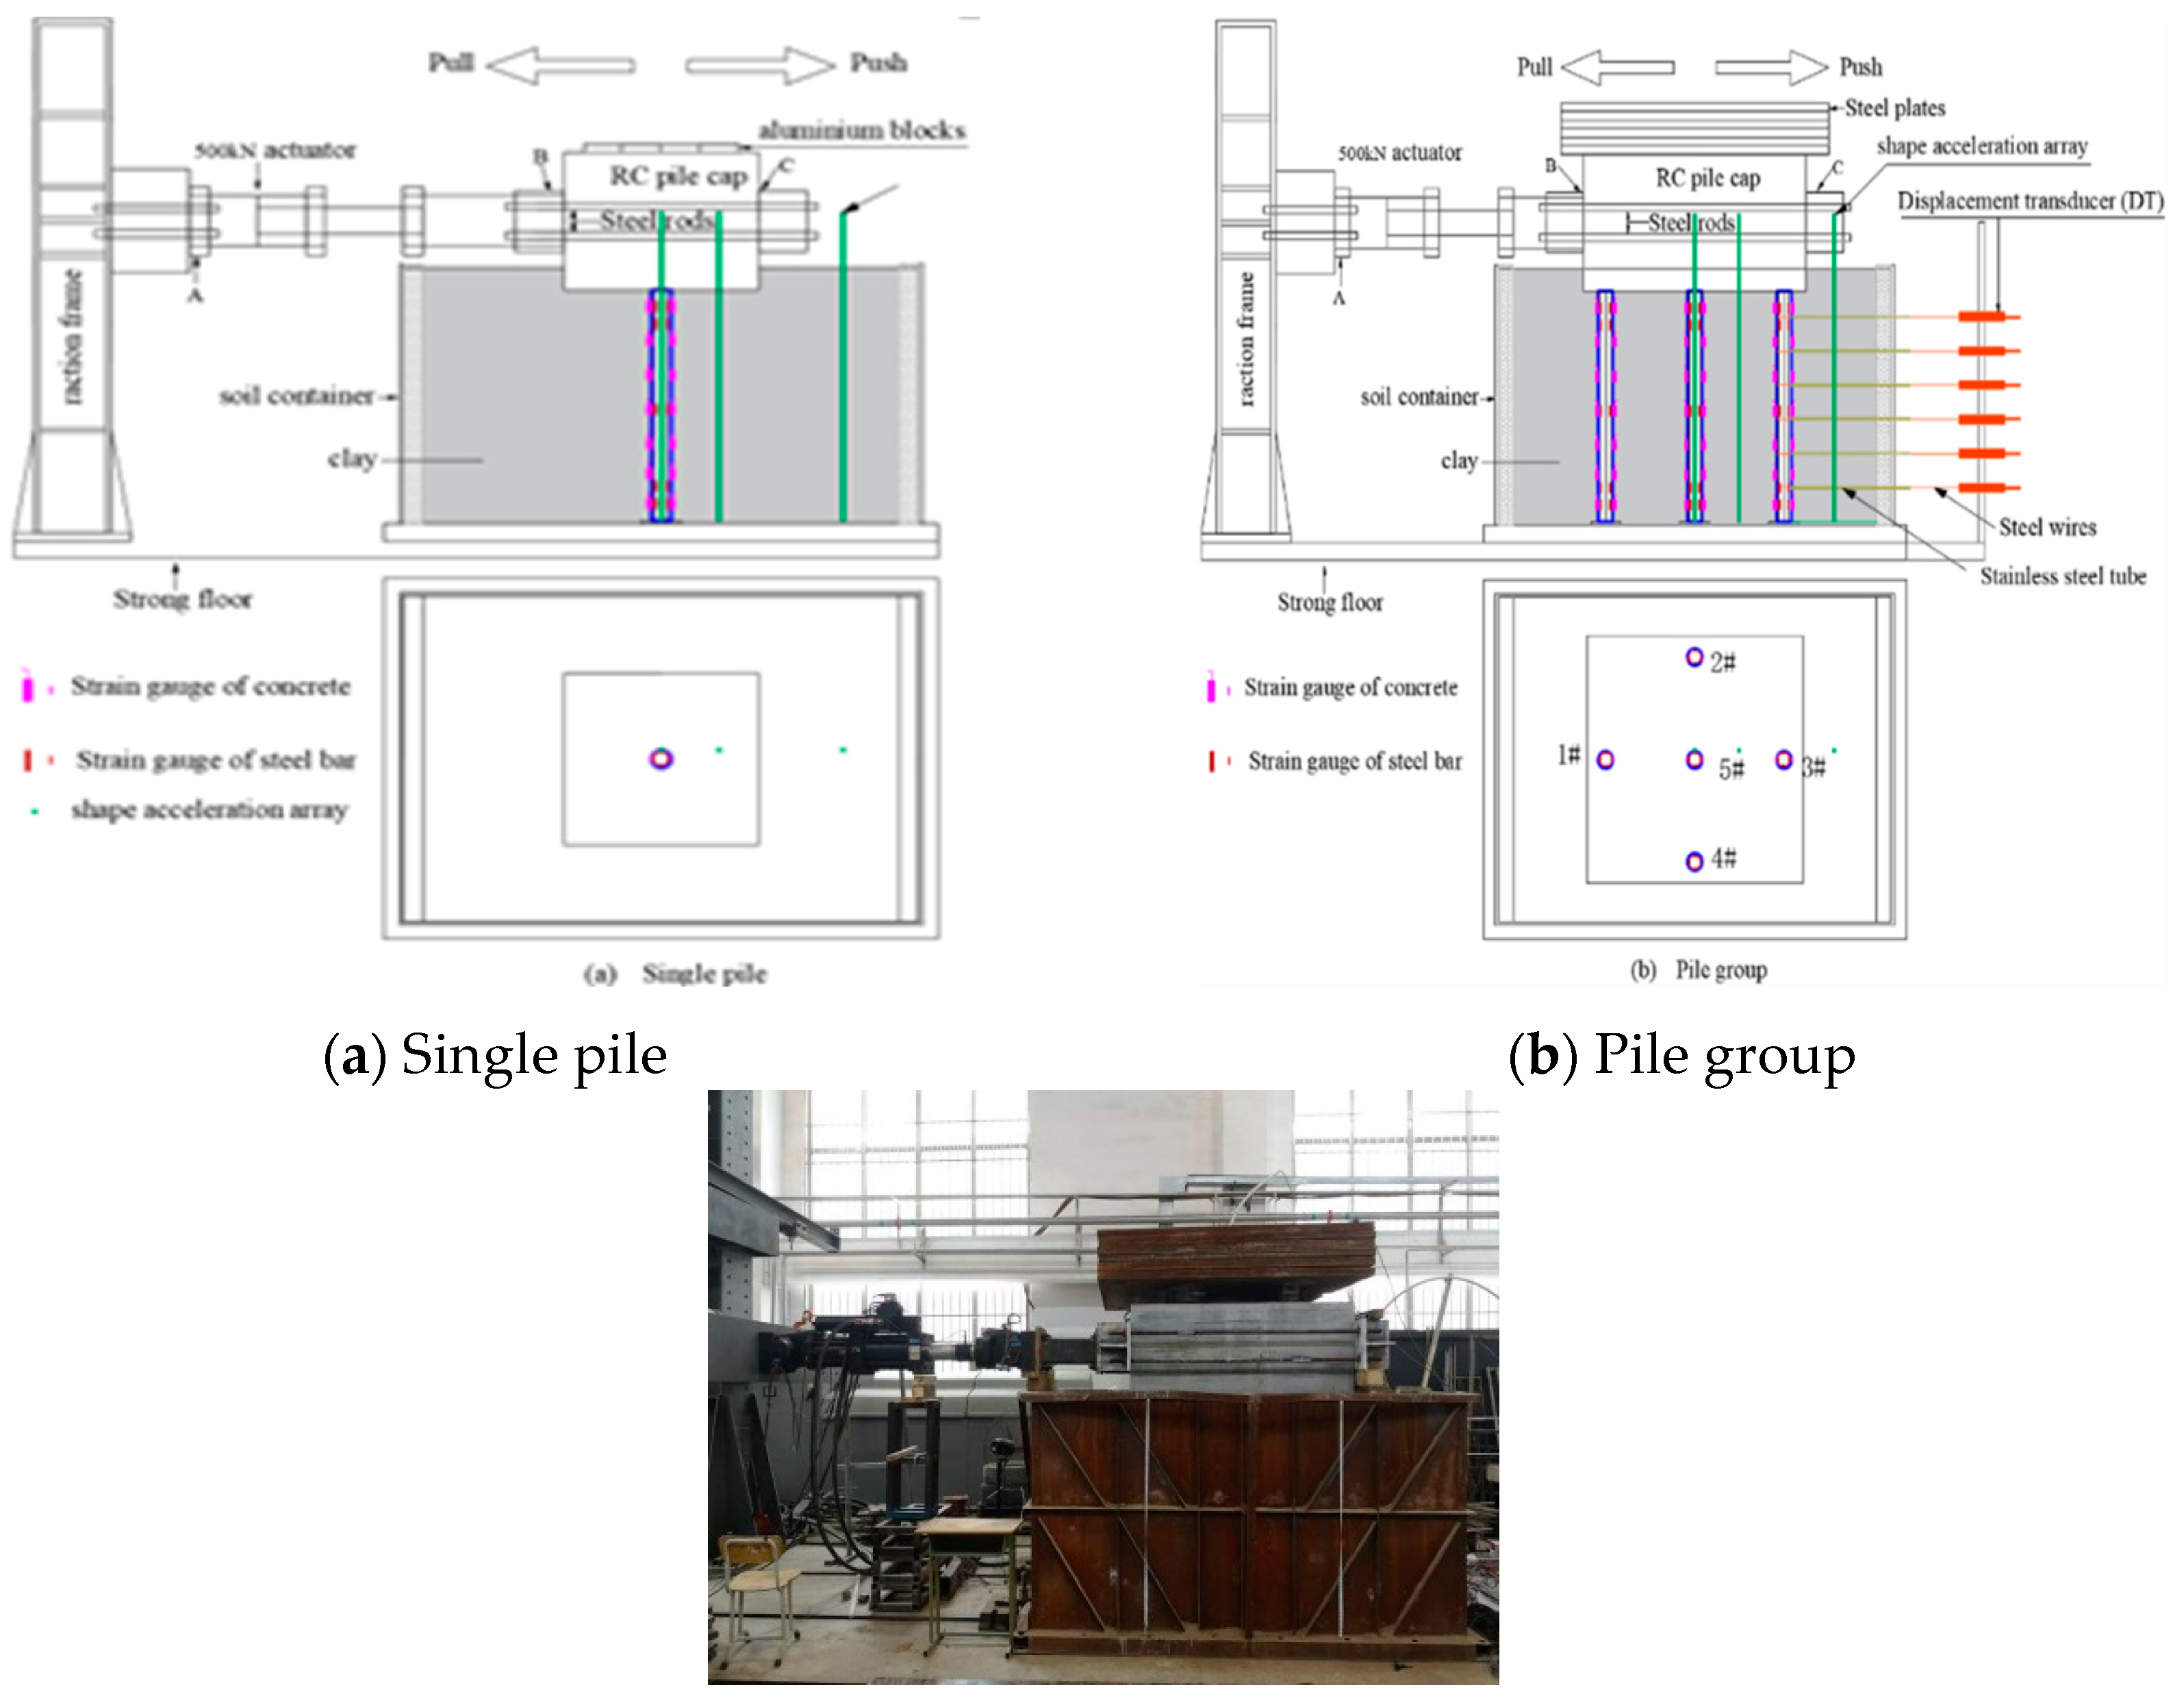
Figure 1.
Schematic diagram of lateral cyclic loading rig used for model test and the specimen instrumentation (unit: mm): (a) RC pile group specimen; (b) single pile specimen; (c) Schematic views of RC pile group test system.
Figure 1.
Schematic diagram of lateral cyclic loading rig used for model test and the specimen instrumentation (unit: mm): (a) RC pile group specimen; (b) single pile specimen; (c) Schematic views of RC pile group test system.
Considering the limitation of the laboratory space and the capacity of the soil container, the scaled pile group was prepared for the quasi-static test under 1g gravitational field. When introducing the scaling factors, it was difficult to perfectly satisfy the similitude laws in terms of both soil and piles, especially for RC piles in soil [17, 18] . Therefore, the piles were scaled down, while the soil was prepared to have reasonable relative densities and the soil strength index, in order to satisfy the similitude law. In the test, the geometric scale factor, the modulus of elasticity, and the density were 1/15, 1 and 1, respectively, and the scaling factors of other variables were the functions of them. The scaling factors were:
The scaling factors of density, modulus of elasticity, stress and strain all were 1; The scaling factors of pile flexural rigidity and moment of inertia were 1/50625; The scaling factor of area and concentrated load were 1/225; The geometrical scaling factor was 1/15; The scaling factor of bending moment was 1/3375.
Figure 1 shows the configuration and the measured positions of the RC pile group including size, reinforced plan, type of steel, and constraint condition, referring to code for design of concrete structures (GB50010-2010) and technical code for building pile foundations (JGJ 94-2008) in China. Also, Figure 1 shows the cyclic lateral loading device and the constant vertical load equipment. To minimize boundary effects, the model was put in the central area of the soil container. The pile group model consisted of five RC foundation piles at 6D (D=0.1 m is the pile diameter) spacing in a symmetrical orthogonal configuration. The piles numbered as 1 to 5 had the same length of 1.35 m and their heads were all embedded in the RC cap at the same height. The piles were constructed by drilling the shaft hole, placing reinforcement, and pouring concrete using the same standard and procedures. As for the symmetry of structural form and stressing state, we recorded the strain data of Pile 1, 2, 3 and 5 except for Pile 4. As shown in Figure 1(c), the design strength grade of concrete was C30. The longitudinal steel ratio was 2.56%, provided by four HRB335 8 rebar with 1cm concrete cover. The pile was confined by 4 galvanized iron wires transverse hooped bars at vertical intervals of 10cm extending over the full pile length.
2.5. Loading device and loading protocoling
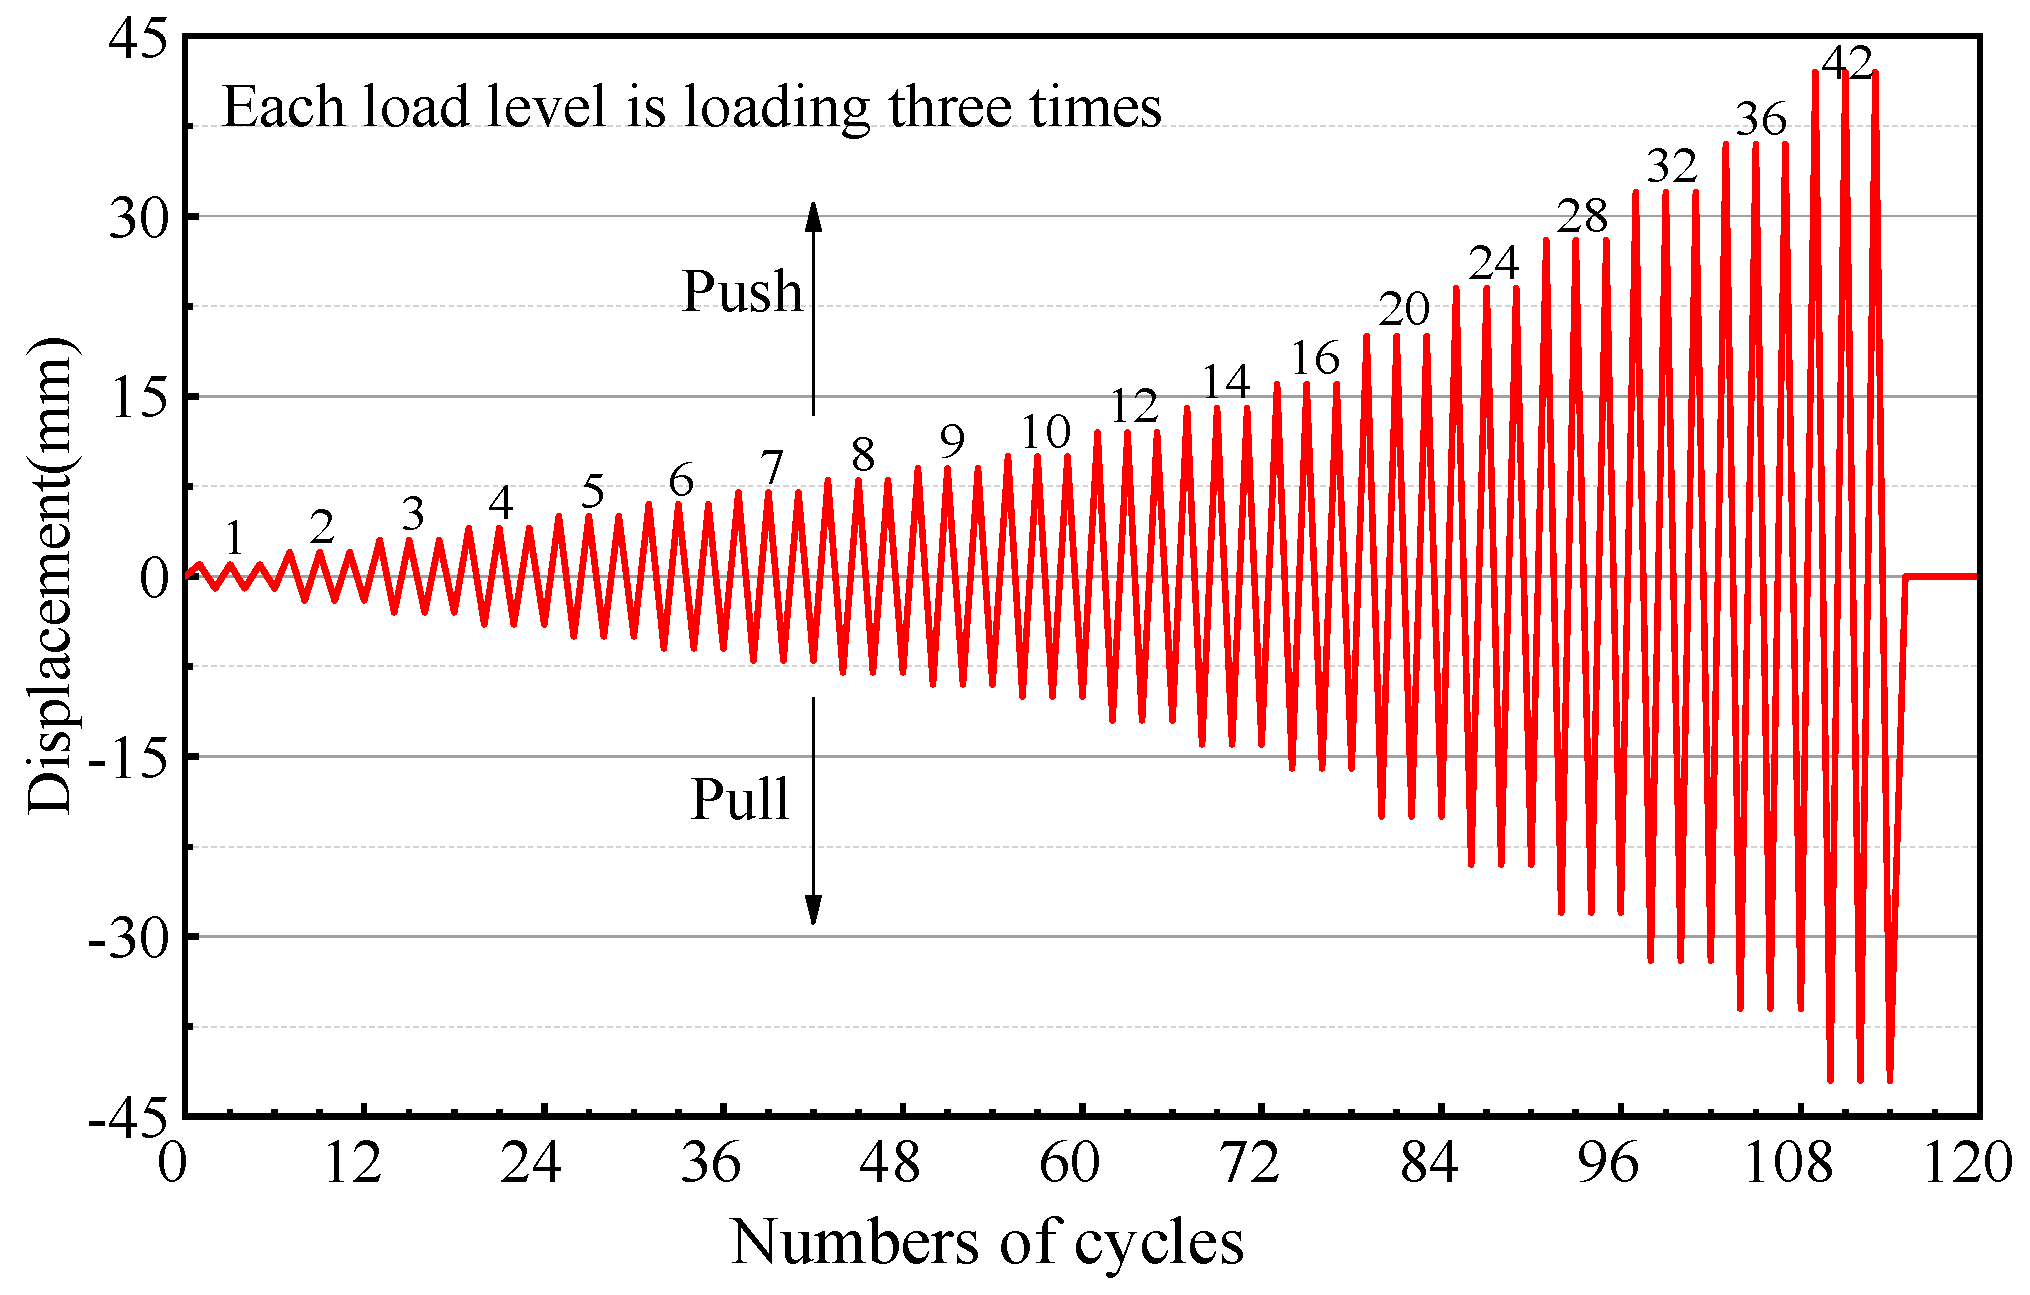
The ends of the foundation piles were fixed to the rigid block employing a square steel plate with sides of 20cm. Such supports prevented the displacement of the bottom section in three directions. The vertical load (7200kg) was applied by the clump weight on the top of the RC pile cap and remained constant throughout the test. The cyclic lateral loading was applied using the MTS actuator, which was the displacement-controlled loading. The cyclic increasing lateral loading was applied using a 254mm capacity lateral hydraulic actuator approximately at the mid-depth of the RC pile cap. The lateral load was applied in an incremental manner at a very slow loading speed so that the general failure process could be adequately achieved. As shown in Figure 3(a) and (b), the lateral loading started at 1 mm and gradually increased until the collapse of the RC pile group. During the loading processes, the strains on the piles’ concrete surface were recorded.
Currently, there are three commonly used experimental rules for quasi-static loading: displacement controlled loading, force controlled loading, and hybrid force-displacement controlled loading. Displacement controlled loading takes the displacement of the loading process as the control quantity and carries out cyclic loading according to a certain displacement increase. Sometimes the amplitude changes from small to large, sometimes the amplitude is constant, and sometimes the amplitude is mixed with the size.According to JGJ101-96, China's Code of Seismic Testing Methods for Buildings, loading should be controlled by load and loaded in stages before yielding, and loading should be reduced before cracking and yielding. Specimen deformation control deformation should be adopted after the yield value should take to yield the maximum displacement value of the specimen, and for the differential control in multiples of the displacement loading; The number of times of repeated load should be determined according to the purpose of the test. Before yielding, each grade of load can be repeated once, and after yielding, it should be repeated three times. The rules in the practical application of specific problems, one is how to determine the cracking load, in the process of experiment is still using artificial method check and step by step loading is also difficult to accurately get cracking load; Another problem is that there is no single standard for determining yield points. In the process of experiment, it is difficult to accurately determine the yield load and yield displacement of the specimen, which is still judged by human experience. Therefore, it is only an inaccurate concept to judge whether the specimen yield or not in the experiment. In addition, some specimens have no obvious yield point. For such specimens, displacement control should be considered to complete the experiment. The cracking process of pile group foundation on low cap cannot be observed by naked eye, so displacement control is the best way
Figure 1.
The diagram of the loading protocol for RC pile group and single pile.
3. Results
3.1. Hysteresis and skeleton curve
Comparison of the existing low axial compression ratio of reinforced concrete group of the hysteresis curve of the pile foundation of the peak point, can be found that low axial compression ratio of reinforced concrete pile foundation, in reinforced concrete pile foundation after the peak load, low axial compression ratio of group piles and reinforced concrete skeleton curve showed a marked decline of section, show that low axial compression ratio of reinforced concrete pile group foundation deformation increases, The reinforced concrete pile group foundation with high axial compression ratio reaches the limit state after passing through a platform under the peak load only with small peak load reduction. Comparison of the existing low axial compression ratio of reinforced concrete group of the hysteresis curve of the pile foundation of the peak point, can be found that low axial compression ratio of reinforced concrete pile foundation, in reinforced concrete pile foundation after the peak load, low axial compression ratio of group piles and reinforced concrete skeleton curve showed a marked decline of section, show that low axial compression ratio of reinforced concrete pile group foundation deformation increases, The reinforced concrete pile group foundation with high axial compression ratio reaches the limit state after passing through a platform under the peak load only with small peak load reduction.
In the elastic working stage, the hysteretic curve also shows that the reinforced concrete pile group foundation with high axial compression ratio has greater initial stiffness. In the elastic working stage, the hysteretic curve also shows that the reinforced concrete pile group foundation with high axial compression ratio has greater initial stiffness. By comparing the hysteretic curves of the above tests, it can be found that with the increase of axial compression ratio, the hysteretic ring presents a pinching phenomenon and the ductility decreases obviously. Due to the symmetry of reinforcement, even if the concrete in the compression zone has developed to the condition of damage, the strength of the component still does not show a downward trend, but also has a higher bearing capacity.
Figure 5 shows the measured backbone curves of top load-deflection and moment-deflection response of the single pile and pile group. The backbone curves were defined from peaks of the first deflection cycles at a given displacement level.
Figure 3.
(a) Based on Reduced Stiffness Equivalent Elasto-Plastic Yield and Based on Significant Load Capacity After Peak Load;(b)Comparison of backbone curves from cyclic test results between RC pile group specimen and single pile specimen.
Figure 3.
(a) Based on Reduced Stiffness Equivalent Elasto-Plastic Yield and Based on Significant Load Capacity After Peak Load;(b)Comparison of backbone curves from cyclic test results between RC pile group specimen and single pile specimen.
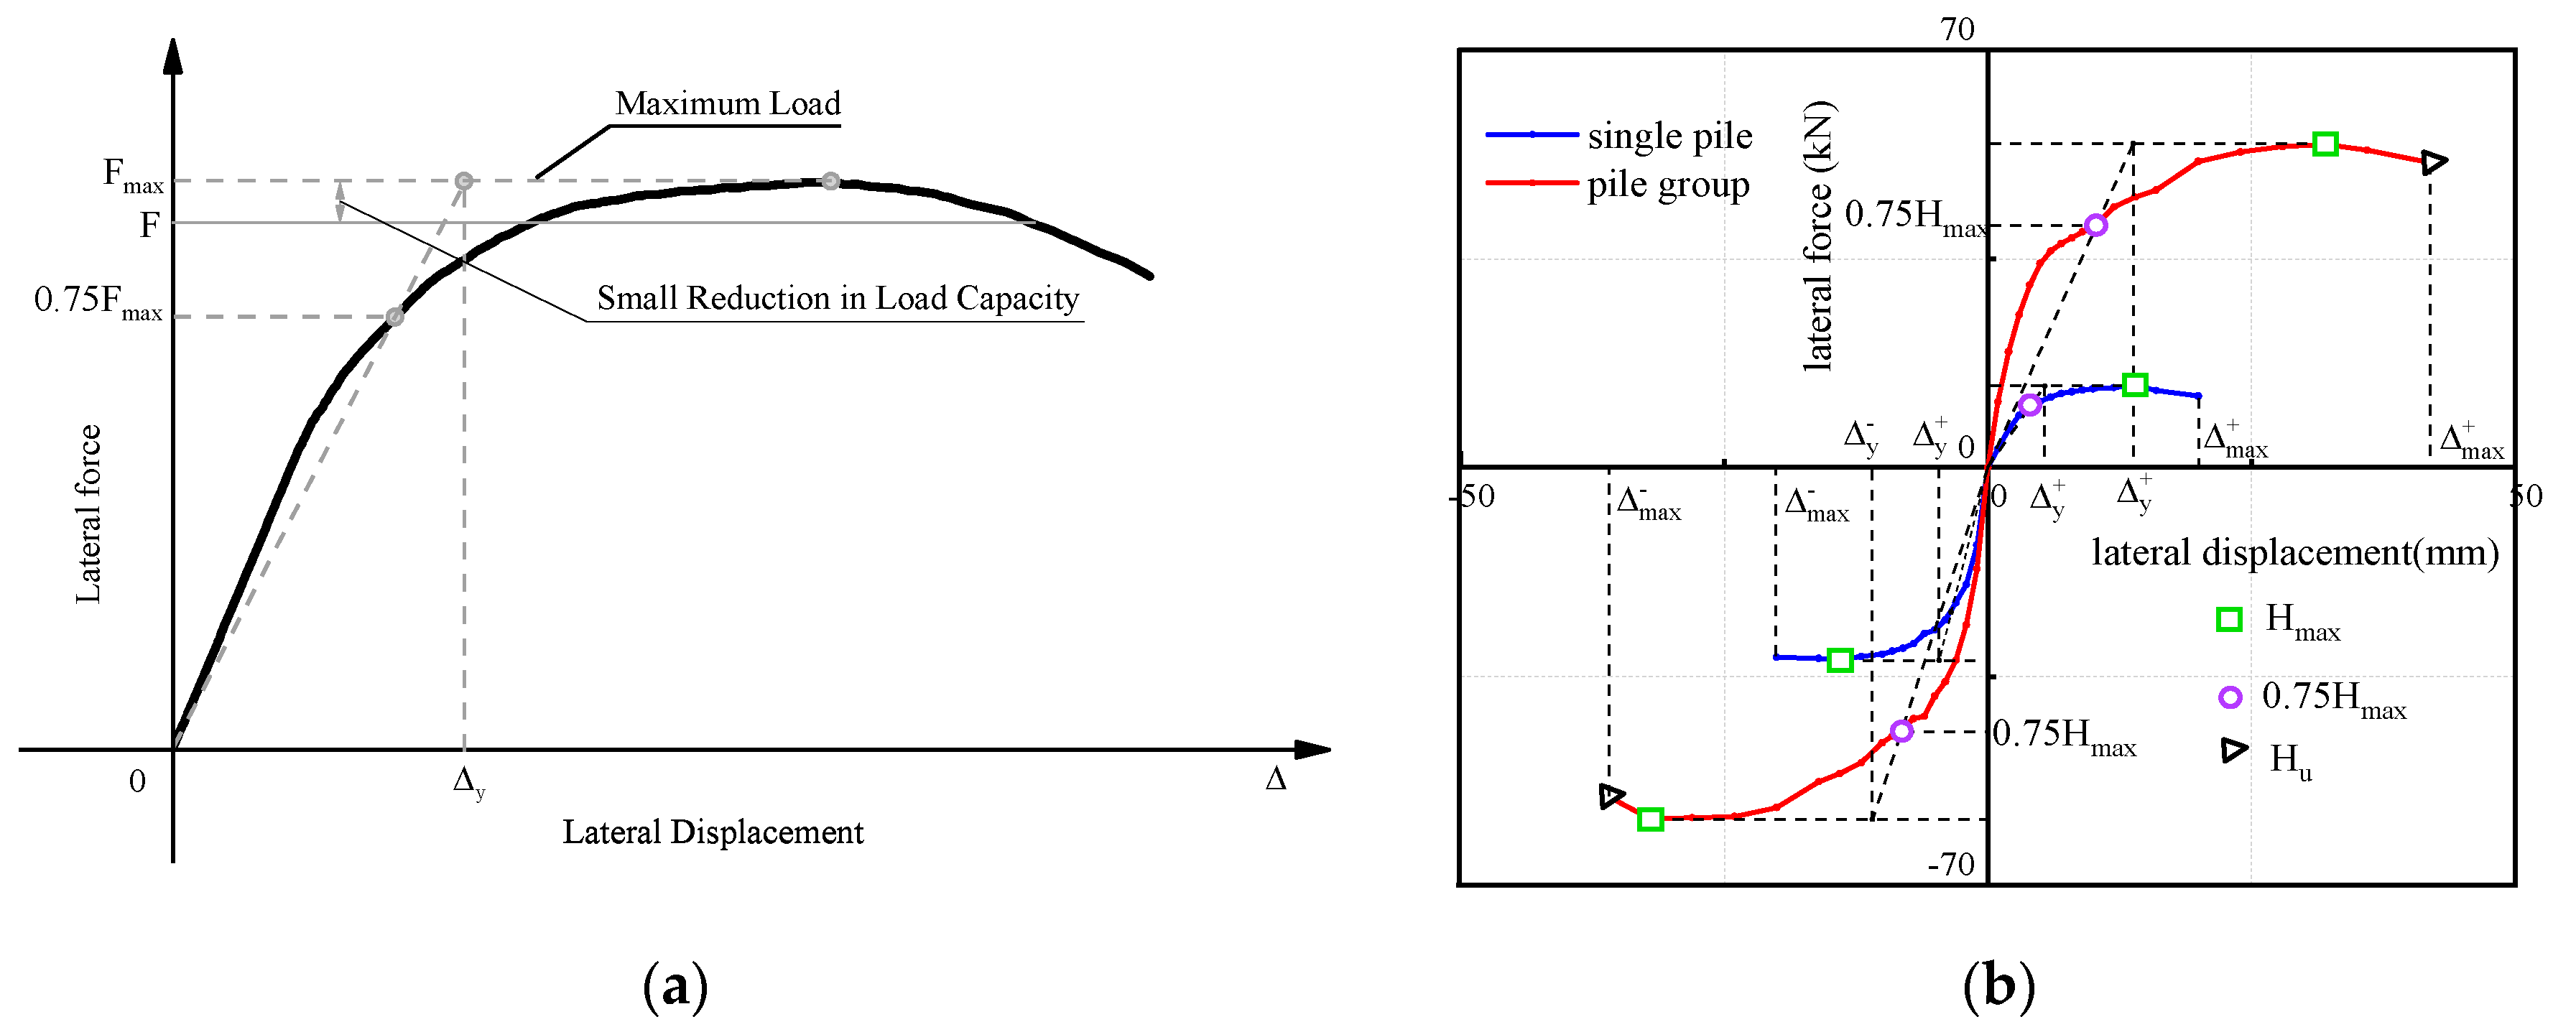
In this study, the method recommended by Amr S. Elnashai and Luigi Di Sarno[19] is adopted to determine the yield point and limit state of reinforced concrete pile group and single pile foundation: as shown in Figure 5 skeleton curve. Because, the use of secant stiffness accounts for the reduction of structural stiffness due to cracking at the elastic limit and the method is the most realistic definition for yield deformation in RC structures. Definitions given above are derived primarily for RC structures. Ductile structures usually have post - peak load strength and their load – deformation curves do not exhibit abrupt reduction in resistance, especially for RC pile. Hence the most realistic definitions are those given in Figures 5. Note that in the tests, the lateral loadings ended when the lateral strength fell by 5% or irreparable pile damage emerged. The load corresponding to 95% reduction after over peak load is the ultimatestate because they account for the post - peak deformation capacity.
Using the above methods, it is finally determined that the forward loading yield displacement of reinforced concrete pile group in this test is 13.8mm, and the corresponding yield load is 45.1kN; the forward loading ultimate displacement is 41.9mm, and the corresponding ultimate load is 51.1kN. The yield displacement of negative loading is -11.0mm, and the ultimate displacement of negative loading is -42mm.
3.2. General Observations and Failure Modes
When analyzing the pile-soil interaction of reinforced concrete pile group foundation, it is necessary to judge when the foundation piles enter the failure state or yield state. Because when a section of the foundation pile yields, the reinforced concrete is heterogeneous material, the crack development has a strong randomness, and there is no definite rule to follow for the deformation of the pile. Therefore, there is no value and significance to study pile-soil interaction for foundation piles that enter into failure or yield piles. Therefore, whether it is to study pile-soil interaction or to conduct elastic-plastic analysis of reinforced concrete, it is very important to judge when foundation pile enters the yield state and give the corresponding target displacement. The traditional method is to use the bending moment curvature curve to judge the yield limit, but because we do not know the real constitutive model of reinforced concrete adopted in the test, the limit curvature value of the foundation pile into the yield state is not accurate. The law of quantitative change and qualitative change is the universal law followed by the development and evolution of all things in nature. For the working behavior of pile group foundation, when pile group is subjected to horizontal load, its working behavior characteristics will definitely change (qualitative characteristics) with the increase of load range (quantitative characteristics), and reflect the meaning contained in the natural law of quantitative to qualitative changes. The reinforced concrete pile group foundation used in this test model is a typical statically indeterminate structure. With the continuous increase of load, according to the observation of the failure of the pile head area of each foundation pile after the test, combined with the hysteretic curve and skeleton curve during the test of pile group foundation, each foundation pile entered the yield state successively due to the different arrangement. And because each foundation pile enters the yield and failure state successively, the force system of pile group foundation is constantly transformed. When the stress system, that is, the constraint modes at both ends of different foundation piles are changed, the stress state of pile has a sudden change characteristic after all. We can use the above analysis to accurately judge the time when each foundation pile enters yield and the corresponding loading displacement level in pile group foundation.
The curvature of pile will change with the amplitude of loading displacement. And the mutation characteristics appear with each pile entering the yield state successively. The curvature of each section of pile can be calculated by Equation (3).
Curvature profiles for the piles are generated using axial strain measurements as follows:
where and =axial strain measurements on opposite sides of the piles at elevation z and D= horizontal separation distance between sensors. Axial strains are derived in this manner from the strain gauges on pile surface.
Figure 4 respectively shows the regular curves of pile curvature of #1 pile, #2 pile, #3 pile and #5 pile changing with loading displacement amplitude. Based on the sudden change characteristic, it can be concluded that when the load displacement amplitude of #3 pile is 6mm, the concrete in the pile head area will first appear under compression failure. According to the change law of the skeleton curve of pile group foundation, it can be determined that this is the reason why pile group foundation enters the inelastic work from the elastic work stage. This is consistent with the loading displacement amplitude corresponding to the concrete failure in the pile head area during the single pile experiment. Pile #1 shows a sudden change when the loading displacement amplitude is 20mm. Pile #2 was damaged when the loading displacement amplitude was 24mm. When the loading displacement amplitude of # 5 foundation pile is 16mm, failure occurs, which is also the reason why pile group foundation enters the yield state according to the skeleton curve of pile group foundation.
According to the above analysis, when a foundation pile enters the yield state or the concrete in the pile head area first fails. The force system of pile group foundation will change abruptly. There is no doubt that the sudden change of stress system will directly reflect the stress state of each foundation pile. The sudden change of the curvature of each section of the piles above can determine the corresponding loading displacement amplitude of each foundation pile into yield. Of course, we can also use principal strain analysis to further verify and review the correctness of the above conclusions. Through the analysis of pile head failure pattern after pile group test and single pile test, it is found that pile head area is bending failure. Therefore, according to the first strength theory, the analysis of the main compressive strain of pile concrete has the most reference value.
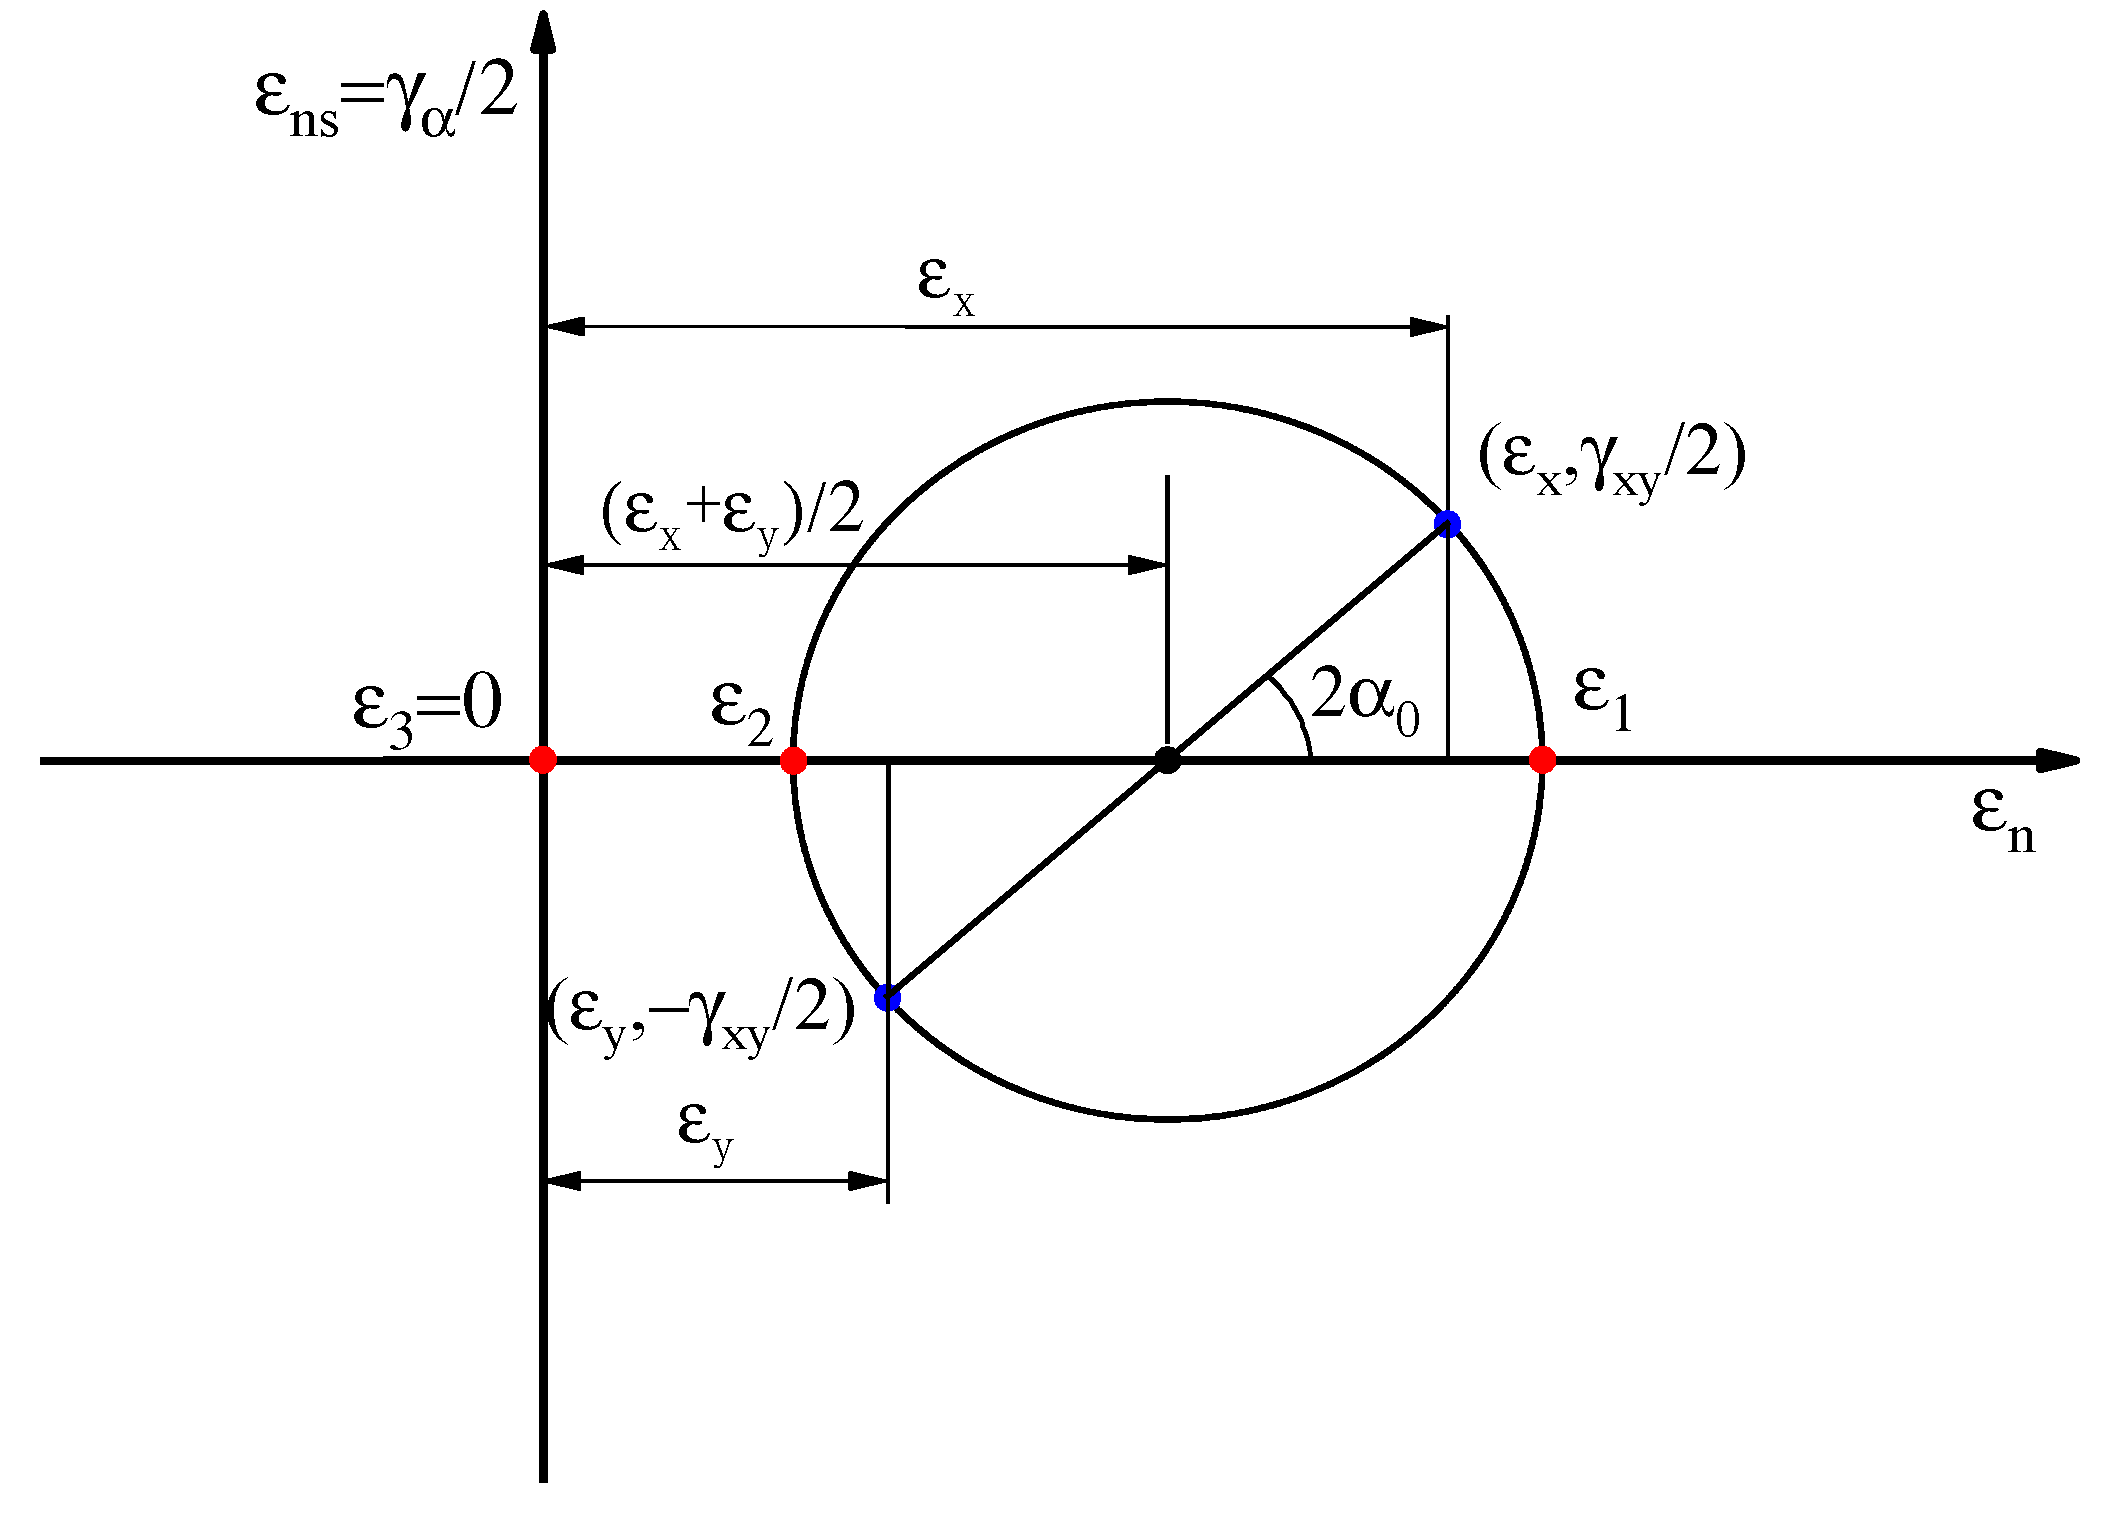
Since the strain flower is arranged on the cross section surface of pile head perpendicular to the loading direction, the stress state of this point can be converted into a plane strain problem. Therefore, the Mohr graphic method of plane strain in elasticity is shown in Figure 5, and the calculation formula (4) and (5) of principal strain can be solved.
Figure 5.
Schematic diagram of the Mohr graphic method of plane strain.
Formulas (4) and (5) can be used to calculate the variation curve of the principal strain at a certain point of the cross section of the pile head of each foundation pile along with the loading displacement amplitude, as shown in Figure 6. Using the above analysis method, the failure sequence and corresponding loading displacement amplitude of each foundation pile can also be determined. This is completely consistent with the above results by using curvature determination.
Determining the target displacement of reinforced concrete pile group foundation is the target of seismic design based on performance/displacement, and is an important reference for controlling the damage degree of pile group under different strength levels of earthquake. So determining the target displacement is the key of performance-based displacement design. Based on the sudden change mechanism of pile curvature and principal strain, this paper determined that the target displacement of # 3 foundation pile is 6mm,#5 foundation pile is 16mm, #1 foundation pile is 20mm, and #2 foundation pile is 24mm.
3.3. Soil–pile interaction force – displacement relationships
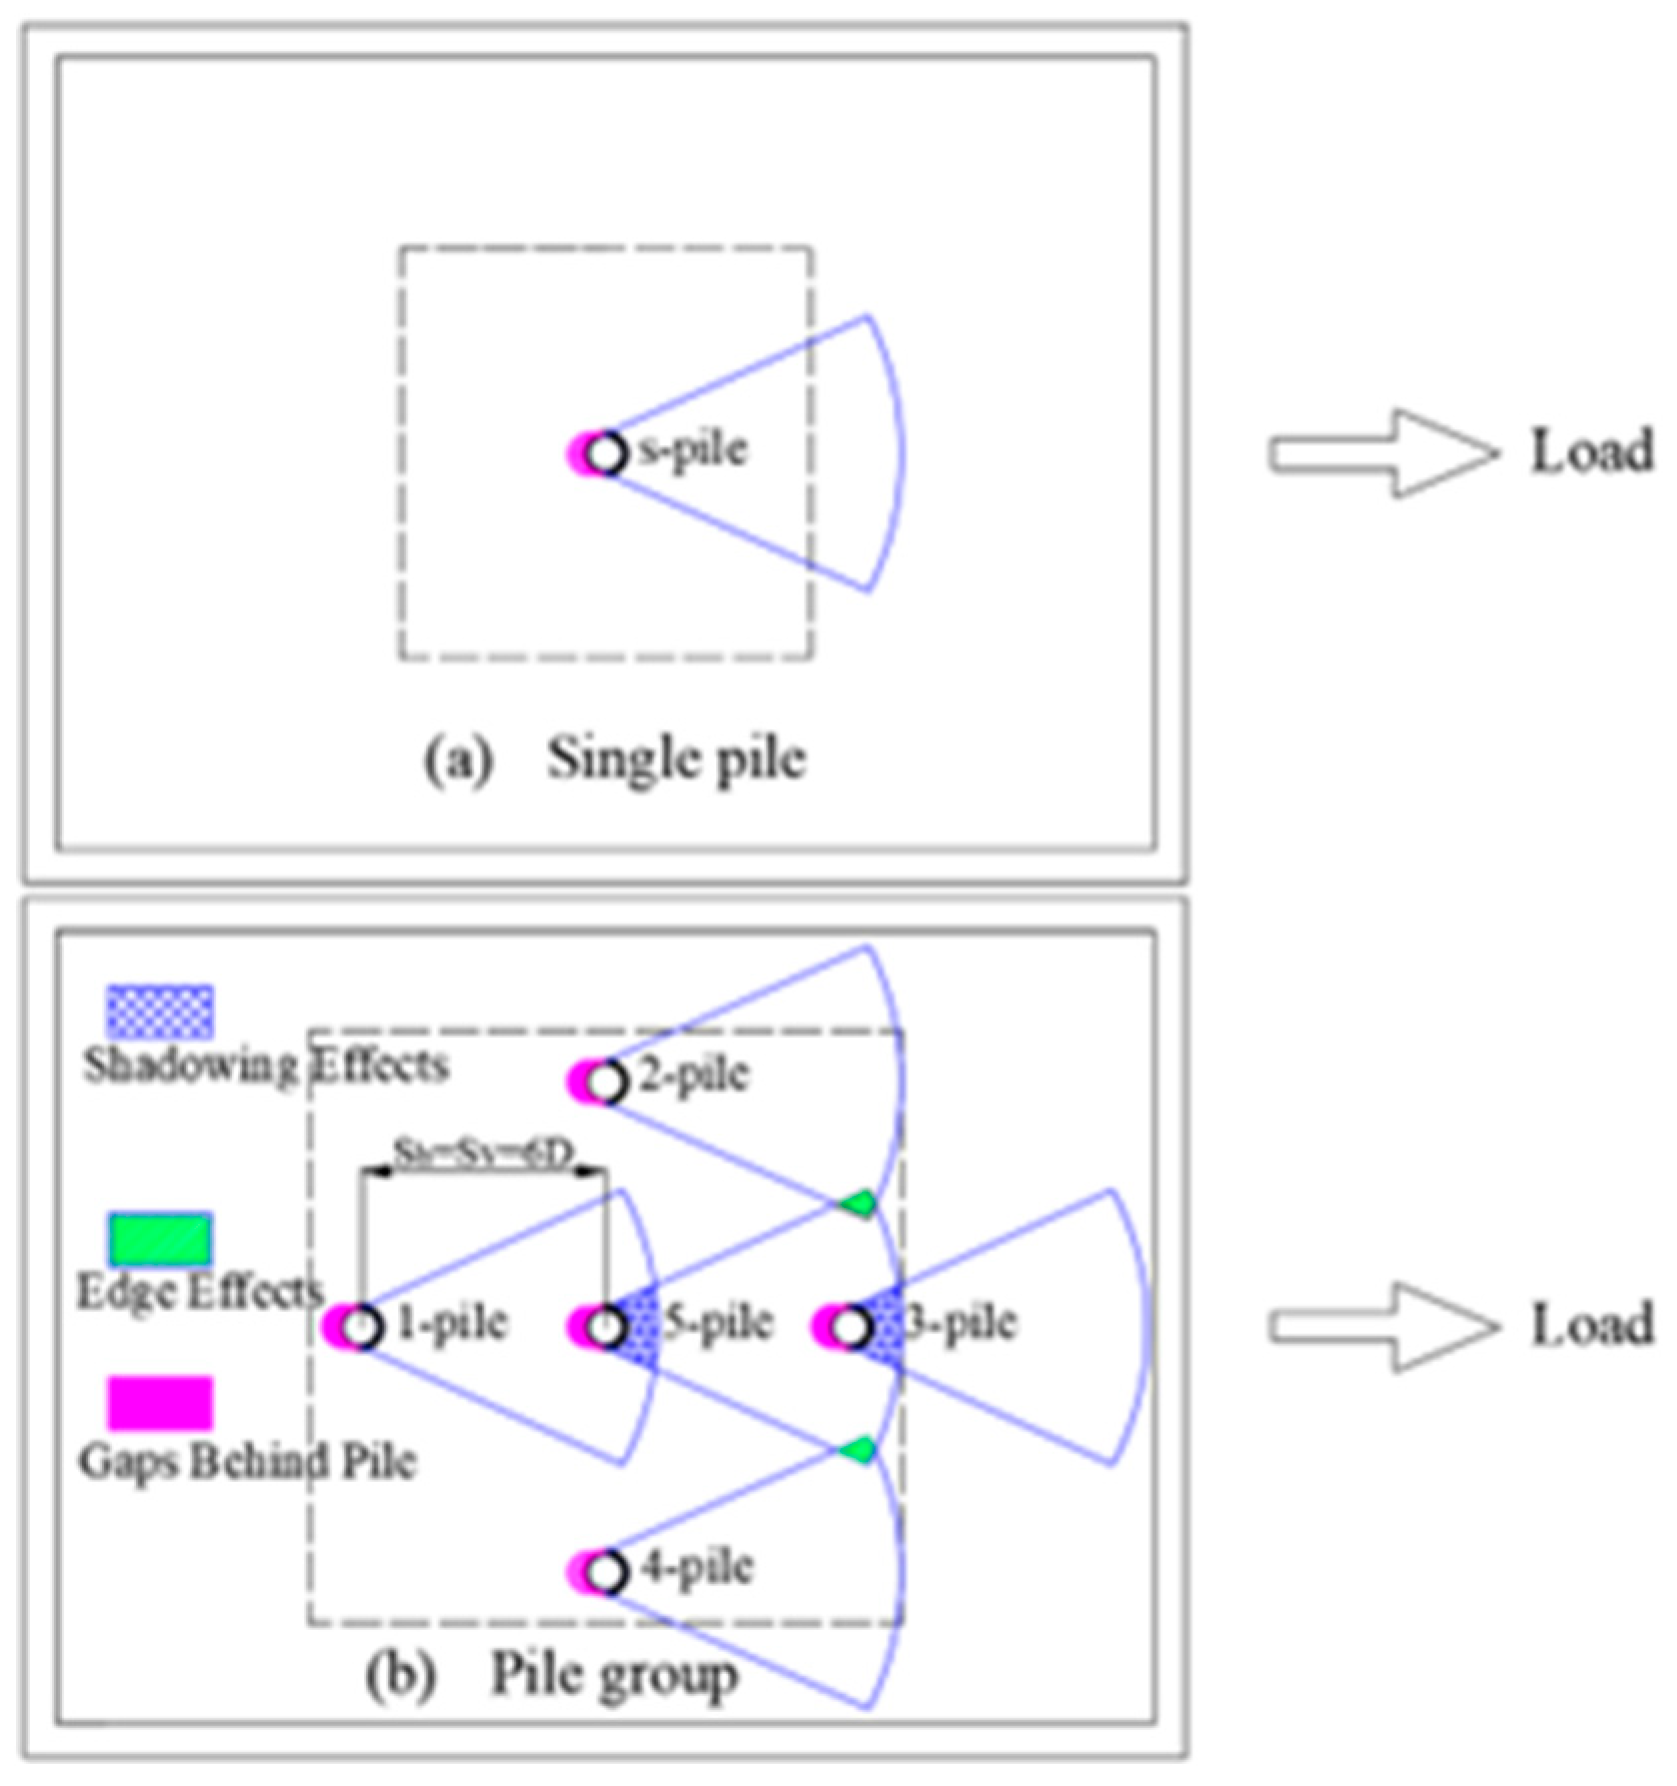
For pile groups, Influence zones are developed behind individual piles within a pile group as they push the soil in front while the load is transferred to the soil. The overlapping of these zones in pile groups results in less soil resistance, and a reduction in the amount of load each pile can carry. The term “shadowing effect” is employed to describe the overlapping zones between piles in different rows, and the term “edge effect” is used to describe the overlapping shear zones between piles in the same row. The closer the piles are spaced, the more overlapping of the influence zones occurs, which creates a greater reduction of soil resistance.
Figure 7.
Analysis diagram of pile group effect of pile group foundation.
Numerous test data show that radial earth pressure approximately presents an elliptic distribution law along the pile circumference, as shown in Figure 8. And detailed measurements of the distribution of interaction pressure on the circumference of the pile (Figure 8) have not been reported in the literature.
The soil pressure cells were glued on the circumference of the pile provided the distribution of the soil-pile interaction compressive pressure in front of the pile at different depths along the pile length. Figure 9 shows that the distribution of the interaction compressive pressure was approximately symmetric around the front of the pile with a shape similar to that proposed by Smith (Figure 8). Furthermore, the measured pressures increased as the applied load increased, and the maximum value of the measured pressure (Pmax) increased from 0 to 120 kPa as the load increased from1mm to 20mm.
According to the relationship between radial earth pressure and radial displacement measured passively around pile, Huang summarized the test data of soil pressure around pile in existing literature for fitting, and obtained the following fitting function (see Equation 7).
The corresponding relationship between p and σmax is finally obtained through calculation, as shown in Equation 8. Where p (kN/m) is horizontal soil resistance per unit length
In combination with Equation 8 and the mechanical parameters of the tested soil in this test, the relationship between pile front p and the maximum soil pressure in this test can be obtained in Equation 9.
The horizontal bearing of pile foundation is a nonlinear pile-soil interaction problem. Before the ultimate failure of pile side foundation soil, the soil is always in an elastic-plastic compression state. With the application of pile top horizontal force, the plastic influence zone of pile side foundation soil expands continuously, and the horizontal reaction force of pile side soil on pile body will be redistributed along the depth direction. When the horizontal load is greater than the ultimate load, the horizontal displacement and displacement gradient of the pile top increase significantly. At the same time, along with the extrusion uplift and passive fracture surface of the pile side soil, the pile body with low reinforcement rate will crack or break. The relative stiffness of pile body and soil is different with different buried depth, and the working behavior of pile under horizontal load is also different. For the single pile with relatively large pile stiffness, it is rigid body rotation under horizontal load. This kind of pile is called rigid pile, and its horizontal bearing capacity is generally controlled by the strength of the soil on the side of the pile. For the single pile with small relative stiffness, it is very flexible, just like the elastic beam erected in the foundation, which is called flexible pile. The horizontal bearing capacity of flexible pile is controlled by the flexural strength of pile material and the resistance of pile side soil. As shown in Figure 10, when the loading displacement amplitude reaches 6mm, the soil around the pile has an overall shear crack. In addition, considering the failure of No. 3 foundation pile in the pile group foundation and in the single pile test at 6mm, this paper studies the pile-soil interaction in the elastic working stage of the foundation pile and the single pile test.
Using the above formula and pile deflection, the p-y curves of pile #1, pile #2 and pile # 5 can be obtained, as shown in Figure 11, Figure 12 and Figure 13.
It can be found through the calculation results of p-y curves in Figure 11, Figure 12 and Figure 13 combined with the schematic diagram of pile group effect analysis in Figure 7. As #2 foundation pile is only affected by edge effect, the reduction of p-y curve of single pile is minimal. 1# foundation pile only has the influence of masking effect, so the reduction of p-y curve to single pile p-y curve is second. Due to the double action of shielding effect and edge effect, the 5# foundation pile has the largest reduction coefficient for p-y curve.
The distribution of the horizontal foundation bed coefficient along the pile height can also be obtained by using the calculation result of the maximum earth pressure around the pile in Figure 9, as shown in Figure 14. In the same way, due to the different proportions of shielding effect and edge effect in the foundation piles of pile group foundation, the coefficient distribution of horizontal foundation bed of soil in front of each foundation pile in pile group foundation is different. The horizontal bed coefficient of #2 foundation pile is obviously greater than that of #1 and 5# foundation pile. In the elastic working stage, because of the double influence of shielding effect and edge effect, the horizontal foundation bed coefficient of the middle pile has no discrete type.
Since the soil has a compaction process, the base bed coefficient after stability is taken. It is found that the coefficients of the three base beds with loading displacement amplitudes of 3mm, 4mm and 5mm tend to be stable, so 5mm is taken for quantitative comparative analysis, as shown in Figure 15.
Through the analysis of the horizontal subbed coefficient in Figure 15, it is found that the subbed coefficient of #2 pile is basically similar to that of the single pile test, so it can be found that the influence of the edge effect on the horizontal subbed coefficient is limited and can be ignored. Therefore, due to the influence of shielding effect, the horizontal subbed coefficients of #1 and #5 foundation piles are reduced the most, and the subbed coefficients of these two foundation piles are close to each other.
4. Conclusions
Based on the structural stressing state theory, this paper proposes the methods modeling tested strains of the RC pile group to accurately calculate the lateral load bearing capacity of RC pile groups. The conclusions reached are as follows:
1. The loading displacement amplitude corresponding to the failure of each foundation pile in the high axial compression reinforced concrete pile group foundation is given as follows: the front-end nappe foundation pile (#3 pile) is 6mm, the middle pile is 16mm, the front-end nappe foundation pile is 20mm, and the loading displacement amplitude of side pile is 24mm.
2. In the silty clay, when the pile group spacing is 6D, the edge effect has a limited influence on the p-y curve of the foundation piles in the pile group foundation compared with the single pile, which is the dominant shading effect.
3. In silty clay, due to the existence of pile group effect, the edge effect has little effect on the horizontal foundation bed coefficient of foundation pile in pile group, while the influence of masking effect on the horizontal foundation bed coefficient of each foundation pile in pile group is not related to the position of pile, but only to the existence of masking effect, and the influence of different columns of masking effect on the horizontal foundation bed coefficient is the same.
Author Contributions
Sun Yunlun: Conceptualization, Investigation, Data Curation, Bin Li: Writing-Original Draft, Formal analysis, Visualization, Liping Jing: Validation, WANG Yougang: Data Curation, Li Sihan: Investigation, Supervision, Writing-Reviewing and Editing. Qi Wenhao: Project administration
Funding
The Scientific Research Fund of Institute of Engineering Mechanics, China Earthquake Administration (Grant no.2019B10) and the National Science and Technology Major Special Funding Project of China (grant number. 2018ZX06902016).
Acknowledgments
the authors would like to acknowledge the support providedby the Scientific Research Fund of Institute of EngineeringMechanics, China Earthquake Administration (Grant no.2019B10) and the National Science and Technology Major Special Funding Project of China (grant number. 2018ZX06902016).
Conflicts of Interest
The authors declare that they have no known competing financial interests or personal relationships that could have appeared to influence the work reported in this paper.
Appendix
| List of Symbols | |
| D | Diameter of pile section |
| fc | Uniaxial strength of concrete |
| fy | Yield stress of longitudinal steel and transverse bar |
| θ | Friction angle of sand |
| γ | The natural density of silty clay |
| γd | Dry density of Silty clay |
| c | Cohesion of silty clay |
| w | Water content of silty clays |
| e | The porosity ratio of silty clays |
| sr | Saturation of silty clay |
| E0 | Deformation modulus of silty clay |
| Gs | The relative density of solid particles of silty clay |
References
- B.K. Gupta, Dynamic pile-head stiffness of laterally loaded end-bearing pile in linear viscoelastic soil − A comparative study, Computers and Geotechnics, 145 (2022) 104654. [CrossRef]
- C.-H. Chiang, C.-P. Yu, Frequency domain modeling and dynamic characteristics evaluation of existing wind turbine systems, in: NONDESTRUCTIVE CHARACTERIZATION AND MONITORING OF ADVANCED MATERIALS, AEROSPACE, AND CIVIL INFRASTRUCTURE 2016, 2016. [CrossRef]
- X. Cheng, S.K. Vanapalli, Prediction of the nonlinear behavior of laterally loaded piles in unsaturated soils, Computers and Geotechnics, 140 (2021) 104480. [CrossRef]
- L.-g. Kong, Z.-c. Zhang, Y.-m. Chen, Nonlinear analysis of pile groups subjected to combined lateral and torsional loading, JOURNAL OF ZHEJIANG UNIVERSITY-SCIENCE A, 21 (2020) 179-192. [CrossRef]
- H. Matlock, Correlation for Design of Laterally Loaded Piles in Soft Clay, in: Offshore Technology Conference, 1970, pp. OTC-1204-MS. [CrossRef]
- L.C. Reese, Laterally Loaded Piles: Program Documentation, Journal of Geotechnical and Geoenvironmental Engineering, 103 (1977) 287-305.
- M. Rollins Kyle, M. Gerber Travis, J.D. Lane, A. Ashford Scott, Lateral Resistance of a Full-Scale Pile Group in Liquefied Sand, Journal of Geotechnical and Geoenvironmental Engineering, 131 (2005) 115-125. [CrossRef]
- M.S. Fayyazi, M. Taiebat, W.D.L. Finn, Group reduction factors for analysis of laterally loaded pile groups, CANADIAN GEOTECHNICAL JOURNAL, 51 (2014) 758-769. [CrossRef]
- W. Fuentes, M. Gil, G. Rivillas, A p-y Model for Large Diameter Monopiles in Sands Subjected to Lateral Loading under Static and Long-Term Cyclic Conditions, JOURNAL OF GEOTECHNICAL AND GEOENVIRONMENTAL ENGINEERING, 147 (2021). [CrossRef]
- M.T. Suleiman, L. Ni, A. Raich, J. Helm, E. Ghazanfari, Measured soil–structure interaction for concrete piles subjected to lateral loading, 52 (2015) 1168-1179. [CrossRef]
- A. Lemnitzer, P. Khalili-Tehrani, E.R. Ahlberg, C. Rha, E. Taciroglu, J.W. Wallace, J.P. Stewart, Nonlinear Efficiency of Bored Pile Group under Lateral Loading, Journal of Geotechnical and Geoenvironmental Engineering, 136 (2010) 1673-1685. [CrossRef]
- M. Zhang, Study on seismic behaviour and failure criterion of reticulated shells based on energy, in, PhD thesis, Harbin Institute of Technology,Harbin,China, 2014.
- M. Zhou, W. Yuan, Y. Zhang, Seismic Material Properties of Reinforced Concrete and Steel Casing Composite Concrete in Elevated Pile-Group Foundation, Polish Maritime Research, 22 (2015) 141-148. [CrossRef]
- X. Wang, A. Ye, Z. He, Y. Shang, Quasi-Static Cyclic Testing of Elevated RC Pile-Cap Foundation for Bridge Structures, Journal of Bridge Engineering, 21 (2016) 04015042. [CrossRef]
- Z. Guan, X. Chen, J. Li, Experimental investigation of the seismic performance of bridge models with conventional and rocking pile group foundations, Engineering Structures, 168 (2018) 889-902. [CrossRef]
- T. Liu, X. Wang, A. Ye, Roles of pile-group and cap-rotation effects on seismic failure mechanisms of partially-embedded bridge foundations: Quasi-static tests, Soil Dynamics and Earthquake Engineering, 132 (2020) 106074. [CrossRef]
- S. Iai, Similitude for Shaking Table Tests on Soil-Structure-Fluid Model in 1g Gravitational Field, Soils and Foundations, 29 (1989) 105-118. [CrossRef]
- X. Wang, A. Ye, Y. Shang, L. Zhou, Shake-table investigation of scoured RC pile-group-supported bridges in liquefiable and nonliquefiable soils, Earthquake Engineering & Structural Dynamics, 48 (2019) 1217-1237. [CrossRef]
- A.S. Elnashai, L.D. Sarno, Fundamentals of Earthquake Engineering, Fundamentals of Earthquake Engineering, 2008. [CrossRef]
Figure 4.
(a) Section curvature of pile 1#; (b) Section curvature of pile No. 2; (c) Curvature of section of pile No. 3; (d) Curvature of section of pile 5#.
Figure 4.
(a) Section curvature of pile 1#; (b) Section curvature of pile No. 2; (c) Curvature of section of pile No. 3; (d) Curvature of section of pile 5#.
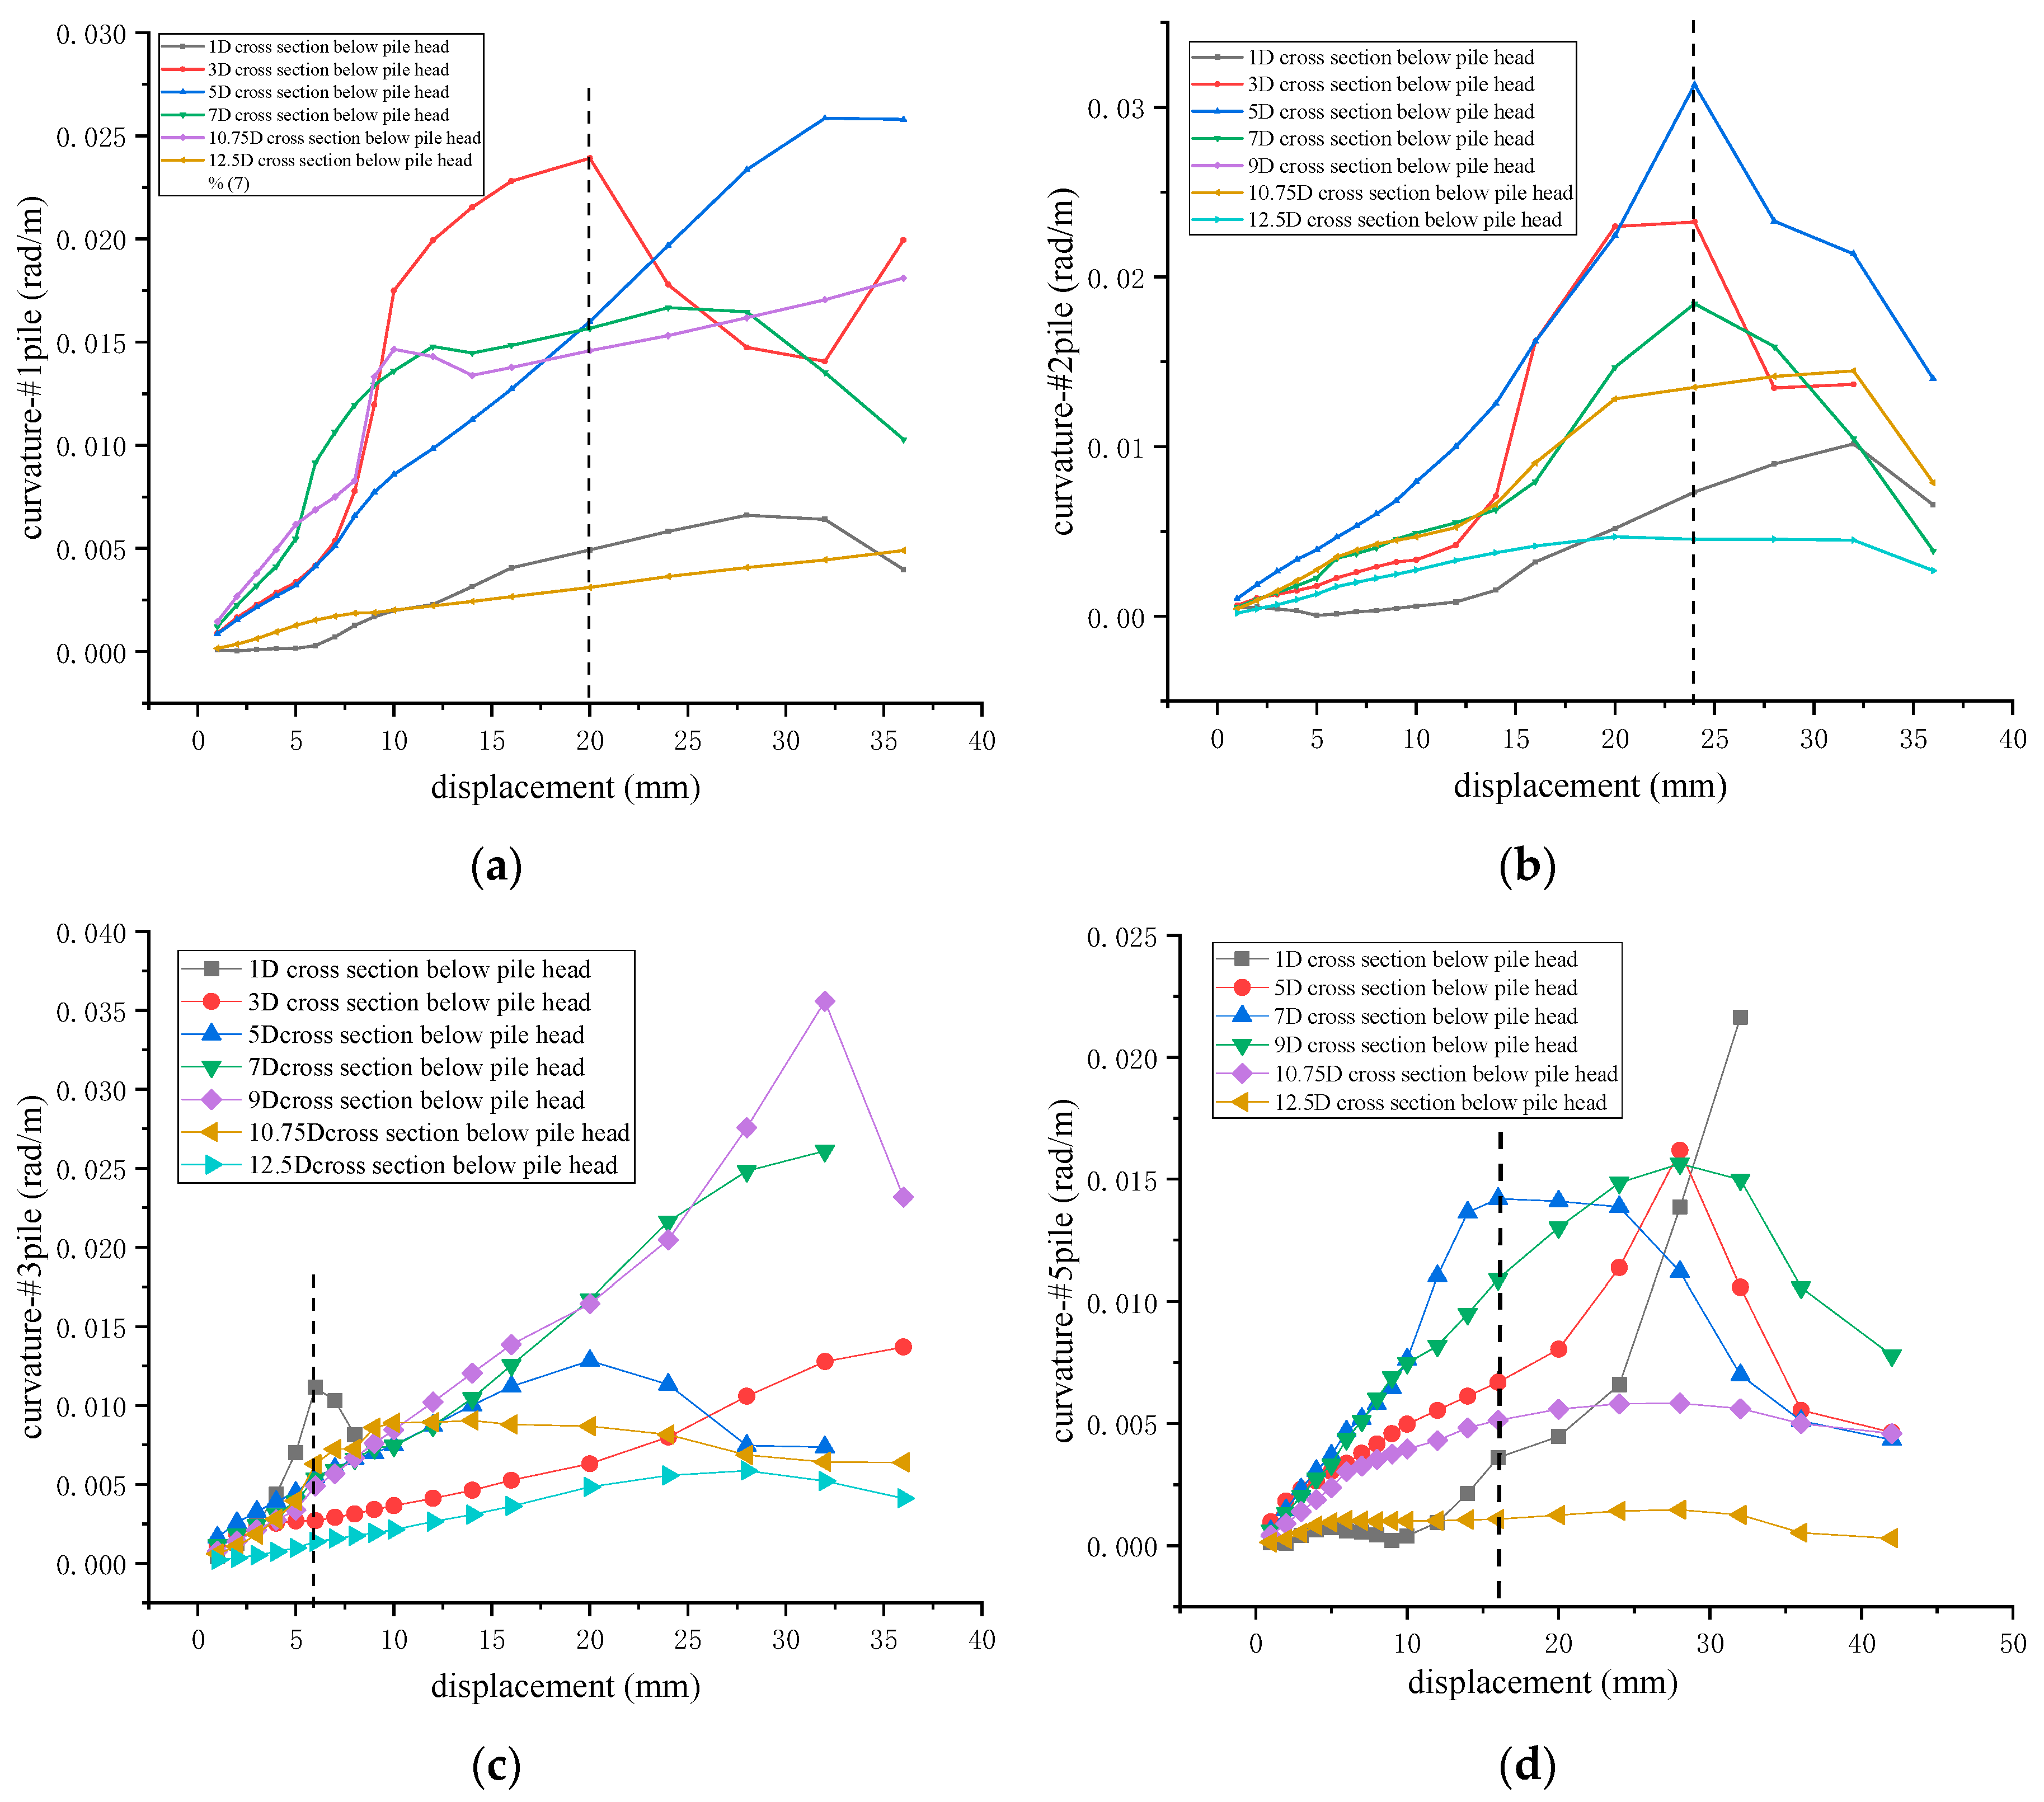
Figure 6.
(a) 1#-pile; (b) 2#-pile; (c) 3#-pile; (d) 5#-pile;.
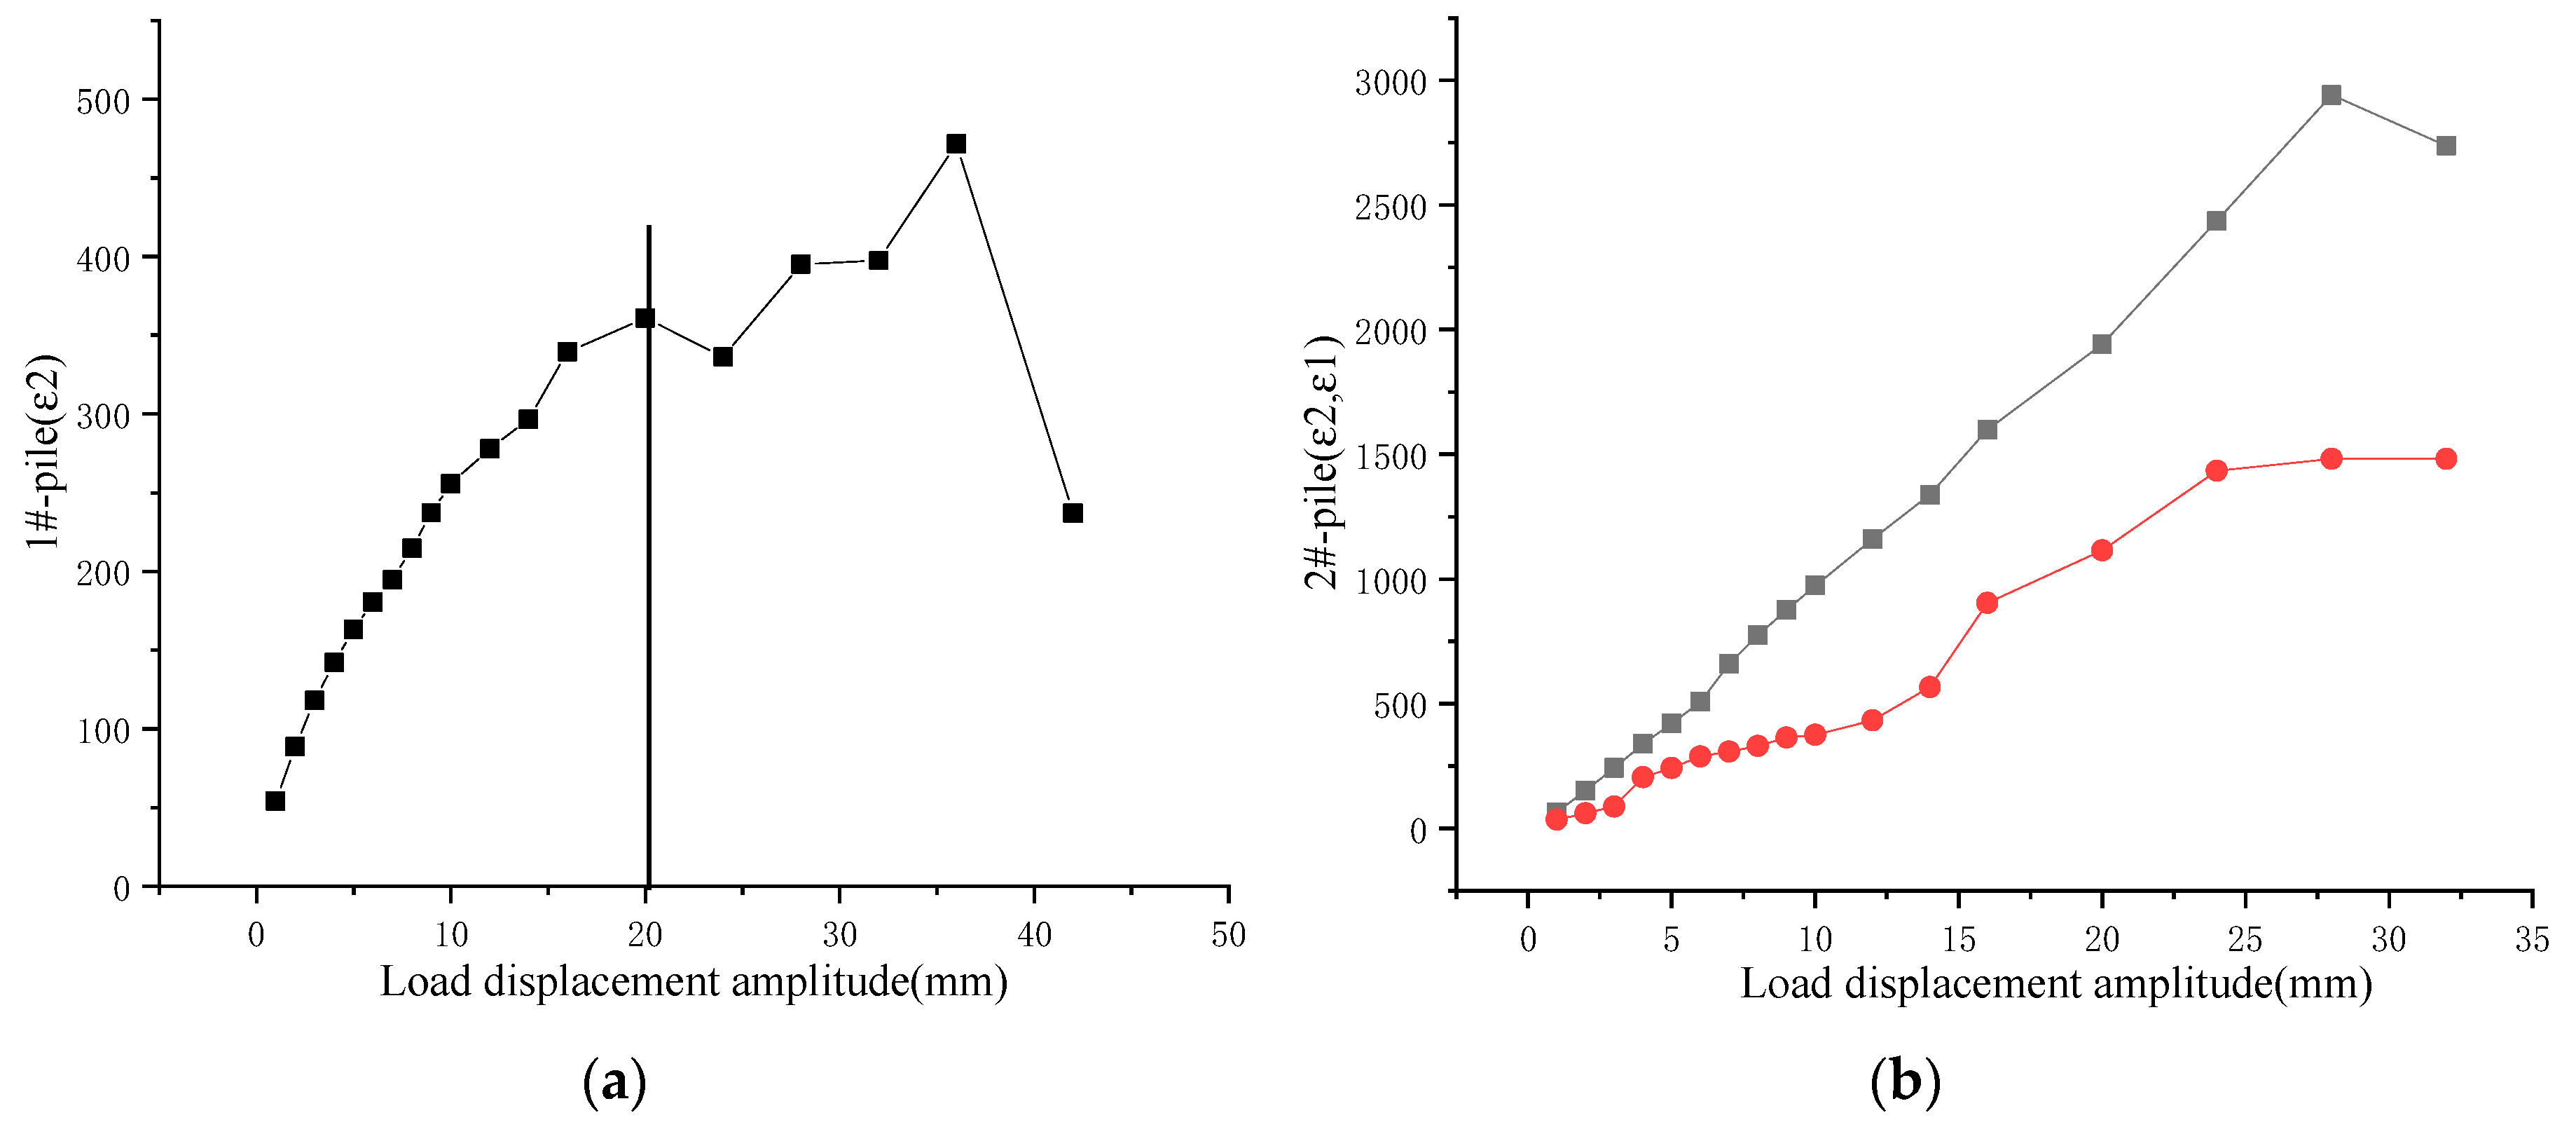
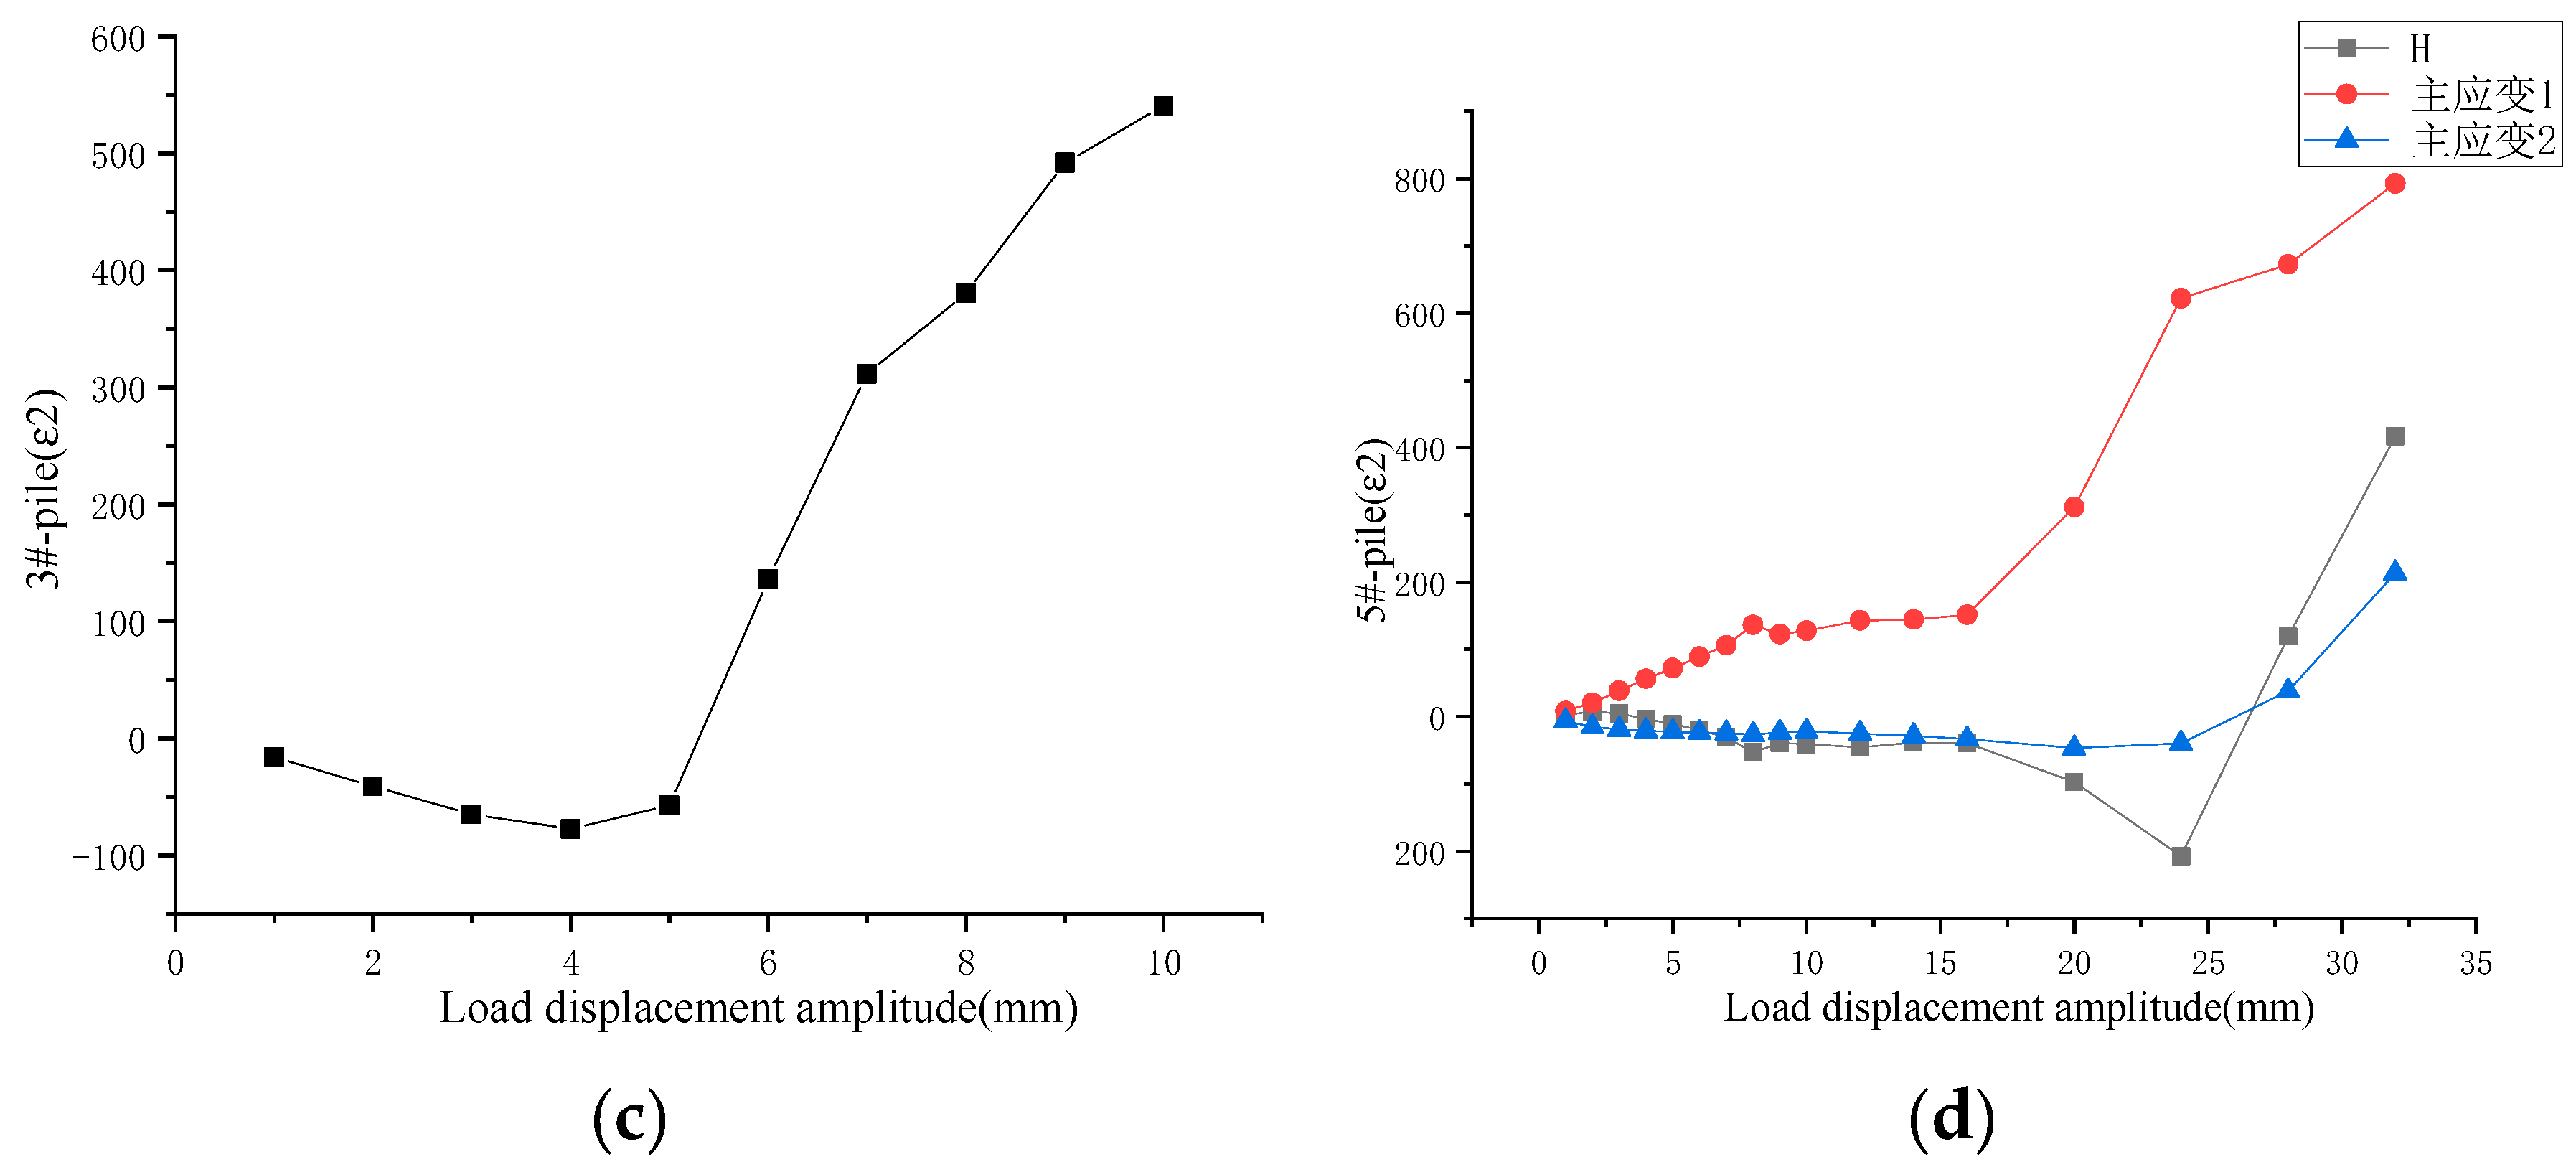
Figure 8.
This is a figure. Schemes follow the same formatting.
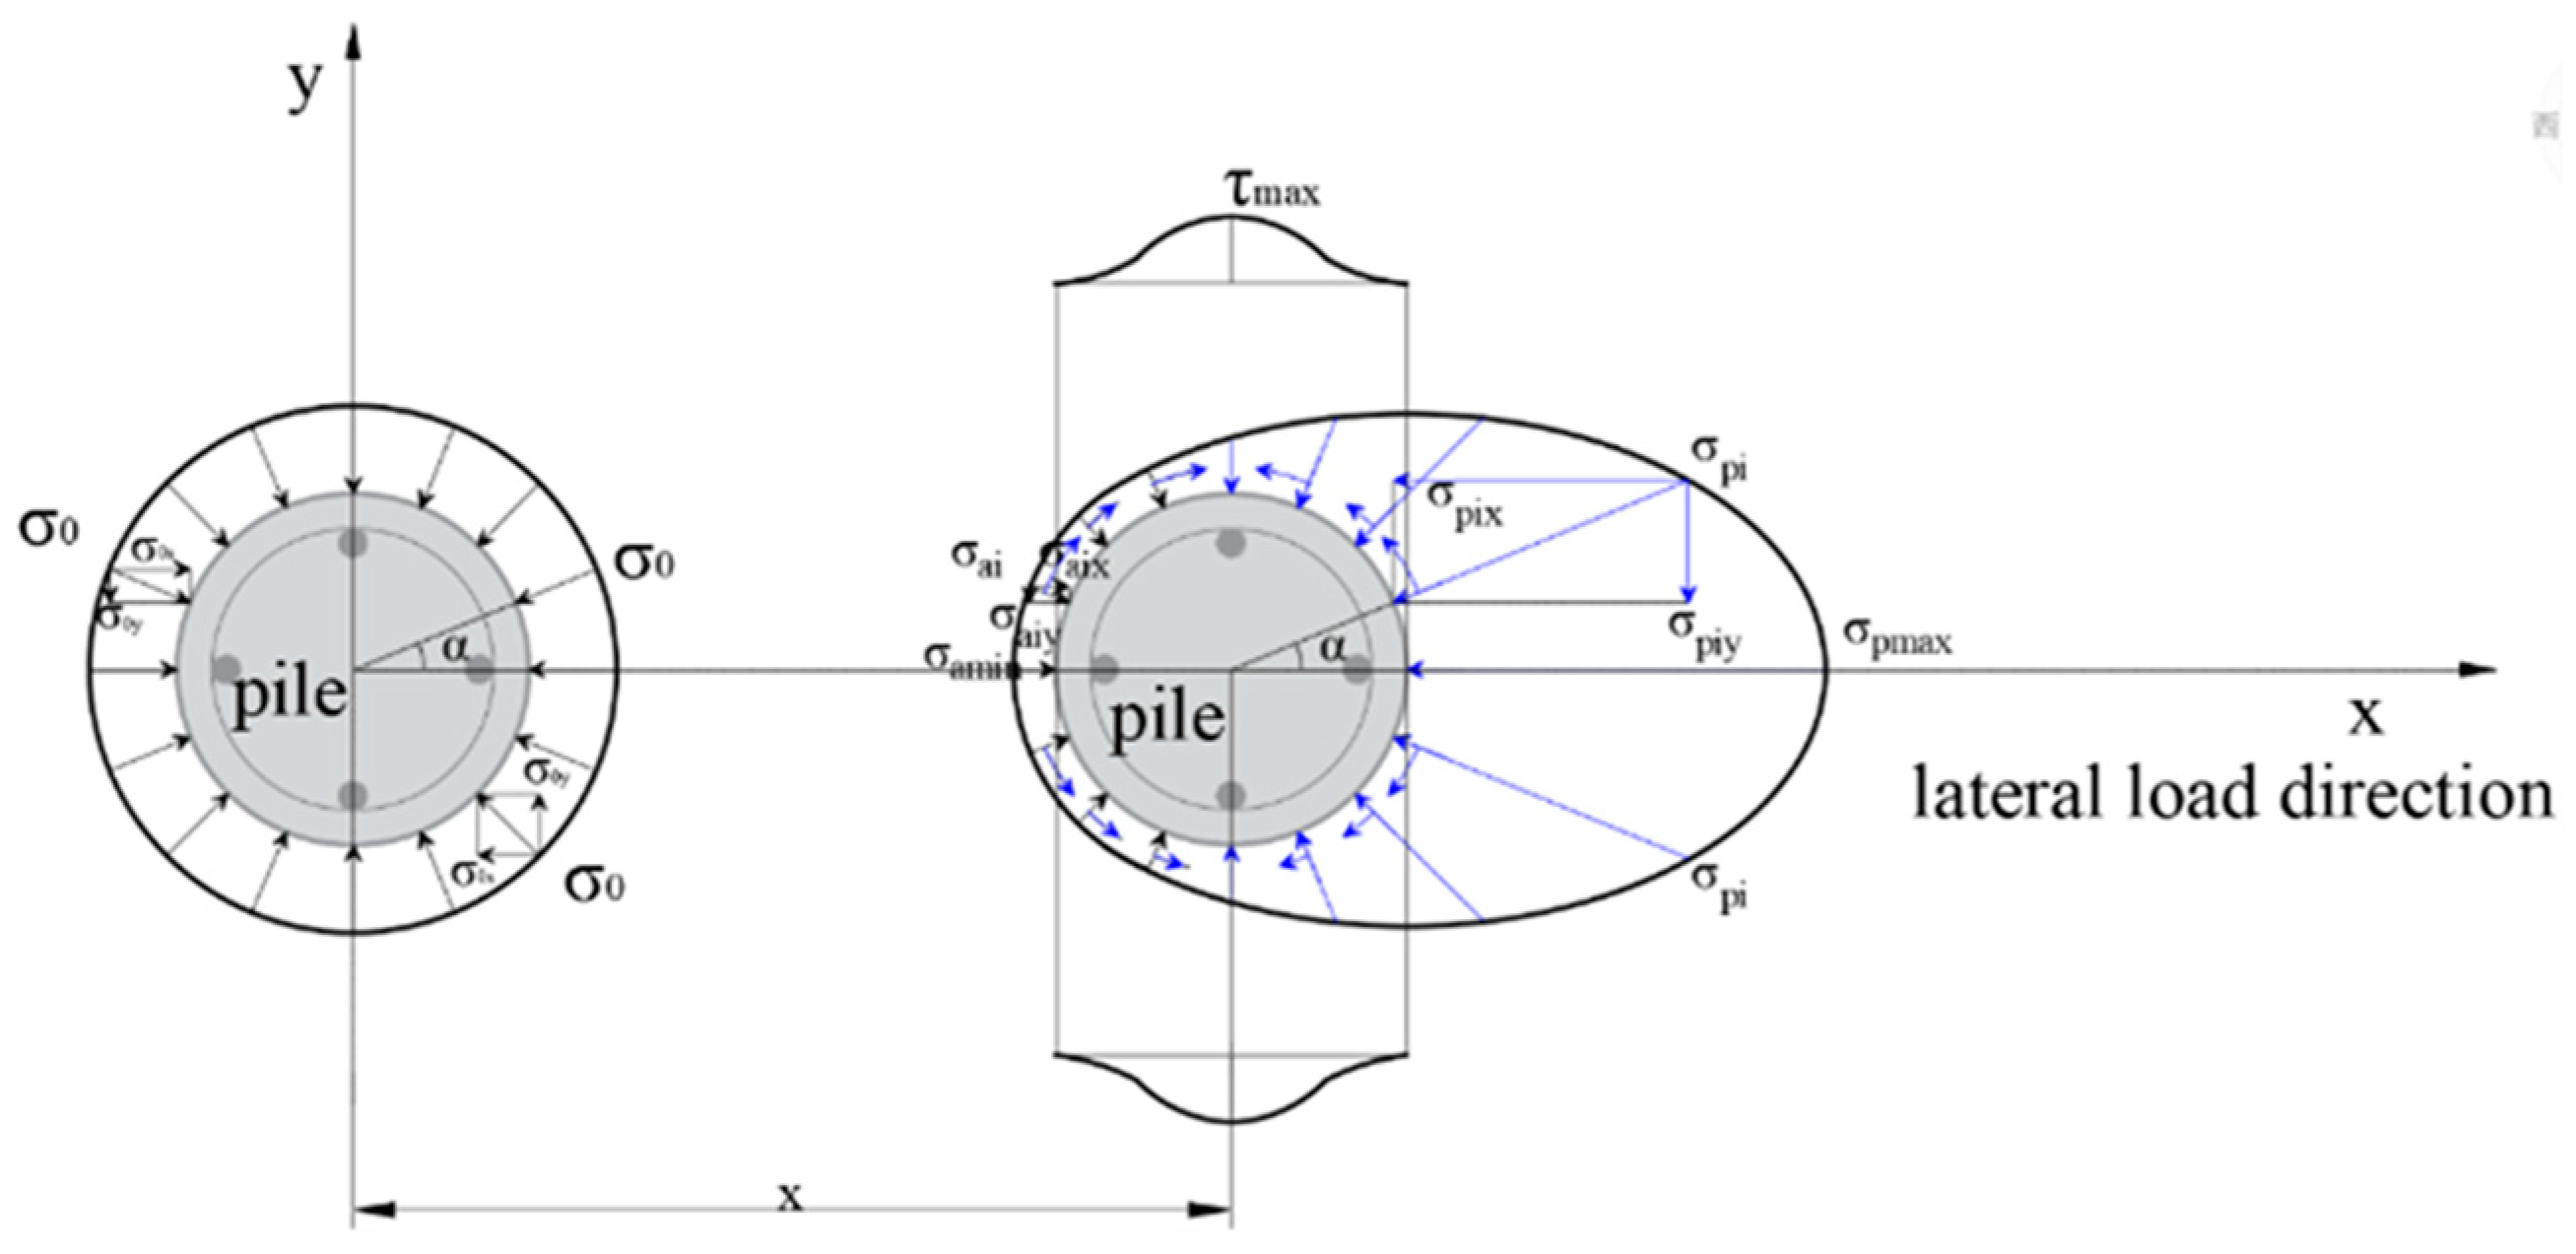
Figure 9.
(a) Net reaction distribution of soil in front of pile # 1; (b) Net reaction distribution of soil in front of pile No. 2; (c) Net reaction distribution of soil in front of pile No. 5; (d) Net reaction distribution of soil in front of single pile test pile.
Figure 9.
(a) Net reaction distribution of soil in front of pile # 1; (b) Net reaction distribution of soil in front of pile No. 2; (c) Net reaction distribution of soil in front of pile No. 5; (d) Net reaction distribution of soil in front of single pile test pile.
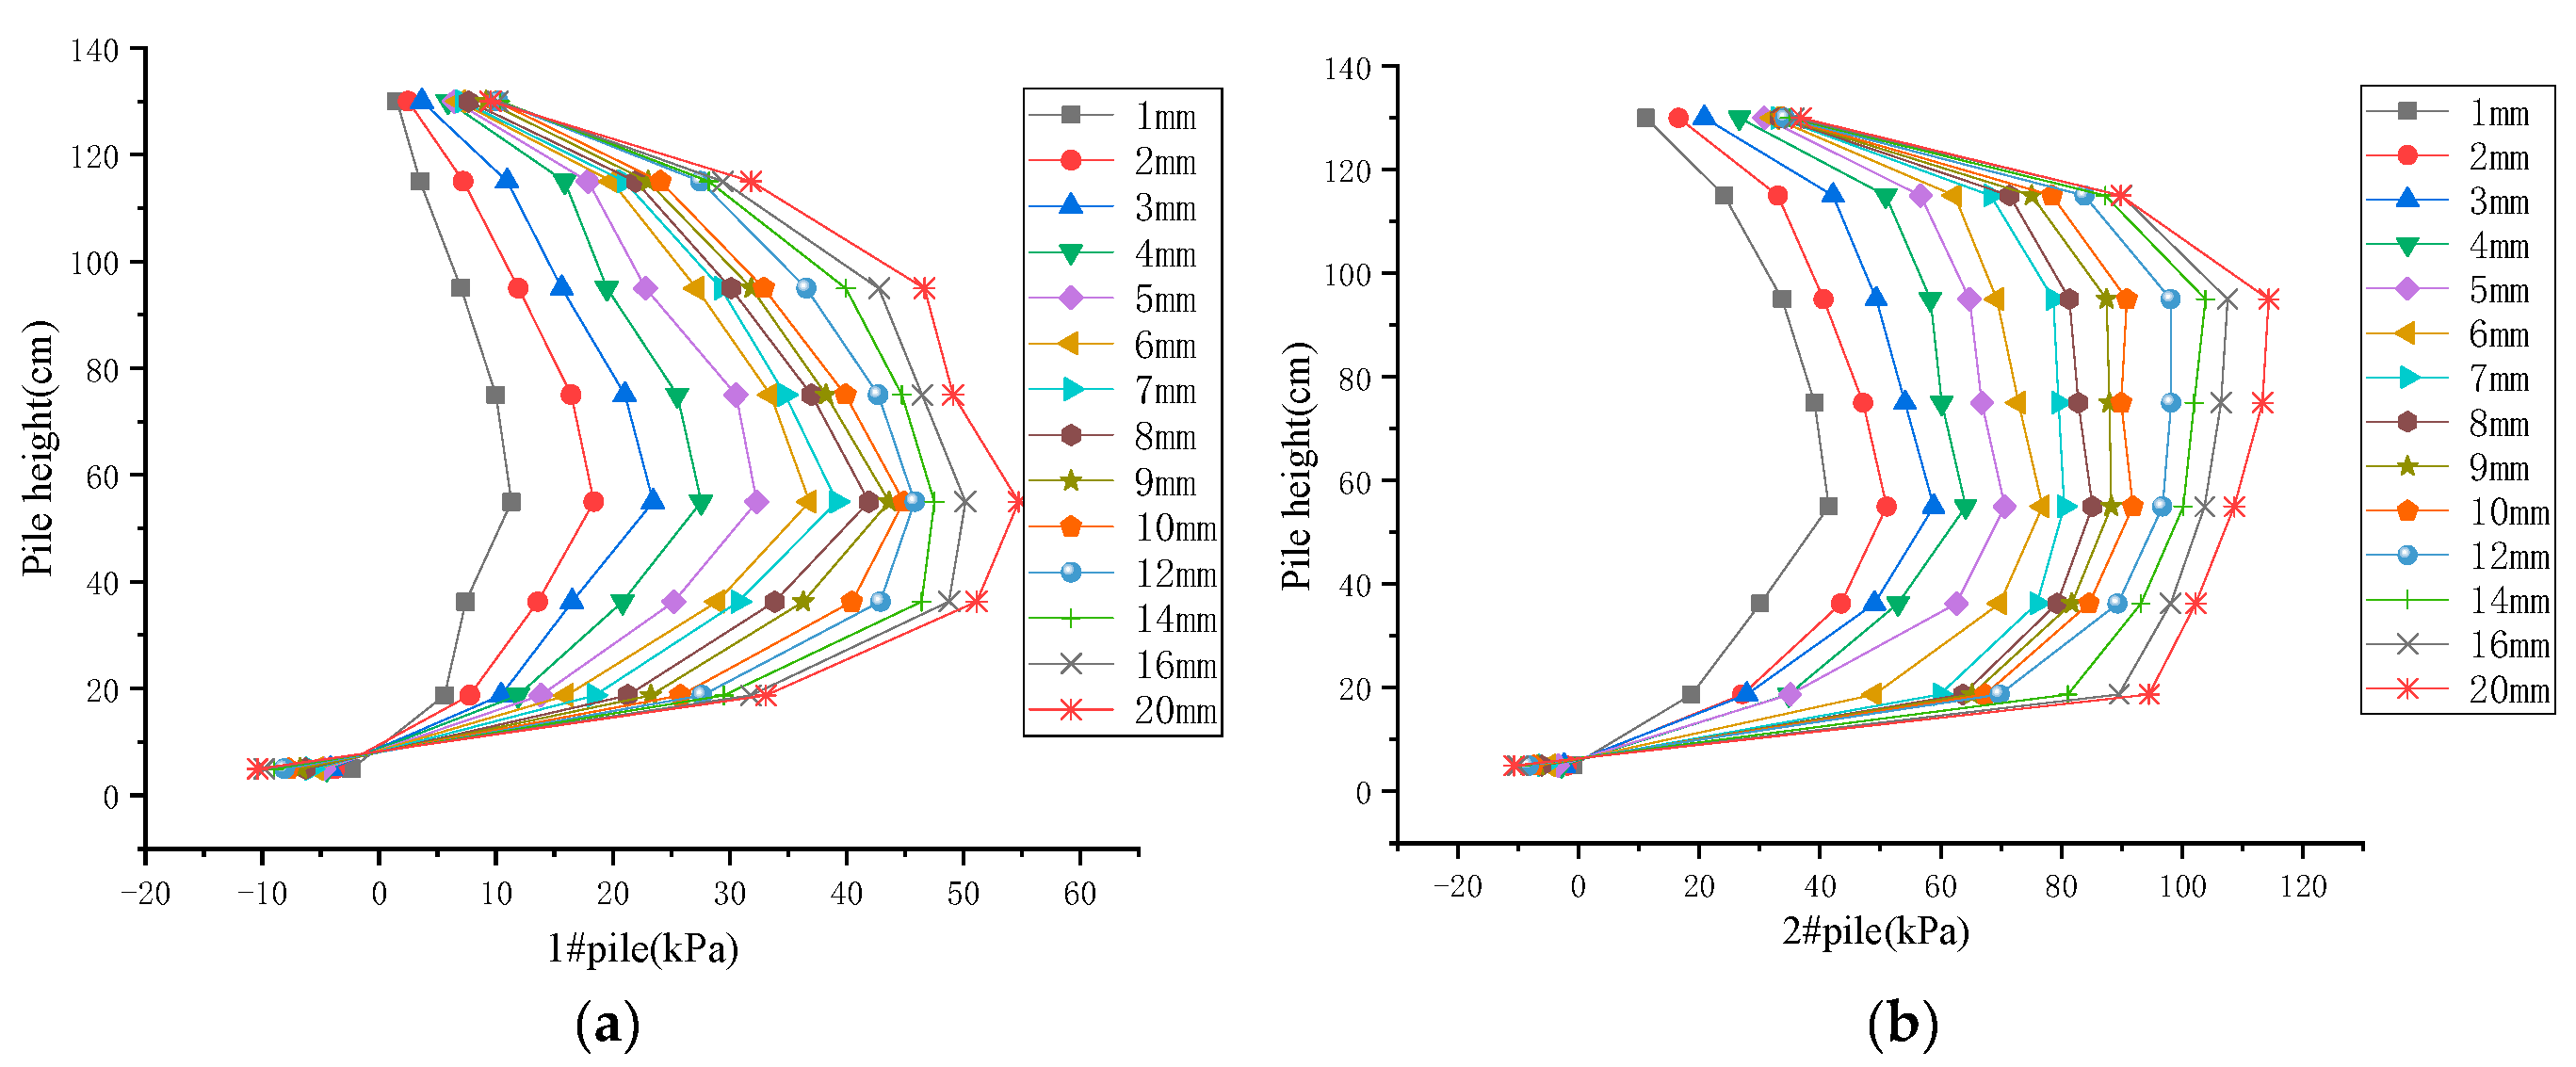
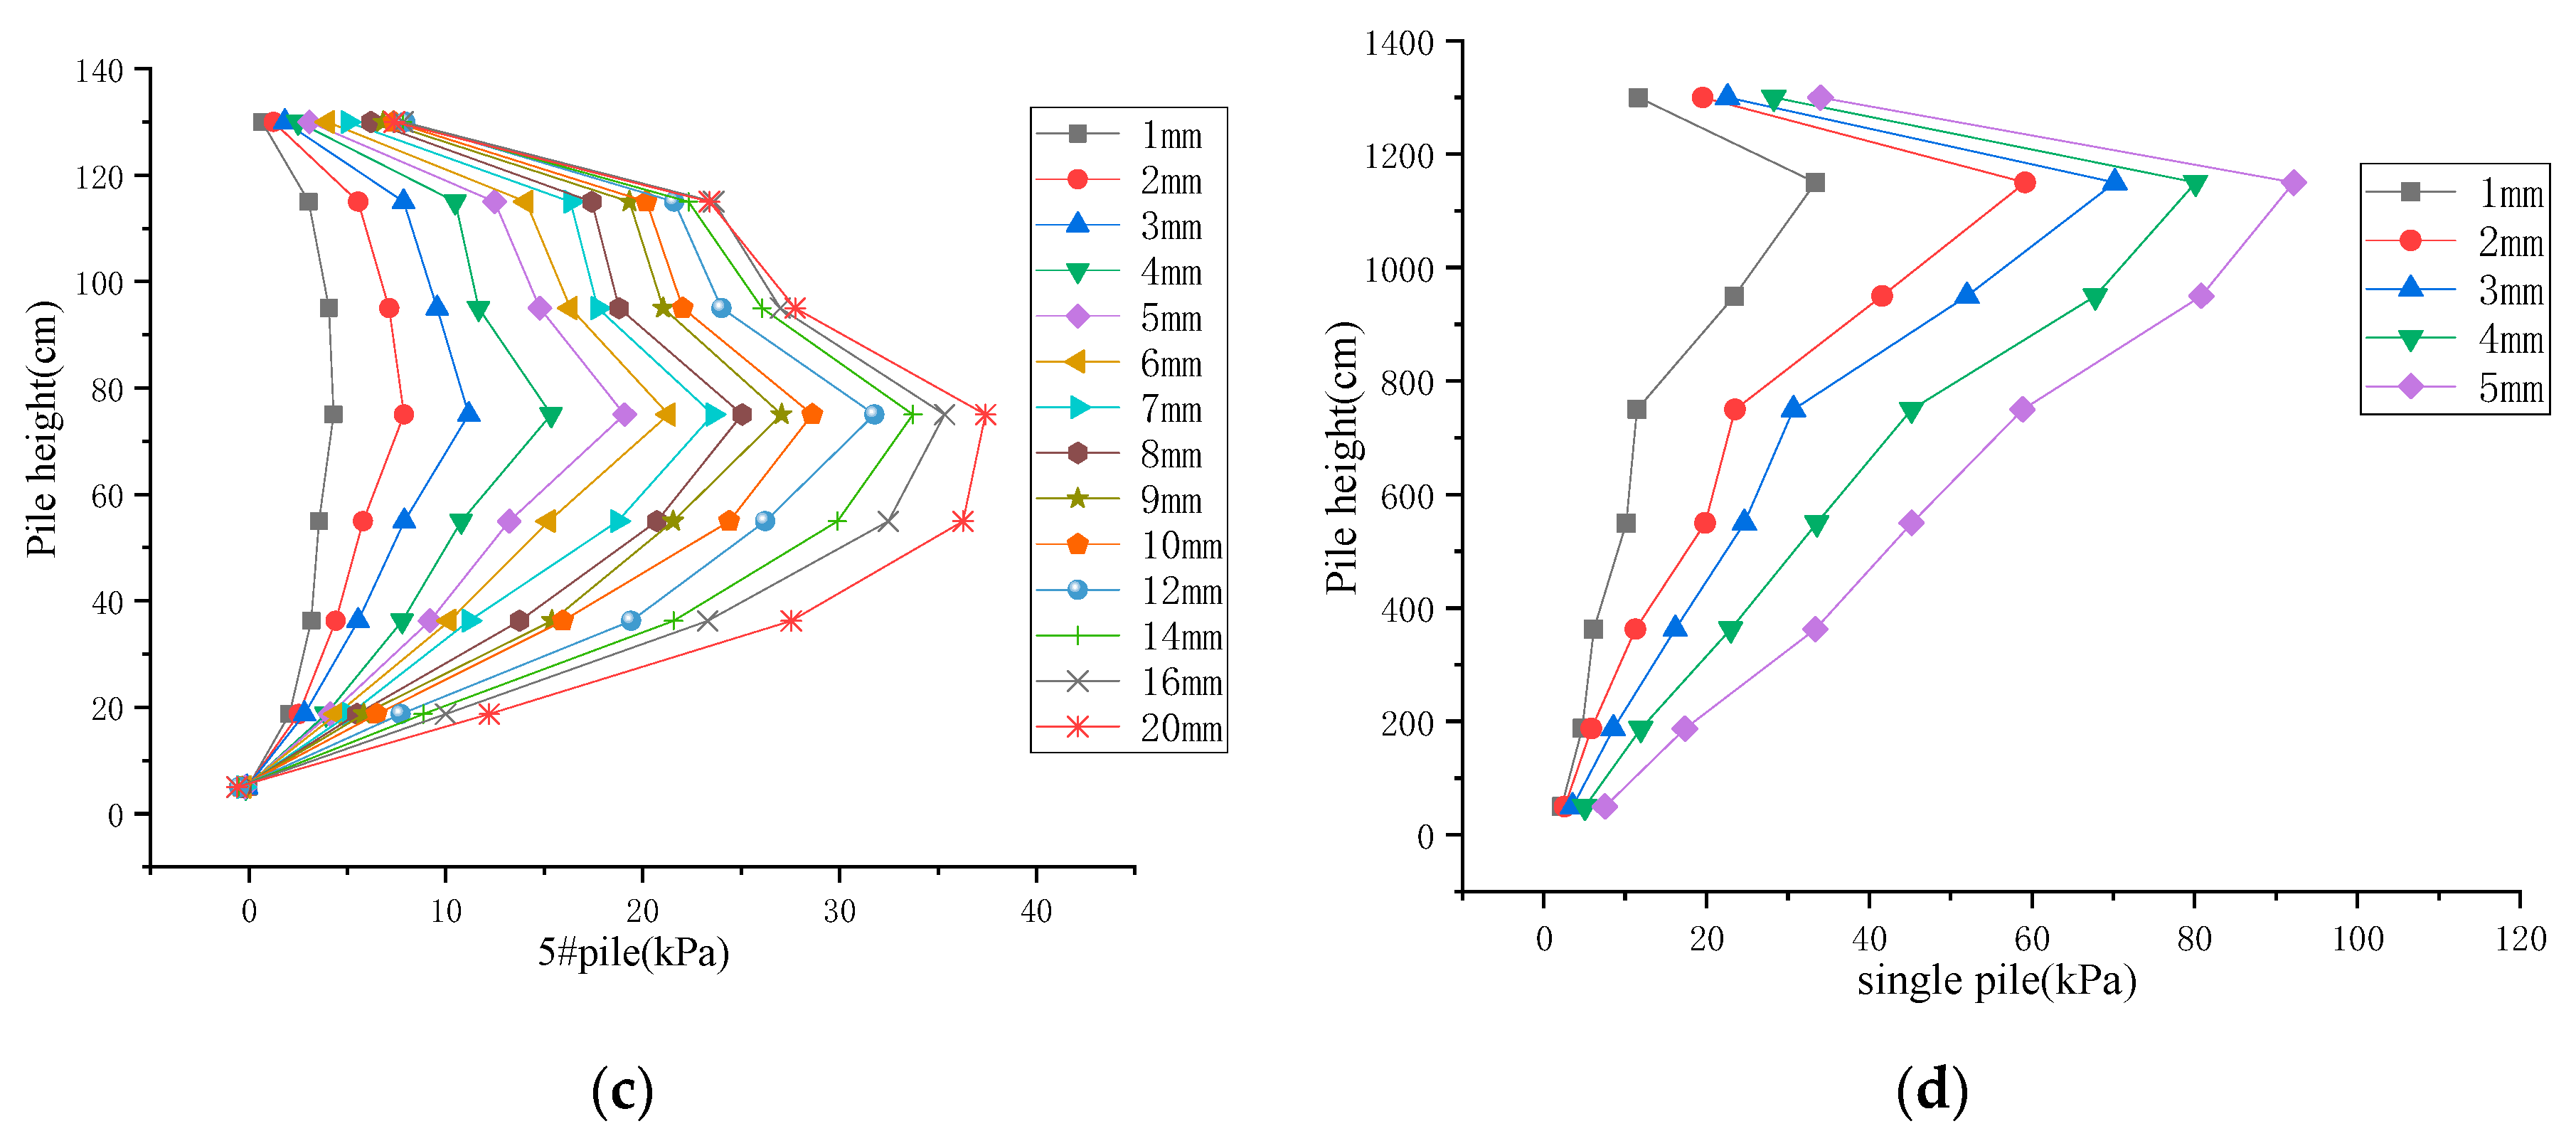
Figure 10.
Schematic diagram of pile group effect analysis of group Pile foundation.
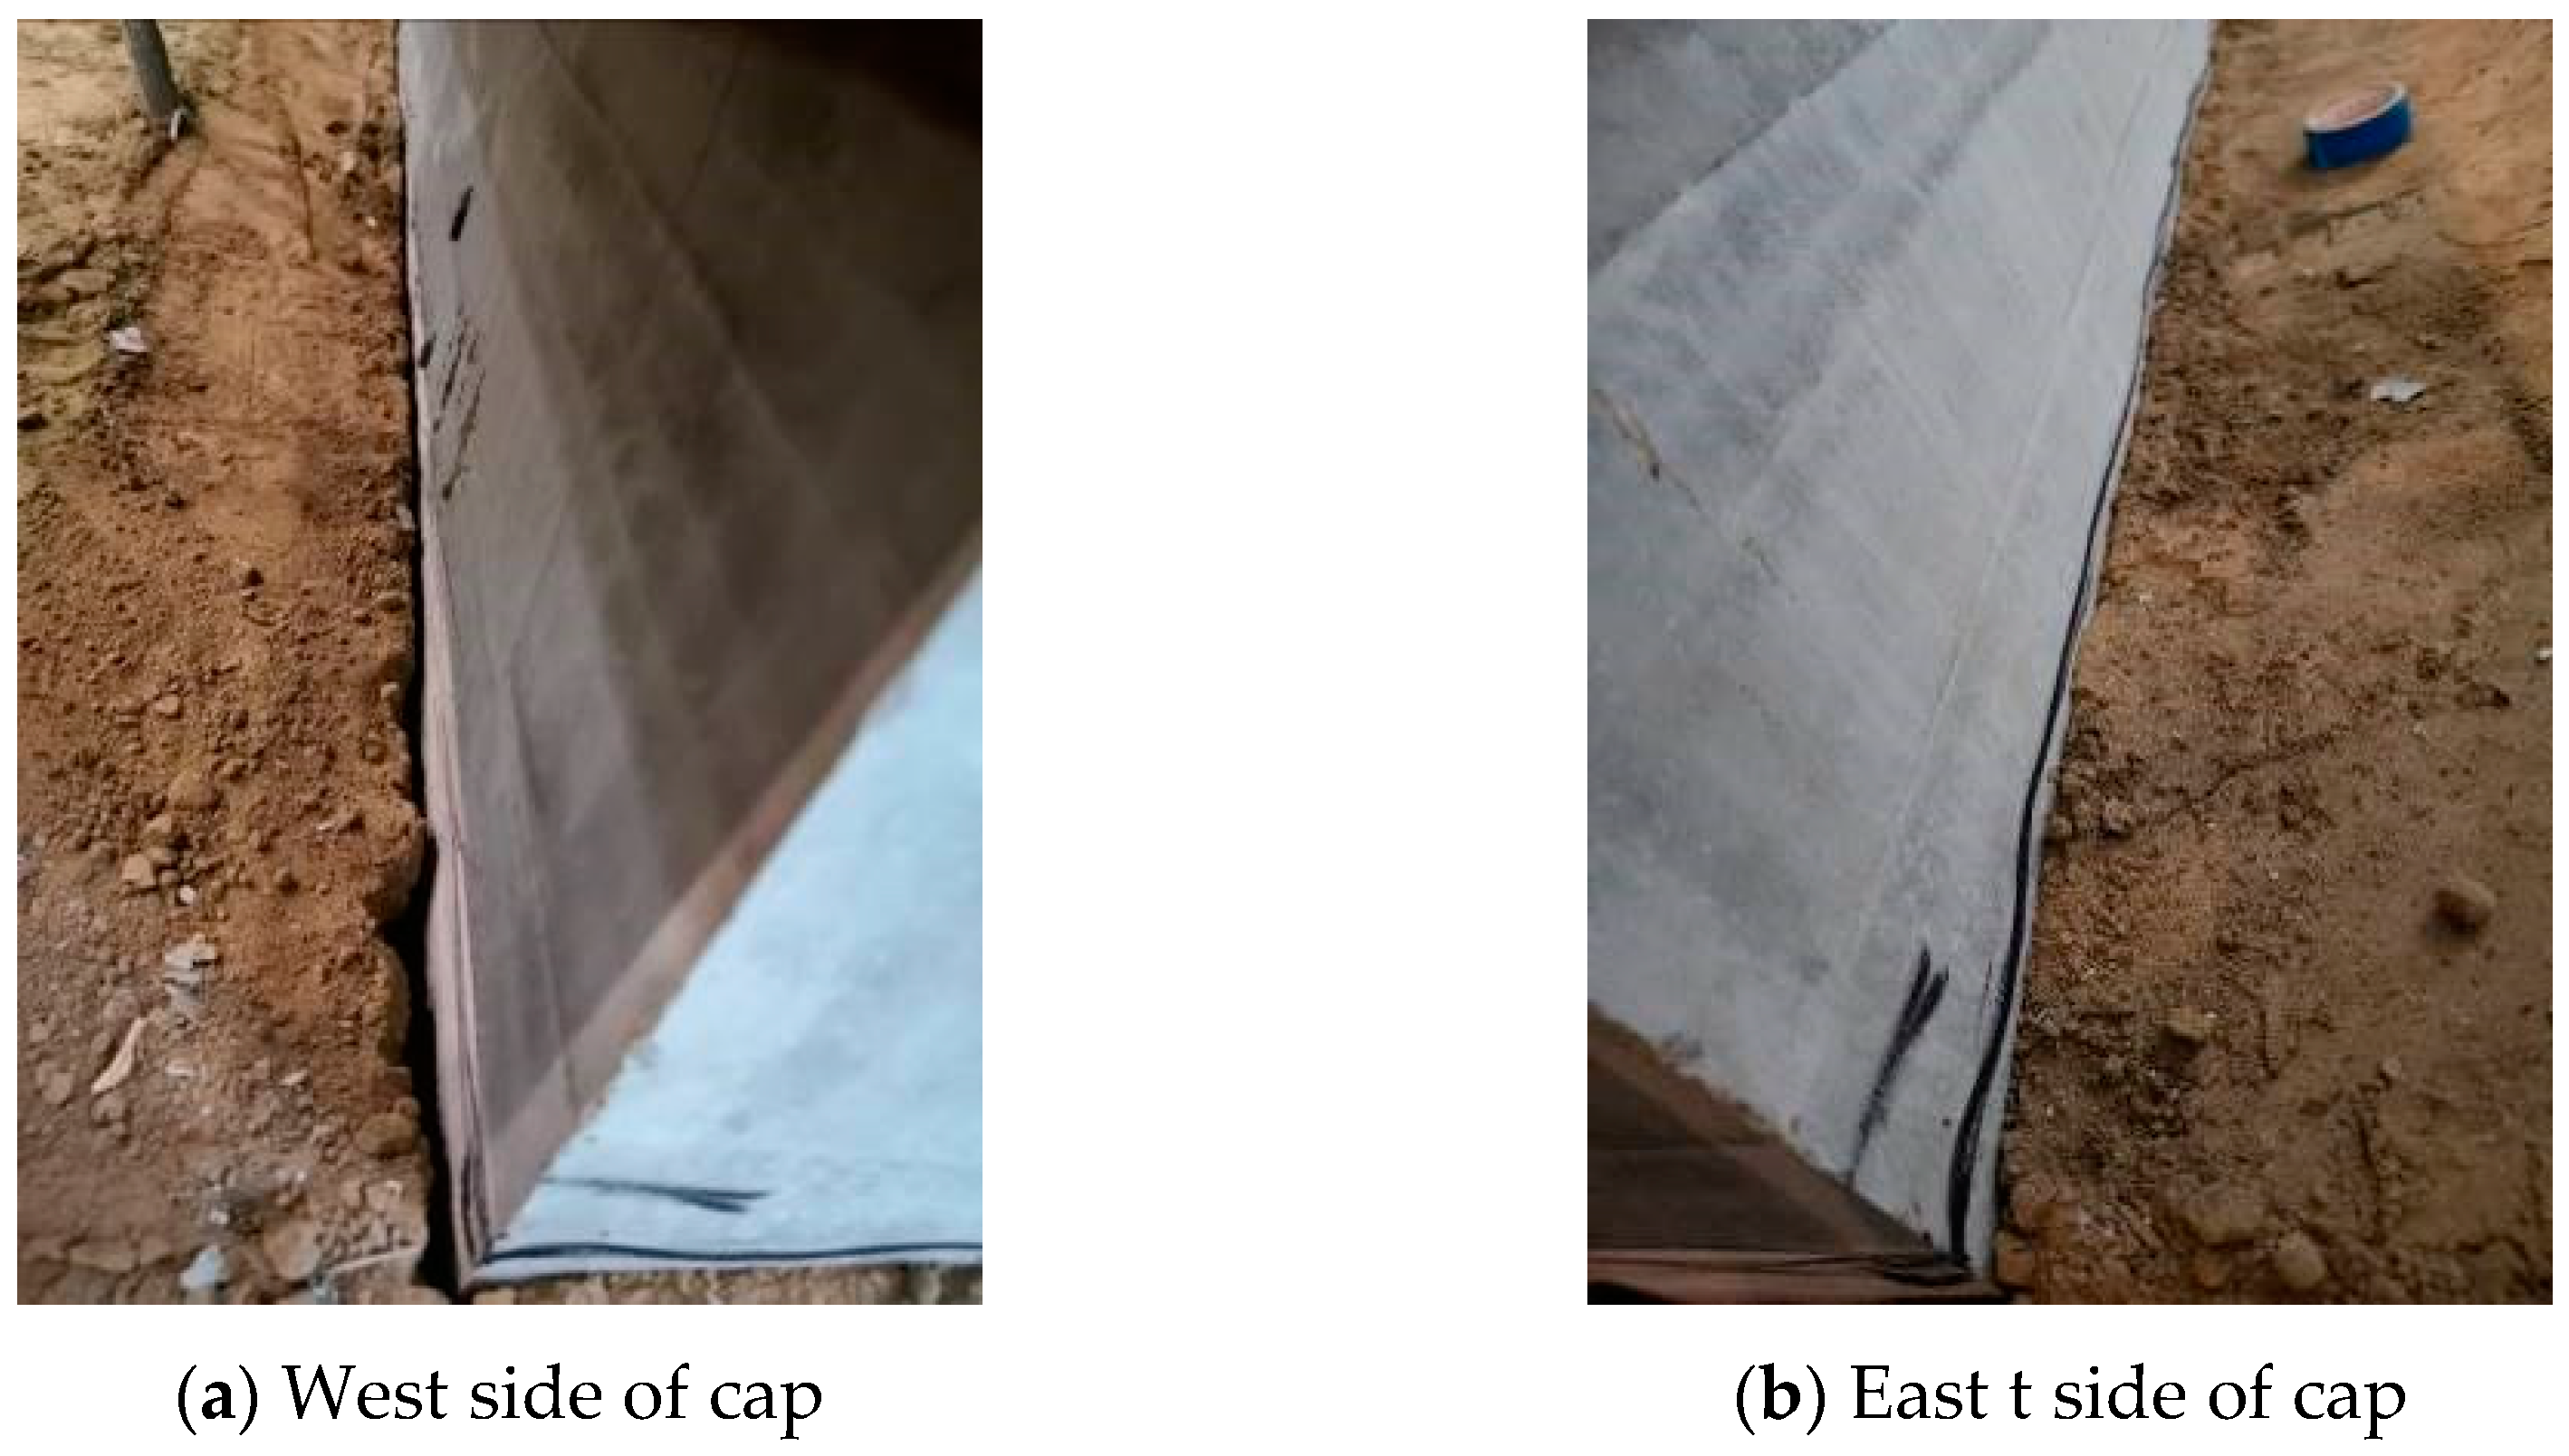
Figure 11.
2#p-y curves.
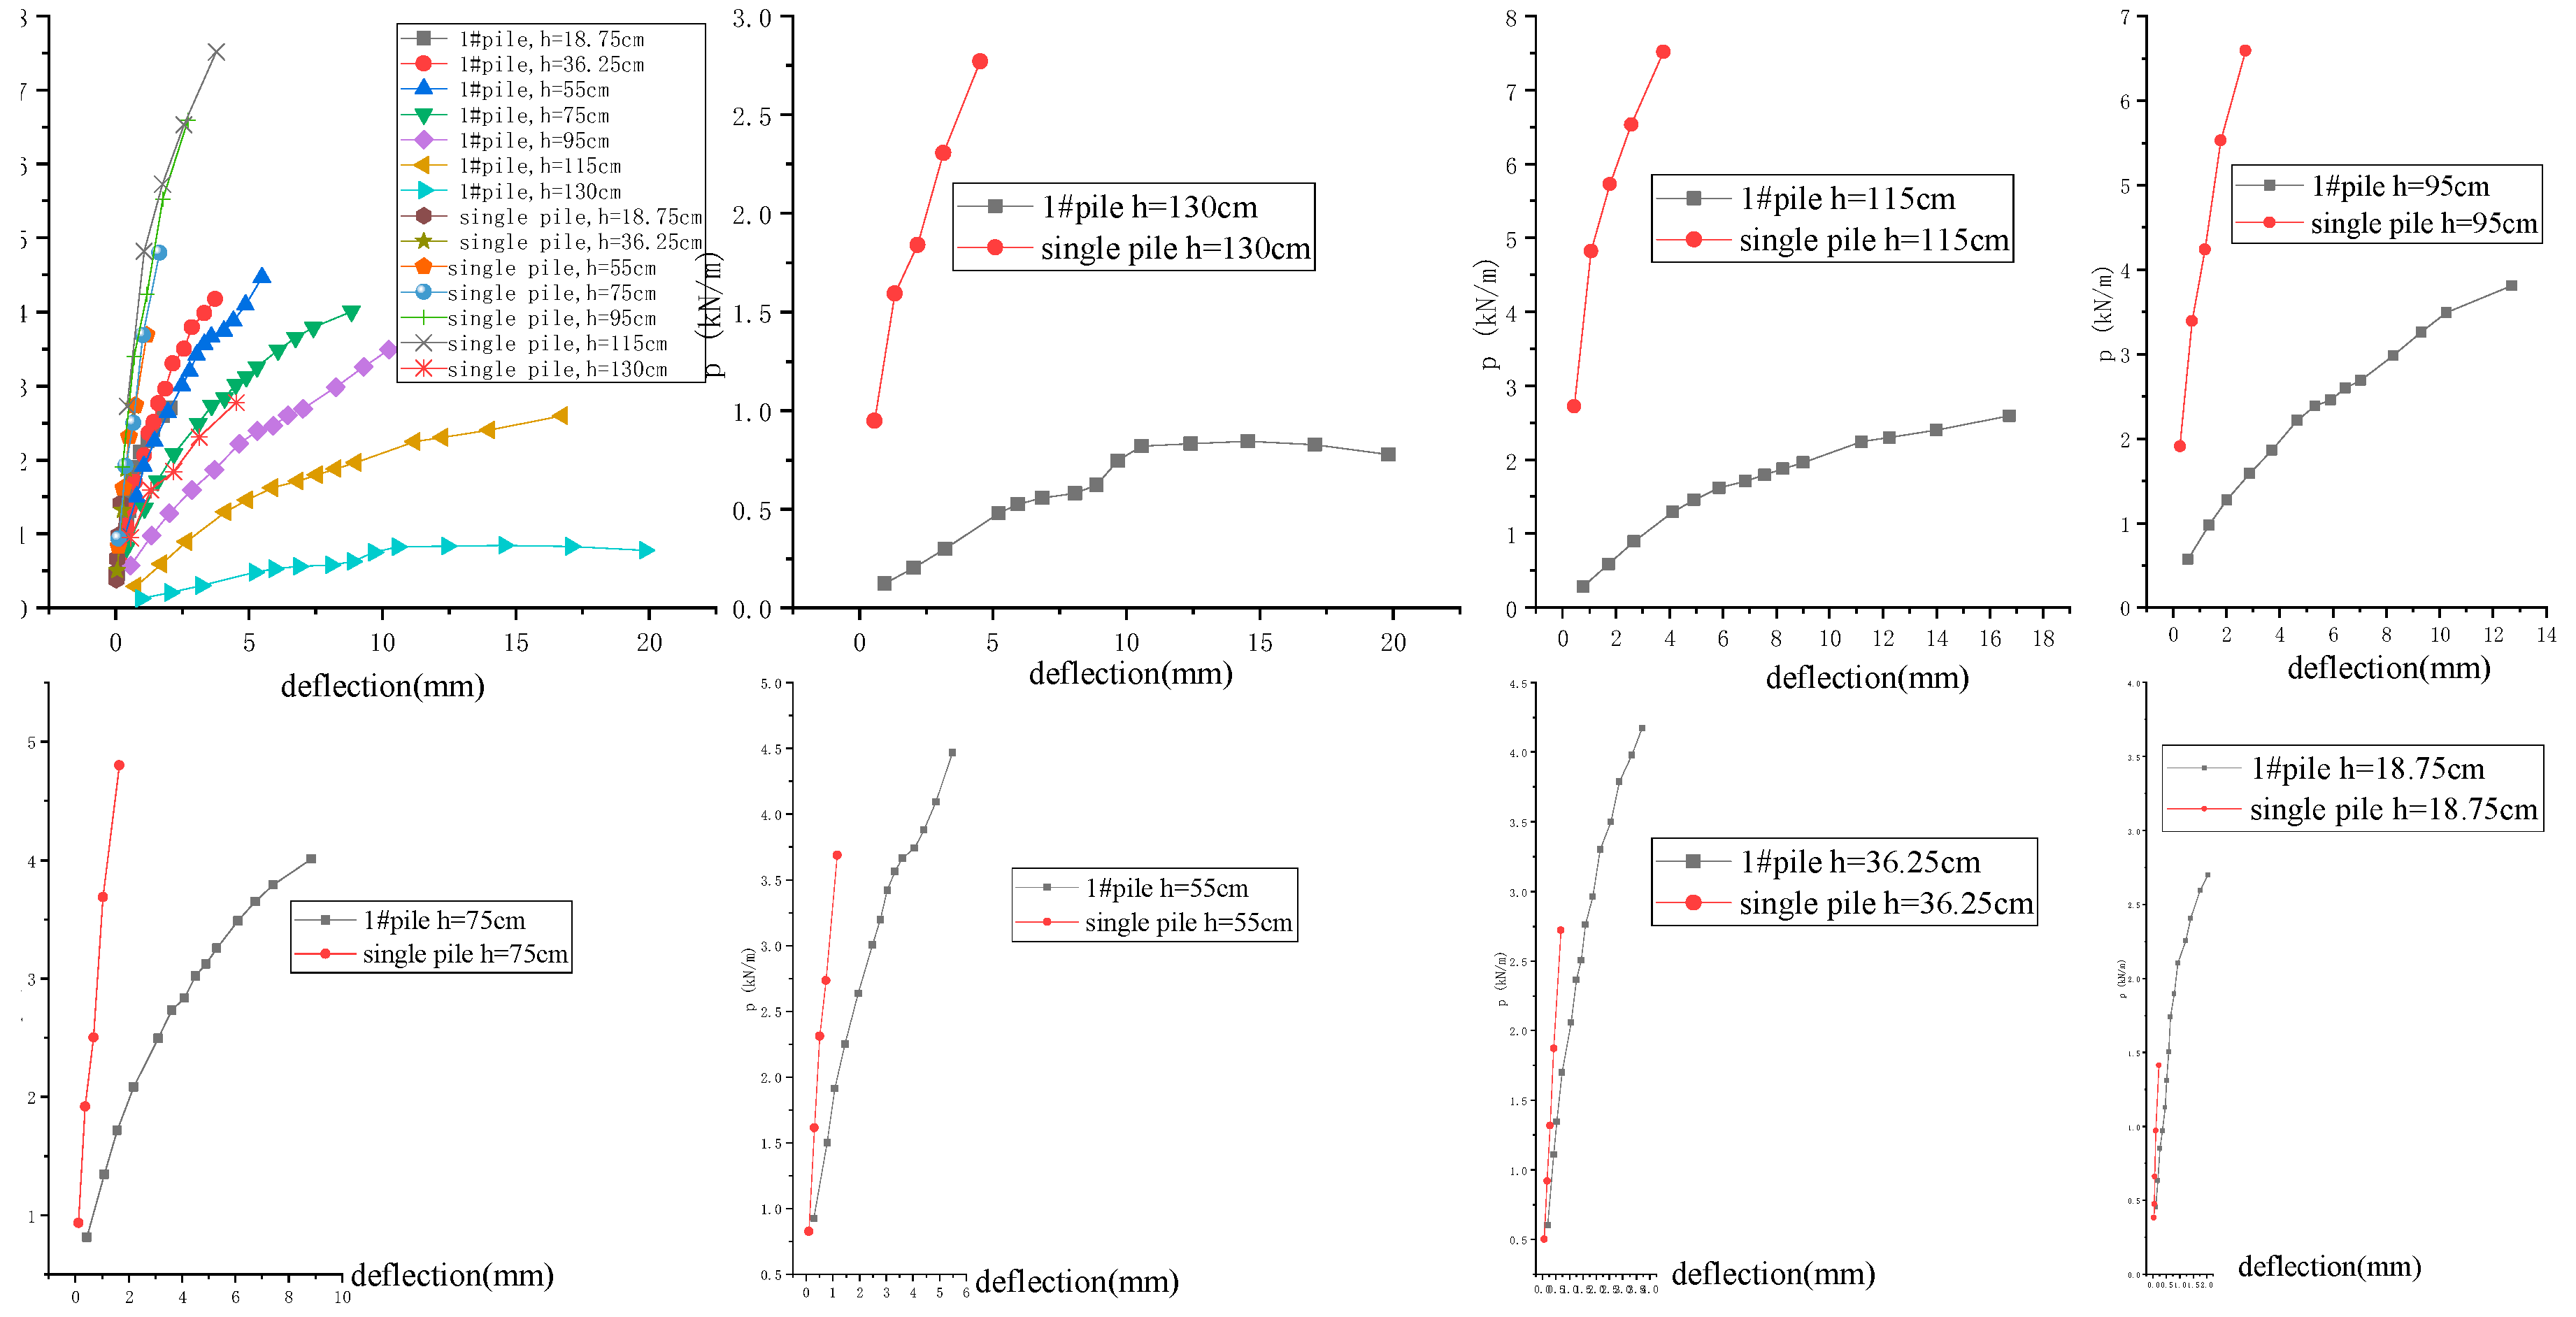
Figure 12.
2#p-y curves.
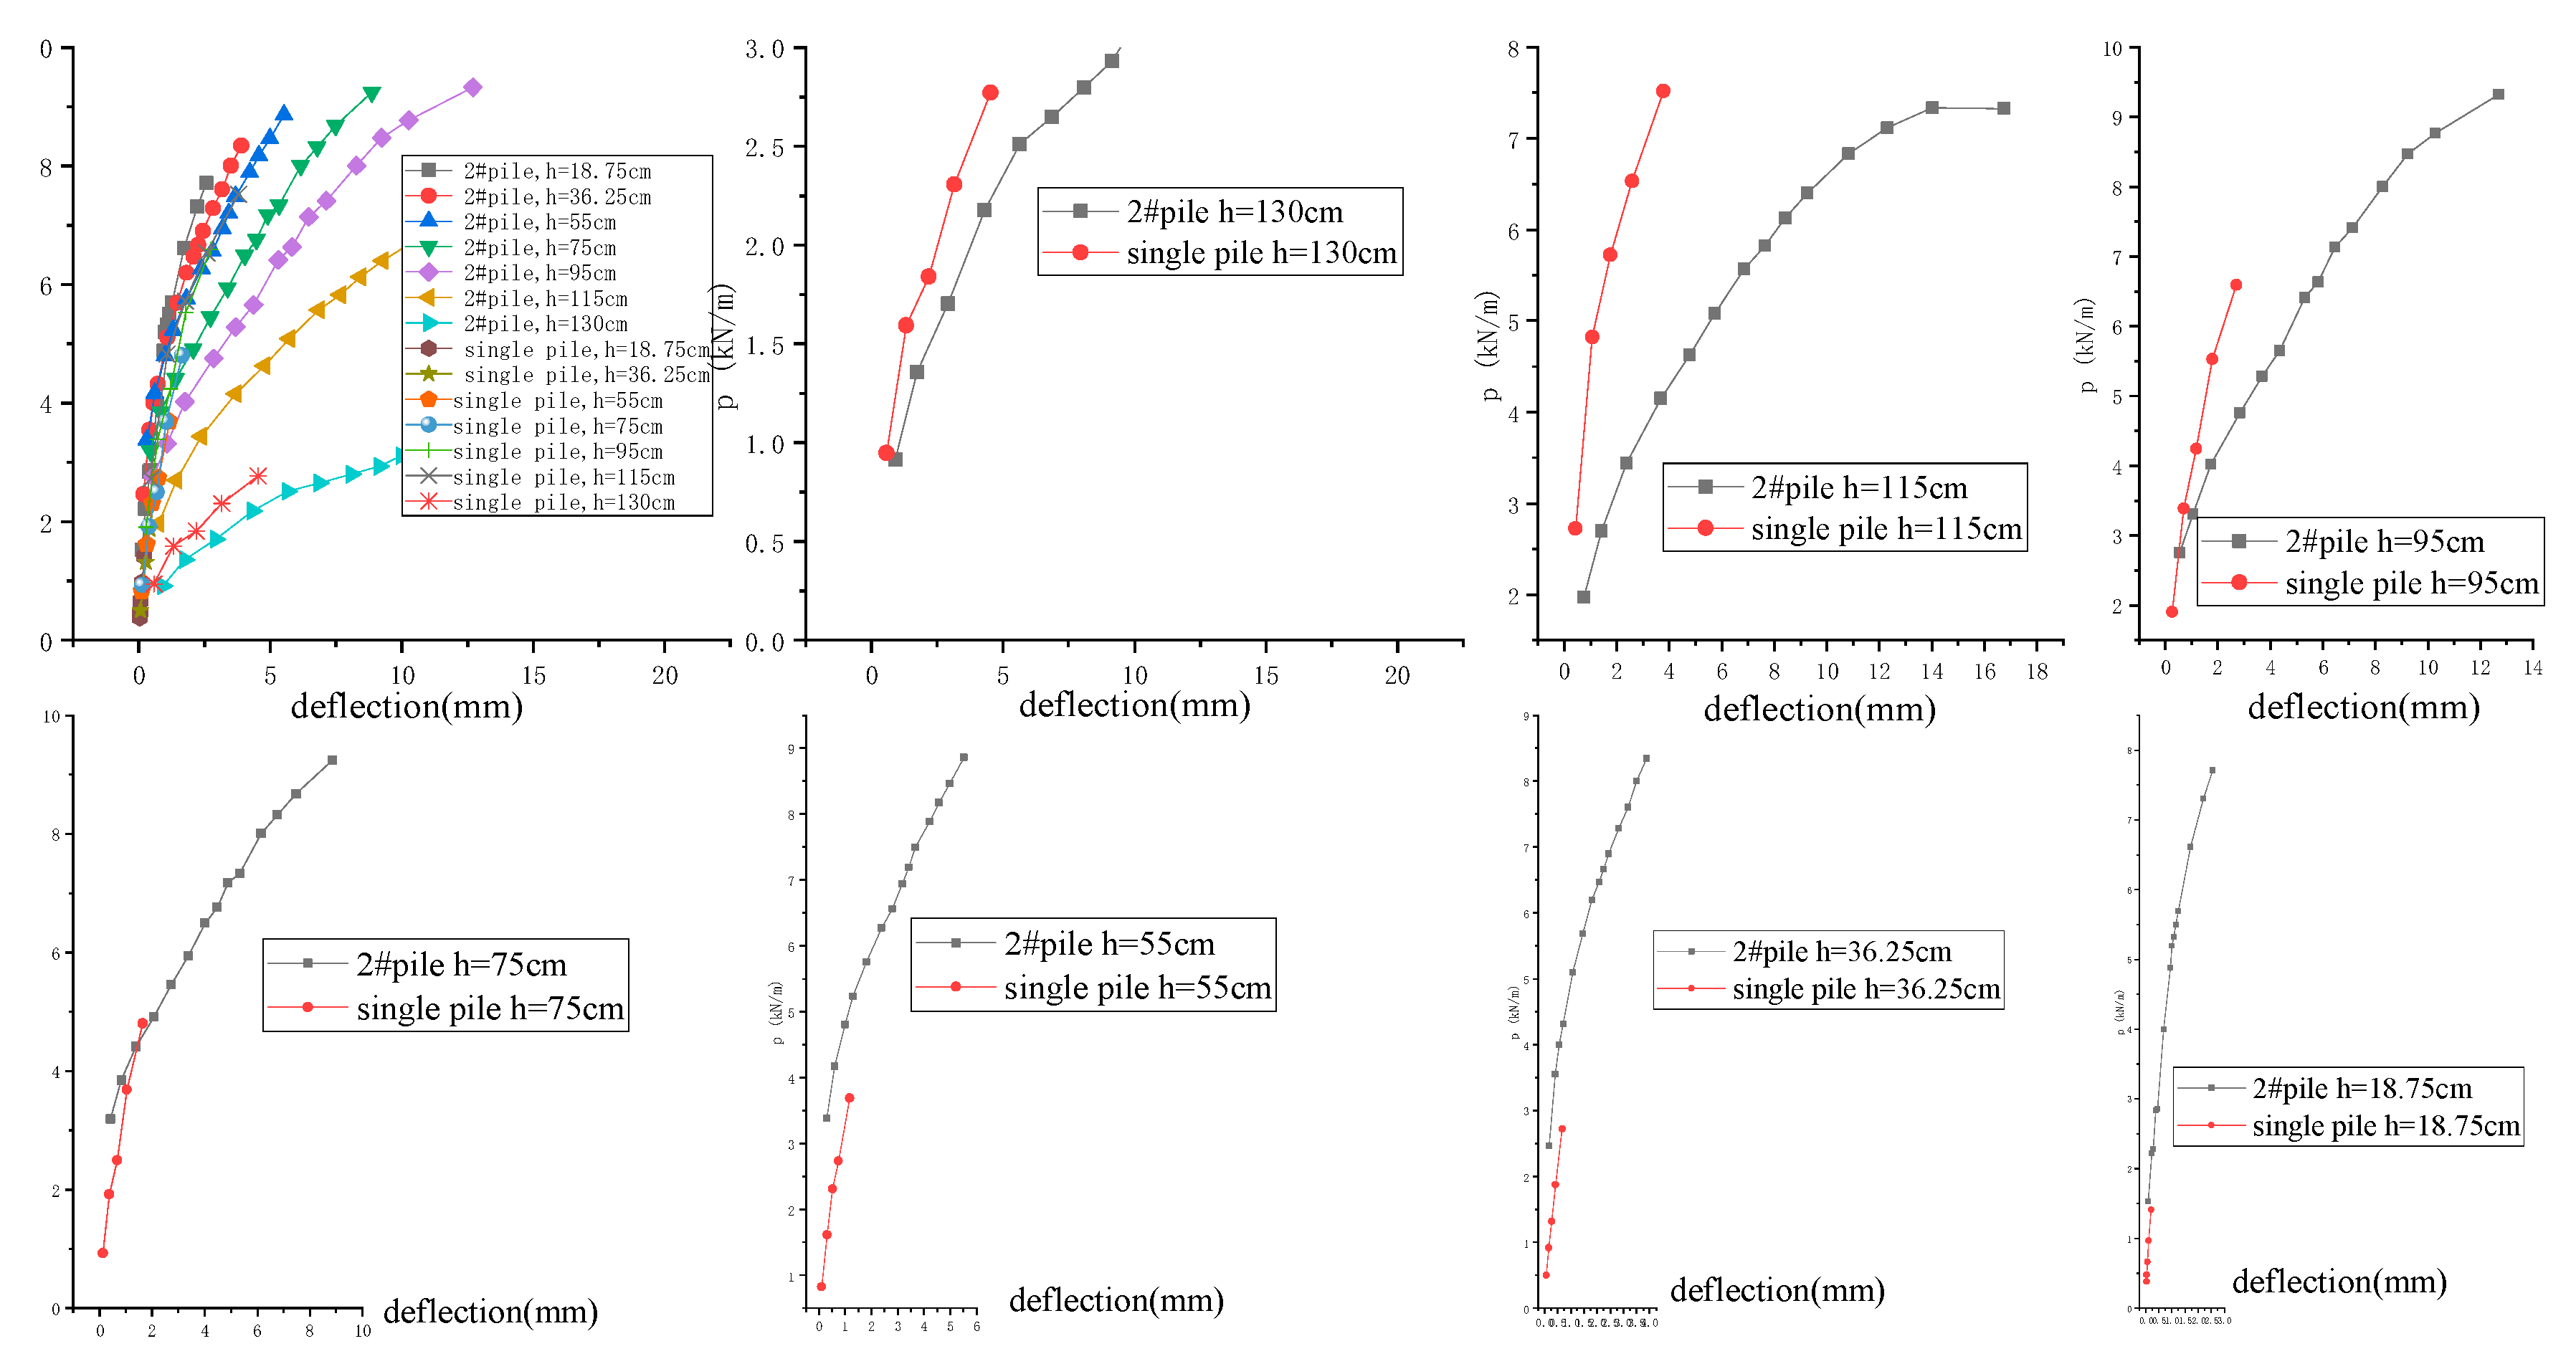
Figure 13.
2#p-y curves.
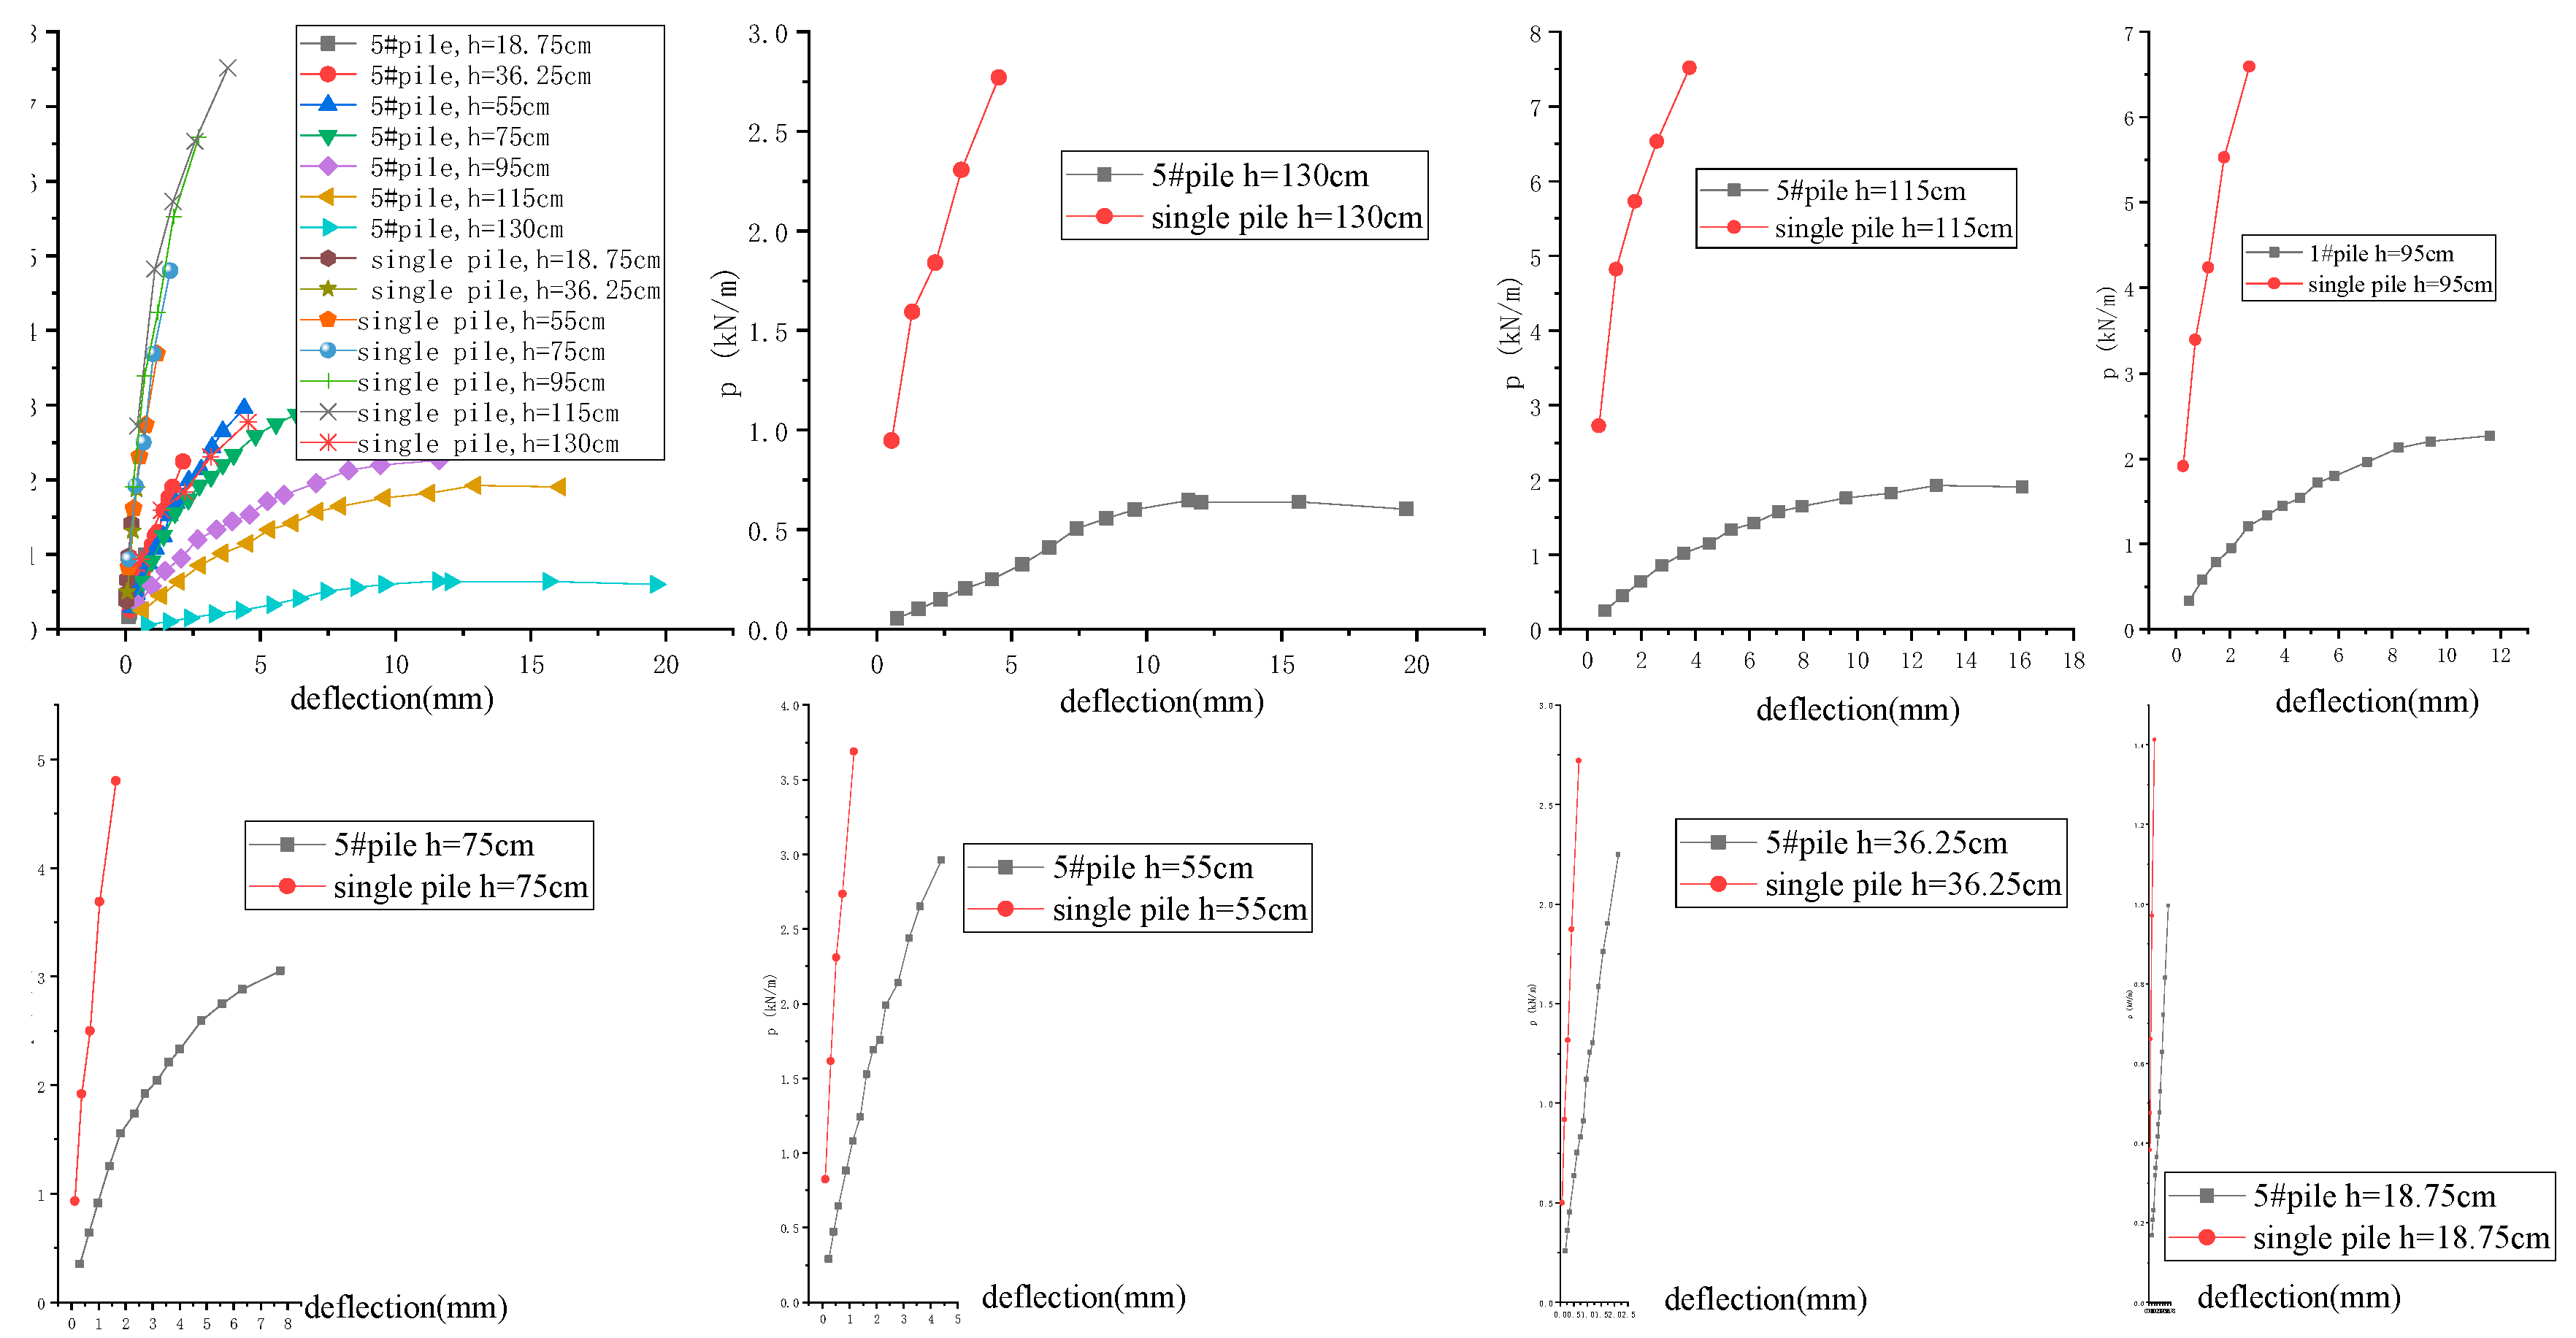
Figure 14.
Calculation results of coefficient of subgrade reaction.
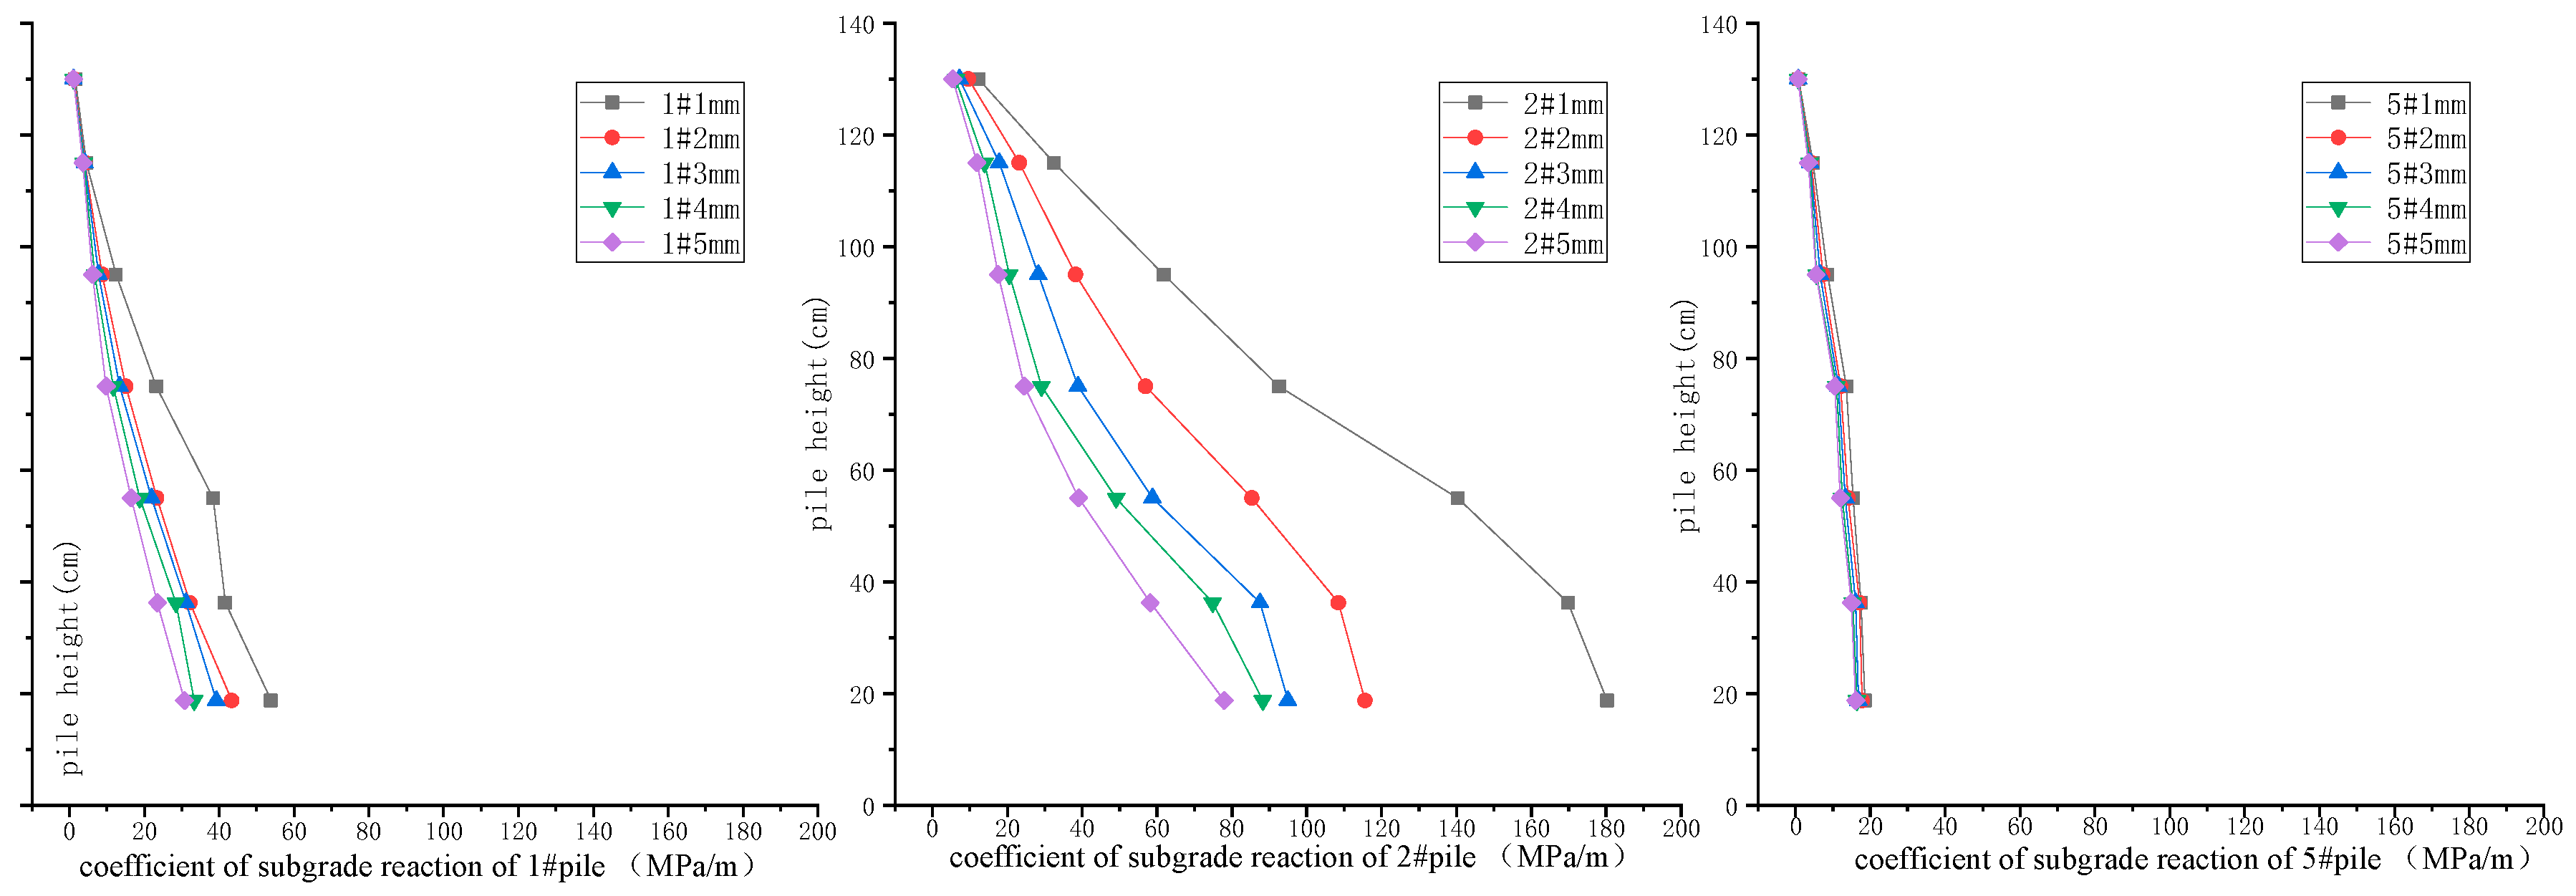
Figure 15.
Comparison of calculation results of each pile foundation bed coefficient.
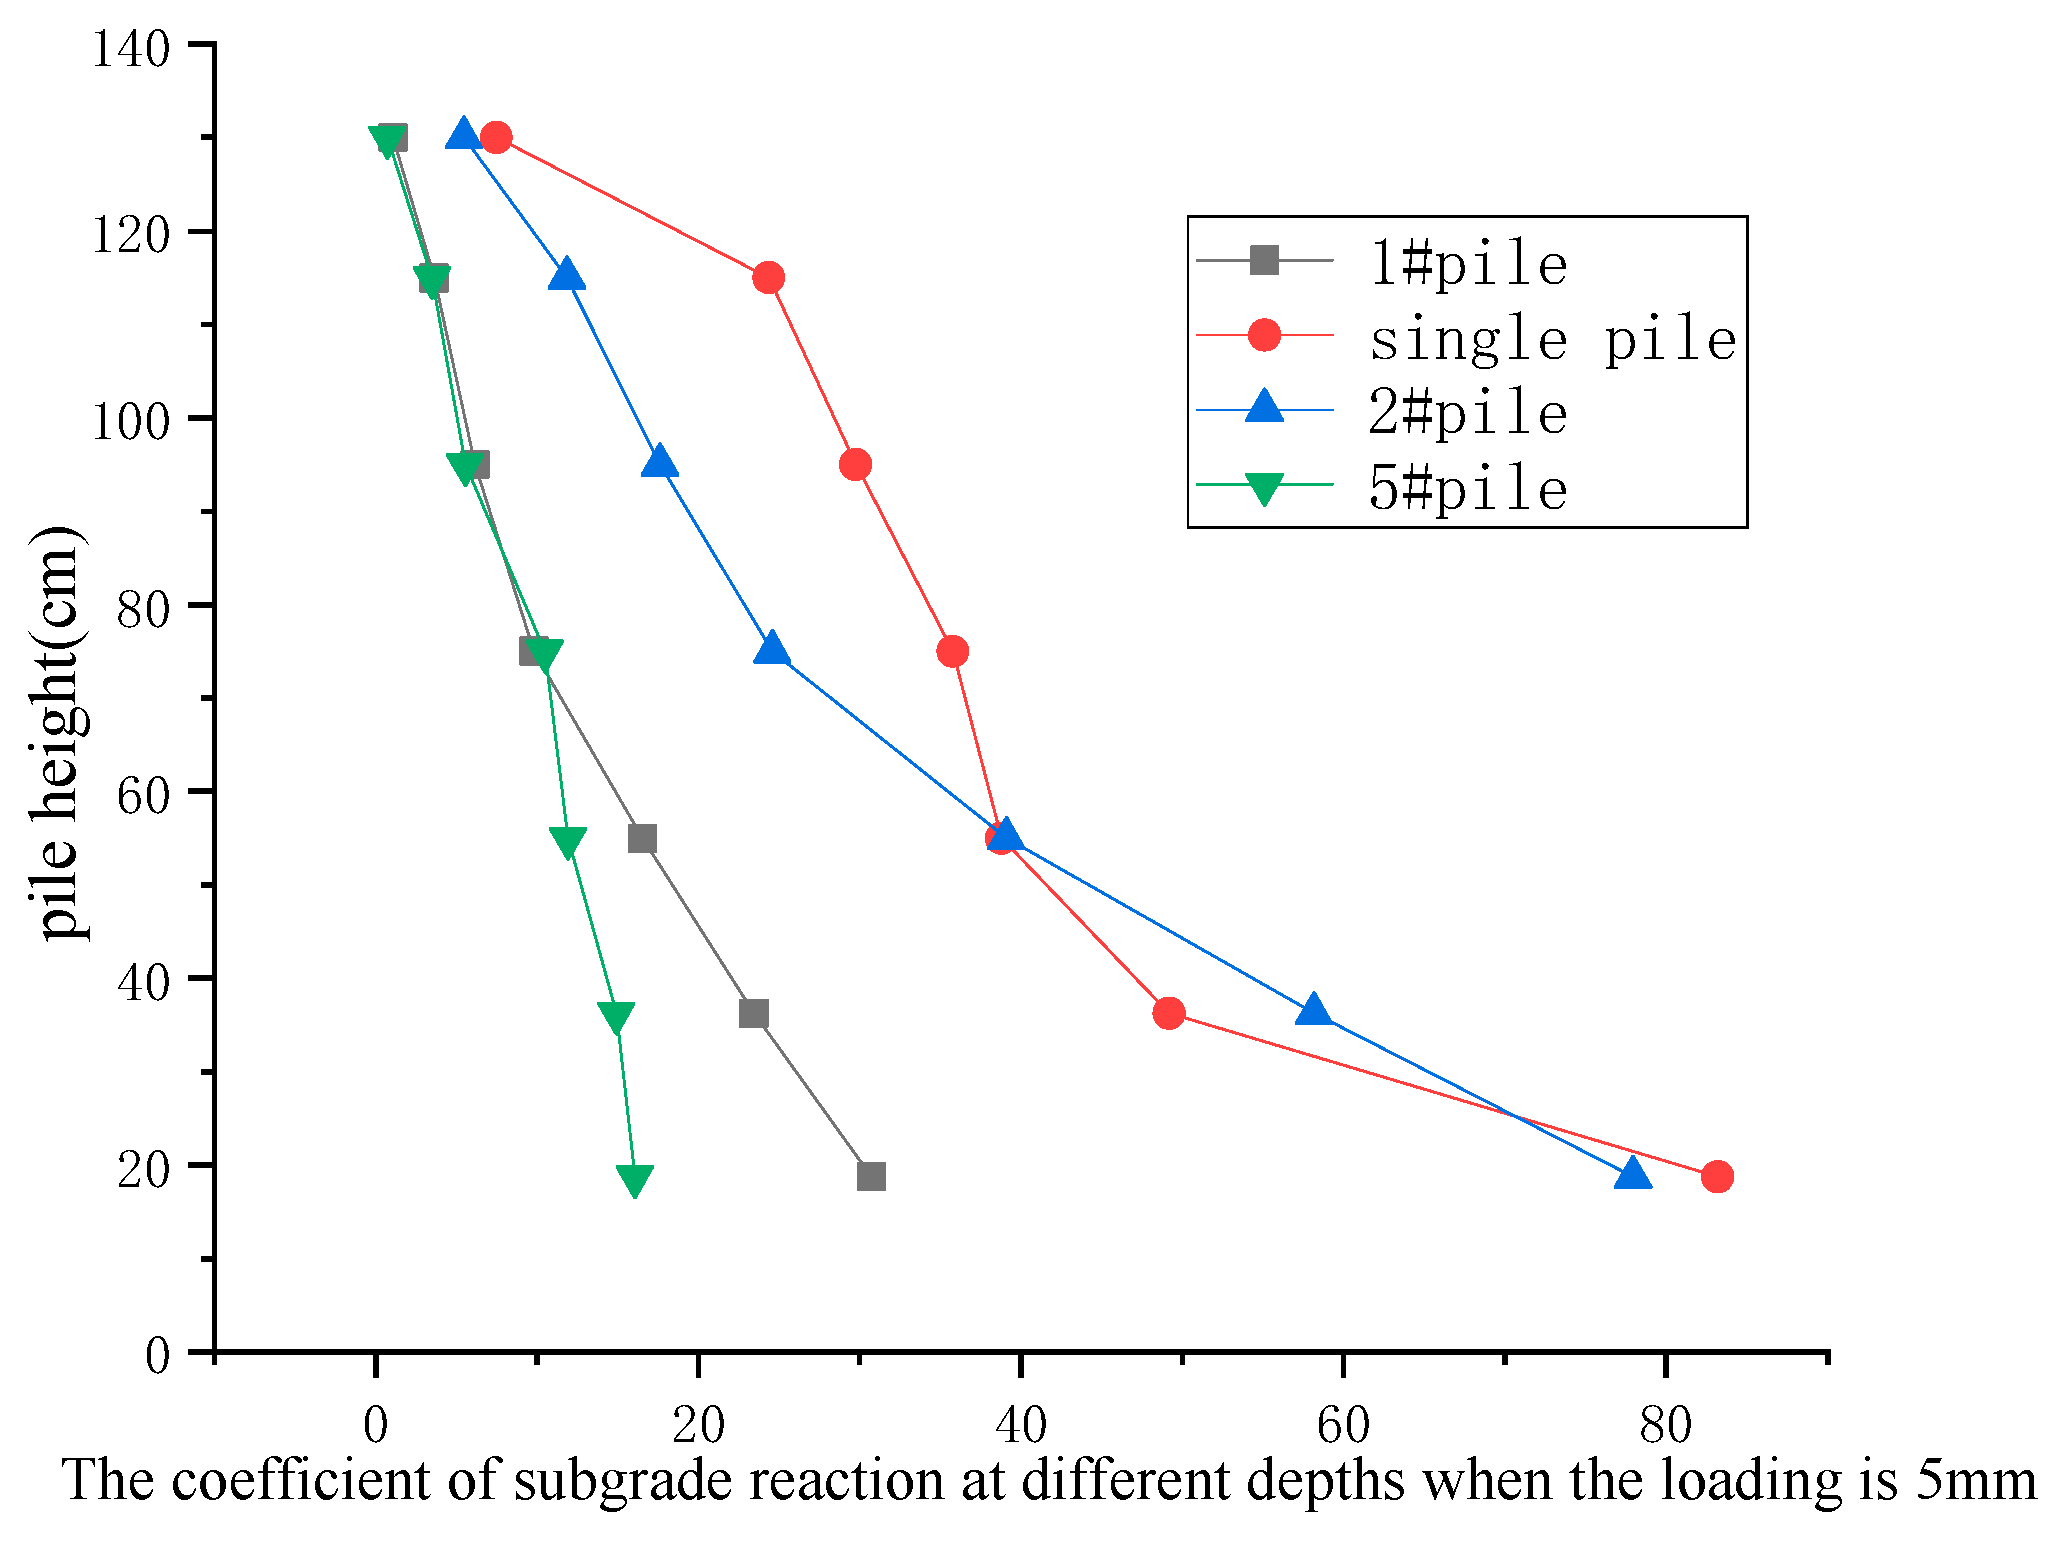

Table 1.
Main physical and mechanical parameters of test clay.
| Gs | ω /(%) |
ρ /( kg·m-3) |
ρd /(kg·m-3) |
e | φ /(°) |
c /(kPa) |
E0 /(kPa) |
|---|---|---|---|---|---|---|---|
| 2.73 | 14.88 | 1720 | 1490 | 0.83 | 19.40 | 15 | 13290 |
Disclaimer/Publisher’s Note: The statements, opinions and data contained in all publications are solely those of the individual author(s) and contributor(s) and not of MDPI and/or the editor(s). MDPI and/or the editor(s) disclaim responsibility for any injury to people or property resulting from any ideas, methods, instructions or products referred to in the content. |
© 2023 by the authors. Licensee MDPI, Basel, Switzerland. This article is an open access article distributed under the terms and conditions of the Creative Commons Attribution (CC BY) license (http://creativecommons.org/licenses/by/4.0/).
Copyright: This open access article is published under a Creative Commons CC BY 4.0 license, which permit the free download, distribution, and reuse, provided that the author and preprint are cited in any reuse.


