
You are currently viewing a beta version of our website. If you spot anything unusual, kindly let us know.
Preprint
Article
A Comparative Study on Crystallisation for Virgin and Recycled Polyethylene Terephthalate (PET): Multiscale Effects on Physico-Mechanical Properties
Altmetrics
Downloads
203
Views
100
Comments
0
A peer-reviewed article of this preprint also exists.


Abstract
Polyethylene terephthalate (PET) is nowadays one of the most used polymers for packaging applications. Modifications induced by service conditions and the optimal mean to recycle this matter several times have to be perfectly understood to allow a reuse for similar application (from bottle to bottle for example). The present study aims to compare physico-chemical properties, crystalline organization, and mechanical behaviour of virgin (vPET) and recycled PET (rPET). Using different combined experimental methods (Calorimetry, Small Angle X-ray Scattering, Atomic Force Microscopy, DMA, and uni-axial tensile test), it has been proven that even if there is no change in the crystallinity of PET, the crystallisation process shows some differences (size and number of spherulites). The potential impact of these differences on local mechanical characterization, at the lamella scale, is explored and tends to demonstrate the development of homogeneous microstructure, leading to well-controlled and relevant local mechanical properties. This approach increases the understanding of crystallisation of PET and recycled PET during forming processes such as thermoforming or injection stretch blow moulding (ISBM) where elongation at break can depend on the microstructure conditioned by the crystallisation process.
Keywords:
Subject: Chemistry and Materials Science - Materials Science and Technology
1. Introduction
Polyethylene terephthalate (PET) is one of the most largely used polymers in food and drink packaging due to its adapted barrier properties, transparency and ability to be manufactured in films [1]. It is also used in various sport industry applications, like for clothing or equipment (e.g., hang gliders), due to its interesting thermo-mechanical properties [2].
Following massive awareness, recycling of polymers is an important challenge for the plastic industry [3]. PET is the major feed from household plastics (370 Mt of annual global plastic production in 2019) [4]. Consequently, PET is the most common plastic in the natural environment, predominantly shaped as bottles [5]. Moreover, PET is a very inert material that degrades very slowly in nature [6]. Post-consumer plastics must be recovered. Currently, 66% of PET is collected for recycling in Europe [7]. The rest is incinerated or sent to landfill, releasing greenhouse gases. On the contrary, recycling PET would increase circularity and reduce CO2 emissions during both production and post-customer processing [8,9].
Two main processes are applied to recycle PET: chemical recycling and mechanical recycling [2,10]. Chemical recycling requires retrieving PET base monomers and purifying them. In a second step, another polymerisation reaction is then needed [11,12,13,14]. There are different methods of chemical recycling such as glycolysis, methanolysis, hydrolysis [2,15]. However, chemical recycling is an expensive process that requires the use of catalysts and high temperatures [14,16]. Mechanical recycling is therefore generally used for its ability to be widely used and its low cost. It involves sorting PET, removing contaminants including water by drying, milling and processing the material to form rPET pellets [17].
Today, rPET is already used for many applications, the best-known being textiles (fleeces, microfibers) [5]. There is also a growing interest in the manufacturing of recycled PET bottles [18] since the textile approach is not circular yet. Actually, it remains difficult, for many reasons, to reach the 25% of recycled content in all PET bottles by 2025 as imposed by Europe [19]. A deeper understanding of PET recycling has to be achieved to reach the ultimate goal of circular 100% recycled bottles. Indeed, during the recycling of PET, many parameters must be considered, in particular the presence of contaminants (e.g., others polymers such as PP, PE, PVC, metals, ink, glues...) and the effect of mechanical recycling (multiple reprocessing cycles) which have an impact on the final properties of rPET [20]. Impurities cause changes in rPET rheology as well as a significant decrease in mechanical properties. Some impurities are not miscible with PET, so they form aggregates that make PET brittle. These impurities can also alter the thermal properties of PET and the transparency of the final product [20,21,22,23,24,25,26]. In addition, during multiple reprocessing cycles, aging of the PET is observed leading to a competition between chain scission and chain branching in the polymer, which induces a change in the thermal, mechanical, and rheological properties of rPET [27,28,29,30]. These properties are particularly crucial to optimize the injection stretch blow moulding process (ISBM) dedicated to bottle production [7,31]. Indeed, in order to obtain recycled transparent bottles, it is necessary to accurately control PET crystallization during the shaping process through monitoring and adapting the process parameters, inducing suitable service properties [31].
The main goal of this work is to have an overview of the physical and mechanical behaviour of recycled PET, in comparison with a well-known reference, a virgin PET. The relationship between the physico-chemical properties of PET and the mechanical properties at different scales is explored to understand the modification of polymer properties after recycling. Three types of PET are used: a virgin PET (vPET), a recycled PET (100rPET) and a blend of this recycled material with the virgin one (50rPET) at 50/50%. This comparison allows to better understand the ability of recycled PET to develop specific microstructure when being transformed through forming processes such as film stretching, thermoforming or even ISBM process. All these processes require high molecular weights, supposing long chains highly entangled promoting then efficient texturation and strain-induced crystallization (SIC). Intrinsic parameters like the molecular weight or the molecular weight distribution are of prime interest and are explored in this study to understand the microstructural mechanisms involved in crystallization processes.
The first purpose of this study is to understand the behaviour of such materials in quiescent conditions. Dynamic crystallization under stretching is not explored. Nevertheless, in static conditions, it is also possible to explore deeply the chains mobility, their ability in developing organized structures that will be relevant for final applications. An analysis of thermal properties using Differential Scanning Calorimetry (DSC) coupled to microscopic observations is then proposed. Spherulitic structures developed are described thanks to crystalline lamellae thickness measurements relaying either on calorimetry (DSC) or on Small Angle X-rays Scattering (SAXS) analysis. To complete these morphological descriptions, local mechanical tests were performed by Atomic Force Microscopy (AFM) where mechanical signatures of crystalline lamellae could be analysed. More classical mechanical analyses like dynamic mechanical analysis (DMA) and uni-axial tensile tests have comforted the previous experiments at the macroscopic scale. To our knowledge, no contribution in the literature has ever proposed such a complete approach in the case of recycled PET, drawing the link between microstructural organization and mechanical properties.
2. Materials and Methods
2.1. Materials and processing protocols
Virgin PET (vPET) and recycled PET (100rPET) pellets were respectively provided by Indorama Ventures® and LPR®. Blends of vPET and 100rPET were achieved by injection moulding, with an equivalent weight of vPET and 100 rPET, leading to the blend called “50rPET”. A geometry of preform has been selected for injection. A typical geometry basically used for injection stretch blow moulding process (ISBM) was chosen. The polymer pellets have been dried under vacuum before injection to avoid hydrolysis during the processing step in temperature. The same injection process parameters have been used for each of the three materials. The goal was to cool down rapidly the melt to quench the microstructure in an amorphous state. As a matter of fact, these injection protocols are common in industrial context where strain-induced crystallization (SIC) has to take place during the blowing process, in a second step.
Moreover, tensile test specimens have also been manufactured thanks to a mini-press, using PET dried for 6 hours at 140°C. Indeed, to process the PET pellets, cylinders have been heated to 270°C and 3 bars of pressure have been applied for 5 seconds to fill the moulds. The crystallinity rate in those samples have been increased by injecting in a hot mould. To achieve transparent samples, it is common to inject in moulds at 20 or 60°C, below PET glass transition temperature. In the present study, the mould has been set to 140°C, allowing crystallization of the polymer from the melt state. This procedure results in opaque samples, proving their increased crystallinity rate.
As already mentioned, this work is focused on crystallization abilities and associated morphologies. To study crystallization processes involved in quiescent conditions, amorphous preforms of vPET, 50rPET and 100rPET were placed in an oven at 140°C for 24 h in order to develop cold crystallization. Then, parallepipedal specimens have been machined from the body of the preforms. Such samples have been used for different analysis methods such as SAXS and DMA as described below. As a result, except in the case of PET pellets, only semi-crystalline preforms will be analysed and discussed in the following steps.
2.2. Melt Flow Index (MFI)
The Melt Flow Index or Rate (MFI or MFR) is an industrial parameter related to viscosity of the molten polymer. MFI allows to define the grade of a polymer (injection or extrusion grade). Using pellets, the MFI of vPET and rPET were measured thanks to a melt flow tester INSTRON CEAST MF20, as defined in the standard test method ISO 1133. The measurements were performed at a temperature of 270°C. Thirteen recordings were taken to determine the average MFI of each PET.
2.3. Size Exclusion Chromatography (SEC)
Size Exclusion Chromatography (SEC) is an accurate method to estimate the molecular weight (in number average, Mn, or in weight average, Mw) of polymers. The polydispersity index (PDI) is defined as the ratio of Mw and Mn. If the value is close to 1, the molecular weight distribution is low. The higher the value is, the larger the Gaussian distribution is (up to 3).
First, the pellets, were dissolved in Hexafluropropan-2-ol (HFIP) to obtain a concentration between 3 and 7 mg/ml. The solution was then filtrated (on 0.45 µm filters) and analysed through the GPC device (System Waters APC Acquity) with four columns at 35°C. Molecular weights were determined by light diffusion with a MALS WYATT (microDawn) device. Two measurements were carried out on both virgin and recycled pellets.
2.4. Polarized optical microscopy
The observations were conducted on a microscope Hot Stage Leica DM4500P with a magnification of x200. They were performed using crossed polarizers with a gypsum plate. To analyse the development of spherulites over cold crystallization phenomenon, a completely amorphous sample was prepared. Small parts of a pellet were collected with a razor blade. Then, the material was melted between two glass slides at 300°C for five minutes. The sandwich system was cooled down in water at ambient temperature to quench the microstructure in its amorphous state. The obtained samples were reheated at 20°C/min until reaching an isothermal step at a temperature of 120°C where cold crystallization may occur.
As mentioned in paragraph 2.1, initially amorphous preforms have been reheated in quiescent conditions at 140 °C for 24 hours. Regarding the experimental methods presented below, only semi-crystalline preforms will be analysed and characterized.
2.5. Thermal differential calorimetry (DSC)
The thermal properties of each material were analysed using a Perkin-Elmer Pyris diamond DSC under a nitrogen flow. Samples of 4 ± 0.5 mg were collected in the central zone of preforms and were encapsulated in aluminium pans.
Figure 1 displays the heating and cooling steps applied for DSC analysis. A heating ramp of 10°C/min up to a temperature of 290°C was first applied. After a holding step at 290°C for one minute, a cooling step with a ramp of 10°C/min to reach 30°C was performed. Samples were maintained at this temperature for one minute. Finally, a second similar heating ramp was conducted. The glass transition temperature, Tg, has been determined drawing two-tangents at temperatures below and above the main transition. The cold crystallization and the melting temperature, Tcc and Tm, were respectively obtained at the maximum of exothermic and endothermic enthalpy peaks. Associated enthalpies, ΔHcc and ΔHm, were determined from the heating scans. The crystallinity ratio, Xc, was calculated according to Equation 1:
2.6. Small Angle X-ray Scattering (SAXS)
The SAXS analysis was performed with an Empyrean diffractometer equipment, with a CuKα radiation, presenting a wavelength of 1.54 Å. Angular scans were conducted at very small angles, between 0.1° and 2° (2θ), allowing the analysis of all plans of diffusion between crystalline lamellaes. The θ angle was corrected by the Lorentz factor because of the phenomenon of diffusion. The Lorentz correction consists of the multiplication of the scattering intensity by a factor proportional to the sine of the diffraction angle. The invariant Q is defined as follows (Equation 2):
where q is the scattering factor and Imeasured, the measured scattered intensity before correction [34,35].
The long period L was calculated using the diffraction Bragg’s law (Equation 3).
where λ is the X-ray wavelength and θcorr is the scattered angle after correction with the Lorentz factor [34,35]. As for DSC experiments, the specimens were extracted in the same central zone of crystallized preforms. Parallepipedal specimens have been extracted from the body of the preforms and one unique SAXS analysis has been performed for each of the three materials.
2.7. Atomic Force Microscopy (AFM)
Microstructural characterizations were carried out via an atomic force microscope (AFM) on preforms of 100% virgin PET (vPET), 100% recycled PET (100rPET) and the blend (50rPET). Prior to AFM analyses, samples were prepared using a Leica EM UC7 ultra-cryomicrotome allowing to obtain very flat and smooth surfaces. The collecting took place in the same central zone of the preforms that the one used for DSC experiments. Then, the MFP-3D Infinity AFM from Asylum Research (Oxford Instruments) was used in a bimodal tapping mode, also known as AM-FM (Amplitude Modulation-Frequency Modulation) mode [36,37]. This mode consists in a nano-mechanical characterization. It allows to obtain the sample topography (height) and the phase contrast as in a tapping mode. In addition, it allows to obtain the indentation and the local contact modulus. A silicon probe (AC160TS-R3) with a resonant frequency of about 300 kHz and a spring constant of about 25 N/m was used. Before testing the samples, the tip was calibrated on a polystyrene (PS) film with a known modulus of 2.7 GPa (Bruker Corporation), used as reference material. After that, AFM tests with calibrated tip were carried out on cryo-microtomed surfaces using a scan rate of 1 Hz. Three images of 3x3 µm2 and a resolution of 256x256 pixels were recorded for each sample.
2.8. Dynamic Mechanical analysis (DMA)
Dynamic mechanical analyses were conducted using a Mettler-Toledo® DMA 1. A tensile mode was applied on samples extracted from preforms with a parallelepiped shape of 5.0 x 2.8 x 1.6 mm3. Tests were performed at a frequency of 1 Hz, with a preload of 1 N and a dynamic deformation of 0.04%. Temperature scans between 25°C and 140°C were performed at a heating rate of 2 °C/min. Viscoelastic properties such as the storage modulus (E’), the loss modulus (E’’) and the associated Tan δ = E”/E’ were measured. The alpha transition Tα was identified at 1 Hz at the maximum of Tan δ peak. Three tests were carried out for each material (vPET, 50rPET and 100rPET). An average curve was then obtained, and the standard deviation was calculated and represented on the curves.
2.9. Uni-axial tensile test (DMA)
Monotonic uni-axial tensile tests until failure were performed using a Zwick Roell Z010 testing machine. The tests were conducted on previously manufactured ISO 527-1BA specimens. Experiments were performed at room temperature with a 3 N preload, a crosshead speed of 5 mm/min, and an initial gauge length of 40 mm. The estimated initial strain rate was of 2.10-3 s-1. Young’s modulus, E, was measured with an extensometer at a strain ranging from 0.05% to 0.25%, according to the standard test method ISO 527. The maximum stress, σmax, and the strain at the maximum stress, ε (σmax), were estimated. Three samples of each material were tested.
3. Results and discussion
This section may be divided by subheadings. It should provide a concise and precise description of the experimental results, their interpretation, as well as the experimental conclusions that can be drawn.
3.1. Molecular weight and rheological properties
This paragraph aims at presenting first a comparison of the molecular organization of virgin and recycled PET pellets. Table 1 summarizes the molecular weights, Mn and Mw as well as the polydispersity index, PDI, measured for the two polymers by SEC.
Table 1 shows that the mass average Mw is significantly lower for recycled PET compared to virgin one, while the number average molecular weight, Mn, remains unchanged. These first results show that polymer chains are shorter in the case of the recycled PET. Moreover, the recycled PET presents also a lower PDI meaning a less dispersed molecular weight distribution for recycled PET, which could be an advantage for processing control [10,38]. It is a non-expected result as the recycling process might result in a random chains scission. Recycled PET seems to be well controlled in terms of chains length distribution, even if the decrease of longer chains lengths is observed compared to the neat PET. To complete this analysis, MFI measurements were conducted to confirm or not the hypothesis of shorter polymer chains for the 100 rPET.
Such order of magnitude for MFI values is expected due to the low viscosity of PET. As a matter of fact, low viscosities are required to inject preforms that will be blown during the Injection Stretch Blow Moulding process (ISBM process). These PET grades are thus commonly used for injection process, allowing an efficient filling of the preform mould.
The recycled PET presents a significantly higher MFI than the virgin one, which proves lower viscosities. These lower rheological properties are clearly in adequation with the lower molecular weight observed for the recycled PET. Thus, recycling process possibly coupled to aging under service conditions might induce this decrease of chain lengths.
3.2. Crystalline morphologies observation and thermal behaviour analysis
These very first analyses permit to describe roughly the molecular organization of each material. The possible shorter lengths and the presence of contaminants inside the recycled PET is of prime interest to understand the ability of these materials to crystallize in quiescent conditions. To focus on the understanding of cold crystallization processes, the spherulitic microstructures induced in controlled conditions have been observed thanks to optical microscopy. During an isothermal step imposed at a temperature of 120°C, the formation and growth of spherulites can be followed. Figure 2 (a, b, c) show optical pictures captured at the end of the isothermal step of 120°C imposed: crystallised samples of vPET, 50rPET and 100rPET are respectively presented below.
As could be expected regarding literature [39], spherulitic organization are completely different between virgin and recycled PET. The blend 50rPET morphologies are equivalent to the pure recycled material. In the last case, more numerous spherulites are present testifying of a higher efficiency in the germination process. Contaminants that are present in the recycled polymer associated with shorter chains lengths, do play an important role as local nucleating agents. As a result, the growth is limited by the presence of more numerous activated germination sites. The final diameters of the spherulites are in the order of magnitude of 4 µm or even less, whereas neat PET presents larger entities, with diameters reaching values of around 10 µm.
Moreover, characteristic times of appearance of spherulites for each sample have been estimated, following the thermal procedure described in Section 2.4. The time departure of cold crystallization at 120°C thus occurs after different durations during the isothermal step: 380, 190 and 225 seconds for respectively vPET, 50rPET and 100rPET. These measurements confirm that the recycled PET has a higher ability to crystallize in quiescent conditions. This is a crucial point that must be considered for processability towards ISBM process. As a matter of fact, for the initially amorphous PET, the forming range above the α-transition can be reduced on the upper limit because of cold crystallization which does reduce stretchability and transparency of the polymer. To complete these observations, thermal analysis performed by DSC have been conducted.
This paragraph presents, with the Figure 3 and Figure 4, thermograms obtained by DSC for vPET, 50rPET and 100rPET. As a reminder, semi-crystalline preforms, reheated in an oven to activate cold crystallization, are characterized.
Figure 3 displays during the first heating stage an endothermal peak for all materials. Two melting temperatures are also observed for all materials. The first melting enthalpy is observed at approximately 130°C while the second one at around 245°C. Crystallites are usually used to melt at higher temperatures, at least a temperature of 250°C without any intermediate melting phenomenon. A less stable microstructural organization could be present; the existence of a transcrystalline phase has already been reported in literature [40]. Moreover, the crystallinity ratio Xc has been estimated from both the observed melting enthalpies. The values obtained are in the order of magnitude of 33, 35 and 37% for vPET, 50rPET and 100rPET, respectively. The recycled PET appears clearly more crystalline than the virgin one, while the blend one remains in between.
These observations must be confronted with the second heating step, where the thermo-mechanical history of each of the material has been erased. Concerning Figure 4, several observations can be mentioned. Firstly, the glass transition temperature is changing slightly. The 100rPET polymer presents a Tg of 80°C, which is one degree higher than the virgin one. Secondly, the less stable phase attributed to possible transcrystalline organization is not detected at all. This observation highlights the fact that thermo-mechanical history induced especially by the injection process may have played a role in pre-organizing a local microstructure. The differences observed are thus not intrinsic to the material itself. Thirdly, the cold crystallization is only observable for the vPET polymer at a temperature of 130°C. This is a crucial point which proves that amorphizing PET requires more severe cooling conditions for recycled PET than for virgin one. Thus, the microstructure of 100rPET is difficult to be quenched in an amorphous state, testifying its ability in crystallizing efficiently. Once again, this result is in adequation with the literature [32,40,41]. Previous studies have reported that faster crystallization of recycled PET can be attributed to shorter chains, acting as nuclei promoting the growth of more crystalline areas for recycled PET compared to the neat one. Contaminants present in recycled PET may also play this role. Finally, a split of the melting peak can be seen for all rPET (50rPET and 100rPET). This last point is more deeply detailed in the following section.
3.3. Crystalline morphologies description: lamella thickness measurements
To go further in the understanding of the morphological crystalline organization, DSC and SAXS analysis were carried out to estimate crystalline lamellas thicknesses. Double melting peaks as observed previously can suggest different crystalline lamellas populations whose thicknesses can differ from a material to another. Crystalline lamellar thicknesses, corresponding to each endothermal peak, are then investigated using Gibbs-Thomson relation (Equation 4):
where Tm0 is the equilibrium melting temperature of an infinite crystal (564 K); σe is the surface free energy of the basal plane where the chains fold (0.106 J.m-²); ΔhmV is the melting enthalpy per volume unit (2.1 x 10⁸ J.m-3) [42,43].
Over the first heating step, two populations of crystalline lamellas, population 1 and population 2, have been denoted, as described on Figure 3. Figure 5 shows an estimation of crystalline lamella thicknesses calculated for the first heating stage for the three materials.
Crystalline lamella thicknesses obtained for population 1 and population 2 are in the order of magnitude of 3.5 to 12 nm, as referred in the literature for semi-crystalline PET, crystallized in quiescent conditions [43,44]. As expected, 50rPET and 100rPET present slightly higher thicknesses compared to the virgin sample. Those values are consistent with literature where mechanically recycled PET has higher melting temperatures, associated to more stable crystalline structure with probably thicker crystalline lamellas [39].
These analyses were completed thanks to X-ray scattering, with a SAXS protocol where long periods, L, were measured. In a second time, the crystalline lamella thicknesses can then be deduced from long periods measurements, according to the degree of crystallinity previously analysed by DSC during the first heating stage. Figure 6 presents SAXS diffractograms obtained for the three materials, involving the Lorentz correction presented in the Section 2.6.
The diffractograms obtained including the Lorentz correction clearly show that a periodicity exists inside the three polymers at the scale of arranged lamellas. This periodicity results in a gaussian distribution of the long period L. The maximum of the peak is, for the three cases, centred on values in the order of magnitude of 60 nm which are common for polymeric systems. From those analysis, and thanks to crystallinity ratios Xc measured by DSC, an estimation of crystalline lamella thicknesses is possible, as presented on Figure 7.
Thanks to this approach, crystalline lamella thicknesses can be estimated and compared. The order of magnitude is of 25 nm which is slightly higher compared to DSC analysis where thicknesses of 12 nm were determined regarding the main melting endothermic peak (population 2). The two characterization methods are clearly not equivalent. Assumptions and uncertainties might explain the differences observed (identification of melting points attributed to different lamella populations, Xc measurement, Lorentz correction, etc. Nevertheless, as the protocols used were rigorously the same from a polymer to another, it remains possible to compare the different cases. On Figure 7, small discrepancies can be observed. Once again, and as observed previously with DSC experiments, the case of recycled PET (100rPET) presents slightly thicker crystalline lamellas. The case of 50rPET remains in between the totally virgin and recycled PET. To conclude on this part, in quiescent conditions, the ability in crystallization processes is clearly more efficient for recycled PET, with melting peaks observed at higher temperatures. Moreover, very few differences can be highlighted regarding crystalline morphologies description of virgin and recycled PET which could present slightly thicker crystalline lamellas. In the following part, and to go further in the local microstructural organization understanding, efforts were made to describe also local mechanical behaviours, at the scale of crystalline lamellas.
3.4. Mechanical behaviour at the mesoscopic scale
A local mechanical approach is presented in this section thanks to dynamic mechanical characterisation performed by AFM. Mechanical investigations are then conducted at the meso-scale of crystalline lamellas. The analysed surface is of 3x3 µm2 which corresponds, considering spherulitic diameters of approximately 10 µm or 4 µm for respectively vPET and rPET, to a scanning surface of 11 and 72 % of a whole spherulitic entity. In other words, this tapping approach consists in analysing a representative part of a spherulite, whose crystalline lamellas are in the order of magnitude of 10 to 60 nm, involving both amorphous and crystalline domains. Figure 8, Figure 9 and Figure 10 show images obtained with the AM-FM mode described in Section 2.7. Pictures are organised as follows: topography (a), indentation (b) and the contact modulus (c). A histogram with Gaussian fit showing the disparity of elastic moduli has also been plotted (d) for each material. Topography images (Figures 8 (a)–10 (a)) show the microstructure of each material and the associated roughness (height). It is possible to observe that, as required for mechanical tests, each surface prepared by the ultracryomicrotome is very smooth (height is in the order of 10 nm) allowing to make nano-mechanical analysis without artefacts due to the surface roughness. Images of indentation (Figures 8 (b)–10 (b)) show that tip penetration is in all cases between 300 pm and 2 nm according to Hertz hypothesis in an intermittent bimodal test. Images of contact modulus (Figures 8 (c)–10(c)) show the local variation of each material stiffness. Distribution of elastic moduli is represented on a histogram and the associated Gaussian fit for each case is given (Figures 8 (d)–10 (d)). Contours observed in Figure 8 and Figure 10, respectively for vPET and 100rPET, could represent spherulites edges with interspherulitic regions. This hypothesis would have to be verified in further works.
The elastic moduli histograms display a distribution of mechanical properties which appears symmetrical both in the case of vPET and 100rPET. This symmetrical distribution could be the reflect of both soft and stiff contributions that could be attributed to either amorphous or crystalline domains. The averaged value on these distributions is the same (2.13 GPa) for vPET and 100rPET, even if the fully recycled PET exhibits higher crystallinity ratio (Xc = 36.6 %) than the virgin one (Xc = 32.9 %) and does present possible thicker crystalline lamellas. No mechanical signature of the presence of more crystalline regions is detectable. The fact that crystalline lamellas would be thicker in the case of recycled PET is not obvious regarding these measurements too. Indeed, local mechanical signatures appear equivalent, even in terms of distribution. It is of prime interest to note that, finally, rPET is able to develop well-controlled microstructure, as homogeneous as a virgin PET regarding the distribution of crystalline morphologies and their local mechanical characteristics. The presence of contaminants, associated to shorter chains, does not seem to affect at all the mechanical properties of the recycled polymer. Moreover, the blend of vPET and 100rPET materials (50rPET) exhibits a singular behaviour as less symmetrical and larger distribution of elastic modulus is observed, with an averaged value of 3.03 GPa. The fact that two PET are blended may have induced possible local non-homogeneous domains. Nevertheless, the mechanical behaviour of the blend remains close to both virgin and recycled PET.
3.5. Mechanical behaviour at the macroscopic scale
Characterizations in this paper have so far focused on microscopic and mesoscopic scales. The objective of this section is to link properties at the micro- and meso-scale to macroscopic mechanical properties, more relevant regarding the process scale. The mechanical behaviour of vPET, 50rPET and 100rPET were studied through both DMA and tensile tests experiments.
Figure 11 and Figure 12 represent respectively the evolution of storage modulus and Tan δ as a function of temperature.
On Figure 11, the value of modulus at room temperature is very similar for all the materials i.e., no significant differences in the mechanical behaviour have been pointed out. More dispersion in the measurements is observed in the case of 50rPET which is a blend of vPET and 100rPET. Such observation agrees with AFM measurements regarding the elastic moduli distribution. It confirms the fact that the blend presents less homogeneous mechanical properties than the neat or totally recycled PET. Furthermore, the inflexion point between the glassy and the rubbery-like behaviours appears for higher temperatures in the case of 100rPET. This is in accordance with the maximum of Tan δ peak which is shifted to higher temperatures in the case of 100rPET compared to vPET. The blend 50rPET still appears in between the two-extremal cases. In a nutshell, the α-transition temperatures are summarised in the following table.

Table 3.
α-transition temperature, taken at the maximum of Tan δ peak and a frequency of 1 Hz, for vPET, 50rPET and 100rPET.
Table 3.
α-transition temperature, taken at the maximum of Tan δ peak and a frequency of 1 Hz, for vPET, 50rPET and 100rPET.
| Sample | vPET | 50rPET | 100rPET |
| Tα (°C) | 93.6 ± 0.3 | 94.0 ± 1.0 | 95.9 ± 0.1 |
The α-transition temperature of 100 rPET is two degrees higher than the one of vPET. The area under Tan δ peak is also lower in this case which proves that the amorphous phase of 100rPET presents less molecular mobility. The presence of more crystalline regions as suggested by DSC analysis, is constraining the amorphous phase. Moreover, the rubbery-like plateau is higher in the case of 100rPET which is the most crystalline material, followed by 50rPET and then vPET. The α-transitions are then slightly different appearing later for recycled PET. The second heating step performed in DSC tends to the same conclusion: the forming range is reduced in the case of recycled PET with higher glass transition temperature. Nevertheless, at room temperature, it is obvious that all the PET explored in this study exhibit similar mechanical behaviours.
To complete the viscoelastic properties measurements, uni-axial tensile tests have also been conducted on sample manufactured with vPET, 50rPET and 100rPET. Figure 13 shows a comparison of the stress-strain curves for each material. A representative curve for each sample was chosen to make the comparison after checking the repeatability of those tests with 3 samples.
This last approach tends to highlight the fact that no significant differences in the mechanical behaviour at the macroscopic scale can be seen between the three polymers. The same trends are observed, for all curves, with a strain at the maximum stress at 5% of deformation [45]. As described on Figure 14, samples exhibit similar moduli for each material (about 2800 MPa) [46].
Table 4 summarizes values of the modulus obtained with AFM, DMA, and uni-axial tensile tests.
4. Conclusion
The purpose of this comparative study between semi-crystalline virgin and recycled PET was to understand the link between physico-chemical properties, morphological description of crystalline entities, and mechanical behaviour.
First, it is demonstrated that recycled PET (100rPET) presents lower molecular weight compared to neat one (vPET), while the polydispersity index remains equivalent. Finally, at this stage, the distribution of chains lengths clearly appears well-controlled with rPET just like for virgin PET, with, nevertheless, probably shorter chains. MFI measurements of the two PET confirm these assumptions with recycled PET having a higher MFI value than the virgin PET, testifying of a less viscous rheological behaviour due to smaller chain lengths. The post-condensation at solid state that is commonly used after the mechanical recycling process might have participated to compensate the effects of degradation that can develop during the re-processing of the resin.
Cold crystallization processes, from the amorphous state and followed in quiescent conditions thanks to optical microscopy, are proved to be more efficient in the case of recycled PET. More numerous and smaller spherulites are present in the rPET structure which can develop rapidly and homogeneously. The spherulitic structure growth efficiency is probably ruled by shorter chains associated with contaminants issued from recycling paths that may act as nucleating agents inside the bulk. The blend (50rPET) presents a behaviour which is rather closer to 100rPET, with more numerous and smaller spherulites. The presence of contaminants can be effective in this case too.
To go further in crystallization process understanding, thermal properties using calorimetry analysis have comforted the fact that recycled PET presents significantly faster crystallization kinetics than virgin PET. From the molten state, quenching rPET in an amorphous state was not possible at a cooling rate of 10°C/min while virgin PET was partially amorphous. These results highlight the fact that injection process of rPET preforms has to be adjusted. Precautions must be taken to prevent crystallization from the melt. Regarding the crystal melting of rPET, it takes place for higher temperatures compared to vPET. A further analysis of transcrystalline phase could help to identify the phenomenon that results in a melting temperature shifting. Crystalline lamellae thicknesses have been estimated through different methods (DSC and SAXS). rPET presents slightly thicker crystalline lamellas, associated to higher crystallinity ratios Xc.
The impact of these differences of crystalline morphologies on local mechanical behaviour was then characterized by Atomic Force Microscopy. AFM analyses using dynamic measurements in intermittent contact (tapping mode) were then carried out to search for the presence of potentially different crystallites. Modulus analysis did not show significant differences between vPET and rPET. The distribution of mechanical responses appears very similar and well-controlled in the rPET bulk. Homogeneous properties associated to both amorphous and crystalline domains are clearly in presence; no fragility induced by the presence of contaminants has been detected at this scale. 100rPET and vPET exhibit a single crystalline phase associated to repeatable mechanical behaviour which confirms that recycled PET, just like virgin PET, can develop stable and controlled crystalline entities.
At a larger scale, mechanical behaviours are explored in the low and large deformation domains with both DMA analysis and uni-axial tensile tests. At room temperature, the mechanical responses are equivalent for recycled and virgin materials. Difference of molecular weight and crystallinity does not seem to have any impact on the macroscopic mechanical behaviour of cold crystallized PET. Properties at failure, strongly related to the microscopic properties, could be another interesting study to work on.
Funding
The authors gratefully acknowledge the financial support from the CARNOT MINES 2020 on Polymer recyclability.
Acknowledgments
The authors want to thank Marion Colella from INSAVALOR for SEC measurements, Mikaël Derrien and Xavier Monnier from SIDEL Group for supplying materials, Gabriel Monge and Jean-Marc Haudin for their expertise in X-ray scattering technique.
Conflicts of Interest
The authors declare that they have no known competing financial interest or personal relationships that could have appeared to influence the work reported in this paper.
References
- Mandal, S., Dey, A. PET Chemistry. Recycling of Polyethylene Terephthalate Bottles, 2019, Pages 1-22. [CrossRef]
- Nistico, R. Polyethylene terephthalate (PET) in the packaging industry. Polymer Testing 90, 2020, 106707. [CrossRef]
- Antonopoulos, I., Faraca, G., Tonini, D. Recycling of post-consumer plastic packaging waste in the EU: Recovery rates, material flows, and barriers. Waste Management 126, 2021, 694-705. [CrossRef]
- Plastics Europe, Plastics—the Facts 2020, Plastics—the Facts 2020 (plasticseurope.org) (18/11/2021).
- Coelho, T. M., Castro, R., & Gobbo Jr, J. A. PET containers in Brazil: Opportunities and challenges of a logistics model for post-consumer waste recycling. Resources, Conservation and Recycling 55, 2011, 311-319. [CrossRef]
- Sang, T., Wallis, C. J., Hill, G., & Britovsek, G. J. Polyethylene terephthalate degradation under natural and accelerated weathering conditions. European Polymer Journal 117, 2020, 109873. [CrossRef]
- Petcore Europe, The road to 90%. How to achieve the EU’s pet bottle collection bottle collection targets by 2029, https://www.petcore-europe.org/legislation/334-how-achieve-eu-pet-bottle-collection-bottle-collection-targets-2031.html.
- Hopewell, J., Dvorak, R., Kosior, E. Plastics Recycling: Challenges and Opportunities. Philosophical Transactions of the Royal Society B: Biological Sciences 364, 2009, 2115 26. [CrossRef]
- Chilton, T., Burnley, S., Nesaratnam, S. A life cycle assessment of the closed loop recycling and thermal recovery of post-consumer PET. Resources, Conservation and Recycling 54, 2010, 1241-1249. [CrossRef]
- Awaja, F., Pavel, D. Recycling of PET. European Polymer Journal 41, 2005, 1453–1477. [CrossRef]
- Bedell, M., Brown, M., Kiziltas, A., Mielewski, D., Mukerjee, S., Tabor, R. A case for closed-loop recycling of post-consumer PET for automotive foams. Waste Management 71, 2018, 97-108. [CrossRef]
- Cakić, S. M., Ristić, I. S., Milena, M., Nikolić, N. Č., Ilić, O. Z., Stojiljković, D. T., B-Simendić, J. K. Glycolyzed products from PET waste and their application in synthesis of polyurethane dispersions. Progress in Organic Coatings, 2012, 74(1), 115-124. [CrossRef]
- Roy, P. K., Mathur, R., Kumar, D., Rajagopal, C. Tertiary recycling of poly (ethylene terephthalate) wastes for production of polyurethane–polyisocyanurate foams, 2013, Journal of Environmental Chemical Engineering, 1(4), 1062-1069. [CrossRef]
- Raheem, A. B., Noor, Z. Z., Hassan, A., Abd Hamid, M. K., Samsudin, S. A., & Sabeen, A. H. Current developments in chemical recycling of post-consumer polyethylene terephthalate wastes for new materials production: A review. Journal of Cleaner Production, 2019, 225, 1052-1064. [CrossRef]
- Wu, H.S. Strategic Possibility Routes of Recycled PET. Polymers 13, 2021, 1475. [CrossRef]
- Kim, R., Delva, L., Van Geem, K, Mechanical and chemical recycling of solid plastic waste. Waste management 69, 2007, 24-58. [CrossRef]
- Cecon, V. S., Da Silva, P. F., Curtzwiler, G. W., & Vorst, K. L. The challenges in recycling post-consumer polyolefins for food contact applications: A review. Resources, Conservation & Recycling 167, 2021, 105422. [CrossRef]
- Lonca, G., Lesage, P., Majeau-Bettez, G., Bernard, S., Margni, M. Assessing scaling effects of circular economy strategies: A case study on plastic bottle closed-loop recycling in the USA PET market. Resources, Conservation & Recycling 162, 2020, 105013. [CrossRef]
- DIRECTIVE (UE) 2019/904 DU PARLEMENT EUROPÉEN ET DU CONSEIL du 5 juin 2019 relative à la réduction de l’incidence de certains produits en plastique sur l’environnement, Journal officiel de l’Union européenne L155/1, 12 juin 2019, Article 6.
- Itim, B., Philip, M. Effect of multiple extrusions and influence of PP contamination on the thermal characteristics of bottle grade recycled PET. Polymer Degradation and Stability 117, 2015, 84-89. [CrossRef]
- Dimitrov, N., Krehula, L. K., Siročić, A. P., Hrnjak-Murgić, Z. Analysis of recycled PET bottles products by pyrolysis-gas chromatography. Polymer Degradation and Stability 98, 2013, 972-979. [CrossRef]
- Franz, R., Welle, F. Contamination Levels in Recollected PET Bottles from Non-Food Applications and their Impact on the Safety of Recycled PET for Food Contact. Molecules, Vol. 25, Issue 21, 2020, 4998. [CrossRef]
- Alsewailem, F. D., Alrefaie, J. K. Effect of contaminants and processing regime on the mechanical properties and moldability of postconsumer polyethylene terephthalate bottles. Waste Management 81, 2018, 88-93. [CrossRef]
- Alvarado Chacon, F., Brouwer, M. T., Thoden van Velzen, E. U. Fresia Alvarado Chacon, Marieke T. Brouwer, Eggo Ulphard Thoden van Velzen. Effect of recycled content and rPET quality on the properties of PET bottles, part I: Optical and mechanical properties. Packaging Technology and Science, Vol. 33, Issue 9, 2020, 347-357. [CrossRef]
- La Mantia, F. P., Botta, L., Morreale, M., Scaffaro, R. Effect of small amounts of poly (lactic acid) on the recycling of poly (ethylene terephthalate) bottles. Polymer Degradation and Stability 97, 2012, 21-24. [CrossRef]
- Navarro, R., Ferrandiz, S., Lopez, J., Seguí, V. J. The influence of polyethylene in the mechanical recycling of polyethylene terephthalate. Journal of materials processing technology 195, 2008, 110–116. [CrossRef]
- López, M. D. M. C., Pernas, A. I. A., López, M. J. A., Latorre, A. L., Vilariño, J. L., Rodríguez, M. V. G. Assessing changes on poly (ethylene terephthalate) properties after recycling: Mechanical recycling in laboratory versus postconsumer recycled material. Materials Chemistry and Physics 147, 2014, 884-894. [CrossRef]
- Nait-Ali, K.L., Bergeret, Ferry A.L., Colin, X. Chain branching detection by Cole–Cole modeling of rheological properties changes during PET mechanical recycling. Polymer Testing 31, 2012, 500-504. [CrossRef]
- Wu, H., Lv, S., He, Y., Qu, J.-P. The study of the thermomechanical degradation and mechanical properties of PET recycled by industrial-scale elongational processing. Polymer Testing 77, 2019, 105882. [CrossRef]
- Nait-Ali, L.K., Colin, X., Bergeret, A. Kinetic analysis and modelling of PET macromolecular changes during its mechanical recycling by extrusion. Polymer Degradation and Stability 96, 2011, 236-246. [CrossRef]
- Awaja, F., Pavel, D. Injection stretch blow moulding process of reactive extruded recycled PET and virgin PET blends. European Polymer Journal 41, 2005, 2614–2634. [CrossRef]
- Badia J.D., Strömberg, E., Karlsson, S., Ribes-Greus, A. The role of crystalline, mobile amorphous and rigid amorphous fractions in the performance of recycled poly (ethylene terephthalate) (PET). Polymer Degradation and Stability 97, 2012, 98-107. [CrossRef]
- Asensio, M., Nunez, K., Guerrero, J., Herrero, M., Merino, J.C., Pastor, J.M. Rheological modification of recycled poly (ethylene terephthalate): Blending and reactive extrusion. Polymer Degradation and Stability 179, 2020, 109258. [CrossRef]
- Cser, F. About the Lorentz correction used in interpretation of small-angle X-ray scattering data of semicrystalline polymers. Journal of applied polymer science 80, 2001, 358-366.
- Hsiao, B.S., Verma, R.K. A novel approach to extract morphological variables in crystalline polymers from time-resolved synchrotron SAXS data. Journal of Synchrotron Radiation 5, 1998, 23-29. [CrossRef]
- Herruzo, E.T., Perrino, A.P., Garcia, R. Fast nanomechanical spectroscopy of soft matter. Nature communications 5, 2014, 3126. [CrossRef]
- Benaglia, S., Amo, C.A., Garcia, R. Fast, quantitative and high-resolution mapping of viscoelastic properties with bimodal AFM. Nanoscale 11, 2019, 15289-15297. [CrossRef]
- Welle, F. Twenty Years of PET Bottle to Bottle Recycling—An Overview. Resources, Conservation and Recycling 55, 2011, 865 75. [CrossRef]
- Kim, H.G., Robertson, R.E. Multiple melting endotherms in isothermally melt-crystallized poly (butylene terephthalate). Journal of Polymer Science Part B: Polymer Physics 36, 1998 1757-1767. [CrossRef]
- Rohart, V., Combeaud, C. Stretchability of mechanically recycled PET. Polymer 257, 2022, 125218 . [CrossRef]
- Hao, W., Wang, X., Yang, W., Zheng. K. Non-isothermal crystallization kinetics of recycled PET-Si3N4 nanocomposites, Polymer Testing 31, 2012, 110–116, doi: 10.1016/j.polymertesting.2011.10.003. [CrossRef]
- Lu, X.F., Hay, J.N. Isothermal Crystallization Kinetics and Melting Behaviour of Poly(Ethylene Terephthalate) . Polymer 42, 2001, 9423 31. [CrossRef]
- Badía, J.D., Vilaplana, F., Karlsson, S., Ribes-Greus, A. Thermal Analysis as a Quality Tool for Assessing the Influence of Thermo-Mechanical Degradation on Recycled Poly(Ethylene Terephthalate), Polymer Testing 28, 2009, 169 75. [CrossRef]
- Jonas, A.M., Russell, T.P., Yoon, D.Y. Time-resolved SAXS studies of morphological changes in cold crystallized poly (ethylene terephthalate) during annealing and heating. Colloid and Polymer Science 272, 1994, 1344-1351. [CrossRef]
- Gere, D., Czigany, T. Future trends of plastic bottle recycling: Compatibilization of PET and PLA. Polymer Testing 81, 2020, 106160. [CrossRef]
- Zander, N.E, Gillan, M., Lambeth, R. H. Recycled polyethylene terephthalate as a new FFF feedstock material. Additive Manufacturing 21, 2018, 174-182. [CrossRef]
Figure 1.
Procedure of heating and cooling steps applied during DSC experiments.
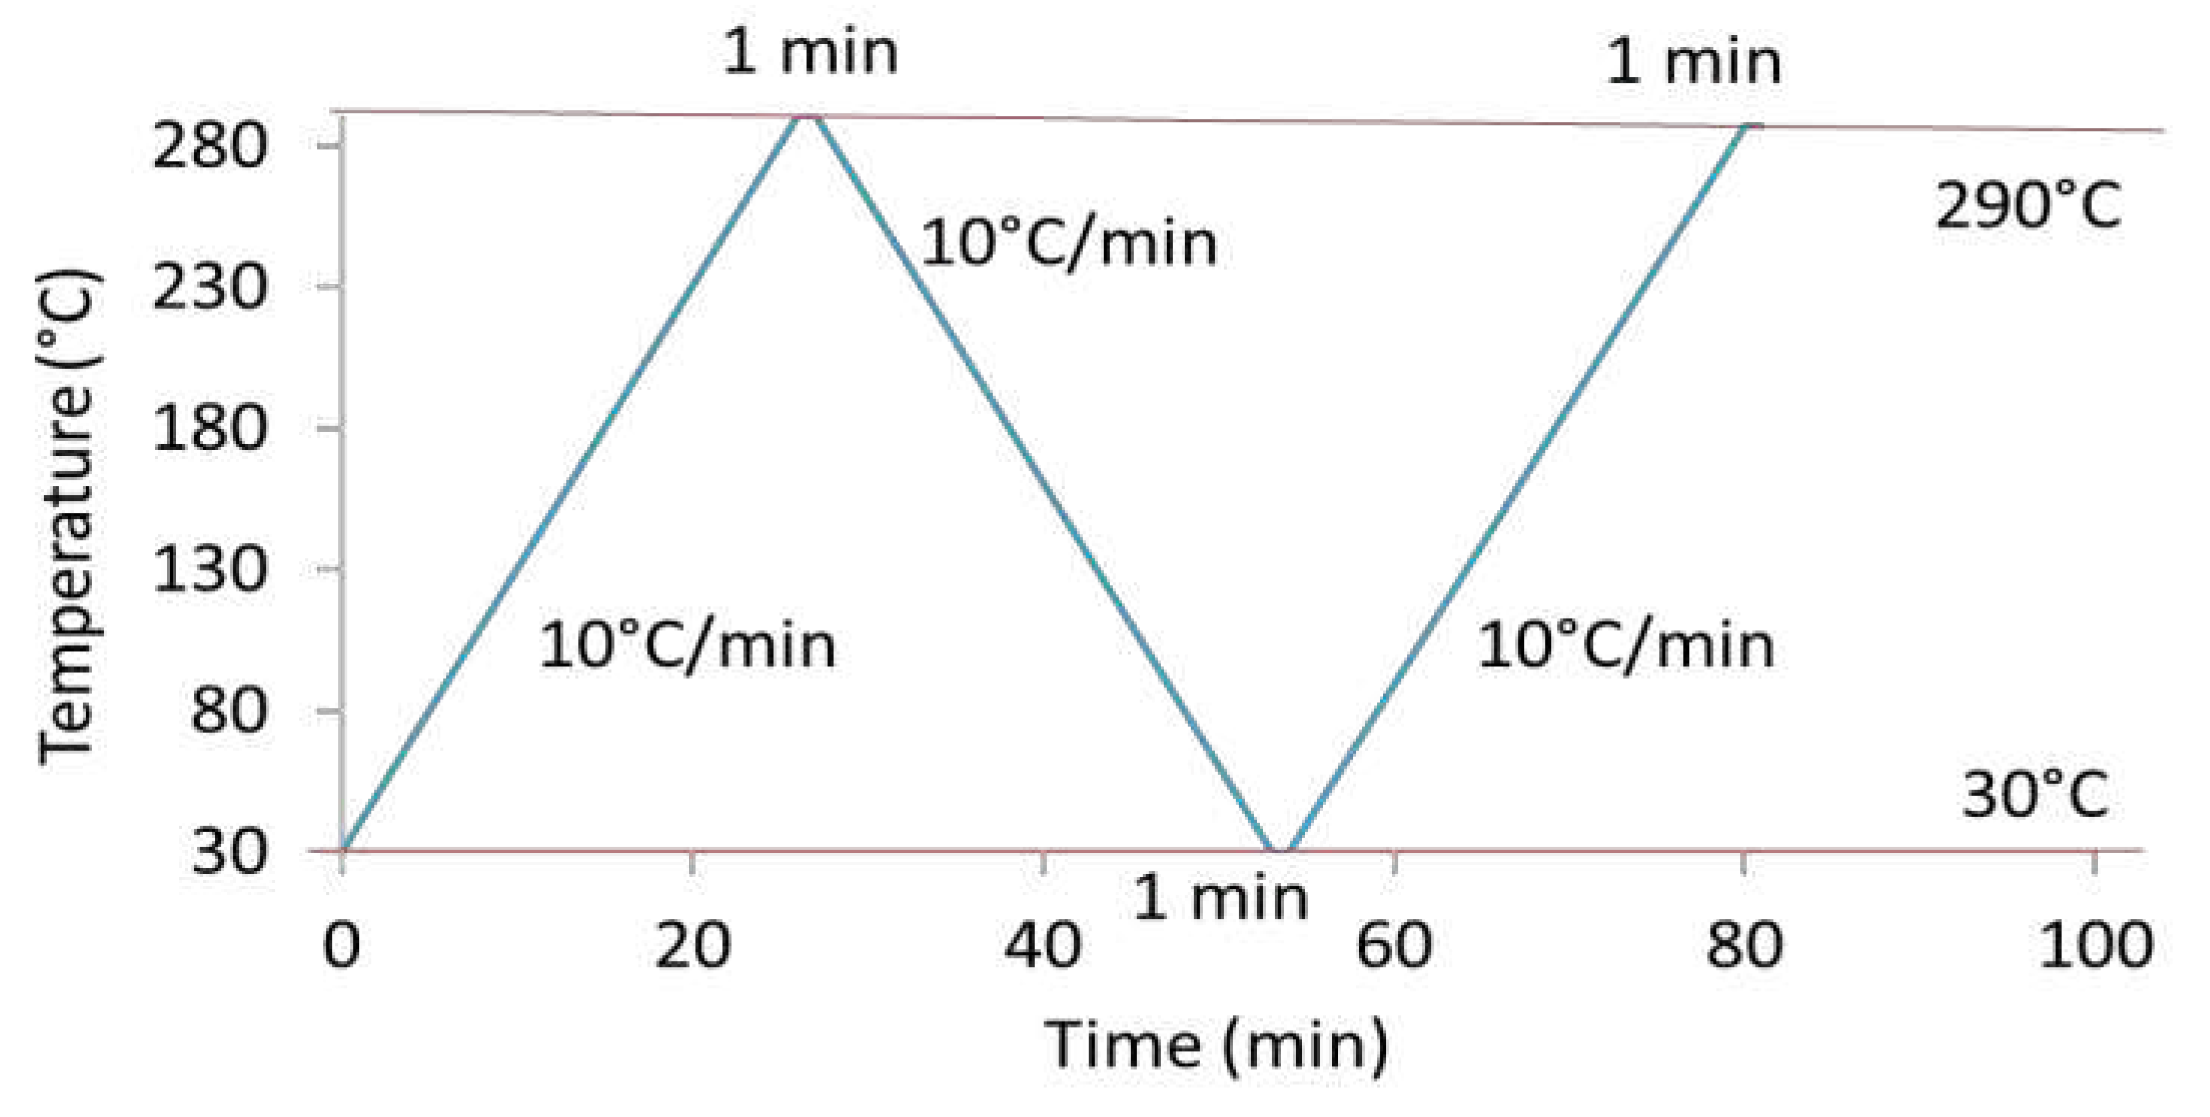
Figure 2.
Optical observations of spherulites developed in quiescent conditions, at a temperature of 120°C, for vPET (a), 50rPET (b) and 100rPET (c).
Figure 2.
Optical observations of spherulites developed in quiescent conditions, at a temperature of 120°C, for vPET (a), 50rPET (b) and 100rPET (c).
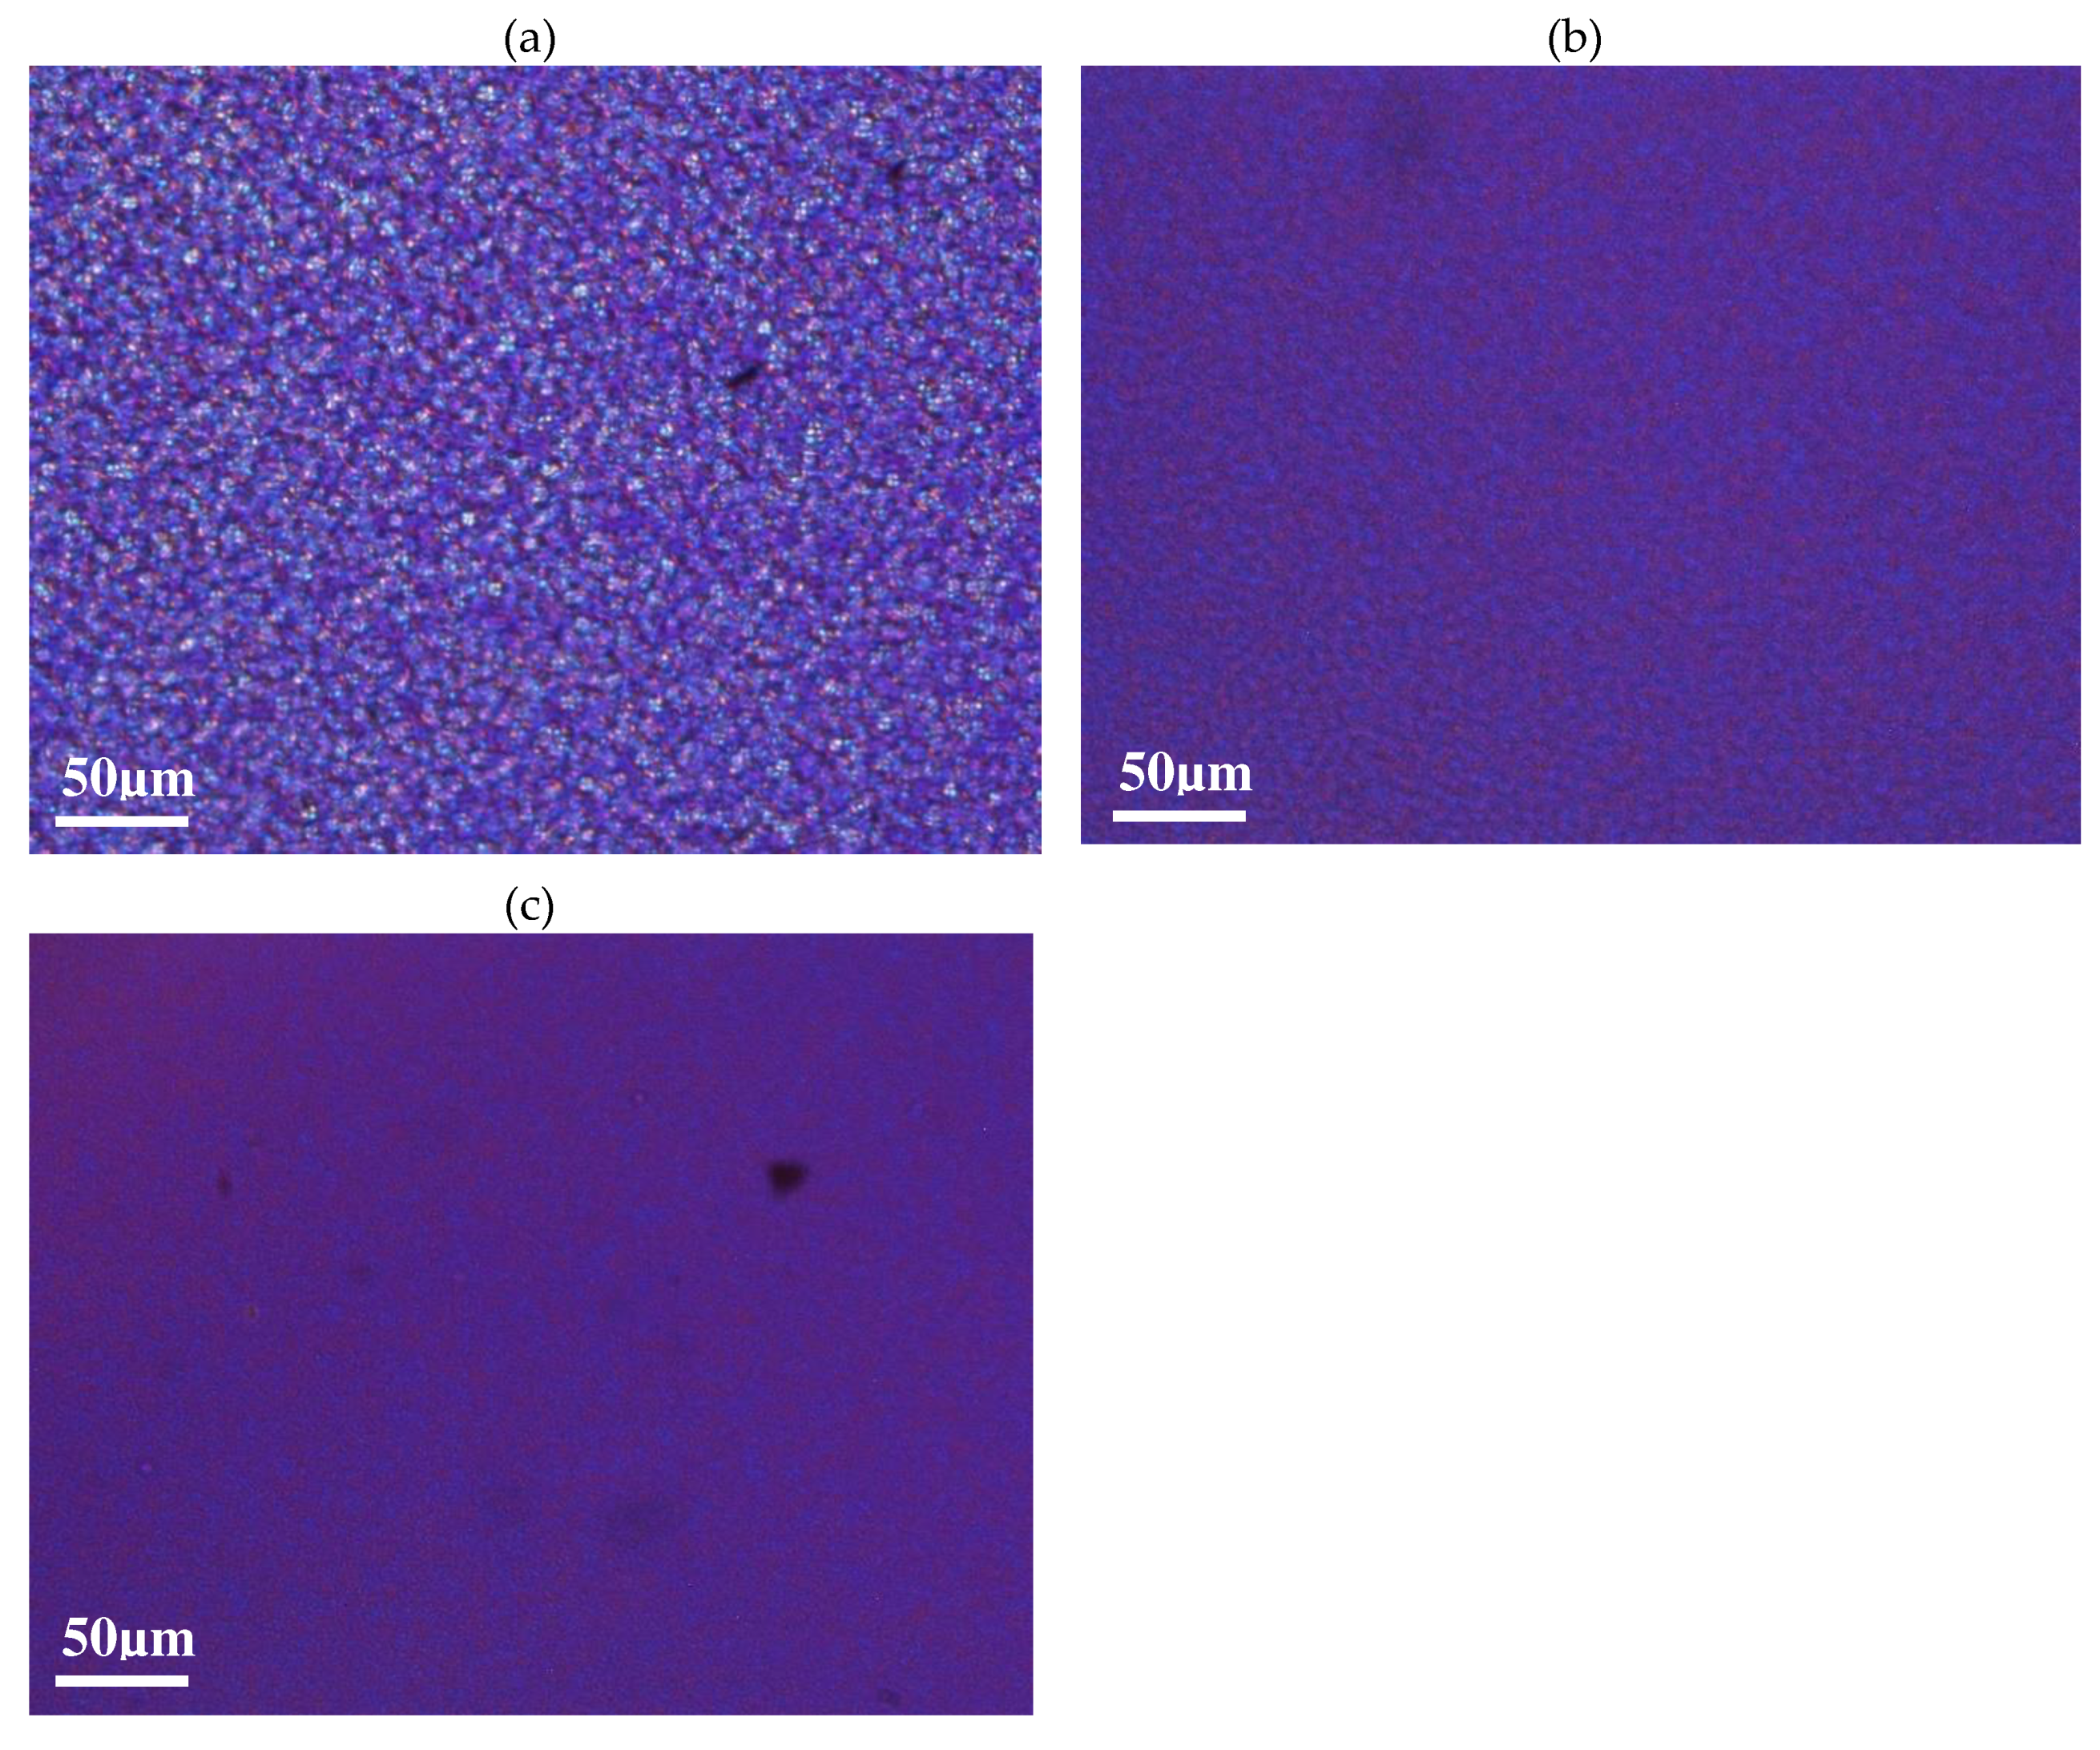
Figure 3.
DSC curves of semi-crystalline preforms for vPET, 50rPET and 100rPET heated, from 30°C to 290°C, at a heating rate of 10°C/min (first heating step).
Figure 3.
DSC curves of semi-crystalline preforms for vPET, 50rPET and 100rPET heated, from 30°C to 290°C, at a heating rate of 10°C/min (first heating step).
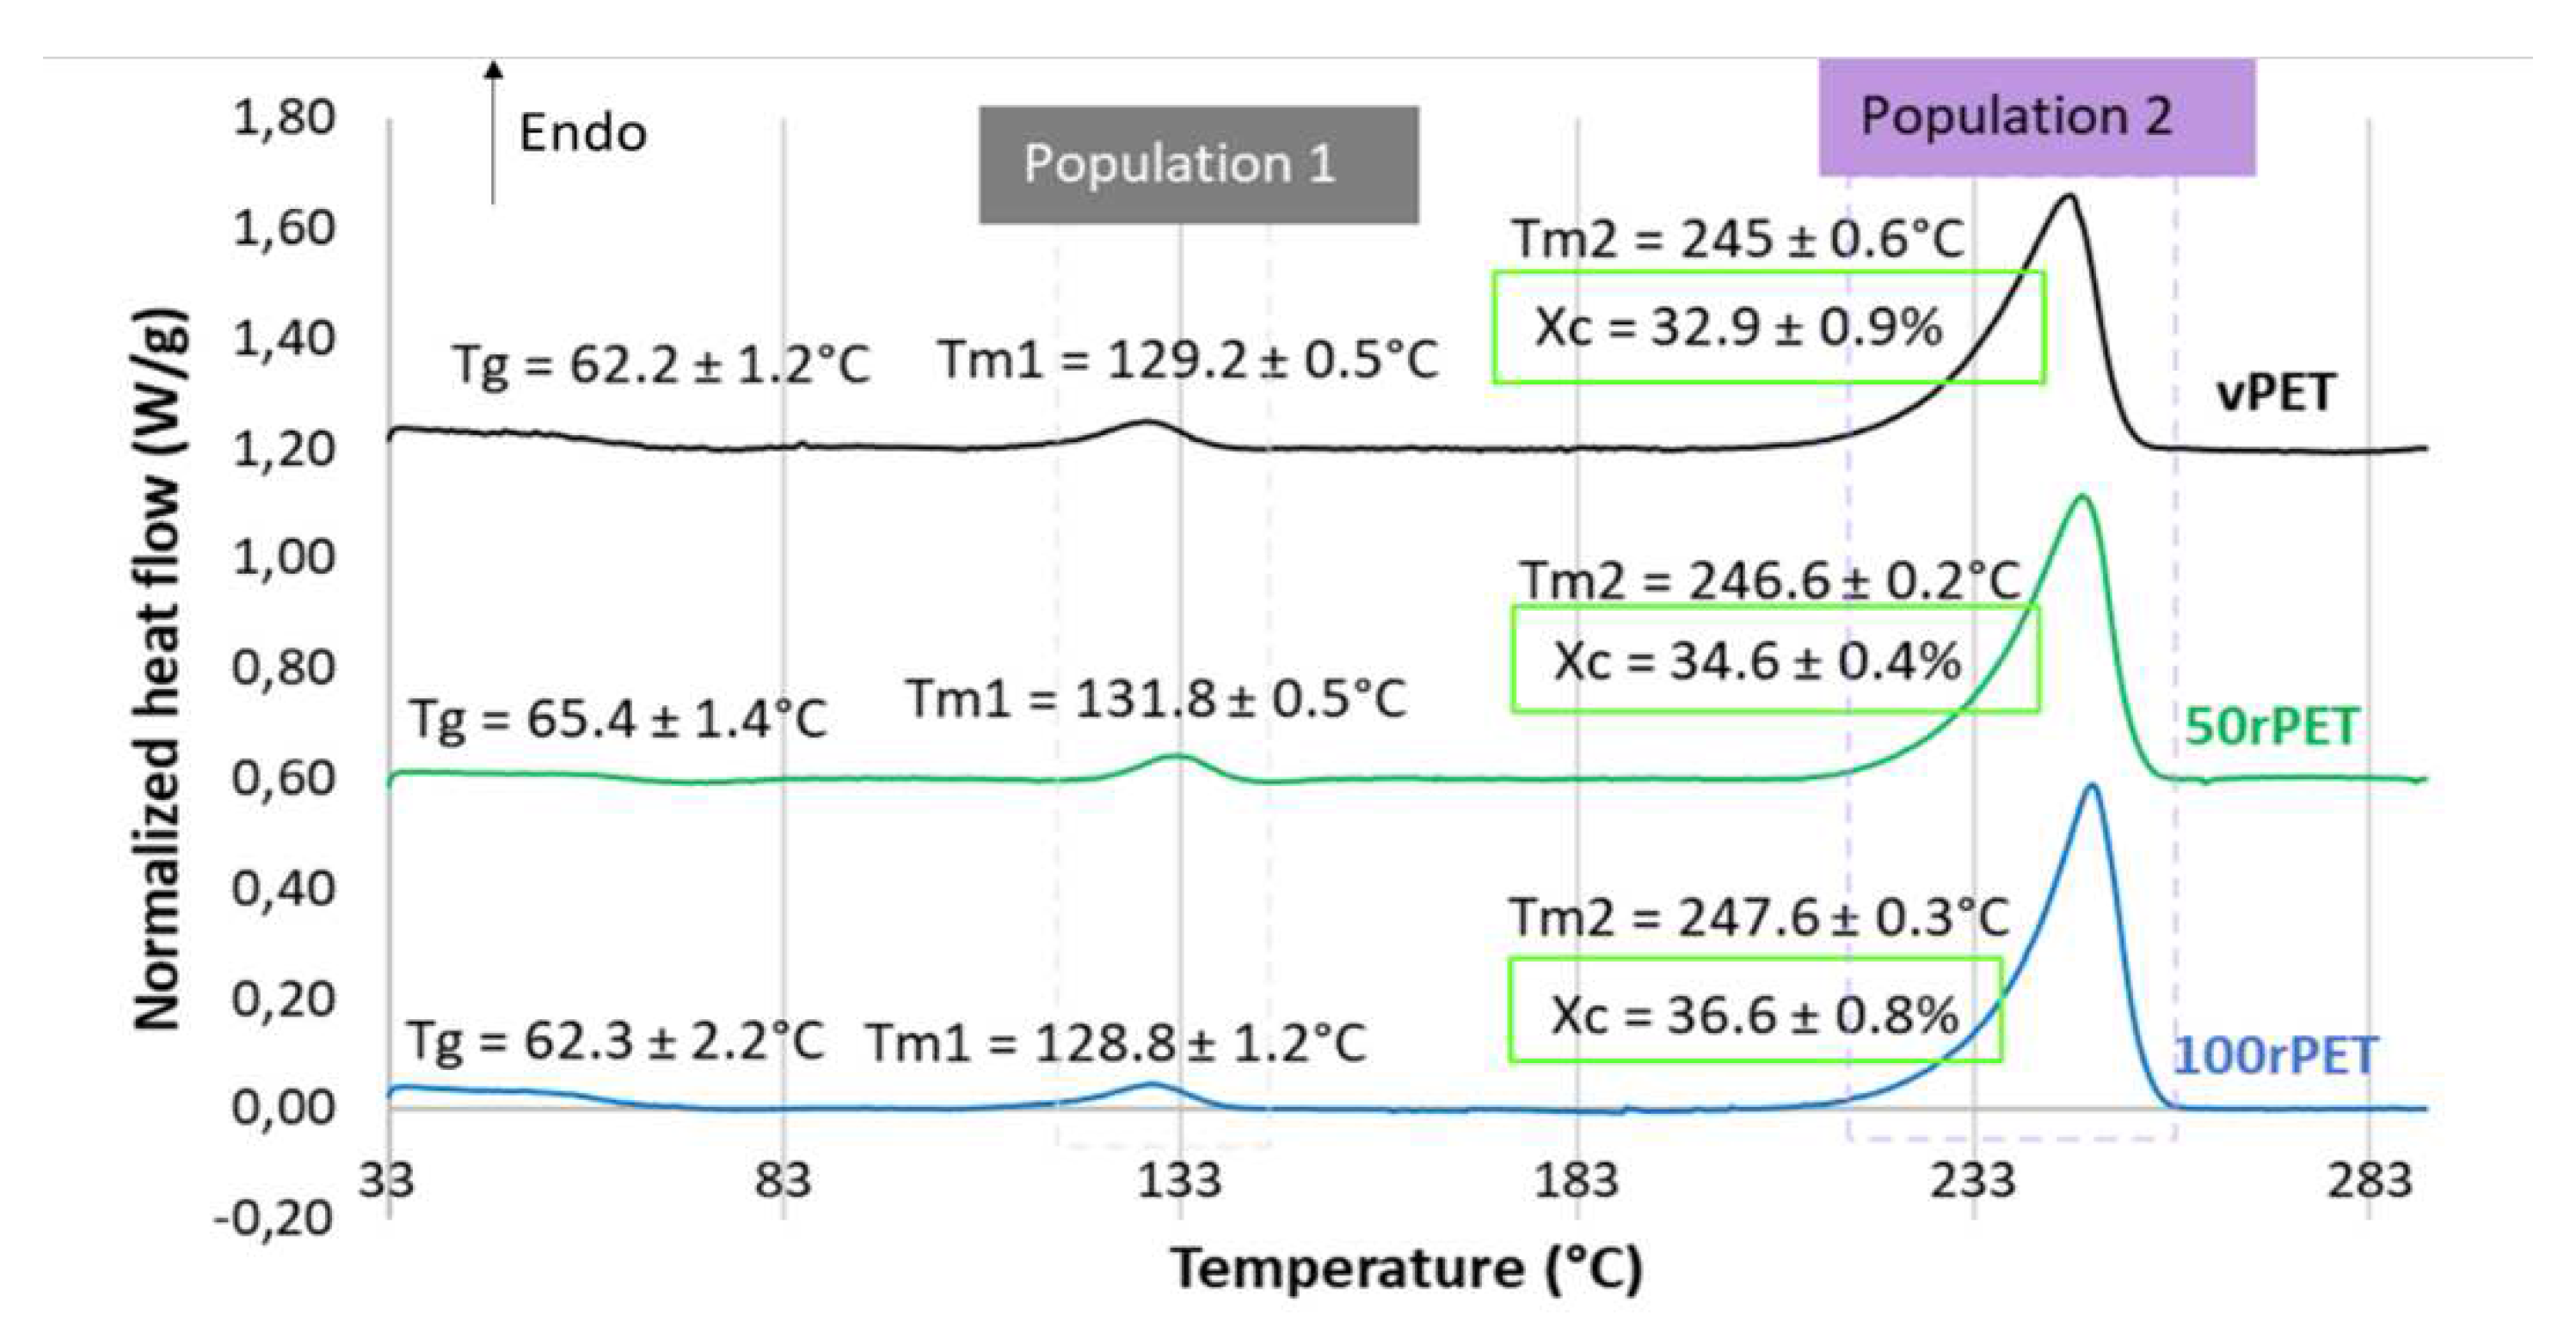
Figure 4.
DSC curves of semi-crystalline preforms for vPET, 50rPET and 100rPET heated from 30°C to 290°C, at a heating rate of 10°C/min C and for the second heating step after cooling from 290°C to 30°C, at a cooling rate of -10°C/min.
Figure 4.
DSC curves of semi-crystalline preforms for vPET, 50rPET and 100rPET heated from 30°C to 290°C, at a heating rate of 10°C/min C and for the second heating step after cooling from 290°C to 30°C, at a cooling rate of -10°C/min.
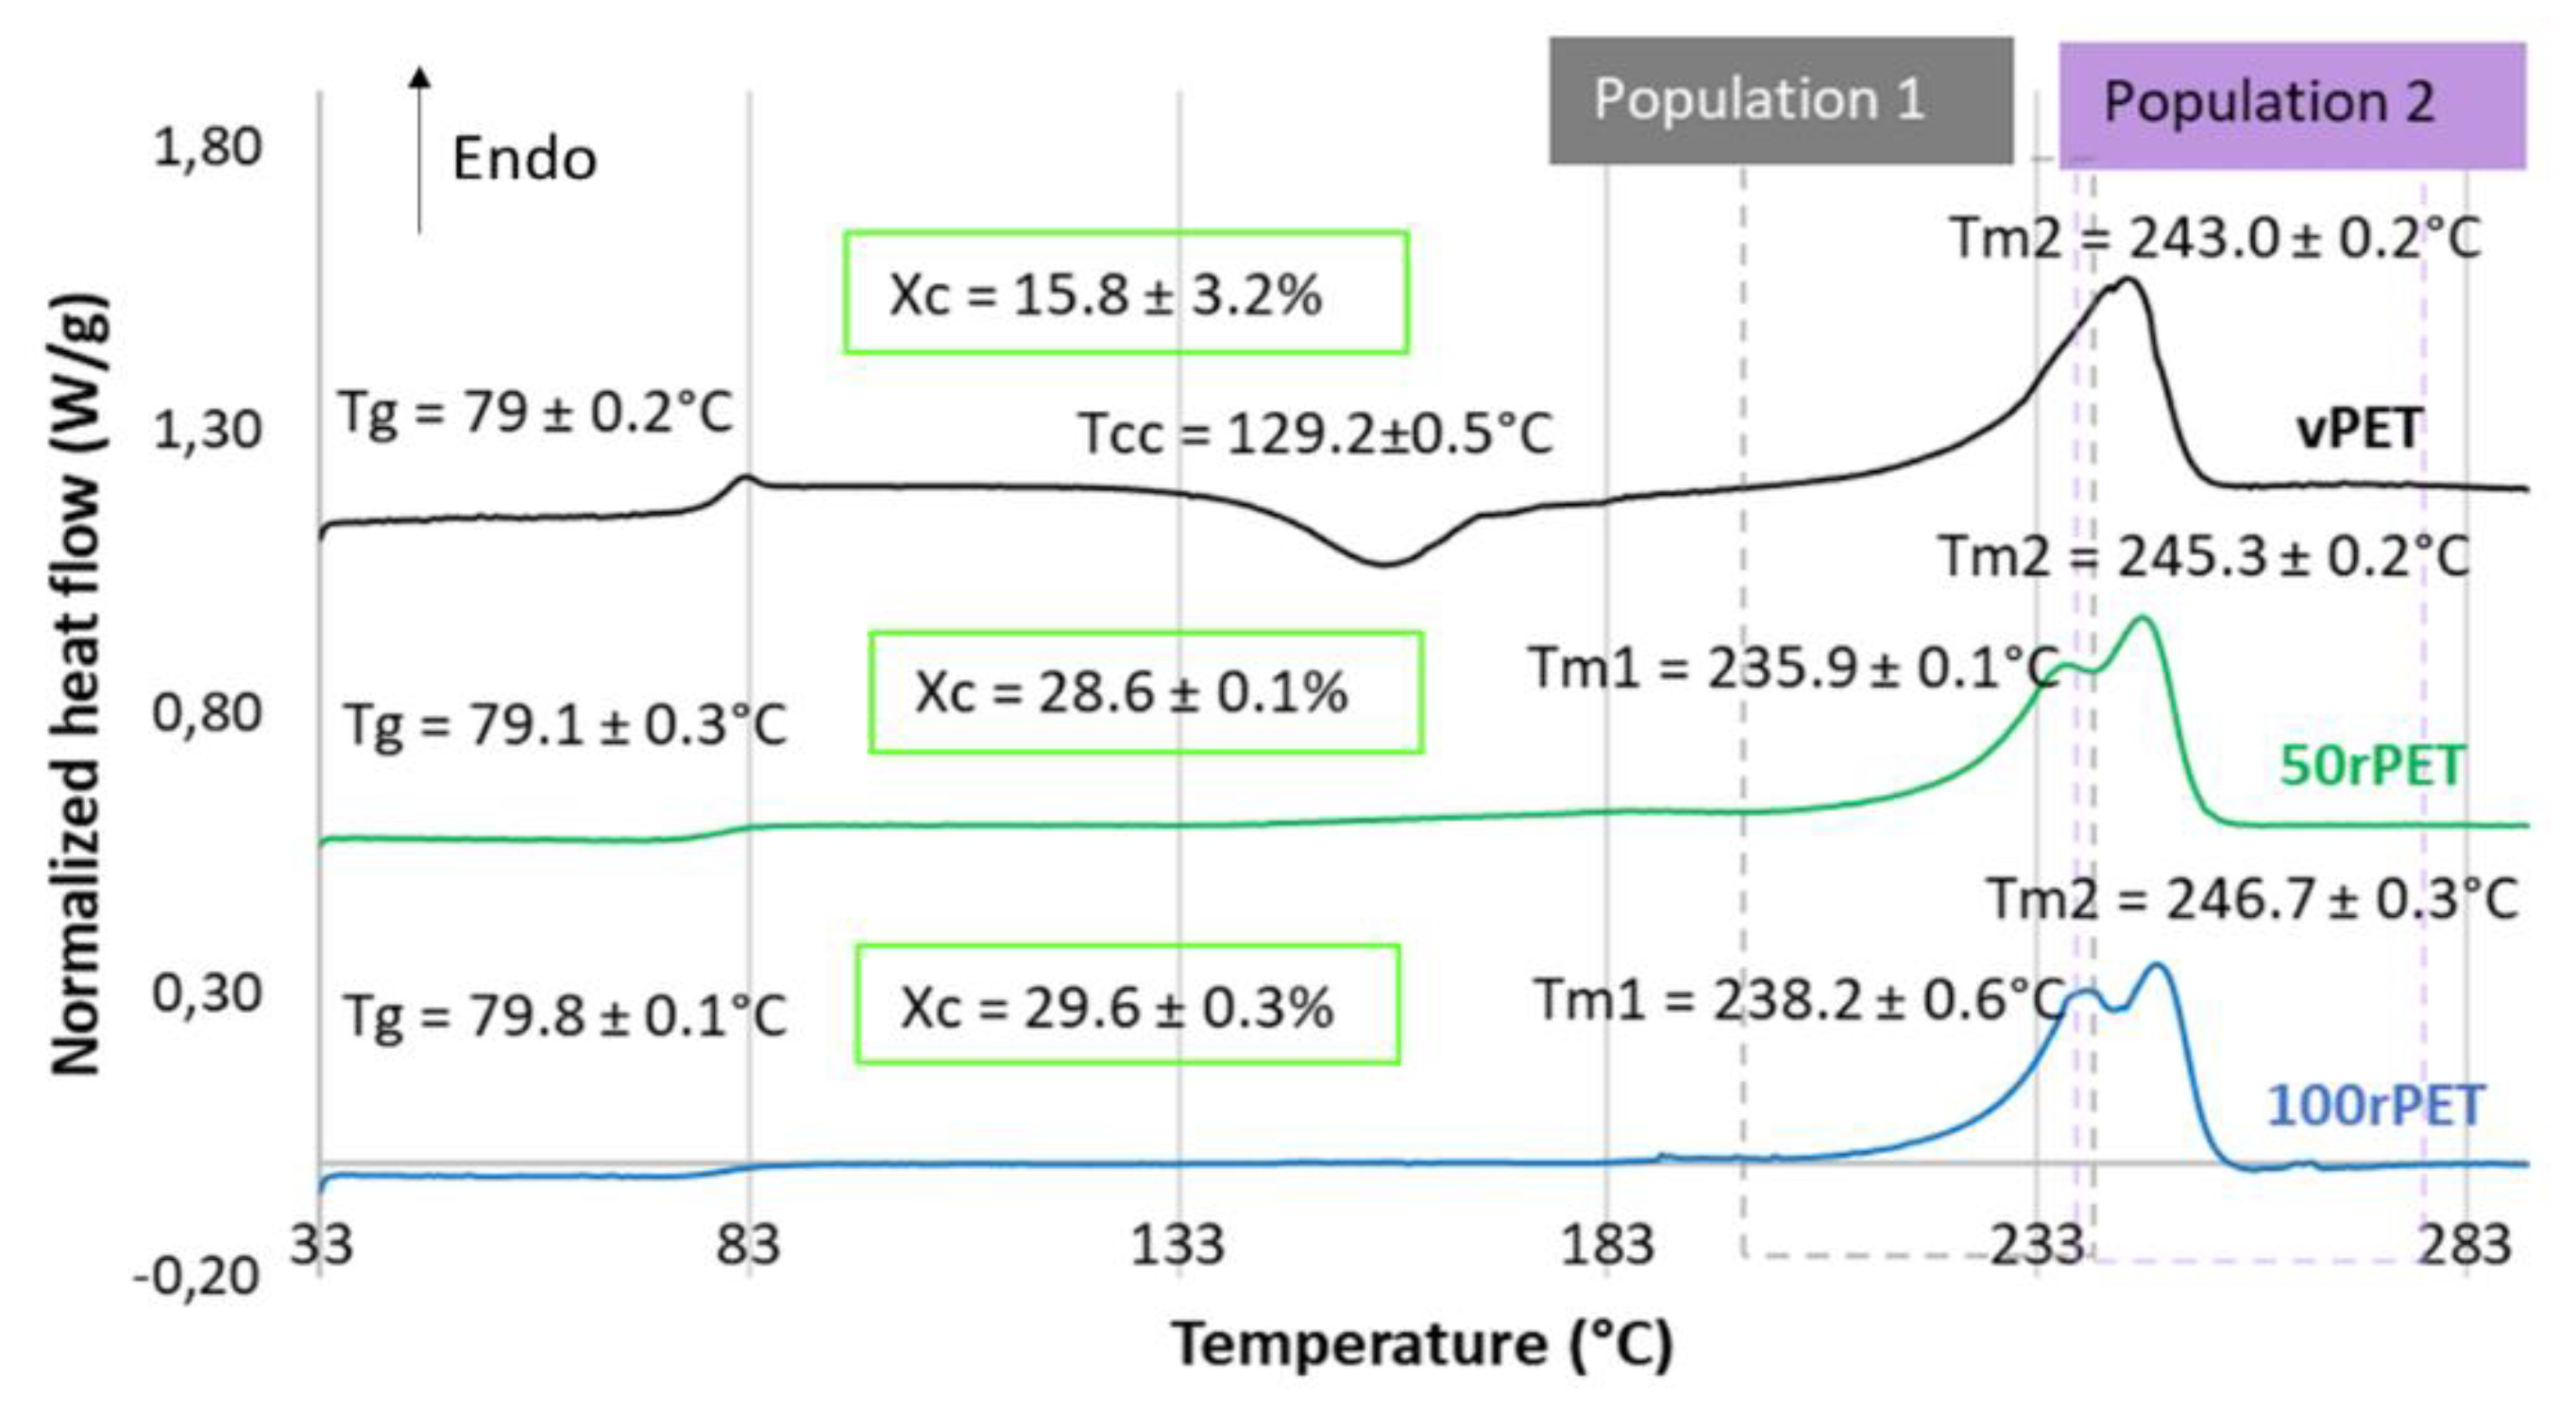
Figure 5.
Crystalline lamella thicknesses, determined by DSC measurement, during the first heating step at 10°C/min, for the lamella population 1 (a) and population 2 (b).
Figure 5.
Crystalline lamella thicknesses, determined by DSC measurement, during the first heating step at 10°C/min, for the lamella population 1 (a) and population 2 (b).
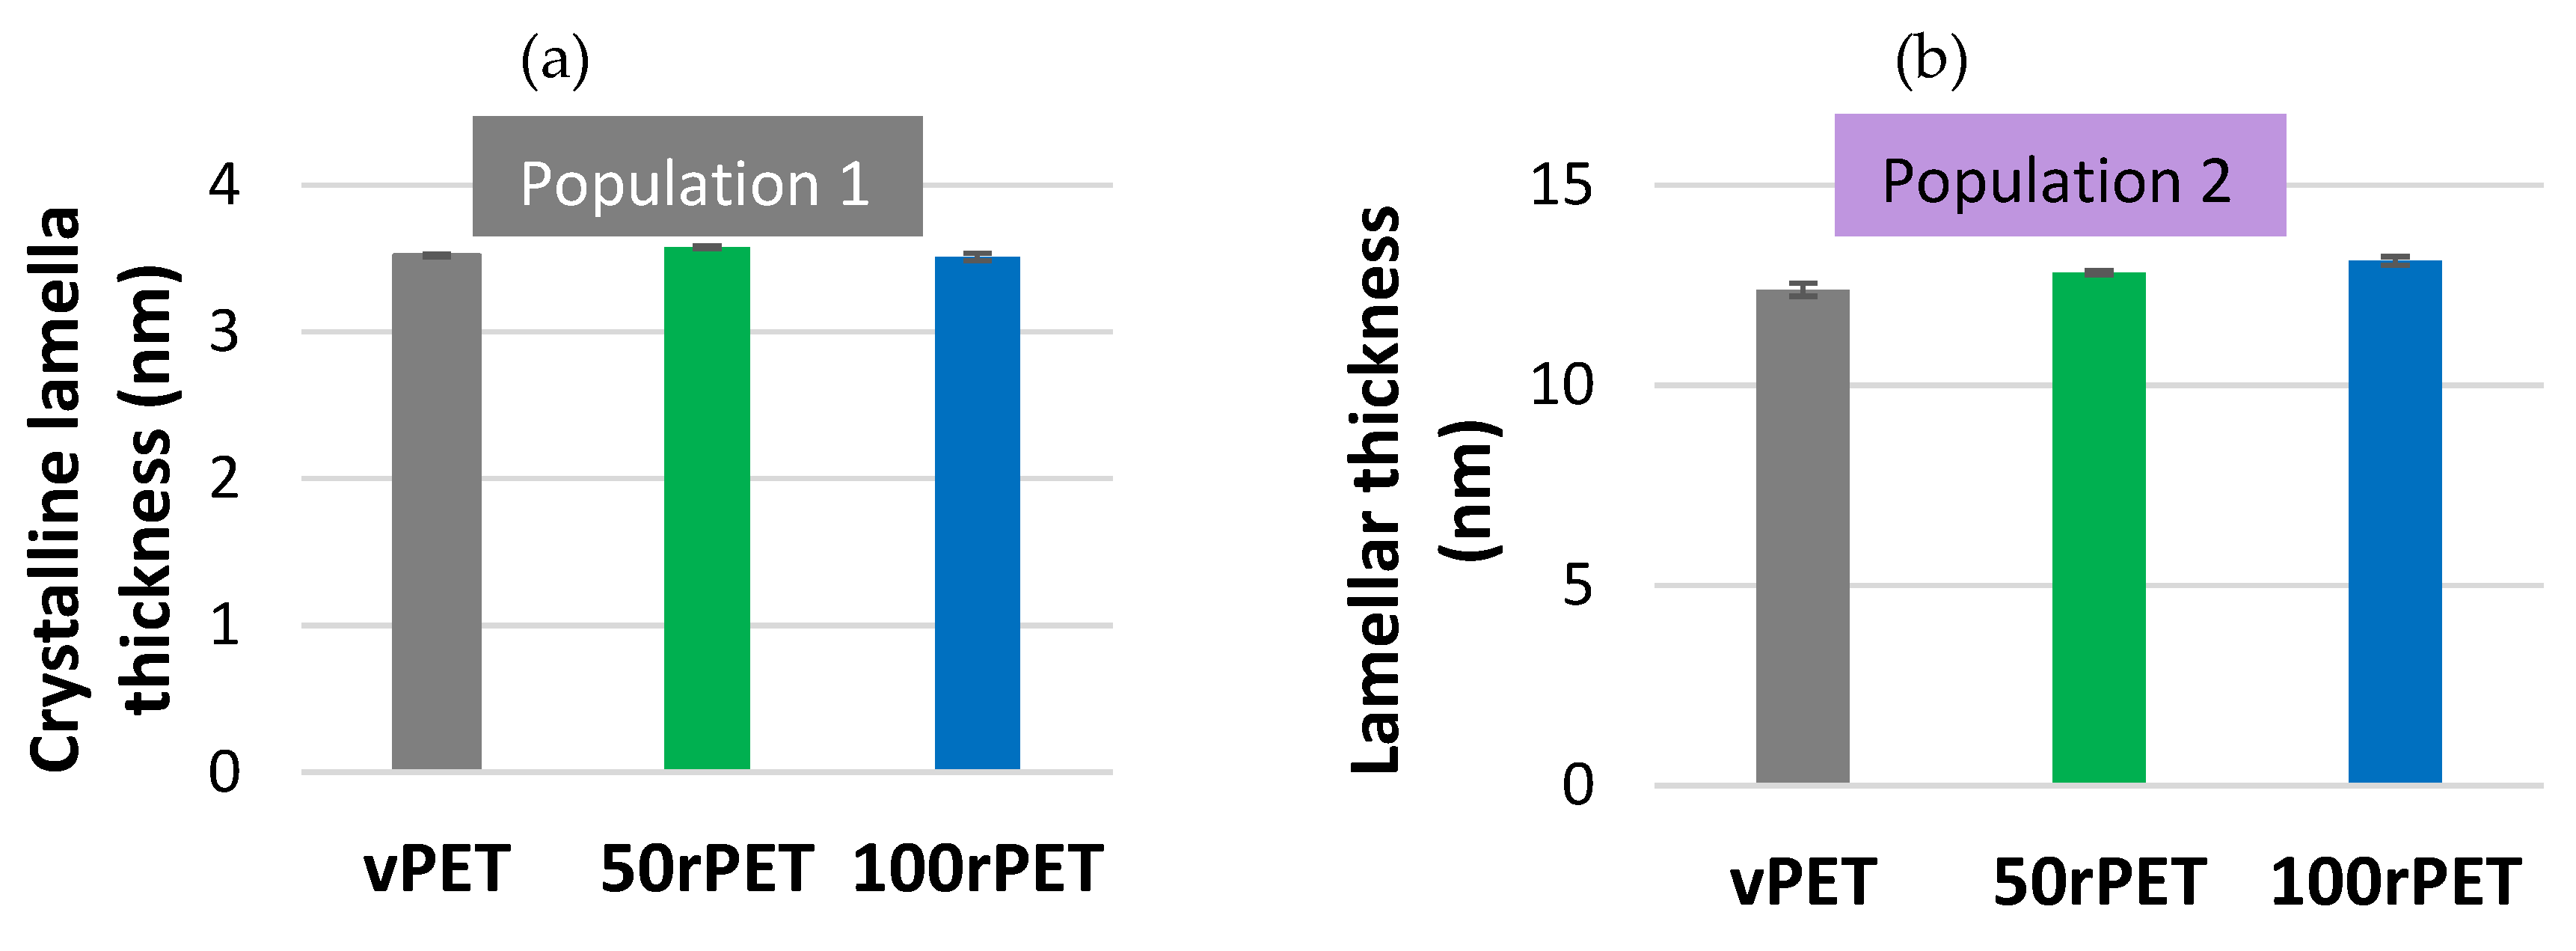
Figure 6.
Diffractograms obtained by Small Angle X-ray Scattering (SAXS) with the Lorentz correction, for vPET, 50rPET, and 100rPET associated to semi-crystalline preforms.
Figure 6.
Diffractograms obtained by Small Angle X-ray Scattering (SAXS) with the Lorentz correction, for vPET, 50rPET, and 100rPET associated to semi-crystalline preforms.
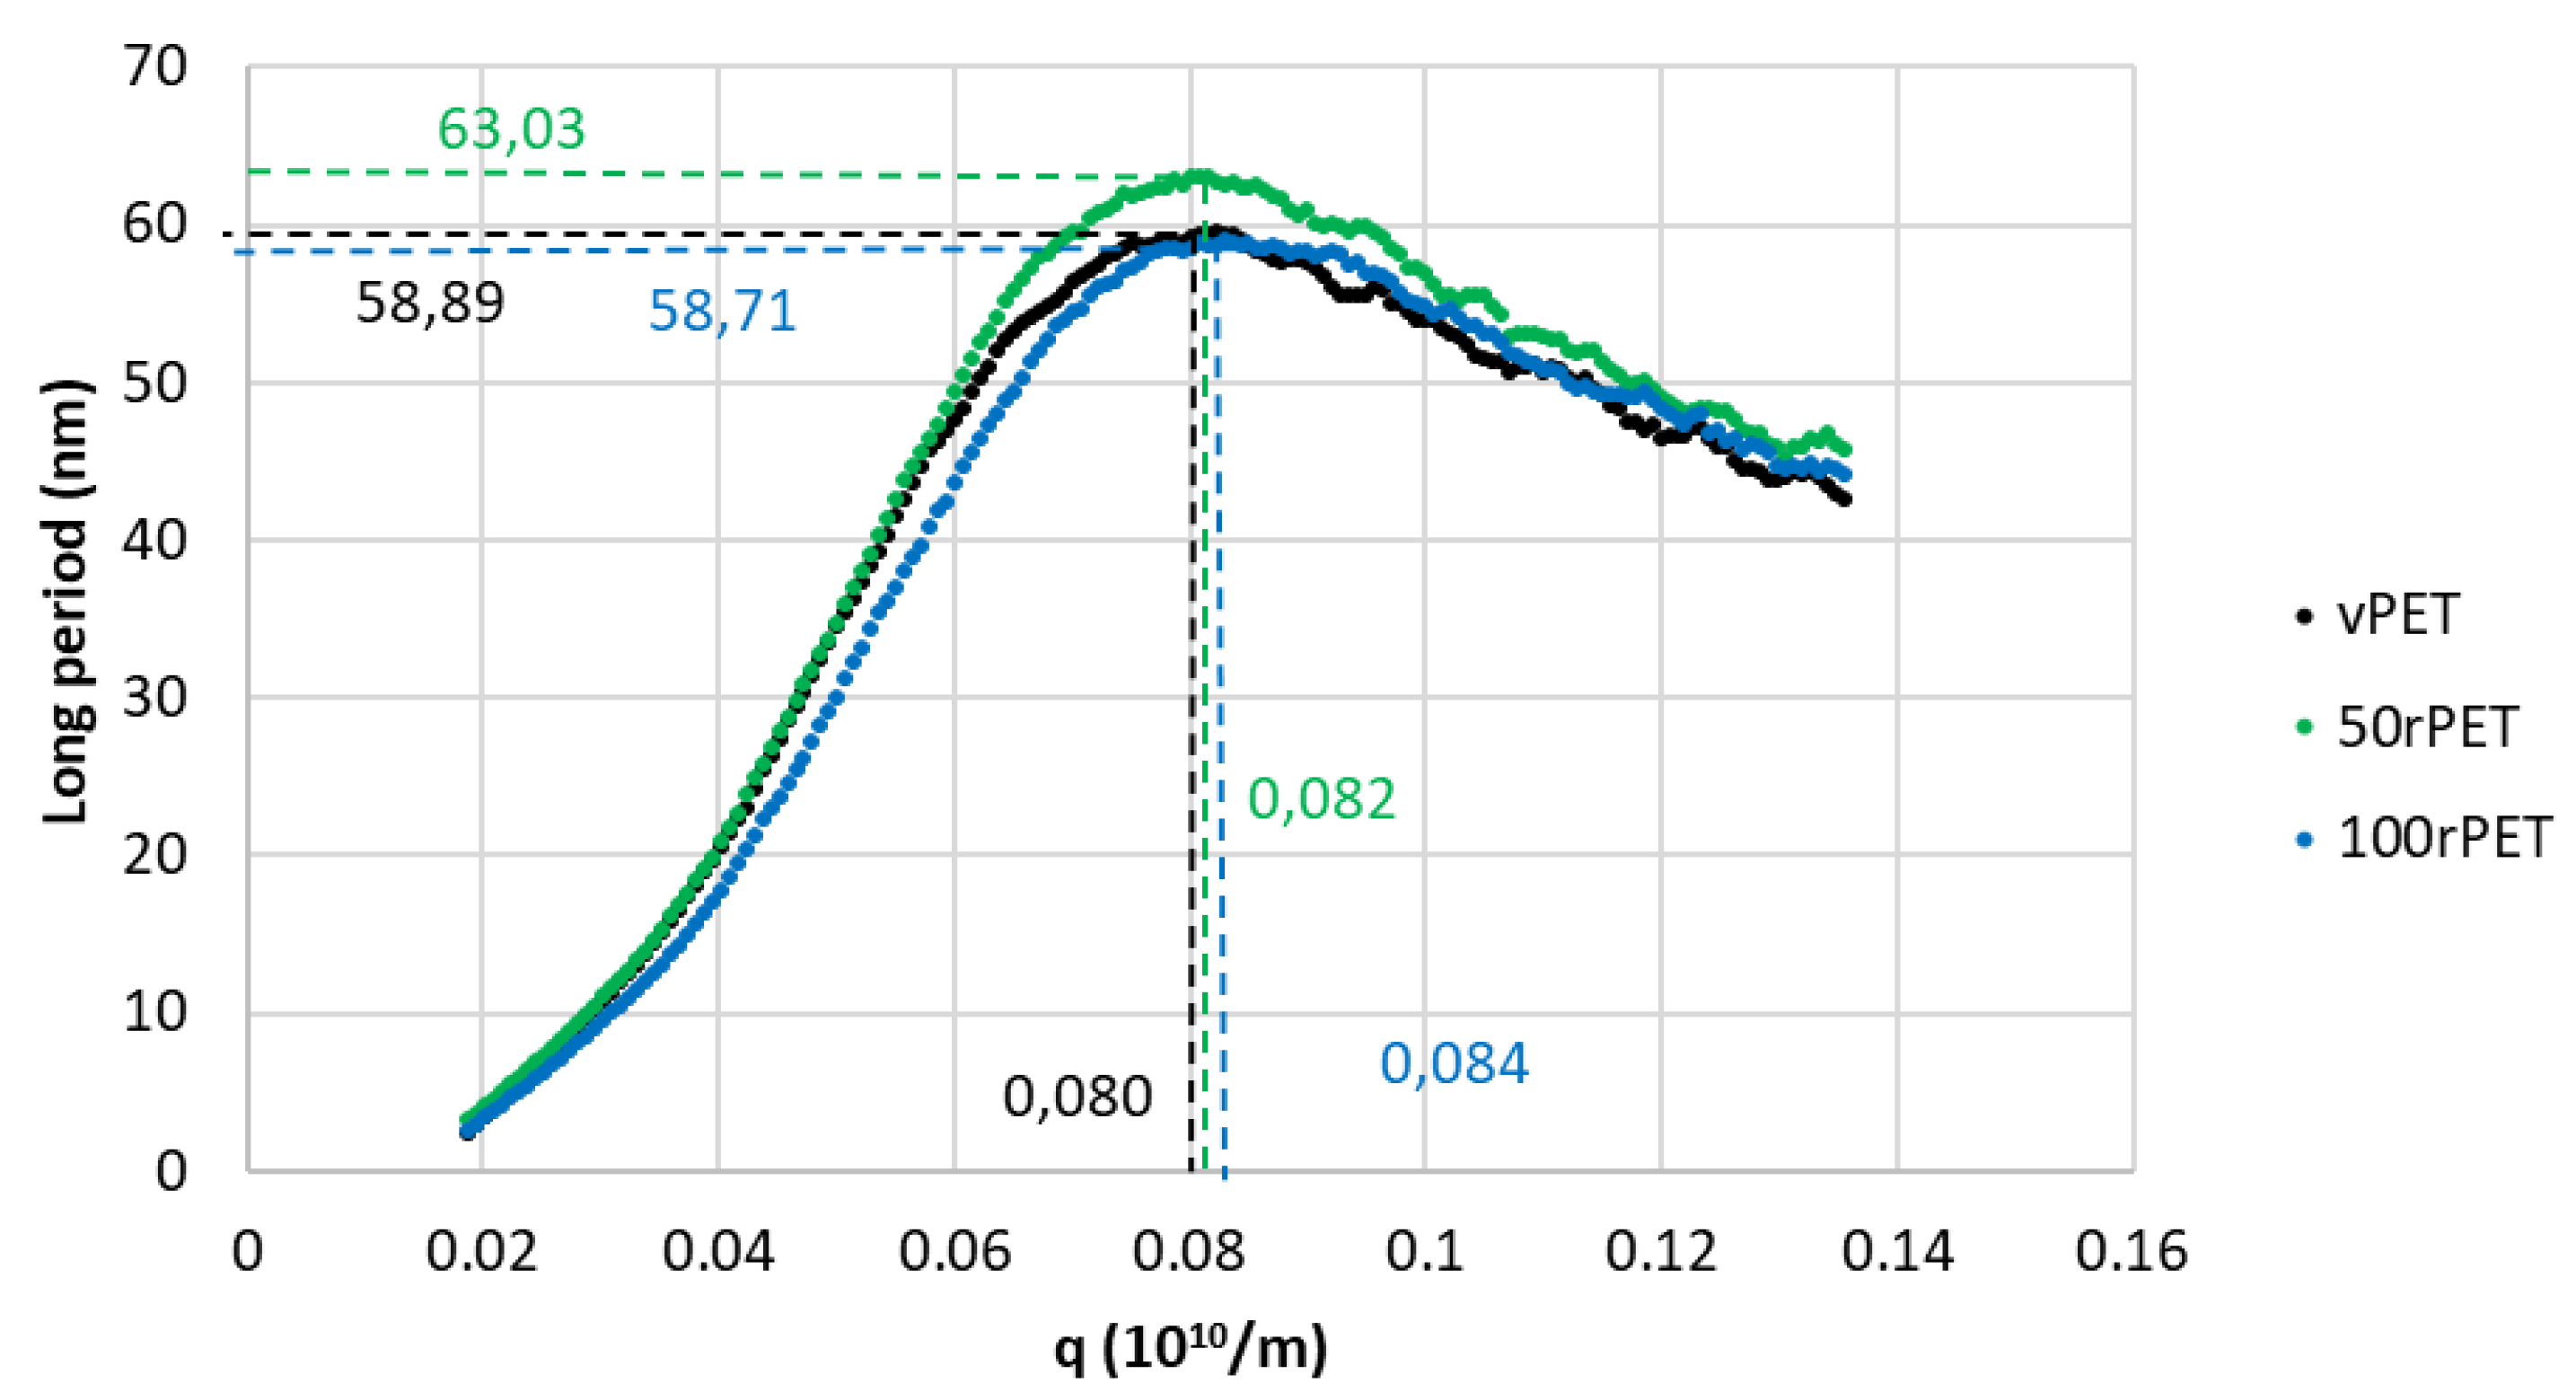
Figure 7.
Crystalline lamellar thicknesses for vPET, 50rPET, and 100rPET associated to semi-crystalline preforms, determined by SAXS analysis, coupled with crystallinity ratios Xc measured by DSC.
Figure 7.
Crystalline lamellar thicknesses for vPET, 50rPET, and 100rPET associated to semi-crystalline preforms, determined by SAXS analysis, coupled with crystallinity ratios Xc measured by DSC.
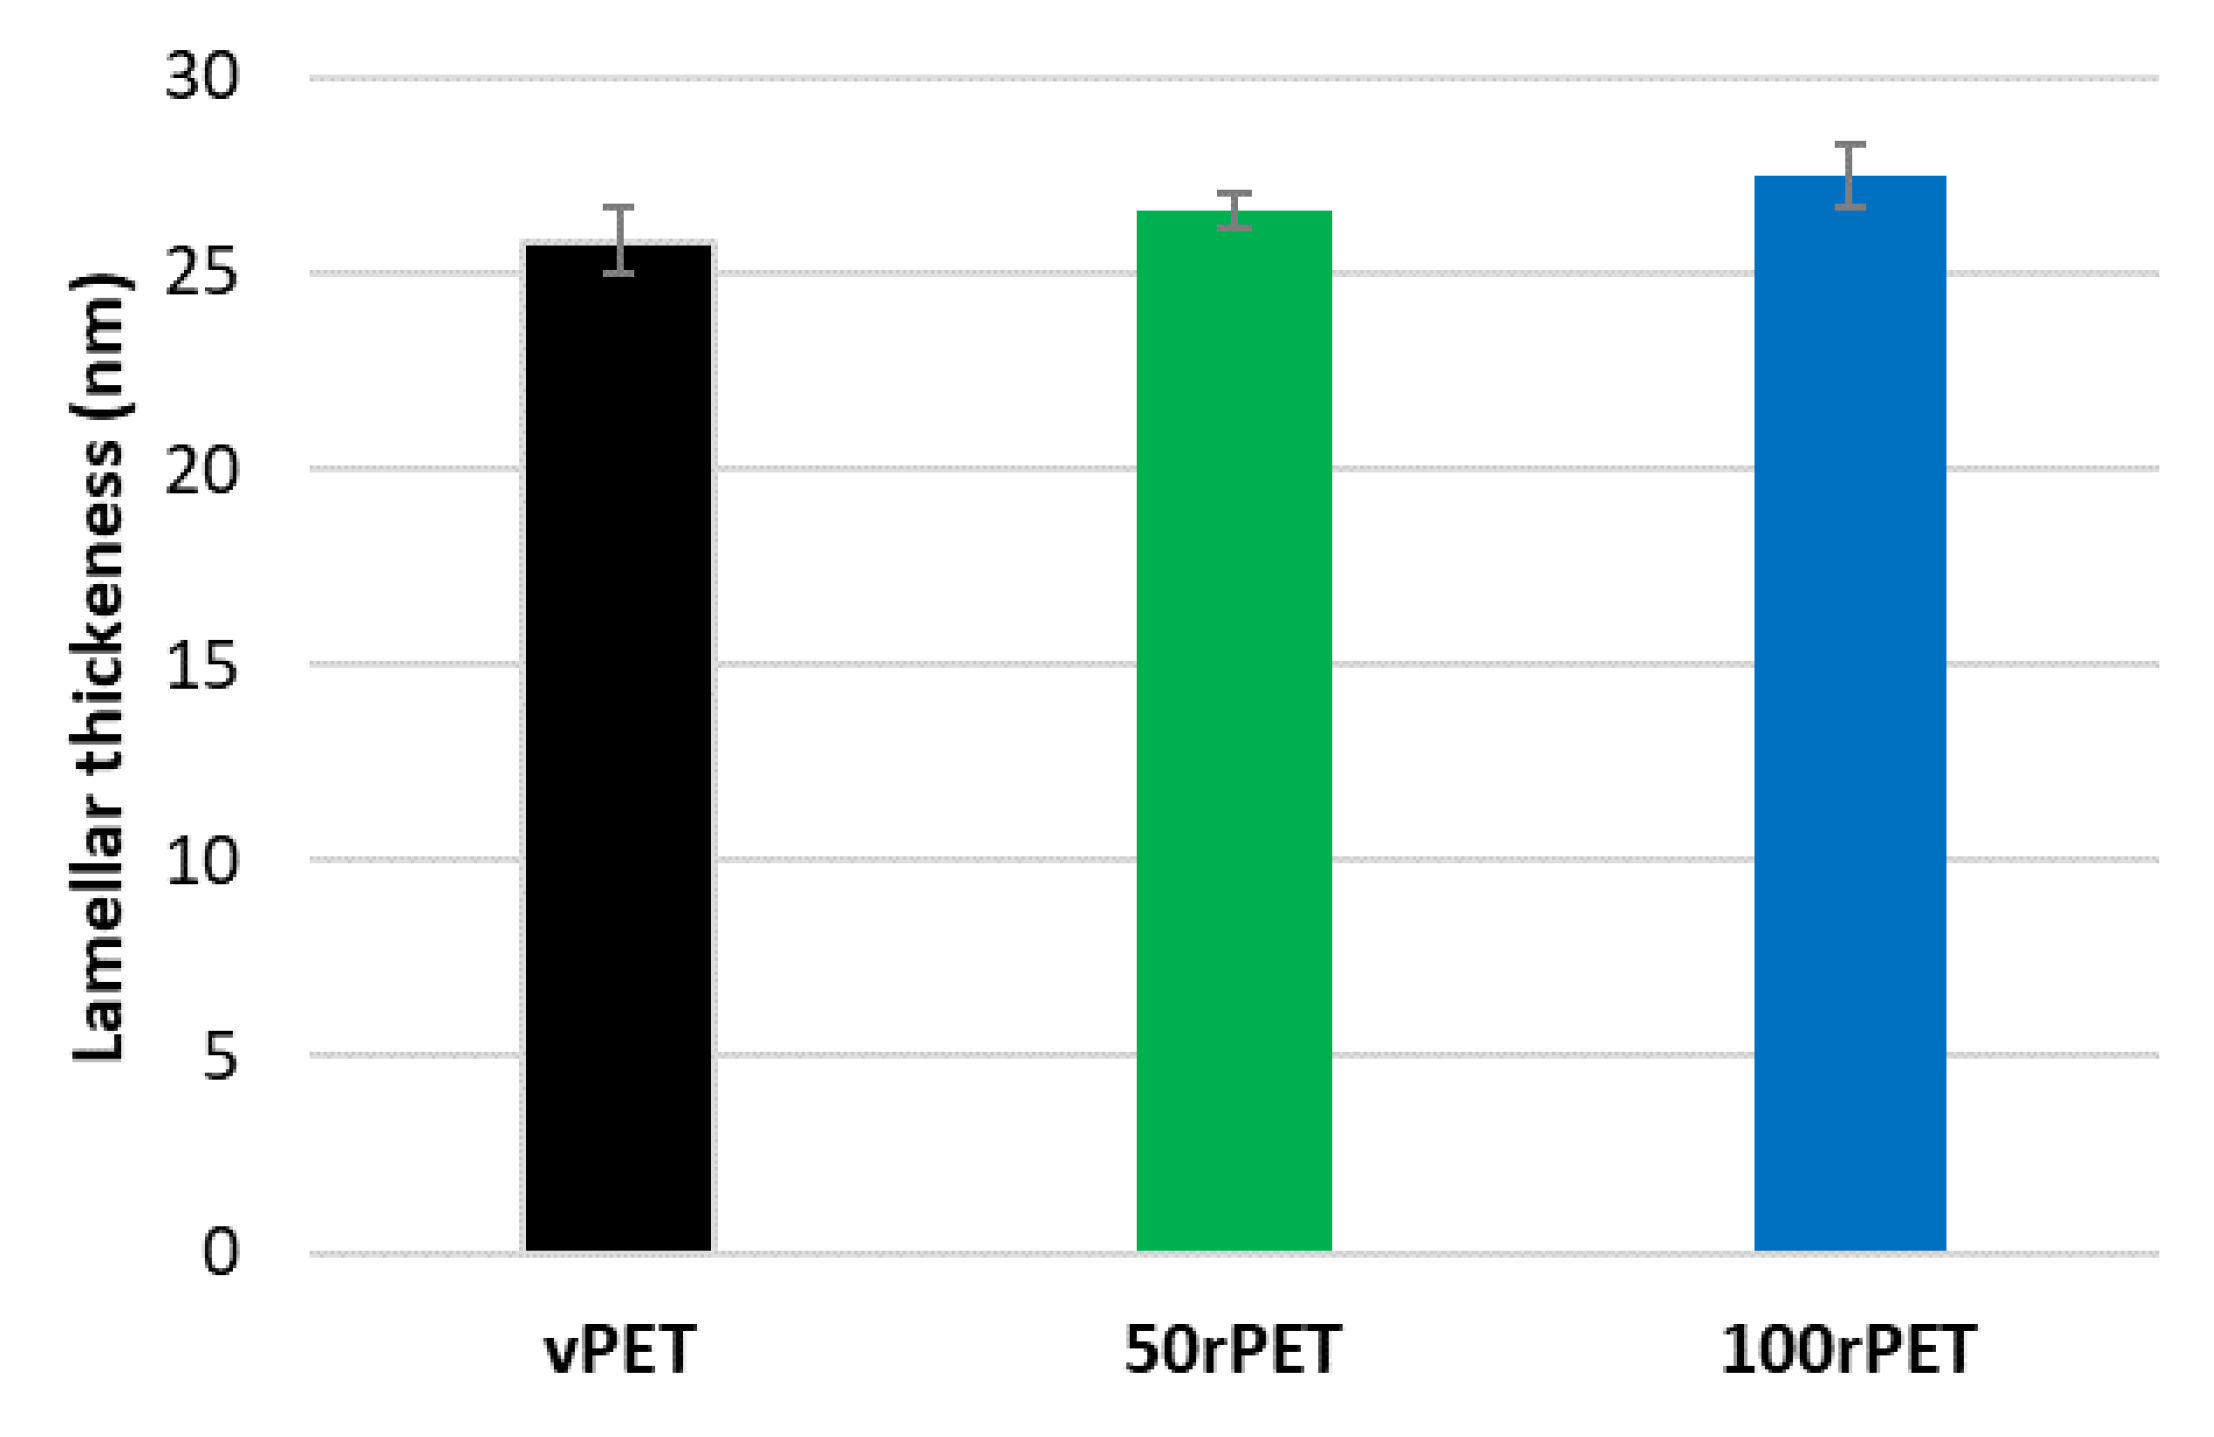
Figure 8.
AFM images of vPET with the topography (a), the indentation (b), the contact modulus (c) and the histogram of elastic moduli (d).
Figure 8.
AFM images of vPET with the topography (a), the indentation (b), the contact modulus (c) and the histogram of elastic moduli (d).
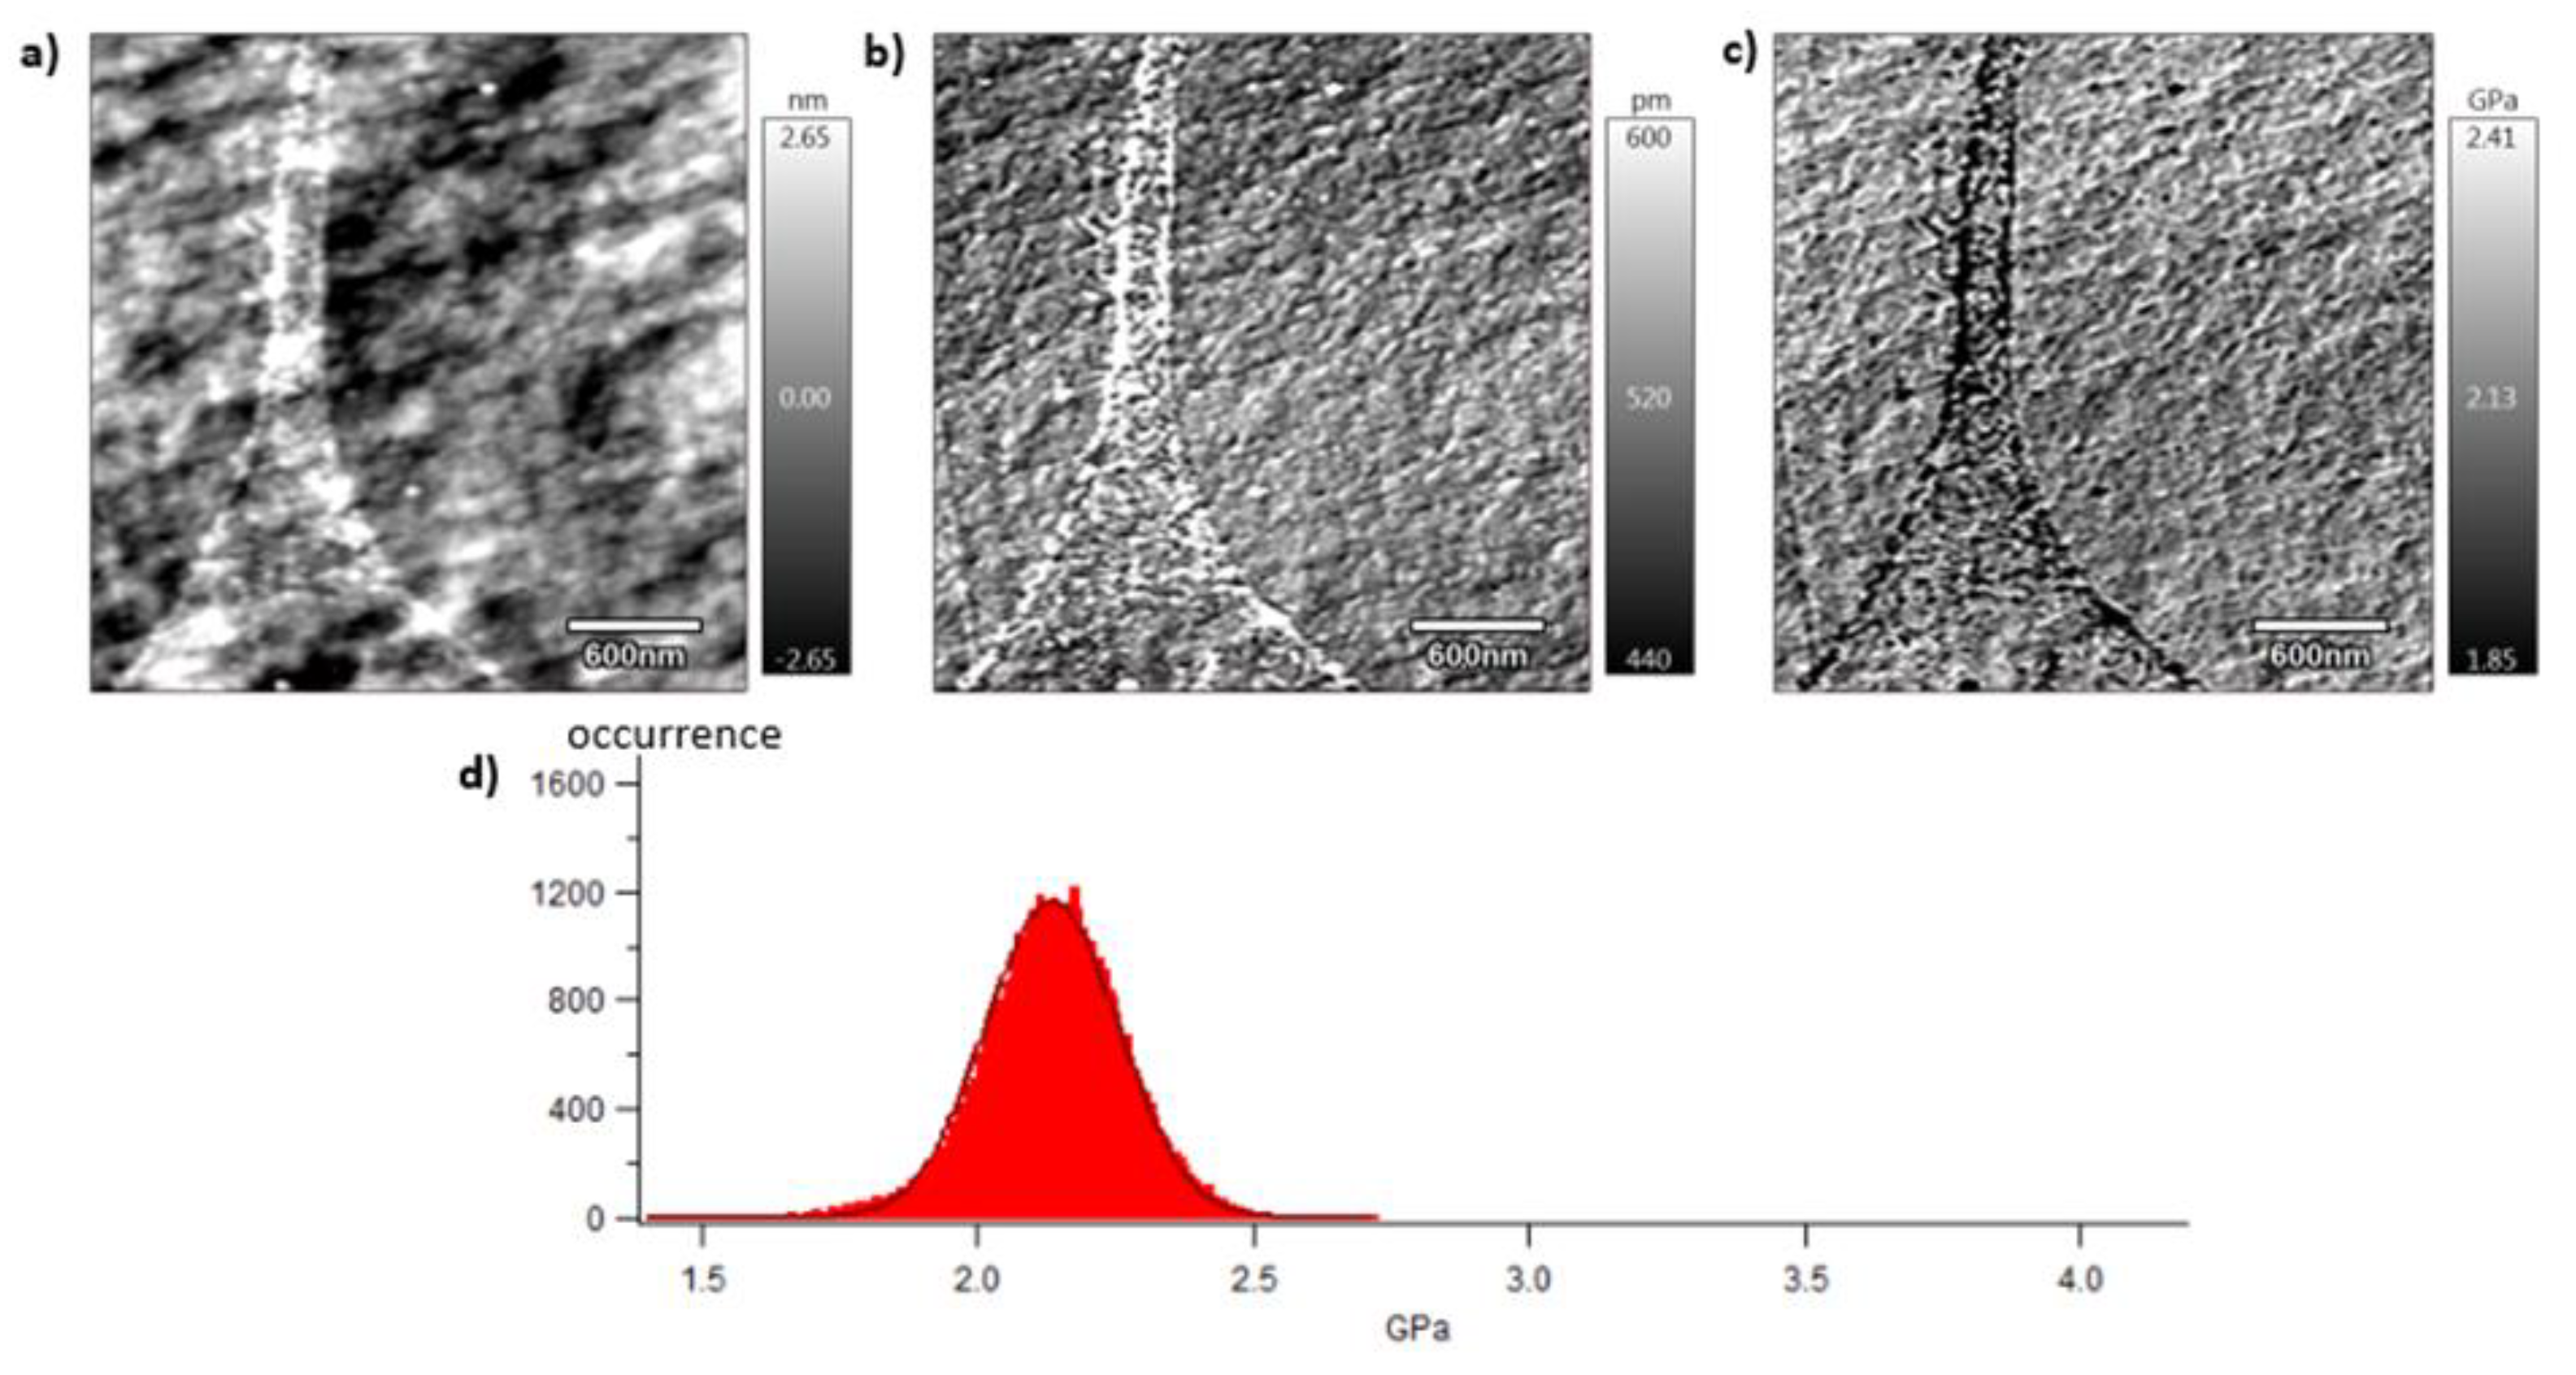
Figure 9.
AFM images of 100rPET with the topography (a), the indentation (b), the contact modulus (c), and the histogram of elastic moduli (d).
Figure 9.
AFM images of 100rPET with the topography (a), the indentation (b), the contact modulus (c), and the histogram of elastic moduli (d).
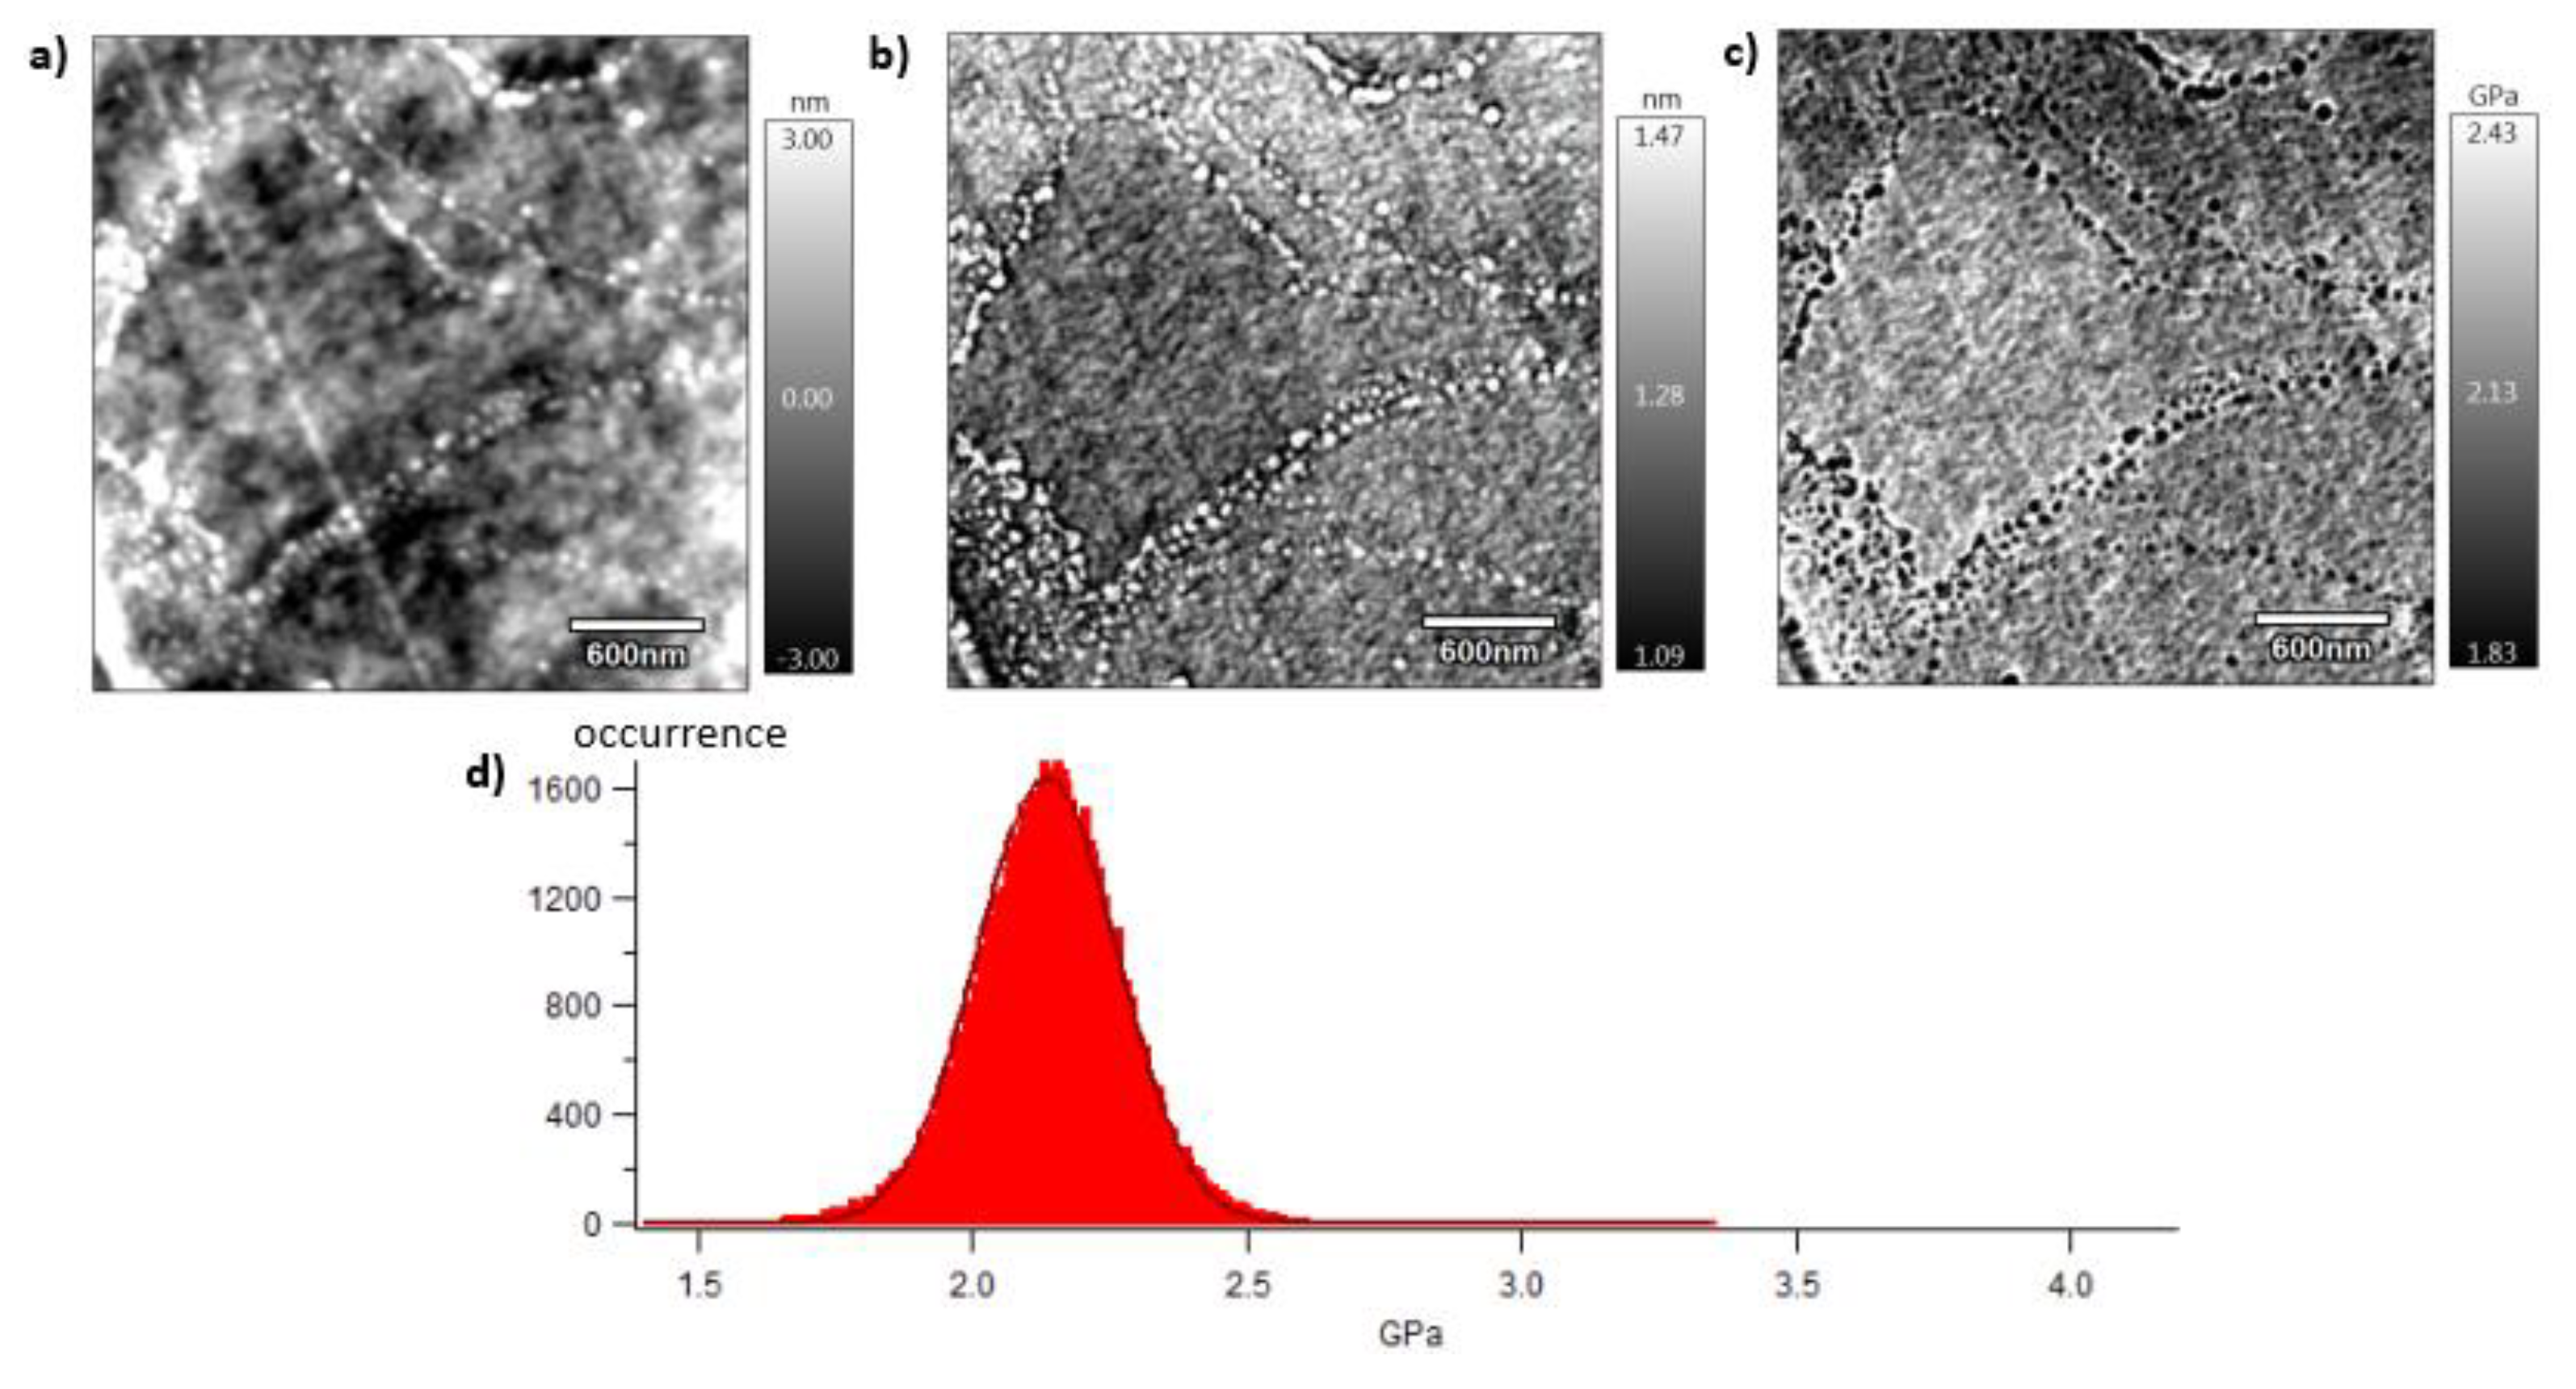
Figure 10.
AFM images of 50rPET with the topography (a), the indentation (b), the contact modulus (c) and the histogram of elastic moduli (d).
Figure 10.
AFM images of 50rPET with the topography (a), the indentation (b), the contact modulus (c) and the histogram of elastic moduli (d).
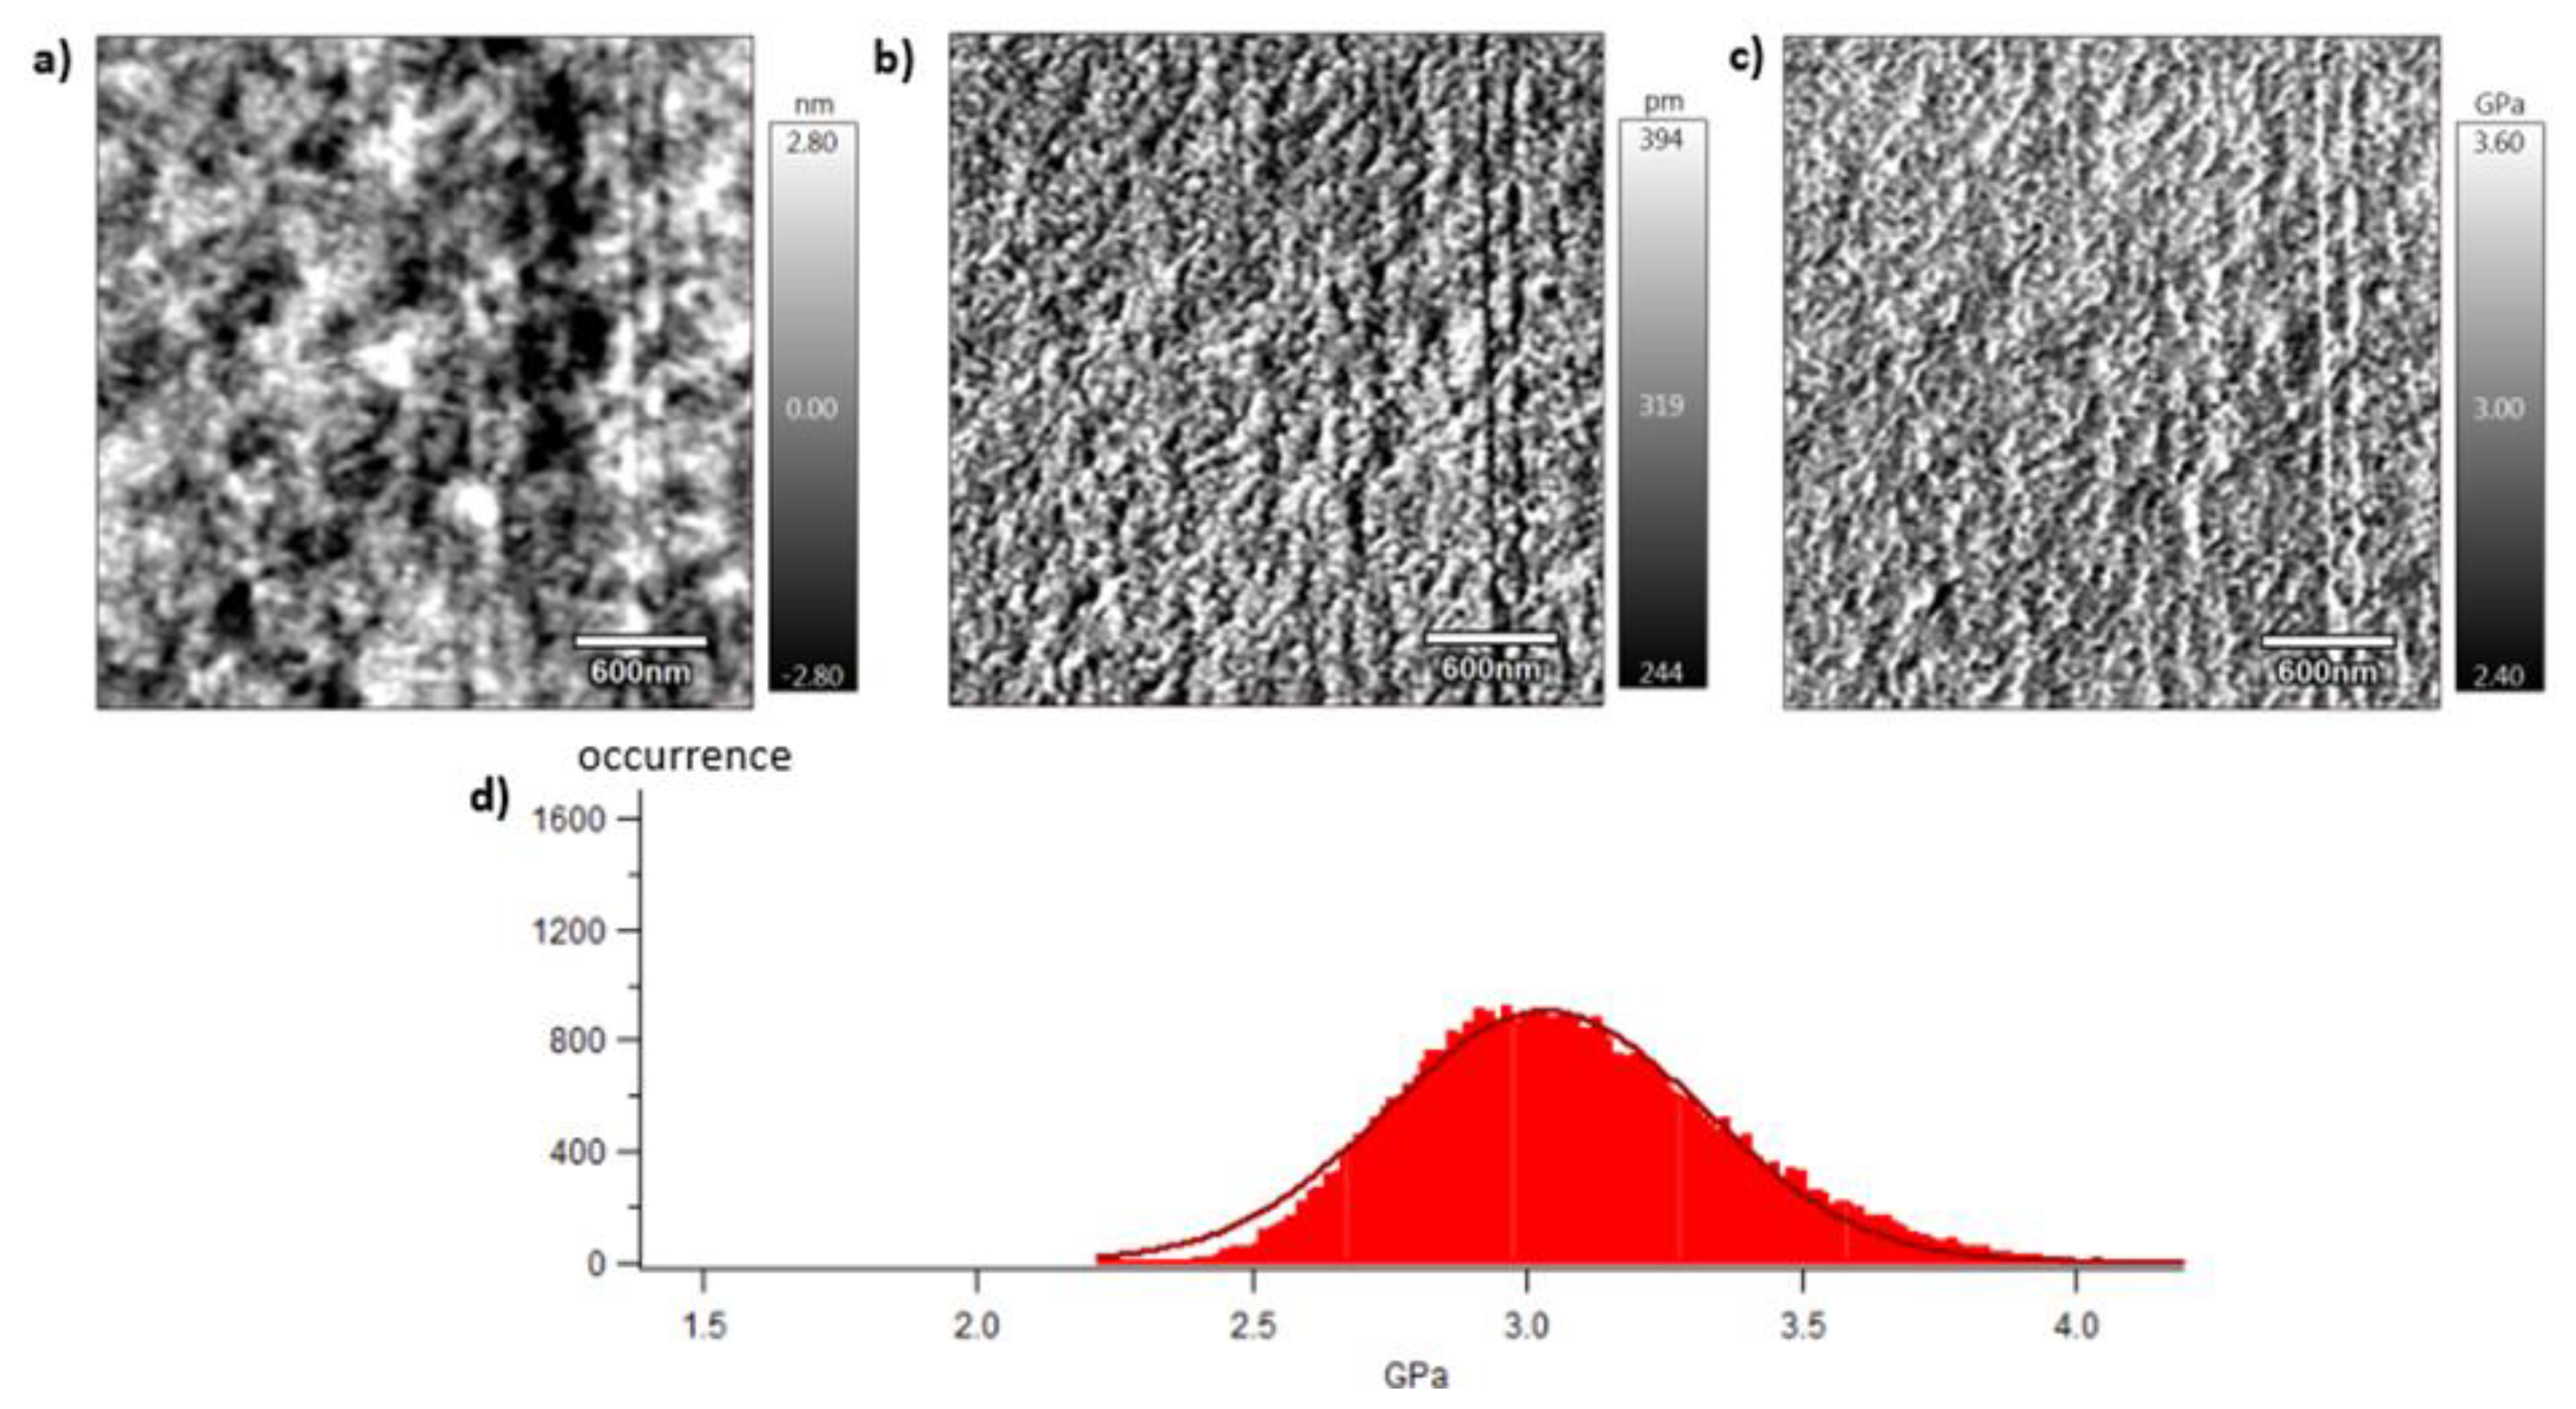
Figure 11.
Storage modulus (E’) as a function of temperature for vPET, 50rPET and 100rPET measured by DMA, in tensile mode, at a frequency of 1 Hz and a heating rate of 2°C/min.
Figure 11.
Storage modulus (E’) as a function of temperature for vPET, 50rPET and 100rPET measured by DMA, in tensile mode, at a frequency of 1 Hz and a heating rate of 2°C/min.
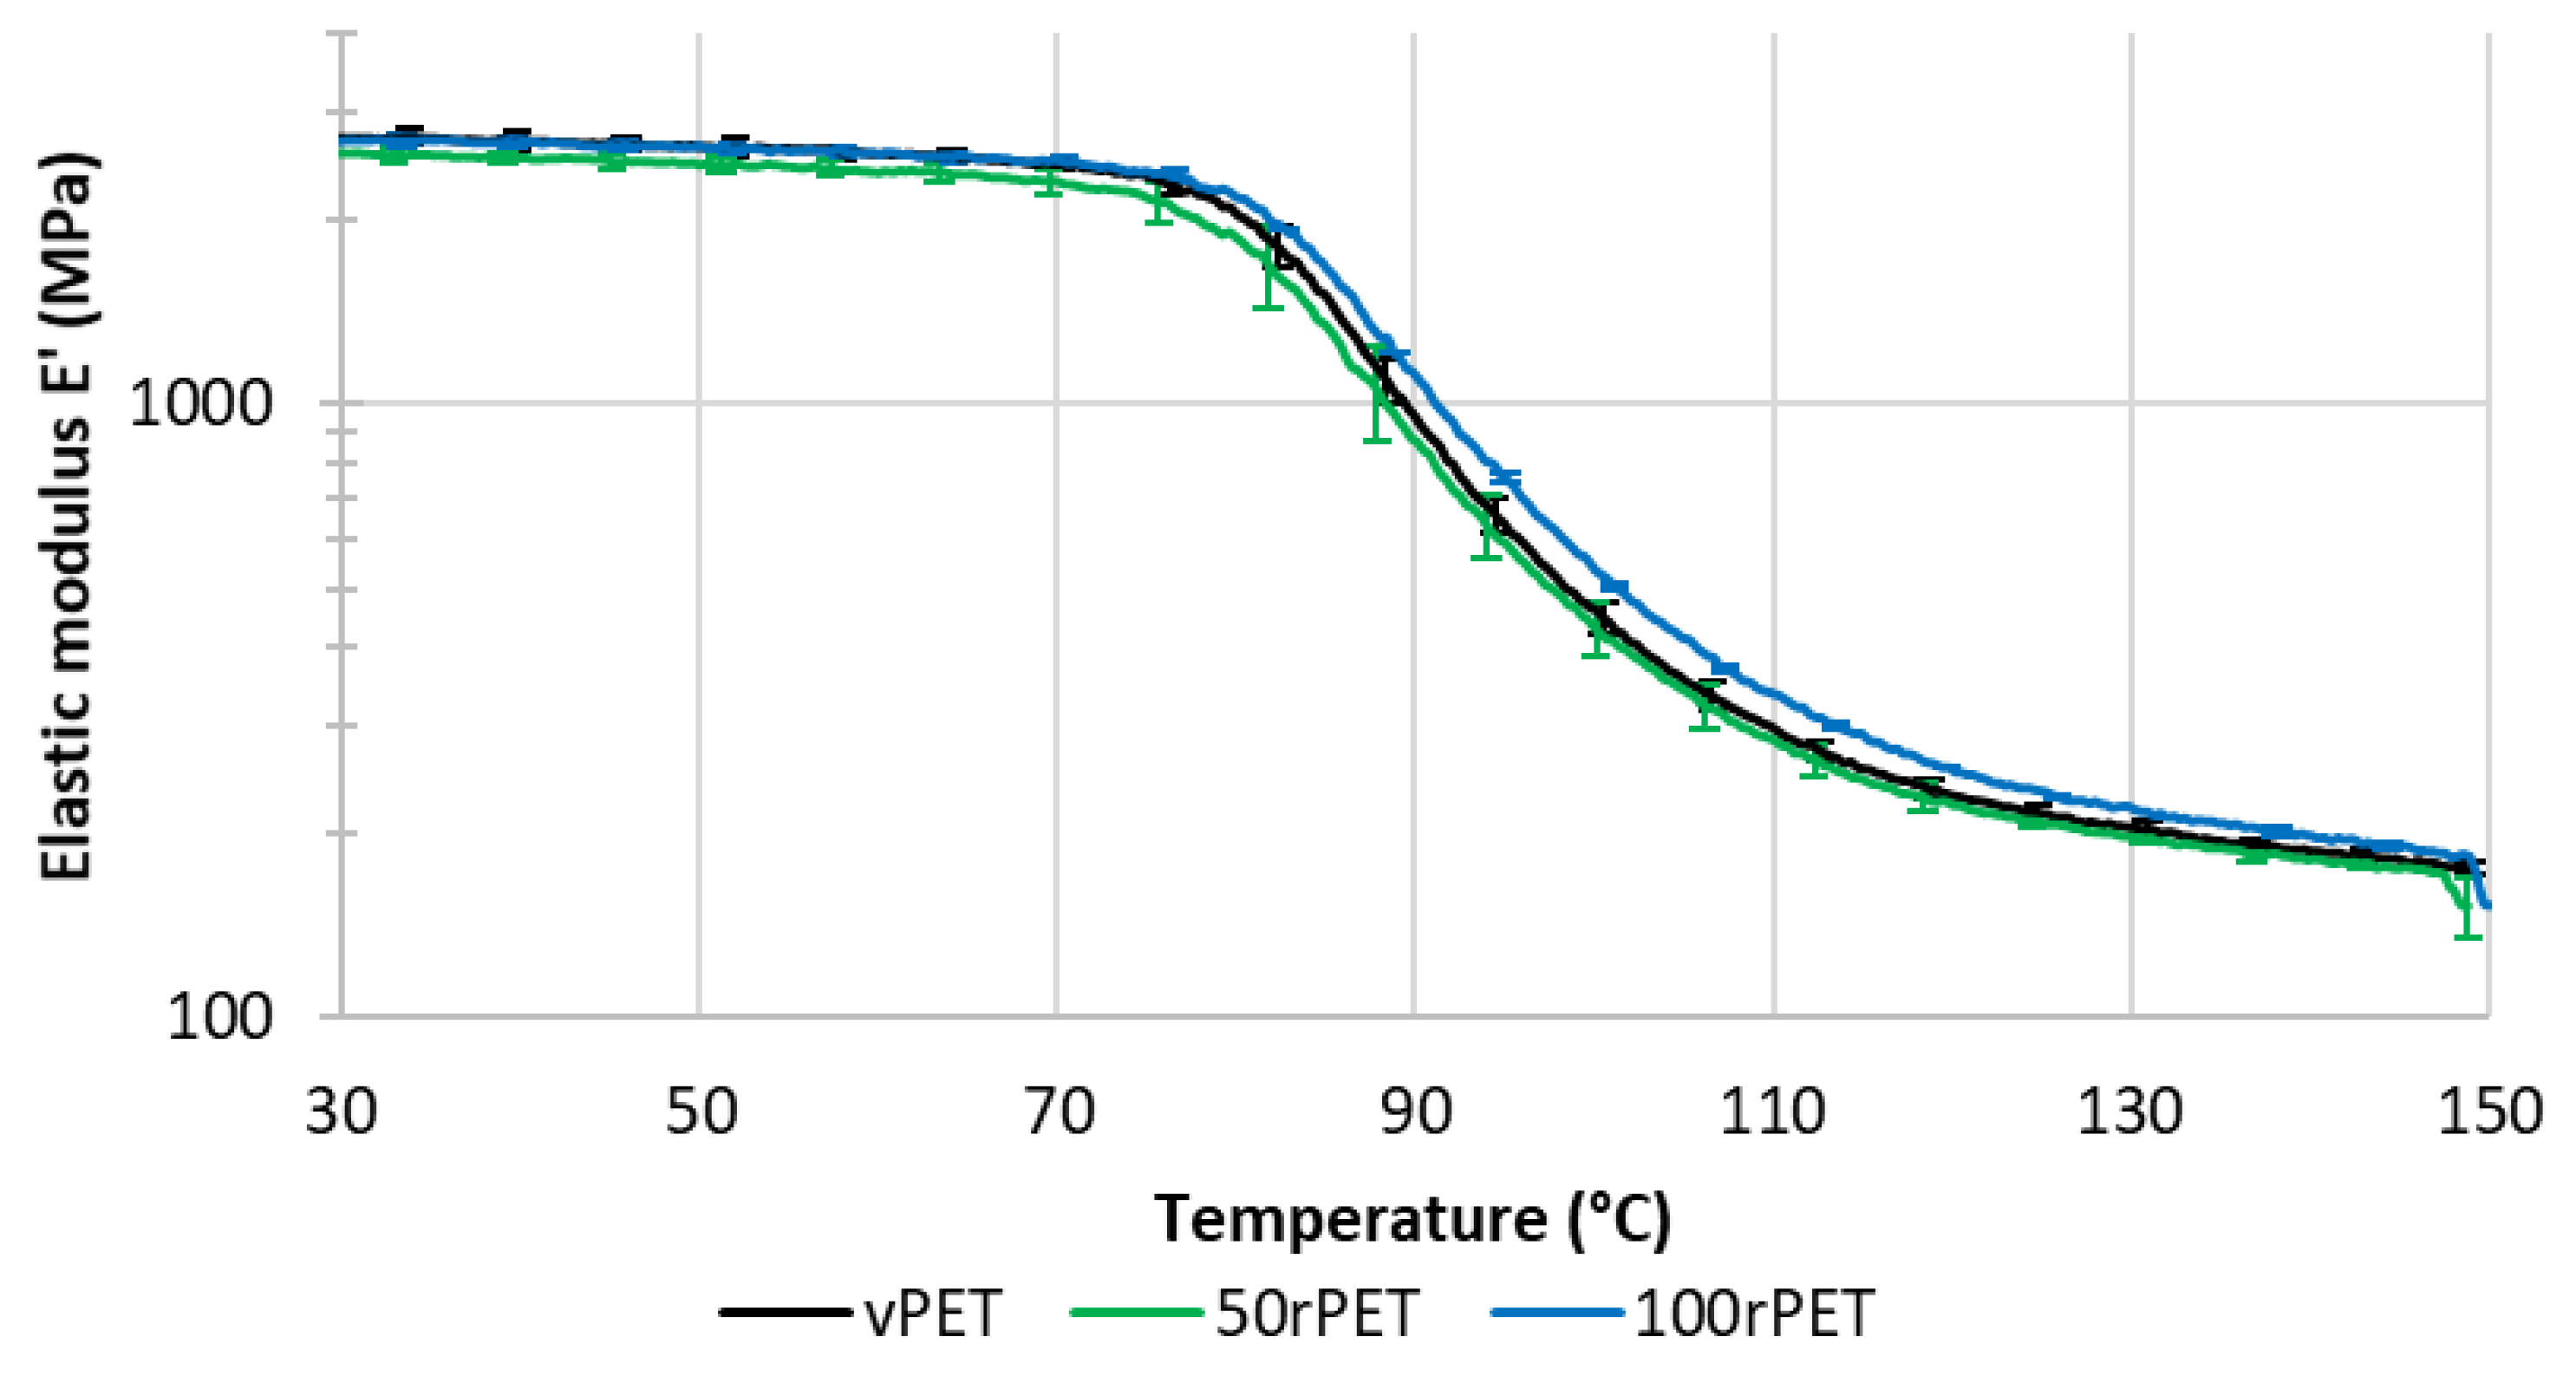
Figure 12.
Phase angle (Tan δ) as a function of temperature for vPET, 50rPET and 100rPET measured by DMA, in tensile mode, at a frequency of 1 Hz and a heating rate of 2°C/min.
Figure 12.
Phase angle (Tan δ) as a function of temperature for vPET, 50rPET and 100rPET measured by DMA, in tensile mode, at a frequency of 1 Hz and a heating rate of 2°C/min.
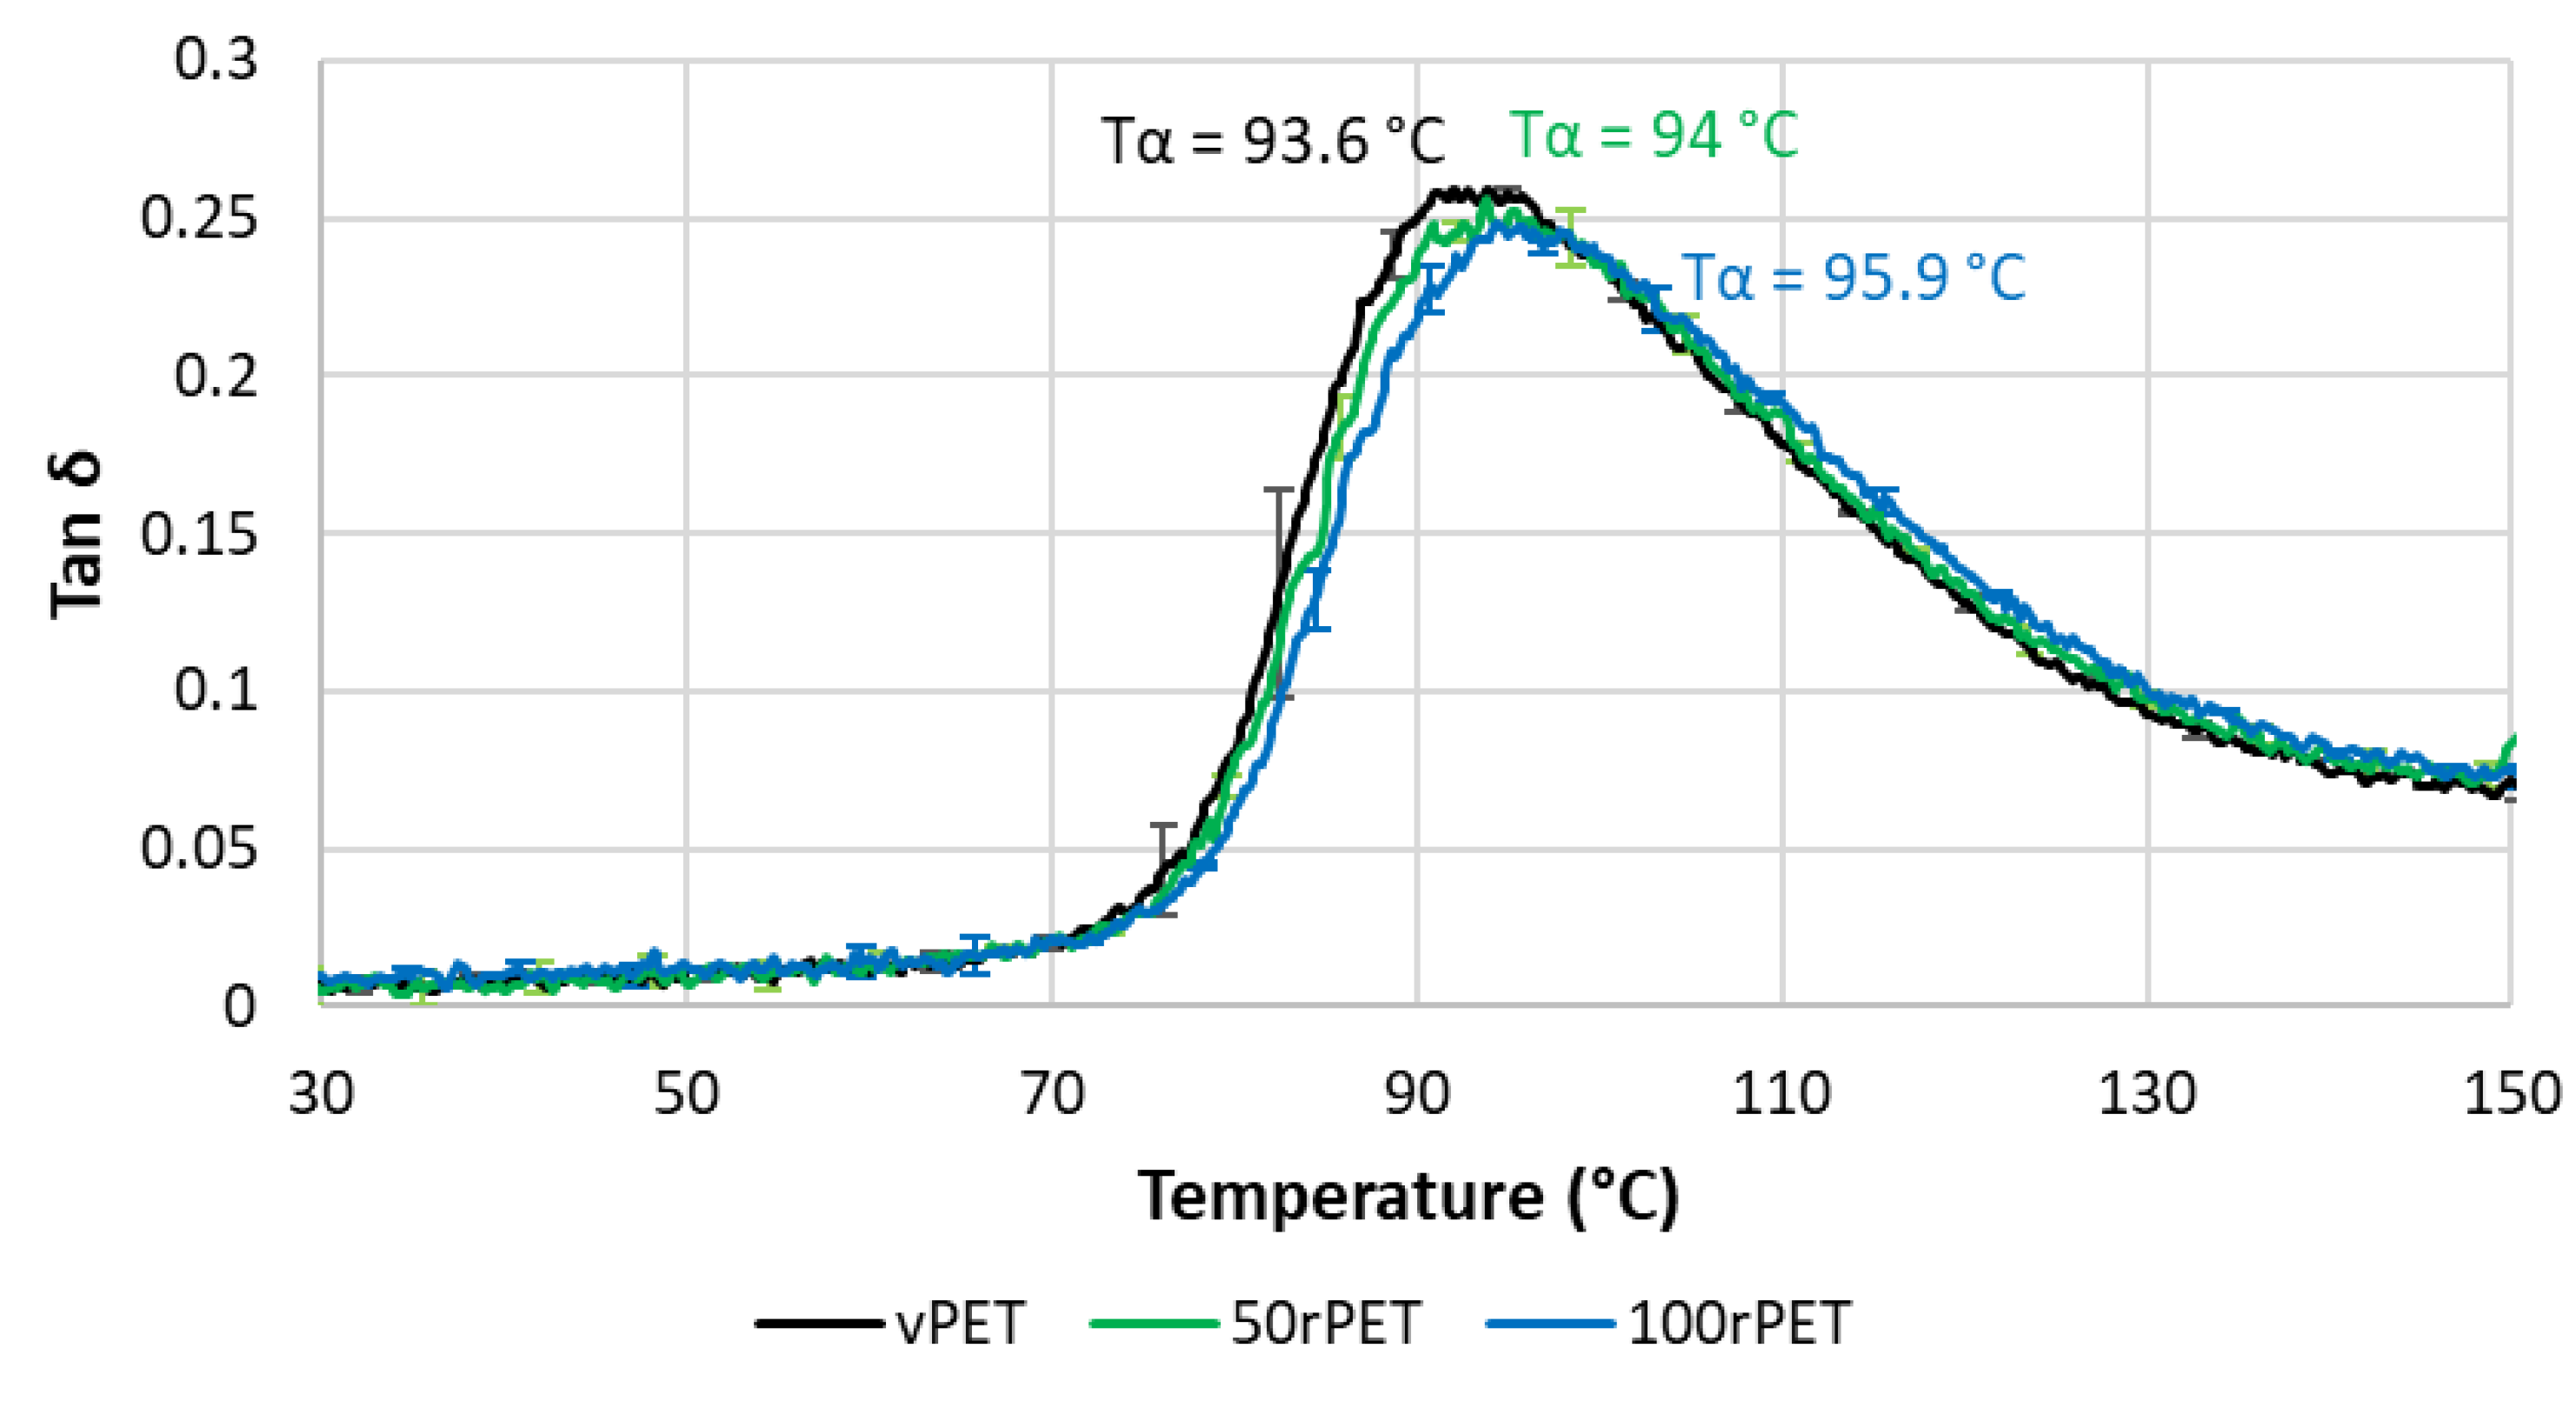
Figure 13.
Stress-strain curves of standard samples for vPET, 50rPET, and 100rPET, obtained in uni-axial conditions until rupture, at room temperature and a cross head velocity of 5 mm/min.
Figure 13.
Stress-strain curves of standard samples for vPET, 50rPET, and 100rPET, obtained in uni-axial conditions until rupture, at room temperature and a cross head velocity of 5 mm/min.
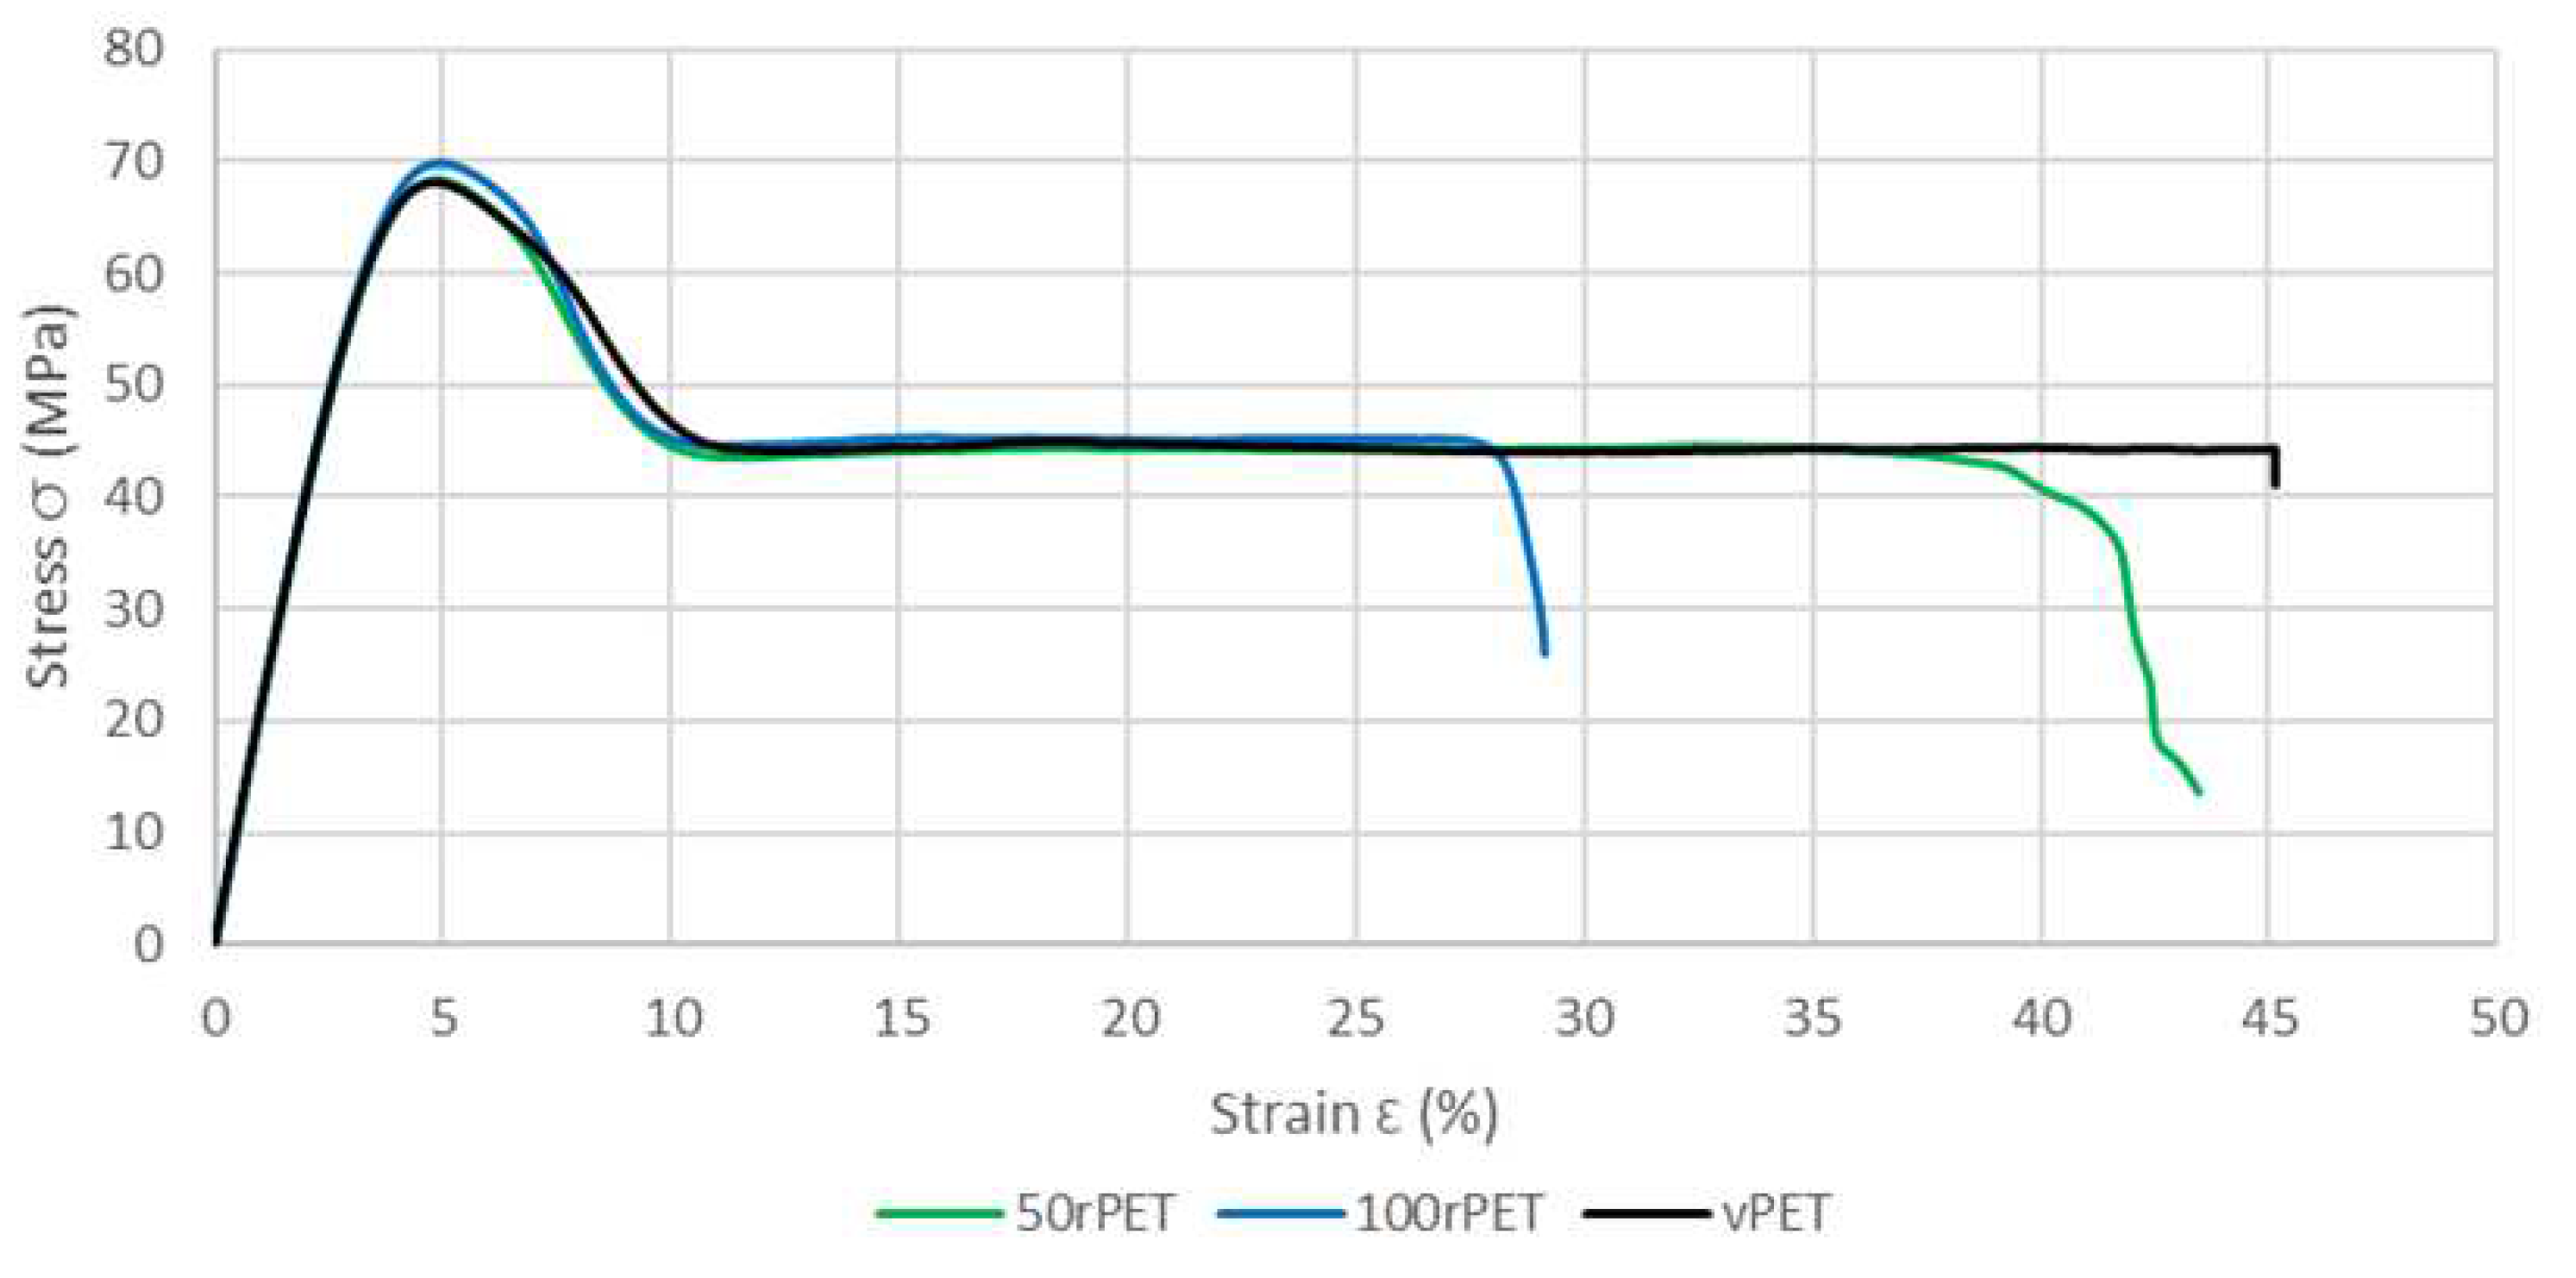
Figure 14.
Zoom of stress-strain curves of standard samples for vPET, 50rPET, and 100rPET, until a deformation of 0.2 %, obtained in uni-axial conditions with an extensometer to calculate the Young’s modulus.
Figure 14.
Zoom of stress-strain curves of standard samples for vPET, 50rPET, and 100rPET, until a deformation of 0.2 %, obtained in uni-axial conditions with an extensometer to calculate the Young’s modulus.
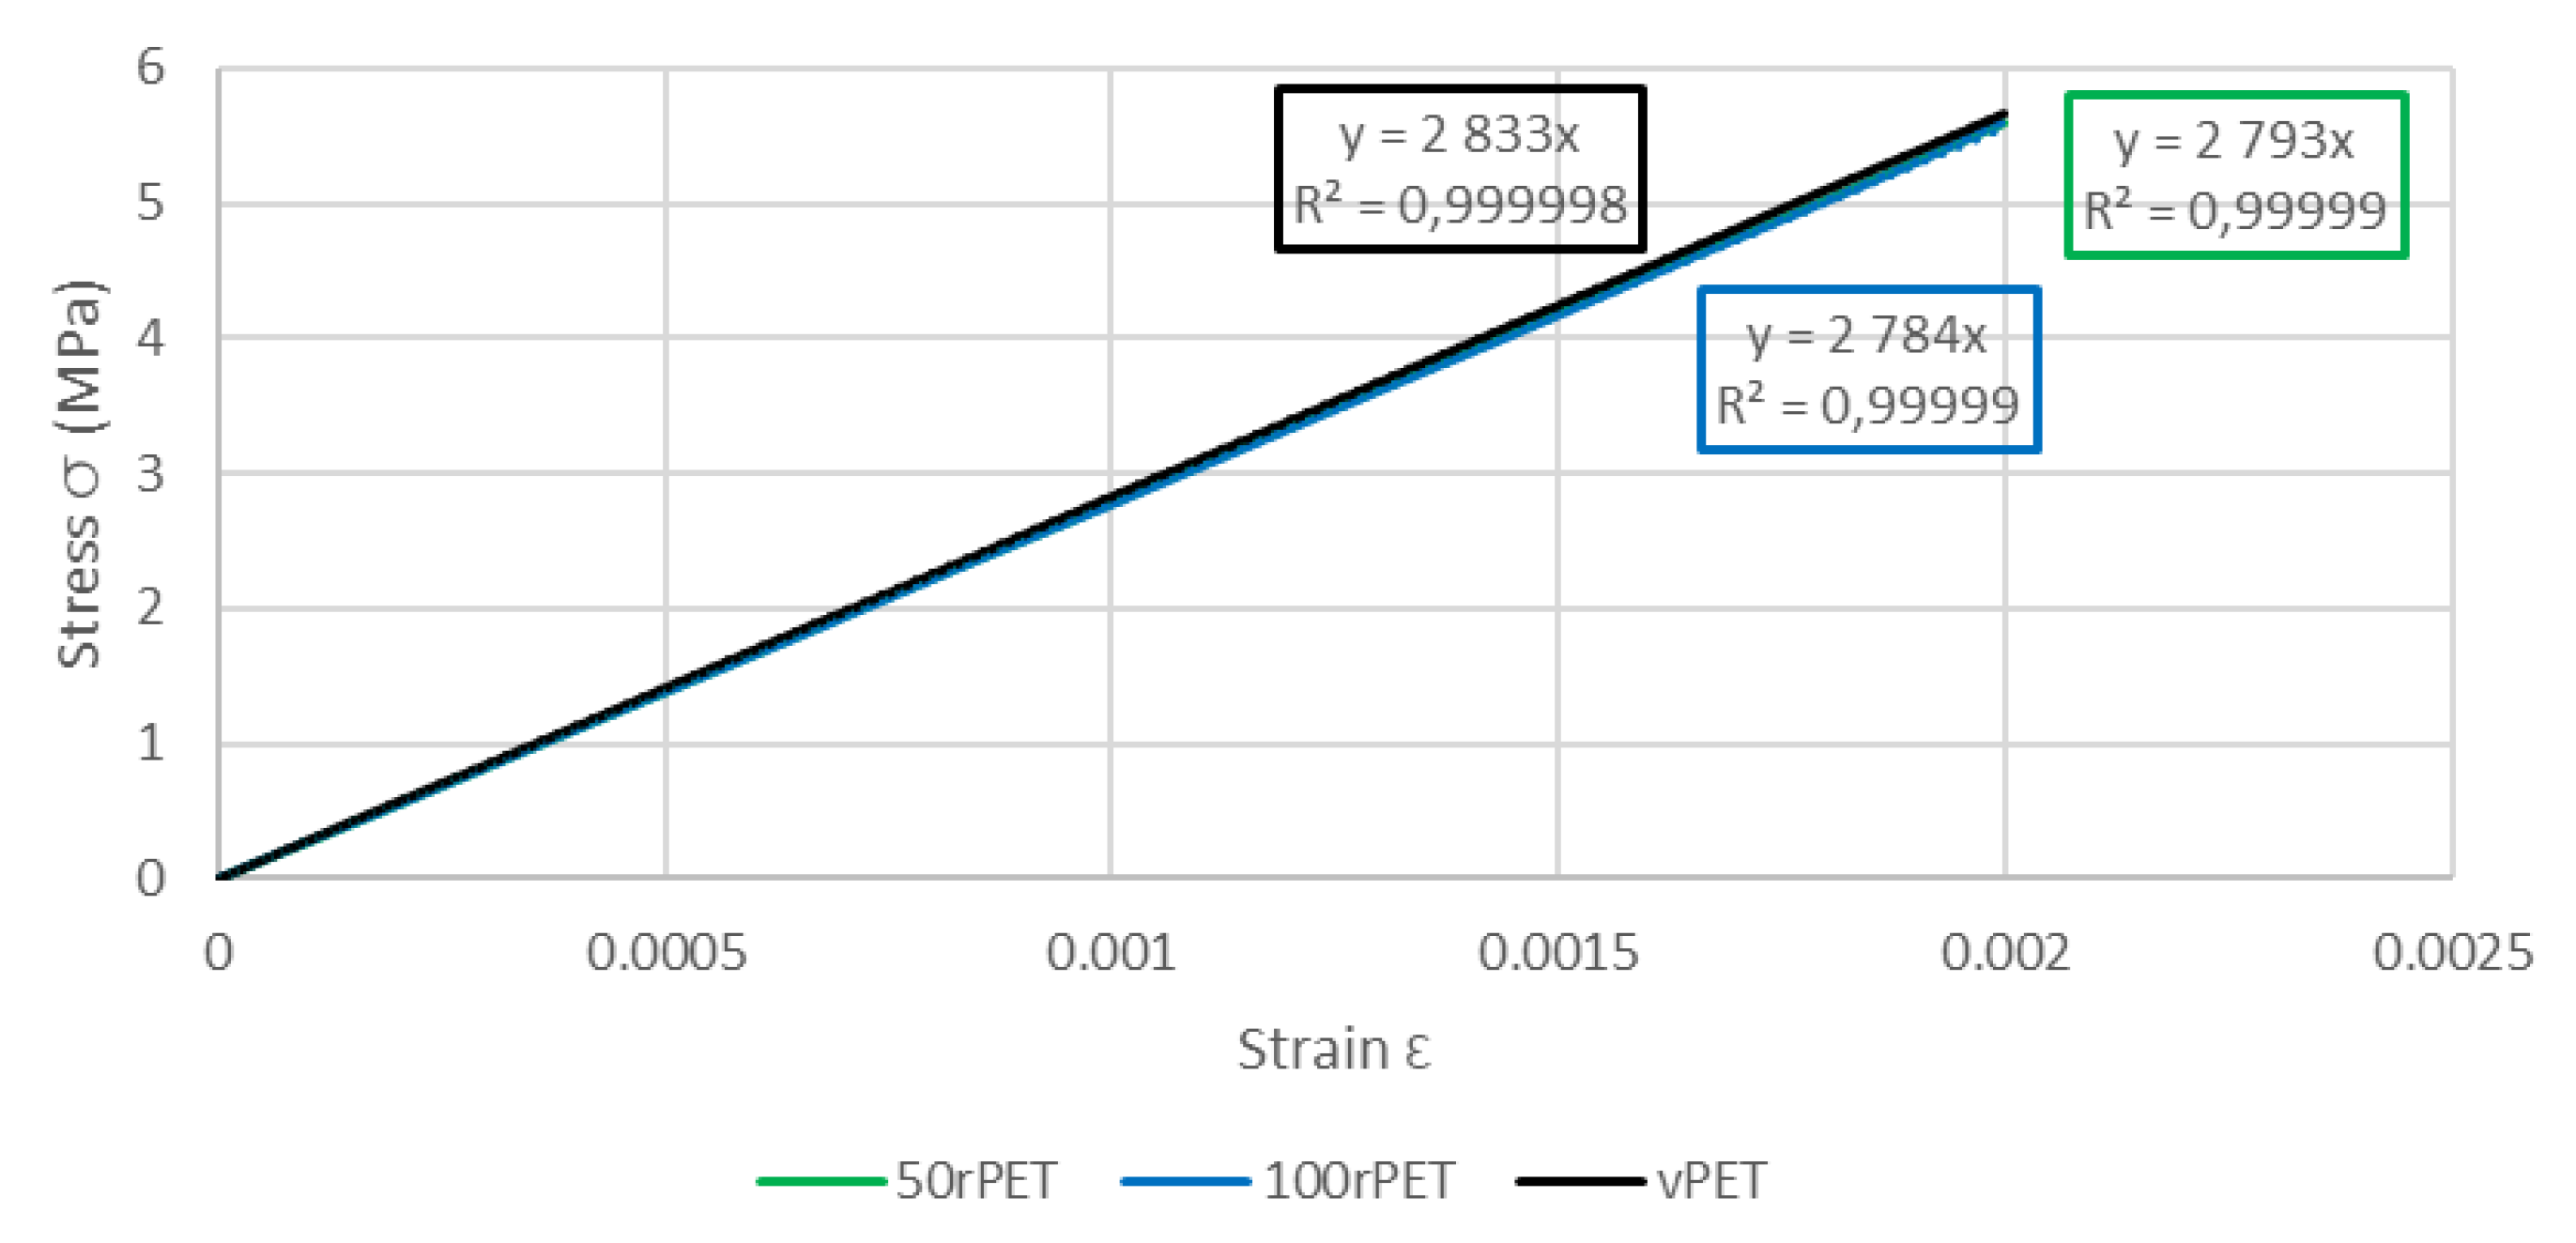
Table 1.
Mn, Mw and PDI for vPET and 100rPET.
| Polymer | Mn (kg.mol-1) | Mw (kg.mol-1) | PDI |
|---|---|---|---|
| vPET | 31.5 ± 0.1 | 53.8 ± 1.1 | 1.71 ± 0.04 |
| 100rPET | 31.2 ± 1.6 | 44.9 ± 0.1 | 1.54 ± 0.08 |
Table 2.
Melt Flow Index (MFI) for vPET and 100rPET.
| Polymer | MFI (g/10min) |
|---|---|
| vPET | 20.7 ± 0.3 |
| 100rPET | 36.5 ± 0.4 |
Table 4.
AFM, DMA and uniaxial tensile test module values for vPET, 50rPET and 100rPET.
| Material | Max modulus AFM (GPa) | Elastic modulus (GPa) | Young’s modulus (GPa) |
| vPET | 2.13± 0.12 | 2.72 ± 0.09 | 2.83 ± 0.01 |
| 50rPET | 3.03± 0.29 | 2.56± 0.06 | 2.79 ± 0.03 |
| 100rPET | 2.13± 0.13 | 2.69 ± 0.03 | 2.78 ± 0.03 |
Disclaimer/Publisher’s Note: The statements, opinions and data contained in all publications are solely those of the individual author(s) and contributor(s) and not of MDPI and/or the editor(s). MDPI and/or the editor(s) disclaim responsibility for any injury to people or property resulting from any ideas, methods, instructions or products referred to in the content. |
© 2023 by the authors. Licensee MDPI, Basel, Switzerland. This article is an open access article distributed under the terms and conditions of the Creative Commons Attribution (CC BY) license (http://creativecommons.org/licenses/by/4.0/).
Copyright: This open access article is published under a Creative Commons CC BY 4.0 license, which permit the free download, distribution, and reuse, provided that the author and preprint are cited in any reuse.
Submitted:
30 June 2023
Posted:
04 July 2023
You are already at the latest version
Alerts
A peer-reviewed article of this preprint also exists.
Submitted:
30 June 2023
Posted:
04 July 2023
You are already at the latest version
Alerts
Abstract
Polyethylene terephthalate (PET) is nowadays one of the most used polymers for packaging applications. Modifications induced by service conditions and the optimal mean to recycle this matter several times have to be perfectly understood to allow a reuse for similar application (from bottle to bottle for example). The present study aims to compare physico-chemical properties, crystalline organization, and mechanical behaviour of virgin (vPET) and recycled PET (rPET). Using different combined experimental methods (Calorimetry, Small Angle X-ray Scattering, Atomic Force Microscopy, DMA, and uni-axial tensile test), it has been proven that even if there is no change in the crystallinity of PET, the crystallisation process shows some differences (size and number of spherulites). The potential impact of these differences on local mechanical characterization, at the lamella scale, is explored and tends to demonstrate the development of homogeneous microstructure, leading to well-controlled and relevant local mechanical properties. This approach increases the understanding of crystallisation of PET and recycled PET during forming processes such as thermoforming or injection stretch blow moulding (ISBM) where elongation at break can depend on the microstructure conditioned by the crystallisation process.
Keywords:
Subject: Chemistry and Materials Science - Materials Science and Technology
1. Introduction
Polyethylene terephthalate (PET) is one of the most largely used polymers in food and drink packaging due to its adapted barrier properties, transparency and ability to be manufactured in films [1]. It is also used in various sport industry applications, like for clothing or equipment (e.g., hang gliders), due to its interesting thermo-mechanical properties [2].
Following massive awareness, recycling of polymers is an important challenge for the plastic industry [3]. PET is the major feed from household plastics (370 Mt of annual global plastic production in 2019) [4]. Consequently, PET is the most common plastic in the natural environment, predominantly shaped as bottles [5]. Moreover, PET is a very inert material that degrades very slowly in nature [6]. Post-consumer plastics must be recovered. Currently, 66% of PET is collected for recycling in Europe [7]. The rest is incinerated or sent to landfill, releasing greenhouse gases. On the contrary, recycling PET would increase circularity and reduce CO2 emissions during both production and post-customer processing [8,9].
Two main processes are applied to recycle PET: chemical recycling and mechanical recycling [2,10]. Chemical recycling requires retrieving PET base monomers and purifying them. In a second step, another polymerisation reaction is then needed [11,12,13,14]. There are different methods of chemical recycling such as glycolysis, methanolysis, hydrolysis [2,15]. However, chemical recycling is an expensive process that requires the use of catalysts and high temperatures [14,16]. Mechanical recycling is therefore generally used for its ability to be widely used and its low cost. It involves sorting PET, removing contaminants including water by drying, milling and processing the material to form rPET pellets [17].
Today, rPET is already used for many applications, the best-known being textiles (fleeces, microfibers) [5]. There is also a growing interest in the manufacturing of recycled PET bottles [18] since the textile approach is not circular yet. Actually, it remains difficult, for many reasons, to reach the 25% of recycled content in all PET bottles by 2025 as imposed by Europe [19]. A deeper understanding of PET recycling has to be achieved to reach the ultimate goal of circular 100% recycled bottles. Indeed, during the recycling of PET, many parameters must be considered, in particular the presence of contaminants (e.g., others polymers such as PP, PE, PVC, metals, ink, glues...) and the effect of mechanical recycling (multiple reprocessing cycles) which have an impact on the final properties of rPET [20]. Impurities cause changes in rPET rheology as well as a significant decrease in mechanical properties. Some impurities are not miscible with PET, so they form aggregates that make PET brittle. These impurities can also alter the thermal properties of PET and the transparency of the final product [20,21,22,23,24,25,26]. In addition, during multiple reprocessing cycles, aging of the PET is observed leading to a competition between chain scission and chain branching in the polymer, which induces a change in the thermal, mechanical, and rheological properties of rPET [27,28,29,30]. These properties are particularly crucial to optimize the injection stretch blow moulding process (ISBM) dedicated to bottle production [7,31]. Indeed, in order to obtain recycled transparent bottles, it is necessary to accurately control PET crystallization during the shaping process through monitoring and adapting the process parameters, inducing suitable service properties [31].
The main goal of this work is to have an overview of the physical and mechanical behaviour of recycled PET, in comparison with a well-known reference, a virgin PET. The relationship between the physico-chemical properties of PET and the mechanical properties at different scales is explored to understand the modification of polymer properties after recycling. Three types of PET are used: a virgin PET (vPET), a recycled PET (100rPET) and a blend of this recycled material with the virgin one (50rPET) at 50/50%. This comparison allows to better understand the ability of recycled PET to develop specific microstructure when being transformed through forming processes such as film stretching, thermoforming or even ISBM process. All these processes require high molecular weights, supposing long chains highly entangled promoting then efficient texturation and strain-induced crystallization (SIC). Intrinsic parameters like the molecular weight or the molecular weight distribution are of prime interest and are explored in this study to understand the microstructural mechanisms involved in crystallization processes.
The first purpose of this study is to understand the behaviour of such materials in quiescent conditions. Dynamic crystallization under stretching is not explored. Nevertheless, in static conditions, it is also possible to explore deeply the chains mobility, their ability in developing organized structures that will be relevant for final applications. An analysis of thermal properties using Differential Scanning Calorimetry (DSC) coupled to microscopic observations is then proposed. Spherulitic structures developed are described thanks to crystalline lamellae thickness measurements relaying either on calorimetry (DSC) or on Small Angle X-rays Scattering (SAXS) analysis. To complete these morphological descriptions, local mechanical tests were performed by Atomic Force Microscopy (AFM) where mechanical signatures of crystalline lamellae could be analysed. More classical mechanical analyses like dynamic mechanical analysis (DMA) and uni-axial tensile tests have comforted the previous experiments at the macroscopic scale. To our knowledge, no contribution in the literature has ever proposed such a complete approach in the case of recycled PET, drawing the link between microstructural organization and mechanical properties.
2. Materials and Methods
2.1. Materials and processing protocols
Virgin PET (vPET) and recycled PET (100rPET) pellets were respectively provided by Indorama Ventures® and LPR®. Blends of vPET and 100rPET were achieved by injection moulding, with an equivalent weight of vPET and 100 rPET, leading to the blend called “50rPET”. A geometry of preform has been selected for injection. A typical geometry basically used for injection stretch blow moulding process (ISBM) was chosen. The polymer pellets have been dried under vacuum before injection to avoid hydrolysis during the processing step in temperature. The same injection process parameters have been used for each of the three materials. The goal was to cool down rapidly the melt to quench the microstructure in an amorphous state. As a matter of fact, these injection protocols are common in industrial context where strain-induced crystallization (SIC) has to take place during the blowing process, in a second step.
Moreover, tensile test specimens have also been manufactured thanks to a mini-press, using PET dried for 6 hours at 140°C. Indeed, to process the PET pellets, cylinders have been heated to 270°C and 3 bars of pressure have been applied for 5 seconds to fill the moulds. The crystallinity rate in those samples have been increased by injecting in a hot mould. To achieve transparent samples, it is common to inject in moulds at 20 or 60°C, below PET glass transition temperature. In the present study, the mould has been set to 140°C, allowing crystallization of the polymer from the melt state. This procedure results in opaque samples, proving their increased crystallinity rate.
As already mentioned, this work is focused on crystallization abilities and associated morphologies. To study crystallization processes involved in quiescent conditions, amorphous preforms of vPET, 50rPET and 100rPET were placed in an oven at 140°C for 24 h in order to develop cold crystallization. Then, parallepipedal specimens have been machined from the body of the preforms. Such samples have been used for different analysis methods such as SAXS and DMA as described below. As a result, except in the case of PET pellets, only semi-crystalline preforms will be analysed and discussed in the following steps.
2.2. Melt Flow Index (MFI)
The Melt Flow Index or Rate (MFI or MFR) is an industrial parameter related to viscosity of the molten polymer. MFI allows to define the grade of a polymer (injection or extrusion grade). Using pellets, the MFI of vPET and rPET were measured thanks to a melt flow tester INSTRON CEAST MF20, as defined in the standard test method ISO 1133. The measurements were performed at a temperature of 270°C. Thirteen recordings were taken to determine the average MFI of each PET.
2.3. Size Exclusion Chromatography (SEC)
Size Exclusion Chromatography (SEC) is an accurate method to estimate the molecular weight (in number average, Mn, or in weight average, Mw) of polymers. The polydispersity index (PDI) is defined as the ratio of Mw and Mn. If the value is close to 1, the molecular weight distribution is low. The higher the value is, the larger the Gaussian distribution is (up to 3).
First, the pellets, were dissolved in Hexafluropropan-2-ol (HFIP) to obtain a concentration between 3 and 7 mg/ml. The solution was then filtrated (on 0.45 µm filters) and analysed through the GPC device (System Waters APC Acquity) with four columns at 35°C. Molecular weights were determined by light diffusion with a MALS WYATT (microDawn) device. Two measurements were carried out on both virgin and recycled pellets.
2.4. Polarized optical microscopy
The observations were conducted on a microscope Hot Stage Leica DM4500P with a magnification of x200. They were performed using crossed polarizers with a gypsum plate. To analyse the development of spherulites over cold crystallization phenomenon, a completely amorphous sample was prepared. Small parts of a pellet were collected with a razor blade. Then, the material was melted between two glass slides at 300°C for five minutes. The sandwich system was cooled down in water at ambient temperature to quench the microstructure in its amorphous state. The obtained samples were reheated at 20°C/min until reaching an isothermal step at a temperature of 120°C where cold crystallization may occur.
As mentioned in paragraph 2.1, initially amorphous preforms have been reheated in quiescent conditions at 140 °C for 24 hours. Regarding the experimental methods presented below, only semi-crystalline preforms will be analysed and characterized.
2.5. Thermal differential calorimetry (DSC)
The thermal properties of each material were analysed using a Perkin-Elmer Pyris diamond DSC under a nitrogen flow. Samples of 4 ± 0.5 mg were collected in the central zone of preforms and were encapsulated in aluminium pans.
Figure 1 displays the heating and cooling steps applied for DSC analysis. A heating ramp of 10°C/min up to a temperature of 290°C was first applied. After a holding step at 290°C for one minute, a cooling step with a ramp of 10°C/min to reach 30°C was performed. Samples were maintained at this temperature for one minute. Finally, a second similar heating ramp was conducted. The glass transition temperature, Tg, has been determined drawing two-tangents at temperatures below and above the main transition. The cold crystallization and the melting temperature, Tcc and Tm, were respectively obtained at the maximum of exothermic and endothermic enthalpy peaks. Associated enthalpies, ΔHcc and ΔHm, were determined from the heating scans. The crystallinity ratio, Xc, was calculated according to Equation 1:
2.6. Small Angle X-ray Scattering (SAXS)
The SAXS analysis was performed with an Empyrean diffractometer equipment, with a CuKα radiation, presenting a wavelength of 1.54 Å. Angular scans were conducted at very small angles, between 0.1° and 2° (2θ), allowing the analysis of all plans of diffusion between crystalline lamellaes. The θ angle was corrected by the Lorentz factor because of the phenomenon of diffusion. The Lorentz correction consists of the multiplication of the scattering intensity by a factor proportional to the sine of the diffraction angle. The invariant Q is defined as follows (Equation 2):
where q is the scattering factor and Imeasured, the measured scattered intensity before correction [34,35].
The long period L was calculated using the diffraction Bragg’s law (Equation 3).
where λ is the X-ray wavelength and θcorr is the scattered angle after correction with the Lorentz factor [34,35]. As for DSC experiments, the specimens were extracted in the same central zone of crystallized preforms. Parallepipedal specimens have been extracted from the body of the preforms and one unique SAXS analysis has been performed for each of the three materials.
2.7. Atomic Force Microscopy (AFM)
Microstructural characterizations were carried out via an atomic force microscope (AFM) on preforms of 100% virgin PET (vPET), 100% recycled PET (100rPET) and the blend (50rPET). Prior to AFM analyses, samples were prepared using a Leica EM UC7 ultra-cryomicrotome allowing to obtain very flat and smooth surfaces. The collecting took place in the same central zone of the preforms that the one used for DSC experiments. Then, the MFP-3D Infinity AFM from Asylum Research (Oxford Instruments) was used in a bimodal tapping mode, also known as AM-FM (Amplitude Modulation-Frequency Modulation) mode [36,37]. This mode consists in a nano-mechanical characterization. It allows to obtain the sample topography (height) and the phase contrast as in a tapping mode. In addition, it allows to obtain the indentation and the local contact modulus. A silicon probe (AC160TS-R3) with a resonant frequency of about 300 kHz and a spring constant of about 25 N/m was used. Before testing the samples, the tip was calibrated on a polystyrene (PS) film with a known modulus of 2.7 GPa (Bruker Corporation), used as reference material. After that, AFM tests with calibrated tip were carried out on cryo-microtomed surfaces using a scan rate of 1 Hz. Three images of 3x3 µm2 and a resolution of 256x256 pixels were recorded for each sample.
2.8. Dynamic Mechanical analysis (DMA)
Dynamic mechanical analyses were conducted using a Mettler-Toledo® DMA 1. A tensile mode was applied on samples extracted from preforms with a parallelepiped shape of 5.0 x 2.8 x 1.6 mm3. Tests were performed at a frequency of 1 Hz, with a preload of 1 N and a dynamic deformation of 0.04%. Temperature scans between 25°C and 140°C were performed at a heating rate of 2 °C/min. Viscoelastic properties such as the storage modulus (E’), the loss modulus (E’’) and the associated Tan δ = E”/E’ were measured. The alpha transition Tα was identified at 1 Hz at the maximum of Tan δ peak. Three tests were carried out for each material (vPET, 50rPET and 100rPET). An average curve was then obtained, and the standard deviation was calculated and represented on the curves.
2.9. Uni-axial tensile test (DMA)
Monotonic uni-axial tensile tests until failure were performed using a Zwick Roell Z010 testing machine. The tests were conducted on previously manufactured ISO 527-1BA specimens. Experiments were performed at room temperature with a 3 N preload, a crosshead speed of 5 mm/min, and an initial gauge length of 40 mm. The estimated initial strain rate was of 2.10-3 s-1. Young’s modulus, E, was measured with an extensometer at a strain ranging from 0.05% to 0.25%, according to the standard test method ISO 527. The maximum stress, σmax, and the strain at the maximum stress, ε (σmax), were estimated. Three samples of each material were tested.
3. Results and discussion
This section may be divided by subheadings. It should provide a concise and precise description of the experimental results, their interpretation, as well as the experimental conclusions that can be drawn.
3.1. Molecular weight and rheological properties
This paragraph aims at presenting first a comparison of the molecular organization of virgin and recycled PET pellets. Table 1 summarizes the molecular weights, Mn and Mw as well as the polydispersity index, PDI, measured for the two polymers by SEC.
Table 1 shows that the mass average Mw is significantly lower for recycled PET compared to virgin one, while the number average molecular weight, Mn, remains unchanged. These first results show that polymer chains are shorter in the case of the recycled PET. Moreover, the recycled PET presents also a lower PDI meaning a less dispersed molecular weight distribution for recycled PET, which could be an advantage for processing control [10,38]. It is a non-expected result as the recycling process might result in a random chains scission. Recycled PET seems to be well controlled in terms of chains length distribution, even if the decrease of longer chains lengths is observed compared to the neat PET. To complete this analysis, MFI measurements were conducted to confirm or not the hypothesis of shorter polymer chains for the 100 rPET.
Such order of magnitude for MFI values is expected due to the low viscosity of PET. As a matter of fact, low viscosities are required to inject preforms that will be blown during the Injection Stretch Blow Moulding process (ISBM process). These PET grades are thus commonly used for injection process, allowing an efficient filling of the preform mould.
The recycled PET presents a significantly higher MFI than the virgin one, which proves lower viscosities. These lower rheological properties are clearly in adequation with the lower molecular weight observed for the recycled PET. Thus, recycling process possibly coupled to aging under service conditions might induce this decrease of chain lengths.
3.2. Crystalline morphologies observation and thermal behaviour analysis
These very first analyses permit to describe roughly the molecular organization of each material. The possible shorter lengths and the presence of contaminants inside the recycled PET is of prime interest to understand the ability of these materials to crystallize in quiescent conditions. To focus on the understanding of cold crystallization processes, the spherulitic microstructures induced in controlled conditions have been observed thanks to optical microscopy. During an isothermal step imposed at a temperature of 120°C, the formation and growth of spherulites can be followed. Figure 2 (a, b, c) show optical pictures captured at the end of the isothermal step of 120°C imposed: crystallised samples of vPET, 50rPET and 100rPET are respectively presented below.
As could be expected regarding literature [39], spherulitic organization are completely different between virgin and recycled PET. The blend 50rPET morphologies are equivalent to the pure recycled material. In the last case, more numerous spherulites are present testifying of a higher efficiency in the germination process. Contaminants that are present in the recycled polymer associated with shorter chains lengths, do play an important role as local nucleating agents. As a result, the growth is limited by the presence of more numerous activated germination sites. The final diameters of the spherulites are in the order of magnitude of 4 µm or even less, whereas neat PET presents larger entities, with diameters reaching values of around 10 µm.
Moreover, characteristic times of appearance of spherulites for each sample have been estimated, following the thermal procedure described in Section 2.4. The time departure of cold crystallization at 120°C thus occurs after different durations during the isothermal step: 380, 190 and 225 seconds for respectively vPET, 50rPET and 100rPET. These measurements confirm that the recycled PET has a higher ability to crystallize in quiescent conditions. This is a crucial point that must be considered for processability towards ISBM process. As a matter of fact, for the initially amorphous PET, the forming range above the α-transition can be reduced on the upper limit because of cold crystallization which does reduce stretchability and transparency of the polymer. To complete these observations, thermal analysis performed by DSC have been conducted.
This paragraph presents, with the Figure 3 and Figure 4, thermograms obtained by DSC for vPET, 50rPET and 100rPET. As a reminder, semi-crystalline preforms, reheated in an oven to activate cold crystallization, are characterized.
Figure 3 displays during the first heating stage an endothermal peak for all materials. Two melting temperatures are also observed for all materials. The first melting enthalpy is observed at approximately 130°C while the second one at around 245°C. Crystallites are usually used to melt at higher temperatures, at least a temperature of 250°C without any intermediate melting phenomenon. A less stable microstructural organization could be present; the existence of a transcrystalline phase has already been reported in literature [40]. Moreover, the crystallinity ratio Xc has been estimated from both the observed melting enthalpies. The values obtained are in the order of magnitude of 33, 35 and 37% for vPET, 50rPET and 100rPET, respectively. The recycled PET appears clearly more crystalline than the virgin one, while the blend one remains in between.
These observations must be confronted with the second heating step, where the thermo-mechanical history of each of the material has been erased. Concerning Figure 4, several observations can be mentioned. Firstly, the glass transition temperature is changing slightly. The 100rPET polymer presents a Tg of 80°C, which is one degree higher than the virgin one. Secondly, the less stable phase attributed to possible transcrystalline organization is not detected at all. This observation highlights the fact that thermo-mechanical history induced especially by the injection process may have played a role in pre-organizing a local microstructure. The differences observed are thus not intrinsic to the material itself. Thirdly, the cold crystallization is only observable for the vPET polymer at a temperature of 130°C. This is a crucial point which proves that amorphizing PET requires more severe cooling conditions for recycled PET than for virgin one. Thus, the microstructure of 100rPET is difficult to be quenched in an amorphous state, testifying its ability in crystallizing efficiently. Once again, this result is in adequation with the literature [32,40,41]. Previous studies have reported that faster crystallization of recycled PET can be attributed to shorter chains, acting as nuclei promoting the growth of more crystalline areas for recycled PET compared to the neat one. Contaminants present in recycled PET may also play this role. Finally, a split of the melting peak can be seen for all rPET (50rPET and 100rPET). This last point is more deeply detailed in the following section.
3.3. Crystalline morphologies description: lamella thickness measurements
To go further in the understanding of the morphological crystalline organization, DSC and SAXS analysis were carried out to estimate crystalline lamellas thicknesses. Double melting peaks as observed previously can suggest different crystalline lamellas populations whose thicknesses can differ from a material to another. Crystalline lamellar thicknesses, corresponding to each endothermal peak, are then investigated using Gibbs-Thomson relation (Equation 4):
where Tm0 is the equilibrium melting temperature of an infinite crystal (564 K); σe is the surface free energy of the basal plane where the chains fold (0.106 J.m-²); ΔhmV is the melting enthalpy per volume unit (2.1 x 10⁸ J.m-3) [42,43].
Over the first heating step, two populations of crystalline lamellas, population 1 and population 2, have been denoted, as described on Figure 3. Figure 5 shows an estimation of crystalline lamella thicknesses calculated for the first heating stage for the three materials.
Crystalline lamella thicknesses obtained for population 1 and population 2 are in the order of magnitude of 3.5 to 12 nm, as referred in the literature for semi-crystalline PET, crystallized in quiescent conditions [43,44]. As expected, 50rPET and 100rPET present slightly higher thicknesses compared to the virgin sample. Those values are consistent with literature where mechanically recycled PET has higher melting temperatures, associated to more stable crystalline structure with probably thicker crystalline lamellas [39].
These analyses were completed thanks to X-ray scattering, with a SAXS protocol where long periods, L, were measured. In a second time, the crystalline lamella thicknesses can then be deduced from long periods measurements, according to the degree of crystallinity previously analysed by DSC during the first heating stage. Figure 6 presents SAXS diffractograms obtained for the three materials, involving the Lorentz correction presented in the Section 2.6.
The diffractograms obtained including the Lorentz correction clearly show that a periodicity exists inside the three polymers at the scale of arranged lamellas. This periodicity results in a gaussian distribution of the long period L. The maximum of the peak is, for the three cases, centred on values in the order of magnitude of 60 nm which are common for polymeric systems. From those analysis, and thanks to crystallinity ratios Xc measured by DSC, an estimation of crystalline lamella thicknesses is possible, as presented on Figure 7.
Thanks to this approach, crystalline lamella thicknesses can be estimated and compared. The order of magnitude is of 25 nm which is slightly higher compared to DSC analysis where thicknesses of 12 nm were determined regarding the main melting endothermic peak (population 2). The two characterization methods are clearly not equivalent. Assumptions and uncertainties might explain the differences observed (identification of melting points attributed to different lamella populations, Xc measurement, Lorentz correction, etc. Nevertheless, as the protocols used were rigorously the same from a polymer to another, it remains possible to compare the different cases. On Figure 7, small discrepancies can be observed. Once again, and as observed previously with DSC experiments, the case of recycled PET (100rPET) presents slightly thicker crystalline lamellas. The case of 50rPET remains in between the totally virgin and recycled PET. To conclude on this part, in quiescent conditions, the ability in crystallization processes is clearly more efficient for recycled PET, with melting peaks observed at higher temperatures. Moreover, very few differences can be highlighted regarding crystalline morphologies description of virgin and recycled PET which could present slightly thicker crystalline lamellas. In the following part, and to go further in the local microstructural organization understanding, efforts were made to describe also local mechanical behaviours, at the scale of crystalline lamellas.
3.4. Mechanical behaviour at the mesoscopic scale
A local mechanical approach is presented in this section thanks to dynamic mechanical characterisation performed by AFM. Mechanical investigations are then conducted at the meso-scale of crystalline lamellas. The analysed surface is of 3x3 µm2 which corresponds, considering spherulitic diameters of approximately 10 µm or 4 µm for respectively vPET and rPET, to a scanning surface of 11 and 72 % of a whole spherulitic entity. In other words, this tapping approach consists in analysing a representative part of a spherulite, whose crystalline lamellas are in the order of magnitude of 10 to 60 nm, involving both amorphous and crystalline domains. Figure 8, Figure 9 and Figure 10 show images obtained with the AM-FM mode described in Section 2.7. Pictures are organised as follows: topography (a), indentation (b) and the contact modulus (c). A histogram with Gaussian fit showing the disparity of elastic moduli has also been plotted (d) for each material. Topography images (Figures 8 (a)–10 (a)) show the microstructure of each material and the associated roughness (height). It is possible to observe that, as required for mechanical tests, each surface prepared by the ultracryomicrotome is very smooth (height is in the order of 10 nm) allowing to make nano-mechanical analysis without artefacts due to the surface roughness. Images of indentation (Figures 8 (b)–10 (b)) show that tip penetration is in all cases between 300 pm and 2 nm according to Hertz hypothesis in an intermittent bimodal test. Images of contact modulus (Figures 8 (c)–10(c)) show the local variation of each material stiffness. Distribution of elastic moduli is represented on a histogram and the associated Gaussian fit for each case is given (Figures 8 (d)–10 (d)). Contours observed in Figure 8 and Figure 10, respectively for vPET and 100rPET, could represent spherulites edges with interspherulitic regions. This hypothesis would have to be verified in further works.
The elastic moduli histograms display a distribution of mechanical properties which appears symmetrical both in the case of vPET and 100rPET. This symmetrical distribution could be the reflect of both soft and stiff contributions that could be attributed to either amorphous or crystalline domains. The averaged value on these distributions is the same (2.13 GPa) for vPET and 100rPET, even if the fully recycled PET exhibits higher crystallinity ratio (Xc = 36.6 %) than the virgin one (Xc = 32.9 %) and does present possible thicker crystalline lamellas. No mechanical signature of the presence of more crystalline regions is detectable. The fact that crystalline lamellas would be thicker in the case of recycled PET is not obvious regarding these measurements too. Indeed, local mechanical signatures appear equivalent, even in terms of distribution. It is of prime interest to note that, finally, rPET is able to develop well-controlled microstructure, as homogeneous as a virgin PET regarding the distribution of crystalline morphologies and their local mechanical characteristics. The presence of contaminants, associated to shorter chains, does not seem to affect at all the mechanical properties of the recycled polymer. Moreover, the blend of vPET and 100rPET materials (50rPET) exhibits a singular behaviour as less symmetrical and larger distribution of elastic modulus is observed, with an averaged value of 3.03 GPa. The fact that two PET are blended may have induced possible local non-homogeneous domains. Nevertheless, the mechanical behaviour of the blend remains close to both virgin and recycled PET.
3.5. Mechanical behaviour at the macroscopic scale
Characterizations in this paper have so far focused on microscopic and mesoscopic scales. The objective of this section is to link properties at the micro- and meso-scale to macroscopic mechanical properties, more relevant regarding the process scale. The mechanical behaviour of vPET, 50rPET and 100rPET were studied through both DMA and tensile tests experiments.
Figure 11 and Figure 12 represent respectively the evolution of storage modulus and Tan δ as a function of temperature.
On Figure 11, the value of modulus at room temperature is very similar for all the materials i.e., no significant differences in the mechanical behaviour have been pointed out. More dispersion in the measurements is observed in the case of 50rPET which is a blend of vPET and 100rPET. Such observation agrees with AFM measurements regarding the elastic moduli distribution. It confirms the fact that the blend presents less homogeneous mechanical properties than the neat or totally recycled PET. Furthermore, the inflexion point between the glassy and the rubbery-like behaviours appears for higher temperatures in the case of 100rPET. This is in accordance with the maximum of Tan δ peak which is shifted to higher temperatures in the case of 100rPET compared to vPET. The blend 50rPET still appears in between the two-extremal cases. In a nutshell, the α-transition temperatures are summarised in the following table.
Table 3.
α-transition temperature, taken at the maximum of Tan δ peak and a frequency of 1 Hz, for vPET, 50rPET and 100rPET.
Table 3.
α-transition temperature, taken at the maximum of Tan δ peak and a frequency of 1 Hz, for vPET, 50rPET and 100rPET.
| Sample | vPET | 50rPET | 100rPET |
| Tα (°C) | 93.6 ± 0.3 | 94.0 ± 1.0 | 95.9 ± 0.1 |
The α-transition temperature of 100 rPET is two degrees higher than the one of vPET. The area under Tan δ peak is also lower in this case which proves that the amorphous phase of 100rPET presents less molecular mobility. The presence of more crystalline regions as suggested by DSC analysis, is constraining the amorphous phase. Moreover, the rubbery-like plateau is higher in the case of 100rPET which is the most crystalline material, followed by 50rPET and then vPET. The α-transitions are then slightly different appearing later for recycled PET. The second heating step performed in DSC tends to the same conclusion: the forming range is reduced in the case of recycled PET with higher glass transition temperature. Nevertheless, at room temperature, it is obvious that all the PET explored in this study exhibit similar mechanical behaviours.
To complete the viscoelastic properties measurements, uni-axial tensile tests have also been conducted on sample manufactured with vPET, 50rPET and 100rPET. Figure 13 shows a comparison of the stress-strain curves for each material. A representative curve for each sample was chosen to make the comparison after checking the repeatability of those tests with 3 samples.
This last approach tends to highlight the fact that no significant differences in the mechanical behaviour at the macroscopic scale can be seen between the three polymers. The same trends are observed, for all curves, with a strain at the maximum stress at 5% of deformation [45]. As described on Figure 14, samples exhibit similar moduli for each material (about 2800 MPa) [46].
Table 4 summarizes values of the modulus obtained with AFM, DMA, and uni-axial tensile tests.
4. Conclusion
The purpose of this comparative study between semi-crystalline virgin and recycled PET was to understand the link between physico-chemical properties, morphological description of crystalline entities, and mechanical behaviour.
First, it is demonstrated that recycled PET (100rPET) presents lower molecular weight compared to neat one (vPET), while the polydispersity index remains equivalent. Finally, at this stage, the distribution of chains lengths clearly appears well-controlled with rPET just like for virgin PET, with, nevertheless, probably shorter chains. MFI measurements of the two PET confirm these assumptions with recycled PET having a higher MFI value than the virgin PET, testifying of a less viscous rheological behaviour due to smaller chain lengths. The post-condensation at solid state that is commonly used after the mechanical recycling process might have participated to compensate the effects of degradation that can develop during the re-processing of the resin.
Cold crystallization processes, from the amorphous state and followed in quiescent conditions thanks to optical microscopy, are proved to be more efficient in the case of recycled PET. More numerous and smaller spherulites are present in the rPET structure which can develop rapidly and homogeneously. The spherulitic structure growth efficiency is probably ruled by shorter chains associated with contaminants issued from recycling paths that may act as nucleating agents inside the bulk. The blend (50rPET) presents a behaviour which is rather closer to 100rPET, with more numerous and smaller spherulites. The presence of contaminants can be effective in this case too.
To go further in crystallization process understanding, thermal properties using calorimetry analysis have comforted the fact that recycled PET presents significantly faster crystallization kinetics than virgin PET. From the molten state, quenching rPET in an amorphous state was not possible at a cooling rate of 10°C/min while virgin PET was partially amorphous. These results highlight the fact that injection process of rPET preforms has to be adjusted. Precautions must be taken to prevent crystallization from the melt. Regarding the crystal melting of rPET, it takes place for higher temperatures compared to vPET. A further analysis of transcrystalline phase could help to identify the phenomenon that results in a melting temperature shifting. Crystalline lamellae thicknesses have been estimated through different methods (DSC and SAXS). rPET presents slightly thicker crystalline lamellas, associated to higher crystallinity ratios Xc.
The impact of these differences of crystalline morphologies on local mechanical behaviour was then characterized by Atomic Force Microscopy. AFM analyses using dynamic measurements in intermittent contact (tapping mode) were then carried out to search for the presence of potentially different crystallites. Modulus analysis did not show significant differences between vPET and rPET. The distribution of mechanical responses appears very similar and well-controlled in the rPET bulk. Homogeneous properties associated to both amorphous and crystalline domains are clearly in presence; no fragility induced by the presence of contaminants has been detected at this scale. 100rPET and vPET exhibit a single crystalline phase associated to repeatable mechanical behaviour which confirms that recycled PET, just like virgin PET, can develop stable and controlled crystalline entities.
At a larger scale, mechanical behaviours are explored in the low and large deformation domains with both DMA analysis and uni-axial tensile tests. At room temperature, the mechanical responses are equivalent for recycled and virgin materials. Difference of molecular weight and crystallinity does not seem to have any impact on the macroscopic mechanical behaviour of cold crystallized PET. Properties at failure, strongly related to the microscopic properties, could be another interesting study to work on.
Funding
The authors gratefully acknowledge the financial support from the CARNOT MINES 2020 on Polymer recyclability.
Acknowledgments
The authors want to thank Marion Colella from INSAVALOR for SEC measurements, Mikaël Derrien and Xavier Monnier from SIDEL Group for supplying materials, Gabriel Monge and Jean-Marc Haudin for their expertise in X-ray scattering technique.
Conflicts of Interest
The authors declare that they have no known competing financial interest or personal relationships that could have appeared to influence the work reported in this paper.
References
- Mandal, S., Dey, A. PET Chemistry. Recycling of Polyethylene Terephthalate Bottles, 2019, Pages 1-22. [CrossRef]
- Nistico, R. Polyethylene terephthalate (PET) in the packaging industry. Polymer Testing 90, 2020, 106707. [CrossRef]
- Antonopoulos, I., Faraca, G., Tonini, D. Recycling of post-consumer plastic packaging waste in the EU: Recovery rates, material flows, and barriers. Waste Management 126, 2021, 694-705. [CrossRef]
- Plastics Europe, Plastics—the Facts 2020, Plastics—the Facts 2020 (plasticseurope.org) (18/11/2021).
- Coelho, T. M., Castro, R., & Gobbo Jr, J. A. PET containers in Brazil: Opportunities and challenges of a logistics model for post-consumer waste recycling. Resources, Conservation and Recycling 55, 2011, 311-319. [CrossRef]
- Sang, T., Wallis, C. J., Hill, G., & Britovsek, G. J. Polyethylene terephthalate degradation under natural and accelerated weathering conditions. European Polymer Journal 117, 2020, 109873. [CrossRef]
- Petcore Europe, The road to 90%. How to achieve the EU’s pet bottle collection bottle collection targets by 2029, https://www.petcore-europe.org/legislation/334-how-achieve-eu-pet-bottle-collection-bottle-collection-targets-2031.html.
- Hopewell, J., Dvorak, R., Kosior, E. Plastics Recycling: Challenges and Opportunities. Philosophical Transactions of the Royal Society B: Biological Sciences 364, 2009, 2115 26. [CrossRef]
- Chilton, T., Burnley, S., Nesaratnam, S. A life cycle assessment of the closed loop recycling and thermal recovery of post-consumer PET. Resources, Conservation and Recycling 54, 2010, 1241-1249. [CrossRef]
- Awaja, F., Pavel, D. Recycling of PET. European Polymer Journal 41, 2005, 1453–1477. [CrossRef]
- Bedell, M., Brown, M., Kiziltas, A., Mielewski, D., Mukerjee, S., Tabor, R. A case for closed-loop recycling of post-consumer PET for automotive foams. Waste Management 71, 2018, 97-108. [CrossRef]
- Cakić, S. M., Ristić, I. S., Milena, M., Nikolić, N. Č., Ilić, O. Z., Stojiljković, D. T., B-Simendić, J. K. Glycolyzed products from PET waste and their application in synthesis of polyurethane dispersions. Progress in Organic Coatings, 2012, 74(1), 115-124. [CrossRef]
- Roy, P. K., Mathur, R., Kumar, D., Rajagopal, C. Tertiary recycling of poly (ethylene terephthalate) wastes for production of polyurethane–polyisocyanurate foams, 2013, Journal of Environmental Chemical Engineering, 1(4), 1062-1069. [CrossRef]
- Raheem, A. B., Noor, Z. Z., Hassan, A., Abd Hamid, M. K., Samsudin, S. A., & Sabeen, A. H. Current developments in chemical recycling of post-consumer polyethylene terephthalate wastes for new materials production: A review. Journal of Cleaner Production, 2019, 225, 1052-1064. [CrossRef]
- Wu, H.S. Strategic Possibility Routes of Recycled PET. Polymers 13, 2021, 1475. [CrossRef]
- Kim, R., Delva, L., Van Geem, K, Mechanical and chemical recycling of solid plastic waste. Waste management 69, 2007, 24-58. [CrossRef]
- Cecon, V. S., Da Silva, P. F., Curtzwiler, G. W., & Vorst, K. L. The challenges in recycling post-consumer polyolefins for food contact applications: A review. Resources, Conservation & Recycling 167, 2021, 105422. [CrossRef]
- Lonca, G., Lesage, P., Majeau-Bettez, G., Bernard, S., Margni, M. Assessing scaling effects of circular economy strategies: A case study on plastic bottle closed-loop recycling in the USA PET market. Resources, Conservation & Recycling 162, 2020, 105013. [CrossRef]
- DIRECTIVE (UE) 2019/904 DU PARLEMENT EUROPÉEN ET DU CONSEIL du 5 juin 2019 relative à la réduction de l’incidence de certains produits en plastique sur l’environnement, Journal officiel de l’Union européenne L155/1, 12 juin 2019, Article 6.
- Itim, B., Philip, M. Effect of multiple extrusions and influence of PP contamination on the thermal characteristics of bottle grade recycled PET. Polymer Degradation and Stability 117, 2015, 84-89. [CrossRef]
- Dimitrov, N., Krehula, L. K., Siročić, A. P., Hrnjak-Murgić, Z. Analysis of recycled PET bottles products by pyrolysis-gas chromatography. Polymer Degradation and Stability 98, 2013, 972-979. [CrossRef]
- Franz, R., Welle, F. Contamination Levels in Recollected PET Bottles from Non-Food Applications and their Impact on the Safety of Recycled PET for Food Contact. Molecules, Vol. 25, Issue 21, 2020, 4998. [CrossRef]
- Alsewailem, F. D., Alrefaie, J. K. Effect of contaminants and processing regime on the mechanical properties and moldability of postconsumer polyethylene terephthalate bottles. Waste Management 81, 2018, 88-93. [CrossRef]
- Alvarado Chacon, F., Brouwer, M. T., Thoden van Velzen, E. U. Fresia Alvarado Chacon, Marieke T. Brouwer, Eggo Ulphard Thoden van Velzen. Effect of recycled content and rPET quality on the properties of PET bottles, part I: Optical and mechanical properties. Packaging Technology and Science, Vol. 33, Issue 9, 2020, 347-357. [CrossRef]
- La Mantia, F. P., Botta, L., Morreale, M., Scaffaro, R. Effect of small amounts of poly (lactic acid) on the recycling of poly (ethylene terephthalate) bottles. Polymer Degradation and Stability 97, 2012, 21-24. [CrossRef]
- Navarro, R., Ferrandiz, S., Lopez, J., Seguí, V. J. The influence of polyethylene in the mechanical recycling of polyethylene terephthalate. Journal of materials processing technology 195, 2008, 110–116. [CrossRef]
- López, M. D. M. C., Pernas, A. I. A., López, M. J. A., Latorre, A. L., Vilariño, J. L., Rodríguez, M. V. G. Assessing changes on poly (ethylene terephthalate) properties after recycling: Mechanical recycling in laboratory versus postconsumer recycled material. Materials Chemistry and Physics 147, 2014, 884-894. [CrossRef]
- Nait-Ali, K.L., Bergeret, Ferry A.L., Colin, X. Chain branching detection by Cole–Cole modeling of rheological properties changes during PET mechanical recycling. Polymer Testing 31, 2012, 500-504. [CrossRef]
- Wu, H., Lv, S., He, Y., Qu, J.-P. The study of the thermomechanical degradation and mechanical properties of PET recycled by industrial-scale elongational processing. Polymer Testing 77, 2019, 105882. [CrossRef]
- Nait-Ali, L.K., Colin, X., Bergeret, A. Kinetic analysis and modelling of PET macromolecular changes during its mechanical recycling by extrusion. Polymer Degradation and Stability 96, 2011, 236-246. [CrossRef]
- Awaja, F., Pavel, D. Injection stretch blow moulding process of reactive extruded recycled PET and virgin PET blends. European Polymer Journal 41, 2005, 2614–2634. [CrossRef]
- Badia J.D., Strömberg, E., Karlsson, S., Ribes-Greus, A. The role of crystalline, mobile amorphous and rigid amorphous fractions in the performance of recycled poly (ethylene terephthalate) (PET). Polymer Degradation and Stability 97, 2012, 98-107. [CrossRef]
- Asensio, M., Nunez, K., Guerrero, J., Herrero, M., Merino, J.C., Pastor, J.M. Rheological modification of recycled poly (ethylene terephthalate): Blending and reactive extrusion. Polymer Degradation and Stability 179, 2020, 109258. [CrossRef]
- Cser, F. About the Lorentz correction used in interpretation of small-angle X-ray scattering data of semicrystalline polymers. Journal of applied polymer science 80, 2001, 358-366.
- Hsiao, B.S., Verma, R.K. A novel approach to extract morphological variables in crystalline polymers from time-resolved synchrotron SAXS data. Journal of Synchrotron Radiation 5, 1998, 23-29. [CrossRef]
- Herruzo, E.T., Perrino, A.P., Garcia, R. Fast nanomechanical spectroscopy of soft matter. Nature communications 5, 2014, 3126. [CrossRef]
- Benaglia, S., Amo, C.A., Garcia, R. Fast, quantitative and high-resolution mapping of viscoelastic properties with bimodal AFM. Nanoscale 11, 2019, 15289-15297. [CrossRef]
- Welle, F. Twenty Years of PET Bottle to Bottle Recycling—An Overview. Resources, Conservation and Recycling 55, 2011, 865 75. [CrossRef]
- Kim, H.G., Robertson, R.E. Multiple melting endotherms in isothermally melt-crystallized poly (butylene terephthalate). Journal of Polymer Science Part B: Polymer Physics 36, 1998 1757-1767. [CrossRef]
- Rohart, V., Combeaud, C. Stretchability of mechanically recycled PET. Polymer 257, 2022, 125218 . [CrossRef]
- Hao, W., Wang, X., Yang, W., Zheng. K. Non-isothermal crystallization kinetics of recycled PET-Si3N4 nanocomposites, Polymer Testing 31, 2012, 110–116, doi: 10.1016/j.polymertesting.2011.10.003. [CrossRef]
- Lu, X.F., Hay, J.N. Isothermal Crystallization Kinetics and Melting Behaviour of Poly(Ethylene Terephthalate) . Polymer 42, 2001, 9423 31. [CrossRef]
- Badía, J.D., Vilaplana, F., Karlsson, S., Ribes-Greus, A. Thermal Analysis as a Quality Tool for Assessing the Influence of Thermo-Mechanical Degradation on Recycled Poly(Ethylene Terephthalate), Polymer Testing 28, 2009, 169 75. [CrossRef]
- Jonas, A.M., Russell, T.P., Yoon, D.Y. Time-resolved SAXS studies of morphological changes in cold crystallized poly (ethylene terephthalate) during annealing and heating. Colloid and Polymer Science 272, 1994, 1344-1351. [CrossRef]
- Gere, D., Czigany, T. Future trends of plastic bottle recycling: Compatibilization of PET and PLA. Polymer Testing 81, 2020, 106160. [CrossRef]
- Zander, N.E, Gillan, M., Lambeth, R. H. Recycled polyethylene terephthalate as a new FFF feedstock material. Additive Manufacturing 21, 2018, 174-182. [CrossRef]
Figure 1.
Procedure of heating and cooling steps applied during DSC experiments.
Figure 2.
Optical observations of spherulites developed in quiescent conditions, at a temperature of 120°C, for vPET (a), 50rPET (b) and 100rPET (c).
Figure 2.
Optical observations of spherulites developed in quiescent conditions, at a temperature of 120°C, for vPET (a), 50rPET (b) and 100rPET (c).
Figure 3.
DSC curves of semi-crystalline preforms for vPET, 50rPET and 100rPET heated, from 30°C to 290°C, at a heating rate of 10°C/min (first heating step).
Figure 3.
DSC curves of semi-crystalline preforms for vPET, 50rPET and 100rPET heated, from 30°C to 290°C, at a heating rate of 10°C/min (first heating step).
Figure 4.
DSC curves of semi-crystalline preforms for vPET, 50rPET and 100rPET heated from 30°C to 290°C, at a heating rate of 10°C/min C and for the second heating step after cooling from 290°C to 30°C, at a cooling rate of -10°C/min.
Figure 4.
DSC curves of semi-crystalline preforms for vPET, 50rPET and 100rPET heated from 30°C to 290°C, at a heating rate of 10°C/min C and for the second heating step after cooling from 290°C to 30°C, at a cooling rate of -10°C/min.
Figure 5.
Crystalline lamella thicknesses, determined by DSC measurement, during the first heating step at 10°C/min, for the lamella population 1 (a) and population 2 (b).
Figure 5.
Crystalline lamella thicknesses, determined by DSC measurement, during the first heating step at 10°C/min, for the lamella population 1 (a) and population 2 (b).
Figure 6.
Diffractograms obtained by Small Angle X-ray Scattering (SAXS) with the Lorentz correction, for vPET, 50rPET, and 100rPET associated to semi-crystalline preforms.
Figure 6.
Diffractograms obtained by Small Angle X-ray Scattering (SAXS) with the Lorentz correction, for vPET, 50rPET, and 100rPET associated to semi-crystalline preforms.
Figure 7.
Crystalline lamellar thicknesses for vPET, 50rPET, and 100rPET associated to semi-crystalline preforms, determined by SAXS analysis, coupled with crystallinity ratios Xc measured by DSC.
Figure 7.
Crystalline lamellar thicknesses for vPET, 50rPET, and 100rPET associated to semi-crystalline preforms, determined by SAXS analysis, coupled with crystallinity ratios Xc measured by DSC.
Figure 8.
AFM images of vPET with the topography (a), the indentation (b), the contact modulus (c) and the histogram of elastic moduli (d).
Figure 8.
AFM images of vPET with the topography (a), the indentation (b), the contact modulus (c) and the histogram of elastic moduli (d).
Figure 9.
AFM images of 100rPET with the topography (a), the indentation (b), the contact modulus (c), and the histogram of elastic moduli (d).
Figure 9.
AFM images of 100rPET with the topography (a), the indentation (b), the contact modulus (c), and the histogram of elastic moduli (d).
Figure 10.
AFM images of 50rPET with the topography (a), the indentation (b), the contact modulus (c) and the histogram of elastic moduli (d).
Figure 10.
AFM images of 50rPET with the topography (a), the indentation (b), the contact modulus (c) and the histogram of elastic moduli (d).
Figure 11.
Storage modulus (E’) as a function of temperature for vPET, 50rPET and 100rPET measured by DMA, in tensile mode, at a frequency of 1 Hz and a heating rate of 2°C/min.
Figure 11.
Storage modulus (E’) as a function of temperature for vPET, 50rPET and 100rPET measured by DMA, in tensile mode, at a frequency of 1 Hz and a heating rate of 2°C/min.
Figure 12.
Phase angle (Tan δ) as a function of temperature for vPET, 50rPET and 100rPET measured by DMA, in tensile mode, at a frequency of 1 Hz and a heating rate of 2°C/min.
Figure 12.
Phase angle (Tan δ) as a function of temperature for vPET, 50rPET and 100rPET measured by DMA, in tensile mode, at a frequency of 1 Hz and a heating rate of 2°C/min.
Figure 13.
Stress-strain curves of standard samples for vPET, 50rPET, and 100rPET, obtained in uni-axial conditions until rupture, at room temperature and a cross head velocity of 5 mm/min.
Figure 13.
Stress-strain curves of standard samples for vPET, 50rPET, and 100rPET, obtained in uni-axial conditions until rupture, at room temperature and a cross head velocity of 5 mm/min.
Figure 14.
Zoom of stress-strain curves of standard samples for vPET, 50rPET, and 100rPET, until a deformation of 0.2 %, obtained in uni-axial conditions with an extensometer to calculate the Young’s modulus.
Figure 14.
Zoom of stress-strain curves of standard samples for vPET, 50rPET, and 100rPET, until a deformation of 0.2 %, obtained in uni-axial conditions with an extensometer to calculate the Young’s modulus.
Table 1.
Mn, Mw and PDI for vPET and 100rPET.
| Polymer | Mn (kg.mol-1) | Mw (kg.mol-1) | PDI |
|---|---|---|---|
| vPET | 31.5 ± 0.1 | 53.8 ± 1.1 | 1.71 ± 0.04 |
| 100rPET | 31.2 ± 1.6 | 44.9 ± 0.1 | 1.54 ± 0.08 |
Table 2.
Melt Flow Index (MFI) for vPET and 100rPET.
| Polymer | MFI (g/10min) |
|---|---|
| vPET | 20.7 ± 0.3 |
| 100rPET | 36.5 ± 0.4 |
Table 4.
AFM, DMA and uniaxial tensile test module values for vPET, 50rPET and 100rPET.
| Material | Max modulus AFM (GPa) | Elastic modulus (GPa) | Young’s modulus (GPa) |
| vPET | 2.13± 0.12 | 2.72 ± 0.09 | 2.83 ± 0.01 |
| 50rPET | 3.03± 0.29 | 2.56± 0.06 | 2.79 ± 0.03 |
| 100rPET | 2.13± 0.13 | 2.69 ± 0.03 | 2.78 ± 0.03 |
Disclaimer/Publisher’s Note: The statements, opinions and data contained in all publications are solely those of the individual author(s) and contributor(s) and not of MDPI and/or the editor(s). MDPI and/or the editor(s) disclaim responsibility for any injury to people or property resulting from any ideas, methods, instructions or products referred to in the content. |
© 2023 by the authors. Licensee MDPI, Basel, Switzerland. This article is an open access article distributed under the terms and conditions of the Creative Commons Attribution (CC BY) license (http://creativecommons.org/licenses/by/4.0/).
Copyright: This open access article is published under a Creative Commons CC BY 4.0 license, which permit the free download, distribution, and reuse, provided that the author and preprint are cited in any reuse.
Effect of Styrene-Diene Block Copolymers and Glass Bubbles on the Post-Consumer Recycled Polypropylene Properties
Maria Râpă
et al.
Materials,
2020
Thermal and Mechanical Properties of the Recycled and Virgin PET—Part I
Yasemin Celik
et al.
Polymers,
2022


MDPI Initiatives
Important Links
© 2024 MDPI (Basel, Switzerland) unless otherwise stated