1. Introduction
Aedes albopictus (Skuse, 1894), a mosquito of Asian origin, was introduced in Italy at the end of the 1980s, and is now the most abundant species in Italian urban areas [
1] and a major threat to public health.
Ae. albopictus has been responsible for several arbovirus outbreaks in Europe: in France, an increasing number of autochthonous transmissions of dengue virus (DENV), chikungunya virus (CHIKV) and Zika virus (ZIKV) have been detected since 2010 [
2]; and in Italy, the species has caused two CHIKV epidemic events, in 2007 (Emilia-Romagna region) and 2017 (Lazio and Calabria regions)[
3,
4].
In Italy, the tiger mosquito causes a significant biting nuisance [
5] and a constant risk of spread of arboviruses introduced by infected travellers. For these reasons, it is the subject of intense control activities both in public and private areas [
6].
A National Arbovirus Surveillance implemented after the chikungunya outbreak of 2007 promotes a multidisciplinary approach to the surveillance and control management of arbovirus vectors [
7].
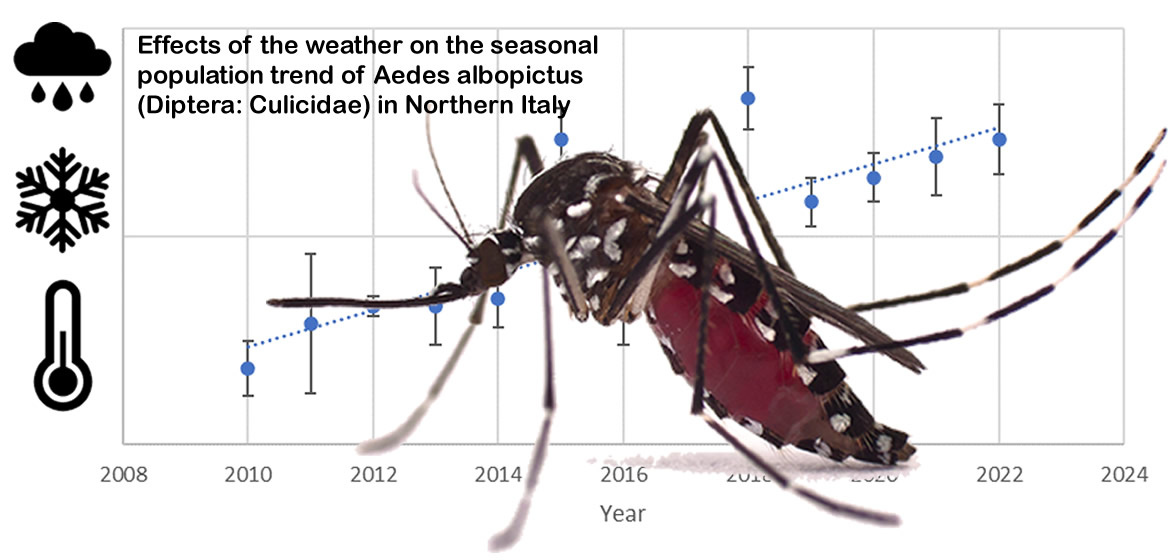
In this work, we have analysed the effects of temperature, rain, and humidity on the seasonal density of Ae. albopictus.
The temperature and precipitation directly or indirectly affect the population dynamics and the life cycle from egg-hatching to adult mosquitoes [
8,
9,
10]
Ae. albopictus develop at a temperature of 15–35 °C, with an optimum of about 29–30 °C and a minimum threshold around 9–10 °C [
11,
12]. High temperatures result in a reduction in the cycle length and survival rate while low temperatures increase the cycle length and survival rate. In females, temperature affects flight activity, host-seeking, and blood-feeding [
13,
14].
Temperature directly affects the larval cycle, while relative humidity (RH) and rainfall indirectly affect the larval cycle; in breeding sites, drought and evaporation reduce the carrying capacity of the larval development environment [
15,
16,
17]. Rain increases the carrying capacity in urban areas; intense rains can wash away the young larvae in road drains, which are the principal breeding sites of
Ae. albopictus [
1].
Another indirect effect of climate is on the control activity efficacy: high temperatures increase the microbiological activity and accelerate the degradation of larvicide products, while low temperatures may reduce the larval feeding activity, thus reducing the dose of ingested larval insecticide [
18,
19]. Intense rainfall may wash away the insecticide from road drains, reducing its efficacy and persistence (personal observation), but may also wash away immatures.
Relative humidity (RH) is a synthetic parameter between temperature and rain and can influence the survival and field dispersion of the adults [
20,
21].
2. Materials and Methods
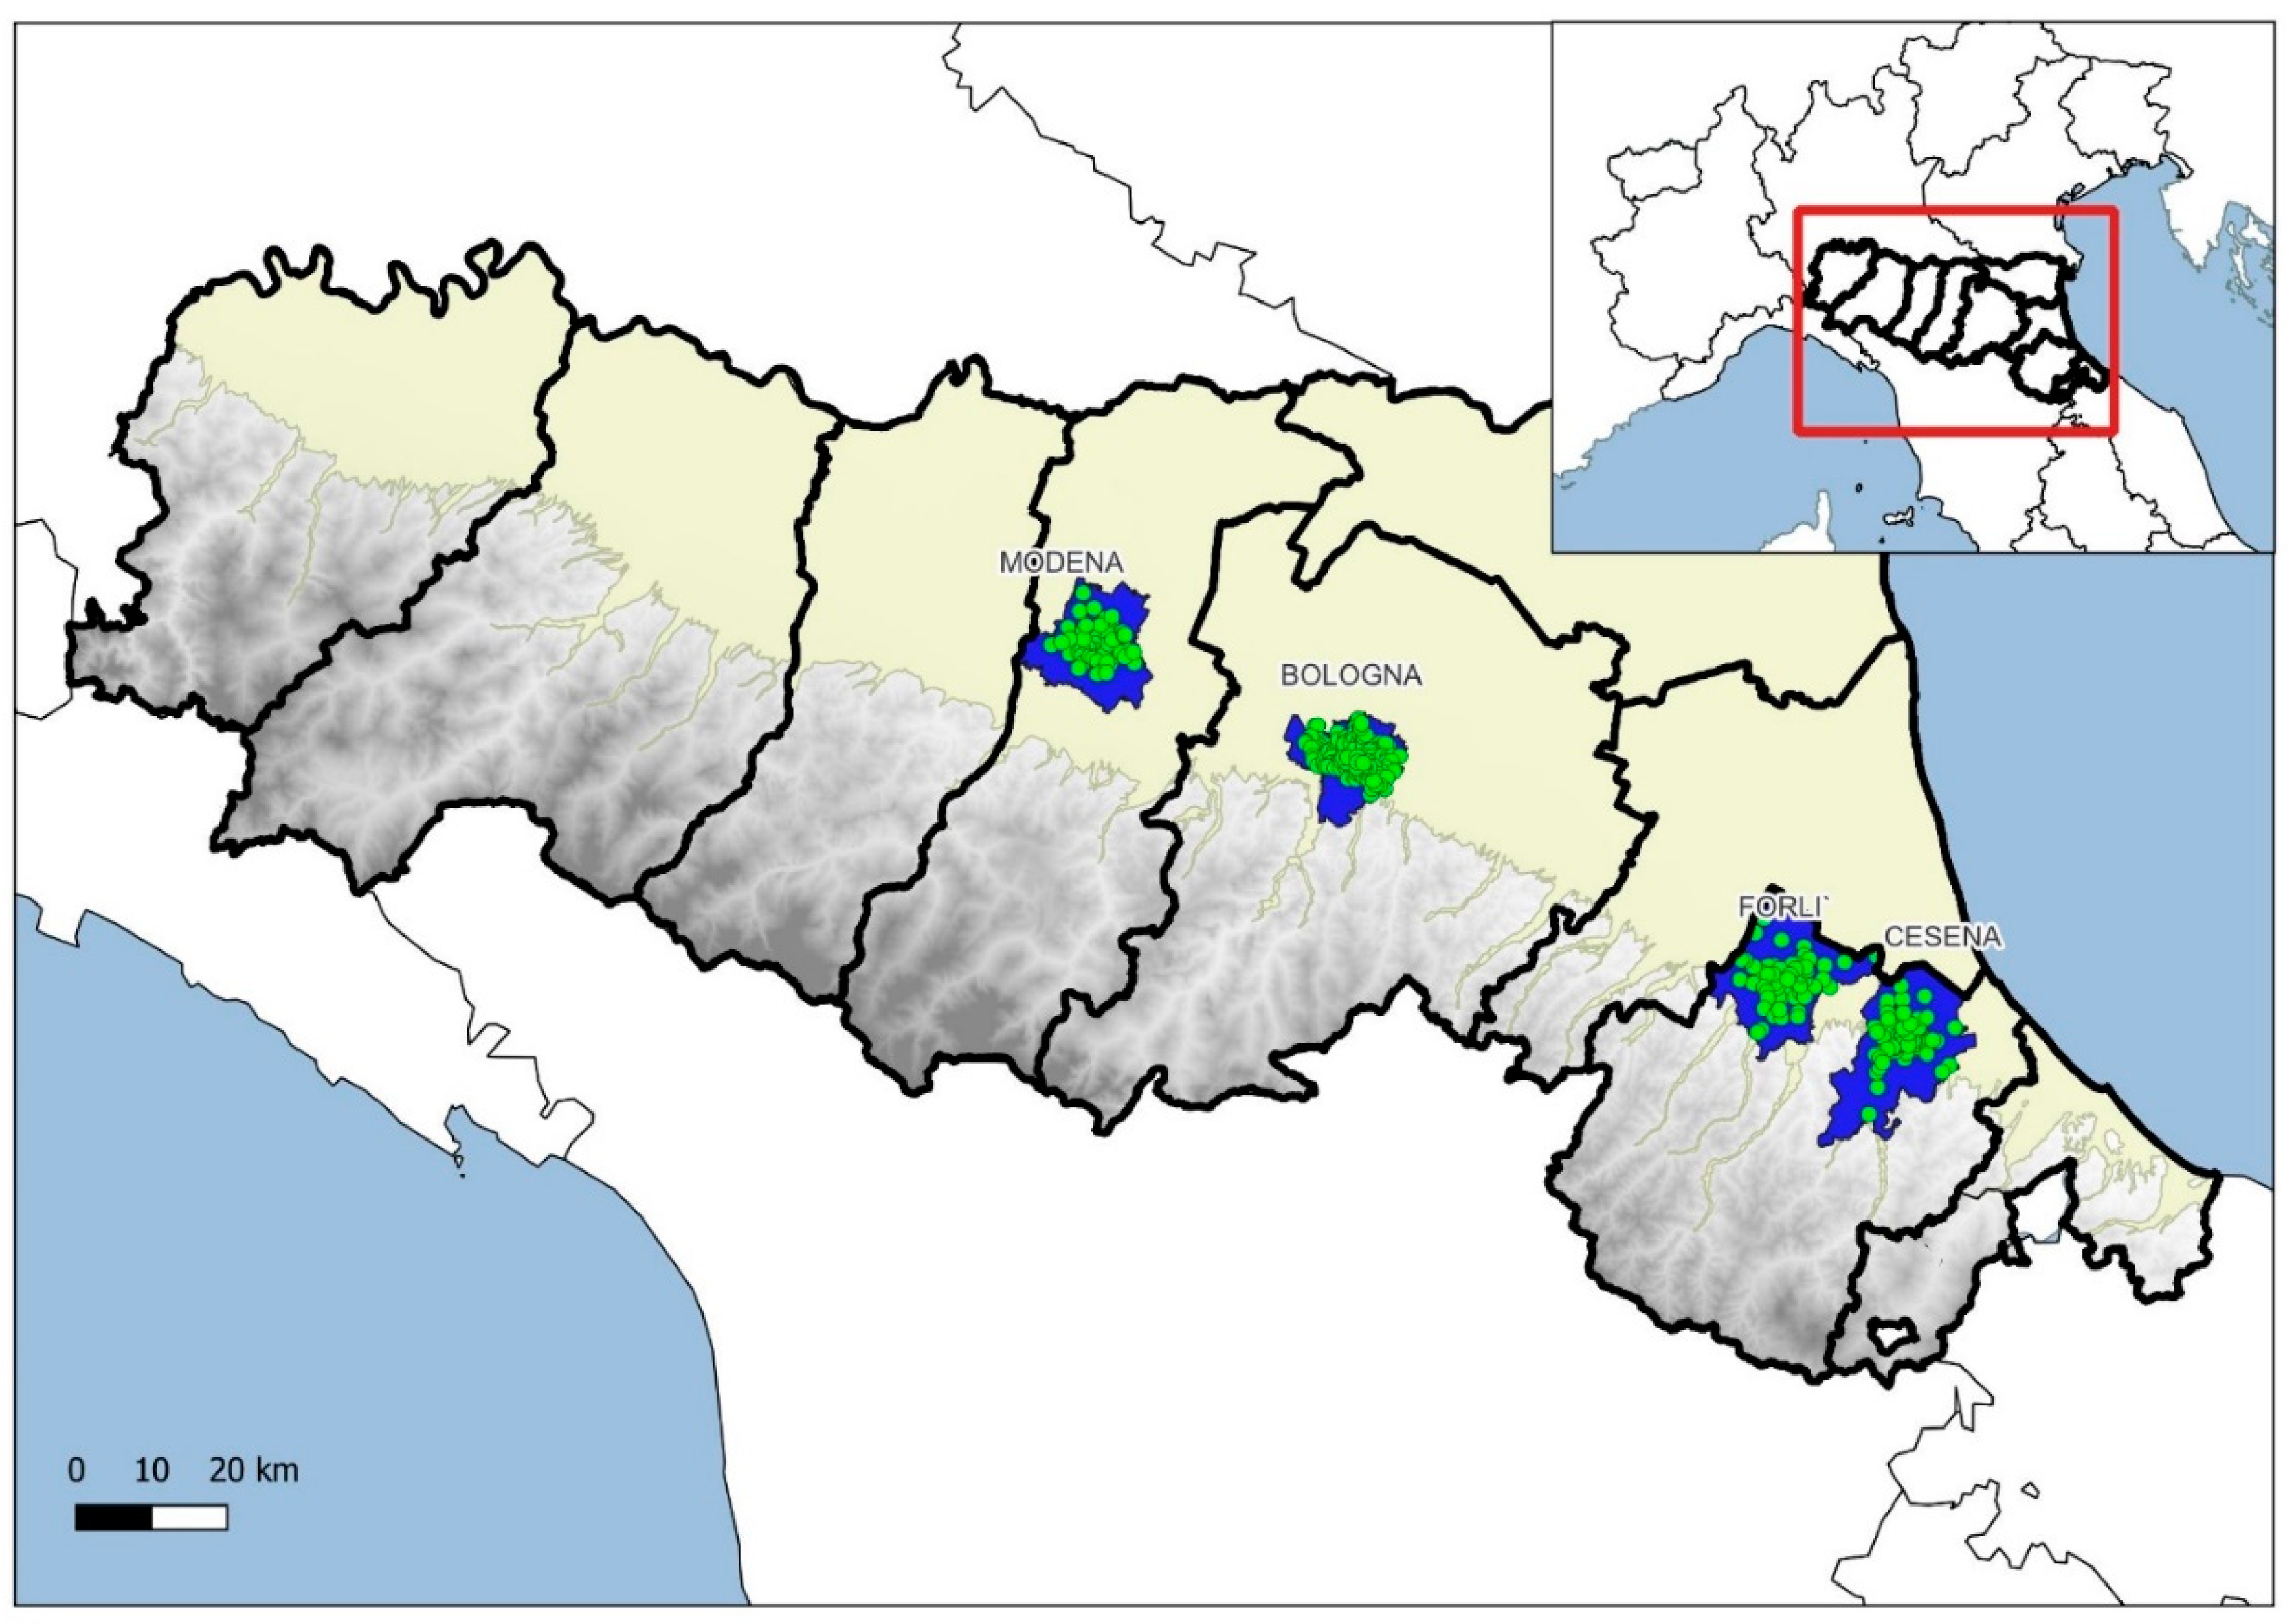
Study area. The study was performed in Bologna (44°29’41” N, 11°20’33” E), Modena (44°38’49” N, 10°55’30” E), Cesena (44° 8’22” N, 12°14’46” E) and Forlì (44°13’21” N, 12° 2’26” E) towns, where the
Ae. albopictus monitoring was conducted without interruptions from 2010 to 2022, according to the validation procedure included in the protocol of the Emilia-Romagna regional
Ae. albopictus monitoring network (E-RMN_AA) [
7,
22](
Figure 1).
Ae .albopictus monitoring. In previous studies conducted in Northern Italy, the average
Aedes albopictus egg density collected by ovitraps was correlated with the adult population estimated by human landing collection (HLC) [
21,
23]. In this study, data from the ovitrap collection from week 21 to 40 were used as a population estimate.
Monitored urban areas were divided into quadrants by GIS software (QGIS), with each having one station positioned in a green-shaded area [
24].
The ovitrap used (CAA14G model) was a 1.4 L black plastic container holding about 800 mL of Bacillus thuringiensis var. israelensis solution (1 mL of Vectobac 12AS/ovitrap) (Valent BioSciences, Sumitomo) and a strip of masonite (15 × 2.5 cm) as an egg deposition substrate.
The monitoring network was organized with summer and winter ovitraps. Summer ovitraps were activated from week 21 to 40 and sampled every two weeks in Bologna (n.110 ovitraps), Cesena (n.75 ovitraps), Forlì (n.60 ovitraps) and Modena (n.60 ovitraps). Winter ovitraps were activated from week 41 to week 20 of the next year in Bologna (20 ovitraps), Cesena (10 ovitraps), and Forlì (10 ovitraps).
Meteorological data. Daily weather parameters (daily average air temperature at 2 m, daily average relative air humidity at 2 m, daily cumulated precipitation, and daily average global radiation) were recorded throughout the course of the study in the four municipalities monitored (ERG5 datasets; Arpae - Regional Agency for Environmental Protection of Emilia-Romagna Region, [
25]). In the three cold months (January, February and March), we considered the number of frosty days (the number of days with a minimum daily temperature < 0°C).
Statistical Analysis. The number of ovitraps activated in each urban area was determined using the Taylor Power Law [
23] at a precision level of D = 1.5-0.25.
In multiple linear regression analyses, the inference of dependent variable ignores the model uncertainty from the first selection of relevant predictors, resulting in overconfident parameter estimates that generalize poorly. To overcome this limitation in the classical linear regression, we used a Bayesian multi-model linear regression as described in Bergh et al. 2021 [
26], a technique that retains all models for inference, weighting each model’s contribution by its posterior probability.
The Akaike information criterion (AIC) weights were used to guide the choice of prior distribution on the regression parameters, and Markov chain Monte Carlo (MCMC) methods were used to update these priors with the observed data in order to obtain the posterior distribution of the parameters.
The MCMC algorithm involves simulating a Markov chain where each state corresponds to a set of parameter values. On each iteration, the algorithm draws a new set of parameter values from a proposal distribution and determines whether to accept or reject the proposal based on the ratio of the posterior probabilities of the new states to the posterior probabilities of the old states. In this study, 1000 samples were chosen for MCMC [
27,
28,
29].
The lag influence of weather parameters on the population dynamics was mitigated using the monthly average, and the number of eggs was standardized for each area with the average.
We adopted the Spearman rank correlation, which is insensitive to transformation using monotonic functions. The Spearman correlation between the different weather parameters was calculated, and the standardized monitoring data were transformed by log(y+1) to normalize the data and control the variance.
We used the open-source software R (version 4.2.2) [
30] and the BAS package [
31] for the statistical analysis.
3. Results
A positive correlation was found between the monthly egg density data. The data collected in May, June, July and August were correlated with those recorded in the subsequent month; the correlation decreased during the summer. The correlation between monthly egg densities was strongest for June and July and weakest for August and September. (
Table 1).
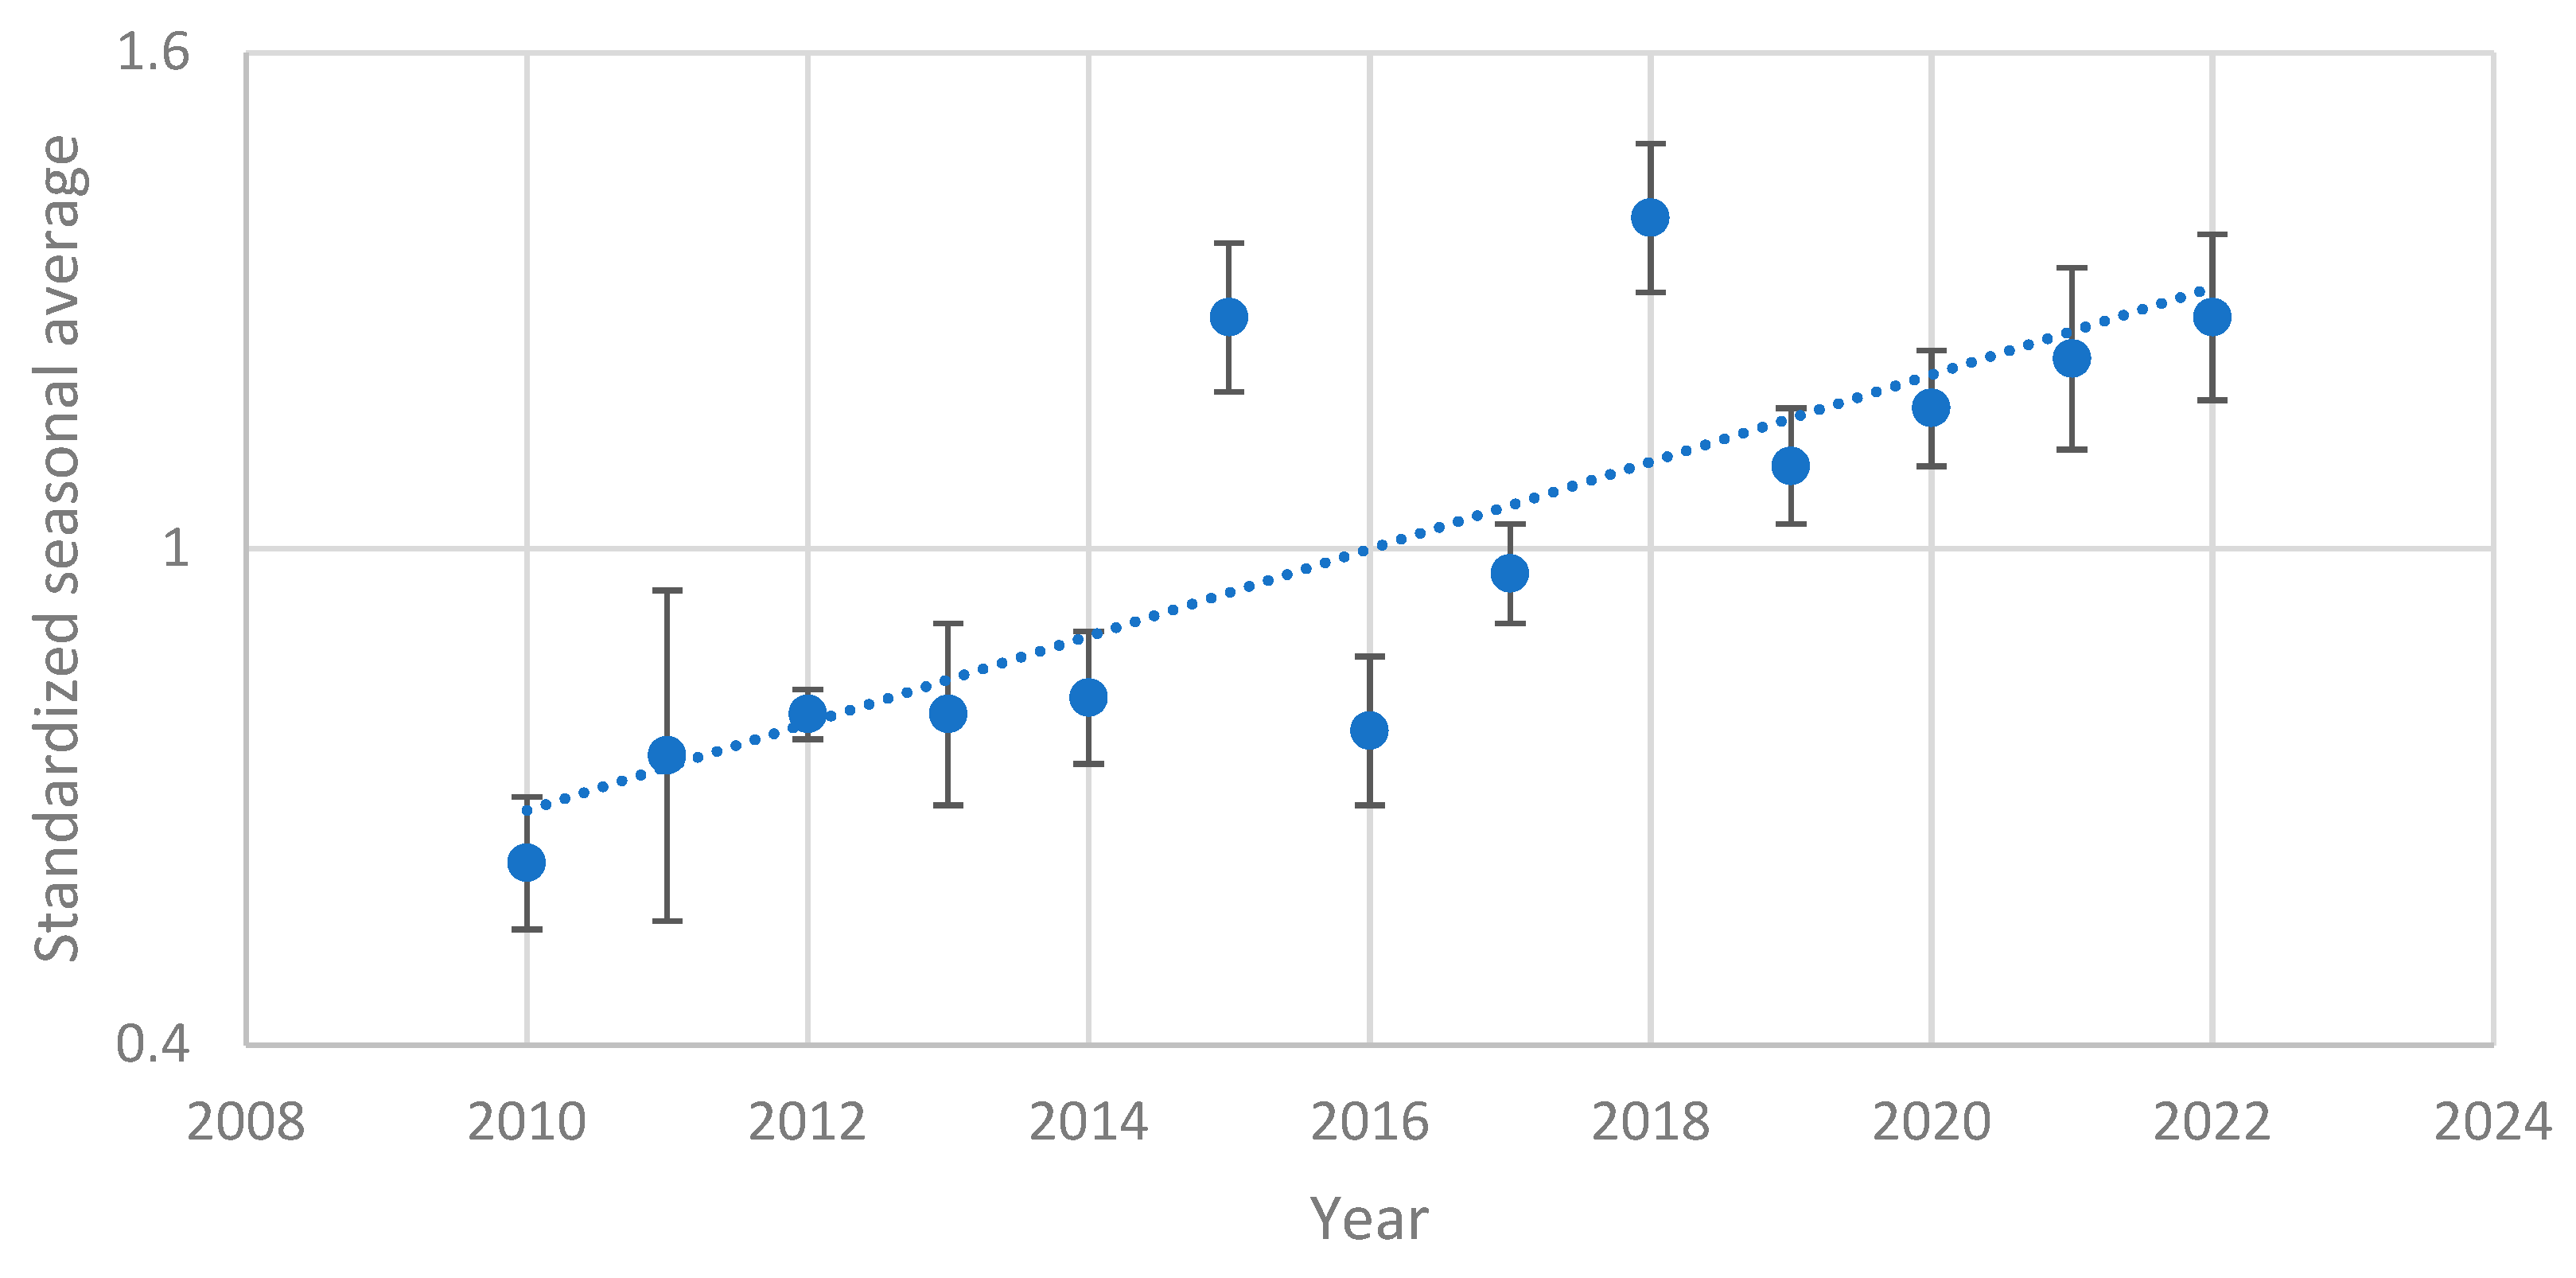
The data collected showed a growing trend in the average number of eggs during the summer season (from the ending of May to to the beginning of October) from 2010 to 2022 (R=0.66, F
1,50=38.55 and p<0.001) (
Figure 2).
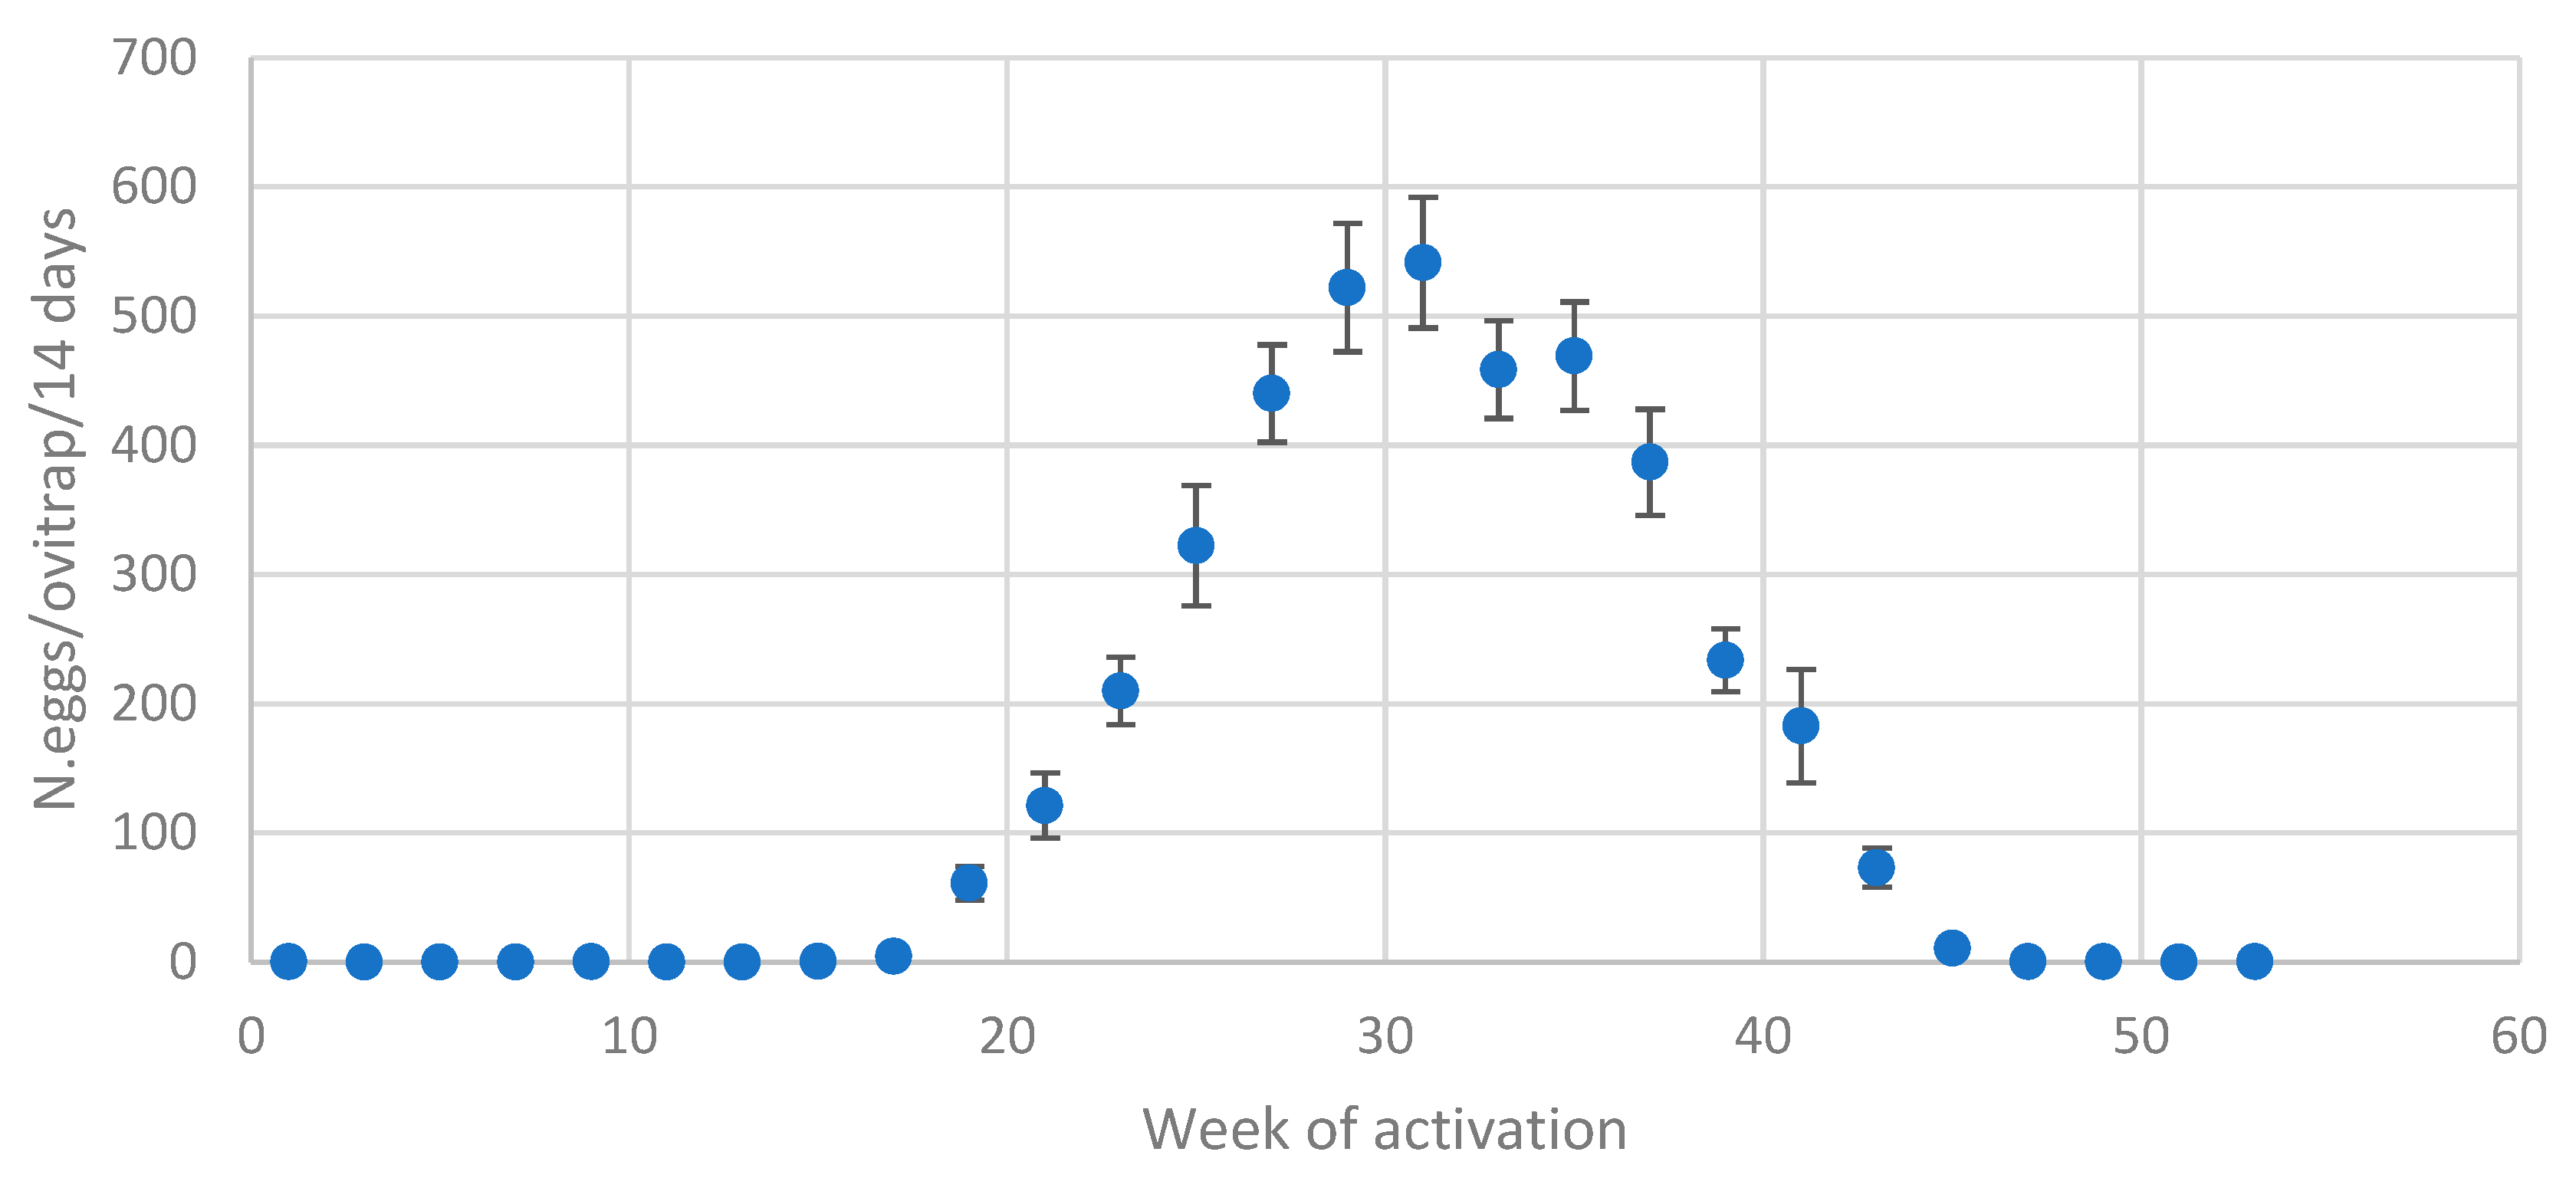
As typically happens in temperate regions, a bell-shaped trend of
Ae. albopictus eggs, collected by monitoring during the summer season, was observed (
Figure 3).
From the beginning of May the seasonal pattern of eggs laid in the winter ovitraps (n. 40) was initially exponential, peaking in late July or early August, after which it gradually declined (
Figure 3).
The number of frost days in winter, the average daily temperature and rain in March (T3 and R3), the temperature and RH in May (T5 and RH5), the mean temperature in June (T6), the rainfall in July (R7), and the mean RH in September (RH9) were the parameters that most influenced the summer average (weeks 21 to 40) of the population of
Ae. Albopictus, where frost days, T3, R3, T9, and RH9 had a negative influence and T5, T6, R5, and R7 had a positive effect (
Table 2).
The model comparison table tells us which of the models showed the best predictive adequacy.
The first two columns are P(M) and P(M|data). P(M) denotes the prior probability of each model. The column labelled P(M|data) denotes the posterior probability of each model after data observation.
BFM is a Bayes factor on the model odds, and it is the factor by which the odds in favour of a specific model increase after data observation.
BF10 gives the relative predictive adequacy of the given model compared to the best-fitting model.
The posterior summary table (
Table 3) provides information about each possible predictor in the linear regression model.
The equation linking the summer average (E
mean) to the spring weather parameters is as follows (
Table 4):
The influence of the winter period (frost days in January–March, T3 and R3) on the egg density in May (M) was evident and partially explains the variability of the data. Significant positive interactions with temperature (T5) and RH recorded in May (RH5) were found. Low temperature and RH in May (T5 and RH5) delayed the emergence and maturation of the females as well as the survival of the first generation (
Table 5).
Table 5.
Posterior summaries of coefficients between weather parameters and the egg density in May.
Table 5.
Posterior summaries of coefficients between weather parameters and the egg density in May.
| Models |
P(M) |
P(M|data) |
BFM
|
BF10
|
R2
|
| Null model (incl. T3, R3, Frost) |
0.08 |
0.00 |
0.00 |
1.00 |
0.59 |
| T5 + RH5 |
0.08 |
0.66 |
23.26 |
63817.39 |
0.79 |
| T5 + RAD5 |
0.08 |
0.15 |
2.10 |
14431.56 |
0.77 |
| T5 |
0.08 |
0.13 |
1.85 |
12948.66 |
0.75 |
Table 6.
Regression coefficients between the average of eggs in May and spring weather parameters.
Table 6.
Regression coefficients between the average of eggs in May and spring weather parameters.
| Predictor |
Coeff |
SE |
t |
p |
| Intercept |
-2.15 |
1.43 |
-1.50 |
0.140 |
| Frost |
-0.01 |
0.00 |
-2.64 |
0.011 |
| T3 |
-0.27 |
0.04 |
-6.48 |
< .001 |
| R3 |
-0.37 |
0.04 |
-8.83 |
< .001 |
| T5 |
0.28 |
0.04 |
6.50 |
< .001 |
| RH5 |
0.03 |
0.01 |
2.75 |
0.008 |
The egg density in June was positively influenced by the egg density in May (M), temperature and rain in May (T5 and R5), and radiation in June (RAD6), and negatively correlated with the rain recorded in June (R6) (Table 6).
Table 6.
Posterior summaries of coefficients between the population and weather parameters and the egg density in June.
Table 6.
Posterior summaries of coefficients between the population and weather parameters and the egg density in June.
| Models |
P(M) |
P(M|data) |
BFM
|
BF10
|
R2
|
| Null model |
0.10 |
0.00 |
0.00 |
1.00 |
0.00 |
| T5 + R5 + R6 + RAD6 + M |
0.10 |
0.50 |
9.10 |
4280920056.21 |
0.74 |
| T5 + R5 + RH5 + R6 + RAD6 + M |
0.10 |
0.20 |
2.29 |
1725052435.16 |
0.75 |
| T5 + R5 + T6 + R6 + RAD6 + M |
0.10 |
0.19 |
2.10 |
1611936985.26 |
0.75 |
The densities of
Ae. albopictus in May and June (MJ), the rain (R6) and the radiation in June (RAD6), and the temperature in July (T7) seemed to influence the mosquito population in July (
Table 7).
The collection of Ae. albopictus eggs generally peaks in August (A), and the egg densities in previous months (MJJ = May+June+July) play an important role. The July temperature (T7) seemed to have a negative impact on August population.
In September, when the females start to lay their winter eggs, the population of the previous months (MJJA = May+June+July+August) has a minor impact while the temperature of August has a negative effect. The temperature recorded in September seemed to have a positive impact on the time of the development cycle and the flight capacity of gravid females.
Table 9.
Model comparison for the mean density in September.
Table 9.
Model comparison for the mean density in September.
| Models |
P(M) |
P(M|data) |
BFM
|
BF10
|
R2
|
| Null model |
0.04 |
0.00 |
0.01 |
1.00 |
0.00 |
| T8 + RH8 + T9 + MJJA |
0.04 |
0.23 |
7.08 |
390.42 |
0.40 |
| T8 + T9 + RAD9 + MJJA |
0.04 |
0.22 |
6.93 |
383.82 |
0.40 |
| T8 + T9 + R9 + RH9 + MJJA |
0.04 |
0.10 |
2.73 |
174.87 |
0.41 |
4. Discussion
The growth rate of
Ae. albopictus population in spring (in temperate areas) or after the dry season (in tropical countries) is initially exponential and then reaches an equilibrium determined by the carrying capacity of the environment, the weather condition and the control activities [
32].
In this study conducted in four urban areas of the Emilia-Romagna region (Bologna, Modena, Cesena, and Forlì) from 2010 to 2022, we analysed the effects of some weather parameters on the seasonal densities of Ae. albopictus (estimated by ovitraps of the monitoring network of the Emilia-Romagna region).
The winter-spring period (January to May) plays a relevant role in shaping the dimension of the first generation of and the seasonal development of Ae. albopictus.
In all insect populations with exponential growth, the initial density has a decisive impact on the seasonal trend. The number of frost days in winter, the amount of rainfall, and the temperature recorded in March seem to affect the number of Ae. albopictus eggs laid in May by the first-generation females developed from overwintering eggs. In this regard, we can make several assumptions about how the weather conditions affect the Ae. albopictus population:
1. the number of frost days may affect the egg winter survival rate;
2. heavy rainfall during the hatching period of the initial overwintering eggs in March [
33] can wash away the young larvae from road drains, which are the main breeding sites of
Ae. albopictus larvae in Italy;
3. the low temperature in March could retard the hatching of the overwintering eggs in a period more favourable and less affected by the sudden drop in temperature typical of this month;
4. the winter and early spring rain may keep the water levels in road drains high and prevent the activation of the egg hatching process.
In general, temperature seems to have a positive effect on the population, but the effect of rain on the seasonal trend was not quite clear. In Italy, Ae. albopictus often breeds in water sources that are independent of rainfall, for example in tanks, vases, or saucers for watering in urban gardens, or in manholes in courtyards for washing cars.
The rain may have an ambiguous influence on the population dynamics of Ae. albopictus: it may reduce the efficacy and persistence of products used in the larval control activities, it may activate egg hatching, and at the same time it may wash out the larvae from road drains. The total amount of rain as well as its intensity and spatial distribution may play a role that would be difficult to quantify and include in a model.
5. Conclusion
In summary, a temperate winter and a dry and cold climate in March, followed by several rainy events and high temperature, may favour the summer development of Ae. albopictus.
Further research on how the control activities of the first-generation of
Ae. albopictus in spring (April in Italy) impact the summer population needs to be conducted in the field, with greater attention paid to the carrying capacity and density-dependent effects (additive, compensatory and over-compensatory) on the mosquito population [
32].
Author Contributions
Conceptualization, M.C.; methodology, M.C.; data curation, M.C., A.A.; original draft preparation, A.A., M.C., R.B.; writing, review and editing, all authors.; All authors have read and agree to the published version of the manuscript.
Funding
This research received no external funding.
Data Availability Statement
The data presented in this study are available on request from the corresponding author.
Acknowledgments
We thank all the technicians involved in the monitoring system and the Emilia-Romagna Regional Group for arbovirus surveillance and control.
Conflicts of Interest
The authors declare no conflict of interest.
References
- Carrieri, M.; Angelini, P.; Venturelli, C.; Maccagnani, B.; Bellini, R. Aedes albopictus (Diptera: Culicidae) population size survey in the 2007 Chikungunya outbreak area in Italy. I. Characterization of breeding sites and evaluation of sampling methodologies. J Med Entomol 2011, 48, 1214–1225. [Google Scholar] [CrossRef] [PubMed]
- Cochet, A.; Calba, C.; Jourdain, F.; Grard, G.; Durand, G.A.; Guinard, A. Autochthonous dengue in mainland France, 2022: geographical extension and incidence increase. Euro Surveill. 2022, 27, pii=2200818. [Google Scholar] [CrossRef] [PubMed]
- Angelini, P.; Macini, P.; Finarelli, A.C.; Po, C.; Venturelli, C.; Bellini, R.; Dottori, M. Chikungunya epidemic outbreak in Emilia-Romagna (Italy) during summer 2007. Parassitologia 2008, 50, 97–98. [Google Scholar] [PubMed]
- Manica, M.; Guzzetta, G.; Poletti, P.; Filipponi, F.; Solimini, A.; Caputo, B. Transmission dynamics of the ongoing chikungunya outbreak in Central Italy: From coastal areas to the metropolitan city of Rome, summer 2017. Eurosurveillance 2017, 22, 18–41. [Google Scholar] [CrossRef]
- Carrieri, M.; Bellini, R.; Maccaferri, S.; Gallo, L.; Maini, S.; Celli, G. Tolerance thresholds for Aedes albopictus and Aedes caspius in Italian urban areas. J. Am. Mosq. Control Assoc 2008, 24, 377–386. [Google Scholar] [CrossRef] [PubMed]
- Canali, M. Controllo della Zanzara Tigre: analisi dei costi sostenuti dagli Enti Locali. Emilia-Romagna Report 2008–2011 2011, 73. [Google Scholar]
- Di Luca, M. Rapporti ISTISAN 22/22 . Sorveglianza delle Zanzare in Italia. ISSN 2022, 1123-3117 (cartaceo), 2384-8936 (online).
- Hawley, W. The biology of Aedes albopictus. J Am Mosq Control Assoc 1988, 1, 1–39. [Google Scholar]
- Vallorani, R.; Angelini, P.; Bellini, R.; Carrieri, M.; Crisci, A.; Mascali Zeo, S.; Messeri, G.; Venturelli, C. Temperature Characterization of Different Urban Microhabitats of Aedes albopictus (Diptera Culicidae) in Central-Northern Italy. Environ Entomol. 2015, 44, 1182–1192. [Google Scholar] [CrossRef] [PubMed]
- Lamy, K.; Tran, A.; Portafaix, T.; Leroux, M.D.; Baldet, T. Impact of regional climate change on the mosquito vector Aedes albopictus in a tropical island environment: La Réunion. Sci Total Environ. 2023, 875, 162484. [Google Scholar] [CrossRef] [PubMed]
- Delatte, H.; Gimonneau, G.; Triboire, A.; Fontenille, D. Influence of temperature on immature development, survival, longevity, fecundity, and gonotrophic cycles of Aedes albopictus, vector of chikungunya and dengue in the Indian Ocean. J Med Entomol. 2009, Jan 46, 33–41. [Google Scholar] [CrossRef]
- Ravasi, D.; Mangili, F.; Huber, D.; Cannata, M.; Strigaro, D.; Flacio, E. The effects of microclimatic winter conditions in urban areas on the risk of establishment for Aedes albopictus. Sci Rep. 2022, 12, 15967. [Google Scholar] [CrossRef] [PubMed]
- Roiz, D.; Rosà, R.; Arnoldi, D.; Rizzoli, A. Effects of temperature and rainfall on the activity and dynamics of host-seeking Aedes albopictus females in northern Italy. Vector Borne Zoonotic Dis. 2010, 10, 811–816. [Google Scholar] [CrossRef] [PubMed]
- Clements, A.N. The Biology of Mosquitoes; 2000.
- Focks, D.A.; Haile, D.G.; Daniels, E.; Mount, G.A. Dynamic life table model for Aedes aegypti (Diptera: Culicidae): analysis of the literature and model development. J Med Entomol. 1993, 30, 30,1003–17. [Google Scholar] [CrossRef] [PubMed]
- Reinhold, J.M.; Lazzari, C.R.; Lahondère, C. Effects of the Environmental Temperature on Aedes aegypti and Aedes albopictus Mosquitoes: A Review. Insects 2018, 9, 158. [Google Scholar] [CrossRef] [PubMed]
- Fukui, S.; Kuwano, Y.; Ueno, K.; Atsumi, K.; Ohta, S. Modeling the effect of rainfall changes to predict population dynamics of the Asian tiger mosquito Aedes albopictus under future climate conditions. PLoS ONE 2022, 17, e0268211. [Google Scholar] [CrossRef]
- Cunningham, P.A. A review of toxicity testing and degradation studies used to predict the effects of diflubenzuron (dimilin) on estuarine crustaceans. Env Pol. 1986, 40A, 63–86. [Google Scholar] [CrossRef]
- Lawler, S.P. Environmental safety review of methoprene and bacterially-derived pesticides commonly used for sustained mosquito control. Ecotoxicol Environ Saf. 2017, 139, 335–343. [Google Scholar] [CrossRef] [PubMed]
- Carrieri, M.; Fariselli, P.; Maccagnani, B.; Angelini, P.; Calzolari, M.; Bellini, R. Weather Factors Influencing the Population Dynamics of Culex pipiens (Diptera: Culicidae) in the Po Plain Valley, Italy (1997-2011). Environmental Entomology 2014, 43, 482–490. [Google Scholar] [CrossRef]
- Bellini, R.; Carrieri, M.; Balestrino, F.; Puggioli, a.; Malfacini, M.; Bouyer, J. Field Competitiveness of Aedes albopictus (Diptera: Culicidae) Irradiated Males in Pilot Sterile Insect Technique Trials in Northern Italy. Journal of Medical Entomology 2021, 58, 807–813. [Google Scholar] [CrossRef]
- Carrieri, M.; Albieri, A.; Gentili, L.; Bacchi, M.; Manzieri, A.M.; Angelini, P.; Venturelli, C.; Matrangolo, C.; Leis, M.; Pezzi, M.; Rani, M.; Iezzi, R.S.; Melotti, S.; Casari, A.; Bellini, R. Egg data validation in quantitative monitoring of Aedes albopictus in Emilia-Romagna region, Italy. Pathogens and Global Health 2021, 115, 125–131. [Google Scholar] [CrossRef]
- Carrieri, M.; Albieri, A.; Angelini, P.; Baldacchini, F.; Venturelli, C.; Mascali Zeo, S.; Bellini, R. Surveillance of the chikungunya vector Aedes albopictus (Skuse) in Emilia-Romagna (northern Italy): organizational and technical aspects of a large scale monitoring system. J. Vector Ecol. 2011, 36, 108–116. [Google Scholar] [CrossRef] [PubMed]
- Albieri, A.; Carrieri, M.; Angelini, P.; Baldacchini, F.; Venturelli, C.; Mascali Zeo, S.; Bellini, R. Quantitative monitoring of Aedes albopictus (Skuse) in Emilia-Romagna,Northern Italy: cluster investigation and geostatistical analysis. Bull. Insectol. 2010, 63, 209–216. [Google Scholar]
- Antolini, G.; Auteri, L.; Pavan, V.; Tomei, F.; Tomozeiu, R.; Marletto, V. A daily highresolution gridded climatic data set for Emilia-Romagna, Italy, during 1961-2010. International Journal of Climatology 2015. [Google Scholar] [CrossRef]
- Bergh, D.v.d.; Clyde, M.A.; Gupta, A.R.K.N. et al. A tutorial on Bayesian multi-model linear regression with BAS and JASP. Behav Res 2021, 53, 2351–2371. [Google Scholar] [CrossRef]
- Raftery, A.E.; Madigan, D.; Hoeting, J.A. Bayesian Model Averaging for Linear Regression Models. Journal of the American Statistical Association 1997, 437, 179–191. [Google Scholar] [CrossRef]
- Clyde, M.; Ghosh, J.; and Littman, M. Bayesian Adaptive Sampling for Variable Selection and Model Averaging. Journal of Computational Graphics and Statistics 2010, 20, 80–101. [Google Scholar] [CrossRef]
- Clyde, M.A. BAS: Bayesian Adaptive Sampling for Bayesian Model Averaging. [R package] 2017. Available online: https://cran.r-project.org/package=BAS.
- R Core Team. R: A Language and environment for statistical computing. (Version 4.3) [Computer software] 2022. Available online: https://cran.r-project.org.
- Clyde, M.A.; Ghosh, J.; Littman, M.L. Bayesian Adaptive Sampling for Variable Selection and Model Averaging. Journal of Computational and Graphical Statistics 2011, 20, 1–80. [Google Scholar] [CrossRef]
- Evans, K.G.; Neale, Z.R.; Holly, B.; Canizela, C.C.; Juliano, S.A. Survival-Larval Density Relationships in the Field and Their Implications for Control of Container-Dwelling Aedes Mosquitoes. Insects 2023, 14, 17. [Google Scholar] [CrossRef]
- Roiz, D.; Neteler, M.; Castellani, C.; Arnoldi, D.; Rizzoli, A. Climatic Factors Driving Invasion of the Tiger Mosquito (Aedes albopictus) into New Areas of Trentino, Northern Italy. PLoS ONE 2011, 6, e14800. [Google Scholar] [CrossRef]
|
Disclaimer/Publisher’s Note: The statements, opinions and data contained in all publications are solely those of the individual author(s) and contributor(s) and not of MDPI and/or the editor(s). MDPI and/or the editor(s) disclaim responsibility for any injury to people or property resulting from any ideas, methods, instructions or products referred to in the content. |
© 2023 by the authors. Licensee MDPI, Basel, Switzerland. This article is an open access article distributed under the terms and conditions of the Creative Commons Attribution (CC BY) license (http://creativecommons.org/licenses/by/4.0/).


