1. Introduction
Studies should be directed towards new missions of Earth Exploration Satellite Services (EESS), especially in Brazil, to monitor agriculture and the diverse biomes of the Brazilian territory, including deforestation in the Amazon rainforest [
1,
2]. These missions aim at deploying small and medium-sized satellites with payloads utilizing ultra-high resolution optical sensors or Synthetic Aperture Radars (SARs) that require/produce high data rates [
3] for downlink transmissions, involving the sharing of their frequency spectrum with Fixed Service (FS) systems (a category of Private Limited Service-SLP regulated by ANATEL [
4]), for example, cellular Base Stations (BS), etc., as it occurs in Cuiabá, Mato Grosso, Brazil. Both highlight the issues of spectral efficiency (in bps/Hz) and coexistence in frequency, time, location, etc.
Our research provides a solution to mitigate interference in the LEO satellite downlinks of Earth exploration services through Cognitive Radio (CR) and Adaptive MODulation and CODing (MODCOD) techniques. The main approach is to manipulate the downlink transmission parameters in the Earth observation communication system (onboard TX and ground station RX) by using CR techniques in the underlay paradigm, in order to remove degradation in the image caused by these interferences. These techniques will be combined with a reconfiguration of the Adaptive MODCOD technique (ACM) based on DVB-S2X systems to increase RF and spectral power efficiencies.
The entire concept of CR was first proposed and detailed by Joseph Mitola III in his PhD thesis in 2000 [
5]. Recently, in [
6], Cognitive Radio System (CRS) is defined as follows:
“CRS employs technology that allows the radio to comprehend its internal state, the operational and geographical environment, and the established regulations to dynamically and autonomously adjust its parameters and operational protocols based on the acquired knowledge to achieve predefined objectives.”
In this sense, we consider the concept of Cognitive Radio (CR) as a proposition to address the challenge of spectrum scarcity in the development of shared satellite-terrestrial wireless networks.
This article initially establishes the techniques that enable CR communications with interference in the underlay paradigm. Then, we develop and adapt/implement operational approaches to deal with these interferences. Innovative methods of spectral exploitation for high-throughput communication satellites combined with CR paradigm architectures will promote the solution to achieve the required high data rate and spectrum sharing goals in the coming years [
7,
8,
9].
Based on this, we propose a new combination of CR approach and ACM technique suitable to mitigate interference in the downlink of Earth exploration services by Low Earth Orbit (LEO) satellites for spectral, temporal, and spatial coexistence, achieving the throughput goal. The MODCOD techniques are based on the rational application of highly efficient and enhanced modulation for non-linearities, combined with efficient channel coding, i.e., error correction codes [
10].
In terrestrial and satellite contexts, there are widely used approaches to increase the spectral efficiency of wireless systems [
11]. Spectrum Sharing (SS) (in underlay) allows sharing of available spectrum between primary and secondary users (PU and SU).
In the EOS (Earth Observation Satellite) downlink scenario, we can improve the functional performance of high data rate transmitters onboard to meet bandwidth requirements and efficiently utilize RF energy by employing MODCOD techniques in an Adaptive Coding and Modulation (ACM) system [
12,
13]. Certain cases where simultaneous transmissions of primary and secondary users will be necessary in the same spectral band at the same time and location, for example, are described in [
14]: GEO satellite as SU with LEO satellite as PU, or in [
15]: LEO satellite system as SU.
The applicability of CR techniques available to enable spectral coexistence of PU and SU is only possible with the advanced algorithmic functions characteristic of Software-Defined Radios (SDRs) [
16].
The article is organized as follows:
Section 2 presents the materials and methods for CR paradigm exploitation (1), MODCOD in ACM (2), and our combined solution for the EESS downlink coexistence scenario (3), along with the strategy to mitigate the harmful effects caused by interference in the desired signal (4).
Section 3 presents and the main empirical-analytical results for chosen combined MODCOD/CR strategy in the case studies (5) and the Lab emulation (6). The results are discussed in
Section 4. A brief conclusion of the work is provided in
Section 5.
2. Materials and Methods
A brief overview of CR spectrum exploitation techniques and the interfering scenario is presented here to calculate the link budget with real parameters.
2.1. Cognitive Radio Paradigms and Techniques
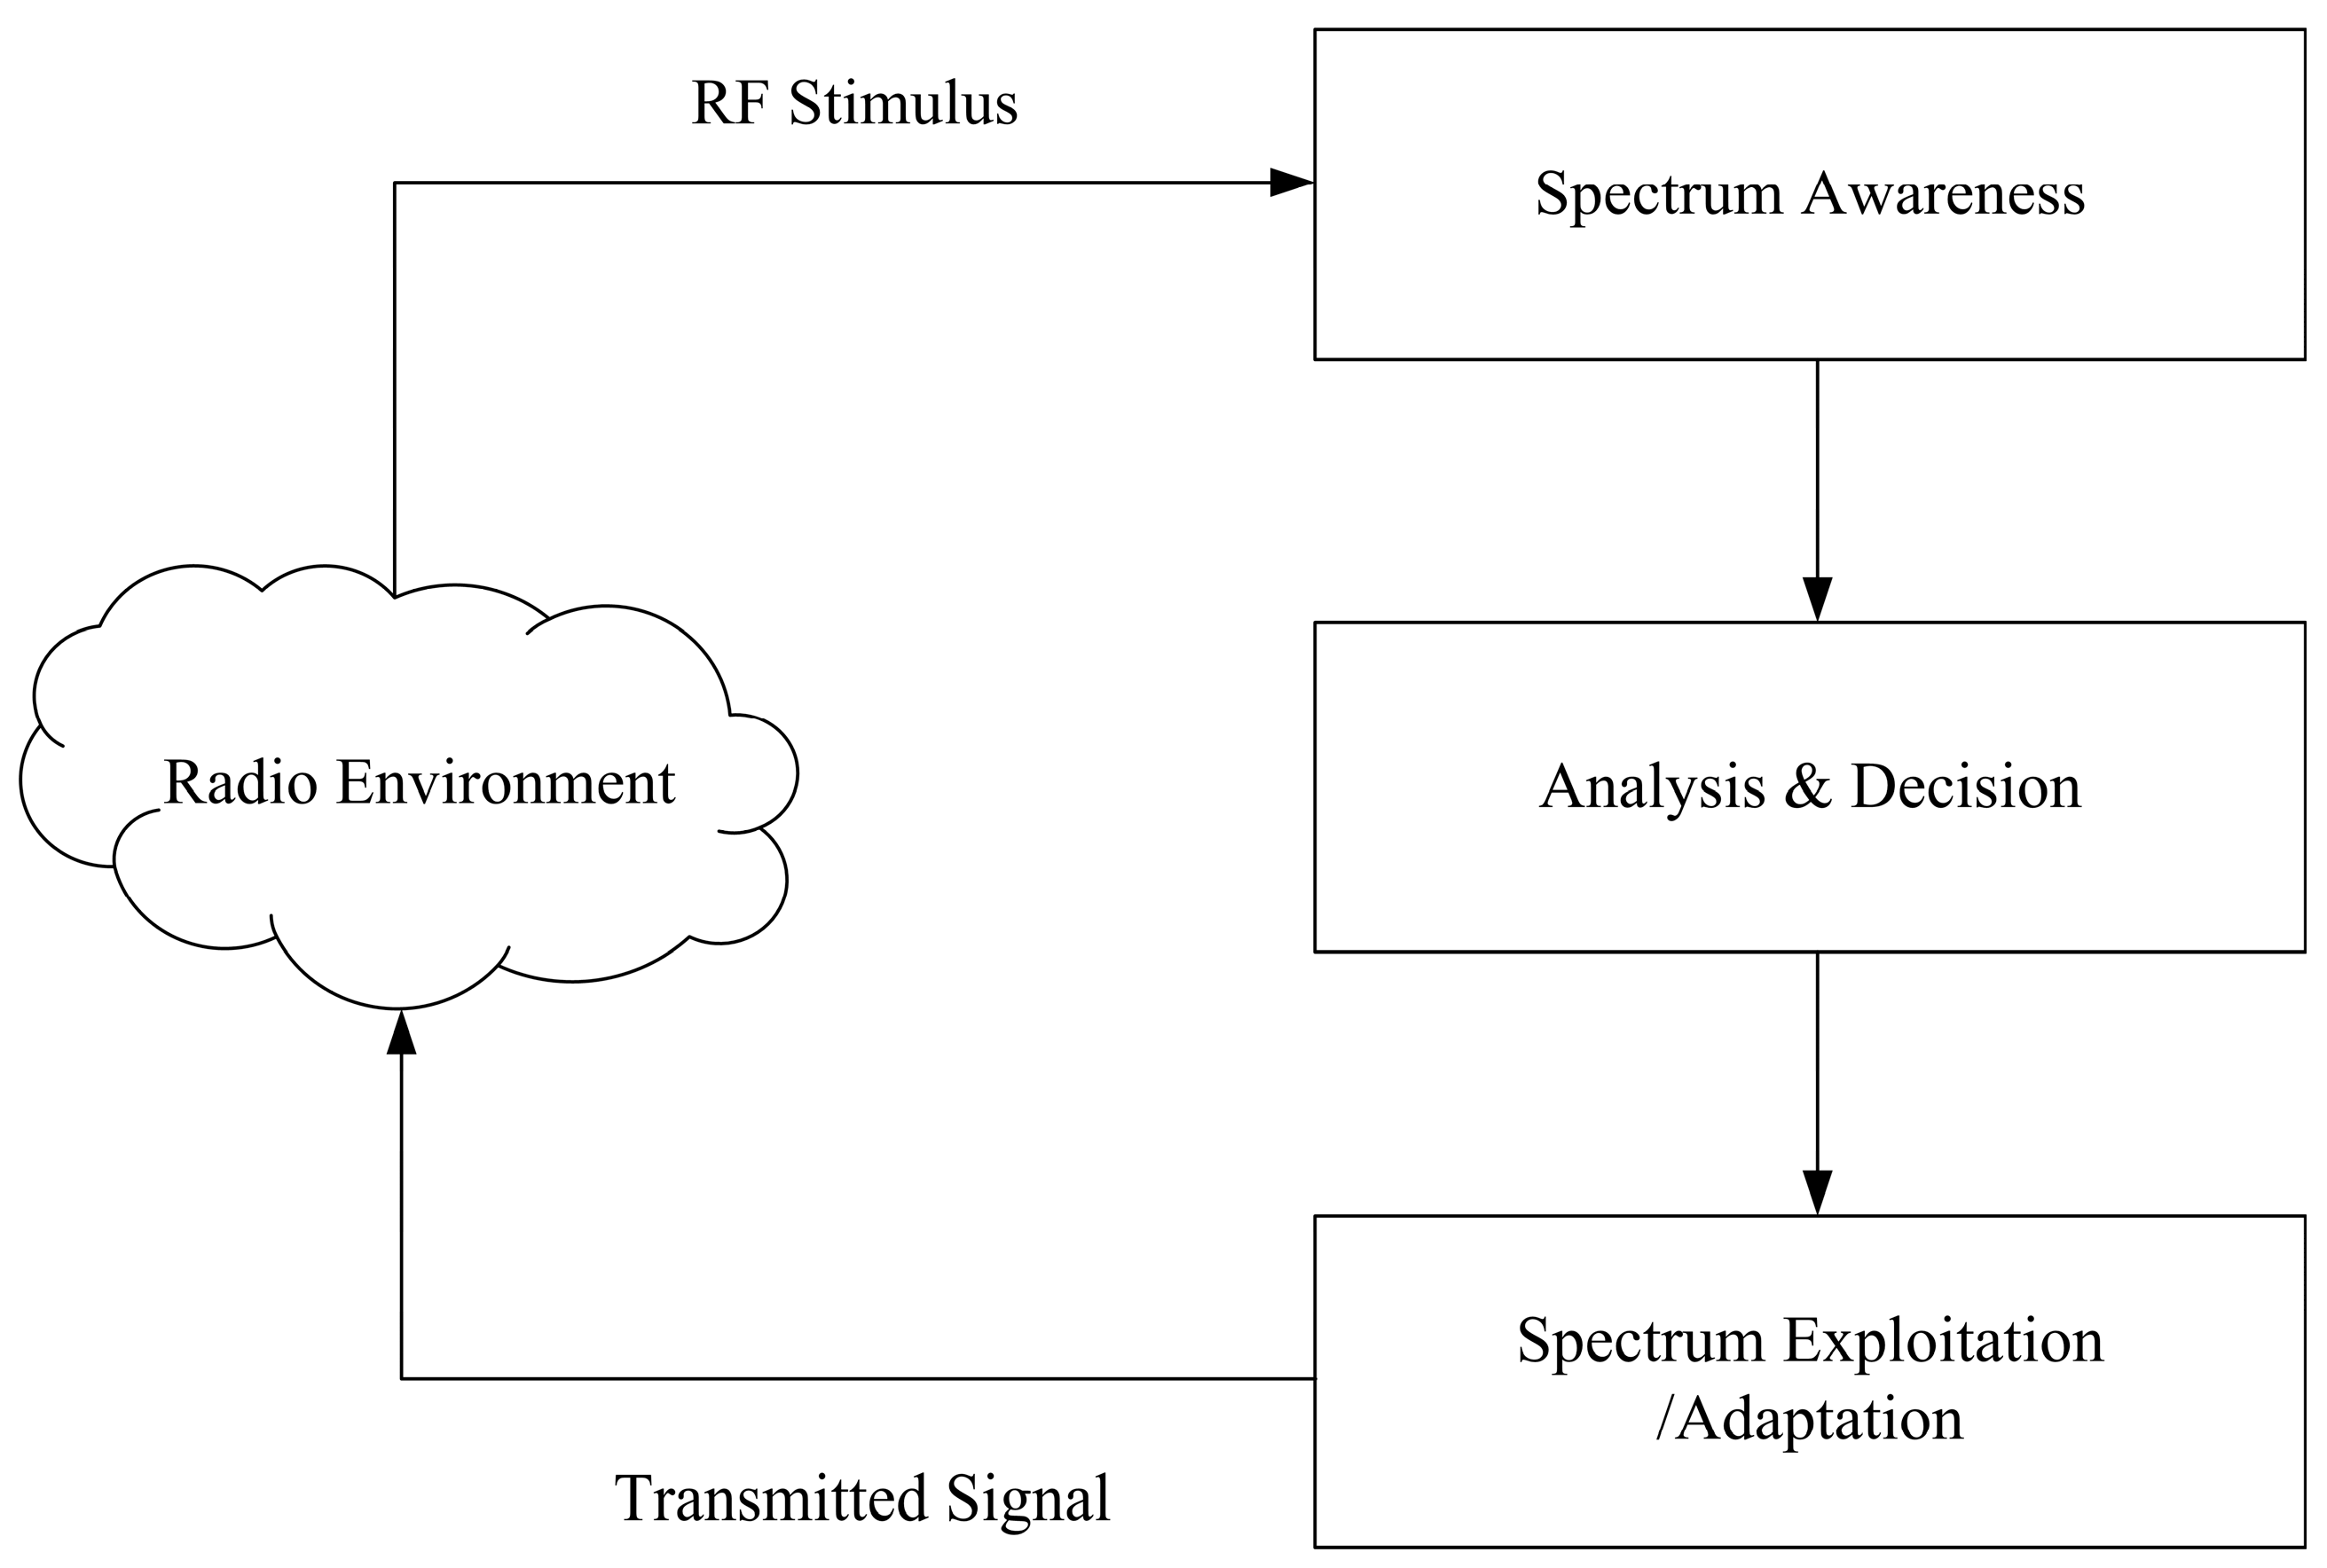
We can describe the operational techniques available in all proposed CR systems as continuous cognitive cycles [
7] in the following sequence (see
Figure 1):
Spectrum Awareness (Sensor) – The first task for a CR is to be aware of its surrounding radio environment;
Analysis and Decision (Controller) – Analyze the obtained information and make an intelligent decision on how to effectively use the available resources;
Spectrum Exploitation (Adaptation) (Actuator) – In other words, the CR autonomously adapts its operational parameters, such as transmission power, operating frequency, modulation and coding schemes, antenna pattern or polarization etc., in any environmental conditions to effectively exploit the available spectral opportunities.
In this sense, the spectrum awareness capability allows a CR to obtain information about dynamic spectral opportunities, while the spectrum exploitation capability assists the CR in efficiently exploiting the spectral availabilities.
Based on the level of knowledge of PU transmission signals, existing spectrum exploitation techniques can be classified into the interweave, underlay, and overlay paradigms. The underlay, which is employed in our practical context, can be defined as [
17]:
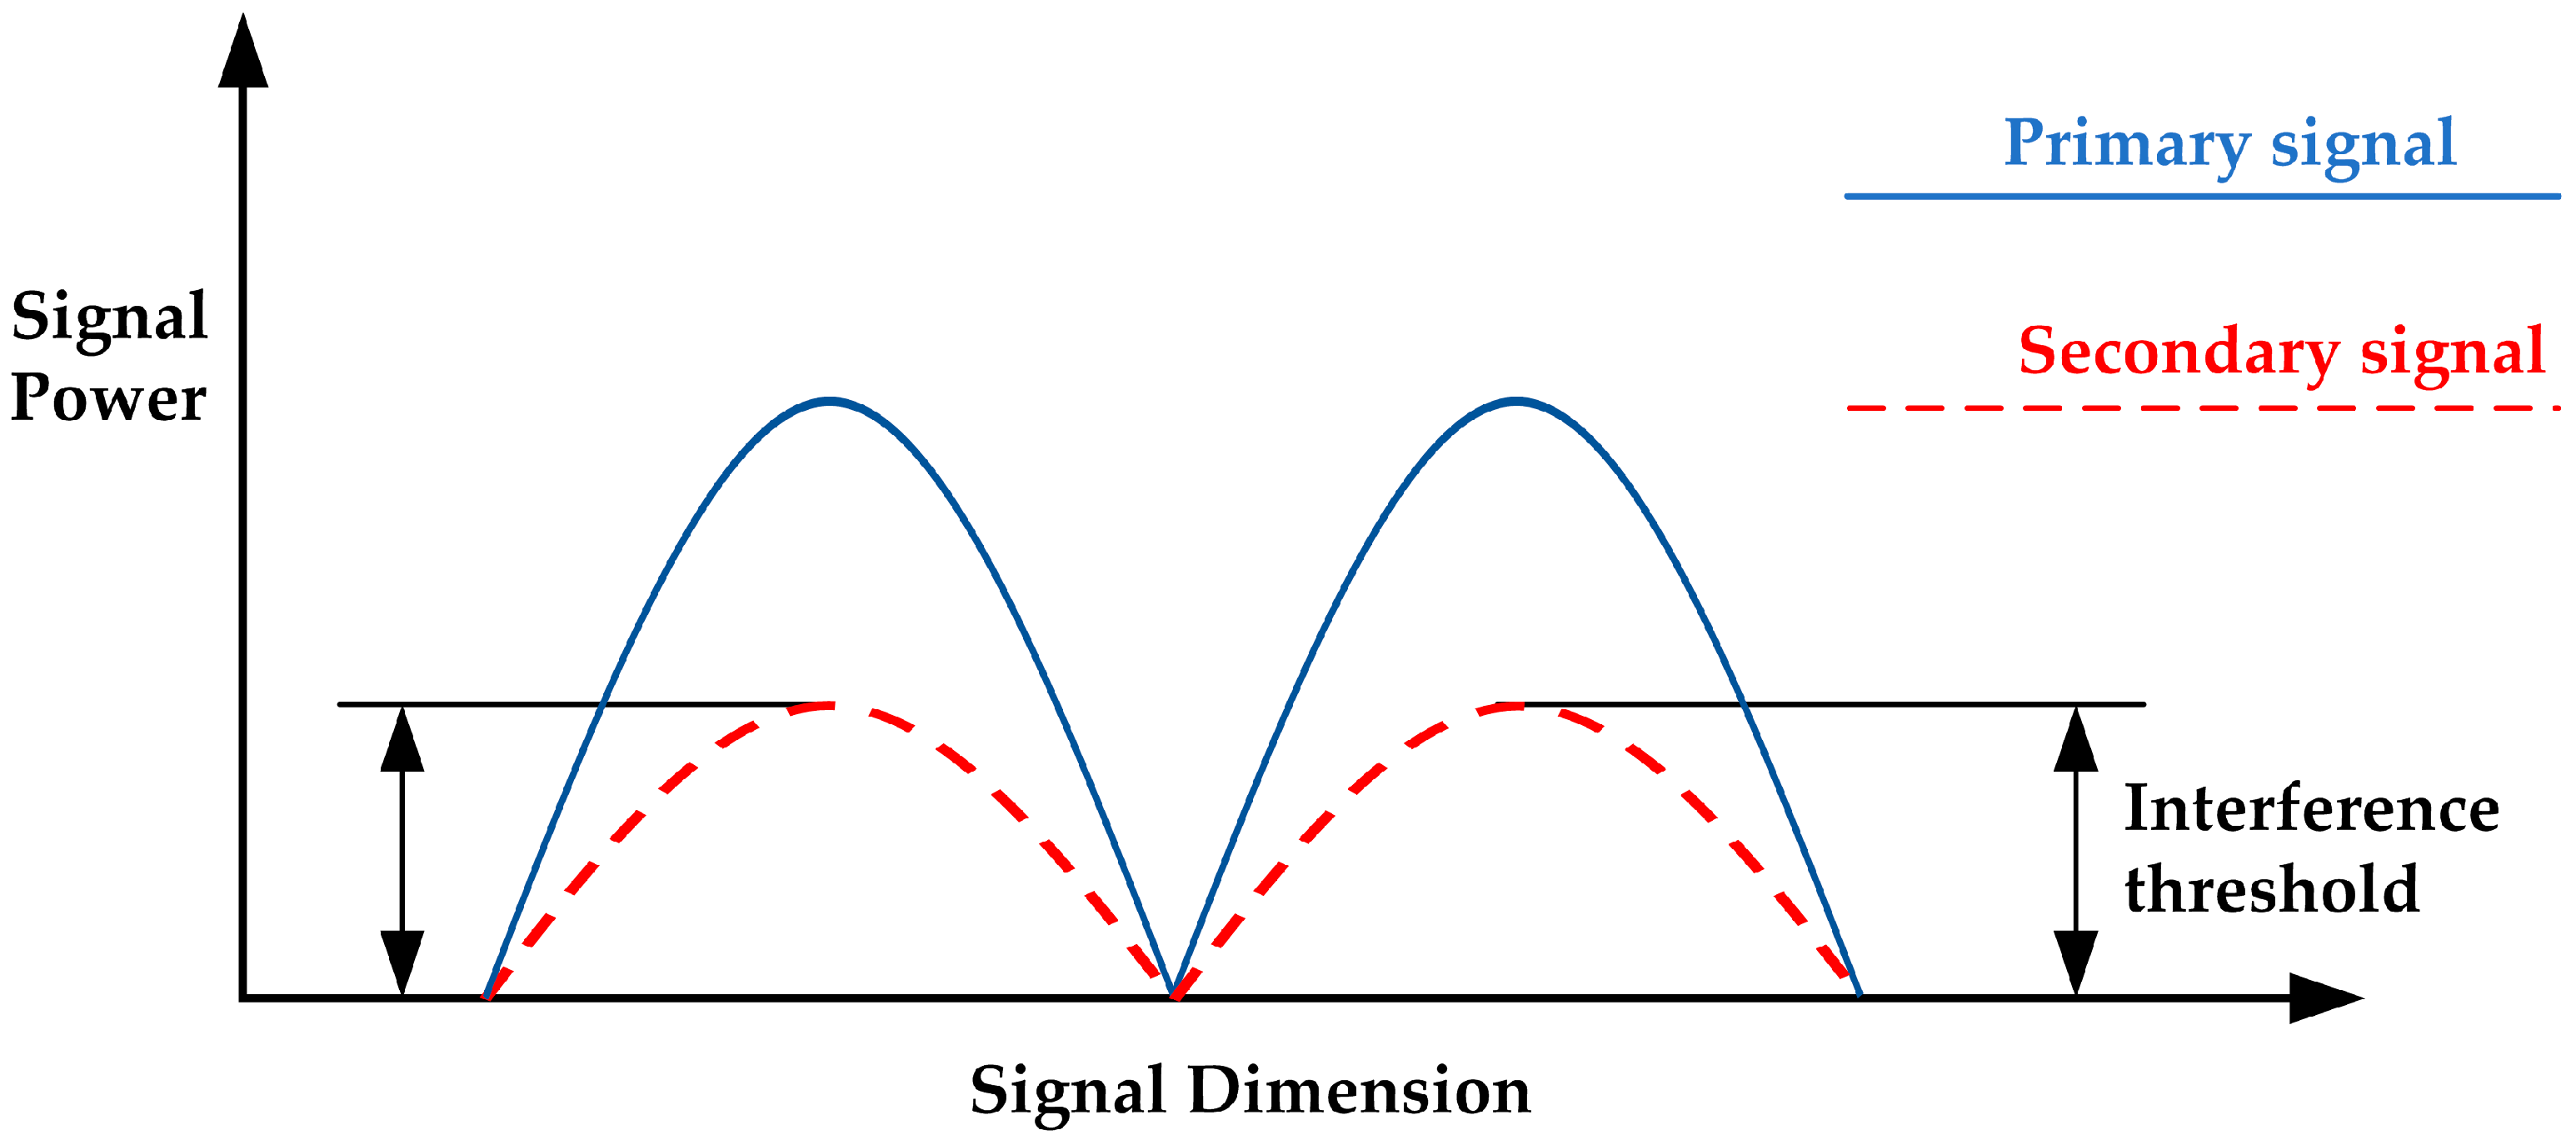
Underlay – In this paradigm, simultaneous cognitive and non-cognitive transmissions are allowed in the same frequency band, as long as the level of interference on the PU side remains acceptable at the defined threshold (see
Figure 2). The maximum level of interference allowed on the PU can be modeled by the concept of interference temperature [
18] and is regulated by local federal policy (e.g., FCC Spectrum Policy Task Force in [
19]). PU system information such as signal-to-noise ratio (SNR), signal and channel parameters, and DoAs (direction of arrival) are eventually required to perform underlay techniques.
2.2. ACM Technique Based on DVB-S2X
The ACM technique, when combined with a CR method, benefits cognitive satellite applications. Both concepts show how this new strategy can be implemented to achieve better bandwidth and RF power efficiencies. Well-recognized techniques for High Data Rate (HDR) are based on the proper use of modulation and coding, the Low-Density Parity Check (LDPC) code followed by Amplitude-Phase Shift Keying (APSK) modulation will be the next-generation basis for HDR downlink [
20] under the DVB-S2X standard [
21].
In short, DVB-S2X is the second-generation extensions standard for Digital Video Broadcasting. This modulation-coding format for high data rate telemetry [
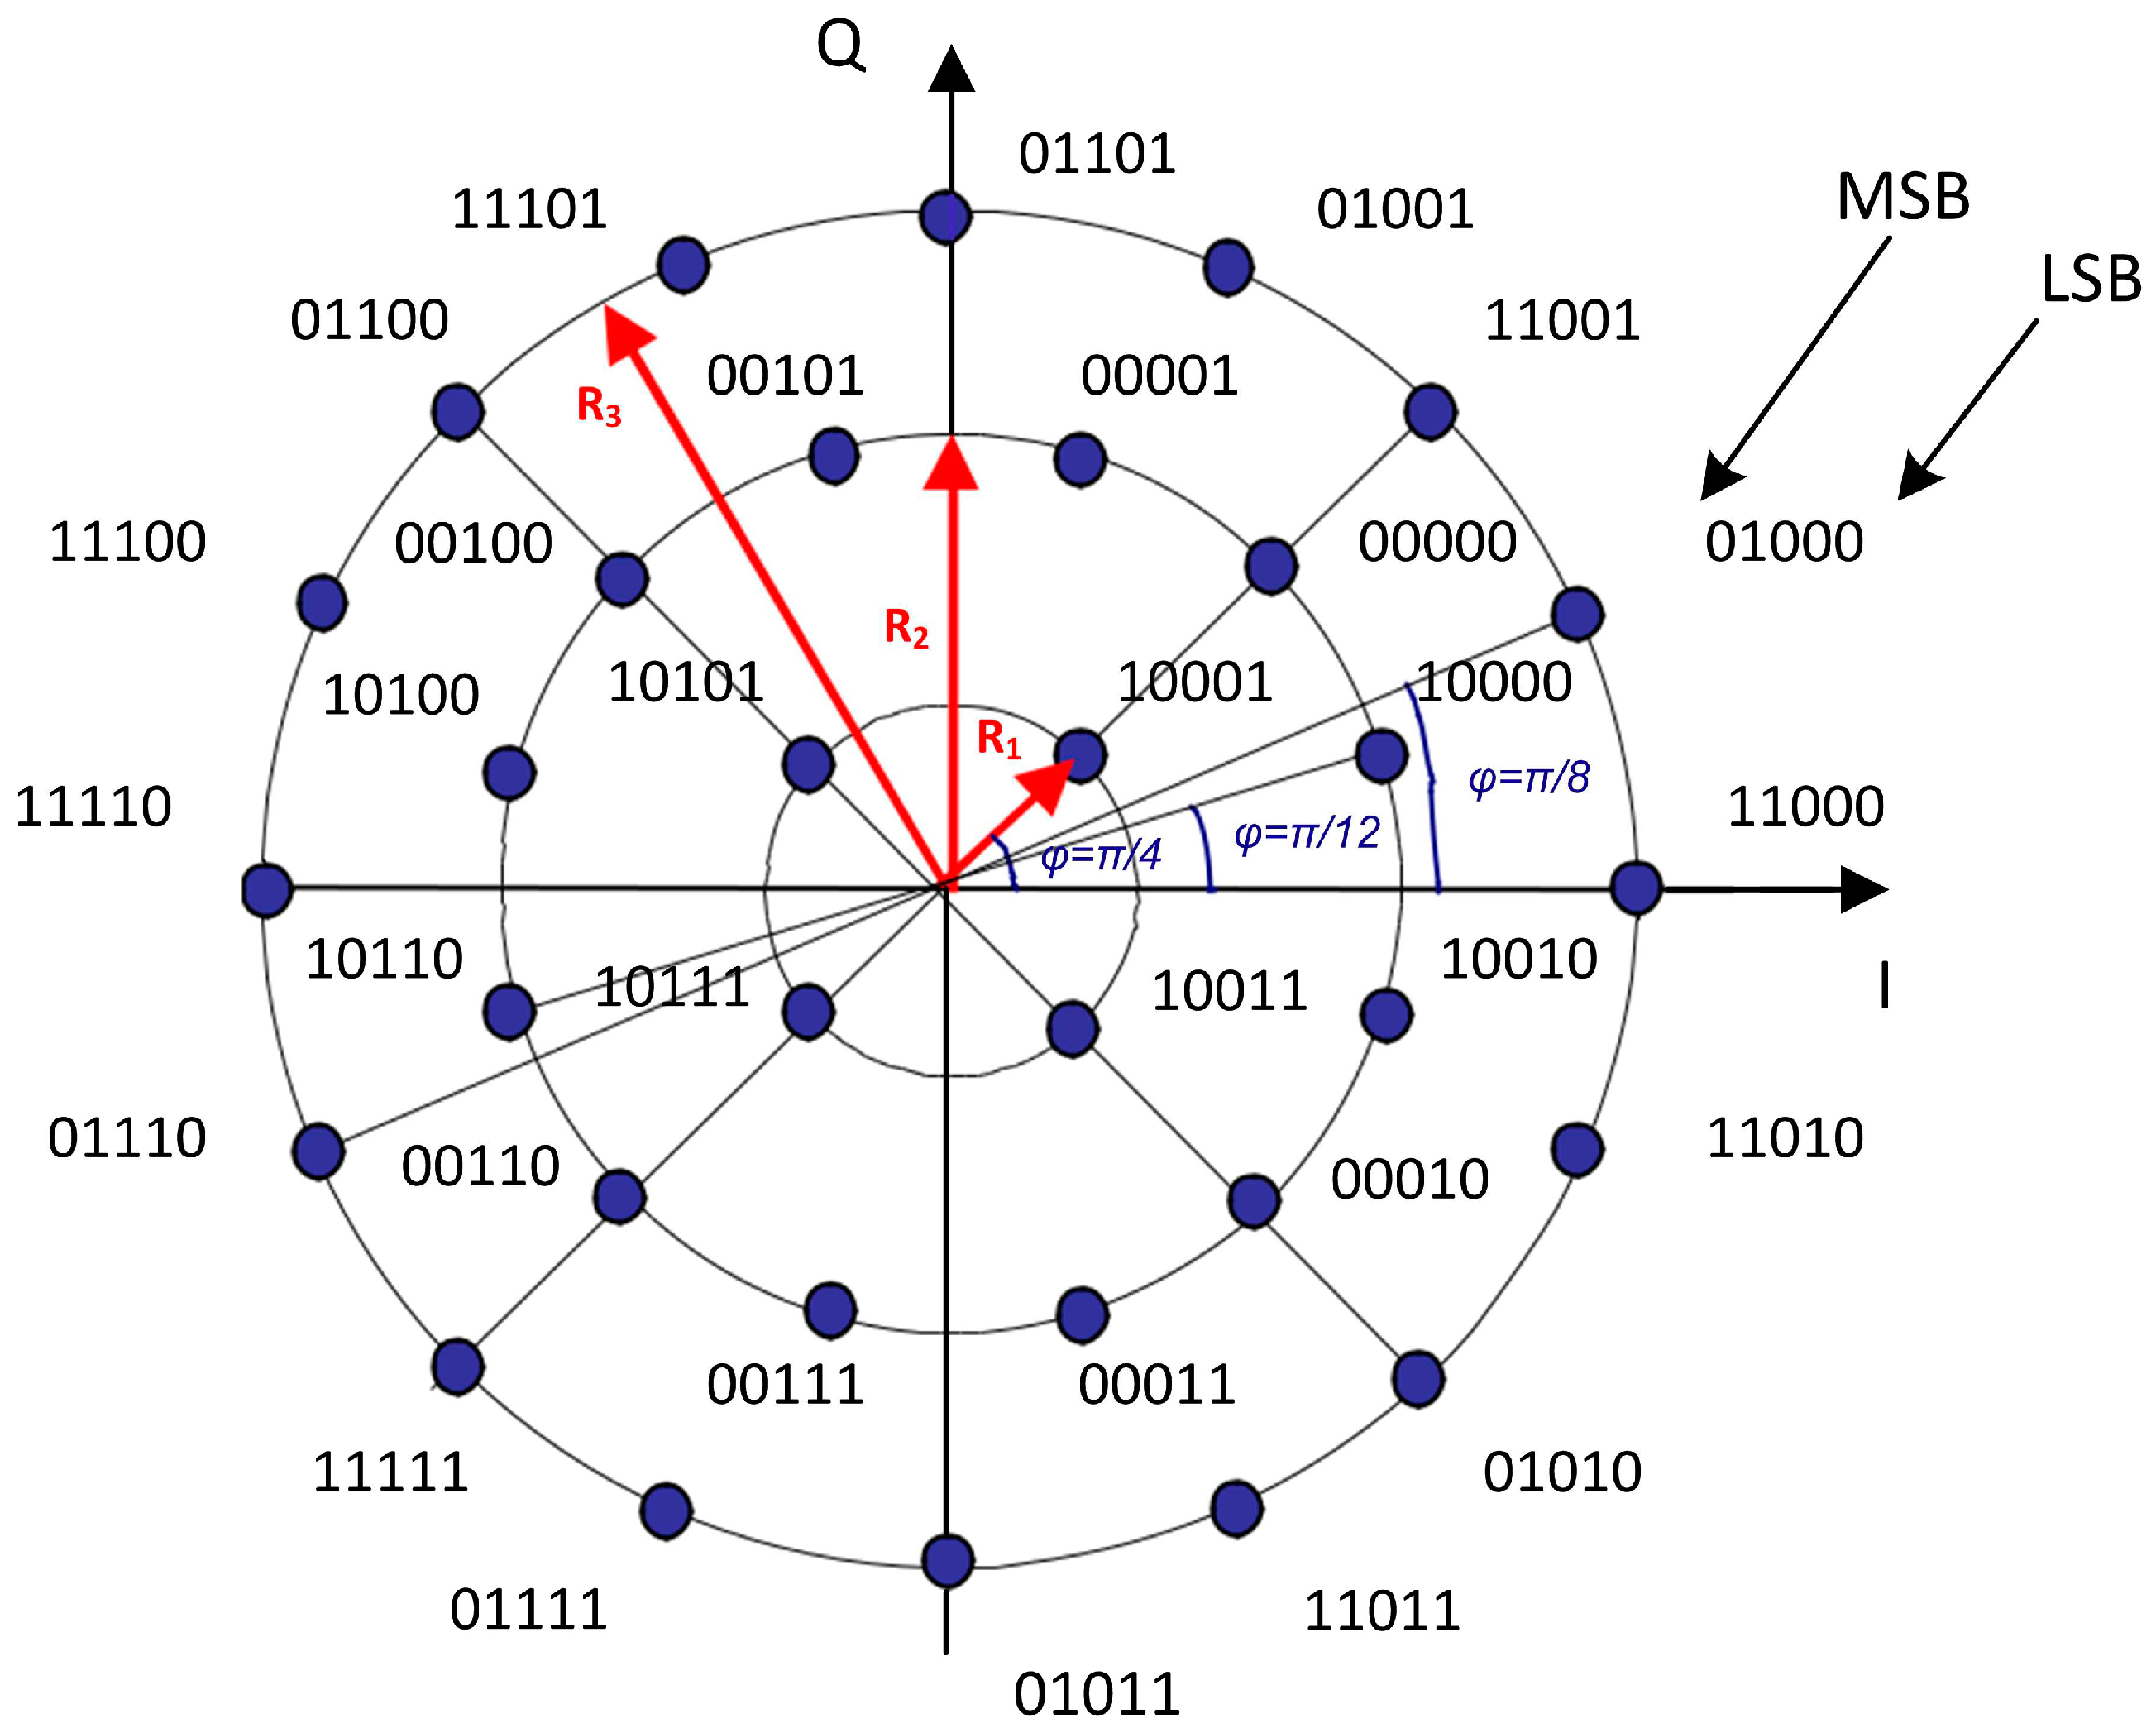
22] is based on LDPC codes combined with eight selected modulation formats (QPSK, 8PSK, 8APSK, 16APSK, 32APSK, 64APSK, 128APSK, and 256APSK) and a wide range of code rates (1/4 to 9/10), ranging in spectral efficiency from 0.49 bit/s/Hz to 5.84 bit/s/Hz. As an example, the DVB-S2X 32APSK constellation is shown in
Figure 3.
Thus, in the satellite context, the onboard computer receives the remote control to change the ACM mode parameters (MODCOD) from the Control and Tracking Centre through a continuous feedback link; the ground station reception system, ERG, performs real-time detection and monitoring of Eb/(I0+N0) [energy per bit to noise spectral power density, N0, plus I0 (interference power spectral density)], information that induce the onboard transmitter itself to make the necessary adaptations.
2.3. EESS Downlink Interfering Scenario
The X band is one of the frequency bands (8.025-8.400 GHz) regulated for satellite-to-ground data transmission applications in EESS [
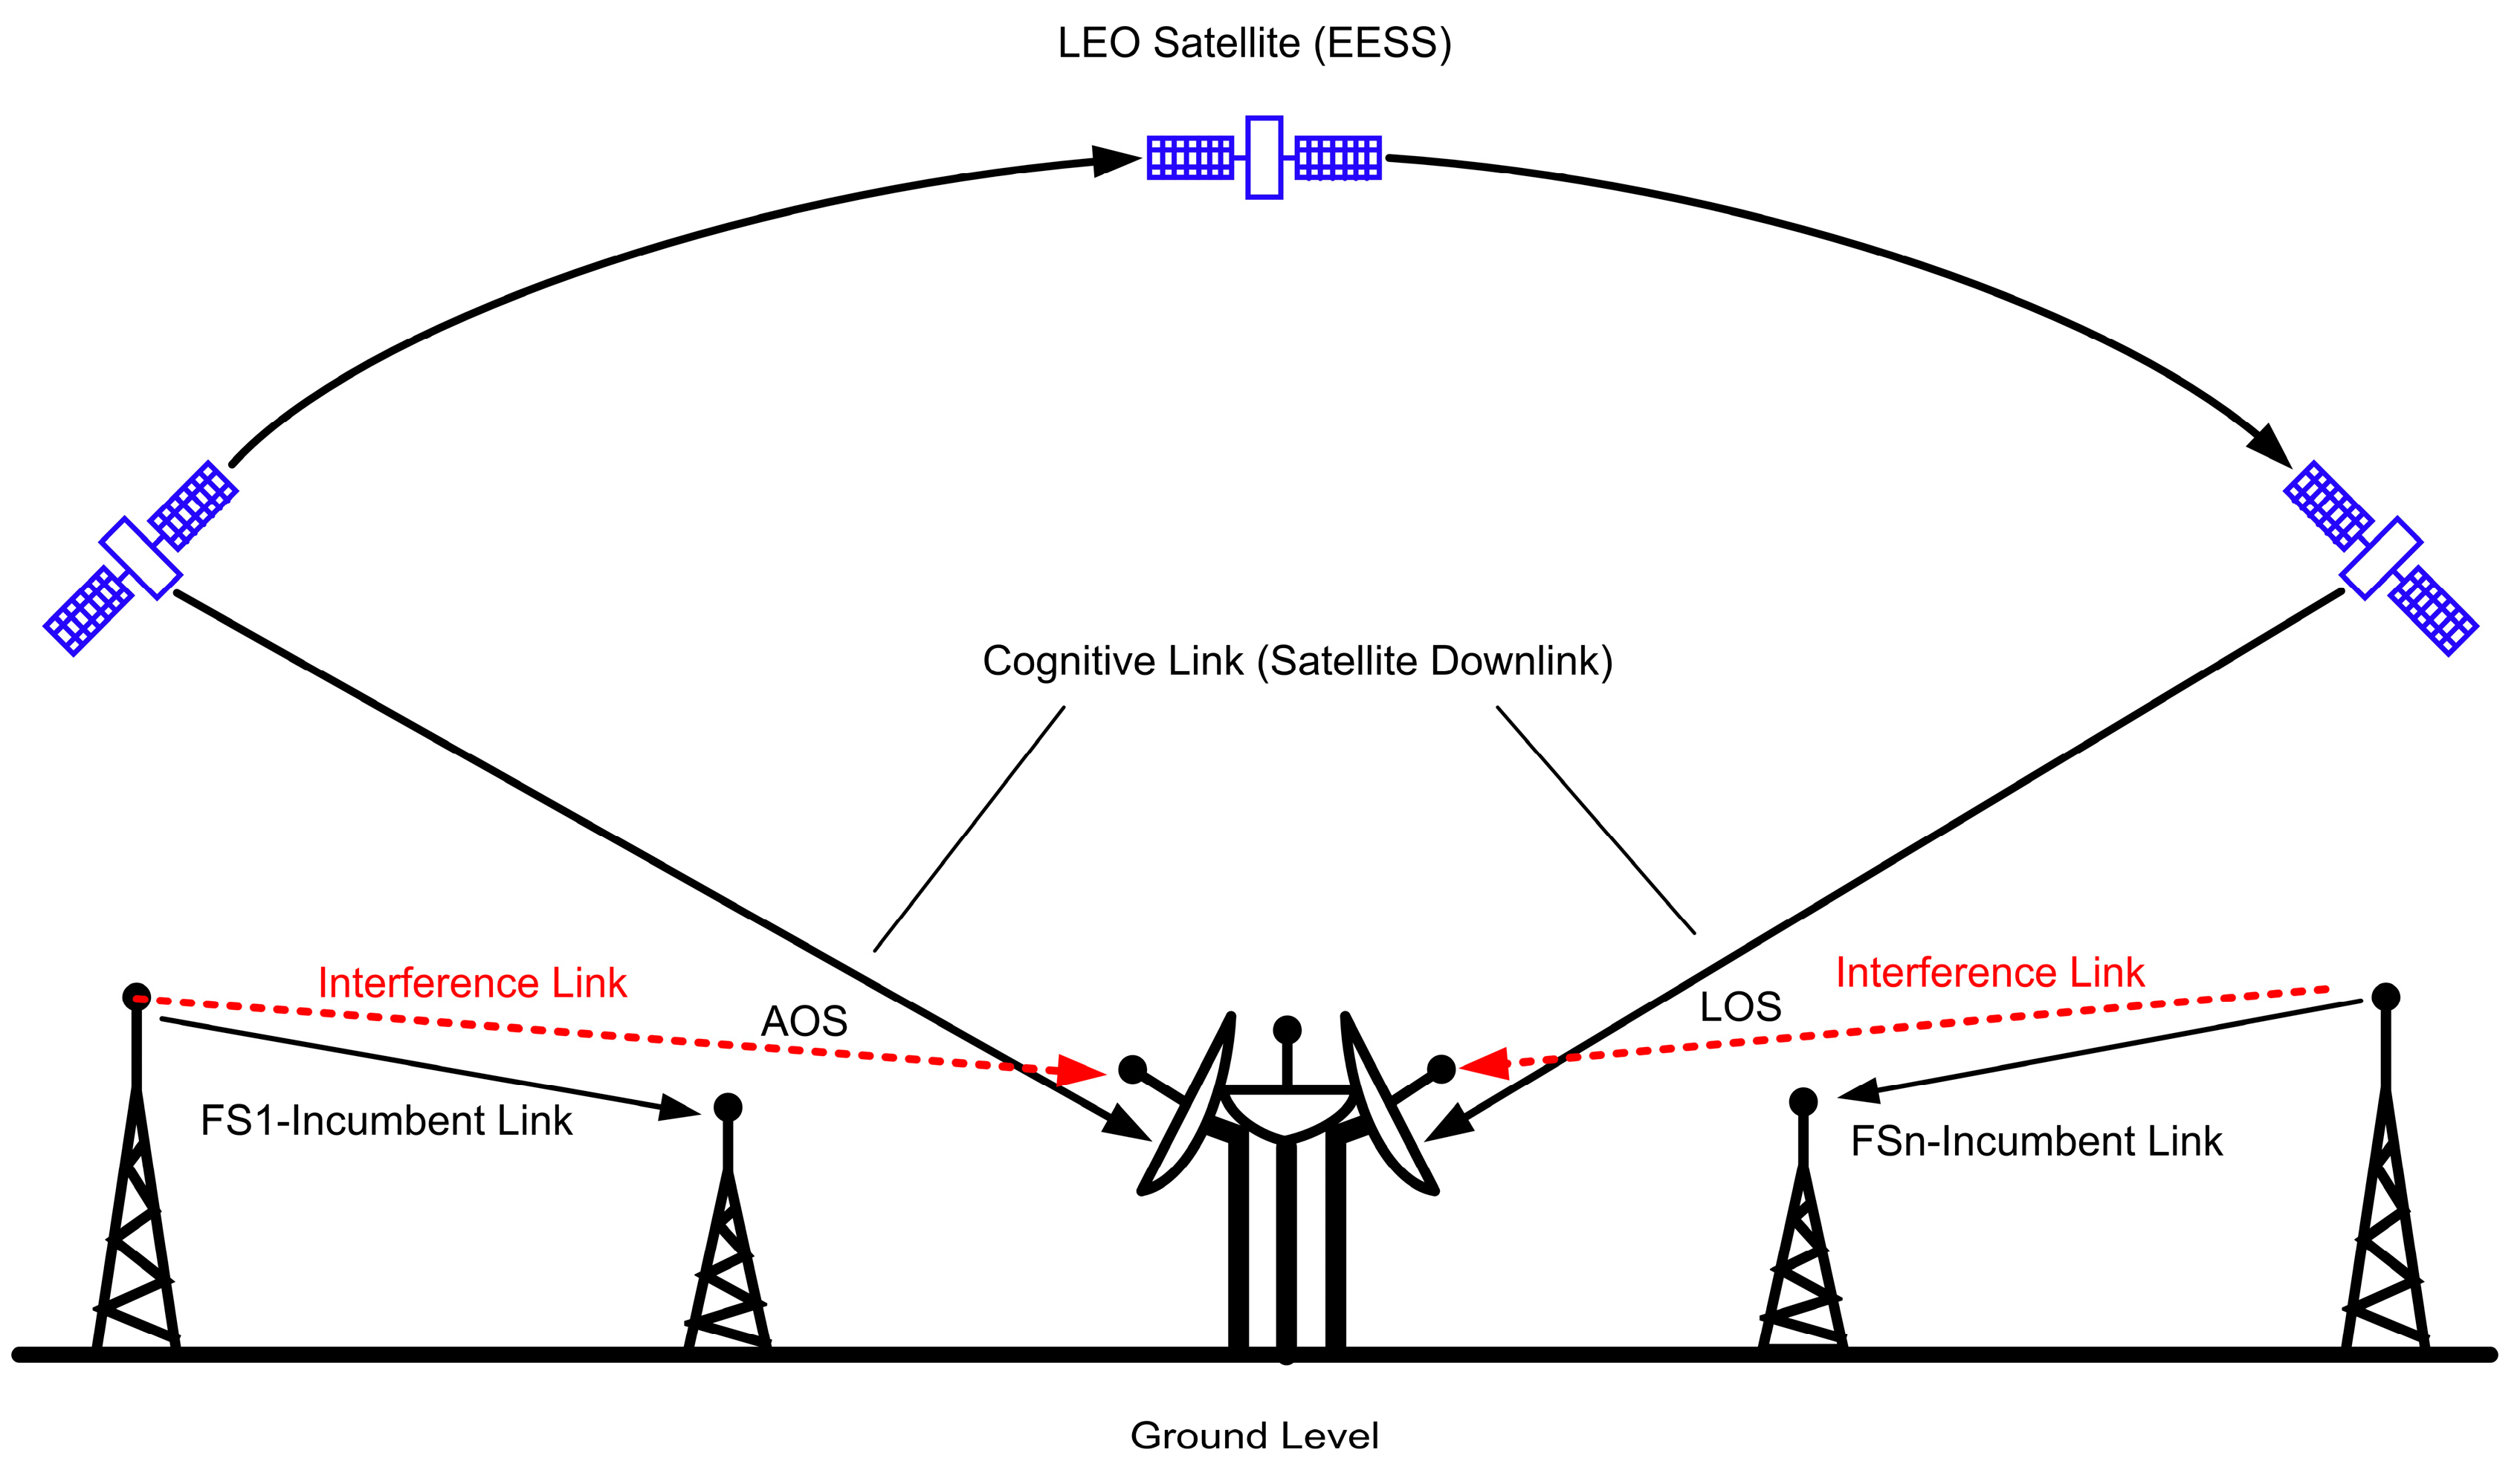
23]. Though, fixed service (FS) links that work within the same frequencies with beamwidth and maximum EIRP interfere at determined azimuth and elevation angles on the satellite receiving antenna.
Figure 4 illustrates the interference scenario with the satellite receiver system.
The ITU Report [
24] provides some recommendations for EESS downlink system evaluation. The emission limit should not exceed the specified values, according to
Table 1, and additional issues can be found in the Standard of CCSDS, 2021 [
25].
Particularizing to our context, the EESS mission of the CBERS-4 (China-Brazil Earth Resources Satellite-4) satellite, launched in 2014, contains four cameras: PAN5/10, IRS, MUX, and WFI. The function of the Wide Field Imager (WFI), with a resolution of 64 m and a coverage range (swath) of 866 km, is to monitor the Amazon rainforest.
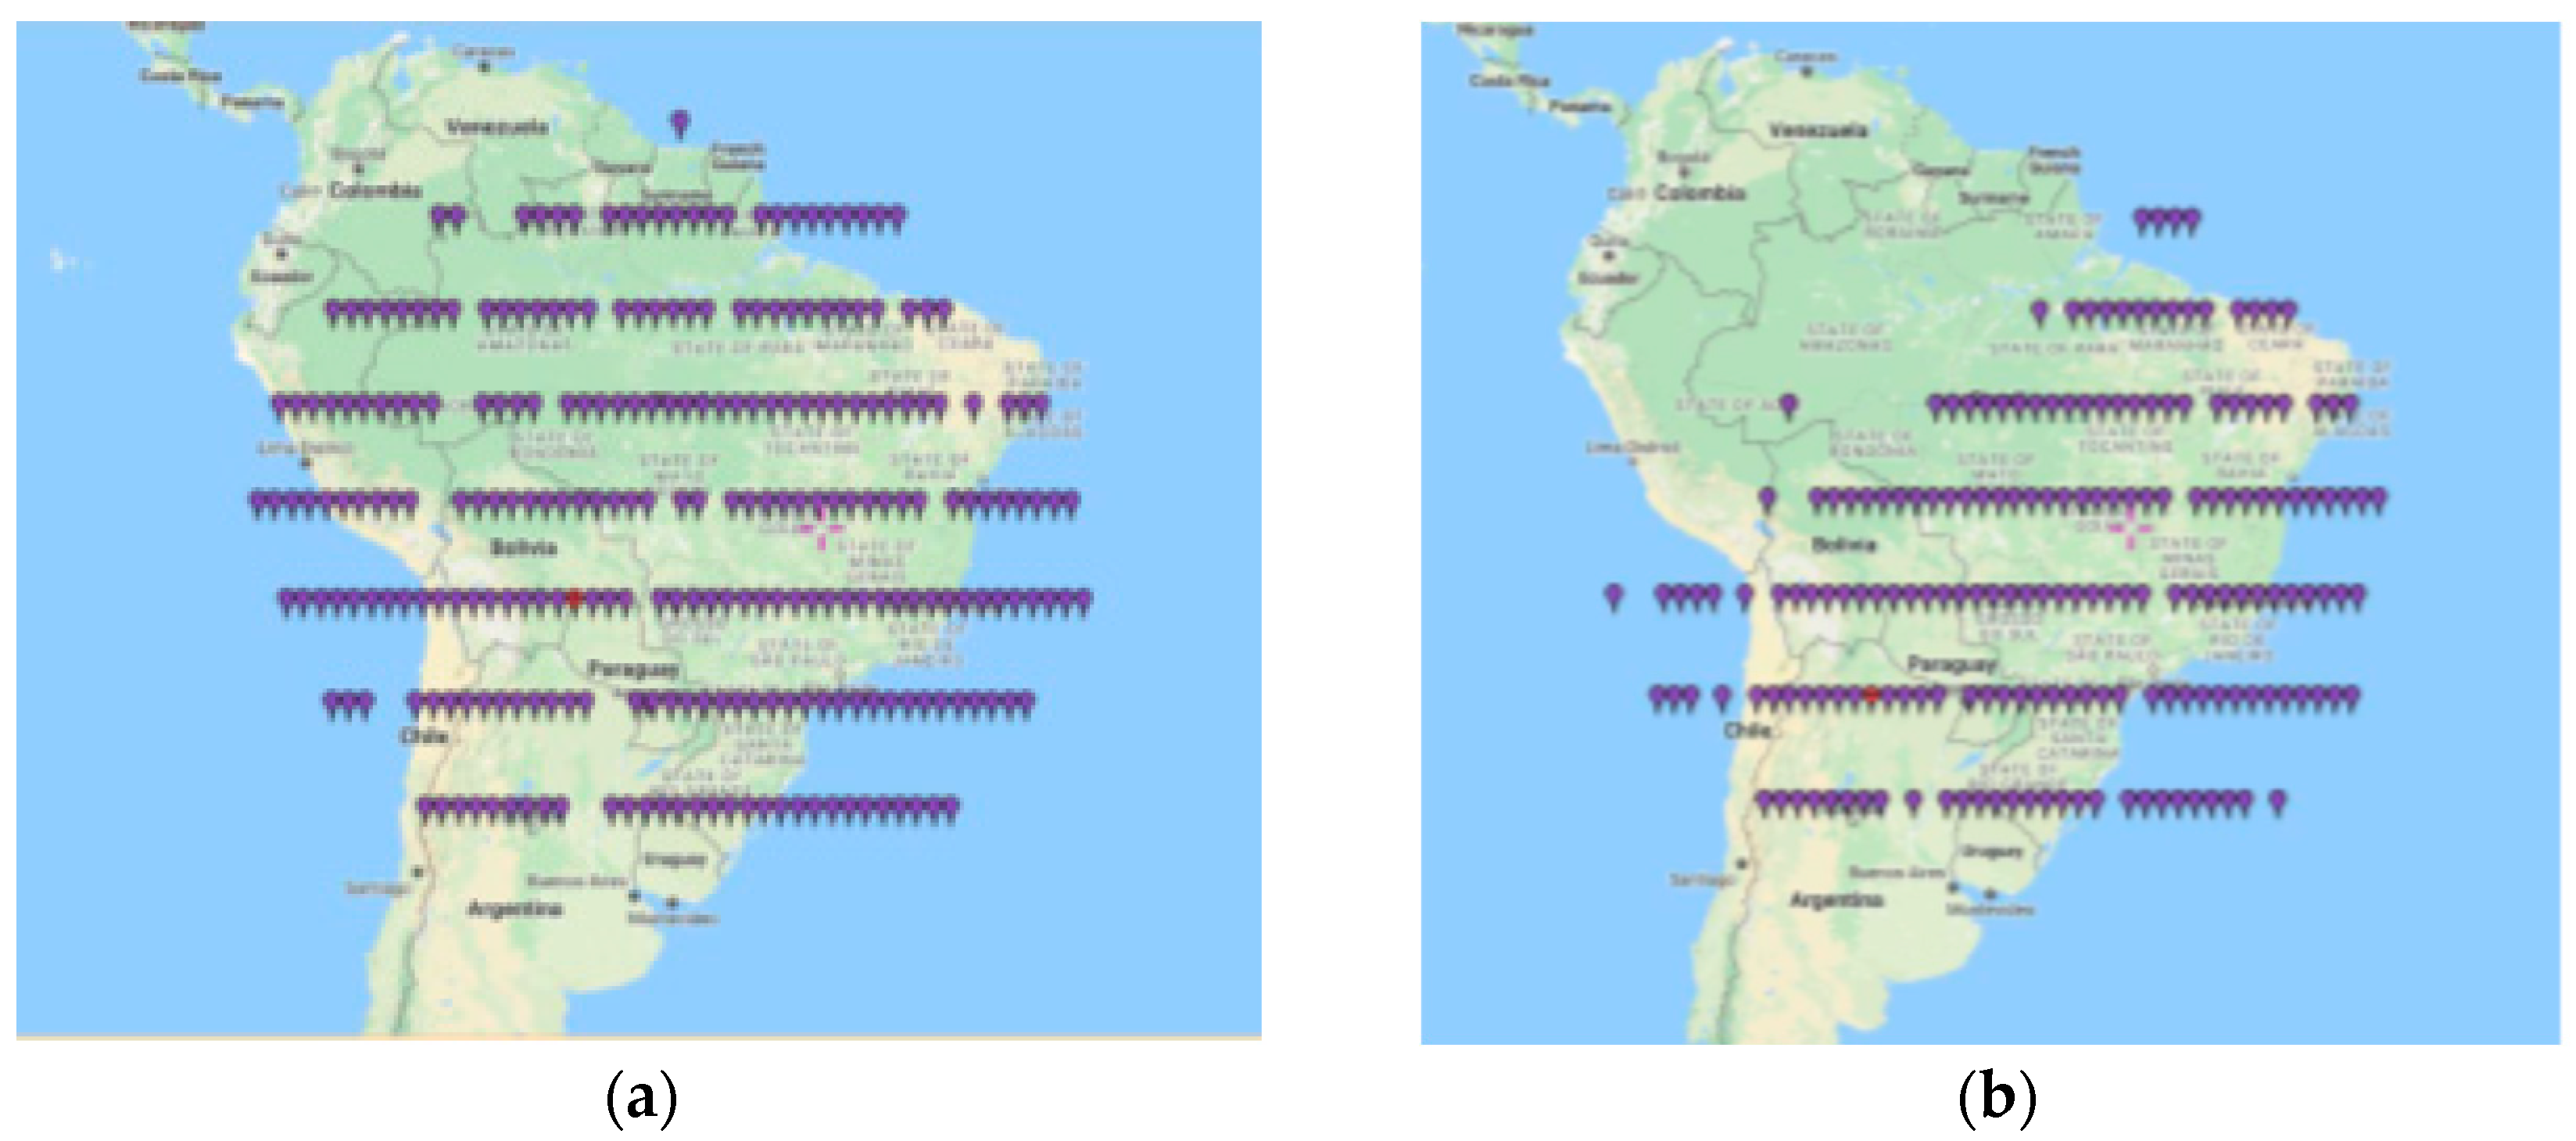
Figure 5 shows a frame (set of scenes) from the CBERS-4 (C-4) WFI image catalog covering twenty-six consecutive days. To examine how interference disrupts the WFI satellite images, we observe how the INPE image catalog is affected. In
Figure 5-a, we can see that the ideal framing of the image forms an almost perfect circular contour.
In
Figure 5-b, we can observe the harmful effects on the set of images with the lack of points (coverage) in certain locations in Brazil or South America, regions in northwest azimuths. This occurs due to the existence of an FS link in that geographic angular region.
2.4. Application Method
The solution combines CR approach in the underlay paradigm and MODCOD techniques (in ACM) mitigating EOS image reception losses due to interference.
Calculation steps were developed in the cognitive paradigm for the operability of the exploitation technique. The following spectrum exploitation dimensions were considered: i) power P; ii) frequency fc; iii) modulation MOD; iv) coding COD; and vi) bandwidth BW. The objective is to enable the satellite transmitter with the function of protecting the receiver by improving the SINR (Signal to Interference plus Noise Ratio).
Through link budget simulations for distinct standardized DVB-S2X – MODCOD configurations, we performed the troubleshooting strategy applied to spectral coexistence and data throughput maximization by adapting the MODCOD functionality. The variation of m bits per symbol in APSK modulations combined with appropriate code rates produces the bandwidth values as a function of both symbol rate and the required SINR.
Considering that the specified BER is a function of SINR for each MODCOD adapted during each satellite pass over the ground station in the presence of interfering signals, the MODCOD selection depends on INR, which directly results from the measurement of Eb/(I0+N0) performed by the receiving system.
This adaptive technique is employed in the transmission channel of the WFI camera on the CBERS-4 and AMAZONIA-1 (AMZ-1) satellites, with a bit rate of 51.28 Mbps. Thus, the established MODCODs and their properties: designations, identifications (
ID), spectral efficiencies (
ηtot), the relationship between
Eb/N0 and
ES/N0, and the effective bandwidth of the modulated carrier are shown in
Table 2. For example, based on this
Table 2, we can evaluate that for the MODCOD scheme QPSK 3/5 (
ID = 8), the required
Eb/N0 for the specified BER (10
-7) has a low value of
Eb/N0 = 1.480 dB, which increases the link margin and allows for operating with higher INR values.
On the other hand, considering the 32APSK 8/9 scheme (ID = 1), the required Eb/N0 = 9.258 dB (high value), the INR must be low to allow for this operating scheme.
In this way, by combining the results of link parameters with the MODCODs from
Table 2,
Table 3 presents the resulting MODCODs to be implemented in the ACM mode, considering the proper communication system of the CBERS-4 satellite's WFI camera (EESS/FS coexistence). Regarding this, we maintained the specified link margin at 3 dB [
26]. As a result, we obtain the maximum INR that each scheme supports.
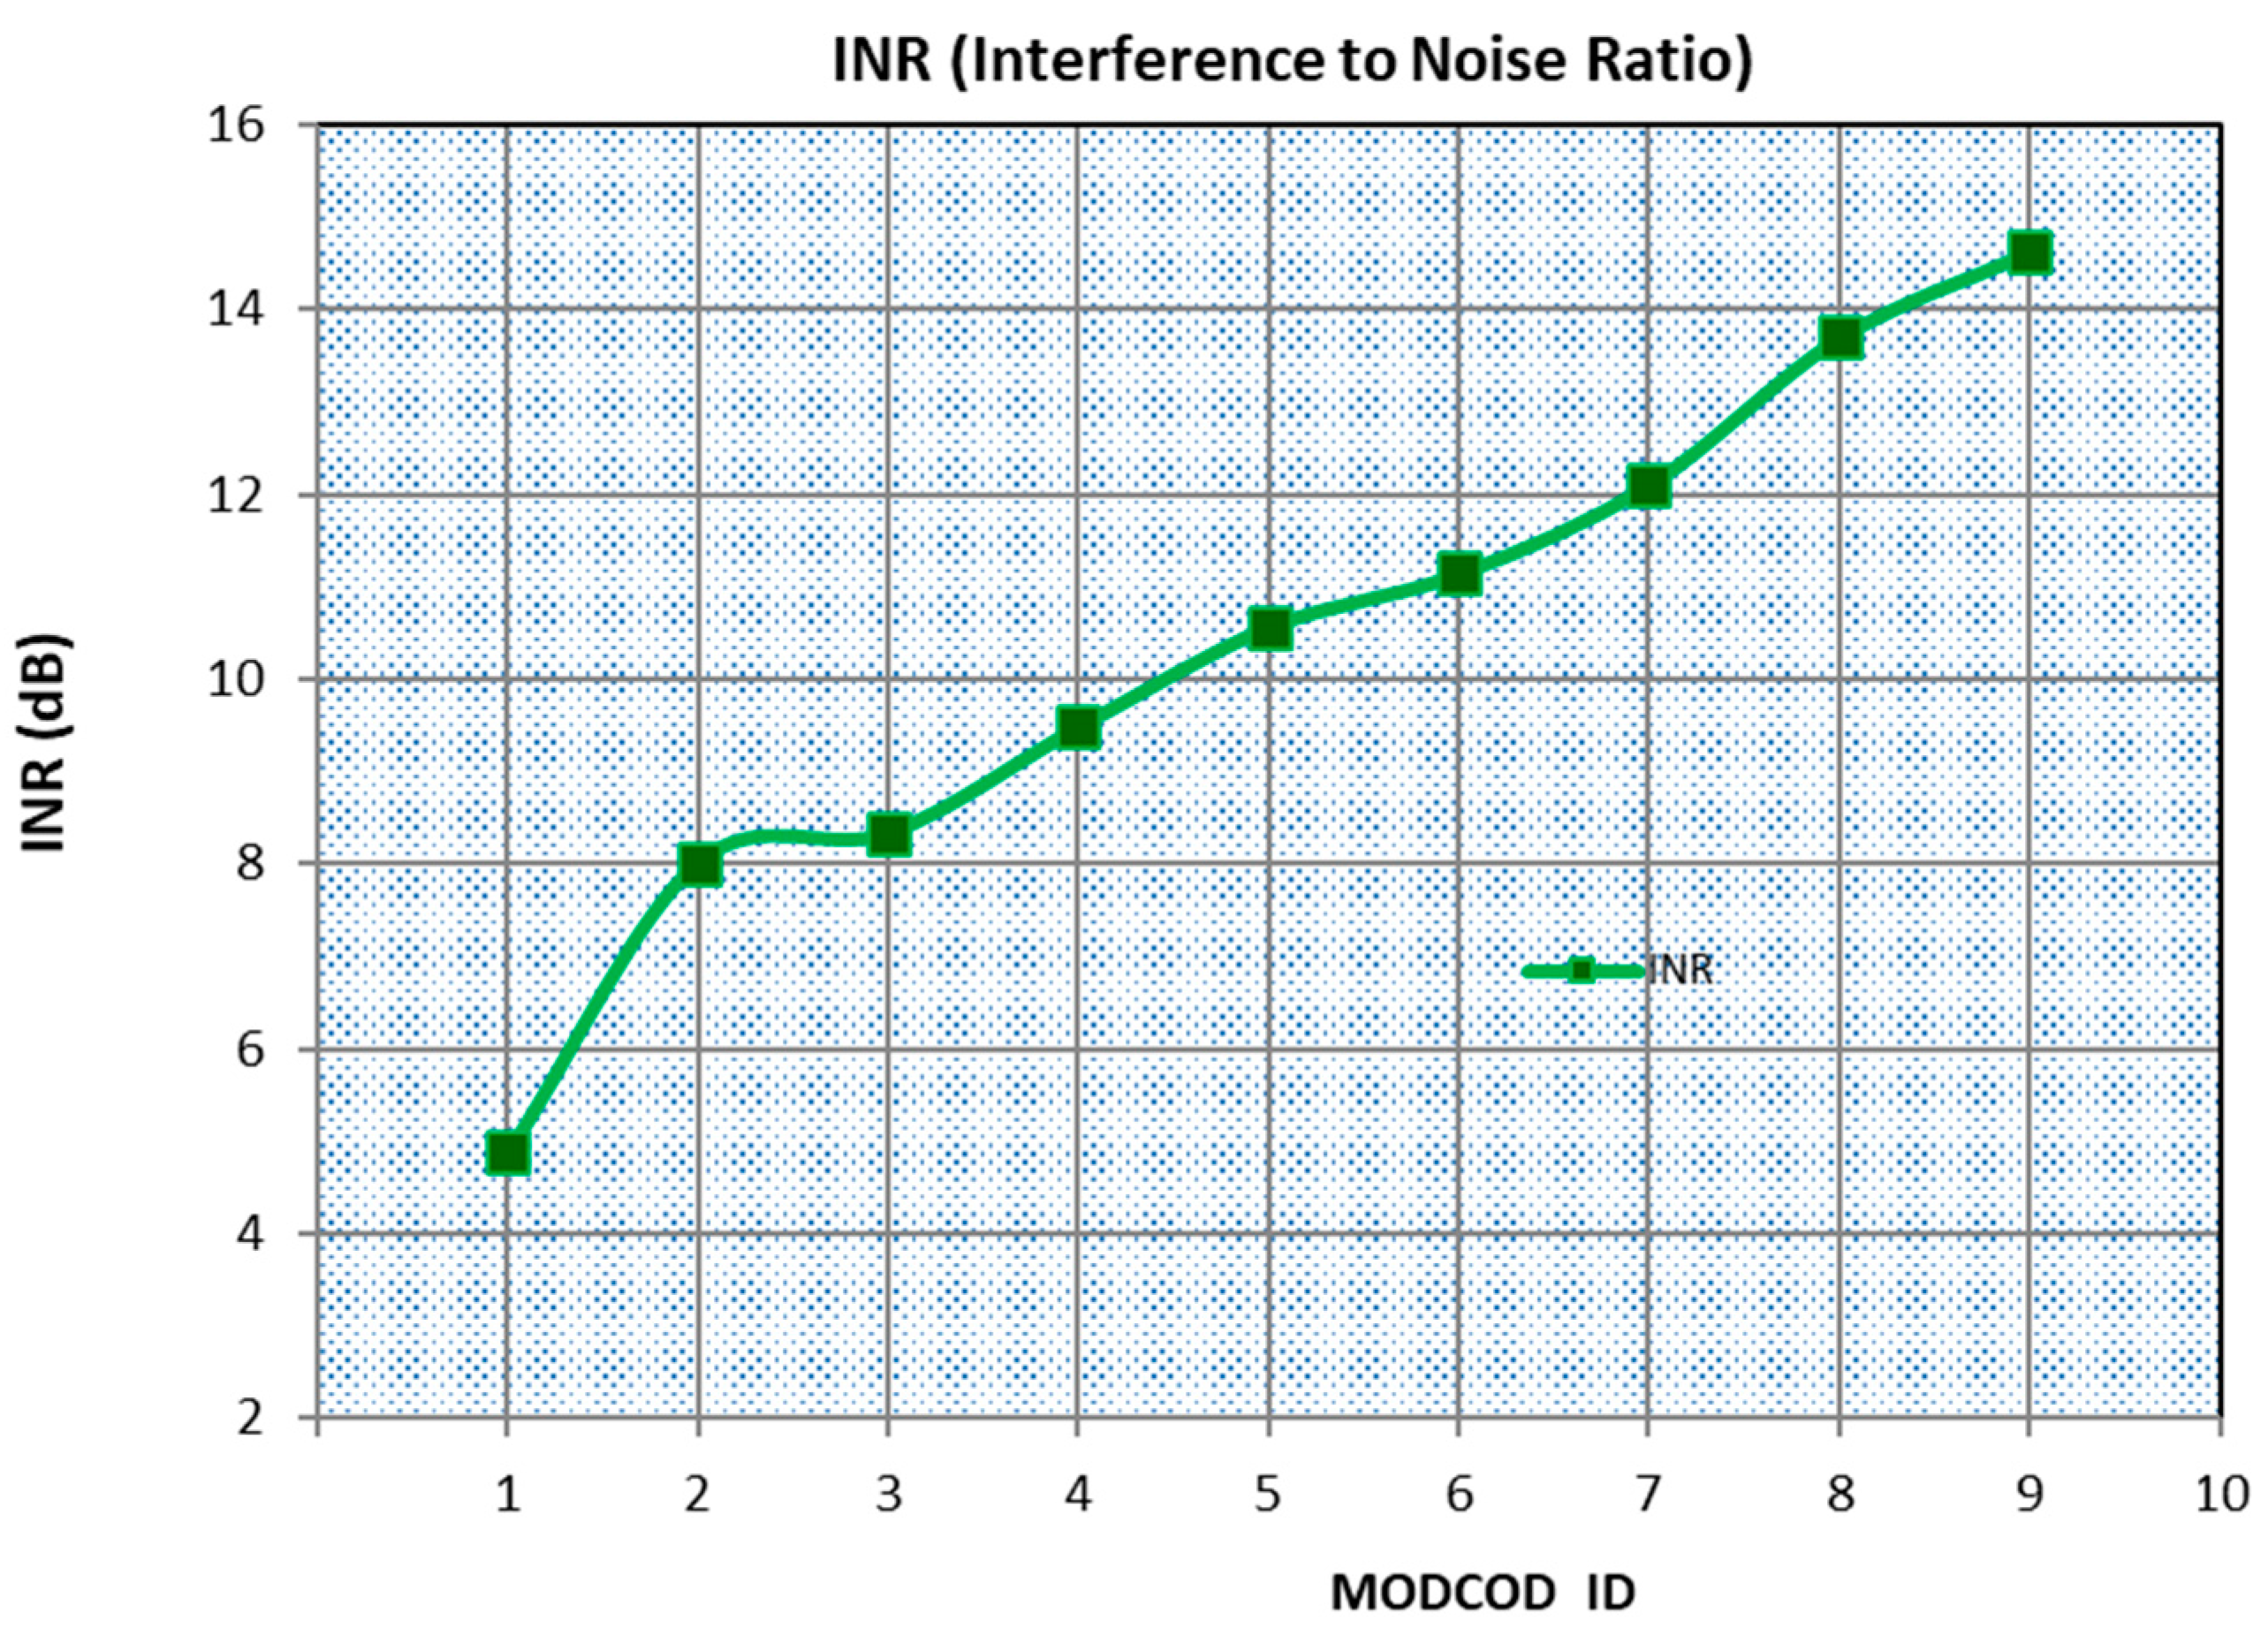
In
Figure 6, the results of
Table 3 are graphically represented. We can see that as the interference power increases, the INR also increases, and the system should automatically select the appropriate MODCOD to support the current INR value while maintaining a constant bit rate transmission.
In
Figure 6, the results of
Table 3 are graphically represented. We can see that as the interference power increases, the INR also increases, and the system should automatically select the appropriate MODCOD to support the current INR value while maintaining a constant bit rate transmission.
3. Results
Case studies – based on the previous results, this section quantifies the throughput for different assumptions. Firstly, we define the baseline case, considered as nominal satellite operations, i.e., the maximum channel rate transmitted in the X band with fixed QPSK modulation without channel coding, as implemented on the CBERS-4 satellite.
3.1. Throughput for Fixed Modulation - Without Interference
In this case, the available bandwidth of 51.28 MHz for the WFI camera is limited to 51.28 Mbps. Note that the throughput (
Thr) depends on the duration of the satellite pass in visibility with the ERG. By considering an average time of approximately 12 minutes [
27], we have:
(which represents the minimum throughput for WFI transmission).
3.2. Throughput for Fixed Modulation - With Interference
Implementing the same fixed QPSK modulation without channel coding in a hypothetical interference scenario, where the INR couples with the elevation angle of the receiving antenna, we obtain the following results presented in
Table 4.
Note that the throughput is below the minimum for failureless image transmission (36.922 Gbits). In this case, we would observe failures in image processing.
3.3. Throughput Using MODCOD in Adapted ACM Mode
Subsequently, we analyze the effectiveness of our proposed strategy in
Table 5, varying the ACM according to the INR, in a satellite pass.
Thus, we observe that the throughput (82.878 Gbits) is higher than the minimum for WFI image transmission (computed as 36.922 Gbits). In this case, we would not expect failures in image processing.
3.4. Tests in Cuiabá/Real Scenario
Expanding on the previous results, as a key contribution of the article, we apply our design strategy in an experimental scenario, considering field measurements recently conducted at the Cuiabá site in December 2022.
The ERG facility in the city of Cuiabá, Brazil, receives TM signals during the passage of C-4 satellite, transmitting the TM image from the satellite's payload cameras in real time.
We performed interference characterization by measuring the power of the interfering signal at the ERG receiving antenna as a function of the antenna azimuth and elevation angles and comparing this interference with the desired signal power levels received from the satellite. This makes it feasible to acquire the carrier-to-interference ratio (C/I) and the interference-to-noise ratio (INR) necessary for executing the suggested strategy.
For our testing procedure, we operated with a high-performance ERG reception system, consisting of an 11.28 m diameter antenna.
Figure 7 summarizes the implemented configuration. This reception system assumes a G/T performance of 35.5 dB.
Our proposed strategy (discussed in
2.4.) can be applied based on the interference measured at the location.
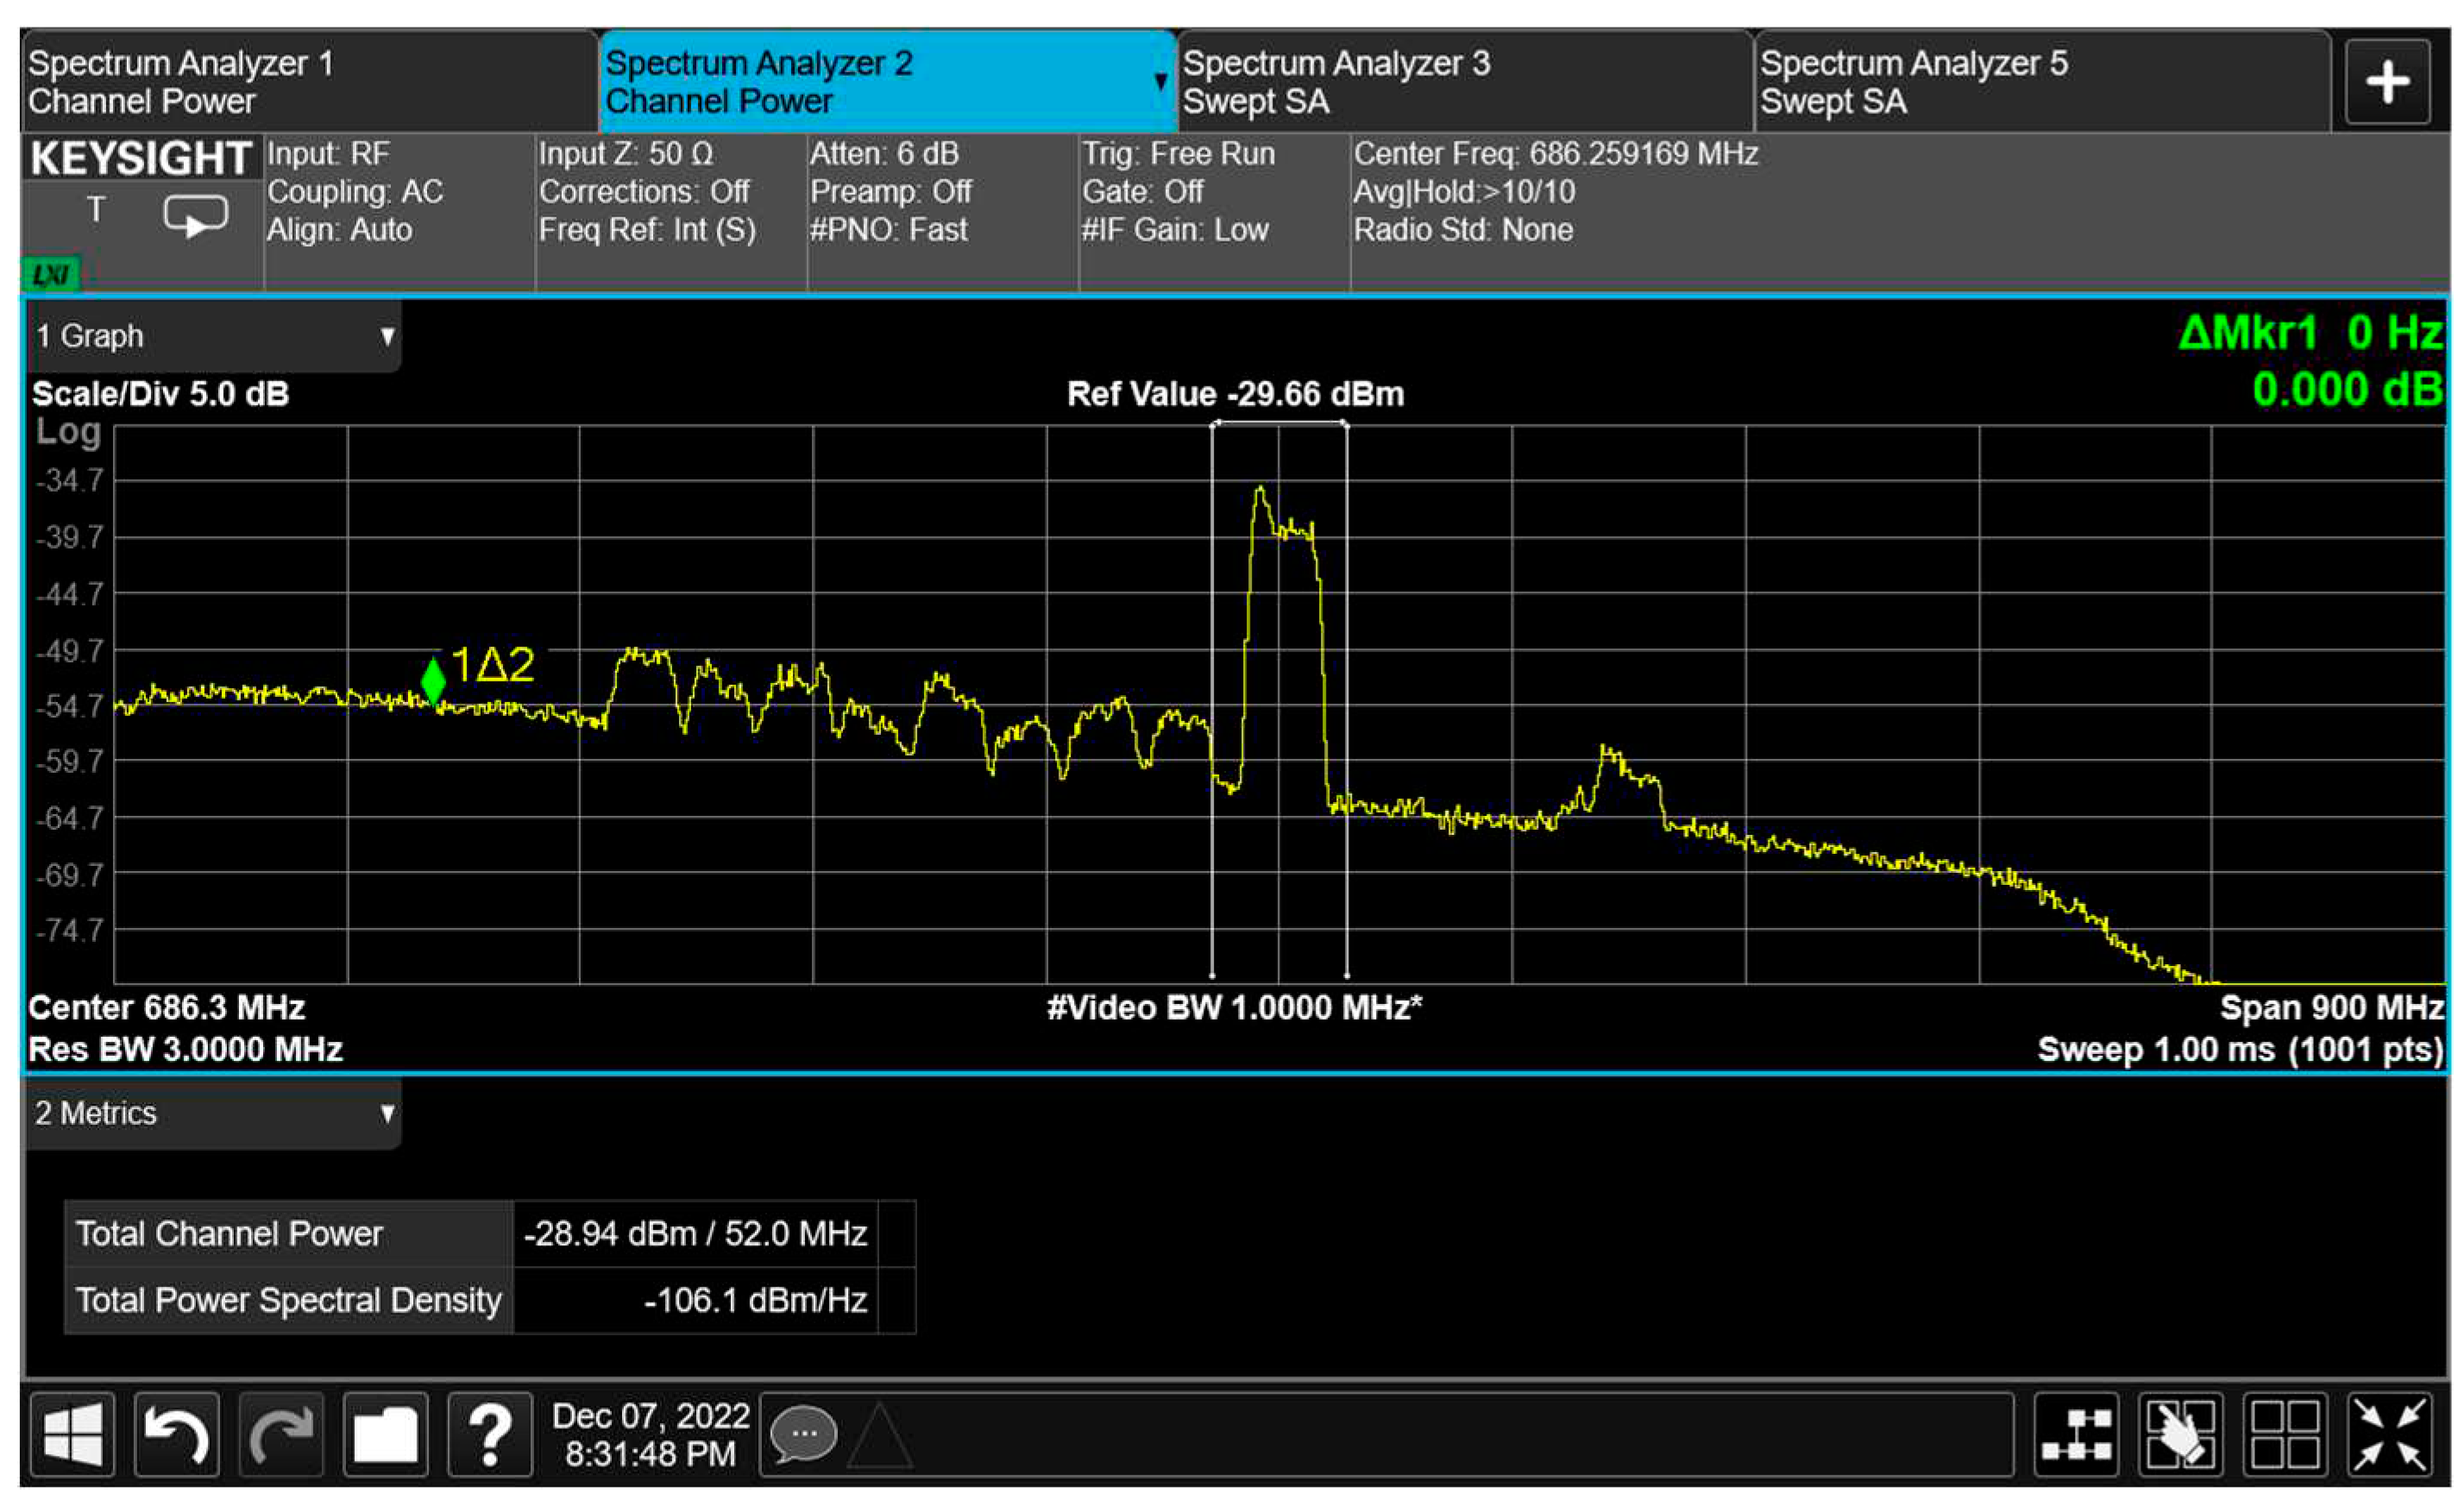
Figure 8 presents the power spectrum of the FS interference signal at the central frequency (
fc) of 8308 MHz @ BW = 37 MHz. It is worth noting that the interference is located in the operational bandwidth of WFI C-4,
fc = 8290 MHz @ BW = 51.28 MHz. Furthermore, we can observe adjacent FS channels interfering in this spectrum band.
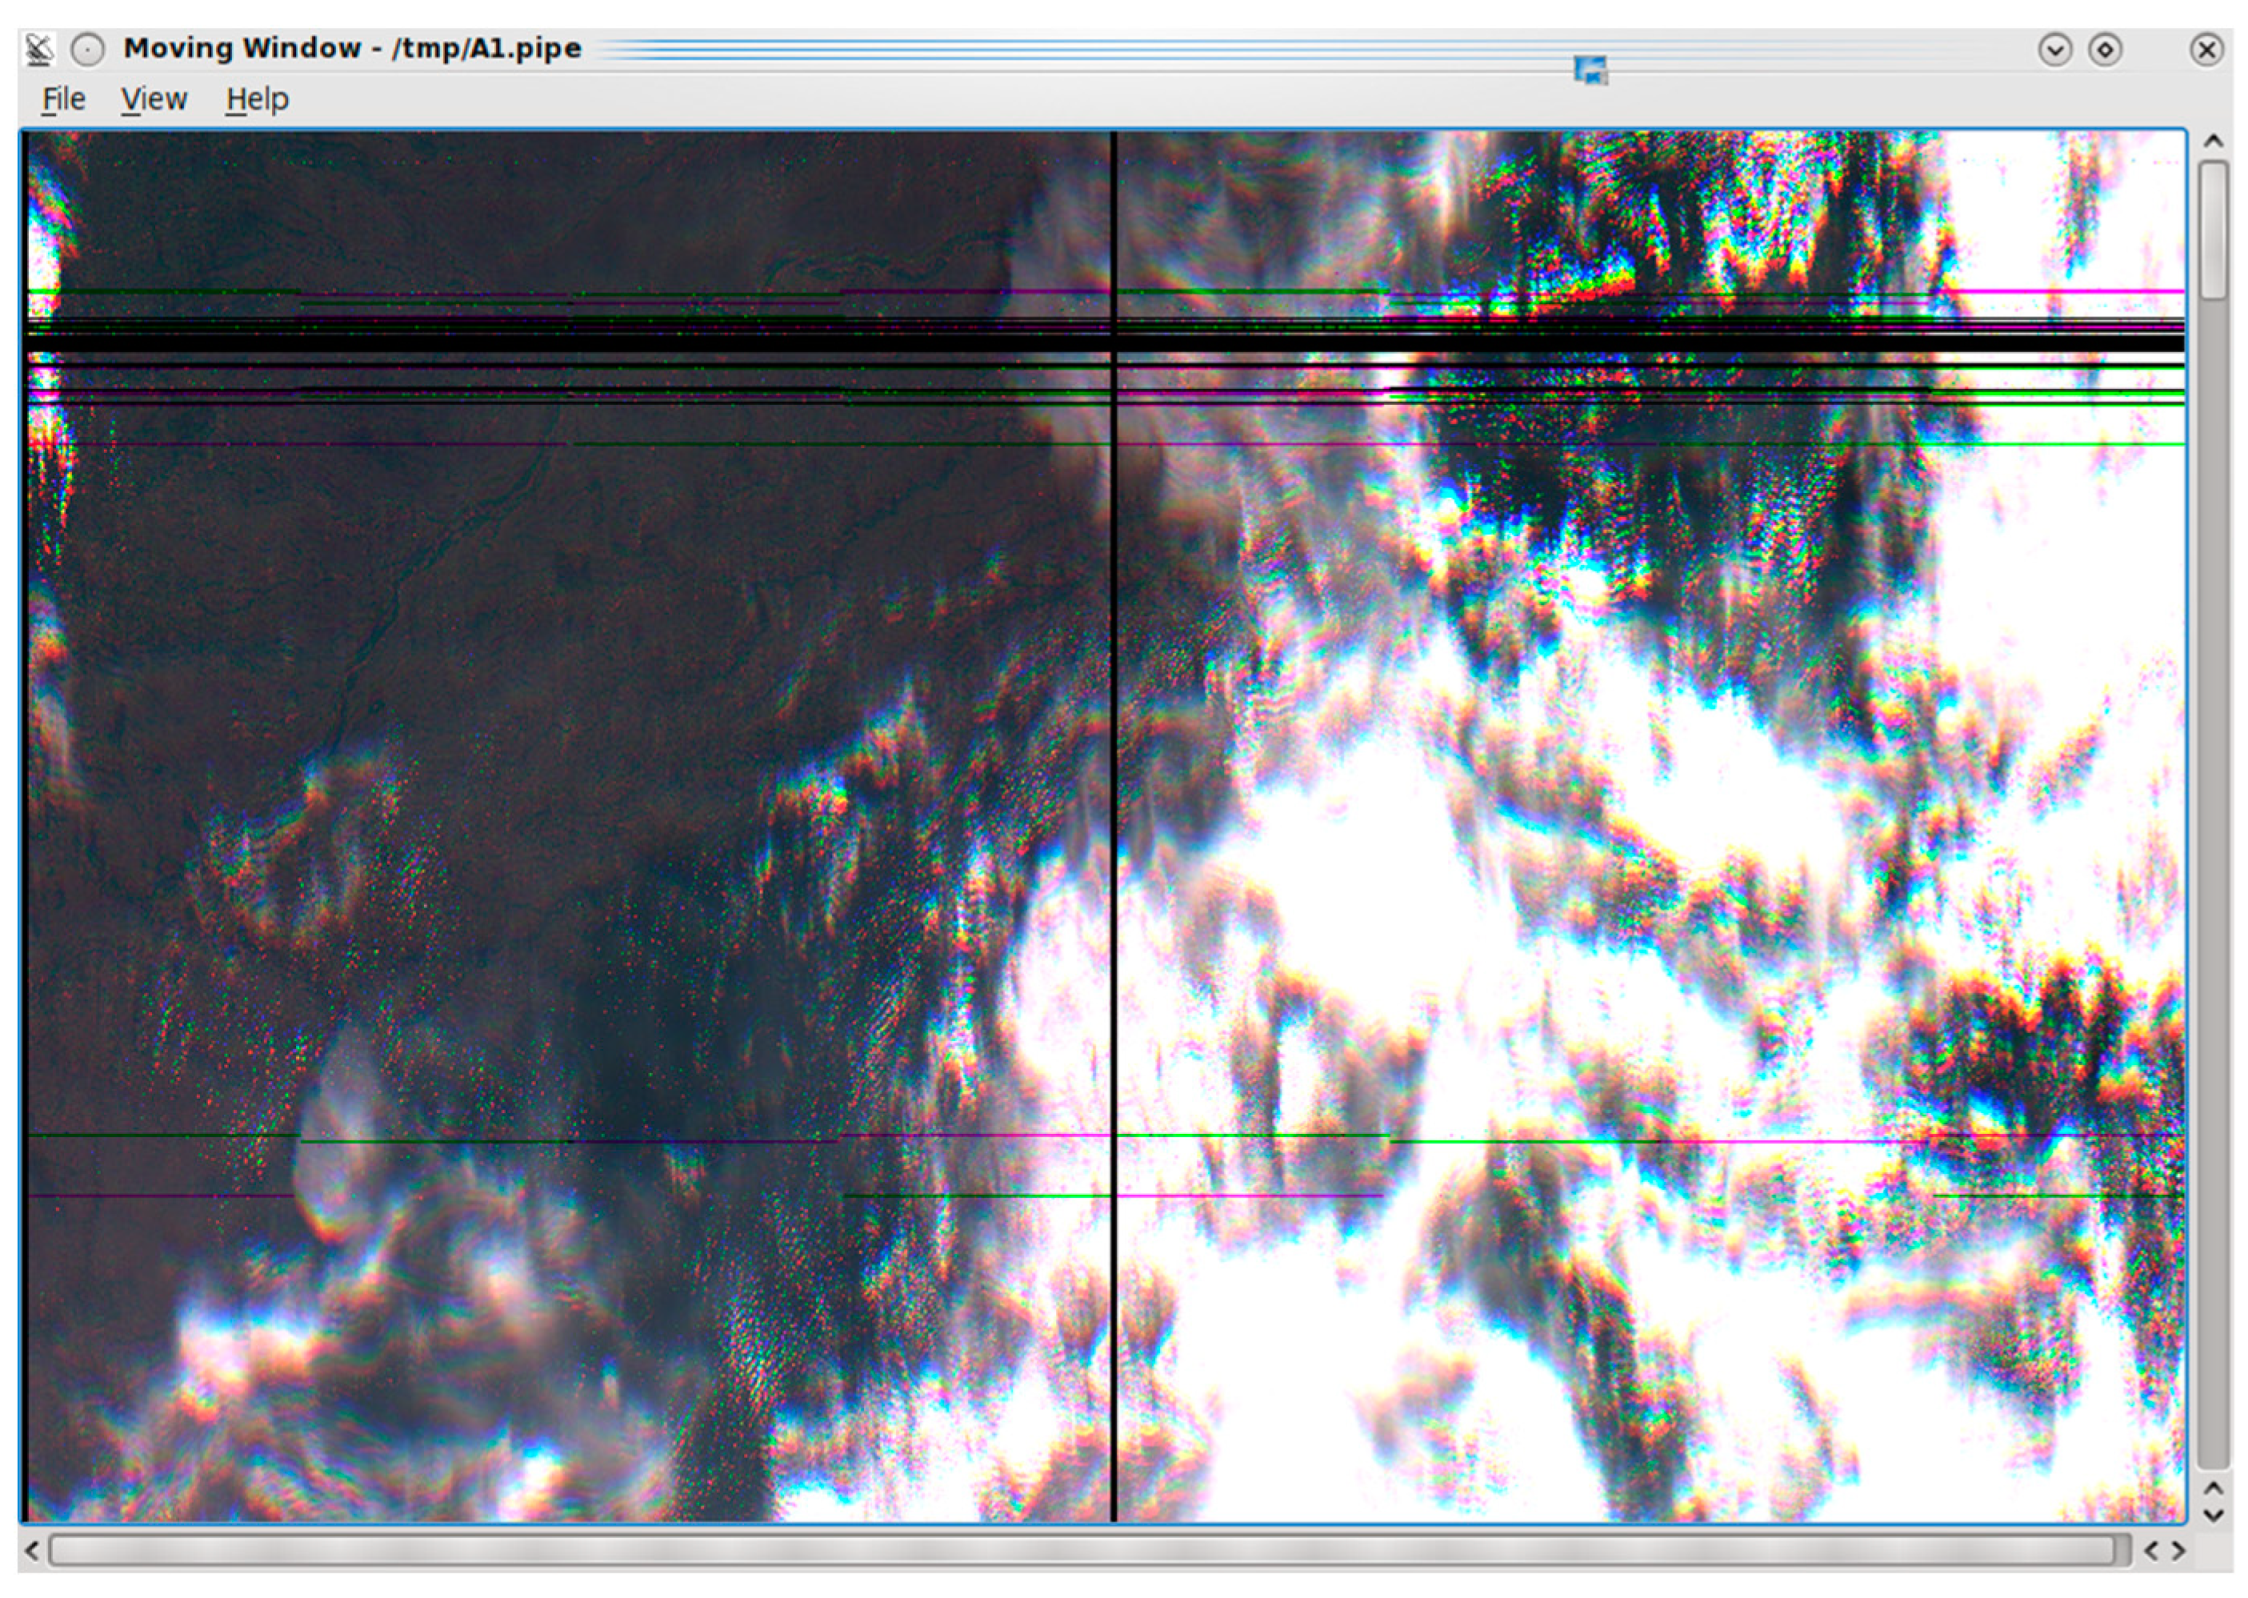
The harmful interference effect can be observed in the several black stripes on the moving-window image of a given satellite passage, presented in
Figure 9.
The maximum tracked interference that generates these failures on the WFI images arises at
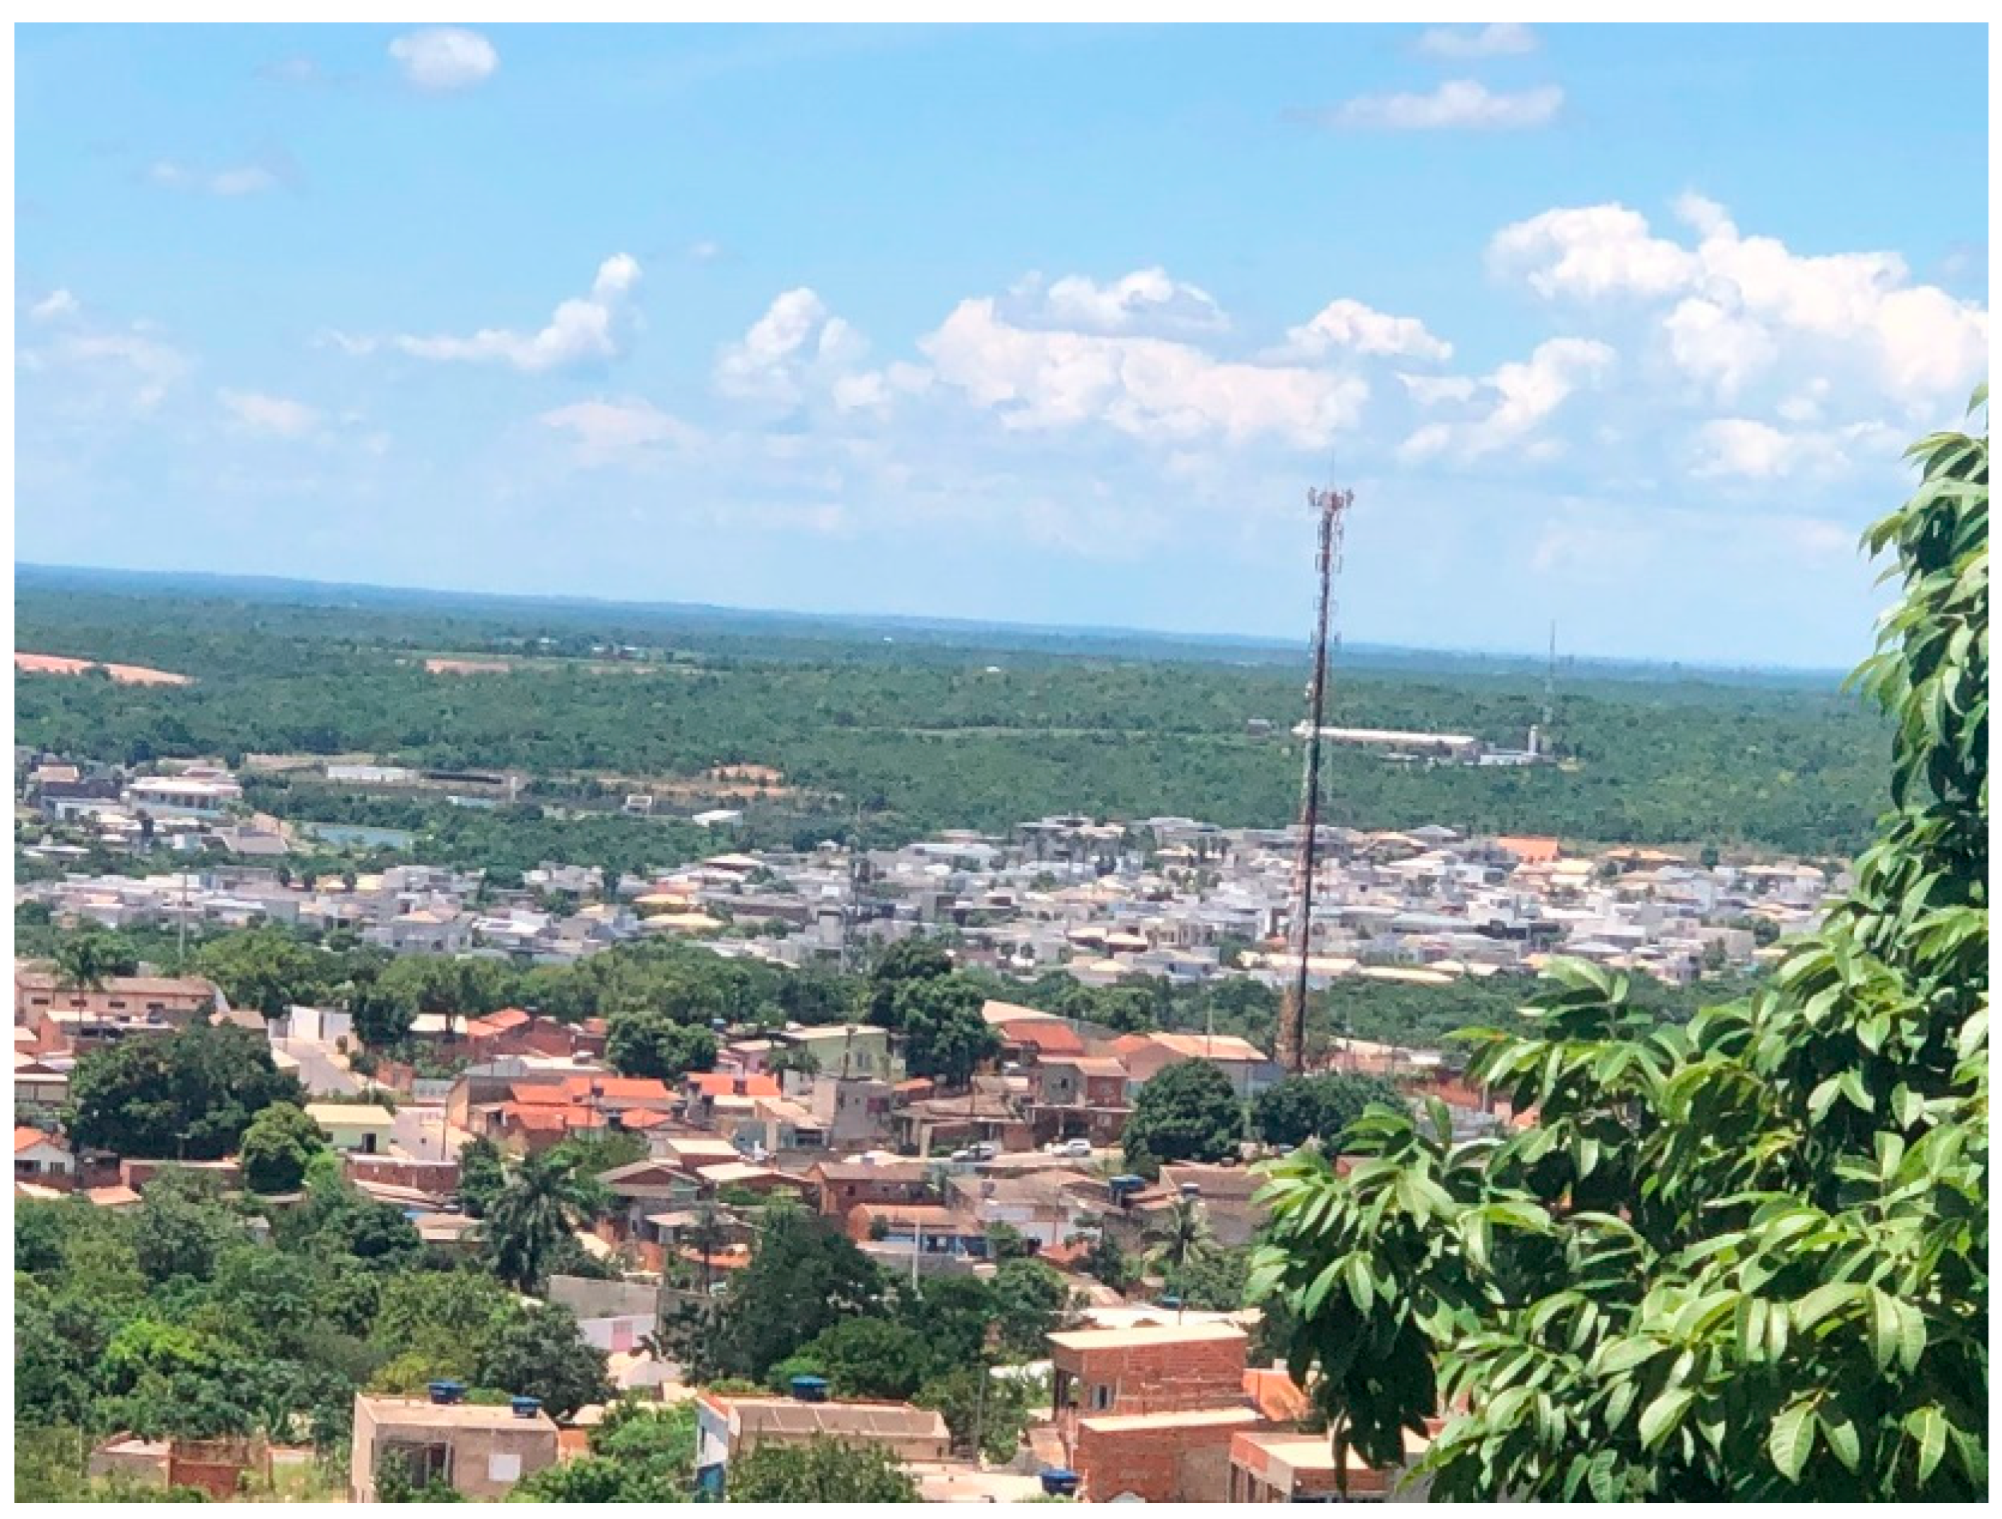
Az = 333.5°. Through further investigation on site, we identified the FS transmitting antenna at the corresponding azimuth, seen in
Figure 10 below.
In this manner, the MODCODs are adapted during satellite visibility based on
INR for antenna elevation angles (
Table 6).
Note that considering current WFI link parameters for C-4, the Thr = 52.796 Gbits. As we can see, the proper operation of a low/medium complexity MODCOD mitigates the harmful effects by maintaining a higher margin than specified during satellite visibility, except for low elevation angles. The throughput for this configuration is about 1.4 times the minimum required of 36.922 Gbits. In this case, no processing failures would be expected for the images. We can recalculate the MODCOD by considering another approach to achieve the maximum throughput on the WFI channel. In return, we will have a high-complexity technology modulator.
This selection can be reassessed regularly, considering the reception systems of the ground stations. A low-cost station, for example, might need our use case solution. On the other hand, when the reception system is composed of a high-performance receiver with high G/T, we can transmit a higher data rate, including other recorded data, as we have greater throughput capacity
3.5. End-to-End Communication System Emulation in Interfering Model
In order to emulate the previous scenario, the
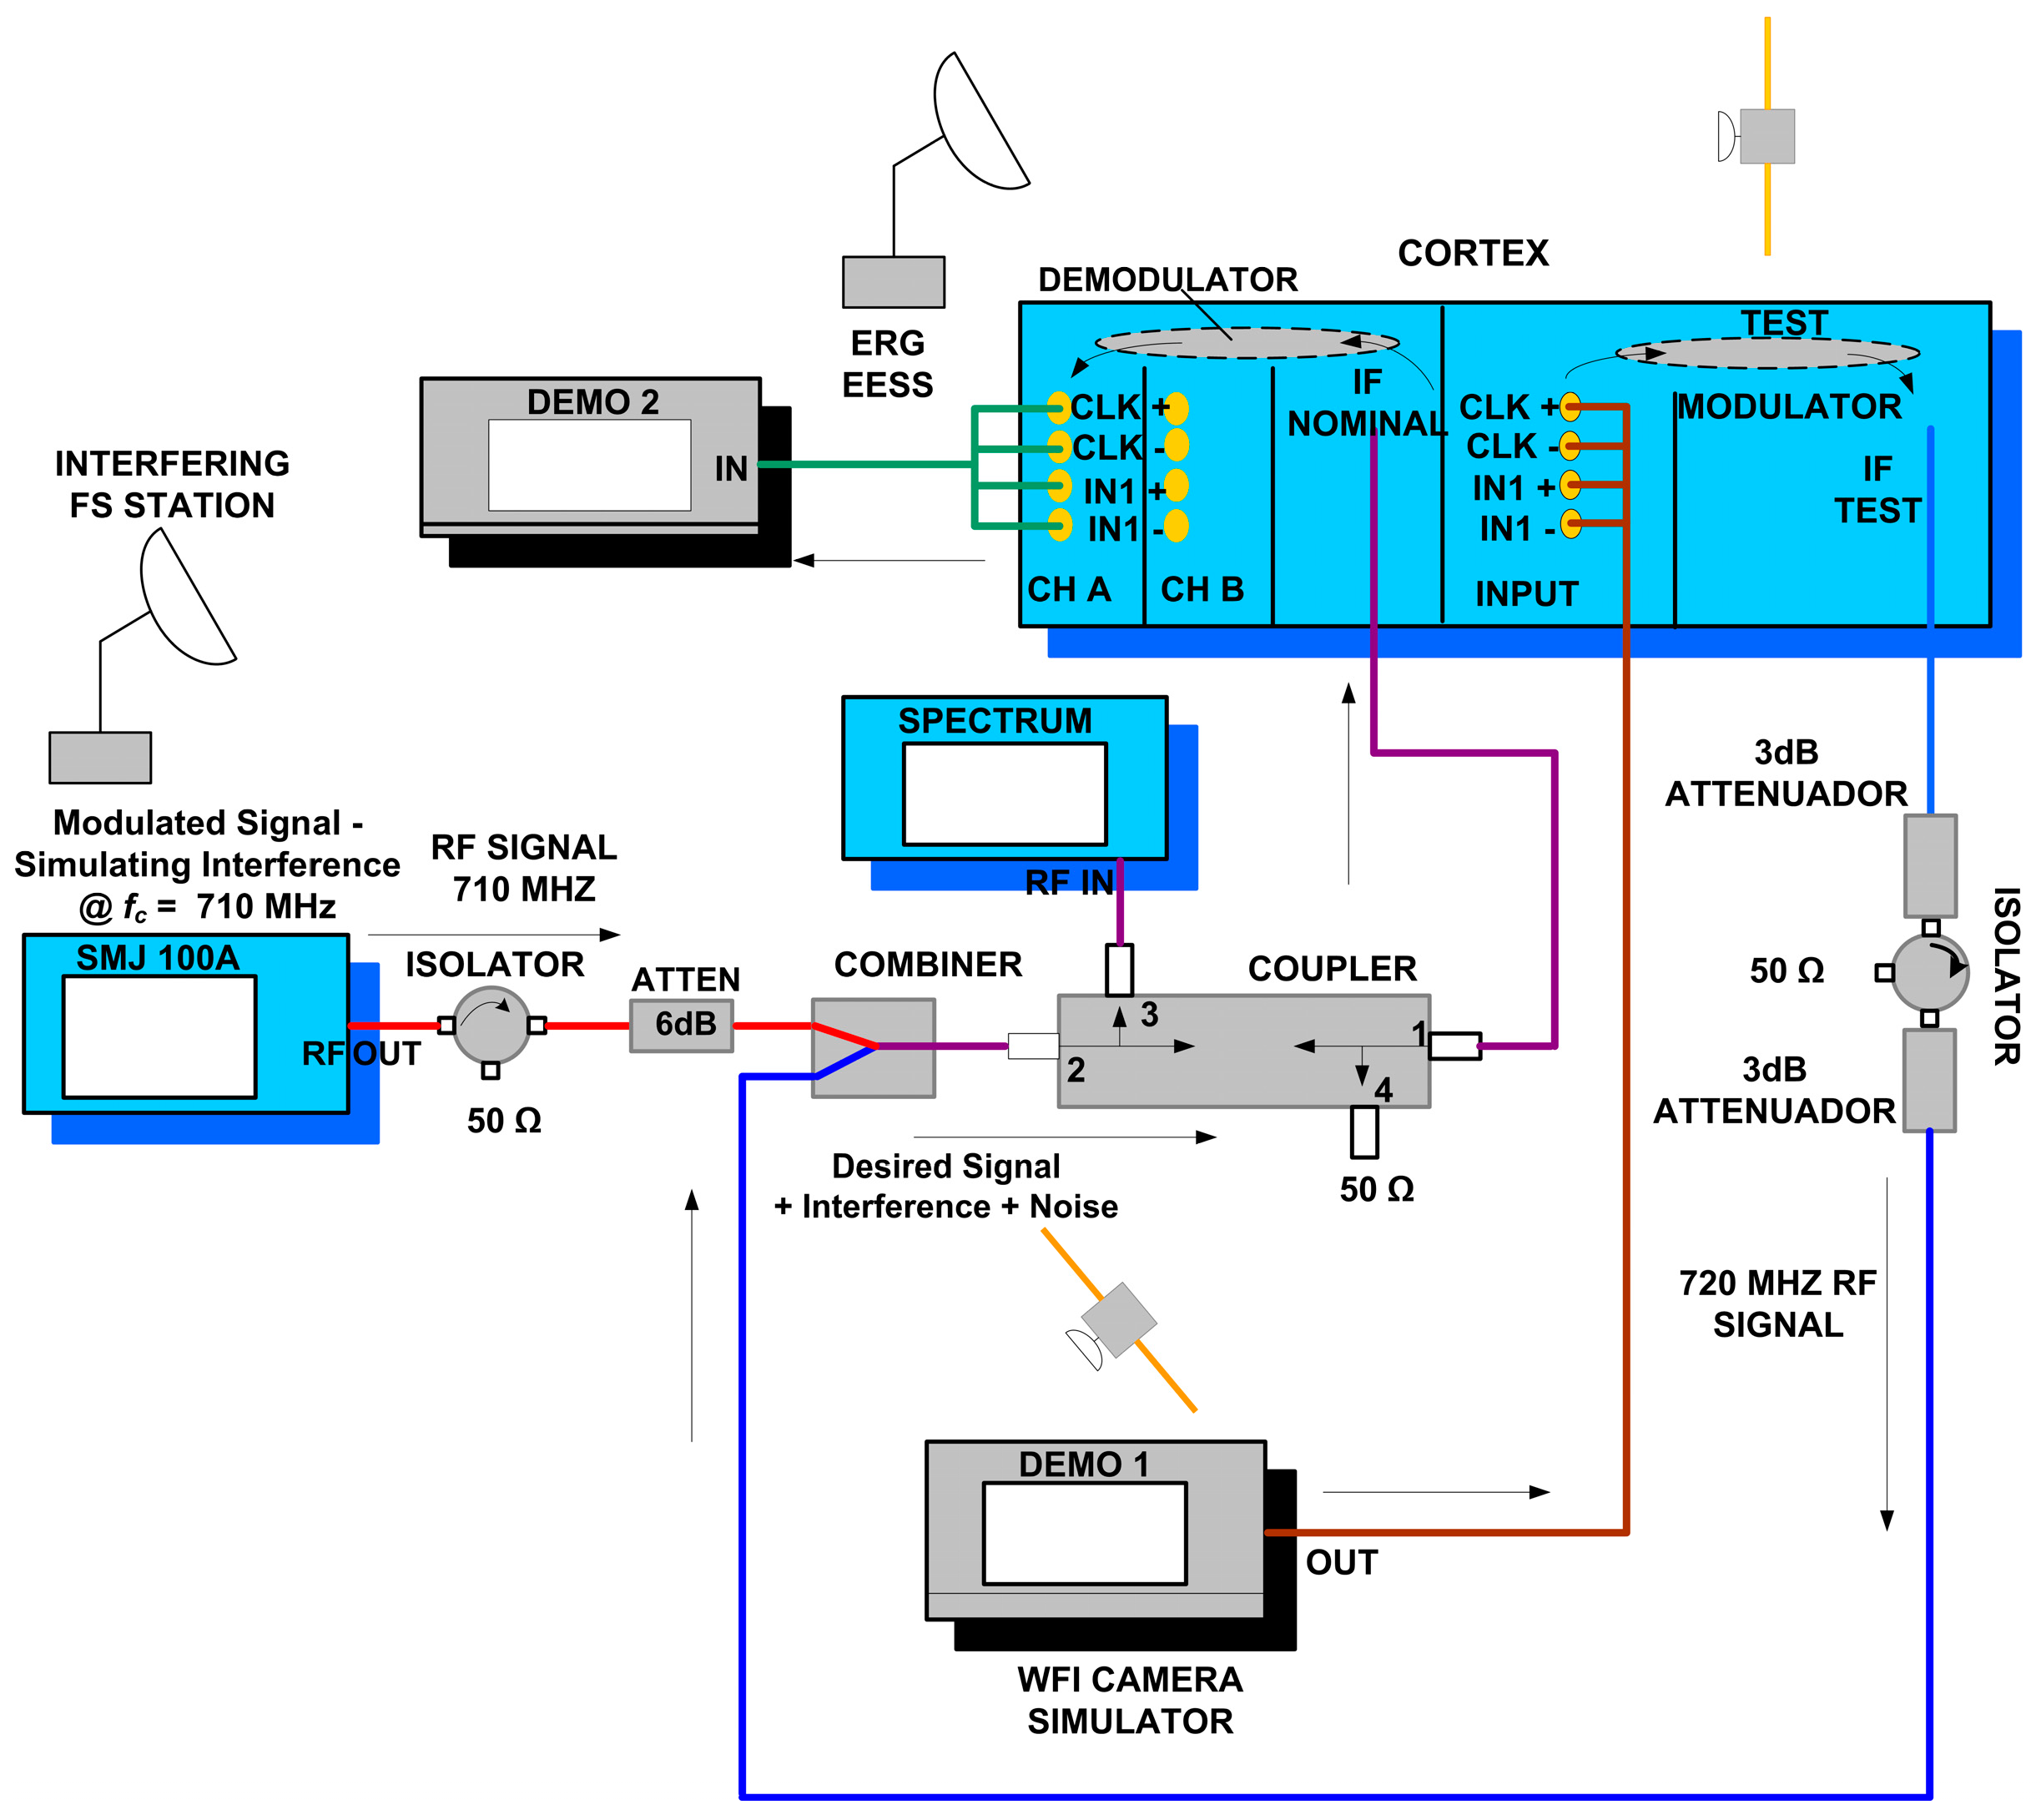
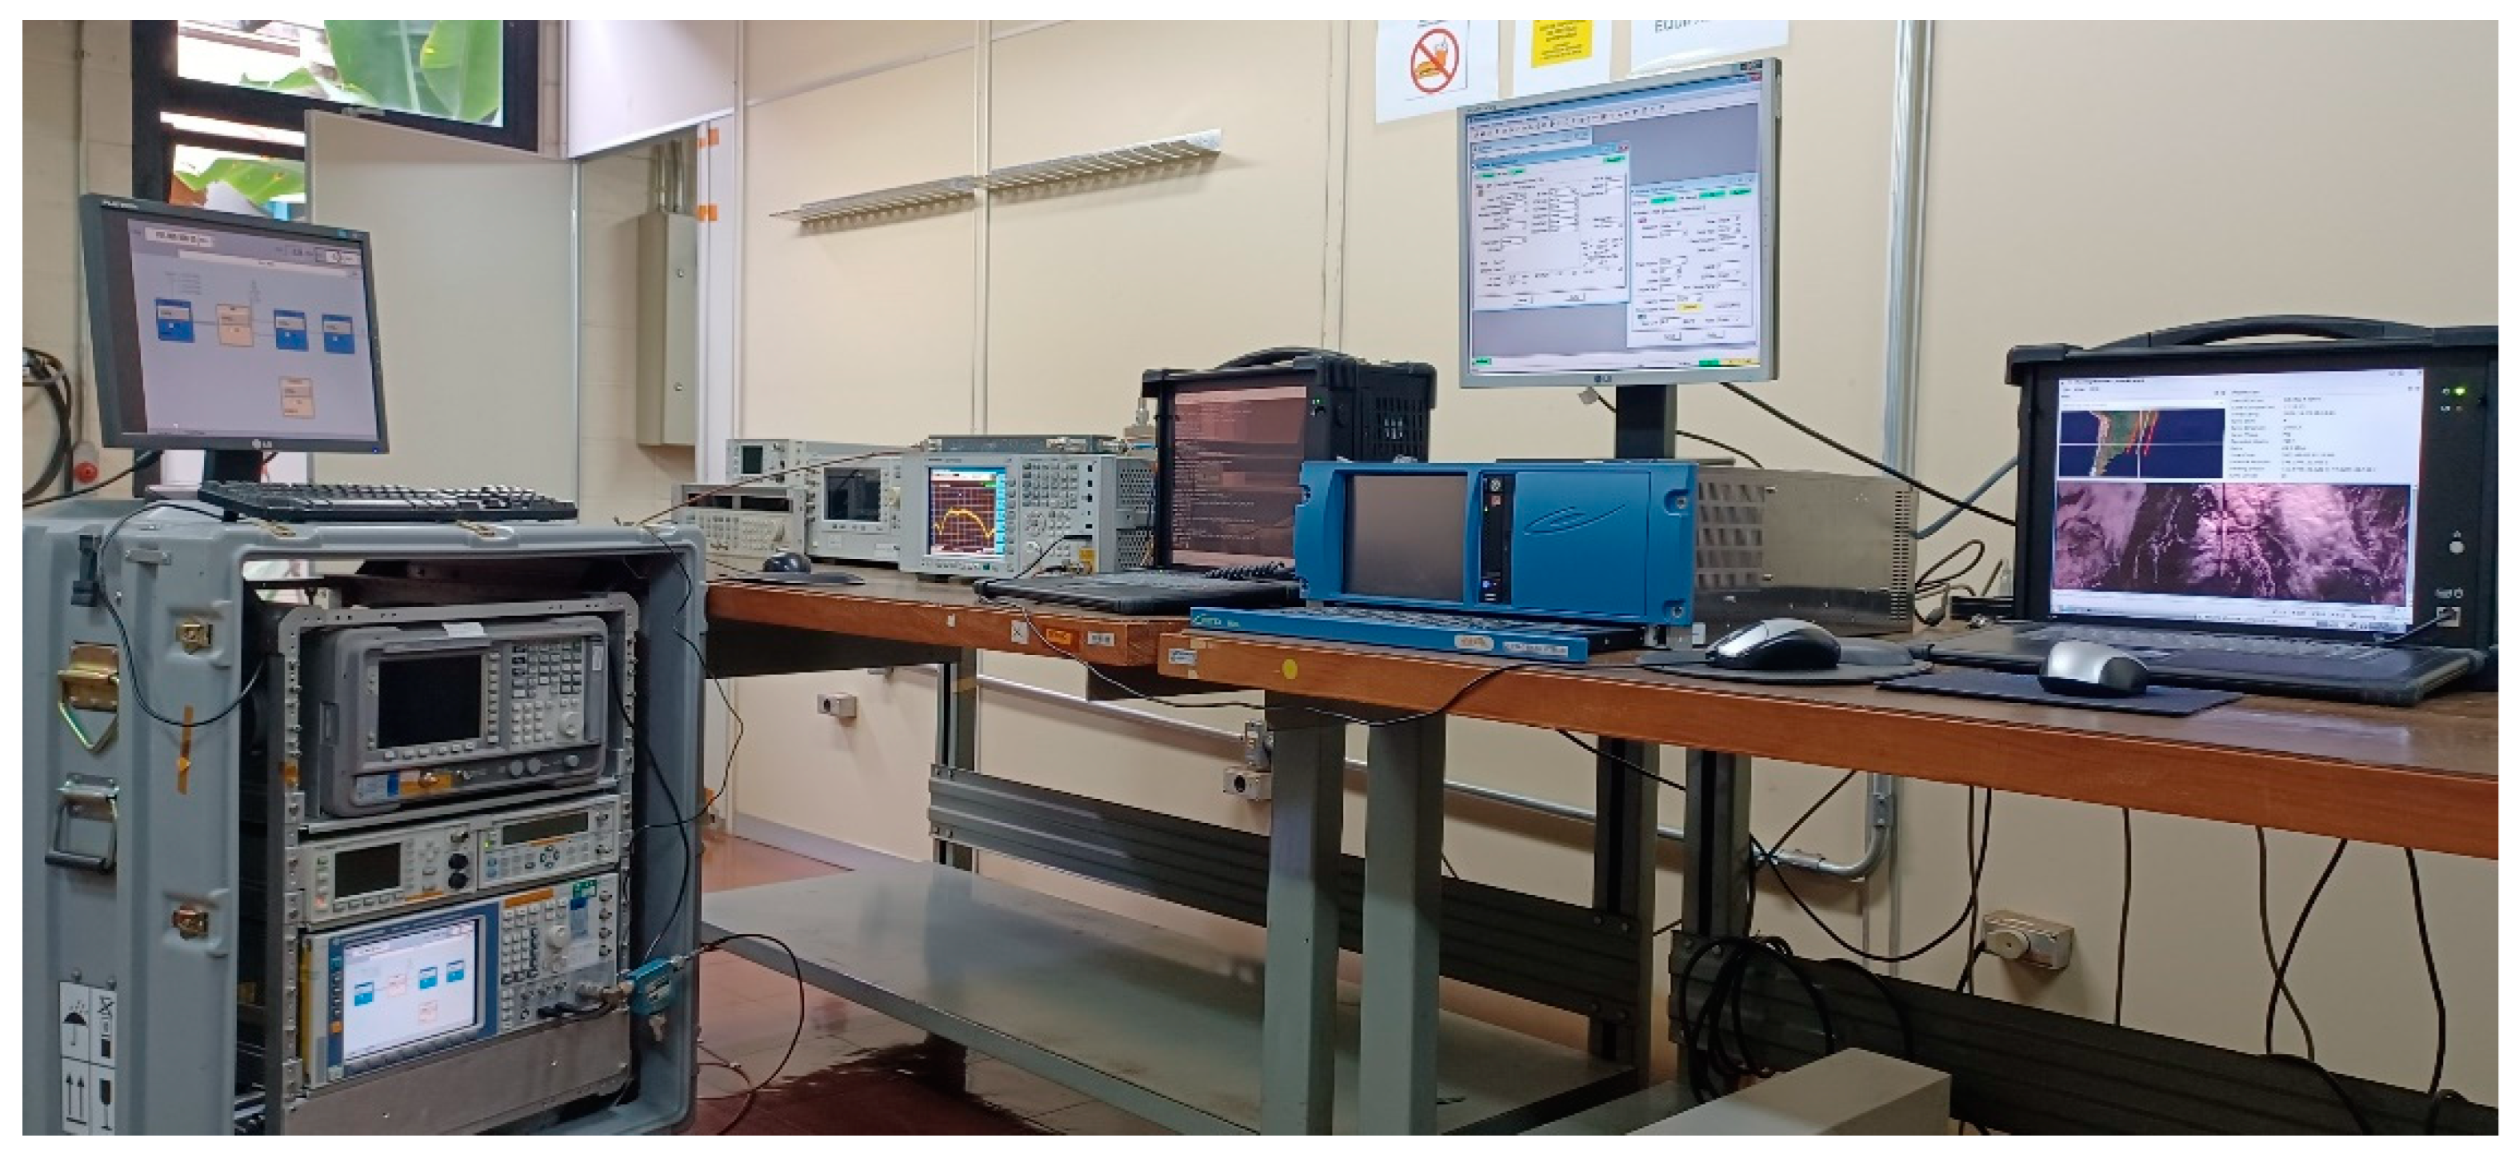
Figure 11 shows the bench-emulated test setup of the TX & RX communication system with interference, with details of the RF devices/equipment used in the lab (
Figure 12 is the setup picture). The specifications and description of the transmission and reception communication system follow below.
Exploring
Figure 11, we have the HDR CORTEX equipment - High Data Rate receiver Cortex Series from the French company Zodiac Safran, which has a dual function in the configuration. It has an internal modulator that generates the carrier signal modulated with external information data, modeling the satellite data transmitter in the communication system. The primary function is to receive and demodulate high data rate.
The image data from the WFI camera are simulated by a dedicated computer (DEMO 1). For practicality, the bit rate Rb was programmed at 50 Mbps (close to the actual WFI value of 51.28 Mbps). The TX output is combined with a signal generated by the Rohde Schwarz SMJ 100A synthesizer, which emulates the interfering signal. At the output of the combiner, we have the compound signal: desired and interference signals plus additive white Gaussian noise (AWGN). The demapping of the I/Q signal from the MAPSK modulation along with the decoding are performed in the Demodulator Unit. The I/Q bit stream at the processor output, corresponding to the camera image data, is transferred to the acquisition board in the computer DEMO 2 for image processing.
The total losses between 'IF TEST' (MODULATOR OUT) and 'IF NOMINAL' (DEMODULATOR IN) is LT = 19.0 dB.
3.5.1. Test 1 Results (No Interference)
Signal configuration at HDR CORTEX ('IF TEST'): the values are
C = -9.6 dBm;
N0 = -102 dBm/Hz. Then, 'IF NOMINAL' gives:
C = -28.6 dBm and
N0 = -121 dBm/Hz.
Since
Rb = 50 Mbps (WFI – AMZ-1), and
Eb/N0 = 15.4 dB is equal to the link budget parameter of the AMZ-1 satellite, WFI camera.
Cortex measurements:
N0(CRTX) = -99.7 dBm/Hz - 19 dB = -118.7 dBm/Hz, and
C = -29 dBm. Since,
Spectrum Analyzer measurements (with interference):
I(SPECT) = -36.8 dBm and
N0 = -118.3 dBm/Hz ,
and,
Measuring the relation
Eb/(
N0 +
I0) on CORTEX, we have:
The measure (6) is close to the calculated in (5). So,
Comparing (7) with the result in (4), we can conclude that the INR values calculated by the measurements in CORTEX and Spectrum Analyzer have a very low variation, calibrating our test setup.
3.5.2. Test 2 Results (Interference Increasing)
To re-evaluate the analyses, we increase the interfering signal level:
Tuning the SMJ generator to get:
we have:
The value (9) has a small variation to the previously calculated in (8). Based on the consistency of our communication-interfering system test results, we can extend the computations on the system with MODCOD scheme, which aim to mitigate interference levels, optimizing the required Eb/N0 according to the variation of INR.
3.5.2. Test 3 – MODCOD Results
As example, we calculate the maximum INR for the MODCOD QPSK 3/5 (ID = 8) @
ηtot = 1.883. From (2), the received SNR at the demodulator input is 15.4 dB, and the minimum specified is:
For downlink practical checking, the earth station antenna gain,
Gant(RX) = 55 dB (from budget parameters):
Results (10) and (12) demonstrate the consistency. For the remaining MODCODs, the calculation sequence follows the same steps.
4. Discussion
For the case study in
Section 3.4 (
Table 6), we considered the link closure with a minimum margin of 3 dB, which requires a low technical complexity modulator system. When considering an approach to maximize throughput, where we can transmit a larger volume of data, including playback recorded passages, we must adapt the MODCOD for this purpose. In return, we will have a modulator of high technical complexity for its development. This trade-off must be re-evaluated when considering satellite reception systems. Therefore, the results show the necessary MODCOD adaptation to support the INR as a function of antenna elevation for the azimuth point of highest interference, based on calculations performed on the EOS downlink budget in the presence of interference.
Regarding the on-site tests, we can consider that the measurements obtained met expectations, indicating that the interference behavior around the receiving antennas does not have theoretically predicted distributions. This is due to both reflections around the ERG and the different front-back ratios of the antennas. Additionally, the signals can be received by the secondary lobes of the antennas.
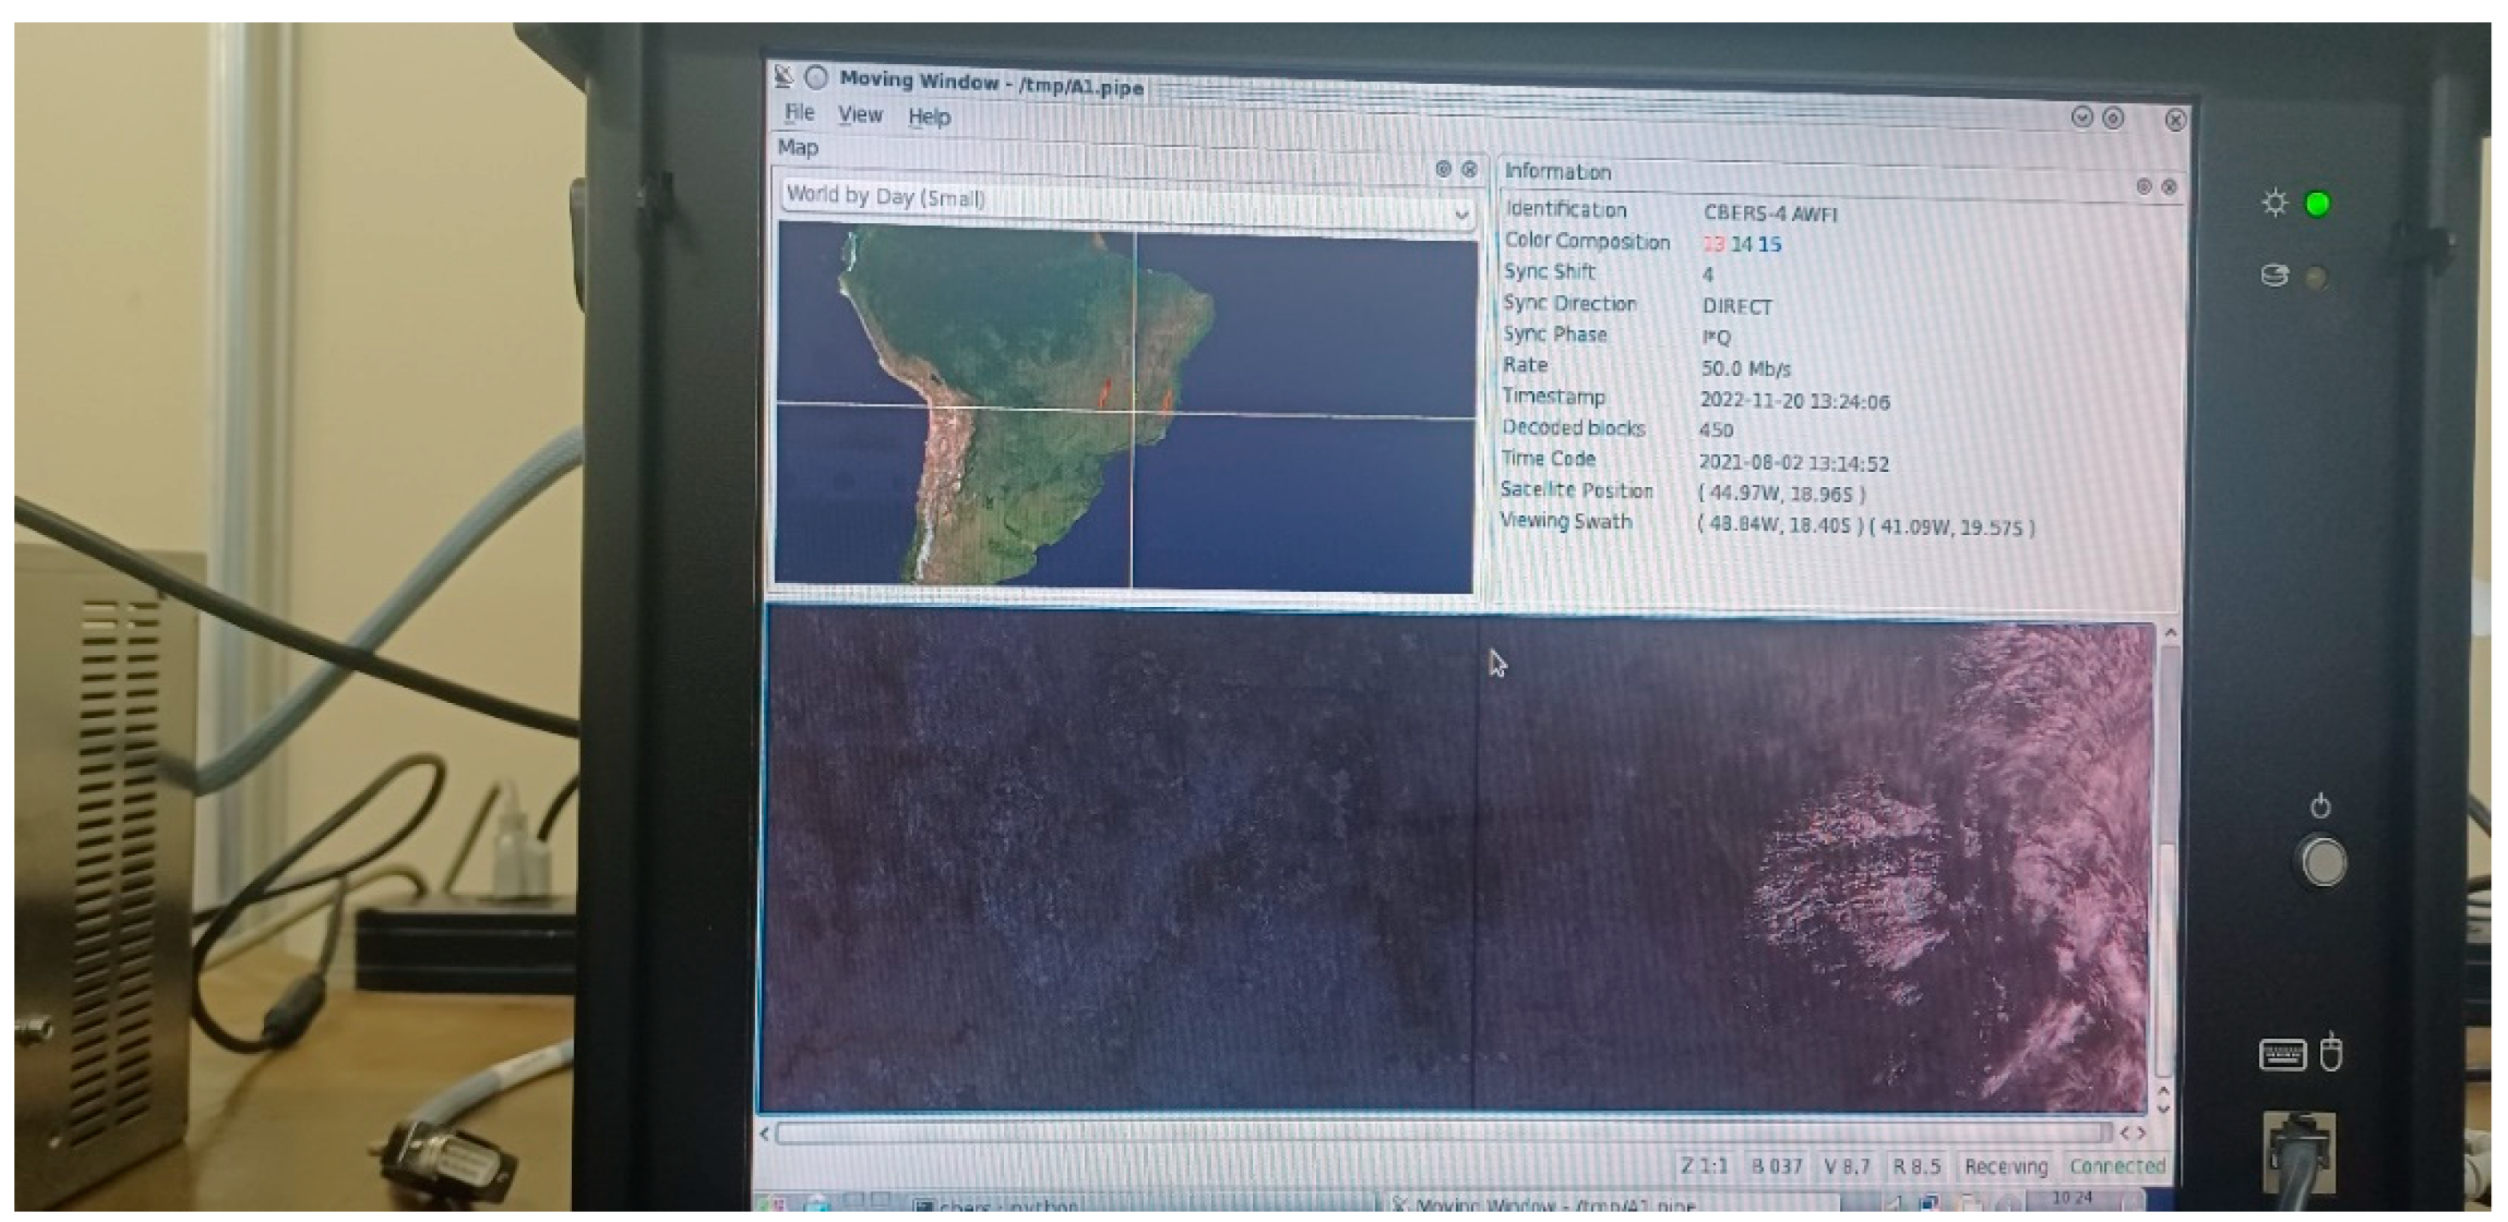
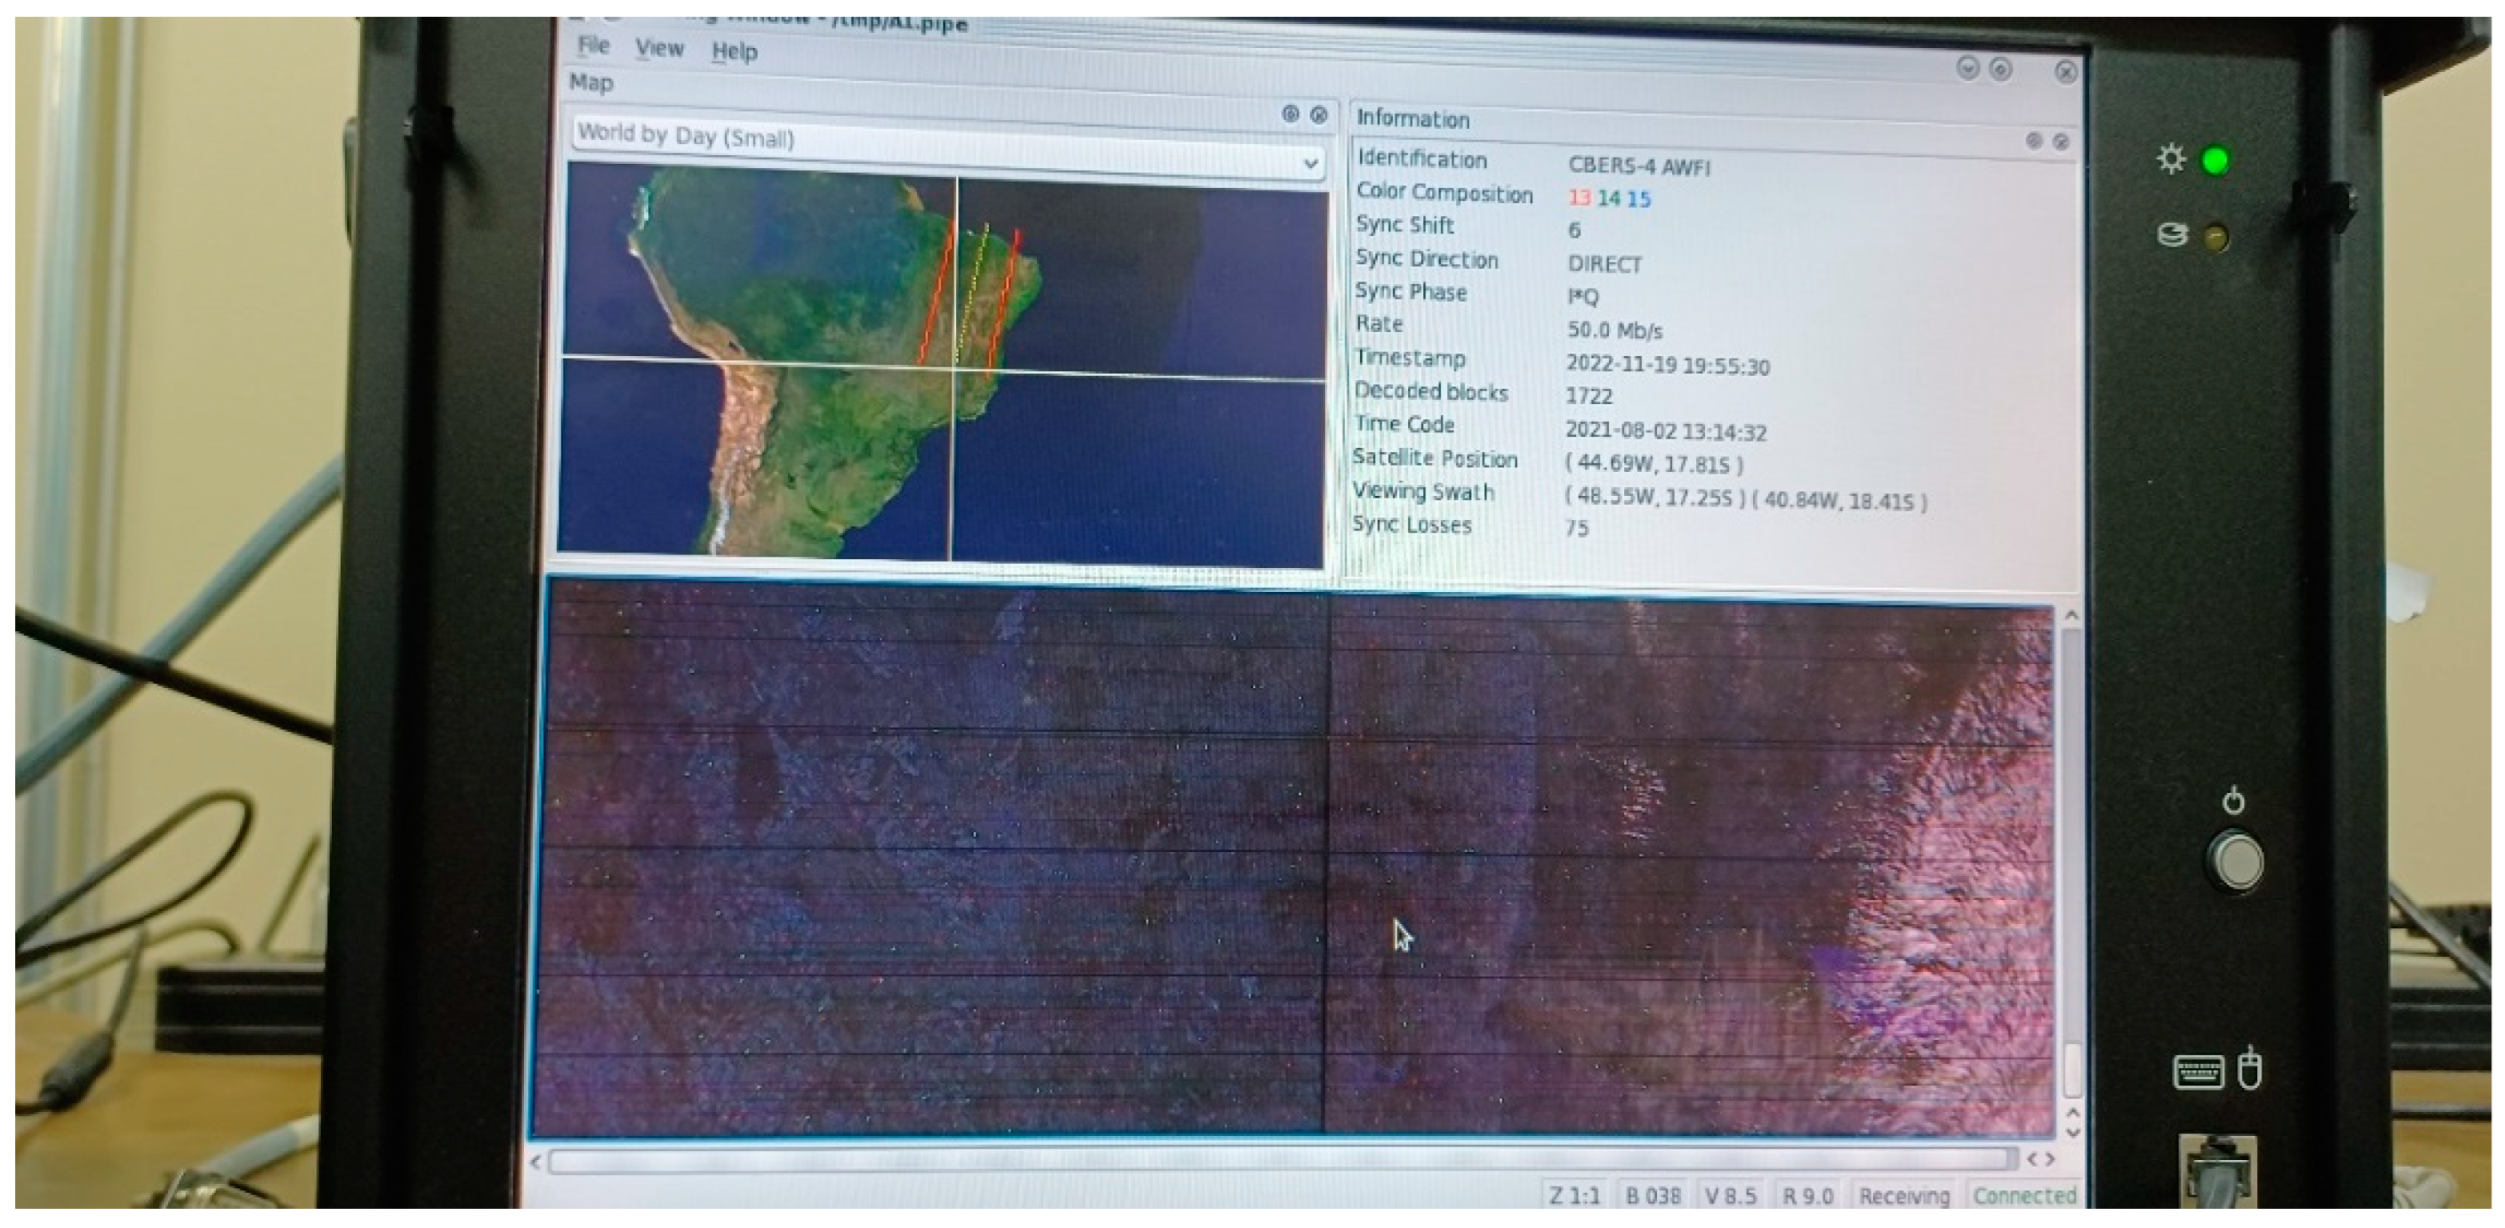
In the simulation of the suitable communication system, it is possible to emulate the variation of SINR by constantly monitoring the image scenes processed from the WFI camera simulator. Consequently, we obtain in our setup 1) the moving window of the failureless WFI image with a link margin,
M ≥ 3 dB, for the specified BER = 10
-7 in the link budget. (See
Figure 13).
In other words, considering QPSK modulation and no error correction code, the relation,
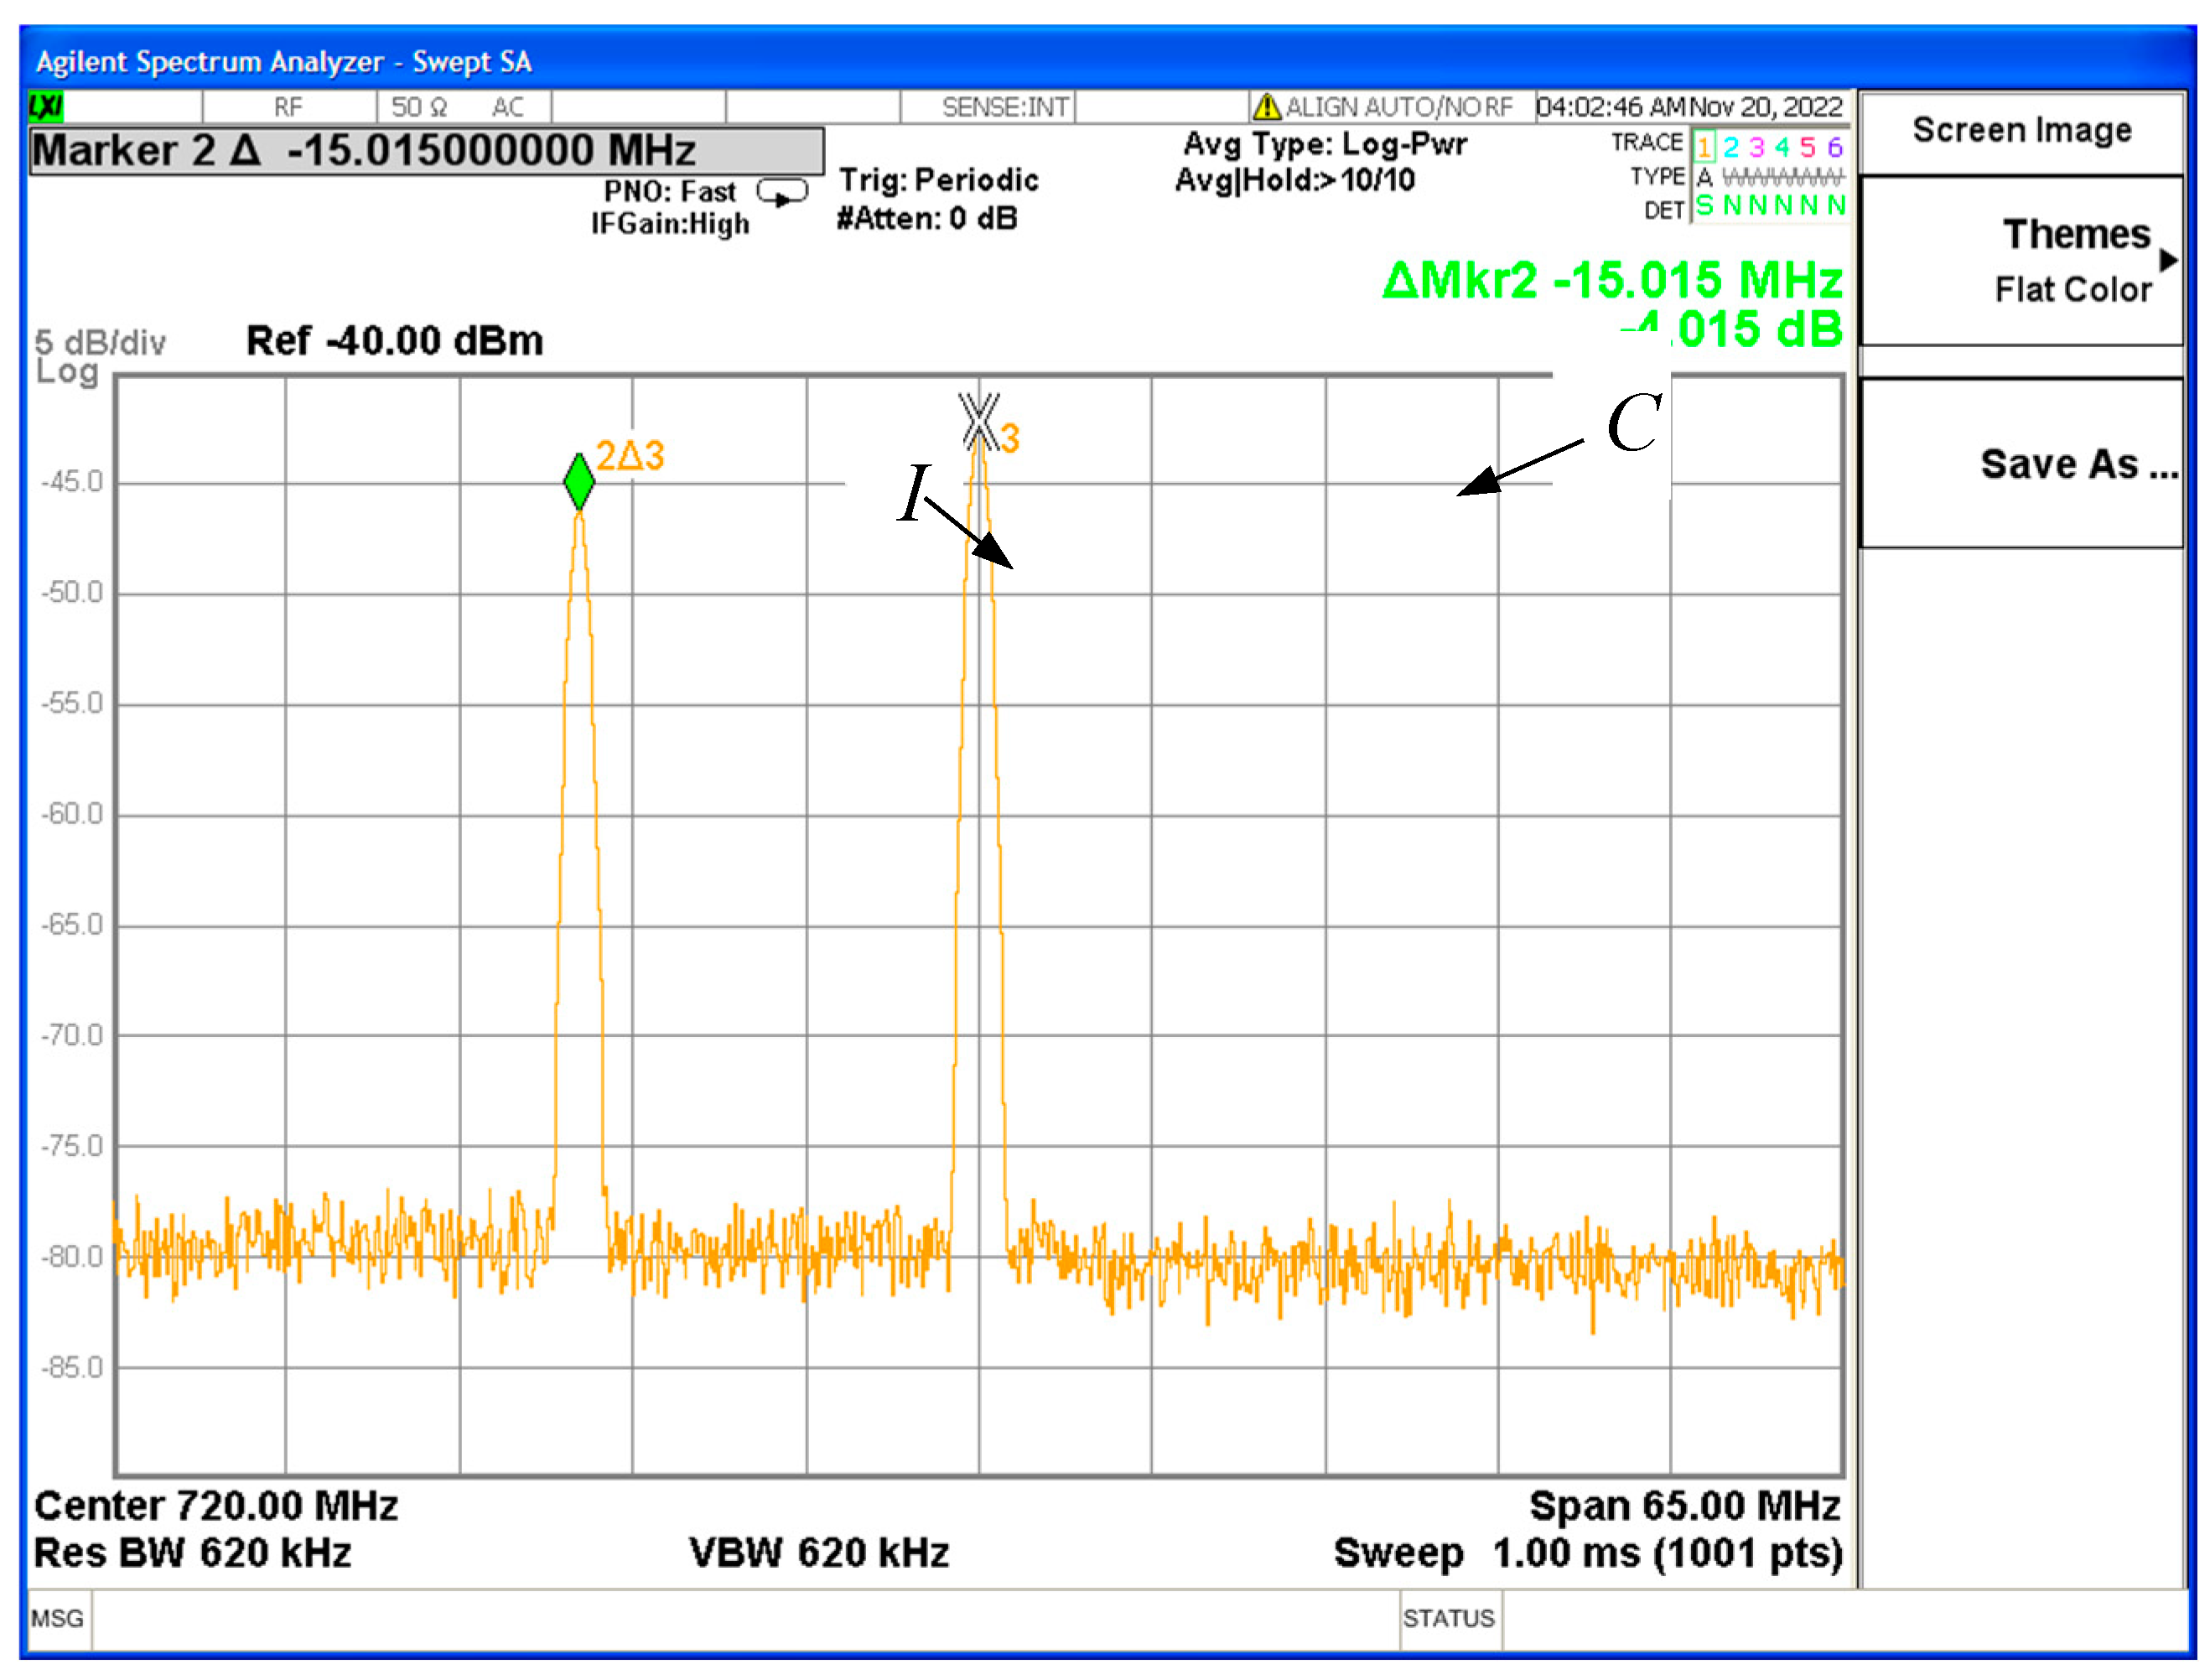
For the purpose of finding the threshold level, we increase the interference until we have 2) the no-failure threshold [(14)], as demonstrated in
Figure 14.
To illustrate the failures in the image processing, we reduce the SINR to 5.2 dB, and we have 3) the moving window depicted in
Figure 15 showing the processing failures on images. This can be verified by the black stripes in the image.
5. Conclusions
This article offers a technical solution that allows spectral coexistence between terrestrial fixed links and the downlink of Earth exploration LEO satellites. The solution maximizes throughput in interfering conditions while maintaining the mission BER requirement within the specified value for the interference plus noise levels during the satellite pass transmitting the image data telemetry. To achieve the target, we developed a strategy that combined the underlay CR exploitation with the adaptive MODCOD techniques. The method adjusts the MODCOD to receive error-free data images based on the SINR per antenna angle. There is a numeric evaluation of the quality of the images given by the specified BER of 10-7. In our emulation, we analyze qualitatively the impact of the drop in signal-to-noise ratio on image processing.
Author Contributions
Conceptualization, R.A., L.S., W.S. and M.S.; methodology, R.A., L.S.; validation, R.A., L.S., W.S.; formal analysis, R.A.; investigation, R.A.; resources, R.A., L.S.; data curation, R.A.; writing—original draft preparation, R.A.; writing—review and editing, R.A., L.S., W.S. and M.S.; visualization, R.A.; supervision, L.S., W.S. and M.S.; project administration, R.A. All authors have read and agreed to the published version of the manuscript.
Funding
This research received no external funding.
Institutional Review Board Statement
Not applicable.
Informed Consent Statement
Not applicable.
Data Availability Statement
The data presented in this study are available on request from the corresponding author.
Acknowledgments
We would like to express our sincere gratitude to the National Institute for Space Research (INPE), the Amazon Program, for their support and contribution to our research project. We extend our appreciation to the researchers and scientists at this Research Institute for their collaboration and provision of essential resources.
Conflicts of Interest
The authors declare no conflict of interest.
References
- Brazilian Space Agency (AEB). PNAE: Programa Nacional de Atividades Espaciais: 2022-2031. Brasília, Brazil, 2022. Available online: http://www.gov.br/aeb/pt-br/programa-espacial-brasileiro/politica-organizacoes-programa-e-projetos/programa-nacional-de-atividades-espaciais (accessed on 21 October 2022).
- Torres, D.L.; Turnes, J.N.; Soto Vega, P.J.; Feitosa, R.Q.; Silva, D.E.; Marcato Junior, J.; Almeida, C. Deforestation Detection with Fully Convolutional Networks in the Amazon Forest from Landsat-8 and Sentinel-2 Images. Remote Sens. 2021, 13, 5084. [CrossRef]
- Nativi, S.; Mazzetti, P.; Santoro, M.; Papeschi, F.; Craglia, M.; Ochiai, O. Big data challenges in building the global earth observation system of systems. Environ. Model. Softw. 2015, 68, 1–26. [CrossRef]
- National Telecommunications Agency (ANATEL). Serviço Limitado Privado - Resolução nº 617, de 19 de Junho de 2013. Brasília, Brazil, 2013. Available online: https://informacoes.anatel.gov.br/legislacao/resolucoes/2013/480-resolucao-617 (accessed on 21 October 2022).
- Mitola III, J. Cognitive radio: an integrated agent architecture for software defined radio. Ph.D. Thesis, Royal Institute of Technology (KTH), Stockholm, Sweden, 2000.
- ETSI TR 103 263 V1.2.1, System Reference document (SRdoc); Cognitive radio techniques for Satellite Communications operating in Ka Band. European Telecommunications Standards Institute: February 2016. Available online: http://www.etsi.org/deliver/etsi_tr/103200_103299/103263/01.02.01_60/tr_103263v010201p.pdf (accessed on 18 October 2019).
- Garhwal, A.; Bhattacharya, P.P. A survey on dynamic spectrum access techniques for cognitive radio.; arXiv 2012, preprint arXiv:1201.1964.
- Sharma, S.K.; Chatzinotas, S.; Ottersten, B. Cognitive radio techniques for satellite communication systems. In: 2013 IEEE 78th vehicular technology conference (VTC Fall); 2013 Sep; p. 1–5. [CrossRef]
- Sharma, S. K.; Chatzinotas, S.; and Ottersten, B. Satellite cognitive communications: Interference modeling and techniques selection. 2012 6th Advanced Satellite Multimedia Systems Conference (ASMS) and 12th Signal Processing for Space Communications Workshop (SPSC), Vigo, Spain, 2012, pp. 111-118. [CrossRef]
- ETSI EN 302 307-2 V1.2.1, Digital Video Broadcasting (DVB); Second generation framing structure, channel coding and modulation systems for Broadcasting, Interactive services, News Gathering and other broadband satellite applications; Part 2: DVB-S2X Extensions (DVB-S2X). European Telecommunications Standards Institute: 2020.
- Sharma, S.K.; Bogale, T.E.; Chatzinotas, S.; Ottersten, B.; Le, L.B.; Wang, X. Cognitive radio techniques under practical imperfections: A survey. IEEE Commun Surv Tutor. 2015; 17(4): 1858–1884. [CrossRef]
- Colin T.; Millerioux, J.P.; Dudal, C.A. System performance of DVB-S2 VCM and ACM high data rate telemetry in EESS Ka-band. SLS-CS_16-09, CCSDS Coding & Synchronization Working Group. September 2016. Available online: https://cwe.ccsds.org/sls/docs/SLS-CandS/Meeting%20Public%20Materials/2016/2016_10%20Rome/SLS-CS_16-09.pdf (accessed on 17 February 2019).
- CCSDS 131.3-B-1, Space Link Protocols over ETSI DVB-S2 Standard. Vol 1. Recommendation for Space Data System Standards (Blue Book). Consultative Committee for Space Data Systems: Washington (DC), USA, Mar 2013.
- Wang, C.; Bian, D.; Zhang, G.; Cheng, J.; Li, Y. A novel dynamic spectrum-sharing method for integrated wireless multimedia sensors and cognitive satellite networks. Sensors. 2018; 18 (11): 3904. [CrossRef]
- Cai, B.; Zhang, Q.; Ge, J.; Xie, W. Resource Allocation for Cognitive LEO Satellite Systems: Facilitating IoT Communications. Sensors. 2023, 23, 3875. [CrossRef]
- Ibrahim, M.; Galal, I. Improved SDR frequency tuning algorithm for frequency hopping systems. ETRI Journal. 2016; 38(3): 455–462. [CrossRef]
- Sharma, S.K. Interweave/underlay cognitive radio techniques and applications in satellite communication systems. Ph.D. Thesis, University of Luxembourg, Luxembourg, 2014. Available online: https://orbilu.uni.lu/handle/10993/18973 (accessed on 17 October 2017).
- Maral, G.; Bousquet, M.; Sun, Z. Communications Systems: Systems, Techniques and Technology. 5th ed. Wiley; 2009.
- Federal Communications Commission. Establishment of interference temperature metric to quantify and manage interference and to expand available unlicensed operation in certain fixed mobile and satellite frequency bands. Et Docket, 03-237; 2003.
- Addabbo, P.; Antonacchio, F.; Beltramonte, T.; Di Bisceglie, M.; Gerace, F.; Giangregorio, G.; Ullo, S. L. A review of spectrally efficient modulations for earth observation data downlink. In: Metrology for Aerospace (MetroAeroSpace). IEEE. 2014; p. 428–432. [CrossRef]
- CCSDS 131.31-O-1, Space Link Protocols over ETSI DVB-S2X Standard (Orange Book). Issue 1. Consultative Committee for Space Data Systems: Washington (DC), USA, Sep 2021.
- Jeannin, N.; Dahman, I. Sizing and optimization of high throughput radio-frequency data down link of earth observation satellites. International Journal of Satellite Communications and Networking, 2016, 34(2), 231-250. [CrossRef]
- International Communication Union. ITU-R. Frequency allocations. Volume I; 2016. Available online: https://www.itu.int/pub/R-REG-RR-2016/en.
- ITU-R SA.1277-0, recommendation. International Telecommunication Union. ITU, 1997.
- CCSDS 401.0-B-32, Radio frequency and modulation systems. Recommended standard. Part 1: Earth station and spacecraft (Blue Book). Consultative Committee for Space Data Systems: Washington (DC), USA, Oct 2021.
- Wertz, J.R.; Everett, D.F.; Puschell, J.J. Space mission engineering: the new SMAD. Microcosm Press; 2011.
- National Institute for Space Research (INPE). Satellite Engineering. Brazil, 2022. Available online: https://www.gov.br/inpe/pt-br/assuntos/produtos/engenharia-de-satelites.
Figure 1.
A simplified cognitive cycle.
Figure 1.
A simplified cognitive cycle.
Figure 2.
Representation of underlay technique. Source: [
5].
Figure 2.
Representation of underlay technique. Source: [
5].
Figure 3.
Bit mapping constellation for the 32APSK modulation.
Figure 3.
Bit mapping constellation for the 32APSK modulation.
Figure 4.
LEO satellite downlink scenario.
Figure 4.
LEO satellite downlink scenario.
Figure 5.
Depiction of a set of images from C-4 WFI (26 days INPE's Catalog). Source: (DGI-INPE, 2018): (a) Complete set; (b) Set with failures.
Figure 5.
Depiction of a set of images from C-4 WFI (26 days INPE's Catalog). Source: (DGI-INPE, 2018): (a) Complete set; (b) Set with failures.
Figure 6.
Curve of INR variation versus applied MODCOD.
Figure 6.
Curve of INR variation versus applied MODCOD.
Figure 7.
Setup in the ERG system.
Figure 7.
Setup in the ERG system.
Figure 8.
Power spectrum of the interference, fc = 8308 MHz.
Figure 8.
Power spectrum of the interference, fc = 8308 MHz.
Figure 9.
WFI image with harmful interference effect.
Figure 9.
WFI image with harmful interference effect.
Figure 10.
Interfering fixed station.
Figure 10.
Interfering fixed station.
Figure 11.
Setup of the communication system.
Figure 11.
Setup of the communication system.
Figure 12.
Picture of the communication system setup.
Figure 12.
Picture of the communication system setup.
Figure 13.
Moving window of WFI images with no failures.
Figure 13.
Moving window of WFI images with no failures.
Figure 14.
Power spectrum of the unmodulated WFI signal (C) and the interference (I).
Figure 14.
Power spectrum of the unmodulated WFI signal (C) and the interference (I).
Figure 15.
WFI Moving window with processing failures.
Figure 15.
WFI Moving window with processing failures.
Table 1.
EESS emission limit recommended by ITU.
Table 1.
EESS emission limit recommended by ITU.
| Frequency band |
Service |
Limit in dB(W/m2) for angle of arrival (δ) above the horizontal plane |
Reference Bandwidth |
| 8025–8500 MHz |
Earth Exploration Satellite |
0 – 5° |
5° – 25° |
25° – 90° |
4 kHz |
| -150 |
-150 + 0.5 (δ-5) |
-140 |
Table 2.
Adaptive MODCOD in DVB-S2X.
Table 2.
Adaptive MODCOD in DVB-S2X.
| MODCOD |
ID |
ηtot |
ES/N0 (dB) Ideal Frame of 64800 bits |
Eb/N0 [dB] |
Symbol BW (MHz) |
| QPSK 1/3 |
9 |
0.656448 |
−1.24 |
0.587996705 |
78.12 |
| QPSK 3/5 |
8 |
1.188304 |
2.23 |
1.480724410 |
43.15 |
| QPSK 5/6 |
7 |
1.654663 |
5.18 |
2.992904443 |
30.99 |
| QPSK 9/10 |
6 |
1.788612 |
6.42 |
3.894838598 |
28.67 |
| 8PSK 3/4 |
5 |
2.228124 |
7.91 |
4.430606434 |
23.01 |
| 8PSK 5/6 |
4 |
2.478562 |
9.35 |
5.408002130 |
20.69 |
| 8PSK 9/10 |
3 |
2.679207 |
10.98 |
6.699937308 |
19.14 |
| 16APSK 5/6 |
2 |
3.300184 |
11.61 |
6.424618456 |
15.54 |
| 32APSK 8/9 |
1 |
4.397854 |
15.69 |
9.257591924 |
11.66 |
Table 3.
Results of the link budget parameters from implemented MODCOD.
Table 3.
Results of the link budget parameters from implemented MODCOD.
OVERALL
LINK BUDGET |
ID = 9
|
ID = 8
|
ID = 7
|
ID = 6
|
ID = 5
|
ID = 4
|
ID = 3
|
| Received C/N0 [dBHz] |
95.5 |
| Received Eb/N0 - loss [dB] |
15.4 |
| Implement. Loss [dB] |
3.0 |
| Demodul. Loss [dB] |
3.0 |
|
Eb/N0 @ BER = 1×10⁻⁶ [dB] |
0.6 |
1.5 |
3.0 |
3.7 |
4.4 |
5.4 |
6.4 |
|
C/I [dB] |
1.9 |
5.4 |
8.4 |
9.6 |
11.3 |
12.8 |
15.2 |
|
Eb/I0 [dB] |
3.9 |
4.9 |
6.5 |
7.6 |
8.2 |
9.4 |
10.7 |
| Received Eb/(N0+I0) [dB] |
3.58 |
4.48 |
5.98 |
6.91 |
7.45 |
8.42 |
9.43 |
| Spec Margin (M) [dB] |
2.99 |
3.00 |
2.99 |
3.01 |
3.02 |
3.02 |
3.001 |
|
INRmax=I0/N0 [dB] |
14.62 |
13.69 |
12.10 |
11.14 |
10.56 |
9.49 |
8.34 |
Table 4.
Throughput for no coding QPSK / interference scenario (INR X Elevation).
Table 4.
Throughput for no coding QPSK / interference scenario (INR X Elevation).
| Elevation (°) |
INR (dB) |
% of time(2)
(CCSDS, 2013) [13] |
Rb(1) Mbps |
Thr(2) Gbits |
| 90 |
8.01 |
16.6 |
51.28 |
30.988 |
| 75 |
8.37 |
13.6 |
51.28 |
| 60 |
9.44 |
25.2 |
51.28 |
| 30 |
11.45 |
35.4 |
39.65 |
| 5.7 |
13.70 |
9.2 |
6.45 |
Table 5.
Throughput X MODCOD (in ACM).
Table 5.
Throughput X MODCOD (in ACM).
| Elev. (°) |
INR dB |
MODCOD |
ID |
% of time(2)
|
Rb(1) Mbps |
Thr(2) Gbits |
| 90 |
8.01 |
8PSK 9/10 |
2 |
16.6 |
137.39 |
82.878 |
| 75 |
8.37 |
16APSK 5/6 |
3 |
13.6 |
169.23 |
| 60 |
9.44 |
8PSK 5/6 |
4 |
25.2 |
127.1 |
| 30 |
11.45 |
QPSK 9/10 |
6 |
35.4 |
91.92 |
| 5.7 |
13.70 |
QPSK 3/5 |
8 |
9.2 |
51.28 |
Table 6.
Calculation of throughput X adaptive MODCOD – C-4 passage.
Table 6.
Calculation of throughput X adaptive MODCOD – C-4 passage.
| Elev. (°) |
I (dBm) |
C (dBm) |
C/I (dB) |
INR (dB)(1)
|
MODCOD
(ID)
|
Rb(Mbps) |
Time(2)
%
|
| 10 |
-21 |
-20.2 |
0.8 |
18.97 |
9⇒
⇒M=-1.05 dB
|
0 |
5.88 |
| 20 |
-32.5 |
-19.7 |
12.8 |
6.97 |
8 |
60.94 |
5.88 |
| 30 |
-40.5 |
-18.7 |
21.8 |
-2.03 |
7 |
80.85 |
5.88 |
| 40 |
-47.5 |
-18.4 |
29.1 |
-9.33 |
6 |
91.72 |
5.88 |
| 50 |
-40.5 |
-17.9 |
22.6 |
-2.83 |
7 |
80.85 |
5.88 |
| 60 |
-45 |
-16.4 |
28.6 |
-8.83 |
6 |
91.72 |
5.88 |
| 70 |
-44 |
-16.2 |
27.8 |
-8.03 |
7 |
80.85 |
5.88 |
| 77.8 |
-26.5 |
-14.7 |
11.8 |
-7.97 |
7 |
80.85 |
5.88 |
| 90 |
-44 |
-14.1 |
29.9 |
-10.13 |
6 |
91.72 |
5.88 |
| 100–140 |
|
|
|
-2.53 –
-8.03 |
7 |
80.85 |
29.4 |
| 150–170 |
|
|
|
0.97 –
5.47 |
8 |
60.94 |
17.64 |
|
Disclaimer/Publisher’s Note: The statements, opinions and data contained in all publications are solely those of the individual author(s) and contributor(s) and not of MDPI and/or the editor(s). MDPI and/or the editor(s) disclaim responsibility for any injury to people or property resulting from any ideas, methods, instructions or products referred to in the content. |
© 2023 by the authors. Licensee MDPI, Basel, Switzerland. This article is an open access article distributed under the terms and conditions of the Creative Commons Attribution (CC BY) license (http://creativecommons.org/licenses/by/4.0/).
