Submitted:
04 July 2023
Posted:
04 July 2023
You are already at the latest version
Abstract
Lung cancer is the leading cause of cancer death worldwide, with non-small cell lung cancer (NSCLC) making up 80% of cases. Some genetic factors leading to NSCLC development include genetic mutations and PD-L1 expression. PD-L1 proteins are targeted in an NSCLC treatment called targeted gene therapy. However, this treatment is effective in a low percentage of patients. This study aimed to create machine learning models to use features like the number of mutations and the level of PD-L1 proteins in cancer cells, along with others, to predict whether a patient will receive clinical benefit from gene therapy treatment. This was done by downloading and merging datasets from cbioportal.org to create a sample size for the model. Features with high correlations to clinical benefit were identified. Three machine-learning models were created using these features to predict clinical benefits in patients, and each model’s accuracy was evaluated. All three models were accurate between 55-85%, with two of the models averaging an accuracy around 75%. Doctors can use these models to more accurately predict whether gene therapy treatment is likely to work in a patient before prescribing it to them.
Keywords:
Non-small cell lung cancer
; Targeted Gene Therapy
; Immune Checkpoint Inhibitors
; Machine Learning
1. Introduction
1.1. Spread of Non-small cell lung cancer
Non-small cell lung cancer (NSCLC) is the leading cause of cancer death worldwide. Unlike small-cell lung cancer, NSCLC makes up 80% of lung cancer cases and commonly occurs in smokers and non-smokers [1]. For non-smokers, there are both environmental and genetic risk factors for developing NSCLC [2]. Some genetic factors that can lead to NSCLC include mutations in cancer cells and the level of the PD-L1 protein [3,4]. The PD-L1 protein is a protein present in cells that acts as brakes for immune system cells, such as T Cells. The PD-L1 protein in cells binds to the PD-1 protein on T Cells [5]. When this binding occurs, the T Cell is not activated and knows not to attack the cell with the PD-L1 protein (Figure 1) [5]. As a result, cells with higher PD-L1 levels are less likely to be attacked by T Cells [5,6,7]. Some cancer cells have been observed to have high levels of PD-L1, which causes them not to be attacked by T Cells [5,6,7]. The PD-L1 protein, which healthy cells use to signal T-Cells that they are not a threat, is exploited by these cancer cells so the host’s immune system does not attack the cancer.
1.2. NSCLC Treatment
The PD-L1 protein is targeted by a type of NSCLC treatment called targeted gene therapy. Targeted gene therapy drugs, known as immune checkpoint inhibitors (ICIs) bind to PD-L1 proteins. This binding prevents the PD-L1 proteins in cancer cells from being able to attach to PD-1 proteins on T Cells [8,9,10]. As a result, T Cells are left free to launch immune attacks on the cancer cells, being able to kill them before they can grow (Figure 2). ICI-based treatment has shown to be effective with long-lasting results, but it also has various limitations. The largest of these limitations is that ICI treatment has only been effective in about 20-40% of patients [9]. This makes it important to understand whether ICI treatment will be beneficial for a patient before prescribing it to them. However, it is currently difficult to predict if a patient will benefit from ICI treatment, making it less cost-effective overall [13]. Hellmann et al. established two features correlated to the success of ICI treatment, also known as clinical benefit. These two features are the number of mutations in cancer cells and PD-L1 expression, which were both shown to be positively correlated to clinical benefit [11].
1.3. Objectives
The first objective of this study was to determine if the correlations outlined above are present in datasets other than the one presented in the study by Hellmann et al. This would strengthen the validity of these correlations. The next goal was to understand which other demographic, environmental, or genetic features would be the best to use to predict clinical benefit in patients. A supervised machine learning model would then be created using these features to predict a patient’s clinical benefit from ICI treatment. This would allow clinical benefits to be predicted before treatment begins. Finally, the performance of this model will be evaluated by looking at both its accuracy and how well it fits the data.
2. Materials and Methods
2.1. Materials
There were two data sources used for this project. The primary dataset (MSK) is from a study conducted with 75 NSCLC patients. It was downloaded as a .tsv file from https://www.cbioportal.org/study/clinicalData?id=nsclc_mskcc_2018.
The secondary dataset (MSKCC) is from a study conducted with 240 NSCLC patients. It was downloaded as a .tsv file from https://www.cbioportal.org/study/clinicalData?id=nsclc_pd1_msk_2018.
2.2. Methodology
The MSK and MSKCC datasets were downloaded from the cBioPortal website. The datasets were merged into one combined dataset to provide more data to train the model. Once this was complete, the merged dataset was split into 80% training data and 20% test data. These steps provided the model with enough data to learn from while still providing a large enough test data size to test the model’s accuracy reliably. To decide which features the model would use to determine clinical benefit, a correlation coefficient test was run on the clinical benefit variable to see which features had the highest correlation. The features with the six highest correlation coefficients were used to train the model. Six features were chosen because this provided enough features for the model to predict clinical benefit accurately without overcomplicating the model and risking overfitting to the training data. Three different supervised machine-learning models were created to fit the training data. The first was a Gaussian Naive Bayes (GNB) model. The GNB model works by assuming the data for each feature follows a normal distribution and classifying each new entry by looking at the likelihood that each feature fits into this normal distribution. The second model created was a decision tree model. The decision tree model works by creating conditions based on specific features in the data and making a tree-like representation of these conditions. When a new entry is given to the model, it goes down a specific path on the tree based on if each condition is true or false for that entry. After enough conditions, the model classifies the entry. The final model was a logistic regression model. Logistic regression models classify data into binary outcomes by fitting a logistic curve to the dataset’s features. The accuracy of the three models on the MSK, MSKCC, and merged datasets were recorded. Finally, Leave One Out Cross Validation (LOOCV) was used to measure model fit to the data. LOOCV works in a dataset with “n” entries by training the model with “n-1” entries and testing it on the final entry. It then repeats this process “n” times to use each entry as the test entry. It then computes a score for how accurate and well fit to the data the model is. This score is found by performing LOOCV and then calculating the model’s Mean Absolute Error (MAE) of the model. T-tests were run to determine statistical significance with a p-value of 0.001. Pandas, NumPy, Sklearn, Seaborn, and Matplotlib were the main packages used. Pandas was used for data manipulation. Numpy was used for numerical computation. Sklearn was used to create the machine learning models. Seaborn and Matplotlib were used to create the visualizations. All programs were run in Python version 3.7.13 using a Google Colabatory notebook.
3. Results and Discussions
3.1. Background Information for Datasets
The first tests provide context for some of the demographic and genetic features of the merged dataset. The merged dataset contains patients of a wide range of ages. 38% of patients were 60-70 years old, 28% were 50-60, and 20% were 70-80. The other 15% of patients were either above 80 years or below 50 years old (Figure 3). It is important to note the ages of the participants in the studies because a younger or older sample may include patients with different features. Specifically, a younger demographic of patients may consist of fewer smokers than this dataset has [19]. The following visualization is a pie chart to show what percentage of patients received clinical benefits from the ICI treatment. Approximately 40% of the patients in the merged dataset received a clinical benefit from the treatment (Figure 4). This is ideal for creating a supervised learning model because it provides a large amount of labeled data for each outcome: clinical benefit and no clinical benefit. Next, a histogram of the mutation count in each dataset was created. The mutation count in patients in both the MSK and MSKCC dataset are clustered on the lower side of the range of mutation counts (Figure 5). The MSK dataset has patients with mutation counts over 600, while the MSKCC dataset does not have any patients with a mutation count above 100 (Figure 6). This difference in mutation counts is important to note because the MSKCC dataset has a larger sample size compared to the MSK dataset. Therefore, the mutation count will be skewed toward the MSKCC dataset’s lower average count. This trend of the mutations being clustered on the lower end of the range is present when a histogram of the mutation counts in the merged dataset is also created (Figure 7).
3.2. Mutation Count Correlation to Clinical Benefit
Once this background information was established, mutation count was examined to see if it significantly correlated to clinical benefit. It had already been previously shown in the study that produced the MSK dataset that there was a significant correlation between mutation count and clinical benefit, so this dataset was not tested. In the MSKCC dataset, it was shown that patients that received a clinical benefit from the treatment had significantly higher mutation count, on average, than those who did not (Figure 8). This exact finding was echoed in the merged dataset (Figure 9). This supports the findings of Hellmann et al. in the study that produced the MSK dataset but seeing this trend in a larger dataset helped confirm this correlation. This also means that mutation count is an important feature that can be used to train the models since it strongly correlates to clinical benefit in patients.
3.3. Correlation Coefficient Test
A correlation coefficient test was run for all the features in the merged dataset to see which features had the highest scores. These six features were found to be Nonsynonymous Mutation Burden, Predicted Neoantigen Burden, Mutation Count, Tumor Mutation Burden, PD-L1, and Smoking History (Table 1). This is an interesting result because the four features with the highest correlation are all related to the number of mutations present in cancer cells. This indicates that mutation counts in cancer cells are highly correlated to the success of ICI treatment. These six features were chosen to use to train each of the models. It is important to note that the MSKCC dataset does not include the Nonsynonymous Mutation Burden or Predicted Neoantigen Burden features, so the MSKCC rows had null values in these columns in the merged dataset. Once the six features were chosen, the three models were built.
3.4. Machine Learning Models
Each model used 80% of the data in the dataset for training and 20% for testing. Each model was tested on the MSK, MSKCC, and the merged dataset. The models’ accuracy for all three datasets was consistently above 50% (Table 2). The models were, on average, the most accurate on the MSK dataset. This could be because the MSKCC dataset complicated the model in a few different ways. First, the MSKCC dataset held many null values for the PD-L1, Nonsynonymous Mutation Burden, and Predicted Neoantigen Burden columns, three of the primary key features. Additionally, this dataset had lower correlation coefficients for each feature than the MSK or merged dataset. Regardless, the models were accurate above 50% on the MSKCC dataset, along with the merged dataset.
3.5. Leave One Out Cross Validation
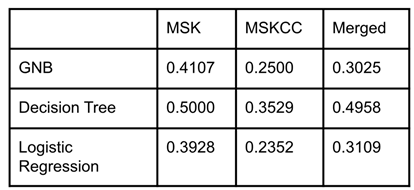
Once the accuracy of the models had been recorded, a LOOCV score was used to evaluate how well each model fits the data. All three models had LOOCV scores close to zero, meaning they were well fit to the data (Table 3). The decision tree model was the least well fit of the three models on average, but the difference between the LOOCV scores for each model was marginal.
4. Conclusions
4.1. Conclusions
It was found that the mutation count and clinical benefit are correlated in the merged and MSKCC datasets, along with the MSK dataset. Six key features (Nonsynonymous Mutation Burden, Predicted Neoantigen Burden, Mutation Count, Tumor Mutation Burden, PD-L1, and Smoking History) were identified with high correlations to clinical benefit in the merged dataset. Using these six key features, three supervised machine-learning models were created. These models were a Gaussian Naive Bayes, a Decision Tree, and a Logistic Regression Model. These models were then applied to the MSK, MSKCC, and merged dataset to predict patient clinical benefit. All three models were found to accurately predict clinical benefit above 50% of the time, averaging in the mid to high 70% range. LOOCV was then used to assess the model’s reliability which found that all three models were well fit to the data.
4.2. Future Investigations
In the future, even more accurate models can be created using larger datasets with additional patient data. Additionally, it is important in the future to understand why these features are correlated to clinical benefit. It is not currently clear why a higher mutation count or higher PD-L1 expression leads to better results in treatment [11]. Understanding why these correlations exist could further advance ICI treatment and its effectiveness in a larger pool of patients.
4.3. Applications
Targeted gene therapy treatments such as ICIs cost patients and insurers millions of dollars each time the treatment is used [12]. As a result, knowing when a patient is likely to benefit from ICIs is extremely important, especially since only 20-40% of patients receive a clinical benefit from this treatment. Previously, it was challenging to understand whether a patient would benefit from ICI treatment.
Predicting which patients will receive a clinical benefit would dramatically increase the cost-effectiveness of this treatment and prevent any potential adverse effects that may come with ICI treatment without clinical benefit [13,14,15,16,17,18]. Using these models, doctors can better understand in advance whether a patient is likely to benefit from ICI treatment to maximize the effectiveness of these powerful drugs.
Acknowledgments
I want to acknowledge Tamara Qawasmeh for her mentorship throughout the process of doing the research and writing this paper. It would not have been possible without her guidance and expertise.
Conflicts of Interest
The authors declare no conflict of interest.
References
- Torre, L. A.; Siegel, R. L.; Jemal, A. Lung cancer statistics. Adv. Exp. Med. Biol. 2016, 893, 1–19. [Google Scholar] [PubMed]
- “Gene mutations in non-small-cell lung cancer,” Webmd.com. [Online]. Available online: https://www.webmd.com/lung-cancer/story/nsclc-gene-mutations (accessed on 29 July 2022).
- Cheng, P.-C.; Cheng, Y.-C. Correlation between familial cancer history and epidermal growth factor receptor mutations in Taiwanese never smokers with non-small cell lung cancer: a case-control study. J. Thorac. Dis. 2015, 7, 281–287. [Google Scholar] [CrossRef] [PubMed]
- Gridelli, C.; et al. Non-small-cell lung cancer. Nat. Rev. Dis. Primers 2015, 1, 15009. [Google Scholar] [CrossRef] [PubMed]
- “NCI Dictionary of Cancer Terms,” National Cancer Institute, 02-Feb-2011. [Online]. Available online: https://www.cancer.gov/publications/dictionaries/cancer-terms/def/pd-l1 (accessed on 29 July 2022).
- “PDL1 (immunotherapy) tests,” Medlineplus.gov. [Online]. Available online: https://medlineplus.gov/lab-tests/pdl1-immunotherapy-tests/ (accessed on 29 July 2022).
- Gavrielatou, N.; Shafi, S.; Gaule, P.; Rimm, D. L. PD-L1 expression scoring: Non-interchangeable, non-interpretable, neither, or both. J. Natl. Cancer Inst., 2021, 113, pp. 1613–1614.
- “Immune checkpoint inhibitors,” National Cancer Institute, 24-Sep-2019. [Online]. Available online: https://www.cancer.gov/about-cancer/treatment/types/immunotherapy/checkpoint-inhibitors (accessed on 29 July 2022).
- Doroshow, D. B.; et al. PD-L1 as a biomarker of response to immune-checkpoint inhibitors. Nat. Rev. Clin. Oncol. 2021, 18, 345–362. [Google Scholar] [PubMed]
- Akinleye; Rasool, Z. Immune checkpoint inhibitors of PD-L1 as cancer therapeutics. J. Hematol. Oncol. 2019, 12, 92. [Google Scholar] [PubMed]
- Hellmann, M. D; et al. Genomic features of response to combination immunotherapy in patients with advanced non-small-cell lung cancer. Cancer Cell 2018, 33, 843–852.e4. [Google Scholar] [CrossRef] [PubMed]
- Bailey and MIIA Health Trust Manager, “Gene therapies offer breakthrough results but extraordinary costs,” Massachusetts Municipal Association (MMA), 18-Mar-2020. [Online]. Available online: https://www.mma.org/gene-therapies-offer-breakthrough-results-but-extraordinary-costs/ (accessed on 29 July 2022).
- Verma, V. et al.; et al. A systematic review of the cost and cost-effectiveness studies of immune checkpoint inhibitors. J. Immunother. Cancer 2018, 6, 128. [Google Scholar] [CrossRef]
- Kim, H.; Liew, D.; Goodall, S. Cost-effectiveness and financial risks associated with immune checkpoint inhibitor therapy. Br. J. Clin. Pharmacol. 2020, 86, 1703–1710. [Google Scholar] [CrossRef] [PubMed]
- Ding, H.; et al. Cost effectiveness of immune checkpoint inhibitors for treatment of non-small cell lung cancer: A systematic review. PLoS One 2020, 15, e0238536. [Google Scholar] [CrossRef]
- Iivanainen, S.; Koivunen, J. P. Possibilities of improving the clinical value of immune checkpoint inhibitor therapies in cancer care by optimizing patient selection. Int. J. Mol. Sci. 2020, 21, 556. [Google Scholar] [CrossRef]
- Dijkstra, K. K.; Voabil, P. T.; Schumacher, N.; Voest, E. E. Genomics- and transcriptomics-based patient selection for cancer treatment with immune checkpoint inhibitors: A review. JAMA Oncol. 2016, 2, 1490–1495. [Google Scholar] [CrossRef]
- Martins, F.; et al. Adverse effects of immune-checkpoint inhibitors: epidemiology, management and surveillance. Nat. Rev. Clin. Oncol. 2019, 16, 563–580. [Google Scholar] [CrossRef] [PubMed]
- CDC, “Current cigarette smoking among adults in the United States,” Centers for Disease Control and Prevention, 16-Mar-2022. [Online]. Available online: https://www.cdc.gov/tobacco/data_statistics/fact_sheets/adult_data/cig_smoking/index.htm (accessed on 29 July 2022).
Figure 1.
Diagram of PD-L1 and PD-1 binding; this PD-L1 and PD-1 binding process prevents the T-cell from killing the tumor cell.
Figure 1.
Diagram of PD-L1 and PD-1 binding; this PD-L1 and PD-1 binding process prevents the T-cell from killing the tumor cell.
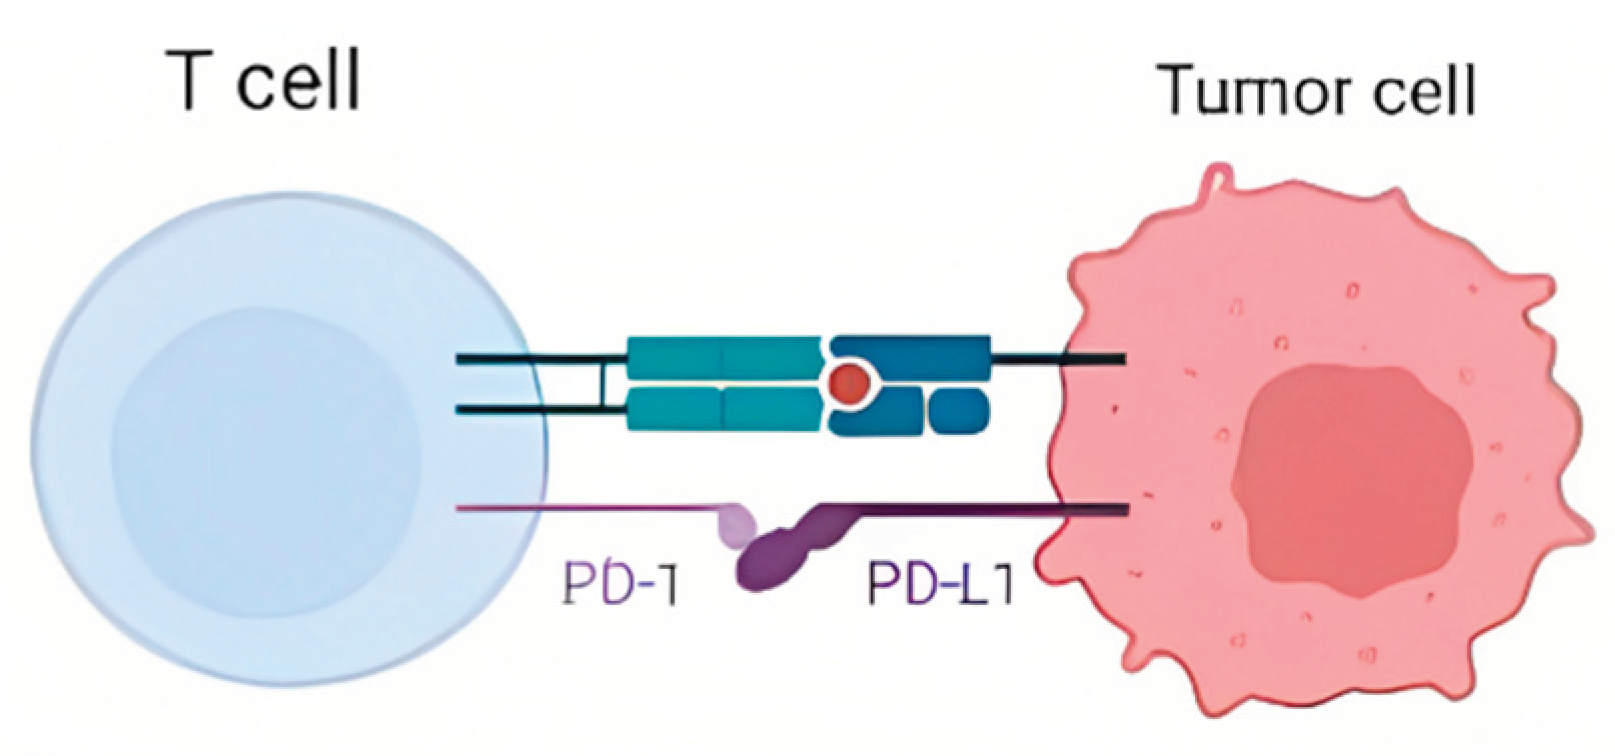
Figure 2.
Diagram of ICI preventing PD-L1 and PD-1 binding; the ICI binding to the PD-L1 protein allows the T-cell to attack the tumor cell.
Figure 2.
Diagram of ICI preventing PD-L1 and PD-1 binding; the ICI binding to the PD-L1 protein allows the T-cell to attack the tumor cell.
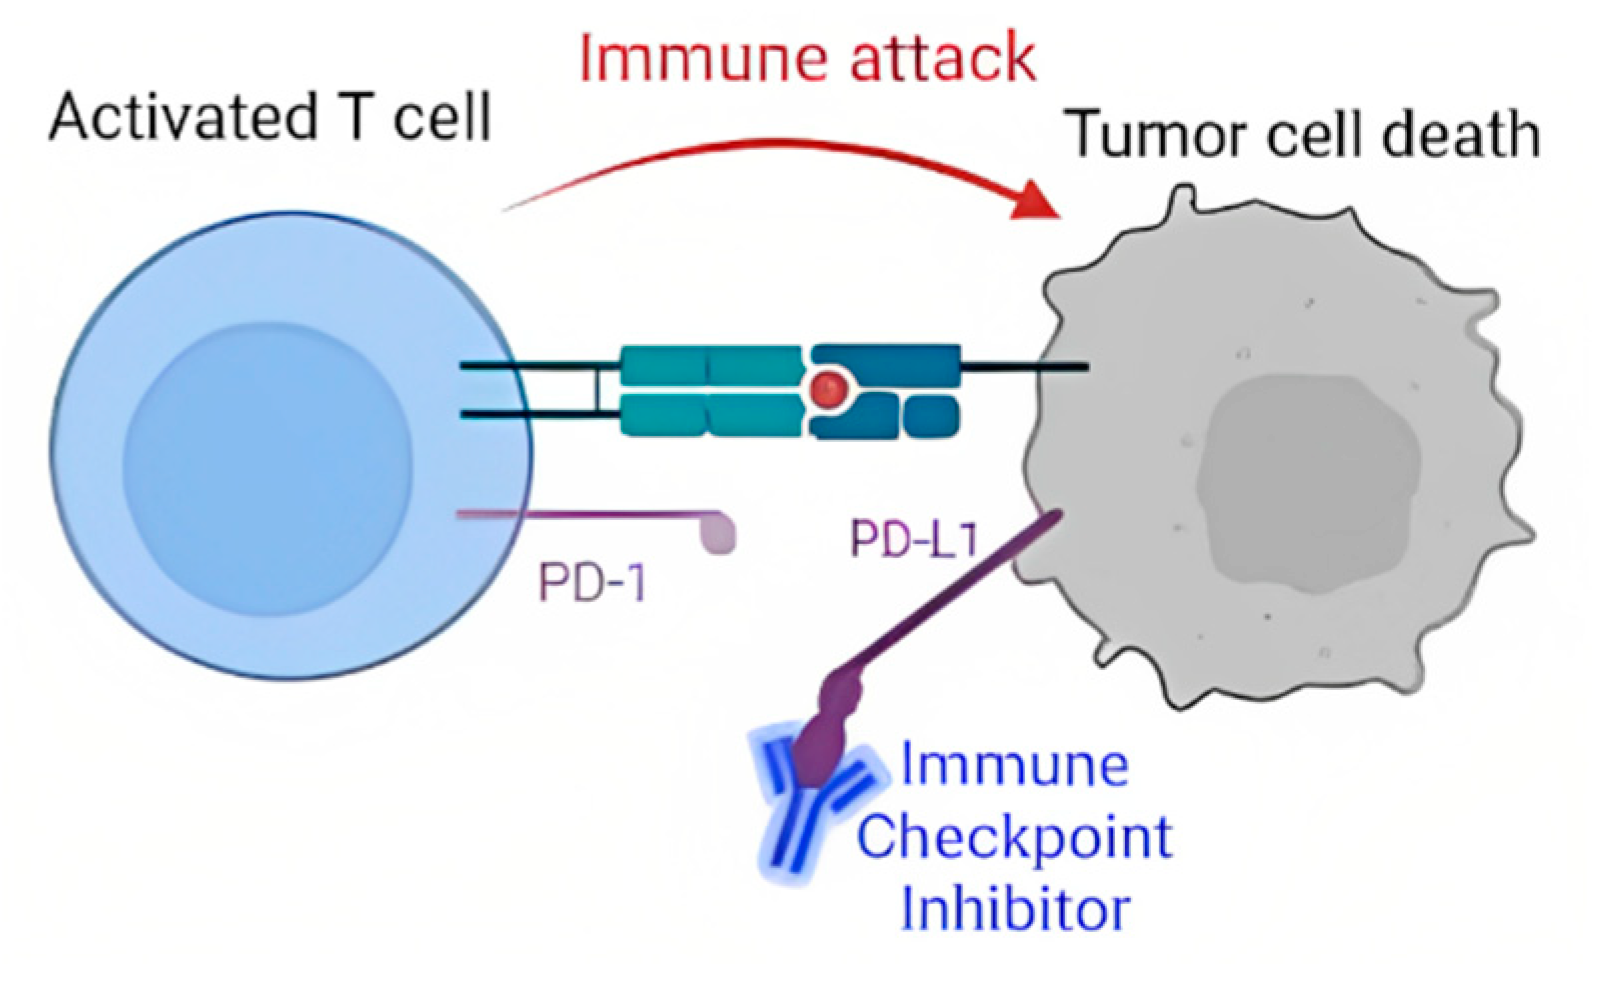
Figure 3.
Pie chart of patient age in the merged dataset; a large age range was represented in the merged dataset with most patients being between 50-70 years old.
Figure 3.
Pie chart of patient age in the merged dataset; a large age range was represented in the merged dataset with most patients being between 50-70 years old.
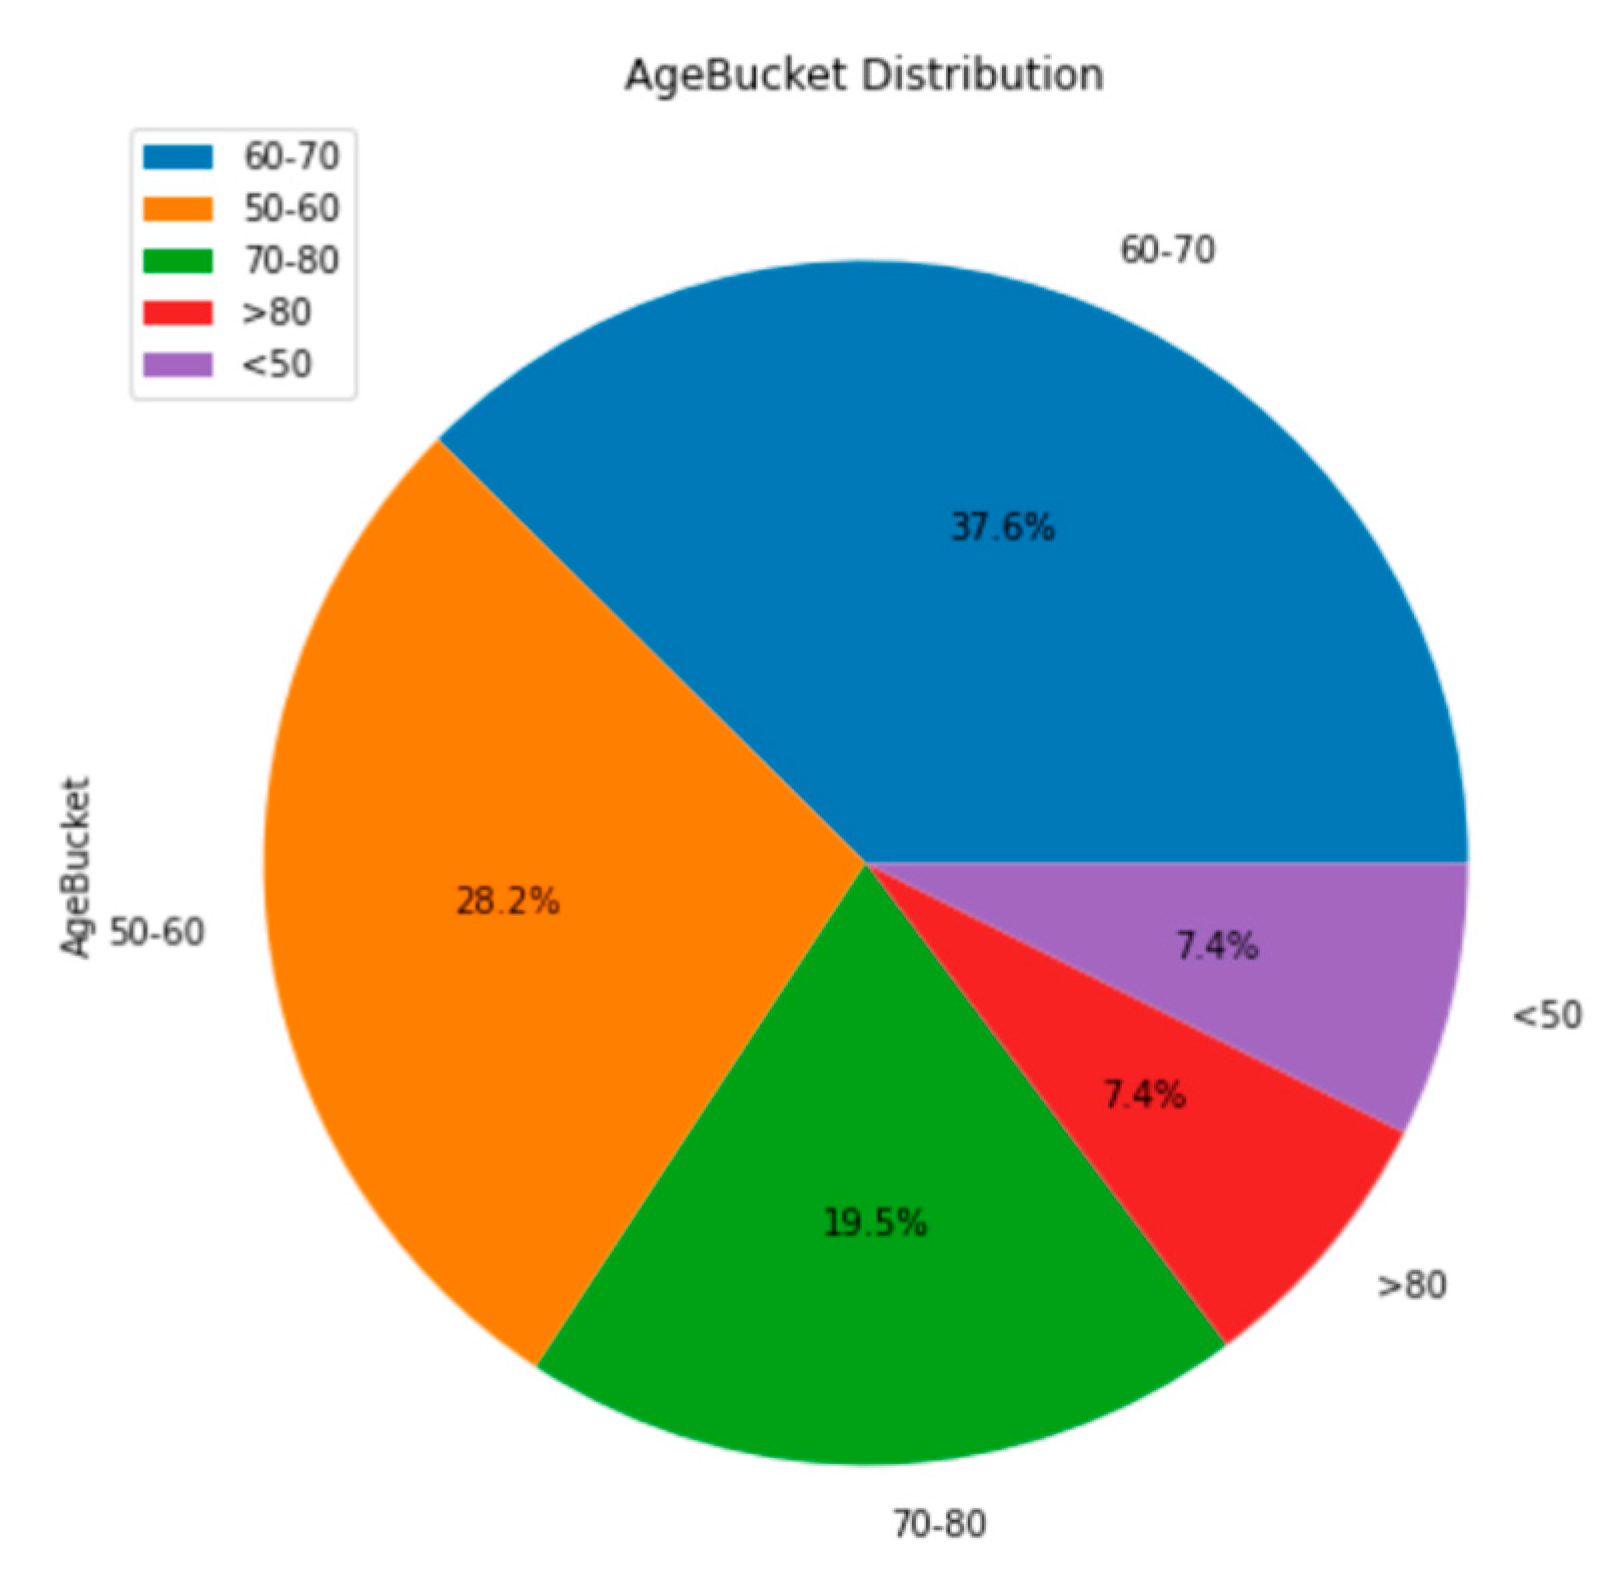
Figure 4.
Pie chart of clinical benefit for the merged dataset; about 40% of the patients received a clinical benefit from the treatment.
Figure 4.
Pie chart of clinical benefit for the merged dataset; about 40% of the patients received a clinical benefit from the treatment.
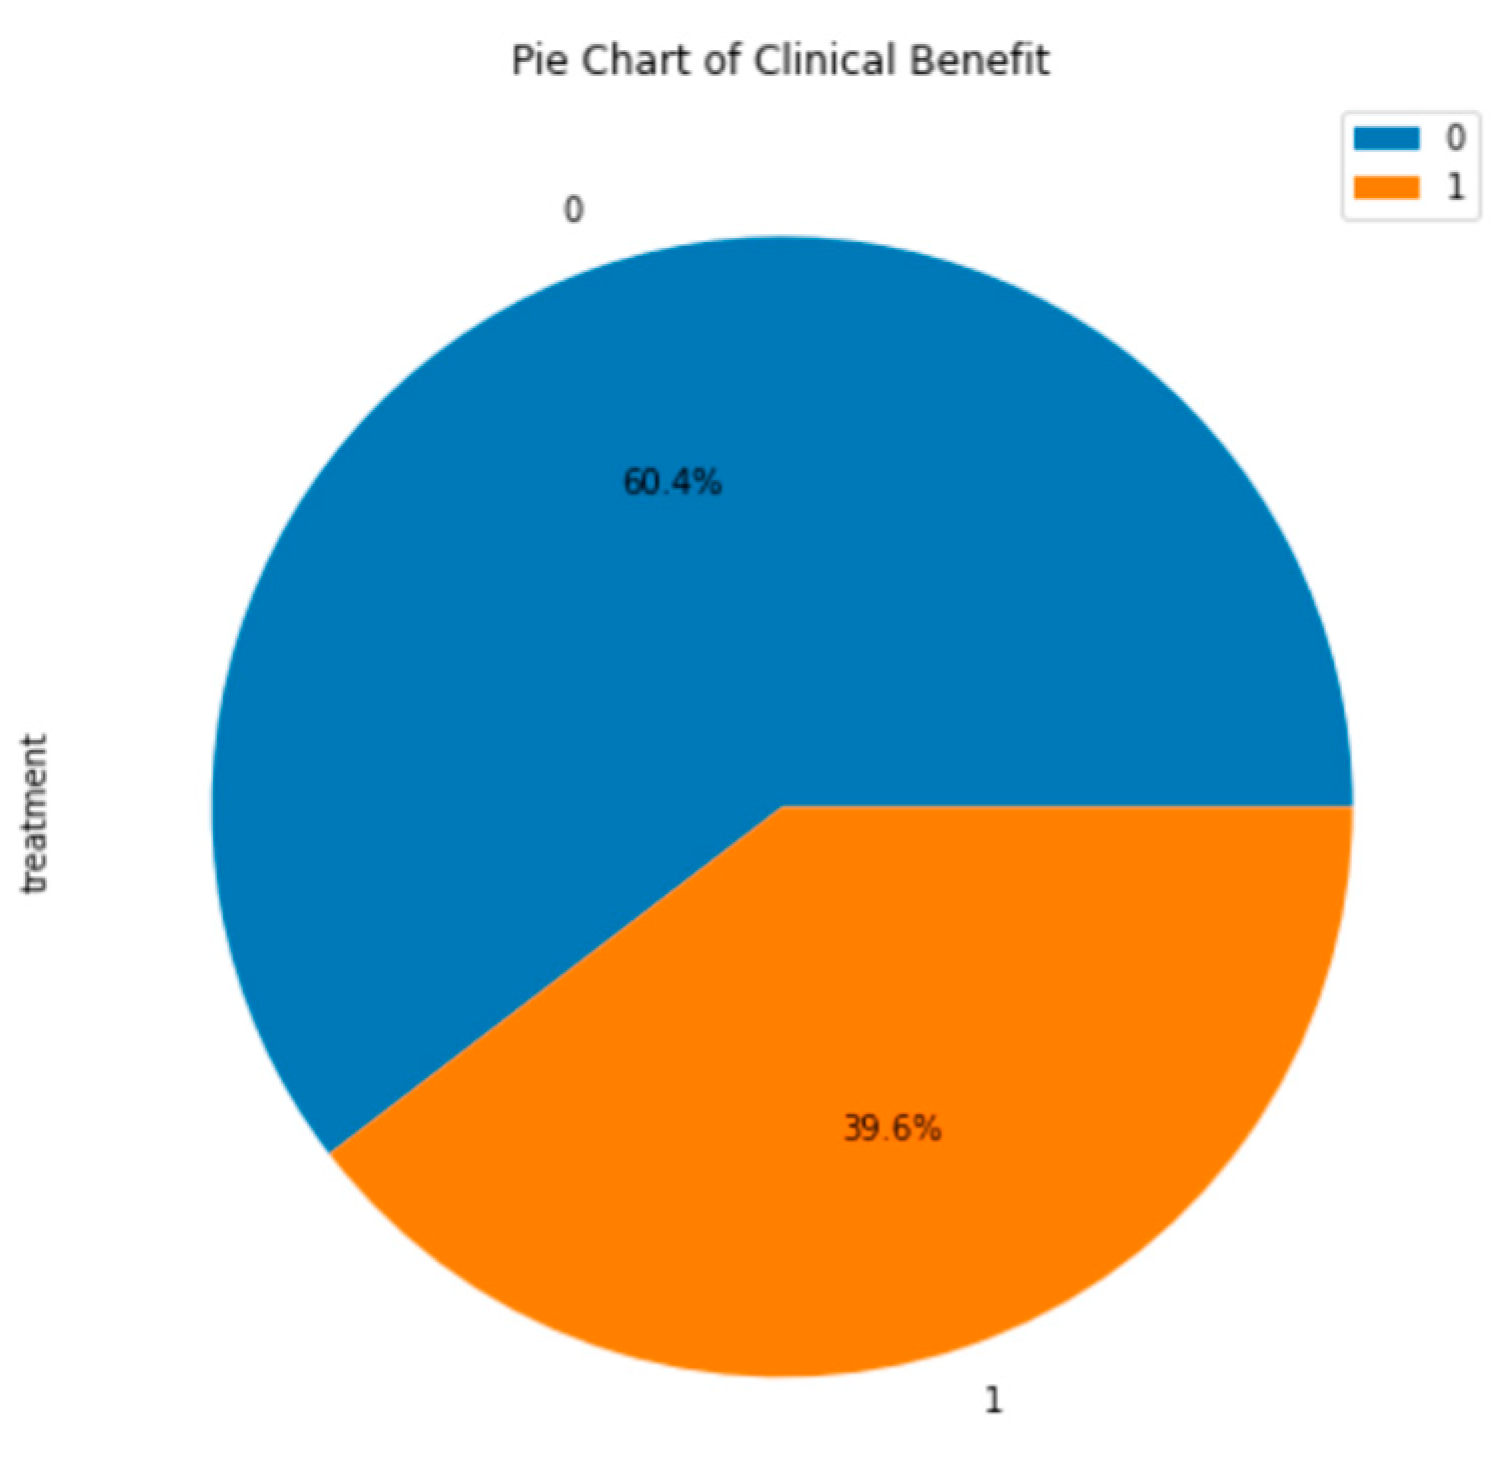
Figure 5.
Histogram of mutation count (MSK); this database includes outlier patients with mutation counts well over 600.
Figure 5.
Histogram of mutation count (MSK); this database includes outlier patients with mutation counts well over 600.
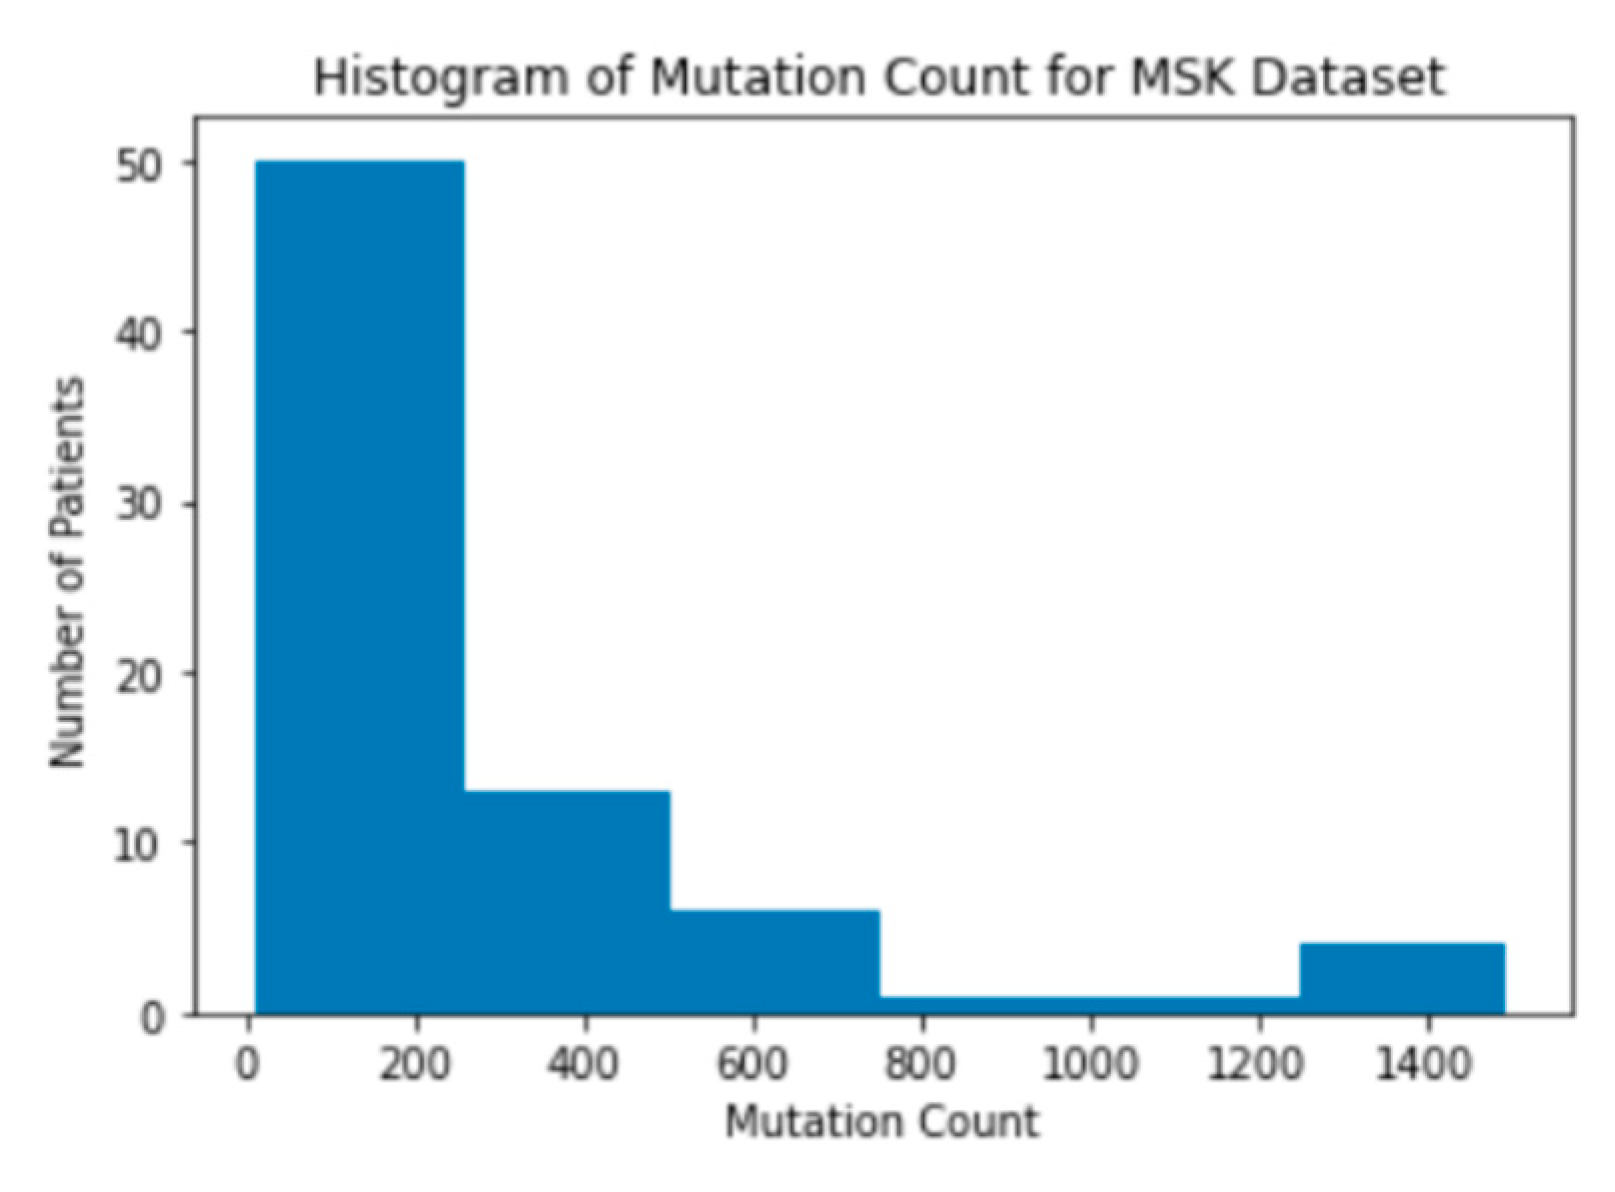
Figure 6.
Histogram of mutation count (MSKCC); this dataset does not include a patient with a mutation count above 100.
Figure 6.
Histogram of mutation count (MSKCC); this dataset does not include a patient with a mutation count above 100.
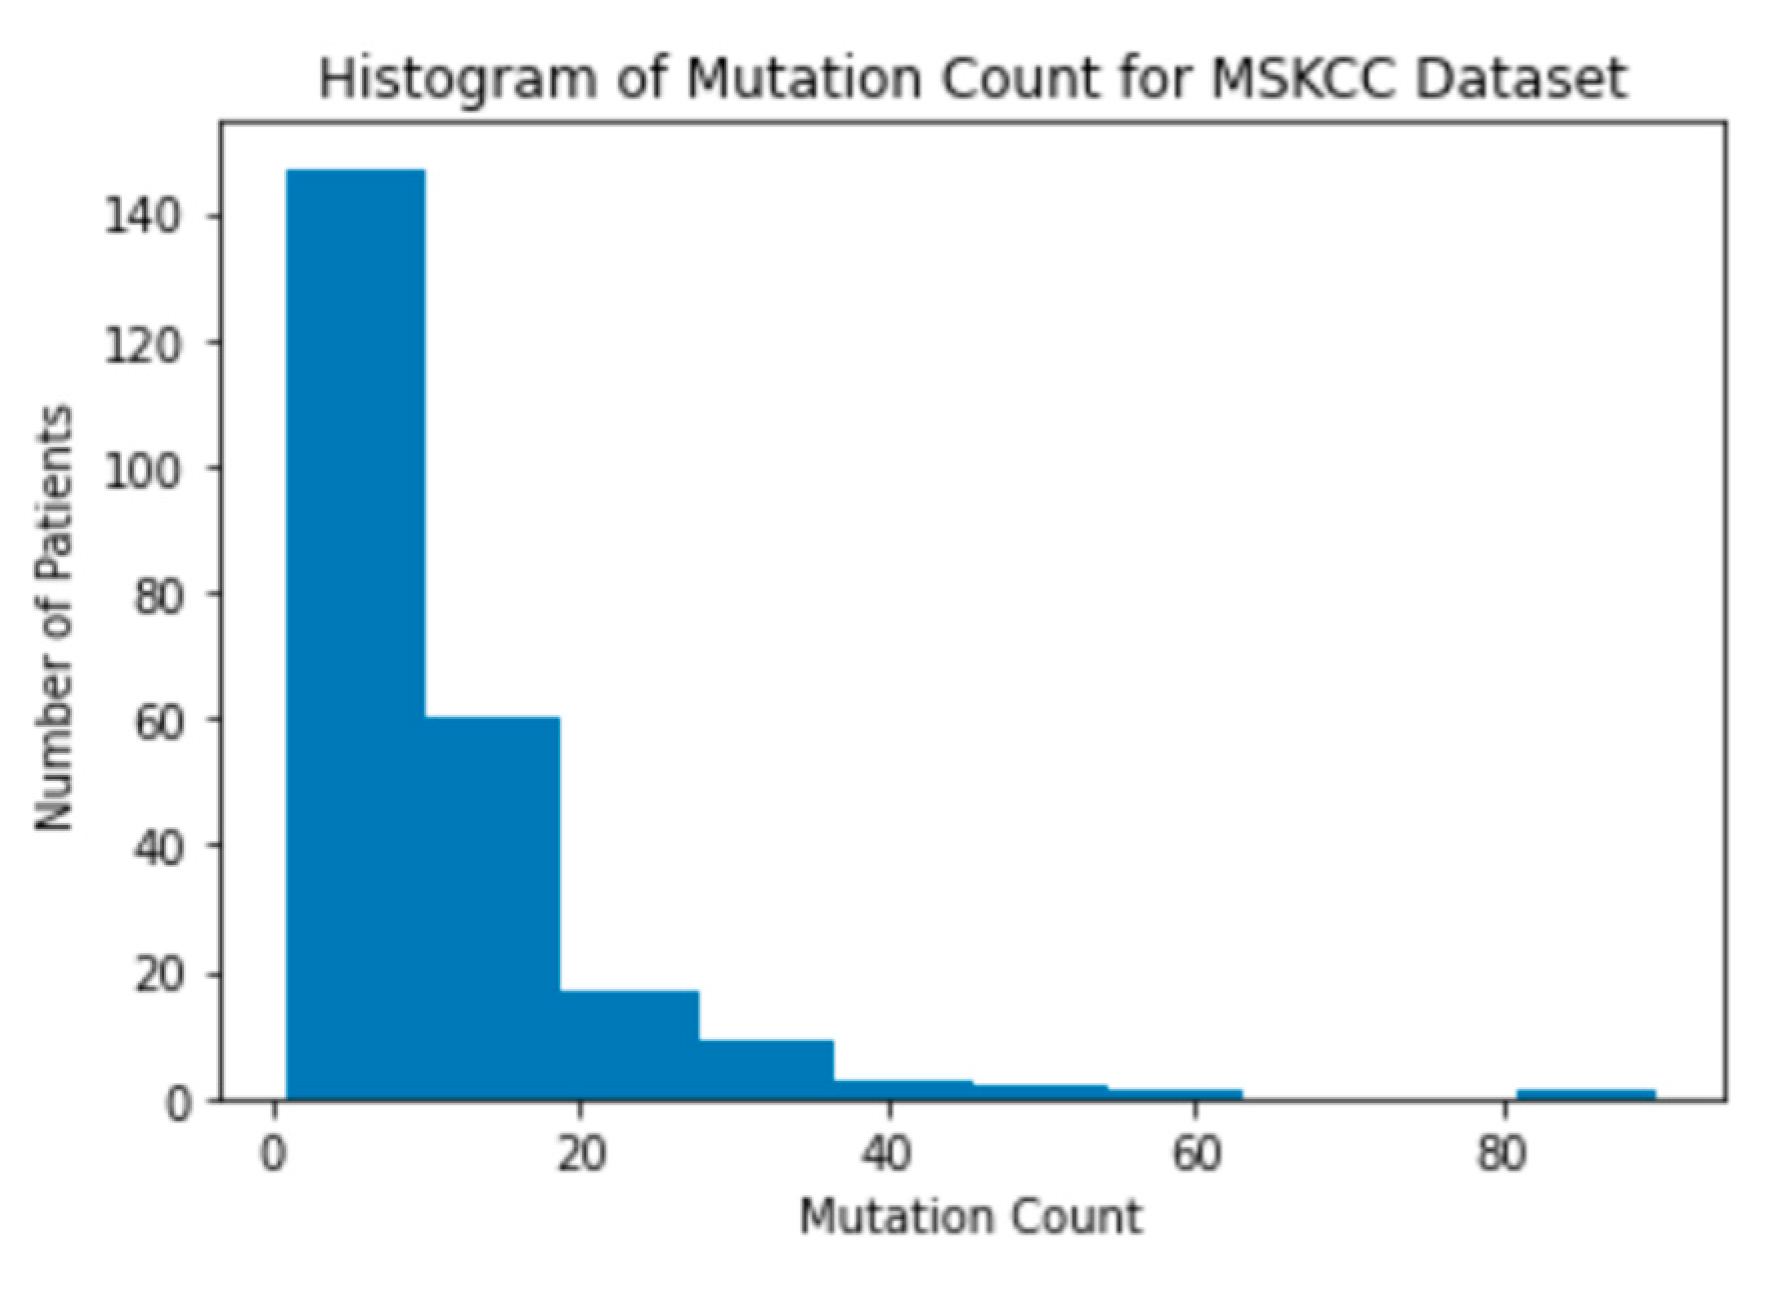
Figure 7.
Histogram of mutation count (merged); most mutations are clustered in the 0-200 range.
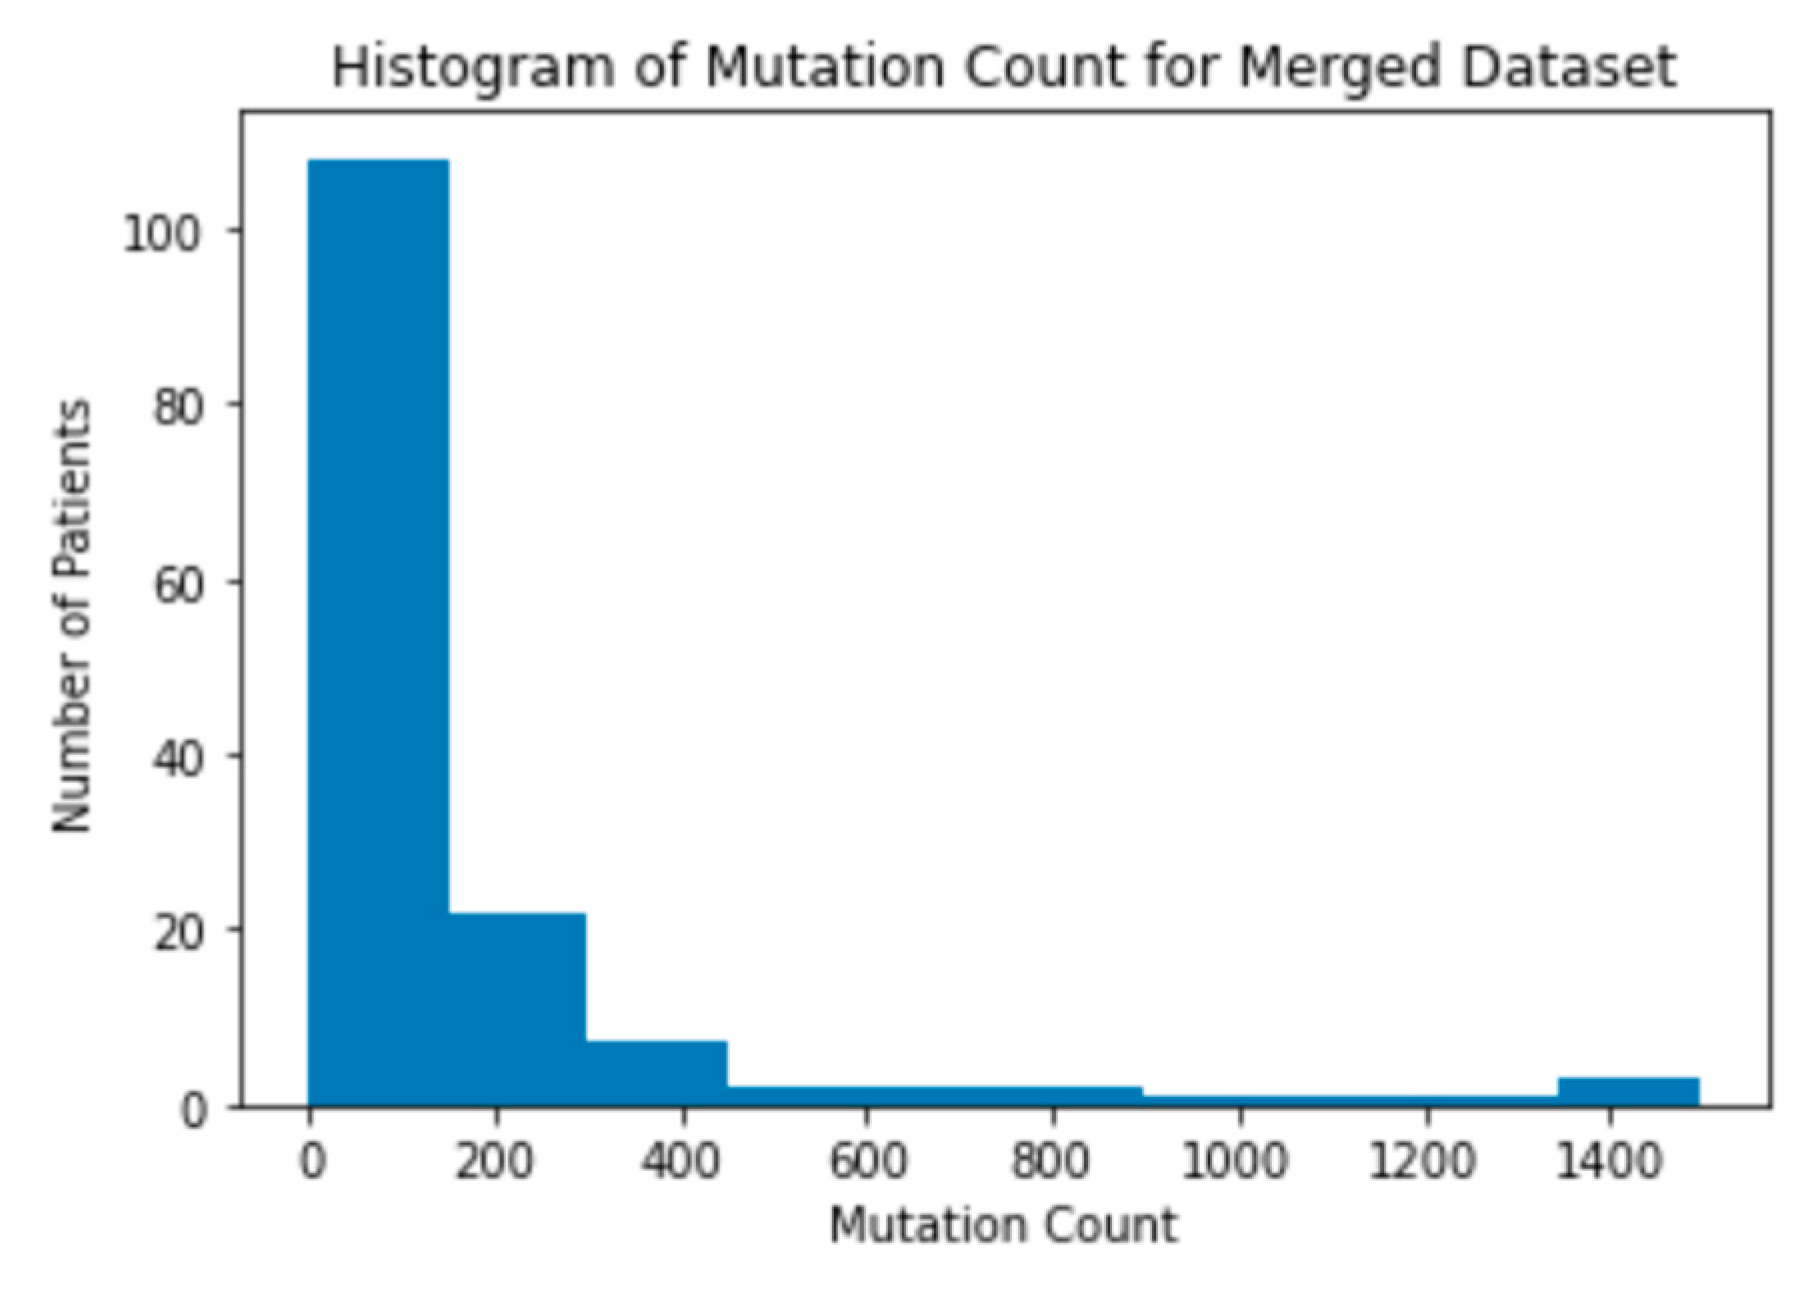
Figure 8.
Bar chart comparing clinical benefit and mutation count in the MSKCC dataset; patients with a clinical benefit had significantly higher mutation counts on average in the MSKCC dataset (p-value <0.001).
Figure 8.
Bar chart comparing clinical benefit and mutation count in the MSKCC dataset; patients with a clinical benefit had significantly higher mutation counts on average in the MSKCC dataset (p-value <0.001).
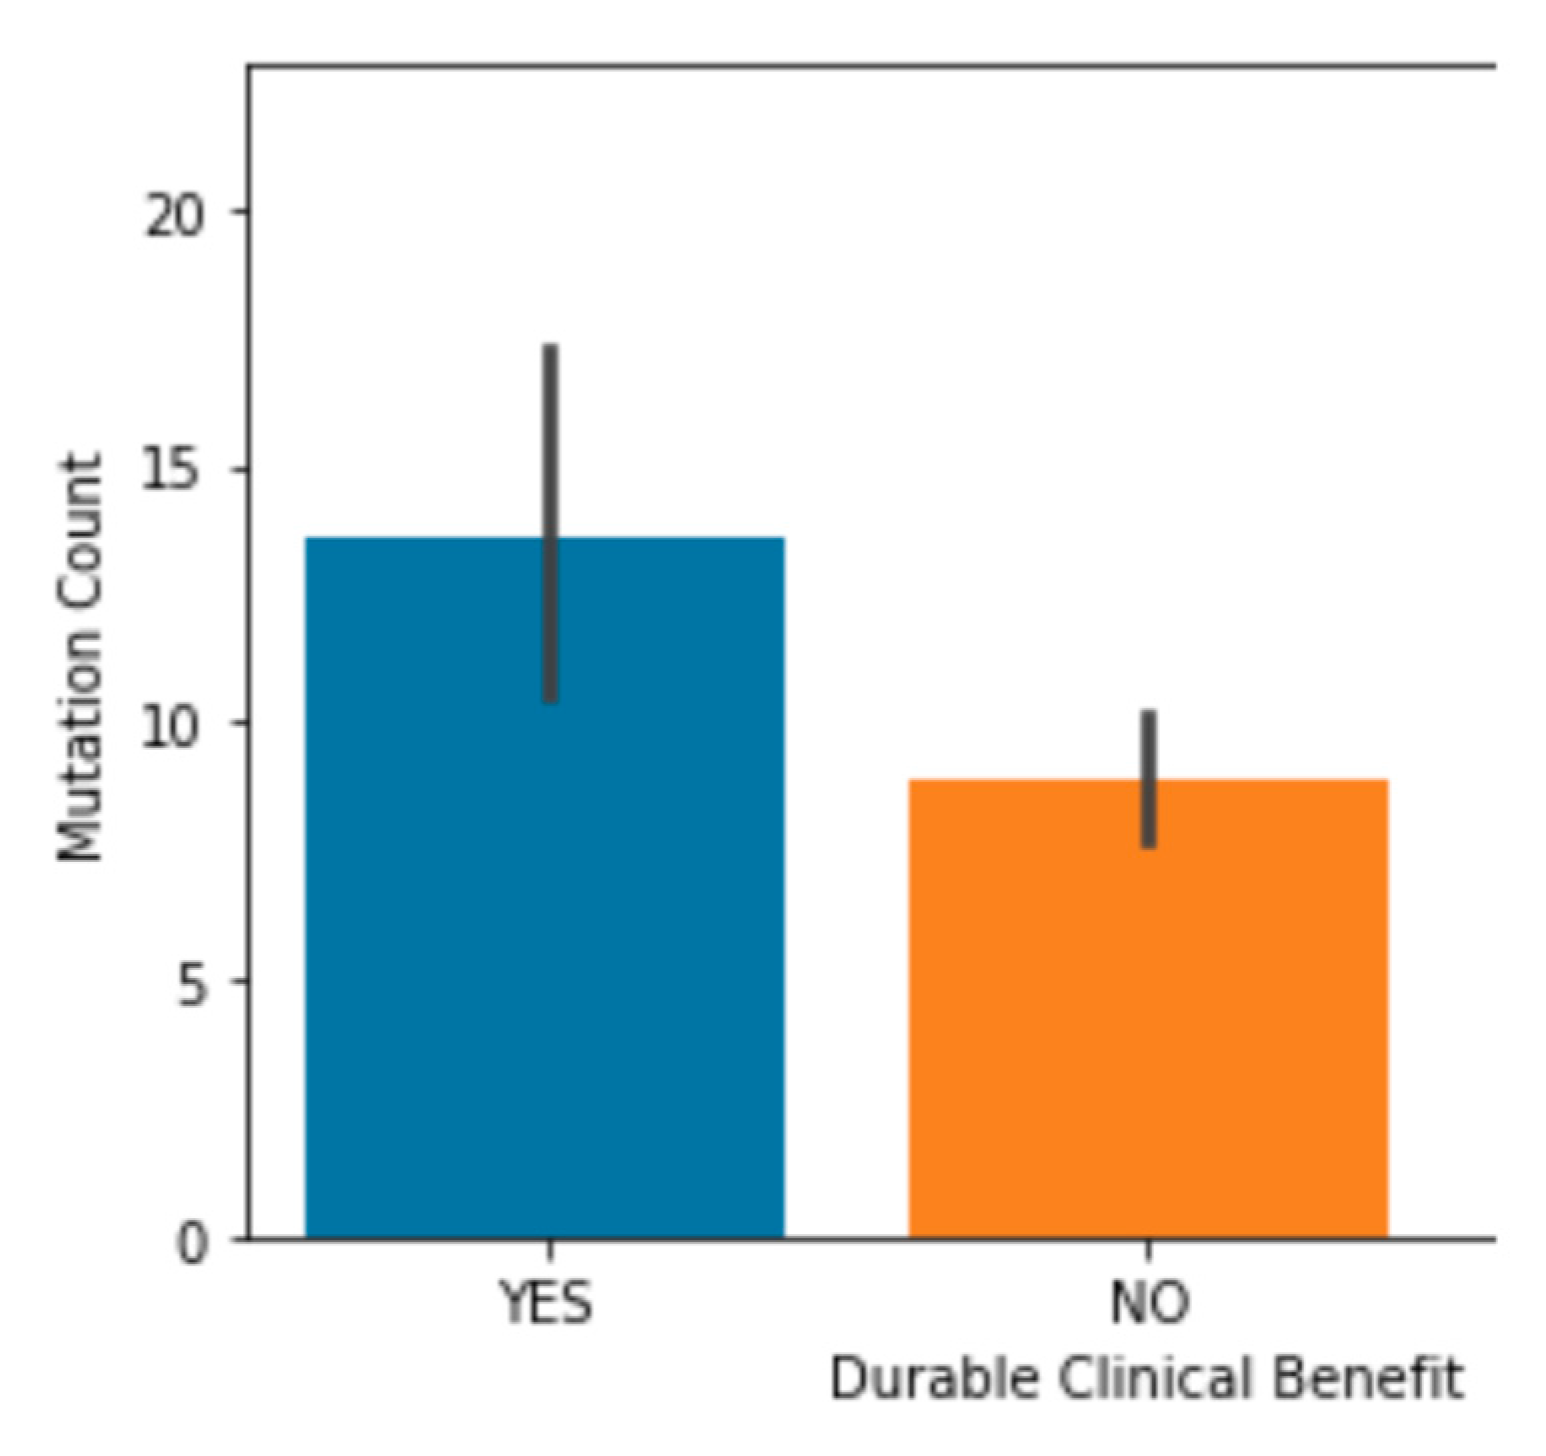
Figure 9.
Bar chart comparing clinical benefit and mutation count (merged); patients that received a clinical benefit (1) had significantly higher mutation counts on average in the merged dataset (p-value <0.001).
Figure 9.
Bar chart comparing clinical benefit and mutation count (merged); patients that received a clinical benefit (1) had significantly higher mutation counts on average in the merged dataset (p-value <0.001).
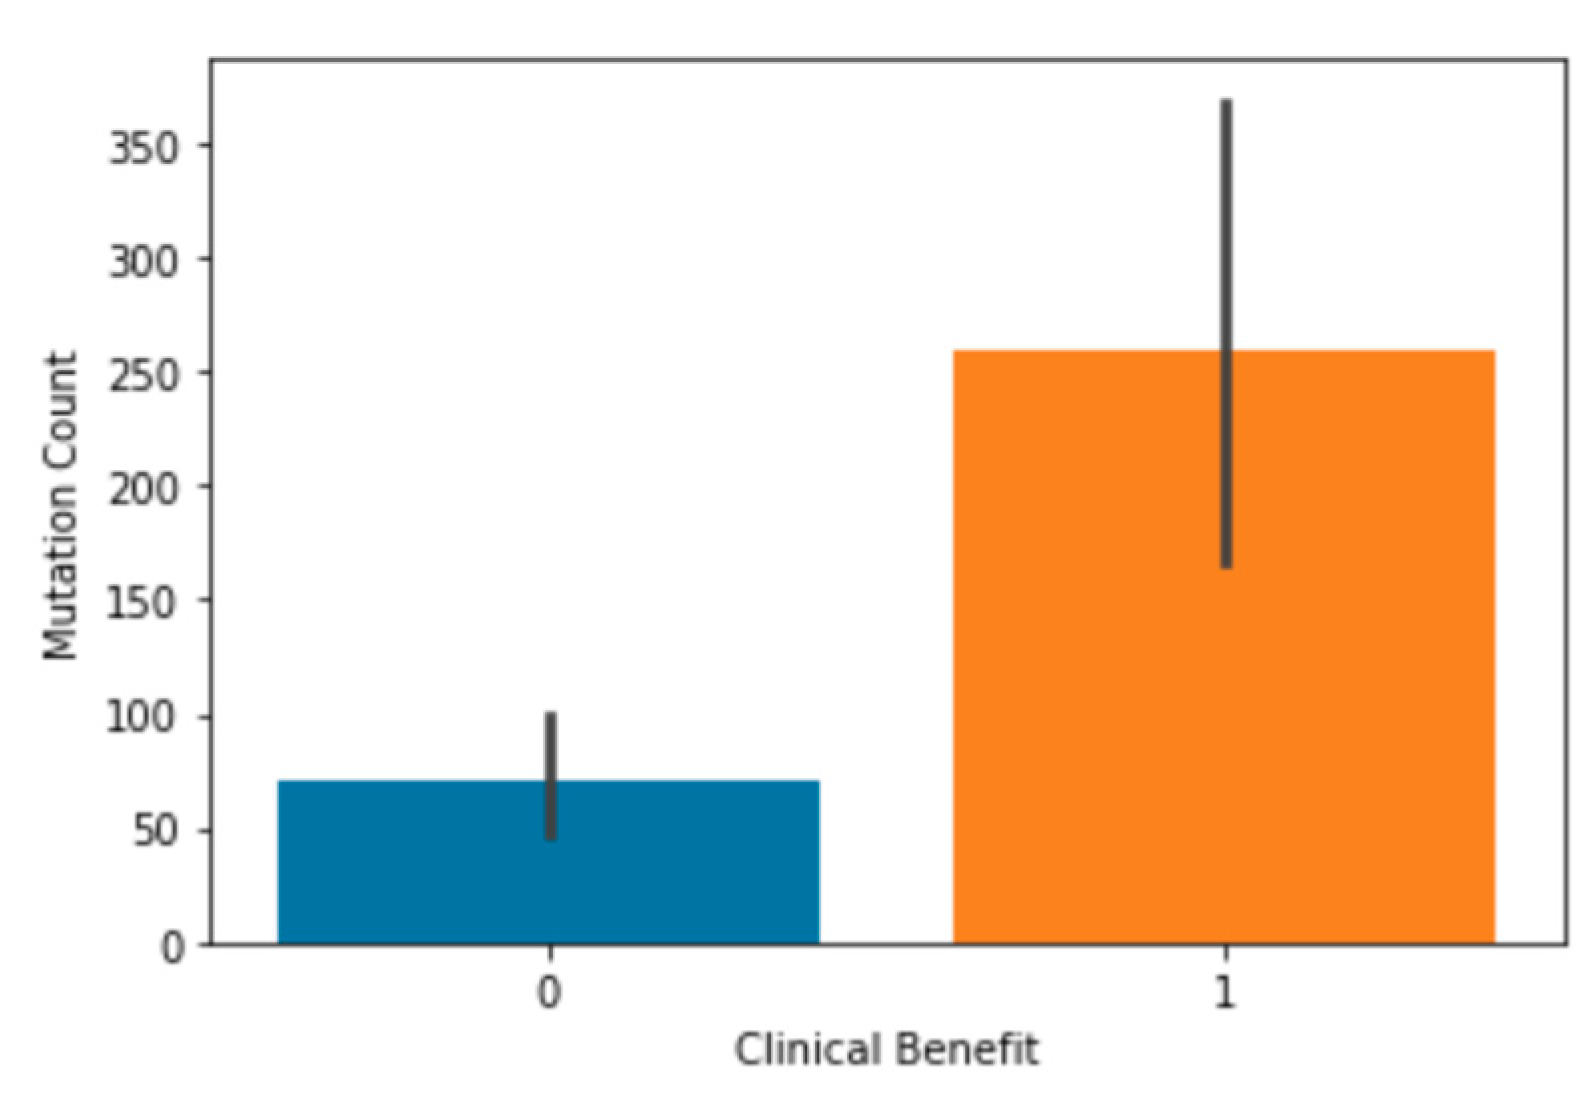

Table 1.
Correlation coefficient for machine learning features; the six highest correlation coefficients were used for the model, with the four highest being related to mutation counts in cancer cells.
Table 1.
Correlation coefficient for machine learning features; the six highest correlation coefficients were used for the model, with the four highest being related to mutation counts in cancer cells.
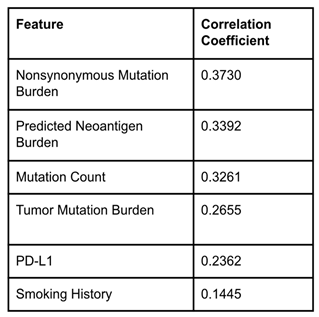 |
Table 2.
Comparing the accuracy of machine learning models on different datasets; all three models showed accuracy levels above 50% for all three datasets. The GNB and logistic regression models proved to be the most accurate on average.
Table 2.
Comparing the accuracy of machine learning models on different datasets; all three models showed accuracy levels above 50% for all three datasets. The GNB and logistic regression models proved to be the most accurate on average.
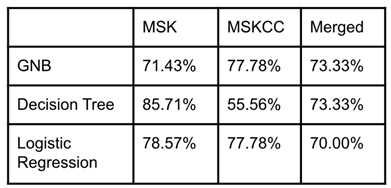 |
Table 3.
Comparing the LOOCV score (mean absolute error) of different models on different datasets; all three models were well fit to the datasets with low LOOCV scores, with the decision tree model being the least well fit of the three.
Table 3.
Comparing the LOOCV score (mean absolute error) of different models on different datasets; all three models were well fit to the datasets with low LOOCV scores, with the decision tree model being the least well fit of the three.
 |
Disclaimer/Publisher’s Note: The statements, opinions and data contained in all publications are solely those of the individual author(s) and contributor(s) and not of MDPI and/or the editor(s). MDPI and/or the editor(s) disclaim responsibility for any injury to people or property resulting from any ideas, methods, instructions or products referred to in the content. |
© 2023 by the authors. Licensee MDPI, Basel, Switzerland. This article is an open access article distributed under the terms and conditions of the Creative Commons Attribution (CC BY) license (http://creativecommons.org/licenses/by/4.0/).
Copyright: This open access article is published under a Creative Commons CC BY 4.0 license, which permit the free download, distribution, and reuse, provided that the author and preprint are cited in any reuse.


