Submitted:
04 July 2023
Posted:
04 July 2023
You are already at the latest version
Abstract
With the rapid development of the economy and the transformation of social contradictions, the economic development model in China has also changed, and a high-quality economic development model has been proposed. This paper uses the entropy method to measure the level of innovation and high-quality economic development in nine prefecture-level cities in Fujian Province from 2011 to 2020, and finds that the overall level shows an increasing trend year by year, but there are obvious regional differences. By constructing a grey correlation degree model, it is found that the innovation subsystem and the high-quality economic development are strongly correlated, the development level of innovation and the subsystem of high-quality economic development are both strongly correlated, the grey correlation degree from high to low is green, coordinated, shared, and livelihood, indicating that innovation has a significant impact on high-quality economic development. Based on the research results, countermeasures and suggestions are proposed to promote the coordinated development of innovation and high-quality economy.
Keywords:
high-quality economic development
; innovation
; entropy method
; grey correlation degree model
; Fujian Province
1. Introduction
On October 18, 2017, General Secretary Xi Jinping pointed out that “China’s economy has shifted from a stage of rapid growth to a stage of high-quality development”. The report of the 20th National Congress further proposed that “high-quality development is the primary task of building a socialist modernized country”. High-quality development can meet the growing needs of the people for a better life, it reflects the new development concept, which makes innovation the first driving force, coordination the endogenous characteristic, green the universal form, openness the inevitable way, and sharing the fundamental purpose. High-quality economic development is a stage-based breakthrough that takes place after economic development reaches a certain scale, it is a model that balances stability and health, it pursues economic growth while taking into account characteristics such as green, coordinated, and sustainable development in all aspects, it also aims to narrow the gap between the rich and the poor, making all people live happier and more fulfilling lives. High-quality economic development requires transformations from pursuing quantity to focusing on quality, from expanding scale to optimizing structure, and from factor-driven to innovation-driven. High-quality economic development mainly covers the following contents: (1) stable and sustained economic growth; (2) improved efficiency and quality of economic development; (3) industrial upgrading and optimization of industrial structure; (4) green economic development.
High-quality economic development model is driven by innovation, pursuing high quality and high efficiency, that is, to promote changes in economic development quality and power with innovation. Innovation is the process of combining knowledge elements with production elements, applying scientific and technological research to production practice, and improving social productivity. Innovation generally involves workers proposing improvements or new methods for production technology or management level, or high-level intellectuals proposing unprecedented important theories in some fields. Technological innovation can bring qualitative improvement to productivity, while theoretical innovation serves the technological level and provides guidance for technological breakthroughs, ultimately increasing social labor productivity and promoting rapid economic development. Innovation is an important driving force for high-quality economic development. In the initial stage of high-quality economic development, it is more necessary to lead economic power change, efficiency change, and quality change through innovation. Innovation can improve the combination of factors, increase the efficiency of resource allocation and utilization, and promote sustained and stable economic growth. Innovation can enhance the effects of various factors, improve productivity, and benefit the quality of economic development. Innovation can also develop new technologies, new services and products to achieve industrial upgrading and structural transformation. Innovation can achieve resource conservation and industrial greening, which promote the transformation of the development model from a high-emission, high-pollution model to a circular and environmentally friendly model.
In the past 40 years of reform and opening up, Fujian Province, as one of the frontier areas of this policy, has gradually strengthened its economic power and become one of the most economically dynamic provinces in China. From the perspective of high-quality development, Fujian Province ranks among the top in the country in terms of economic strength, green development, and other aspects, but it also faces some problems such as insufficient technological innovation, slow industrial upgrading, and large regional disparities. These development characteristics have certain universality and typicality in the country, therefore, an in-depth study of the high-quality economic development, especially researching the impact of innovation-driven high-quality development in Fujian Province, has an important practical significance for other provinces and cities in China.
This paper uses the relevant data of nine prefecture-level cities in Fujian Province from 2011 to 2020, constructs an evaluation index system, applies the entropy method to quantitatively measure the level of innovation and high-quality economic development in Fujian Province, and explores the regional development differences among the cities. Based on the theoretical derivation of the impact mechanism, this paper uses the grey correlation method to explore the relationship between innovation and high-quality economic development in Fujian Province. The analysis of this paper aims to provide theoretical guidance and tailored policy recommendations for Fujian Province, which could improve the level of innovation, promote high-quality economic development, and form an innovation-driven model.
There are three marginal contributions of this article: firstly, based on the theoretical research of development economics and combined with the economic development situation of Fujian Province, this paper constructs an index system of high-quality economic development from five dimensions: economic, green, shared, coordinated, and livelihood, then selects 15 secondary indicators for specific measurement. Secondly, according to the development of innovation in nine cities in Fujian Province, this paper divides innovation capabilities into two primary indicators: innovation input and output, and divides these two primary indicators into 5 secondary indicators, providing a comprehensive measurement to analyze innovation capability. Thirdly, by using the grey correlation analysis method, this paper calculates the grey correlation degree value between innovation and high-quality economic development in Fujian Province, and evaluates the impact of each subsystem.
The remainder of the article is organized as follows: the second section reviews the existing literature; the third section conducts stylized facts analysis of high-quality economic development and innovation in Fujian Province; the fourth section constructs evaluation systems of the two key factors; the fifth section carries out an empirical analysis; and the last section summarizes the conclusions and puts forward corresponding policy suggestions.
2. Literature review
Since the reform and opening-up policy, China’s economy has experienced rapid development for decades, however, problems have also emerged, such as the decline of the demographic dividend, the large gap in income distribution, and the loss of growth momentum [1,2]. In this context, the government has proposed to change the economic development model and implement a high-quality development strategy, shifting the development focus from total growth to structural adjustment [3,4,5]. Consequently, the issue of high-quality economic development has become a hot topic in the academic field [6,7]. Scholars have conducted research primarily from two aspects: the connotation of high-quality economic development, and the comprehensive evaluation methods of high-quality economic development. The interpretation of the connotation is built upon the earlier research on the quality of economic growth, Thomas [8] pointed out that the quality of economic growth should also cover aspects such as welfare distribution, ecological environment, risk resistance, and governance, Barro [9] included broader factors like life expectancy, environment conditions, political system, and religious beliefs. Scholars unanimously agree that the connotation of high-quality economic development is more abundant, including not only economic factors, but also other aspects of society [10,11,12], it can be summarized as lower costs, higher levels, and more sustainable development which is greener and more coordinated [13].
In terms of the quantitative measurement of high-quality economic development, some scholars use single indicators, such as per capita GDP, green total factor productivity, Solow residual, and contribution of technological progress to economic growth, etc. [14,15]. These literature has laid the foundation for subsequent research on high-quality economic development, but a single indicator could only reflect one aspect of economic development, and cannot fully reflect the connotation of high-quality development. Therefore, an increasing number of scholars have begun to pay attention to multiple indicators, measuring from different aspects. Chao et al. [16] constructed an indicator evaluation system for the economic development quality from the aspects of economic model, resource sharing, and green environment; Yang [15] constructed an evaluation index system based on the five development concepts: innovation, coordinate, green, open and sharing; Nie and Jian [17] evaluate the high-quality development level of provincial regions from product and service quality, economic benefits, social benefits, ecological benefits, and economic operation status. With the gradual implementation of the new development concept, the key foundations for China’s high-quality economic development are innovation, coordination, green, openness, and sharing [18], Li and Wang [19] used the five development concepts as important evaluation dimensions for economic development, and compared the high-quality development of Jiangsu Province with several other provinces; Kong et al. [20] also used a similar system to evaluate the high-quality development of cities along the Yangtze River Economic Belt. It is worth mentioning that most literature used the entropy value method or entropy weight TOPSIS (Technique for Order Preference by Similarity to an Ideal Solution) method in the evaluation.
As one of the main driving forces of economic growth, innovation has received much attention from economists [21,22]. Gibson et al. [23] found that innovation is the main driving force to enhance regional competitiveness and promote regional economic development. Jalles [24] found a positive correlation between innovation-driven and various factor productivity of production units. In terms of the measurement indicators of innovation, some scholars used a single direct or indirect indicator to evaluate innovation [25], such as Freeman et al. [26] selected the index of STI (Science, Technolgy, and Innovation), Klomp et al. [27] chose the input and output of innovation, and Leten [28] used the number of new products as the evaluation indicator to study innovation. Grupp et al. [29] suggested using a comprehensive evaluation method to measure innovation, while Zhao et al. [30] selected five dimensions of innovation input, potential, environment, output, and contribution, Hua and Hu [31] chose five dimensions of R&D investment, scientific and technological achievements, talent reserves, technology diffusion, and achievement transformation. In terms of research methods, Zhang et al. [32] used the grey correlation analysis method, Objective weighting and cluster analysis, Zhang [33] adopted the AHP entropy weight method to conduct empirical research on China’s technological innovation capabilities.
In terms of the correlation between high-quality economic development and innovation, scholars believe that innovation can promote high-quality economic development [34], especially the progress of core technological innovation [35], innovation is not considered as one of the main driving forces of economic growth [36,37,38], but also the key driver of high-quality economic development. In empirical research, Chen and Zhuansun [39] found there is a coupling coordination relationship between innovation and high-quality economic development; Wang et al. [40] used the network WSBM (Weighted Stochastic Block Model) method to calculate the performance level of innovation-driven high-quality economic development in China; Xiao [41] constructed an index system based on data from 30 provinces in mainland China, and found that there is a mutually reinforcing effect between innovation and high-quality economic development; Ran [42] found that innovation capability represented by technological complexity can significantly promote regional high-quality economic development. Xiao et al. [43] analyzed the relationship between the Economic Development Quality Index (EDQI) and the Innovation-Driven Index (IDI) using the entropy method, and the results showed that China’s innovation-driven strategy has played an important role in the quality of economic development.
Through literature review, it could be found that high-quality economic development is a pattern of economic development, which includes multiple influencing factors. There is no unified standard for evaluation system, but the method based on multiple major concepts is more common. Various researches have proved the strong correlation between China’s innovation and high-quality economic development, but most of the current research objects are concentrated at the national level, provincial level, or regional level of China, and there is still a lack of research on specific provinces. Therefore, this paper uses the entropy method and grey correlation analysis, which are commonly used, to study the regional and correlational characteristics of innovation and high-quality economic development in nine prefecture-level cities in Fujian Province, aiming to provide theoretical guidance and policy recommendations for better development.
3. Stylized facts of high-quality economic development and innovation in Fujian Province
3.1. The situation of high-quality economic development in Fujian Province
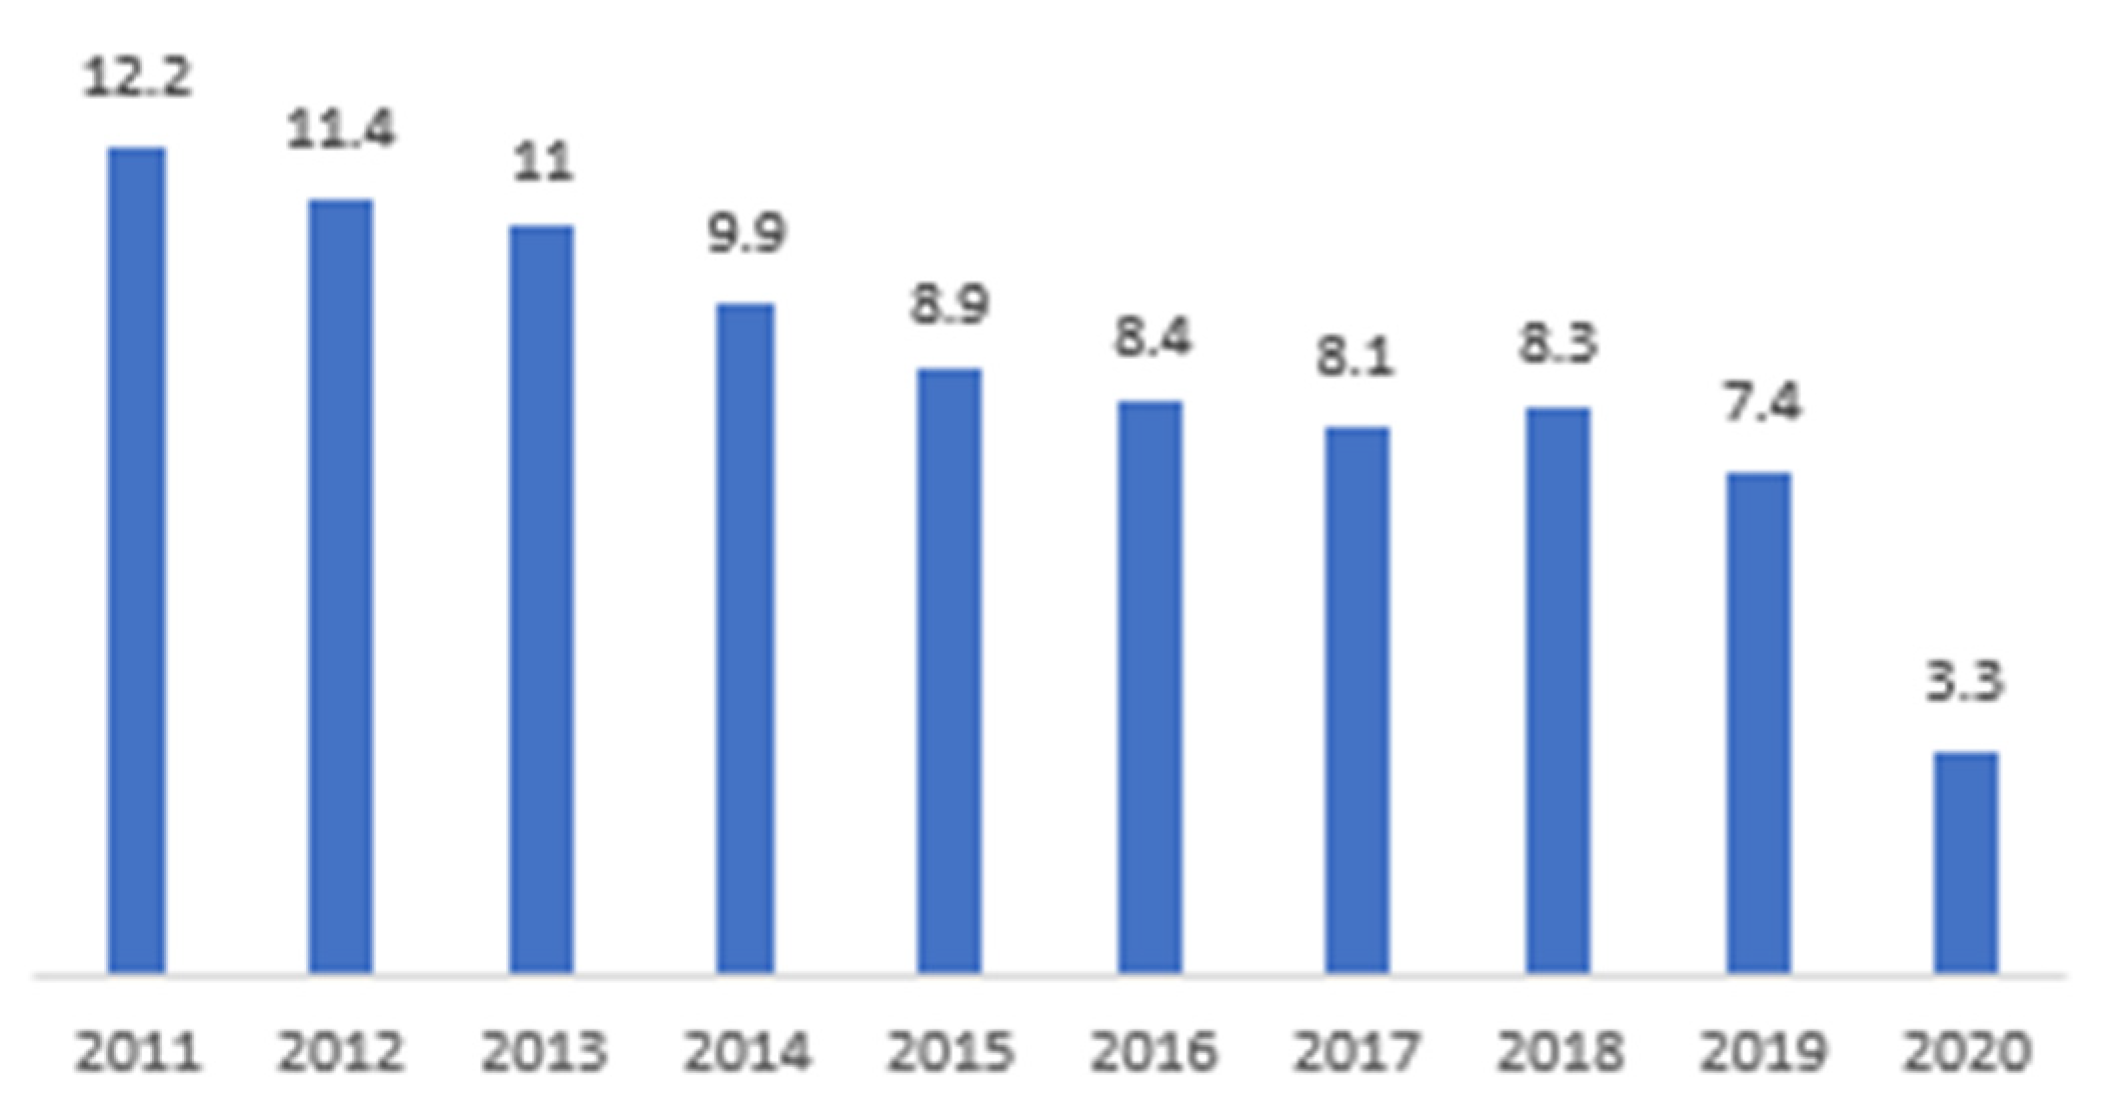
In recent years, the overall economic growth trend of Fujian Province has changed, it has entered a stable growth stage, which is a prerequisite for achieving high-quality economic development. During 2011-2020, the real GDP growth rate of Fujian Province had changed in magnitude, but overall maintained stable growth. The real GDP growth rate of Fujian Province was relatively high from 2011 to 2014, while it changed little and was relatively stable from 2015 to 2019, and affected by the epidemic, the real GDP growth rate in 2020 was relatively low.
Figure 1.
The actual GDP growth rate (%) of Fujian Province. Data source: compiled according to the "Statistical Yearbook of Fujian Province", and it will be the same in the following context.
Figure 1.
The actual GDP growth rate (%) of Fujian Province. Data source: compiled according to the "Statistical Yearbook of Fujian Province", and it will be the same in the following context.
With the stable growth of the overall economy, the proportion of various industries in Fujian Province has also changed accordingly. As shown in Table 1, during 2011-2020, the industrial transformation of Fujian Province has changed significantly, the proportion of the primary and secondary industries has gradually decreased, while the proportion of the tertiary industry has gradually increased, indicating that the composition and structure of economic development in Fujian Province has been significantly optimized.
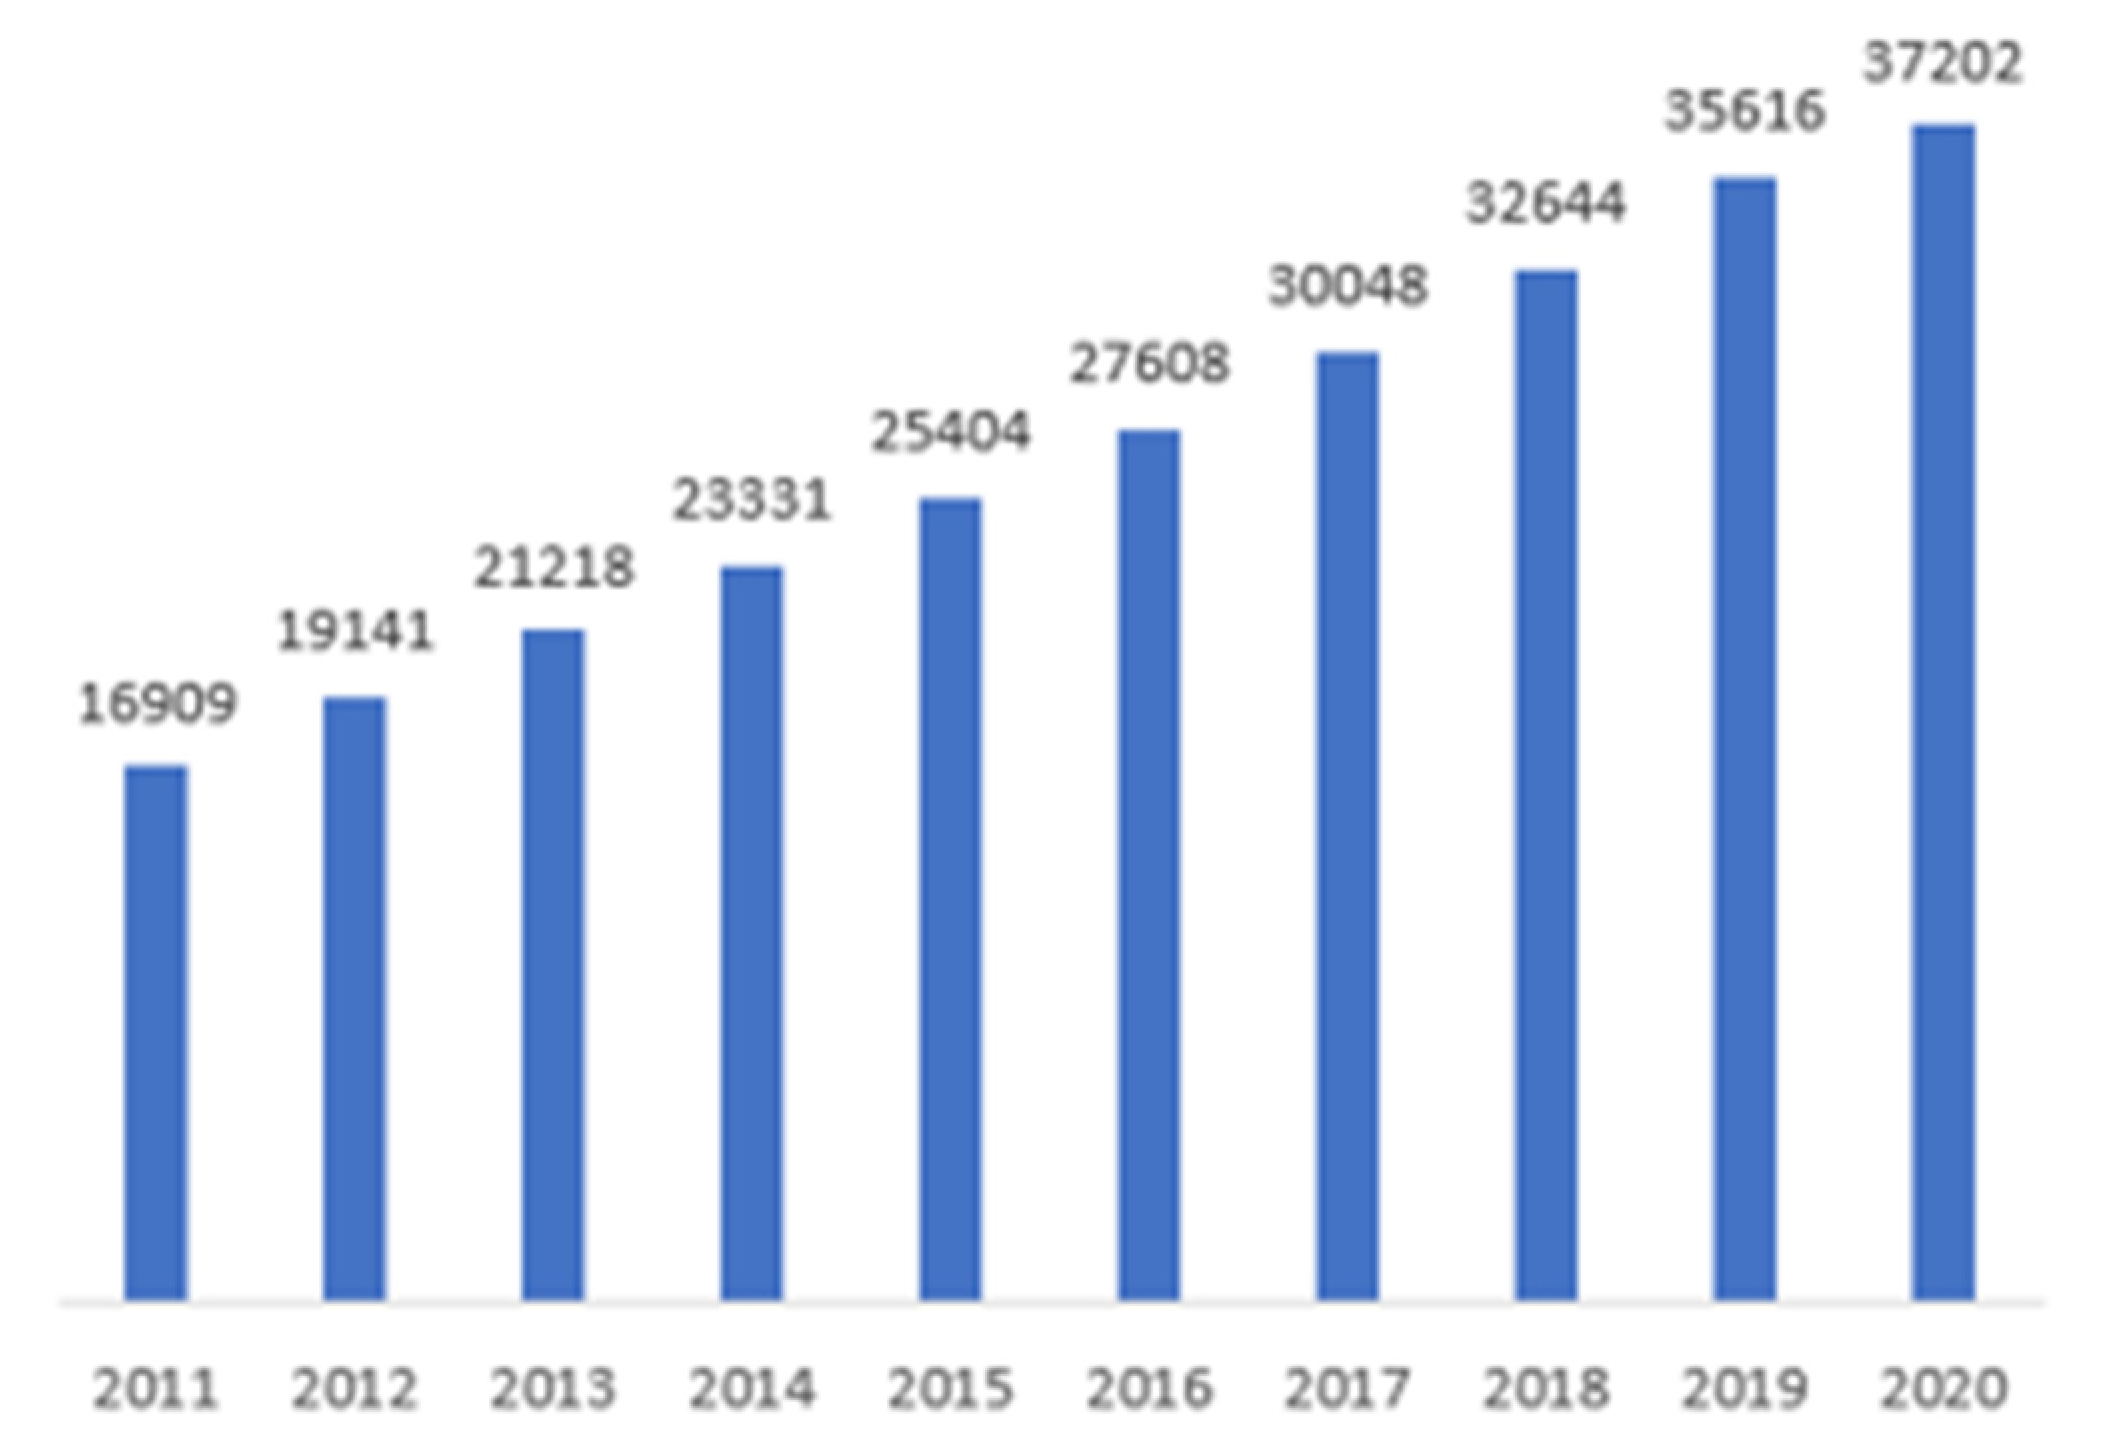
During 2011-2020, the per capita disposable income of Fujian Province increased steadily, compared with 2011, the per capita disposable income of Fujian Province residents had doubled by 2020. This shows that during the transformation of the development model, economic growth has increased people’s economic income, improved people’s living standards, and brought tangible and reliable benefits to the people.
Figure 2.
Per capita disposable income (yuan) of Fujian Province Residents.
3.2. The situation of high-quality economic development in various prefecture-level cities
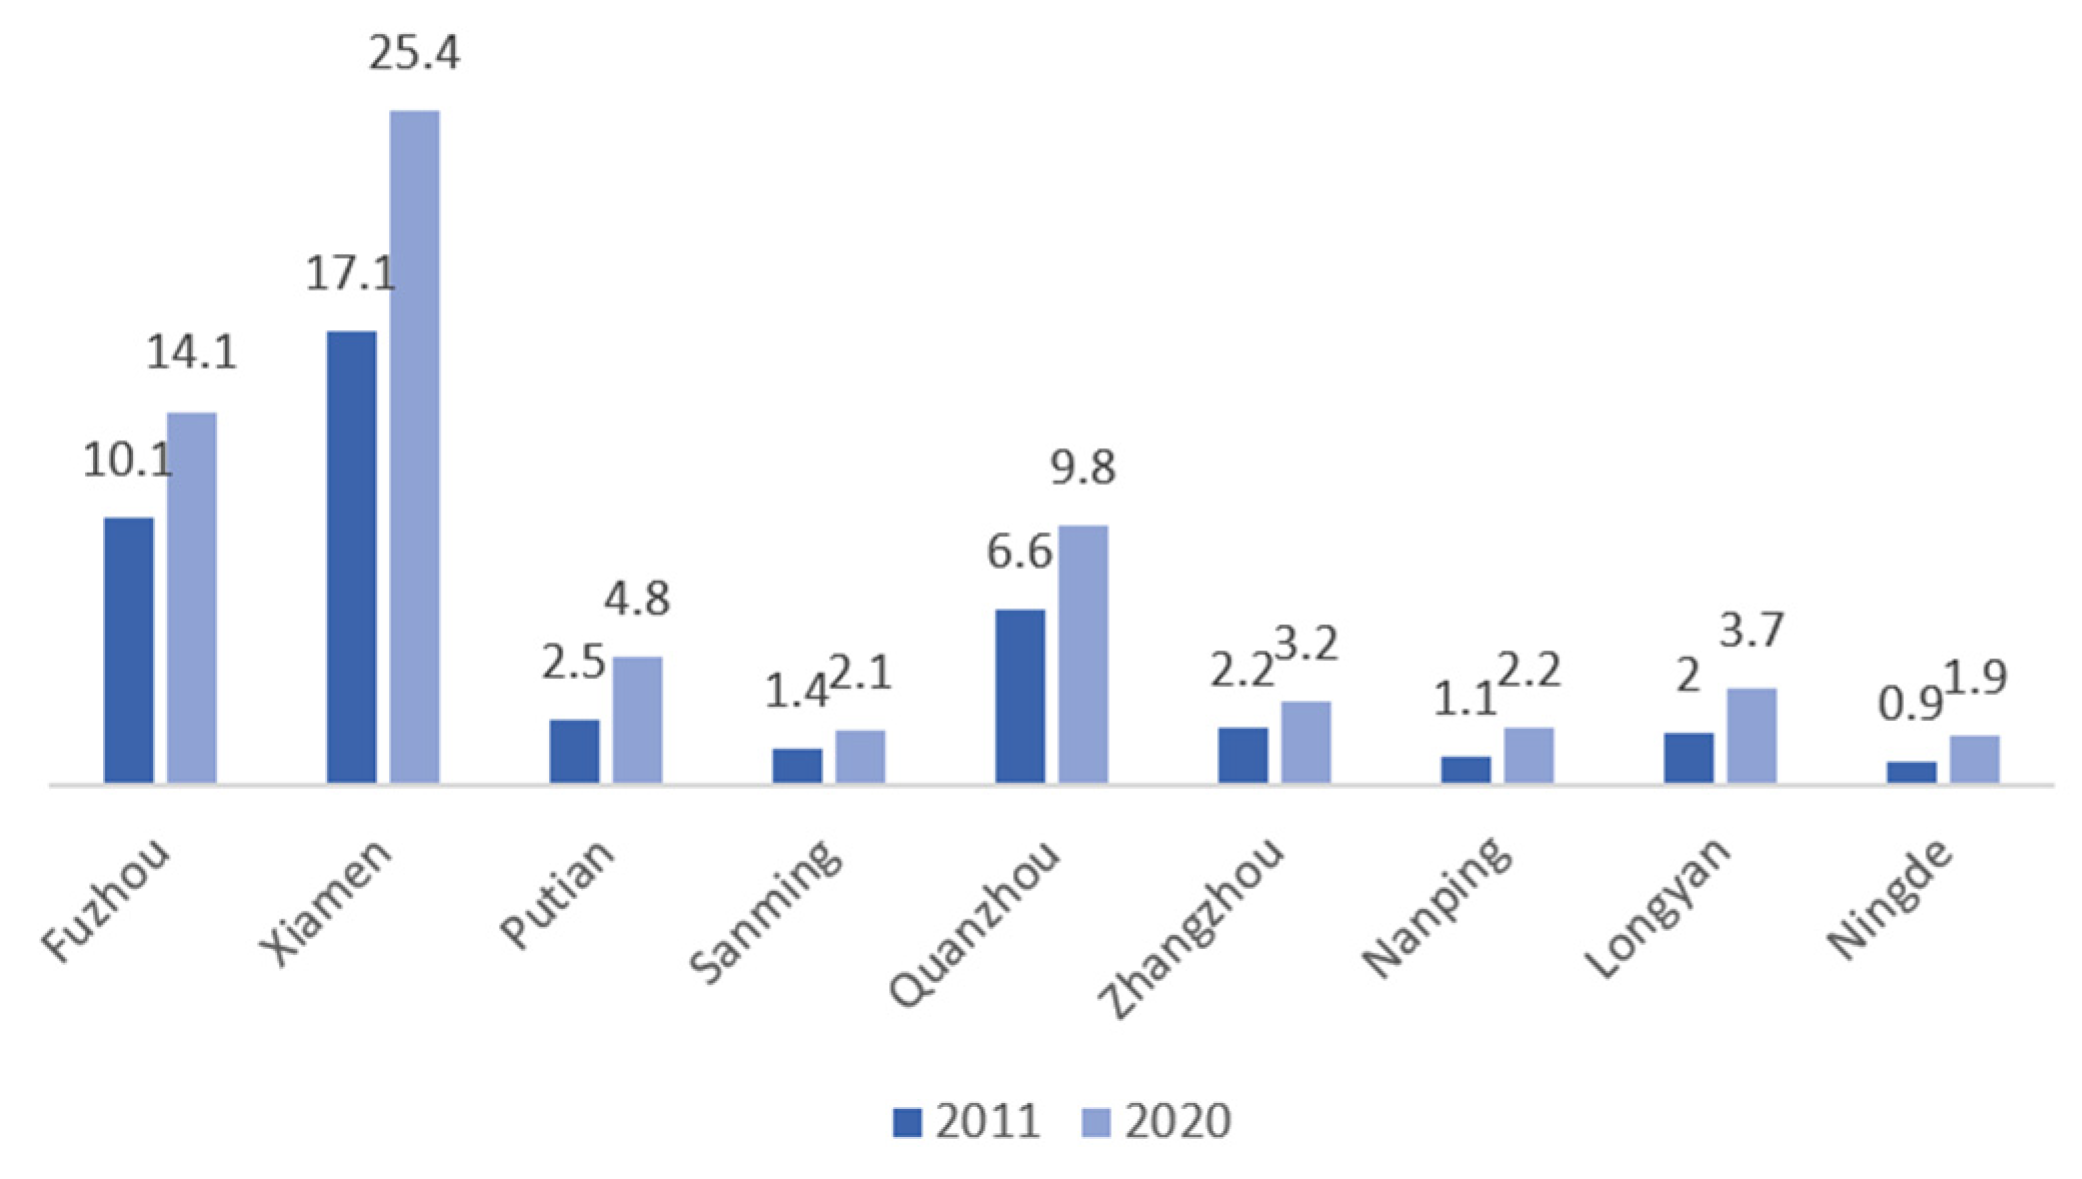
High-quality economic development no longer only takes aspects related to quantity, such as economic growth rate and scale, as the main basis for consideration, but also pays more attention to the improvement of economic development quality. In the process of high-quality development, it is necessary to give more priority to developing areas related to people’s happy life. Due to the different focus, the economic growth rate at this time will not be faster than before, but the quality of people’s lives will be effectively improved. As can be seen from Figure 3 to Figure 5, the GDP of cities in Fujian Province has increased significantly in 2020, although the GDP growth rate declined, factors related to people’s happy life, such as per capita disposable income and green coverage area, have been vigorously developed.
In addition, it can be preliminarily seen from the figures that there are significant regional differences among the nine cities in Fujian Province. The economic development of Fuzhou, Xiamen, and Quanzhou is better, and their quality of economic development is far better than that of other cities. Therefore, it can be inferred that the basis for high-quality economic development is a certain level of the economic development of a city, when people’s lives are rich and material conditions are sufficient, it is easier to drive the economy towards high-quality development.
Figure 3.
GDP(trillion yuan) and growth rate(%) of cities in Fujian Province.
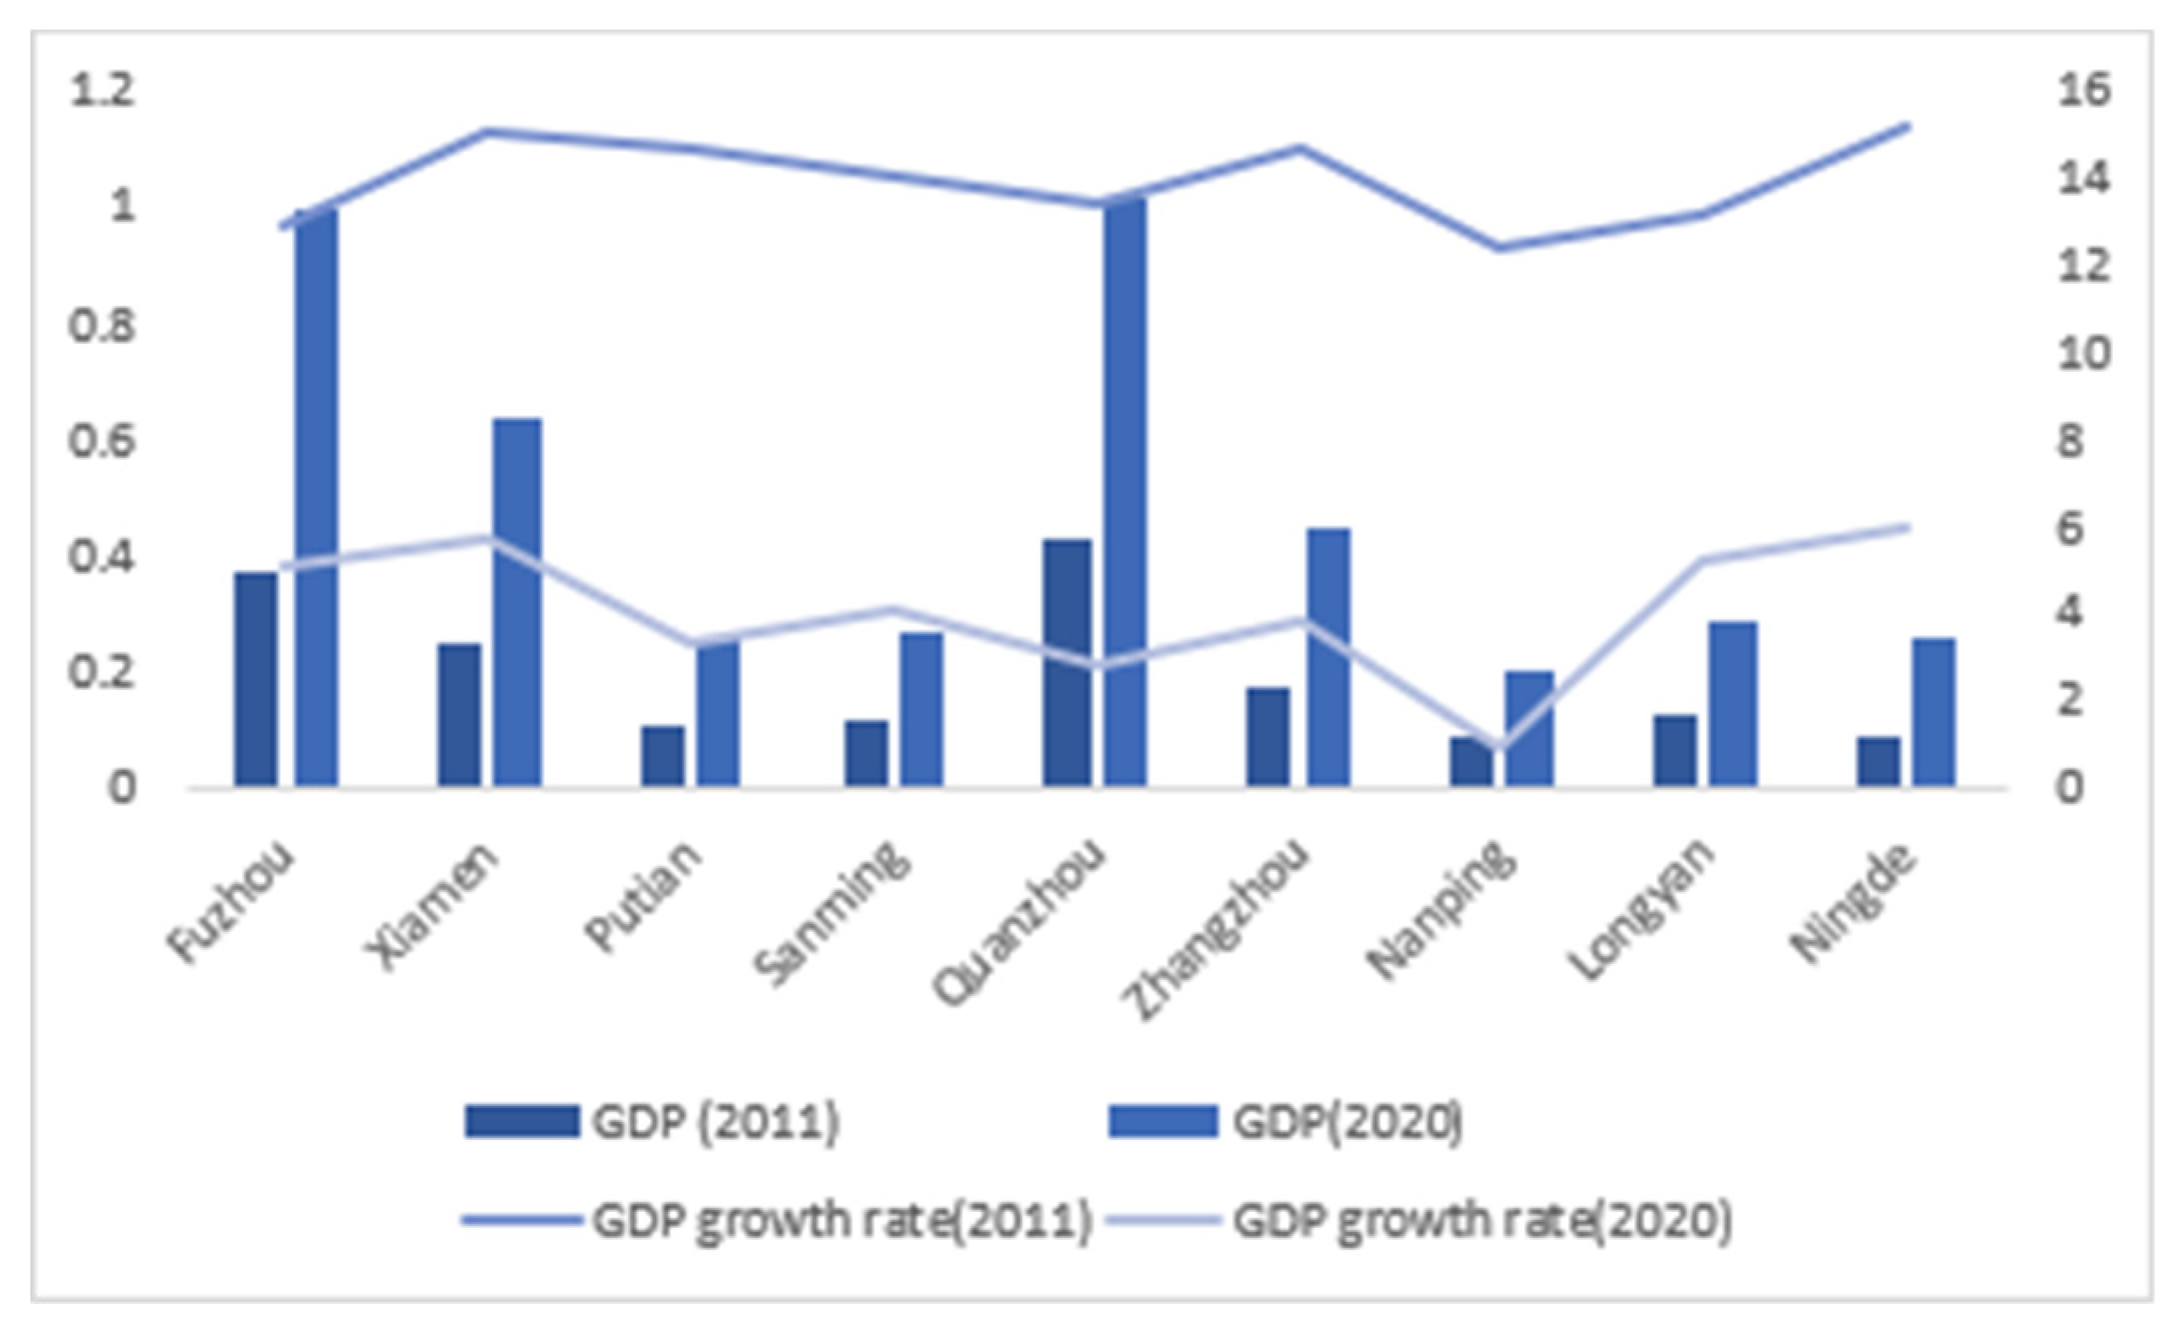
Figure 4.
Per capita disposable income (thousand yuan) of cities in Fujian Province.
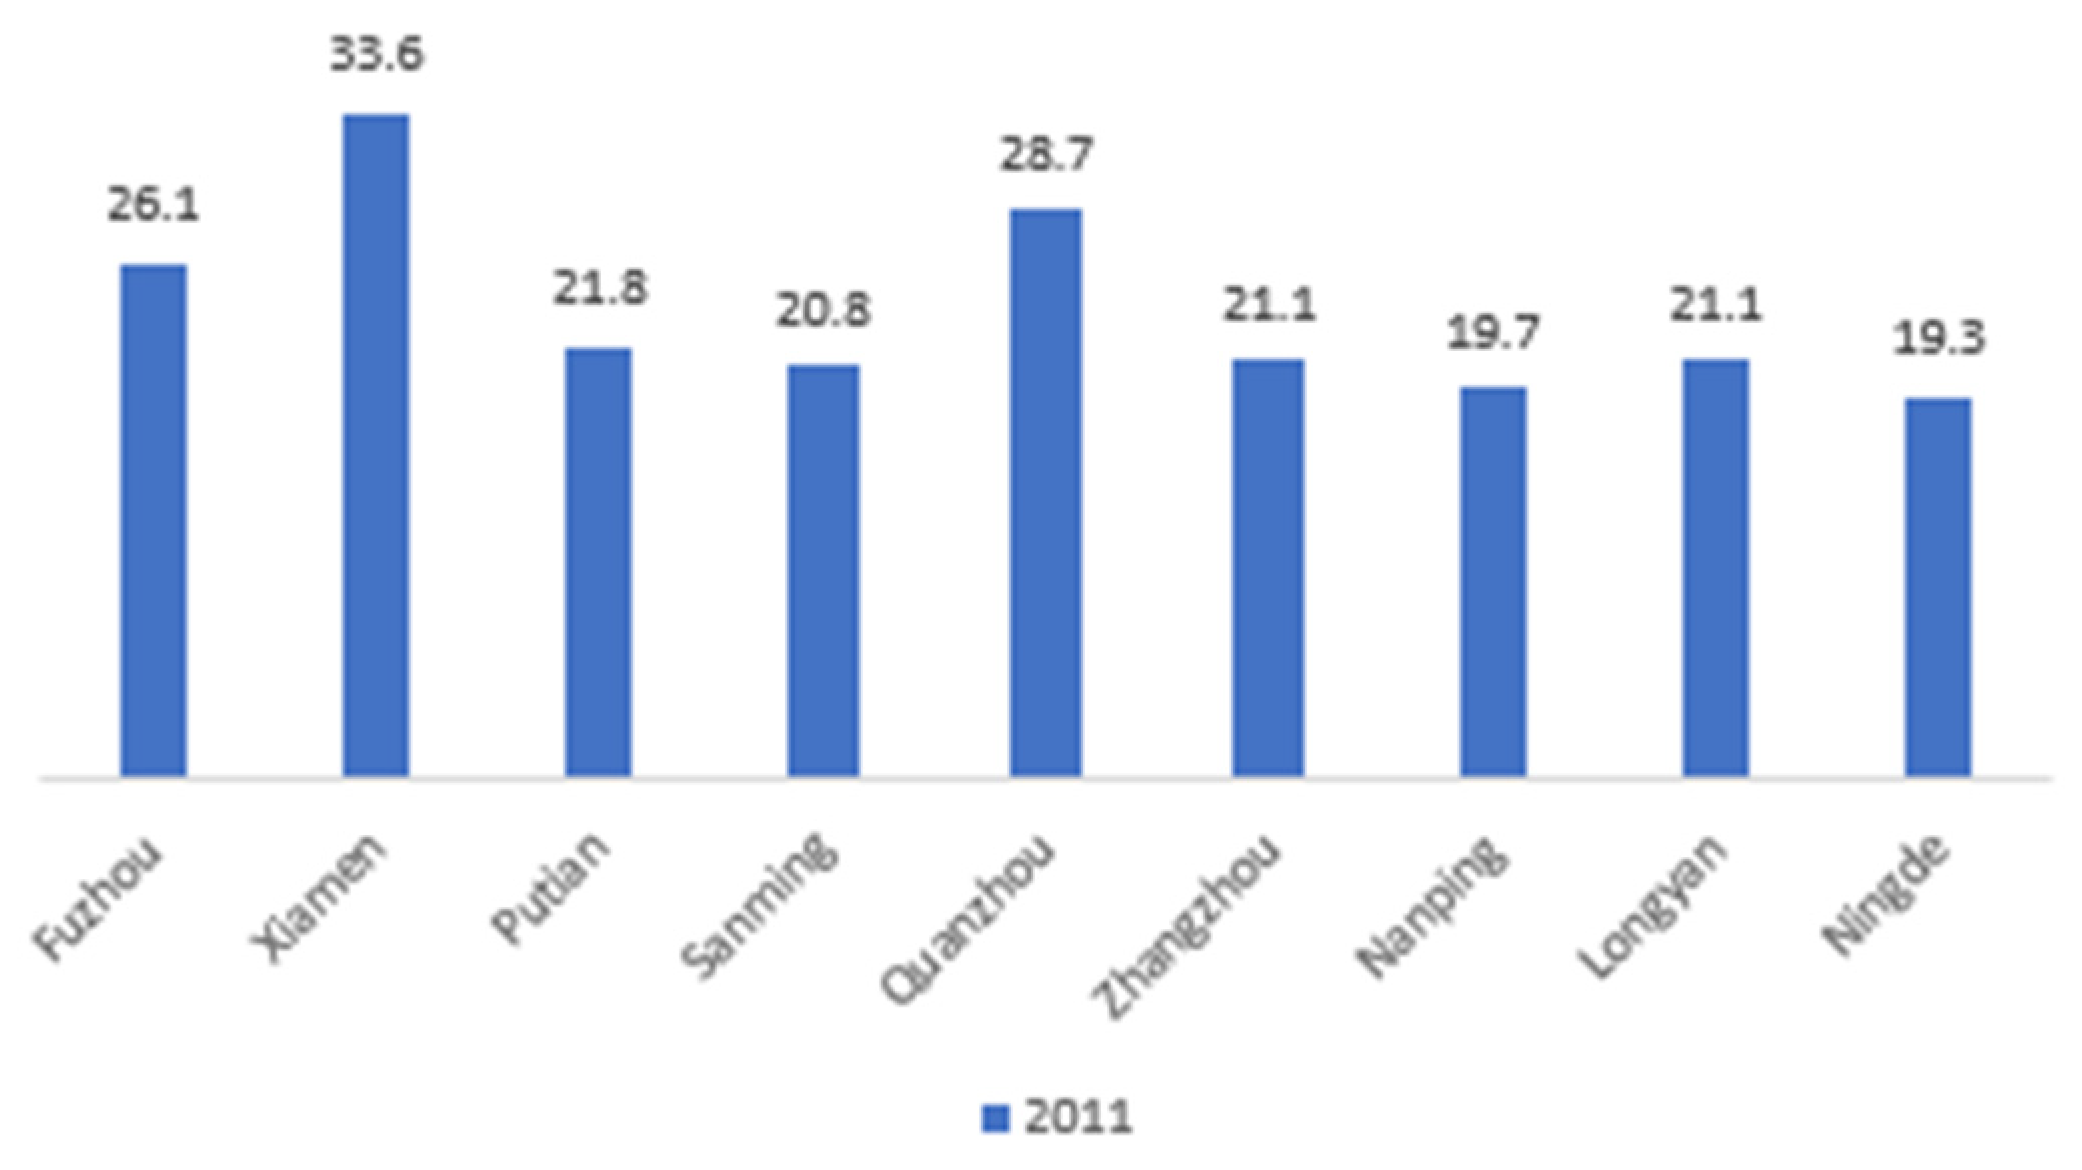
Figure 5.
Green coverage area (thousand hectares) of cities in Fujian Province.
3.3. The overall situation of innovation development in Fujian Province
Since the 18th National Congress of the Communist Party of China, the government has attached great importance to scientific and technological innovation, adhered to innovation at the first driving force for development, and placed innovation as the core of the development strategy. In this context, Fujian Province has always attached great importance to innovation. From 2011 to 2020, Fujian Province’s investment in innovation has gradually increased, the number of related practitioners has also increased significantly, indicating that Fujian Province has achieved remarkable results in attracting, retaining and utilizing talents. As can be seen from Table 2, in 2020, Fujian Province’s local fiscal expenditure on science and technology was 3.7 times that of 2011, R&D internal expenditure was 3.8 times that of 2011, and the number of R&D personnel was 2.1 times that of 2011. The increase in innovation input also brought rich results of scientific and technological progress, table 3 shows that patent applications, technology market turnover, and sales revenue of new products of industrial enterprises above designated size have all achieved large-scale increases.
3.4. The situation of innovation development in various prefecture-level cities
Similar to the differences in economic development among various prefecture-level cities in Fujian Province, the degree of innovation development in various cities also significantly differs. Generally speaking, cities with better economic development, such as Fuzhou, Xiamen, and Quanzhou, have more funds invested in scientific and technological innovation, and the results achieved are also more significant. While cities with average economic development level, such as Sanming, Longyan, and Ningde, do not invest as much funds as developed cities, the proportion of innovation funds in GDP is gradually increasing. It can be seen that although the economic development level of each city in Fujian Province is different, they are all giving priority to developing science and technology and increasing investment, striving to narrow the development gap, and stimulate regional economic development vitality.
Figure 6.
R&D expenditure (thousand yuan) of cities in Fujian Province.
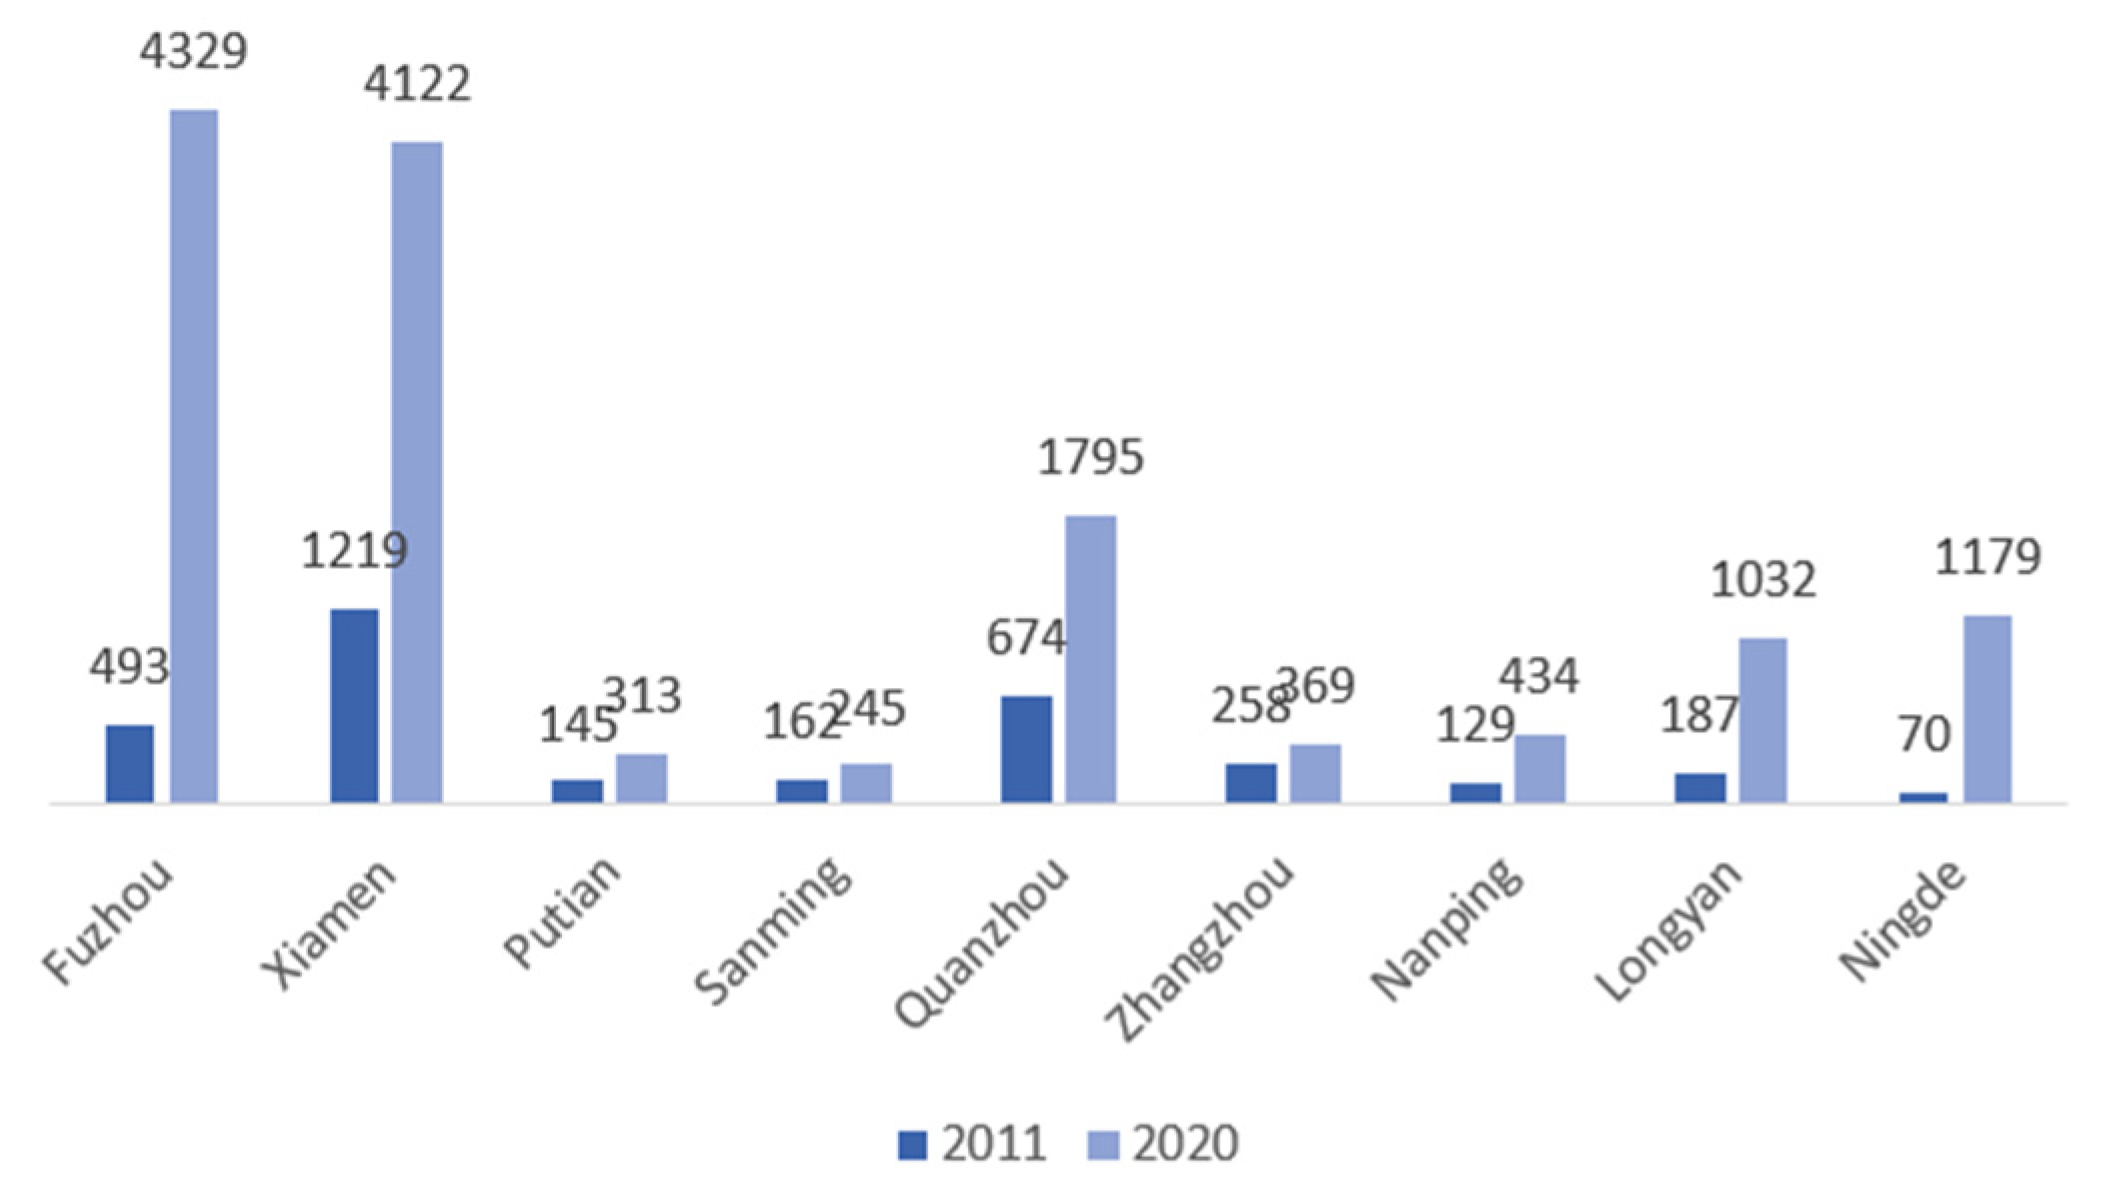
Figure 7.
Proportion of R&D expenditure (%) of cities in Fujian Province.
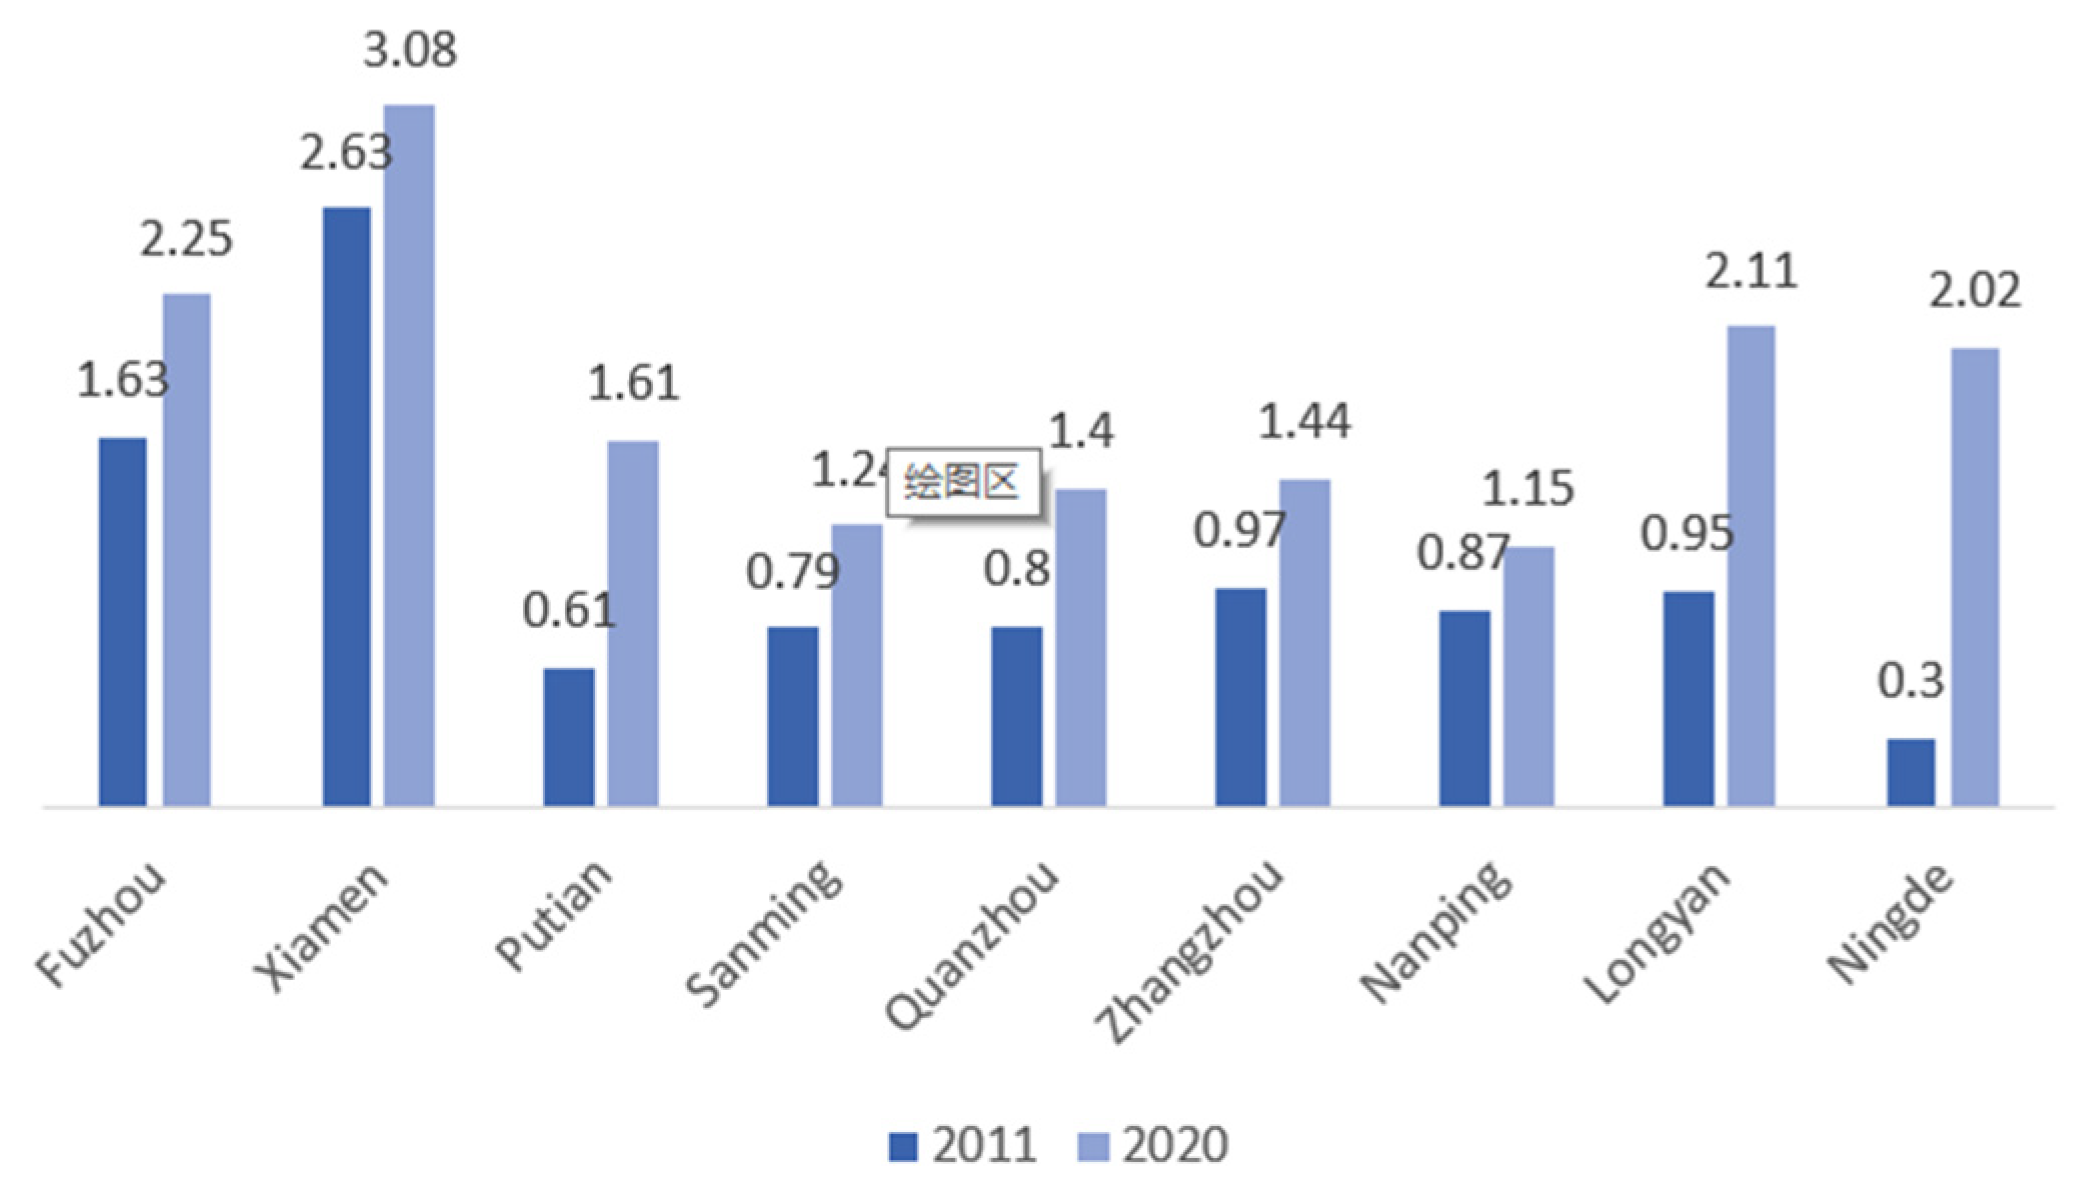
Figure 8.
Number of patent applications (thousand) of cities in Fujian Province.
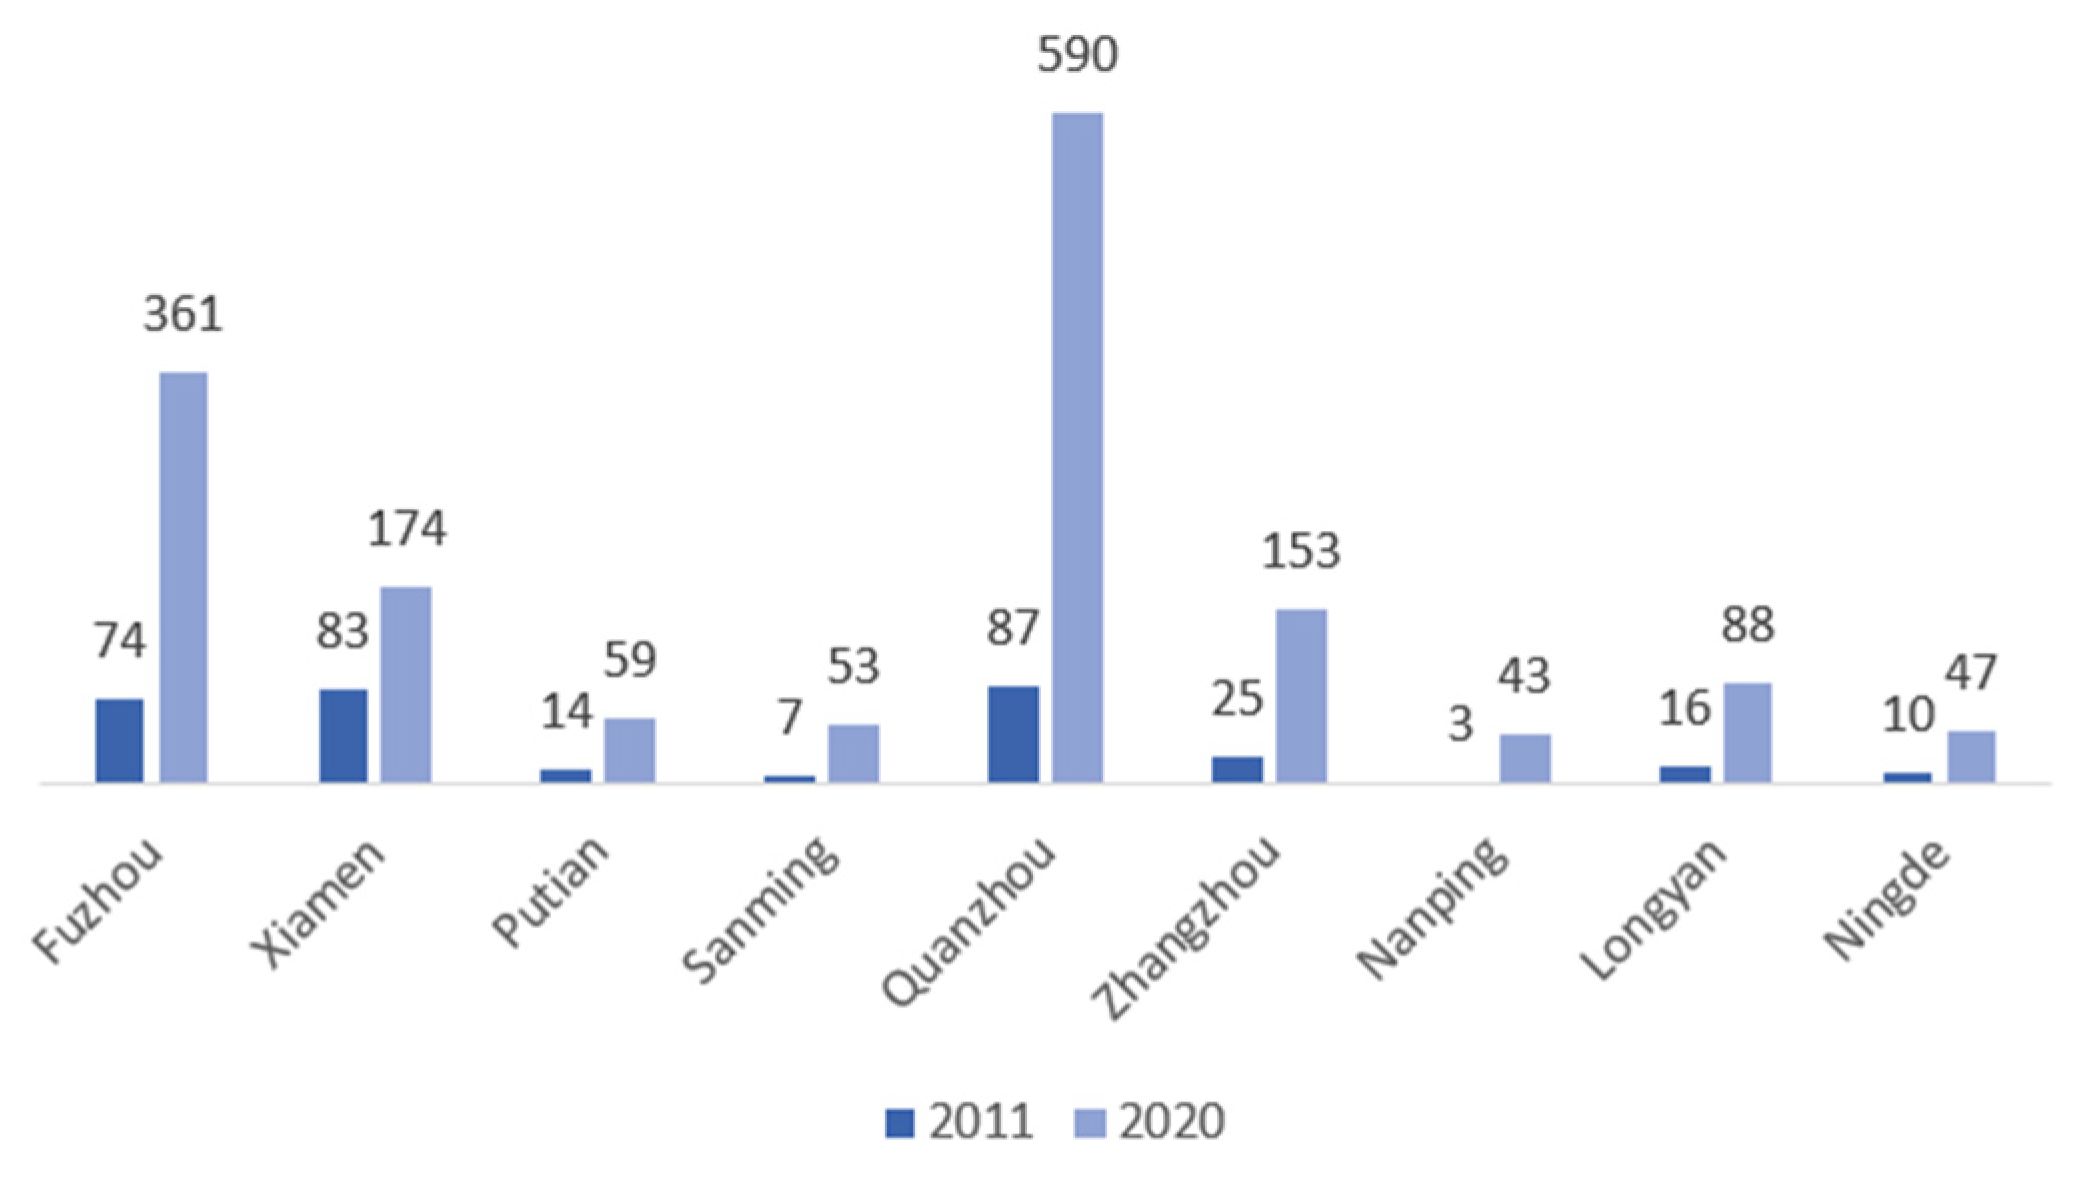
To sum up, Fujian Province’s economic development quality has gradually improved from 2011 to 2020, the financial support for innovation investment has increased year by year, and the results of innovation have also improved. However, the relationship between the two systems cannot be judged by simple data alone. Based on the connotation of high-quality economic development and innovation, this paper will establish an evaluation system by combining the data collected from 9 prefecture-level cities in Fujian Province, then use the entropy method and gray correlation method to analyze their correlation.
4. Construction of evaluation system
4.1. Chosen of evaluation index
4.1.1. Chosen of the high-quality economic development index
The 19th National Congress report related to the theory of high-quality economic development involves five concepts: innovation, coordination, green, openness, and sharing. Among them, innovation is the main factor affecting high-quality economic development in this paper, so based on the research of development economics theory and combined with the economic development situation of Fujian Province, this paper constructs a high-quality economic development index system from five dimensions: economy, green, sharing, coordination and livelihood, as well as 15 secondary indicators, details are shown in Table 4.
The premise for economic quality to develop is that economic quantity maintains stable growth, this paper selects regional GDP, total retail sales of social consumer goods, and foreign trade direct investment transaction volume as the secondary evaluation indicators of economic development.
Green development is the foundation for the healthy and stable growth of the economy. As one of the important contents of high-quality economic development, green development is vital to people’s lives and even affects national development and social stability. This paper uses the green hectare coverage area, the industrial wastewater discharge volume, and the comprehensive utilization of industrial solid waste as the secondary evaluation indicators of green development. The green hectare coverage area is directly related to the level of green development, the industrial wastewater discharge volume reflects the pollution level in the regional development process, and the comprehensive utilization of industrial solid waste indicates the level of urban pollution treatment.
"Sharing" is the starting point and destination of China’s economic reform and development. Shared development means that all the achievements brought about by reform and development should be shared by all the people. From the perspective of high-quality economic development, shared development is reflected in a fair distribution of social material wealth and gradually narrowing the gap between rich and poor. This paper selects the number of medical and health institutions, the number of full-time teachers in general education, and urban unit employees as the secondary evaluation indicators of shared development.
"Coordination" is an important factor for economic sustainable and stable development. The coordination level of regional high-quality economic development measures the coordination ability of population, resources and environment in the regional economic system, reflecting the ability to solve regional gaps, urban-rural differences, industrial development imbalance, and other problems in high-quality development. Generally speaking, the local permanent population size and permanent population urbanization rate could reflect the development vitality of the region, while per capita road area reflects the transportation capacity of the region. This paper selects these three indicators as secondary evaluation indicators for coordinated development.
Finally, the essence of high-quality economic development is to improve people’s happiness and living standards. Urban Engel coefficient measures the proportion of residents’ food consumption in daily living expenses, urban residents’ disposable income directly affects residents’ consumption level, and basic medical insurance coverage affects residents’ physical health rights and interests. These three are directly related to people’s living standards, therefore, this paper selects the urban Engel coefficient, urban residents’ disposable income, and participation in basic medical insurance as secondary evaluation indicators to measure people’s living standards.
4.1.2. Chosen of the innovation index
According to the innovation development of nine prefecture-level cities in Fujian Province and combined with the research results of relevant literature, this paper divides the innovation capability into two primary indicators: innovation input and innovation output, then divides these two indicators into five second-level indicators, as shown in Table 5.
Innovation input is an important guarantee for all innovation activities, this paper uses three secondary indicators: internal expenditure on R&D, government expenditure on science and technology, and R&D expenditure as a percentage of GDP. Among them, R&D expenditure percentage is an important factor of innovation input, generally speaking, the higher this value is, the stronger the scientific and technological strength is. As innovation requires a lot of capital input support, sufficient internal expenditure on R&D and government expenditure on science and technology can ensure the progress of relative activities.
Innovation output refers to the knowledge innovation and technological innovation achievements brought by scientific and technological innovation activities. This paper selects two secondary indicators: patent applications and the number of students in general education. The more patents there are, the higher the innovation capability of a region is. The number of students in general education is selected because the development of higher education plays a boosting role in enhancing regional innovation capability.
4.2. Evaluation methods
4.2.1. The entropy method
The entropy method calculates the degree of dispersion of each indicator, then judge the indicator’s impact on the comprehensive ability, the greater the degree of dispersion of an indicator, the more significant the impact it has. The calculation method is as follows:
(1) Dimensionless treatment:
Positive correlation indicators:
Negative correlation indicators:
In equation(1) and equation(2), i represents the year, j represents the measurement indicators(), , , , respectively represent the initial value, standardized value, maximum value and minimum value of the indicator.
(2) Calculate the weights of each indicator :
In equation(3), , and
(3) Calculate the comprehensive evaluation index:
The parameter is the index needs to be calculated.
4.2.2. The grey correlation analysis method
The grey correlation analysis method is a method for evaluating the correlation degree between the parent system and the subsystem. The value of the grey correlation degree is proportional to the correlation degree between these two systems, that is, the larger the value of the grey correlation degree, the stronger the correlation degree between the two systems. It has the advantages of wide application range and accurate results, the calculation method is as follows:
In equation(5) and equation(6), is the grey correlation coefficient, is the reference sequence, is the comparison sequence, is the resolution (generally taking , is the correlation degree, and .
5. Empirical analysis
5.1. Over-evaluation of high-quality economic development and innovation
Based on the panel data of nine prefecture-level cities in Fujian Province from 2011 to 2020, and by using the entropy method, this paper calculates the weights of each evaluation indicator of economic high-quality development and innovation systems, as shown in Table 6 and Table 7.
Based on the weights obtained by the entropy method, the comprehensive scores of each indicator are plotted as shown in Figure 9 and Figure 10.
Figure 9.
Comprehensive scores of high-quality economic development for each city.
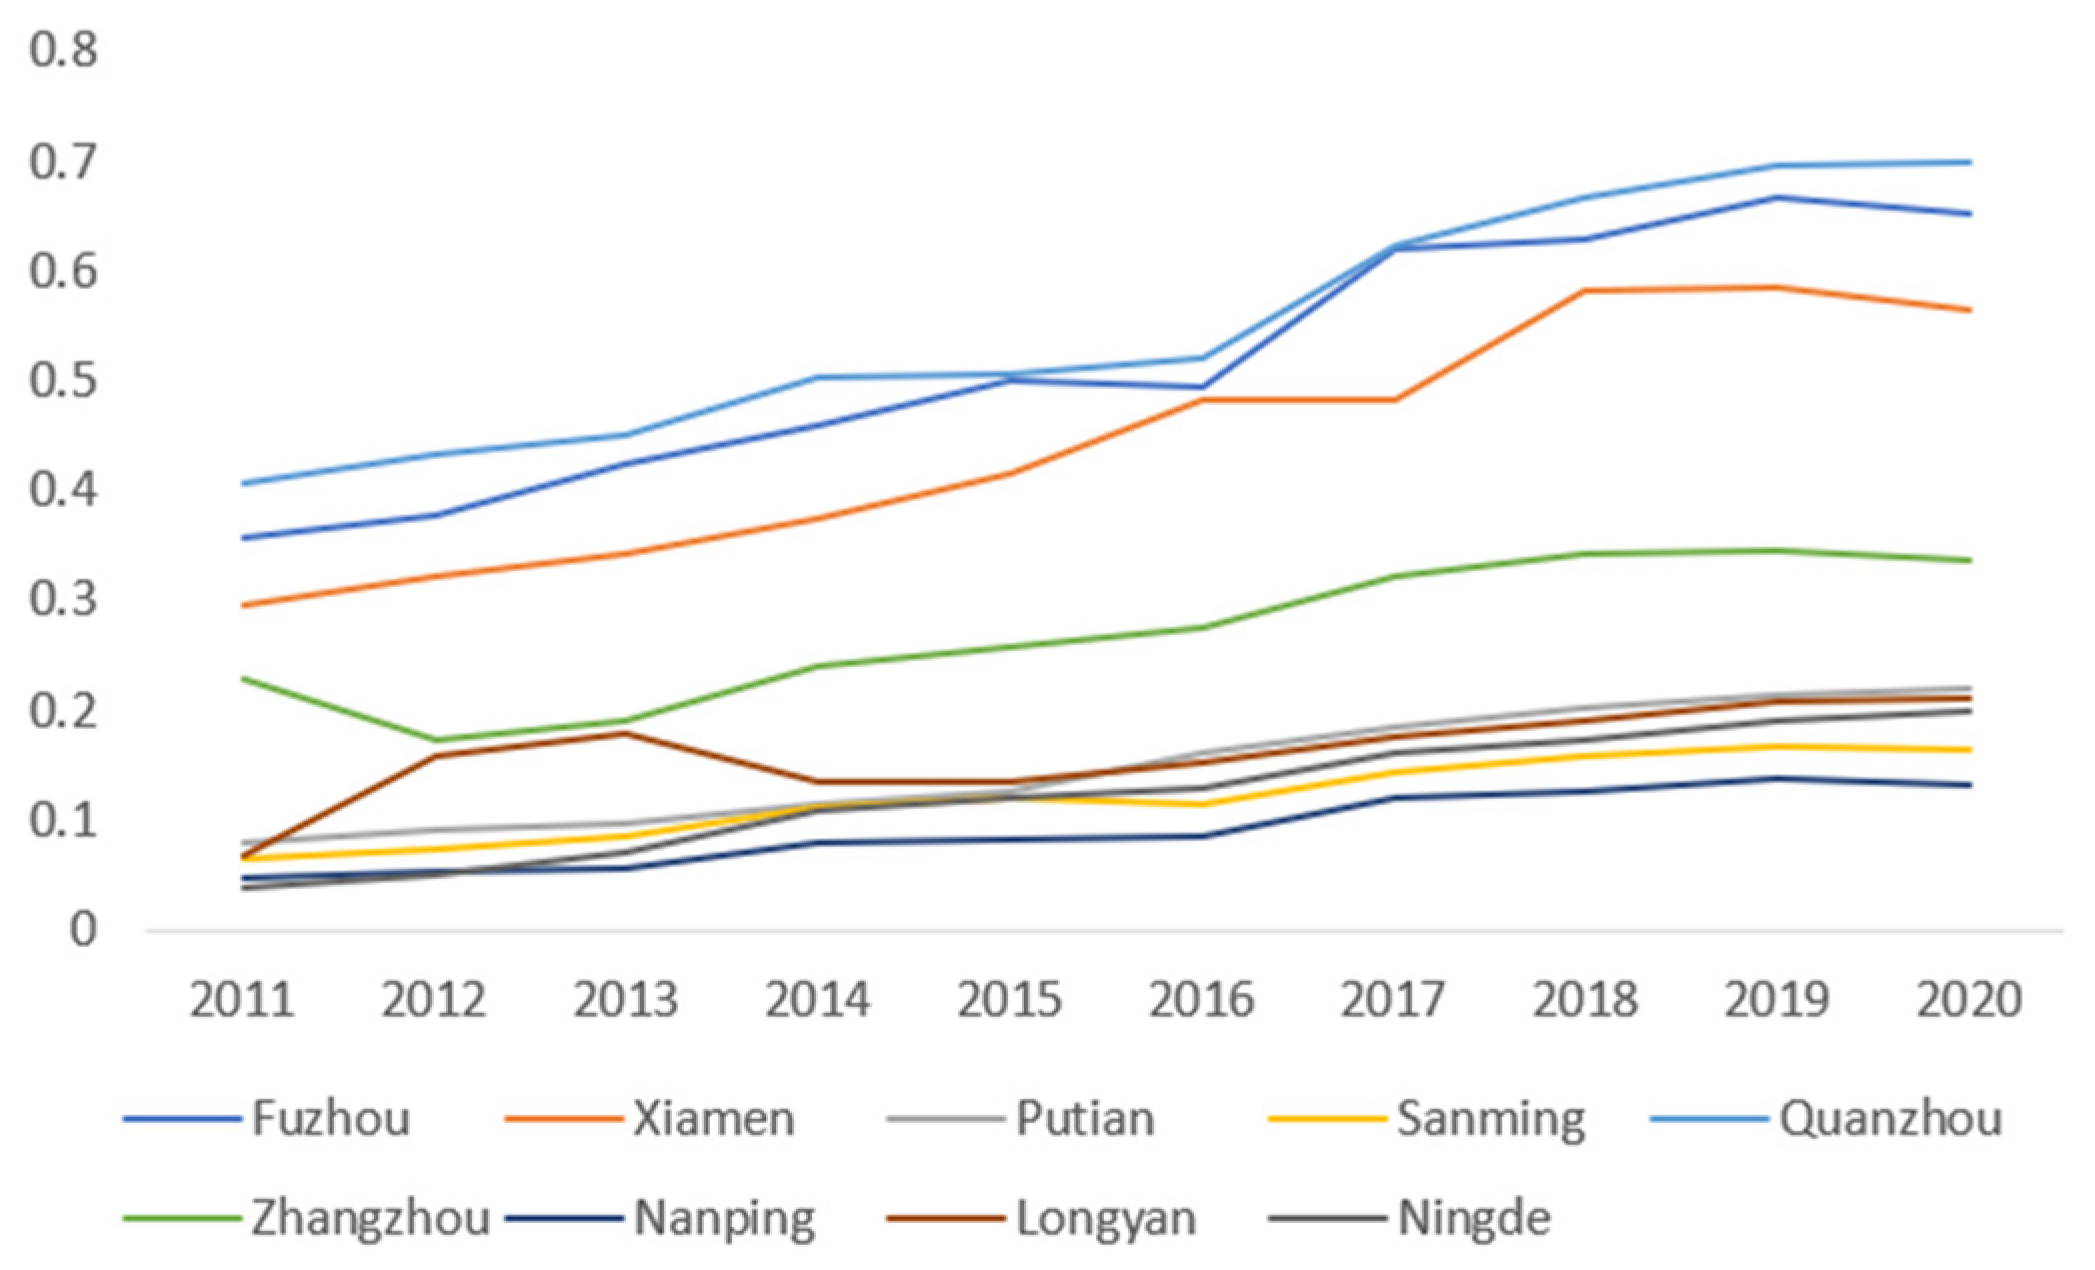
Figure 10.
Comprehensive scores of innovation for each city.
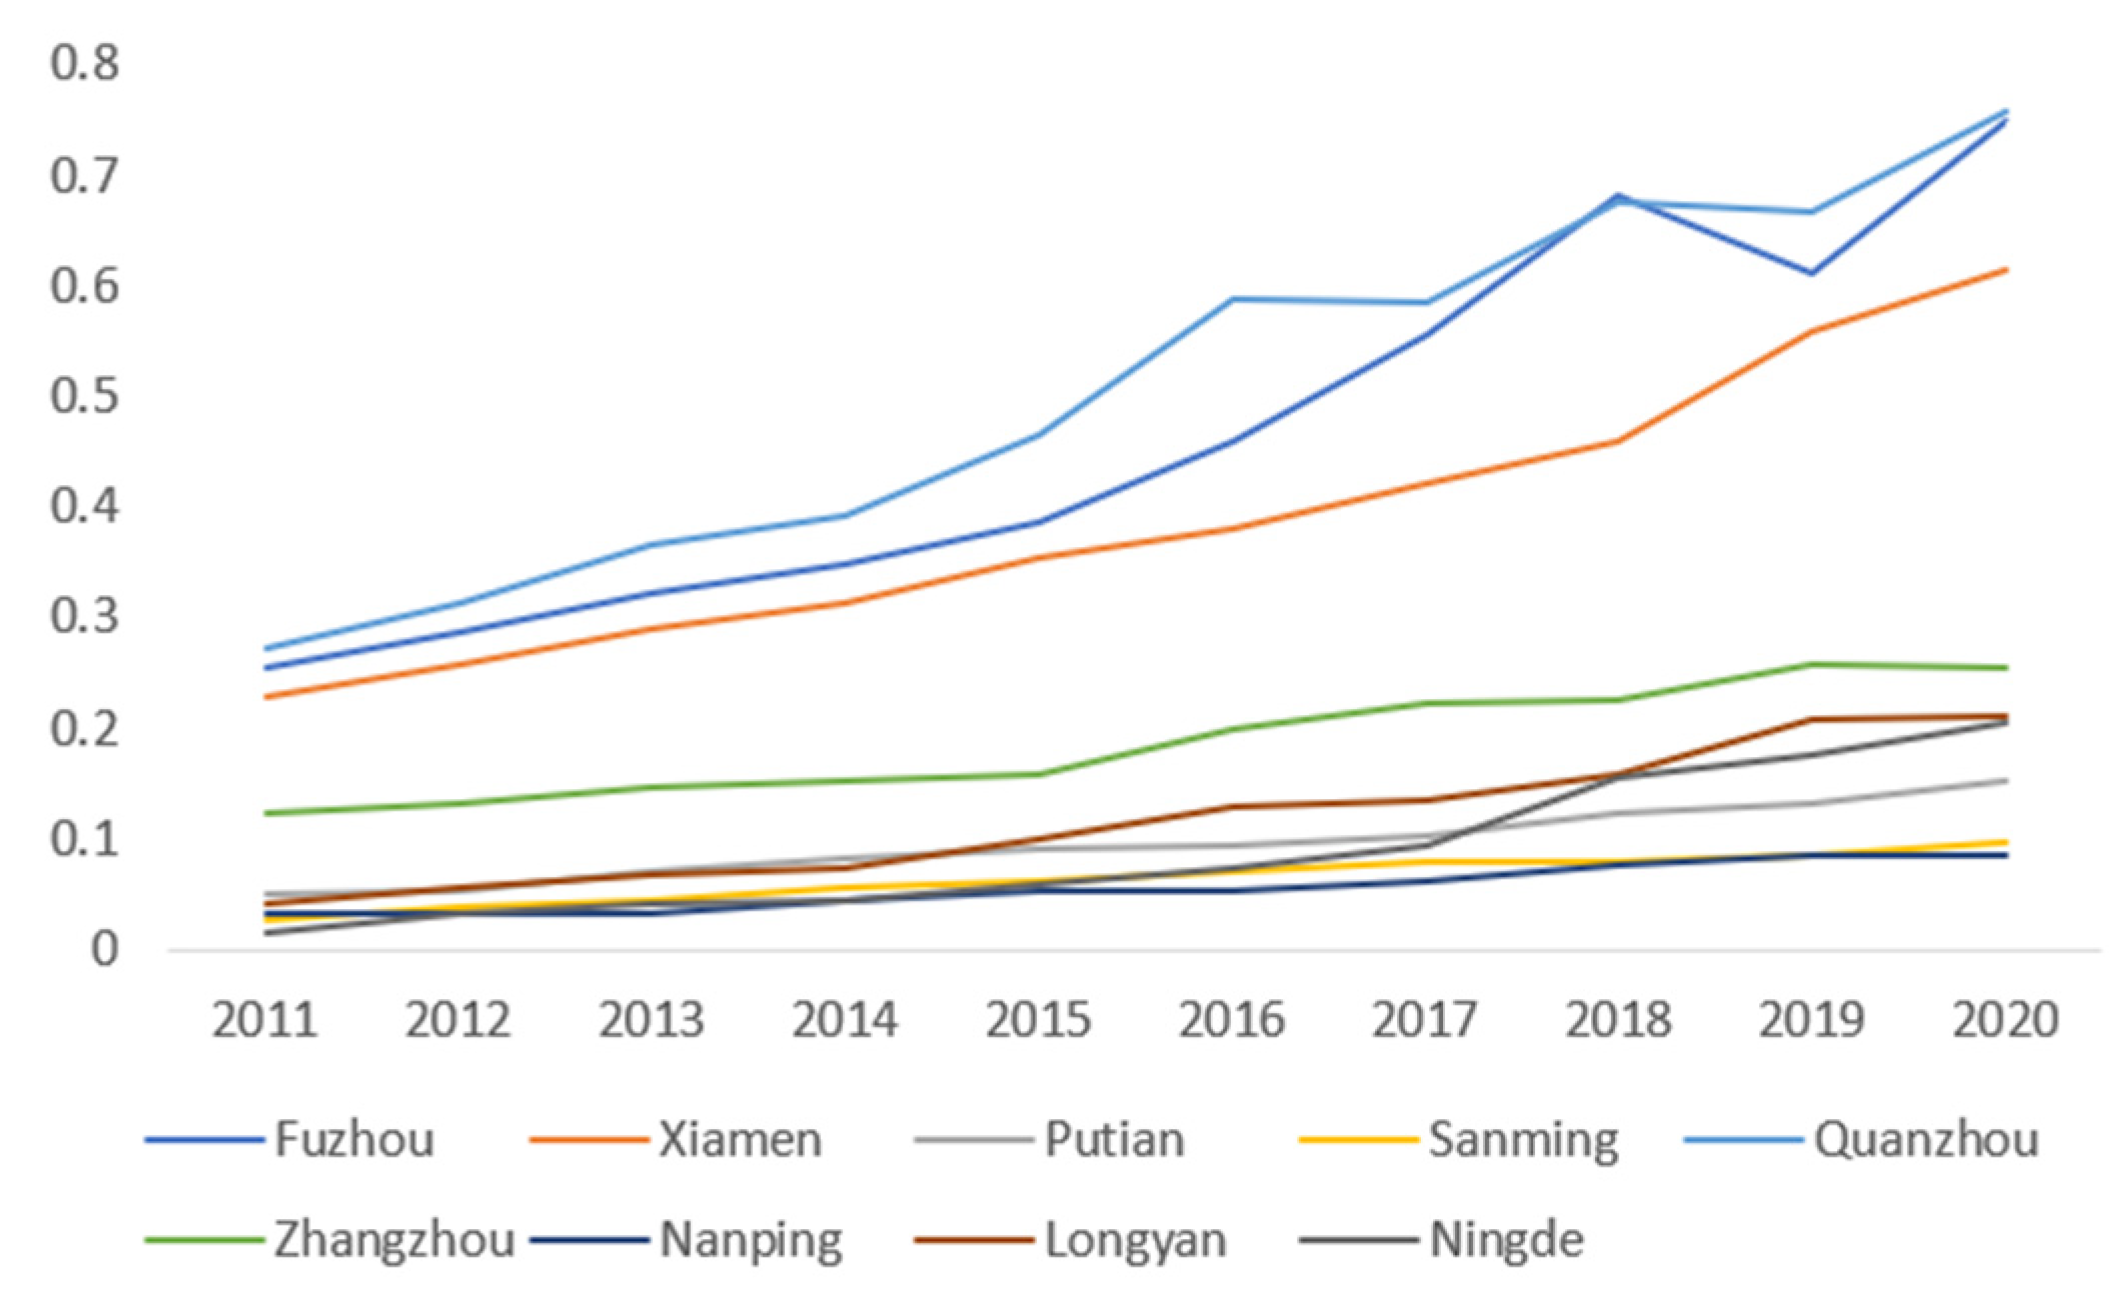
As can be seen from the above figures, although the economic high-quality development and levels of the nine cities have increased from 2011 to 2020, there are still large differences in the growth rate. Among them, Quanzhou, Fuzhou, and Xiamen rank the top three in terms of economic high-quality development and innovation capability, and these three cities have relatively higher initial levels than other cities, with obvious imbalances and differences, which also make the gap between the rich and the poor in these three cities more obvious than the rest.
5.2. Grey correlation analysis between innovation and high-quality economic development
To explore the correlation degree between each indicator of the two systems, this paper selects ~ as the sub-sequences, respectively representing the regional GDP indicator, the total retail sales of social consumer goods indicator, the foreign trade direct investment indicator, the green coverage area indicator, the industrial wastewater discharge indicator, the comprehensive utilization of industrial solid waste indicator, the number of medical and health institutions indicator, the number of full-time teachers in general education indicator, the number of urban unit employees on duty indicator, the urbanization rate of permanent population indicator, the number of permanent population indicator, the per capita road area indicator, the urban Engel coefficient indicator, the disposable income of urban residents indicator, and the number of basic medical insurance participants indicator in economic high-quality development. ~ are selected as the parent sequences, respectively representing internal expenditure on R&D indicator, government expenditure on scientific and technological innovation indicator, R&D expenditure as a percentage of GDP indicator, patent applications indicator, and number of students in general education indicator. Using the grey correlation degree model, this paper calculates the grey correlation degree between factors and the average value of each level of indicator. The results are shown in Table 8.
5.2.1. The impact of innovation subsystem on high-quality economic development
As can be seen from Table 8, the correlation degree between the innovation subsystem and the economic high-quality development is from high to low as follows: innovation output and input, which are 0.6133 and 0.5923 respectively. The correlation degree is greater than 0.5, indicating that the innovation subsystem and the economic high-quality development in Fujian Province are at a high level of correlation. Among them, the correlation degree of innovation output is higher, because scientific and technological achievements will directly act on the corresponding industry or shared development, green development level, bringing about the economic high-quality development of Fujian Province. But at the same time, continuous input is the premise and guarantee of continuous output, only by continuously increasing the intensity of innovation input, can activate the innovation potential, release the innovation vitality, promote the continuous growth of achievements such as patents, improve the quality of talent cultivation for students in general education, stimulate the market demand for application-oriente innovation, and provide impetus for the economic high-quality development of Fujian Province.
5.2.2. The impact of innovation on high-quality economic development subsystem
First of all, the grey correlation degree between innovation and economic systems in economic high-quality development is relatively high, indicating that promoting innovation will first drive economic development, and can rely on developing the innovation level of each city to make up for the regional economic development gap. Secondly, the grey correlation degree between the innovation development level and the primary evaluation indicators of economic high-quality development is from high to low as follows: green, coordination, sharing, and livelihood, and they all belong to a strong correlation, indicating that scientific and technological innovation indeed affects the high-quality development of economy. Therefore, promoting innovation can accelerate industrial technological innovation, achieve a green, low-carbon, energy-efficient, coordinated, and sustainable economic development model, enhance the happiness index of people’s lives, and promote the high-quality development of economy.
6. Conclusions and recommendations
6.1. Conclusions
Through literature review, this paper finds that there is relatively insufficient research on the relationship between economic high-quality development and innovation in provincial prefecture-level cities, especially in Fujian Province, which is an important economic province. Its characteristics of unbalanced regional development and lagging innovation are common in China, so the internal regional research of its prefecture-level cities will have typical social practice value and research significance for the analysis under the provincial perspective. Based on defining the connotation of economic high-quality development and innovation, as well as combined with the available data of Fujian Province, this paper analyzes the overall and regional development status, and finds that Fujian Province’s economic development model is in the process of transformation and restructuring. In this process, Fujian Province continuously strengthens the input of scientific and technological innovation.
This paper also constructs an evaluation index system of economic high-quality development and scientific and technological development level in Fujian Province, calculates the index weights and comprehensive scores by using the entropy method, and finds that from 2011 to 2020, although the innovation and economic high-quality development levels of various cities in Fujian Province have increased year by year, the situtation of various cities are uneven, and there is still a large gap. Among them, Quanzhou, Fuzhou, and Xiamen are far ahead in terms of development level. By using the grey correlation analysis method to calculate the correlation degree value, the results show that the correlation degree between the two is relatively high. Among the primary indicators of economic high-quality development influenced by innovation, the correlation degree is from high to low as follows: economy, coordination, green, sharing, and livelihood.
6.2. Recommendations
According to the empirical analysis results, at the level of innovation indicators, patent applications have the highest weight proportion, which shows that this indicator has the greatest impact on innovation capability. Therefore, cities can promote the improvement of innovation capability by strengthing intellectual property protection, optimizing the application progress, and raise the awareness of patent applicantion. At the level of economic high-quality development, indicators such as permanent population number, foreign trade direct investment amount, green coverage area, etc. have a high proportion of weight. Therefore, cities can adjust policies such as housing prices to encourage immigrants to settle down, actively introduce foreign investment, protect the environment while doing a good job in greening work, and improve their high-quality development level.
Generally speaking, there are differences in the development speed of various cities in Fujian Province, the indicators of cities with relatively high development level are far higher than those of backward cities. The unbalanced development leads to uneven economic high-quality level and different happiness index of residents’ lives in various cities. To this end, the government should increase its support for backward mountainous cities such as Nanping, Sanming, and Putian, encourage these cities to give priority to infrastructure development, encourage financial support for scientific and technological innovation input, promote efficiency reform, power reform and quality reform process of backward cities through regional coordinated development policies such as joint investment promotion, cooperative development, R&D sharing, etc. For medium-developed prefecture-level cities such as Zhangzhou, although their economic high-quality development level and innovation capability are not as good as developed cities, they also have development potential. Policies should guide these cities to increase financial support for innovation input and strive to narrow the gap with developed cities. For developed cities such as Quanzhou, Fuzhou, and Xiamen, although their economic high-quality development level and innovation capability are already at the forefront, there is still a gap between them and domestic advanced cities such as Beijing, Shanghai, and Hangzhou, etc. They should give full play to their geographical advantages of overlapping five regions (Fujian Free Trade Pilot Zone, Fuzhou New Area, “Maritime Silk Road” Core Area, National Ecological Civilization Experimental Zone, National Independent Innovation Demonstration Zone), actively innovate policies, provide more policy support for innovation, further improve their innovation capability, and comprehensively lead Fujian Province to achieve economic high-quality development.
Author Contributions
Writing—original draft preparation, G.Z.; writing—review and editing, G.L. and P.Z. All authors have read and agreed to the published version of the manuscript.
Funding
This research was funded by the Natural Science Foundation of Fujian Province, grant number 2020JOI927; the Sanming University Introduces Senjor Talents Project, grant number 18YG05S.
Institutional Review Board Statement
Not applicable.
Informed Consent Statement
Not applicable.
Data Availability Statement
The datasets used and/or analyzed during the current study are available from the corresponding author on reasonable request.
Acknowledgments
Not applicable.
Conflicts of Interest
The authors declare no conflict of interest.
References
- Yang, Y. W.; Zhang, P. Logic, Measurement and Government in China’s High-quality Economic Development. Econ.Res.J. 2021, 56(01): 26-42.
- Ren, B. P. Theoretical Interpretation and Practical Orientation of China’s Economy from High Speed Growth to High Quality Development in New Era. Acade.Month. 2018,50(03): 66-74.
- Gu, W. T.; Wang, J. Y.; Hua, X. Y.; Liu, Z. D. Entrepreneurship and high-quality economic development: based on the triple bottom line of sustainable development. Int.Enterp.Manag.J.2021, 17, 1-27. [CrossRef]
- Li, X. S.; Lu, Y. L.; Huang, R. T. Whether foreign direct investment can promote high-quality economic development under environmental regulation: evidence from the Yangtze River Economic Belt, China. Environ.Sci.Pullut.Res. 2021,28, 21674-21683. [CrossRef]
- Yang, Y.; Su, X.; Yao, S. Nexus between green finance, fintech, and high-quality economic development: Empirical evidence from China. Resour.Policy, 2021,74,102445. [CrossRef]
- Luo, C.; Wei, D.; Su, W.; Lu, J. J. Association between Regional Digitalization and High-Quality Economic Development. Sustain. 2023, 15(3): 1909. [CrossRef]
- Zhou, C.; Li, X.; Lin, X.; Cheng, M. Influencing factors of the high-quality economic development in China based on LASSO model. Energy.Rep. 2022, 8: 1055-1065. [CrossRef]
- Thomas, V.; Dailami, M.; Mansoor, D.; Dhareshear, A.; Kaufmann, D.; Kishor, N.; Lopez, R.; Wang, Y. The Quality of Growth; Oxford University Press: Oxford, UK, 2000.
- Barro, R.J. Quantity and Quality of Economic Growth. Chil. Econ. 2002, 5, 17–36.
- Chen, L.; Ye, W.; Huo, C.; James, K. Environmental Regulations, the Industrial Structure, and High-Quality Regional Economic Development: Evidence from China. Land. 2020, 9, 517. [CrossRef]
- Luo, H.; Qu, X. Export Trade, Absorptive Capacity, and High-Quality Economic Development in China. Systems. 2023, 11(2): 54. [CrossRef]
- Ma, X.; Xu, J. Impact of environmental regulation on high-quality economic development. Front.Environ.Sci. 2022: 392. [CrossRef]
- Gan, L.; Yang, X.; Chen, L.; Benjamin, L.; Lv, Y. M. Optimization path of Economy-Society-Ecology system orienting industrial structure Adjustment: Evidence from Sichuan Province in China. Ecol.Indic. 2022, 144: 109479. [CrossRef]
- Xu, X. X.; Li, S. J.; Wang, X. B.; Bi, Q. M. Growth Target Choices: Ending Chinese Collapse Fallcy with High-Quality Development. J.World.Econ.2018,10:3-25.
- Yang, X. H. The Construction of Statistical Evaluation Index System of "Five Development Concepts"——Taking Shenzhen as an Example. World.Surv.Res.2017,07:3-7.
- Chao, X. J.; Ren, B. P. The Fluctuation and Regional Difference of Quality of Economic Growth in China. Econ.Res.J.2011,46(04):26-40.
- Jian, X.; Nie, C. Measurement of China’s high-quality development: 1978–2018. Economist. 2020, 8, 49–58.
- Guo, J.; Sun, Z. How does manufacturing agglomeration affect high-quality economic development in China? Econ.Anal.Policy. 2023, 78: 673-691. [CrossRef]
- Li, Z. L.; Wang, A. M. The high-quality development in Jiangsu province: measurement and advancement. Jiangsu Soc. Sci. 2019,(01), 247–256.
- Kong, Q.; Peng, D.; Ni, Y.; Jiang, X.; Wang, Z. Trade openness and economic growth quality of China: empirical analysis using ARDL model. Finance Res. Lett. 2021,38, 101488. [CrossRef]
- Wang, Y. M. A New Round of Power Transformation and Path Selection for China’s Economy. J.Manag.World.2017,(02):1-14.
- Ma, D.; Zhu, Q. Innovation in emerging economies: Research on the digital economy driving high-quality green development. J. Bus. Res. 2022, 145, 801–813. [CrossRef]
- Gibson, D. V.; Naquin, H. Investing in innovation to enable global competitiveness: The case of Portugal. Technol.Forecast.Soc. 2011, 78(8): 1299-1309. [CrossRef]
- Jalles, J. T. How to measure innovation? New evidence of the technology–growth linkage. Res. Econ. 2010, 64(2): 81-96. [CrossRef]
- Becheikh, N.; Landry, R.; Amara, N. Lessons from innovation empirical studies in the manufacturing sector: A systematic review of the literature from 1993–2003. Technovation.2006, 26(5-6): 644-664. [CrossRef]
- Freeman, C.; Soete, L. Developing science, technology and innovation indicators: What we can learn from the past. Res.Policy. 2009, 38(4): 583-589. [CrossRef]
- Klomp, L.; Leeuwen, G. Linking innovation and firm performance: a new approach. Int.J. Econ.Bus. 2001, 8(3): 343-364. [CrossRef]
- Leten, B.; Belderbos, R.; Looy, B. V. Entry and technological performance in new technology domains: Technological opportunities, technology competition and technological relatedness. J.Manag.Stud. 2016, 53(8): 1257-1291. [CrossRef]
- Grupp, H.; Schubert, T. Review and new evidence on composite innovation indicators for evaluating national performance. Res.Policy. 2010, 39(1): 67-78. [CrossRef]
- Zhao, L. X.; Alatenegule. A Quantitative Study on Influence path of Inner Mongolia Science and Technology Innovation Ability on High-Quality Economic Development. Sci.Manag.Res. 2019,37(04):103-107.
- Hua, J.; Hu, J. X. Analysis on the Coupling Relationship between Technology Innovation and High-Quality Economic Development. Sci.Tech.Prog.Policy. 2019,36(08):19-27.
- Zhang, K. Y.; Huang, R. H.; Zhu, A. H. Application of multiple comprehensive evaluation methods in the analysis of innovation evaluation. Sci.Technol.Manag.Res. 2005(11):65-67.
- Zhang, L. H. Extension Evaluation Model and Empirical Study of Regional Science and Technology Innovation in China Based on AHP-Entropy Weight Method. J.Ind.Technol.Econ.2019,38(08):130-136.
- Ren, X. Y.; Yang, S. L. Technological innovation, industrial structure upgrading and high-quality economic development: Analysis based on the measurement of independent effects and synergistic effects. East China Econ. Manag. 2020, 11, 72–80.
- Gu, Z. S.; Wu, H.J. Innovation drive and core technology breakthrough are the cornerstones of high-quality development. China Soft Sci. 2018, 10, 9–18.
- Li, X.; Deng, F. Scientific and technological innovation, industrial structure upgrading and economic growth. Sci. Res. Manag. 2019, 3, 84–93.
- Qian, J. Study on the impact of energy conservation-biased technological progress on economic growth. Stud. Sci. Sci. 2019, 3, 436–449.
- Ding, C. H.; Liu, C.; Zheng, C. Y.; Li, F. Digital economy, technological innovation and high-quality economic development: Based on spatial effect and mediation effect. Sustain.2022, 14(1): 216. [CrossRef]
- Chen, Z. X.; Zhuansun, G. H. Study on Coupling Coordination between Sci-Tech Innovation and High-Quality Economic Development in the Guangdong-Hong Kong-Macao Greater Bay Area. Front.Econ.China. 2022, 17(4).
- Wang, H. Y.; Li, X. Y.; Xu, Y. L. Research on Performance Evaluation and Influence Factors of High-quality Economic Development Driven by Scientific and Technology Innovation of China. Economist. 2019,251(11):64-74. [CrossRef]
- Xiao, R. Q.; Shen, L.; Qian, L. Research on the Impact of Scientific and Technology Innovation on the High-Quality Economic Development of China in the New Era. Sci.Tech.Prog.Policy. 2020,37(4):10.
- Ran, Z.; Zheng, J. H. Innovation Capability and High-Quality Development of Regional Economy—Based on the Analysis of Technology Difference. Shanghai.J.Econ. 2021(04):84-99.
- Xiao, W.; Kong, H.; Shi, L.; Boamah, V.; Tang, D. The Impact of Innovation-Driven Strategy on High-Quality Economic Development: Evidence from China. Sustain. 2022, 14(7): 4212. [CrossRef]

Table 1.
Industrial structural changes in Fujian Province(%).
| Year | Primary Industry | Secondary Industry | Tertiary Industry |
|---|---|---|---|
| 2011 | 8.3 | 52.0 | 39.7 |
| 2012 | 8.1 | 52.1 | 39.8 |
| 2013 | 7.8 | 52.5 | 39.8 |
| 2014 | 7.4 | 52.8 | 39.8 |
| 2015 | 7.2 | 51.2 | 41.6 |
| 2016 | 7.2 | 49.6 | 43.2 |
| 2017 | 6.5 | 48.1 | 45.3 |
| 2018 | 6.1 | 48.7 | 45.1 |
| 2019 | 6.1 | 47.4 | 46.5 |
| 2020 | 6.3 | 46.2 | 47.5 |
Table 2.
Main innovation inputs in Fujian Province.
| Year | Total number of R&D personnel | Local expenditure on science and technology(million yuan) | R&D internal expenditure(million yuan) | Proportion of internal R&D expenditure to GDP (%) |
|---|---|---|---|---|
| 2011 | 128614 | 4048 | 22152 | 1.26 |
| 2012 | 158089 | 4847 | 27099 | 1.38 |
| 2013 | 167041 | 6062 | 31406 | 1.44 |
| 2014 | 185044 | 6740 | 35721 | 1.48 |
| 2015 | 182811 | 7660 | 39293 | 1.51 |
| 2016 | 201090 | 8028 | 45429 | 1.59 |
| 2017 | 207608 | 9944 | 54309 | 1.68 |
| 2018 | 243391 | 11525 | 64279 | 1.66 |
| 2019 | 261612 | 13341 | 75375 | 1.78 |
| 2020 | 270424 | 14944 | 84241 | 1.92 |
Table 3.
Major innovation achievements in Fujian Province.
| Year | Patent applications | Technology market turnover(million yuan) | Sales revenue of new products of industrial enterprises(million yuan) |
|---|---|---|---|
| 2011 | 32325 | 3457 | 311389.14 |
| 2012 | 42773 | 5009 | 329115.24 |
| 2013 | 53701 | 4469 | 344009.97 |
| 2014 | 58075 | 3919 | 351170.53 |
| 2015 | 83146 | 5214 | 352555.47 |
| 2016 | 130376 | 4322 | 405266.01 |
| 2017 | 128079 | 7546 | 447667.89 |
| 2018 | 166610 | 8452 | 530089.84 |
| 2019 | 153279 | 13959 | 578931.19 |
| 2020 | 180399 | 16354 | 609754.92 |
Table 4.
Evaluation indicator system for high-quality economic development.
| Dimension | Secondary indicator | Indicator attribute |
|---|---|---|
| Gross regional product | + | |
| Economy | Total retail sales of consumer goods | + |
| Foreign direct investment | + | |
| Green coverage area | + | |
| Green | Industrial wastewater discharge | - |
| Comprehensive utilization of industrial solid waste | + | |
| Number of medical and health institutions | + | |
| Shared | Number of full-time teachers in general education | + |
| Number of employees in urban | + | |
| Urbanization rate of permanent resident population | + | |
| Coordinated | Number of permanent resident population | + |
| Per capita urban road area | + | |
| Engel’s coefficient in urban areas | - | |
| Livelihood | Per capita disposable income of urban residents | + |
| Number of participants in basic medical insurance | + |
Table 5.
Evaluation indicator system for innovation.
| Dimension | Secondary indicator | Indicator attribute |
|---|---|---|
| Internal R&D expenditure | + | |
| Innovation input | Government scientific and technological expenditure | + |
| Proportion of R&D expenditure to GDP | + | |
| Innovation output | Number of patent applications | + |
| Number of students in general education | + |
Table 6.
Weight of indicators for high-quality economic development.
| Indicator | Weight |
|---|---|
| Gross regional product | 7.3% |
| Total retail sales of consumer goods | 8.1% |
| Foreign direct investment | 10.7% |
| Green coverage area | 10.7% |
| Industrial wastewater discharge | 0.7% |
| Comprehensive utilization of industrial solid waste | 9.9% |
| Number of medical and health institutions | 4.3% |
| Number of full-time teachers in general education | 5.8% |
| Number of employees in urban | 9.0% |
| Urbanization rate of permanent resident population | 4.7% |
| Number of permanent resident population | 11.0% |
| Per capita urban road area | 5.8% |
| Engel’s coefficient in urban areas | 1.3% |
| Per capita disposable income of urban residents | 3.6% |
| Number of participants in basic medical insurance | 7.3% |
Table 7.
Weight of indicators for innovation.
| Indicator | Weight |
|---|---|
| Internal R&D expenditure | 7.3% |
| Government scientific and technological expenditure | 8.1% |
| Proportion of R&D expenditure to GDP | 10.7% |
| Number of patent applications | 10.7% |
| Number of students in general education | 0.7% |
Table 8.
Grey Correlation degree between innovation and high-quality development.
| Measuring indicator | Innovation input | Innovation output | Criteria level average | Target level average | ||||
|---|---|---|---|---|---|---|---|---|
| Economy | 0.7013 | 0.5326 | 0.7281 | 0.4574 | 0.6852 | 0.6209 | 0.6269 | |
| 0.7309 | 0.5507 | 0.7049 | 0.4694 | 0.6651 | 0.6242 | |||
| 0.5018 | 0.4026 | 0.9343 | 0.3660 | 0.9734 | 0.6356 | |||
| Green | 0.5227 | 0.4169 | 0.9923 | 0.3766 | 0.9189 | 0.6455 | 0.6126 | |
| 0.4457 | 0.3633 | 0.7896 | 0.3362 | 0.8594 | 0.5589 | |||
| 0.4964 | 0.3988 | 0.9197 | 0.3632 | 0.9893 | 0.6335 | |||
| Shared | 0.7217 | 0.9905 | 0.4978 | 0.7123 | 0.4812 | 0.6807 | 0.6112 | |
| 0.4404 | 0.3832 | 0.7767 | 0.3514 | 0.9416 | 0.6021 | |||
| 0.4791 | 0.3596 | 0.8740 | 0.3333 | 0.8445 | 0.5509 | |||
| Coordinated | 0.4695 | 0.3868 | 0.8491 | 0.3542 | 0.9573 | 0.6103 | 0.6143 | |
| 0.5064 | 0.3801 | 0.9469 | 0.3491 | 0.9283 | 0.5952 | |||
| 0.4543 | 0.4057 | 0.8109 | 0.3683 | 0.9604 | 0.6376 | |||
| Livelihood | 0.5737 | 0.3695 | 0.8887 | 0.3409 | 0.8840 | 0.5719 | 0.5383 | |
| 0.3881 | 0.4511 | 0.3401 | 0.4013 | 0.8212 | 0.6272 | |||
| 0.5271 | 0.4417 | 0.7942 | 0.5734 | 0.3350 | 0.4157 | |||
| Criteria level average | 0.5271 | 0.4555 | 0.7942 | 0.4102 | 0.8163 | |||
| Target level average | 0.5923 | 0.6133 | ||||||
Disclaimer/Publisher’s Note: The statements, opinions and data contained in all publications are solely those of the individual author(s) and contributor(s) and not of MDPI and/or the editor(s). MDPI and/or the editor(s) disclaim responsibility for any injury to people or property resulting from any ideas, methods, instructions or products referred to in the content. |
© 2023 by the authors. Licensee MDPI, Basel, Switzerland. This article is an open access article distributed under the terms and conditions of the Creative Commons Attribution (CC BY) license (http://creativecommons.org/licenses/by/4.0/).
Copyright: This open access article is published under a Creative Commons CC BY 4.0 license, which permit the free download, distribution, and reuse, provided that the author and preprint are cited in any reuse.


