Preprint
Article

Economic Power Dispatch of a Grid-Tied Photovoltaic Based-Energy Management Systems: Co-optimization Approach

Altmetrics

Downloads

151

Views

43

Comments

0

A peer-reviewed article of this preprint also exists.

Submitted:

03 July 2023

Posted:

04 July 2023

You are already at the latest version

Alerts
Abstract
The requirement for integration of power plants due to the cyclical rise in electrical energy consumption is due to fluctuating load demand with the current grid systems. This integration necessitates effective allocating loads to the power plants for a minimum grid-tied transmission line cost while meeting network constraints. In this paper, we formulate an optimisation problem of minimising the total operational cost of all committed plants transmitted to the grid while meeting network constraints and ensuring economic power dispatch (EPD) and energy management system co-optimization. The developed Particle Swarm Optimization (PSO) method resolve the optimisation problem using piecewise quadratic function to describe the operational cost of the generation units, and the B coefficient approach is employed to estimate the transmission losses. Intelligent adjustments are made to the acceleration coefficients, and a brand-new algorithm is suggested for distributing the initial power values to the generation units. The developed economic power dispatch strategy successfully demonstrated an imperative cost reduction with connected load of 850MW, 1263MW and 2630MW power demand are contrasted with previous PSO application cost values, maximum yearly cost savings of (0.55%, 91.87), (46.55%, 3.78), (73.86%, 89.10) respectively, and significant environmental-benefit. The proposed co-optimisation approach can enhance a significant self-consumption ratio compared to the baseline method.
Keywords: 
Subject: Engineering  -   Electrical and Electronic Engineering

1. Introduction

Renewable energy sources have opened a new era for stability enhancement and future load expansion in the power system. The regular increase in the cost of power from the grid, environmental concerns, and the depletion of fossil fuel reserves with or without market manipulation have in recent years increased electrical demand [1]. Photovoltaic (PV) campaigns, energy storage devices, and electric vehicles (EVs) are growing in popularity as the penetration of renewable energy resources (RESs) in distribution systems deepens [2]. The demand from the distribution networks may be met (in part) by such RESs, which can offer grid services like voltage regulation. For the total energy management system-and-transmission (EMS&T) networks, it becomes operationally desirable and economically sensible to incorporate RESs for energy delivery without interfering with distribution system operation [3]. The power networks of many nations are designed as a networked system that heavily relies on conventional sources of generation. To adapt to changing demands, this structure needs to be improved. Any nation's energy sector now requires integrated energy planning to grow sustainably [4]. The public policies necessary for the extensive expansion of renewable energy technologies and markets are being implemented by several emerging nations. Numerous nations have set a minimum 20% renewable energy (RE) contribution goal [5], while to encourage improvement and generation of alternate or renewable energy, the South African government has set a minimum renewable energy contribution goal [6]. Consequently, steps have been taken to diversify the nation's energy mix. South Africa published a white paper in 2003 outlining its plan to transition to renewable energy sources (biomass, wind, solar, and small-scale hydro) to provide 10 TWh of power. The foundation for the development of RE technologies in South Africa is provided by this policy paper. Then, in May 2011, an integrated resource plan was released, setting a new goal of adding 17,800 MW of renewable energy to the energy mix by 2030. A Renewable Energy Independent Power Producer's Programme (REIPPP) was established in 2011 to further entice private investment into the nation's energy transition. The REIPPP, an ambitious effort for renewable energy generation in South Africa, has three key focuses: lowering CO2 emissions; increasing generating capacity; and, ultimately, providing a path for economic growth. Currently, solar energy production makes up a very small portion of global generation. However, due to resource availability and declining system costs, it will be necessary to expand and integrate solar energy into the grid in the future [7]. A crucial job when taking renewable energy sources into consideration is striking a balance between power generation and load demand. This is a result of the fluctuation and unpredictability of power generation from renewable sources across time [8]. The sun's irradiance present at a site determines the solar panel's generation schedule. Seasons and time of day both have an impact on solar irradiance variations [9, 10]. For an accurate output value, the sun's irradiation must therefore be adequately modelled, simulated, and predicted using a variety of techniques.
Economic Power Dispatch (EPD) is a crucial and ongoing phase in a power system's operational planning. The process of allocating producing power to the grid units to supply the system load economically is described as the general economic dispatch problem [11]. In this scenario, constraints like generation caps, power balance, etc. are crucial factors to consider. Many researchers concentrated on the improvement in general economic dispatch problems, whereas research on dispatch considering renewables is limited [12, 13, 14]. Economic dispatch was initially implemented using equal incremental costs, then transmission loss and penalty factors were added subsequently [15]. Particle swarm optimisation (PSO), differential evolution (DE), genetic algorithms (GA), and evolutionary programming (EP) are examples of intelligent techniques that are used to solve complex dispatch problems that consider valve points, banned operation zones, and quadratic cost functions. [16]. For total transmission-and-distribution (T&D) systems, it becomes operationally desirable and economically sensible to incorporate RESs for energy supply without interfering with distribution system operation [17]. Joint generator-side and load-side control has been suggested in the literature to help with power balancing and frequency regulation in grid systems [18, 19]. The liberalisation of the energy market results in new types of competition and paradigm shifts in the process of producing electricity. Then, for energy contribution in the entire generation of electric power, distributed generation has attracted a lot of interest. The idea of microgrids is now emerging as a natural replacement for traditional electric power systems, where large synchronous generators in remote locations could be accompanied by smaller generators and shorter transmission lines close to the loads, providing an efficient and sustainable alternative for the full use of renewable energies [18]. Both traditional generators, such as thermal generators or diesel engines, and renewable energy sources (RES), such as wind turbines, solar systems, fuel cells, or battery energy storage systems (BESS), can be used as generation units in microgrids [19, 20]. It is crucial to keep in mind that RES projects' operations are unpredictable and vulnerable to disruptions, which makes it challenging to identify the optimum dynamic solution to a problem of economic dispatch [21]. Since conventional and emerging generation systems are physically constrained, energy management in microgrids aims to maximise some desired objective function that describes the cost behaviour, reliability, and efficiency of the system. It also determines the optimal energy dispatch (economic power dispatch). As a result, RES and BESS could handle challenging jobs involving connectivity to big power systems or serve as a technical substitute for managing excess or deficiency of generated energy in smaller grids while taking load changes into account [21, 22].The transmission system structure at the grid buses is often ignored in these studies, which instead focus on the distribution system dynamics by treating load buses as movable nodes. With fewer studies at the transmission level during the past ten years, a lot of work has been done on optimising RESs in distribution networks. Numerous problem formulations and resolution methodologies have been proposed to effectively coordinate RESs for voltage regulation, loss minimization, dispatching signal tracking, etc. [23]. When considering renewable grid injection and any requirements for grid optimisation, Kempener et al. [24] suggested that using smart grids over conventional systems is economically feasible. According to the type of grid reforms necessary to handle renewable energy, the literature on this topic has recognised three distinct levels of renewable penetration: low, medium, and high. Numerous studies on the integration of renewable energy systems into the grid have been done, focusing on different aspects. There are a few works on transmission and energy management system co-optimisation. The transmission and distribution networks and RESs are given specific models in [25, 26], and a multi-level solution approach is suggested to handle the subproblems for each layer in turn. A coordination approach is put forth in [27] by resolving the corresponding subproblems for the two levels. However, no well-defined joint (EMS&EPD) optimisation problem has yet been put forth in previous works, making it challenging to assess the overall effectiveness of their solutions. Additionally, since the joint (EMS&EPD) co-optimisation problem typically has a larger feasible set of solutions to find, solving the network operation cost at a time may not yield the best result. The outputs of the large generator’s connection and those of the RESs in the net-works are jointly optimised. A system for allocating, sizing, and analysing RES (solar PV generator sources) is presented. For the grid-tied PV power system to operate reliably, there must be a high penetration of intermittent RES. These swift reserves can be provided by aggregated and coordinated loads, but they represent energy-constrained and uncertain reserves (in terms of their energy status and capability). Optimisation-based strategies enable one to build a suitable trade-off between closed-loop performance and the resilience of the energy power dispatch to efficiently dispatch uncertain, energy-constrained reserves. The uncertainty linked to aggregations of RESs with energy constraints i.e., a localised energy storage system for each connected generator is therefore studied in this paper.
In this paper, we formulate an optimisation problem of minimising the total operational cost of all committed plants transmitted to the grid, while meeting network (power flow) constraints and ensuring economic power dispatch (EPD) at the transmission level. Optimised-based energy management systems are used to estimate the power flow of the grid-tied systems in simulated Matlab clear and cloudy weather conditions with seasonal variations for optimal solar PV and grid output for the EPD model. The rest of the paper is organised as follows: Section 2 describes the related works on energy management system-and-transmission. Section 3 presents the integration of solar PV modelling and estimation of power output from a PV array and economic dispatch problem. In Section 4, results and discussion are presented on the integration of solar energy into economic dispatch and the cost optimisation for various scenarios are described. Section 5 concludes the paper.

1.1. Problem Overview

The reliability issues caused by the uncertain behaviour of RESs are caused by their dependability on naturally occurring phenomena such as varying light intensity, weather conditions, and irradiance. These inadequacies make RES uneconomical and challenging to integrate into electric grids that are rivalled by conventional hydrocarbon fuel-based generations. One of the practical methods to rise above these deficiencies is to install dispatchable generation RESs into the electric grid, such as energy storage systems (ESSs) [28]. Integration of such RESs with higher seasonal variations is economically beneficial to use with these conventional existing power generation sources, but this increasing diversity of generation sources makes the operating strategy for these hybrid grids a challenging problem, and the cost characteristics of each RESs generators produced power is also a nonlinear function [29]. The problem of achieving minimum cost is primarily focused on in this paper, presented as the total operating cost objective function.
1 = i = 1 T ( g = 1 N G C G P G i + i = 1 N R C r P r i + v = 1 N V C V P V i ) + E b a t t + γ ,
C G P G i is the grid cost function, C r P r i is the grid transmission line spinning reserve operating cost, and C V P V i are the cost functions for solar PV generator and E b a t t is battery model equation.
C g P G i = g = 1 N G N G ( a g P G i 2 t 2 + b g P G i t + c i ) ,
C r P G i = r = 1 N R N R ρ r P r i t ,
C v P V i = v = 1 N V N V τ v P V i t V ,
As illustrated in equations (2) to (4), a i P G i 2 + b i P G i + c i implies as (operating cost of solar PV and Grid); ai, bi and ci are the unit coefficients of power cost and P G i is the unit output i of the real power. Note that in this paper t = 1 , denotes a simulated period. The second component of the total cost, which is the renewable component of the model indicated in (5),
γ = i = 1 T ( α ( g = 1 N G N G P G i + v = 1 N V N V P v i ) + v = 1 N V N V P v i ) ) + ,
Where the percentage-based renewable requirement is the penalty imposed on grid transmission line for failing to meet the customer obligation. The sign function (.)+ is equivalent to 0 in the absence of RES fulfilment requirement. The energy regulator often gives the penalty γ as an annual amount. It is possible to convert this penalty value into a daily penalty value that reflects the daily efficient dispatch of power.

1.1.1. Constraints

The power balance constraints are the total generation 1 as equal to total system power demand   P D plus transmission loss P L o s s
1 =   P D + P L o s s ,
The power plant geographical distributions and grid-tied transmission losses are function of its value and number of unit’s generation expressed as quadratic functions:
P L o s s = i = 1 m j = 1 m P i B i j P j + i = 1 m B 0 i P i + B 00 ,
Inequality constraints:
The power generation of all the grid bus has maximum and minimum limits. P G i m i n P G i P G i m a x , Where P G i m i n , P G i m a x are the maximum and minimum grid bus output limits?
The power output of any generator has a maximum value dependent on the rating of the generator with a minimum limit set by capacity factor of the solar PV plant. The economic dispatch problem has been scheduled based on the following constraints.
Equality Constraints i 1 n P G i = P D
Inequality Constraints P G i m i n P G i P G i m a x
The plants operated with equal incremental operating cost till their limits are violated as soon as the plant reaches the limits (maximum and minimum) its output is fixed at that point and is maintained constant.

2. Materials and Methods

2.1. Numerical study and Simulation of different case studies

Proposed dispatch cases studies depend on estimations of power generation into the grid systems and electric load demand. In this section, a detail description of these mathematical models is given. The generation sources discussed in this paper can be categorized into two types related to their capability of controlling power generation. First, dispatchable, which can control the power dispatch, e.g., coal, fuel cell, micro gas turbine. Second, non-dispatchable, which lacks the dispatch ability, for example, solar PV. The grid relates to the RESs via a single point which is called the Point of Common Coupling (PCC).

2.1.1. Non-dispatchable Energy Sources

2.1.1.1. Solar Photovoltaic (PV)

Solar Photovoltaic (PV) is a non-dispatchable energy source which harvests electric power from solar radiations. The solar power plants are viewed as lossless considering the literature review on EPD and renewable energy sources, and the climatic consequences of their power outputs are not considered [30]. Due to the resistance and reactance of the transmission lines, which are used for both the transfer of solar power and grid electrical energy, there will be significant losses. The irradiance, which in turn depends on the environmental conditions, determines the solar power. In this paper, a set amount of loss is considered when transmitting grid power across the current transmission lines. The case studies are taken into consideration for various climatic circumstances (clear and cloudy conditions) because the output of solar power is climate dependent. The cost of installation is not considered in this model because it is anticipated that public utilities will develop solar power plants. The objective of the economic power dispatch problem of electrical grid power is to schedule the committed electrical power generated outputs to meet the required load demand while satisfying the system equality and inequality constraints.

2.1.1.2. Model for Economic Power Delivery Coordination Using Solar PV Energy

The output power of a solar panel is mostly dependent on estimating varied irradiance values, which calls for an appropriate functional model. The Matlab function was simulated to obtained seasonal solar irradiance model data before in the function. This function estimates the output of a solar panel based on clear and cloudy days, and then calculates the overall output of all solar PV systems.
The second objective function increases the level of RES energy penetration and optimal power flow, as presented in Ref. [31]. In addition to the total operating cost in (1), the maximisation is shown in (8).
2 = i = 1 T ( v = 1 N V P V i i ) ,
This solar-generated electricity is included at that point of common connection and is seen as negative demand. The results of economic power dispatch utilising this model are then compared. The electricity produced by PV arrays is regarded as a negative load for incorporating solar PV energy into the existing grid bus (9), and revised as the optimal power flow optimization problem, formulated to maximise the economic benefits of large-scale solar PV and hybrid energy generators in a time horizon of T intervals, modelled to minimize the cost function of energy generation to satisfy the operating constraints for optimal power output.
Minimise:
C R T P V , u = F P G k = 1 N G C i P G i ,

2.1.1.3. Constraints

Subject to total power generated by the grid-tied solar PV is equal to the demand per hour at each load bus.
g = 1 N G N G P G i + v = 1 N V N V P V i = b = 1 N B N B P b , i i ,
Subject to grid-tied bus maximum permitted ramp rate shown in constraints (11) through (14)
P G i P G i 1 U G i i , G ,
P r i P r i 1 U R G i i , τ ,
g = 1 N G N G P G i + v = 1 N V N V P V i = b = 1 N B N B P b , i i ,
P r i 1 P r i D R G i i , τ
Subject to grid-tied bus, and solar PV maximum capacity limitations (15) to (17)
P G i < m i n ( P G , m a x P G i 1 + U R G t ) i .
P G i < m a x ( P G , m i n P G i 1 + U R G t ) i .
P V i P V i m a x i .
Subject to total spinning reserve of the grid-tied bus constrained by the generator's capacity
P G i + P r i P G m a x i , G .
Subject to each generator's maximum spinning reserve, not greater than -tied bus capacity.
0 P r i S S R r m a x i .
constraints (20) present dispatch period's spinning reserve not greater than the system's spinning reserve requirements
r = 1 N G N R P r i S S R i ,
In case of RES generators unable to provide any power, constraints (21) make sure that there is enough spinning reserve requirement S S R r . m a x to ensure that the demand can be met by the grid-tied bus.
i = 1 N G N G P G i + r = 1 N R N R P r i b = 1 N B N B P b , i ,
the power flow restrictions are represented by constraints (22) and (23) and are calculated using optimal power flow.
P L o s s m a x P L i P L o s s m a x i , l ,
P i L o s s = g = 1 N G N G G G l o s s P G i + v = 1 N V N V H V L o s s P V i b = 1 N B N B H b L o s s P b i ,
Total generation should meet total power demand and can be determined from optimal power flow as
P D ' = P D G i V i S = 1 n P G i + P V i S ,
Where P D ' : New Power Demand, and i S = 1 n P V i S is the sum of solar PV generators.

2.1.2. Dispatchable Energy Sources

2.1.2.1 Batteries

The battery’s function is to store electricity, absorb extra and fluctuating electric power, and discharge power in times of need. When it is economical or when no excess energy is obtainable, the batteries get recharged by the grid. The electric power flow cycles of a battery bank rely on the following constraints: minimum discharge level, self-discharge rate, recharging cycles, shelf life, and recharge/discharge rate. The battery storage charge model can be formulated as follows:

2.1.2.1. Model of battery charge storage

Unreliable renewable energy sources (RES) are the main cause of the microgrid's peaks and gorges. The seasonal changes affect a higher percentage of the microgrids if we take them into account. Dispatched energy sources, on the other hand, produce less uncertainty and fluctuation, and their societal cost is already recognised. Another key player in the power dispatch strategy is an energy storage system (ESS), which is handled in a specially optimised manner due to its limits. The main goals are to cut back on social costs and grid interactions. The cumulative societal cost equation for RES is described as ESS performing a different role from the other microgrid components. By charging the ESS when power is virtually free (coming from the RES) or when the utility grid price is the lowest, while the charge quantity in each battery is determined by the SOC, which is measured by estimation methods [32, 33]. By combining two methods, ESS can reduce societal costs as follows: 1) profiting from the pricing differentials between peak and off-peak hours; 2) recharging from RES with excess energy reduces transmission. In this paper, responsive ESSs are distributed as balancing reserves and have baseline consumption (i.e., aggregated baseline consumption of individual flexible loads in an ESS). The ESS can react to the mismatches brought on by forecast errors by regulating its controlled load over time. Any reduction (increase) in the ESS's consumption compared to the starting point is referred to as discharging. Since the ESS are responsive, they constitute a valuable resource to address demand-supply mismatches at high levels of renewable penetration. The ESS's energy-constrained properties, in contrast to those of a traditional generator, demand careful management of its state of charge. This work shows that the only factors affecting an ESS's energy evolution are the net charging orders. In addition, unlike grid-tied batteries, the system operator's level of flexibility is unknown and time-varying. In other words, the system operator's access to an ESS's flexibility can be translated into upper and lower limits on the ESS's energy state. These upper and lower boundaries depend on several stochastic factors, such as the weather and human behaviour. Here, ESSs are modelled with chance constraints and are formulated probabilistically to account for these factors.
Equations (25) and (26) describe the explicit battery operating cost model while charging and discharging:
C c h a r g i n g = C b a t t C + C b a t t C , m a x ,
C d i s c h a r g i n g = P b a t t D + P b a t t D , m a x ,
Subject to power constraints for ESS charging or discharging power constraint P e s s m i n P e s s P e s s m a x , ESS is charged, P e s s < 0 ; when ESS is discharged, P e s s > 0 The local optimisation function in equation (27) for minimizing the total operating cost of renewable energy production, while accounting for uncertainty grid constraints is given as equation (28) and equation (29) was adapted from the work of [34]. These models will be developed in real-time, with intra-hour dispatch intervals, while accounting for operating and security limitations following the guided model.
t = 1 N s u b i = 1 N g C G i P G i + t = 1 N s u b i = 1 N w C P V ( P V ) ) ,
Subject to grid power network constraints
max P G i m i n , P G i T 1 R G i d o w n P G i min P G i m a x , P G i T 1 + R G i u p V D k m i n V D k m a x ,
The mathematical modeling of the MINLP solvers (equation 29 -30) to compute the lower bound on the optimum objective function’s inputs obtained by enlarging feasible sets i.e., ignoring constraints is guided by the work of [35].
z M I N L P = min f x x Ƞ ,
Ƞ is the charging and discharging efficiencies of the batteries, subject to g as 0 P b a t t C P b a t t C , m a x u b t C   0 P b a t t D P b a t t D , m a x u b a t t D (x) is an objective function or cost function (minimisation) or grid function (maximisation) for an optimal solution x X , x I Z / I / for all i ∈ I.
For a convex function f x : R n R , g : R n R m smooth sometimes convex functions applied to the expected battery energy storage of solar PV variable are bounded by the real power output of the convex function of the charging or discharging of the battery given as
E b a t t = E b a t t 1 + P b a t t C Ƞ b a t t C t P b a t t D 1 Ƞ b a t t D t .
Having constraints 0 E b a t t E b a t t c a p that ensures the energy in the battery does not exceed the storage capacity E b a t t c a p with total power as P b a t t = P b a t t D P b a t t C .

2.1.2.3. Proposed optimised-based energy management system

The study of optimization-based EMS can be enriched by the developments of computational and mathematical programming methods, which predate the invention of digital computers and have revolutionized computation and numerical optimization. Design variables cannot take random values in many practical applications because they must fulfill certain electrical or physical constraints. These limitations, also known as design constraints, are crucial for ensuring the stability and security of the system. The mathematical modeling restrictions is typical of the multi-objective function’s inputs for hybrid energy systems [38].
The study adopted convex MINLP, which rests on the mixed-integer quadratic program for an energy system with storage and found a near-optimal solution for which a heuristic was developed in the branch-and-bound implementation of the model that facilitates online implementation [39]. The fundamental branch-and-bound approach, often known as the branch-and-cut (B&C) method, has been developed throughout the history of integer programming. This indicates that to tighten the formulation, in addition to branching, extra valid inequalities or cuts are placed at the nodes of the branch-and-bound tree. The variables to control the energy supply-demand balancing problem and power flow within different RESs in real-time were motivated by this study. To investigate a broad and complex solution space with numerous objectives for utility integration while using a guiding particle search optimization algorithm and various optimization problems. To compare its performance to other well-known optimization approaches described in the literature, the proposed PSO has been used to solve EPD problems for several test systems that has been developed using the R2022b (Matlab 9.9) window environment.

2.1.2.3. Economic Power Dispatch Problem

Kennedy and Eberhart introduced PSO as a multi-agent parallel search optimisation method in 1995 [40]. PSO served as swarm theory inspiration for the evolutionary strategy for a social behaviour of fish, bird flocking [41] and the PSO concept depends on applying different particles to find the best answer, every particle in the PSO algorithm represents a potential solution, and the optimisation objective function evaluates these solutions to determine their fitness [42, 43]. The number of answers doubles in the iteration until the best one is found, while more particles are imposed in each iteration, which promotes finding the best solution and cuts down on the number of optimisation iterations. Particles move around in a multidimensional search space in quest of the best solution. The particle memory (pbesti) stores the best experiences from each particle, and the best overall result from all particles is referred to as the global best particle (gbest). The following equations describe how each particle (i) adjusts its present position (xi) and velocity (vi) during flight based on its own experience and the experience of nearby particles. The economic dispatch problem aims to reduce the cost of supplying energy subject to restrictions on the static behaviour of the producing units, assumes that the amount of power to be delivered by a given set of units is constant for a certain period. However, plant operators work to keep gearbox slopes within safe bounds to prevent reducing the life of their equipment. This restriction typically manifests as a cap on the rate at which the power output can grow or decrease. The dynamic economic dispatch is distinguished from the conventional, static economic dispatch by such ramp rate limits. The dynamic economic dispatch cannot be solved for a single value of the load because these ramp rates limitations affect how the generators' output changes over time. Instead, it tries to reduce the cost of providing a specific demand profile. One of the primary roles of the operation and control of the power system is the dynamic economic dispatch. It is a technique for allocating the outputs of the online generator to the anticipated load needs over a specific time period in order to run an electric power system as economically as possible while maintaining system security. Given the limitations placed on system functioning by generator ramping rate limits, this issue is one of dynamic optimisation. The most precise version of the EPD problem is the dynamic economic dispatch, which is also the most challenging to answer due to its high dimensionality [44, 45].

2.1.2.4. Particle Search Optimisation Model formulation

The PSO algorithm has two major equations. Equation (31) is the velocity equation, in which each particle in the swarm changes its velocity based on the computed values of the individual and global best solutions as well as its current position. Individual and social acceleration factors are represented by the coefficients c 1 and c 2 . They are known as trust parameters, with c 1 representing a particle's confidence and c 2 representing a particle's confidence in its neighbours. They define the stochastic influence of cognitive and social behaviours in conjunction with the random numbers r 1 k i and r 2 k i . For the formulation of the PSO, which is denoted as the stochastic vector v k i is given by
v k i = c 1 r 1 k i P k i x k i + c 2 r 2 k i P k g x k i .
Where r 1 k i and r 2 k i represents two uniform real random scalar numbers between 0 and 1., updated at every iteration k , and for each solar PV generation sources i in the swarm. Hence r 1 k i and r 2 k i simply scale the magnitudes of the cognitive and transmission line powers c 1 r 1 k i P k i x k i and c 2 r 2 k i P k g x k i . Studying the stochastic contribution v k i in the composition of instantaneous search domain given in equation 52. The cognitive vector P k i x k i and transmitted powers P k g x k i consist of the directions and distances from the solar generator’s location x k i to the best solar generator’s location P k i , and the best global location P k g ; the cognitive and transmitted powers can be anything from normal to parallel w.r.t. each other. When the cognitive vector P k i x k i and the transmitted powers ( P k g x k i ) are not parallel, eq. (32) may be interpreted as the vector equation of a bound plane P k i in n-dimensional space. The plane is bounded since the length of the cognitive and social vectors are scaled independently by the finite scalars c 1 r 1 k i and c 2 r 2 k i .
The angle θ ¯ between the cognitive vector P k i x k i and the transmitted powers ( P k g x k i ) may be determined using.
θ ¯ = cos 1 ( ( P k i x k   i )   *   ( P k g x k i ) ( P k i x k   i ) ( P k g x k i ) .
If θ ¯ = 0 , the vectors ( P k i x k i ) and ( P k g x k i ) are parallel, when θ ¯ = 90 , the vectors ( P k i x k i ) and ( P k g x k i ) are perpendicular. Scaling each solar PV generators sources independently, each component of ( P k i x k i ) and ( P k g x k i ) are replaced with scalar random numbers in the stochastic vector from r 1 k i and r 2 k i to R 1 k i and R 2 k i :
v k i = c 1 R 1 k i P k i x k i + c 2 R 2 k i P k g x k i ,
The R m k i random diagonal matrices are explicitly given as
R m k i = P 11 k i 0 0 P 22 k i 0 0 0 P n n k i   , m = 1,2 ,
With 0 < P j j k i < 1 , j = 1 , . . , n a uniform random number for an independently scaled solar PV generators sources.

3. Proposed Co-Optimization of EPD and EMS PSO Algorithm

To design the best scale of RES capacity, a new proposed particle swarm optimisation (PSO) technique is introduced. Operating energy costs, as well as transmission line losses (TLLs), have been defined as objective functions for optimal solar PV generator allocation and sizing. The optimisation approach employs multi-objective particle swarm optimisation with different scenarios for optimal operation under various operating situations. This study makes a novel contribution by employing a new PSO algorithm for optimal size while accounting for time variation. The simulated grid-tied photovoltaic-based energy management systems are presented in this section. Optimised-based energy management systems are used to estimate the power flow of the grid-tied systems in simulated Matlab clear and cloudy weather conditions with seasonal variations for optimal solar PV and grid output for the EPD model. The findings obtained utilising the newly proposed optimisation program demonstrate a high potential for the deployment of solar PV energy sources in terms of lowering energy and TLL costs and enhancing system operational conditions.

3.1. EMS Classical Algorithm

  • Step 1 - Input Decision Variables Lower &Upper bound; for battery MinMax(PgridV, PbattV, EbattV)
  • Step 2 - Minimize cost of electricity from the grid Objective dt*cost*PgridV – FinalWeiht*EbattV(N)
  • Step 3 - Power input/output to battery Constraints.energyBalance = Optimconstr(N)
  • Step 4 - Power load with power from PV, grid and battery Constraints.loadBalance = Ppv+PgridV+PbattV-Pload
  • Step 5 - Linear Program Options = Optimoptions(prob.optimoptions,)
  • Step 6 - Parse optimization results

3.2. Solar PV – Battery – Grid Algorithm Steps

  • Step 1- PSO Settings
set.Nparticle; set.Niteration; set.weight; set.c1; set.c2;LGS;COESS;Voltage; set.Npv_min&max; set.Nbat_minmax; set.Ngrid_minmax
  • Step 2 -Initiate Particles
particle.position; particle.velocity; particle.best_position; particle.best_LGS;particle.best_COESS;particle.best_Mark;particle=repmat(particle,1,set.Nparticle);best_global.position=[]; best_global.LGS=[]; best_global.COESS=[];best_global.Mark=[];log_global=repmat(best_global,1,set.Niteration);
  • Step 3 - Initiate condition
temp_InitiateP(:,1)=randi([set.Npv_min,set.Npv_max],set.Nparticle,1);temp_InitiateP(:,2)=randi([set.Nbat_min,set.Nbat_max],set.Nparticle,1);
temp_InitiateP(:,3)=randi([set.Ngrid_min,set.Ngrid_max],set.Nparticle,1); for n_par=1:set.Nparticle particle(n_par).position=temp_InitiateP(n_par,:); particle(n_par).velocity=[0 0 0]; end clear n_par
  • Step 4 - Main PSO
for n_ite=1:set.Niteration
for n_par=1:set.Nparticle
Calculate Mark; Bestparticle; Best Global; Velocity & New Position; Round Position; Limit Position
  • Step 5 - Results
tpro=toc; fprintf('The optimum system size is:\n Npv=%d\n Nbat=%d\n Ngrid=%d\nwith the LGS = %.3f%% and COESS = $%.2f\nCompute in %.2f s\n',... best_global.position,best_global.LGS*100,best_global.COESS,tpro);beep;

3.3. EPD PSO Algorithm Steps [49]

  • Step 1 - Problem definition
    • Z=F(X) = P=PminActual+(PmaxActual-PminActual). *x
    • Create a parse.m function P=ParseSolution(x,model)
    • InputPmin=model.Plants.Pmin; Pmax=model.Plants.Pmax; P=Pmin+(Pmax-Pmin).*x; PZ=model.Plants.PZ; nPlant=model.nPlant; for i=1:nPlant; forj=1:numel(PZ{i})if P(i)>PZ{i}{j}(1) && P(i)<PZ{i}{j}(2)% Correction
    • CreateModel for 3, 6, 15 Units committed generators variables; with power demand of committed generators (particles) with uniformly random distribution Pmin, Pmax, alpha, beta, gamma, P0, UR, DR, transmission loss and over X (position).
    • Develop CostFunction -@(x) MyCost (x, Model);
    • Develop a model calculation C=alpha+beta.*P+gamma.*P.*P; PL=P*B*P'+B0*P'+B00;
    • Decision Variables nVar = Model. nPlant (lower and upper bound for 3,6,15 Units committed generators variables
  • Step 2 - PSO Parameters
    • MaxIt – no of iteration; nPop – Swarm Size; Constriction Coefficient – C1 = chi*phi 1 as personal Coeff., C2 = chi*Phi 2 as Global Coeff.; Velocity Limit
  • Step 3 - Initialisation
    • BestSol.Cost = inf; for i=1; nPop, initialise position; initialise Velocity;
    • Evaluation of each committed generators cost model considering the objective function value.
    • Z=F(X) = P=PminActual+(PmaxActual-PminActual). *x; with or without prohibited zones
    • Evaluation; Update Personal Best; Update Global Best; BestSol = Particle(1)’Best
  • Step 4 - PSO Main Loop
    • It-1, MaxIt; for i=1: nPop, Update Velocity; Apply Velocity Limits; Update Position, Velocity mirror effect; Apply Position Limits; Evaluation; Update Personal best
    • Run PSO Matlab codes by calling functions (problem definition; PSO parameters; constriction coefficients; velocity limits; initialization of particles, position, evaluation; update personal best; update global 'Best Cost')
    • Results - Plot (Best Cost, x label, Y label)
    • Update generators’ velocities.
    • Move particles to their new positions CostFunction(particle(i).Position);
    • If all committed generators present position is better than the previous best position, update the value particle(i).Cost<particle(i).Best.Cost
    • Find the best committed generator update BestCost(it)=BestSol

4. Simulation Results and Discussion

4.1. EMS Simulation Results

The operational behaviour of the hybrid energy management system is the main question of the study. Next, a comparison with the cost function without the battery's daily operating costs. The FMINCON technique is used in the MATLAB environment to resolve the optimisation problem. FMINCON optimisation solver methods utilise optional input in addition to active set and interior point chosen from the work of [31]. The authors adapted the work of [46, 47, 48] on the grid-tied solar PV and grid patterns hybrid energy systems operational behaviour and co-optimisation approach (EPD & EMS), using the following data (Vrms =5000, 60 Hz, with an initial power of 10 MW) in a Matlab environment using the FMINCON algorithm. Three phase utility point of common connection data (Vrms = 6600, phase angle = 0.007, initial power 10 MW). Energy storage capacity (ESS = 25000 kwh, Pmin = 400 kw maximum discharge rate, Pmax = 400 kWh maximum charge rate), battery SOC is 20–80%, initial SOC is 50%, SOC to recharge is 11%, SOC recharge rate is 50, battery capacity = 3.6 MW. Figure 1 (a) shows the energy usage exceeding 500 kWh during clear days in the heuristics approach simulation, and the load demand profile illustrated in Figure 1(b) reaches a peak of 800 kWh during cloudy days in the heuristics approach simulation adopted for the period.
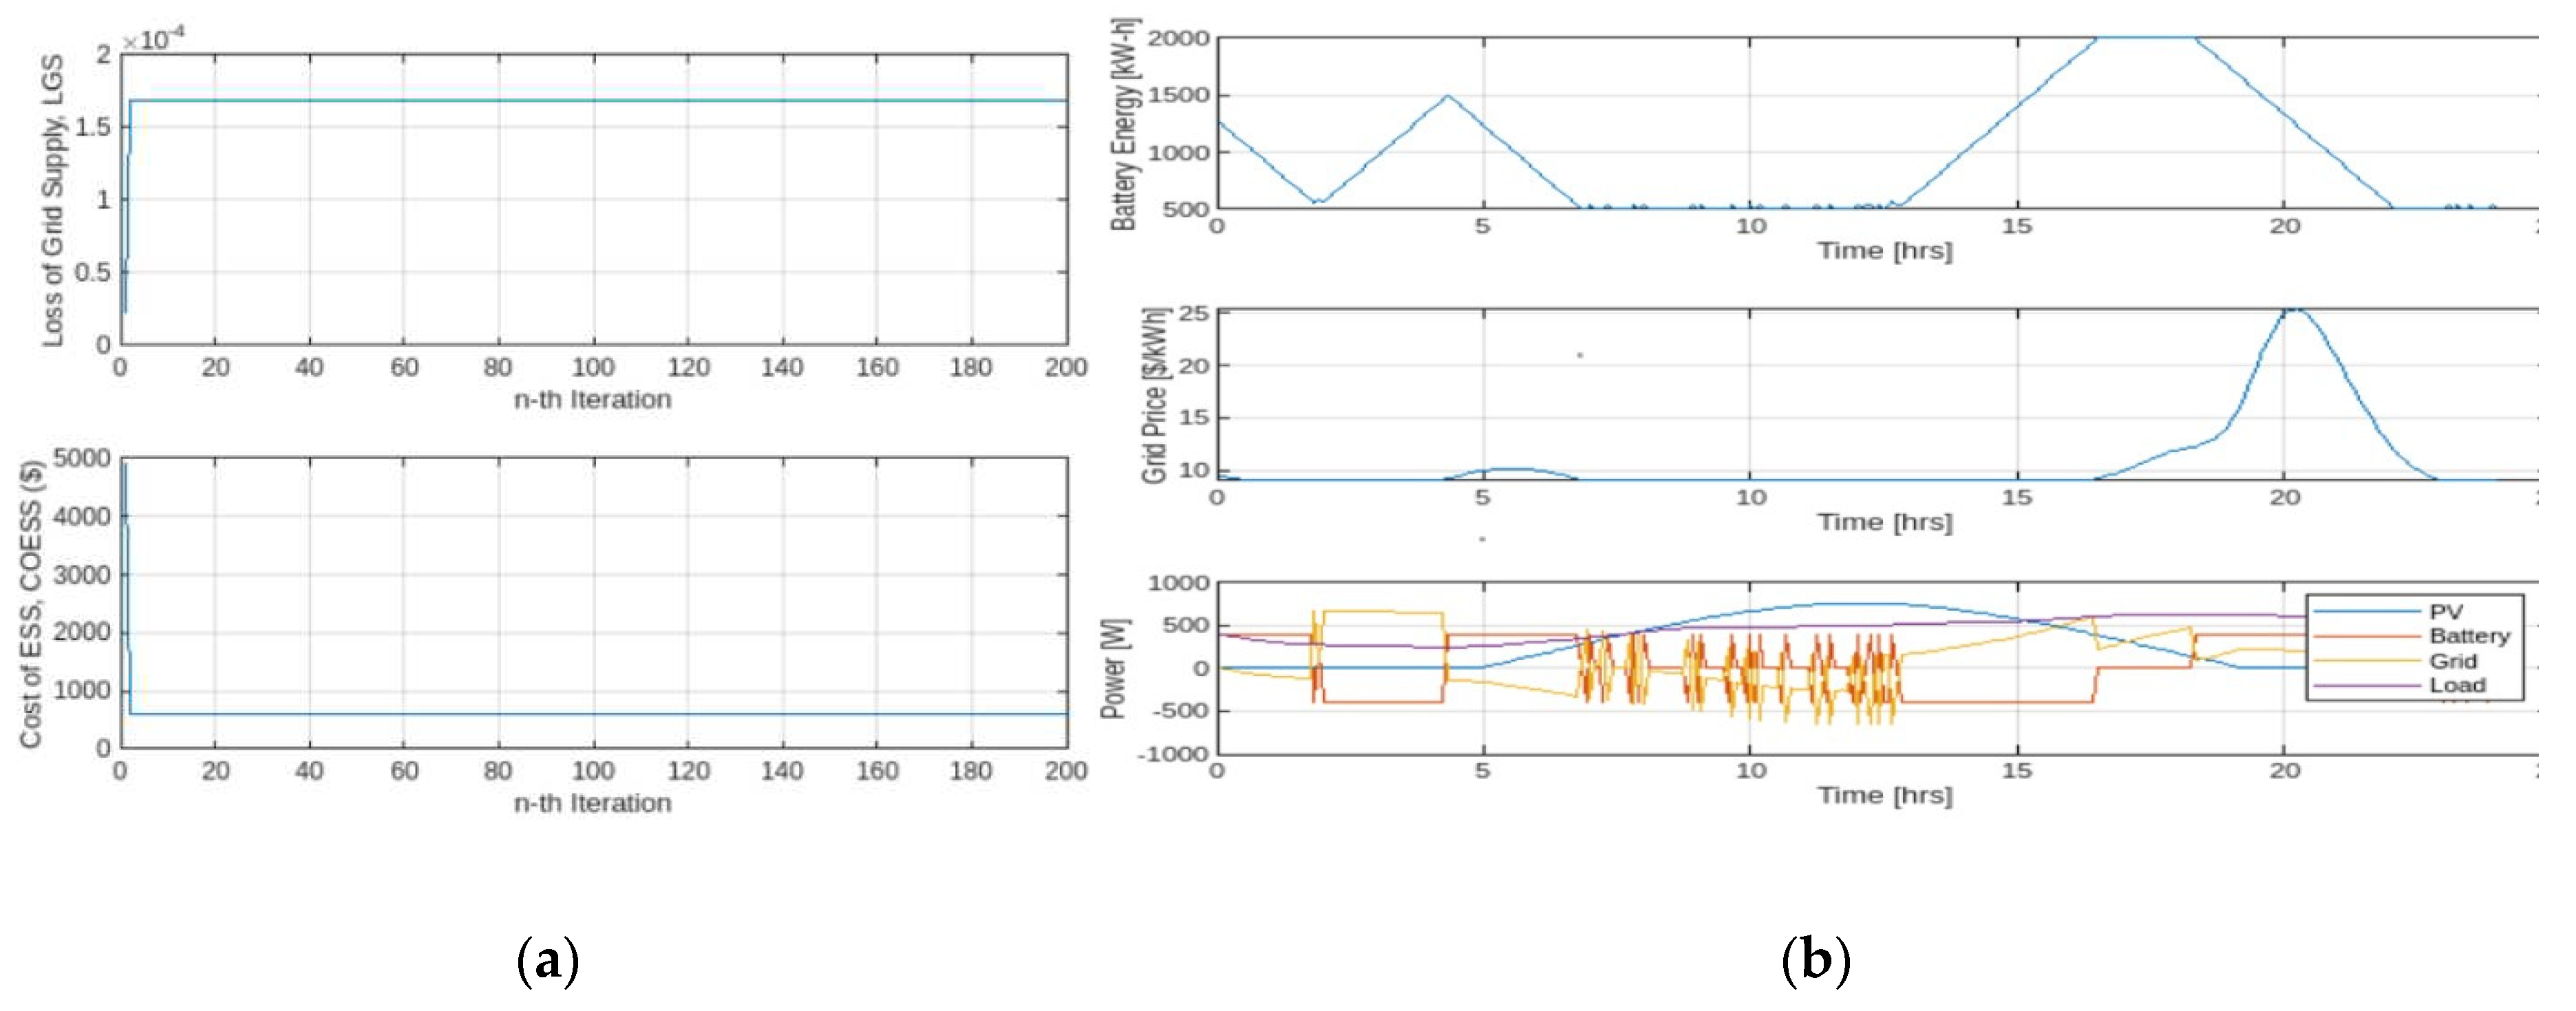
The ESS receives data from the EMS optimisation commands and then performs the appropriate energy generation and load balancing actions in either grid-connected or off-grid mode operating. The ESS is crucial in handling demand side management. In this simulation model, two forms of EMS are used: the heuristics technique and the linear optimisation method. Eq. (30) is used to compute the SoC energy restrictions of the battery limits. It should be emphasised that while SoC cannot be directly measured, it can be obtained through SOC estimating and monitoring methods. The charging and discharging rate restriction is then determined using eq. (33 -35). When the SoC is at its maximum (SoC = maximum SoC) storage capacity, the individual solar PV power generator runs in accordance with the EMS's mode recommendations. The energy restrictions of the battery SoC will be kept between 20% and 80% SoC, which will be beneficial to battery health and life cycle. Emax, the initial battery energy, is computed with 50% SoC assumed for the ideal scenario. However, in this suggested microgrid, a lithium-ion battery with the lowest 10% SoC energy is employed, so that more saved energy can be injected into the grid-tied transmission bus when needed. The ideal cost is the cost of grid energy once optimised, whereas the baseline cost is the price that the consumer should pay without optimisation. The tariff mentions the grid energy that was imported to power the load and battery storage system. The surplus of solar PV and energy storage sold to the utility grid is the revenue. Figure 2 depicts the cost savings computation. The optimum system size is:
Npv=6600
Nbat=6600
Ngrid=6600
with the LGS – loss of grid supply = 0.017% and,
COESS – cost of energy storage system = $594.00
Compute in 0.19 s

4.1. EPD Simulation Results

The simulation EPD covers thermal units with data obtained from coal power plants on South Africa's energy giants (Eskom) and solar PV installations from the Solar PV Installation Company South Africa website. The total power demand is 850MW, 1263MW AND 2630MW, with the chosen maximum iterations of 2 for external PSO and 100 for internal PSO. The quadratic cost functions for the cost of conventional generated power was based on characteristics of input-output of the plants data from the literatures, while the input-output of solar PV plants are free of cost. The assumed costs are the operational which are the subject of the paper. The PSO algorithm is programmed by Matlab 2020b and operated under Intel Core i7 and Windows 10 using two unimodal functions and two multimodal functions to facilitate the original minimum problem calculation through transformation into a maximum value of 200 iterations. The effectiveness of the proposed EPD problems with different load demands and numbers of generating units is tested through cases 3-units, 6-units, and 15-units with and without generation coefficient for all thermal and without generation coefficient all solar PV units. The cases are:

4.1.1. Case 1: 3-unit generator system with demand of 850 MW

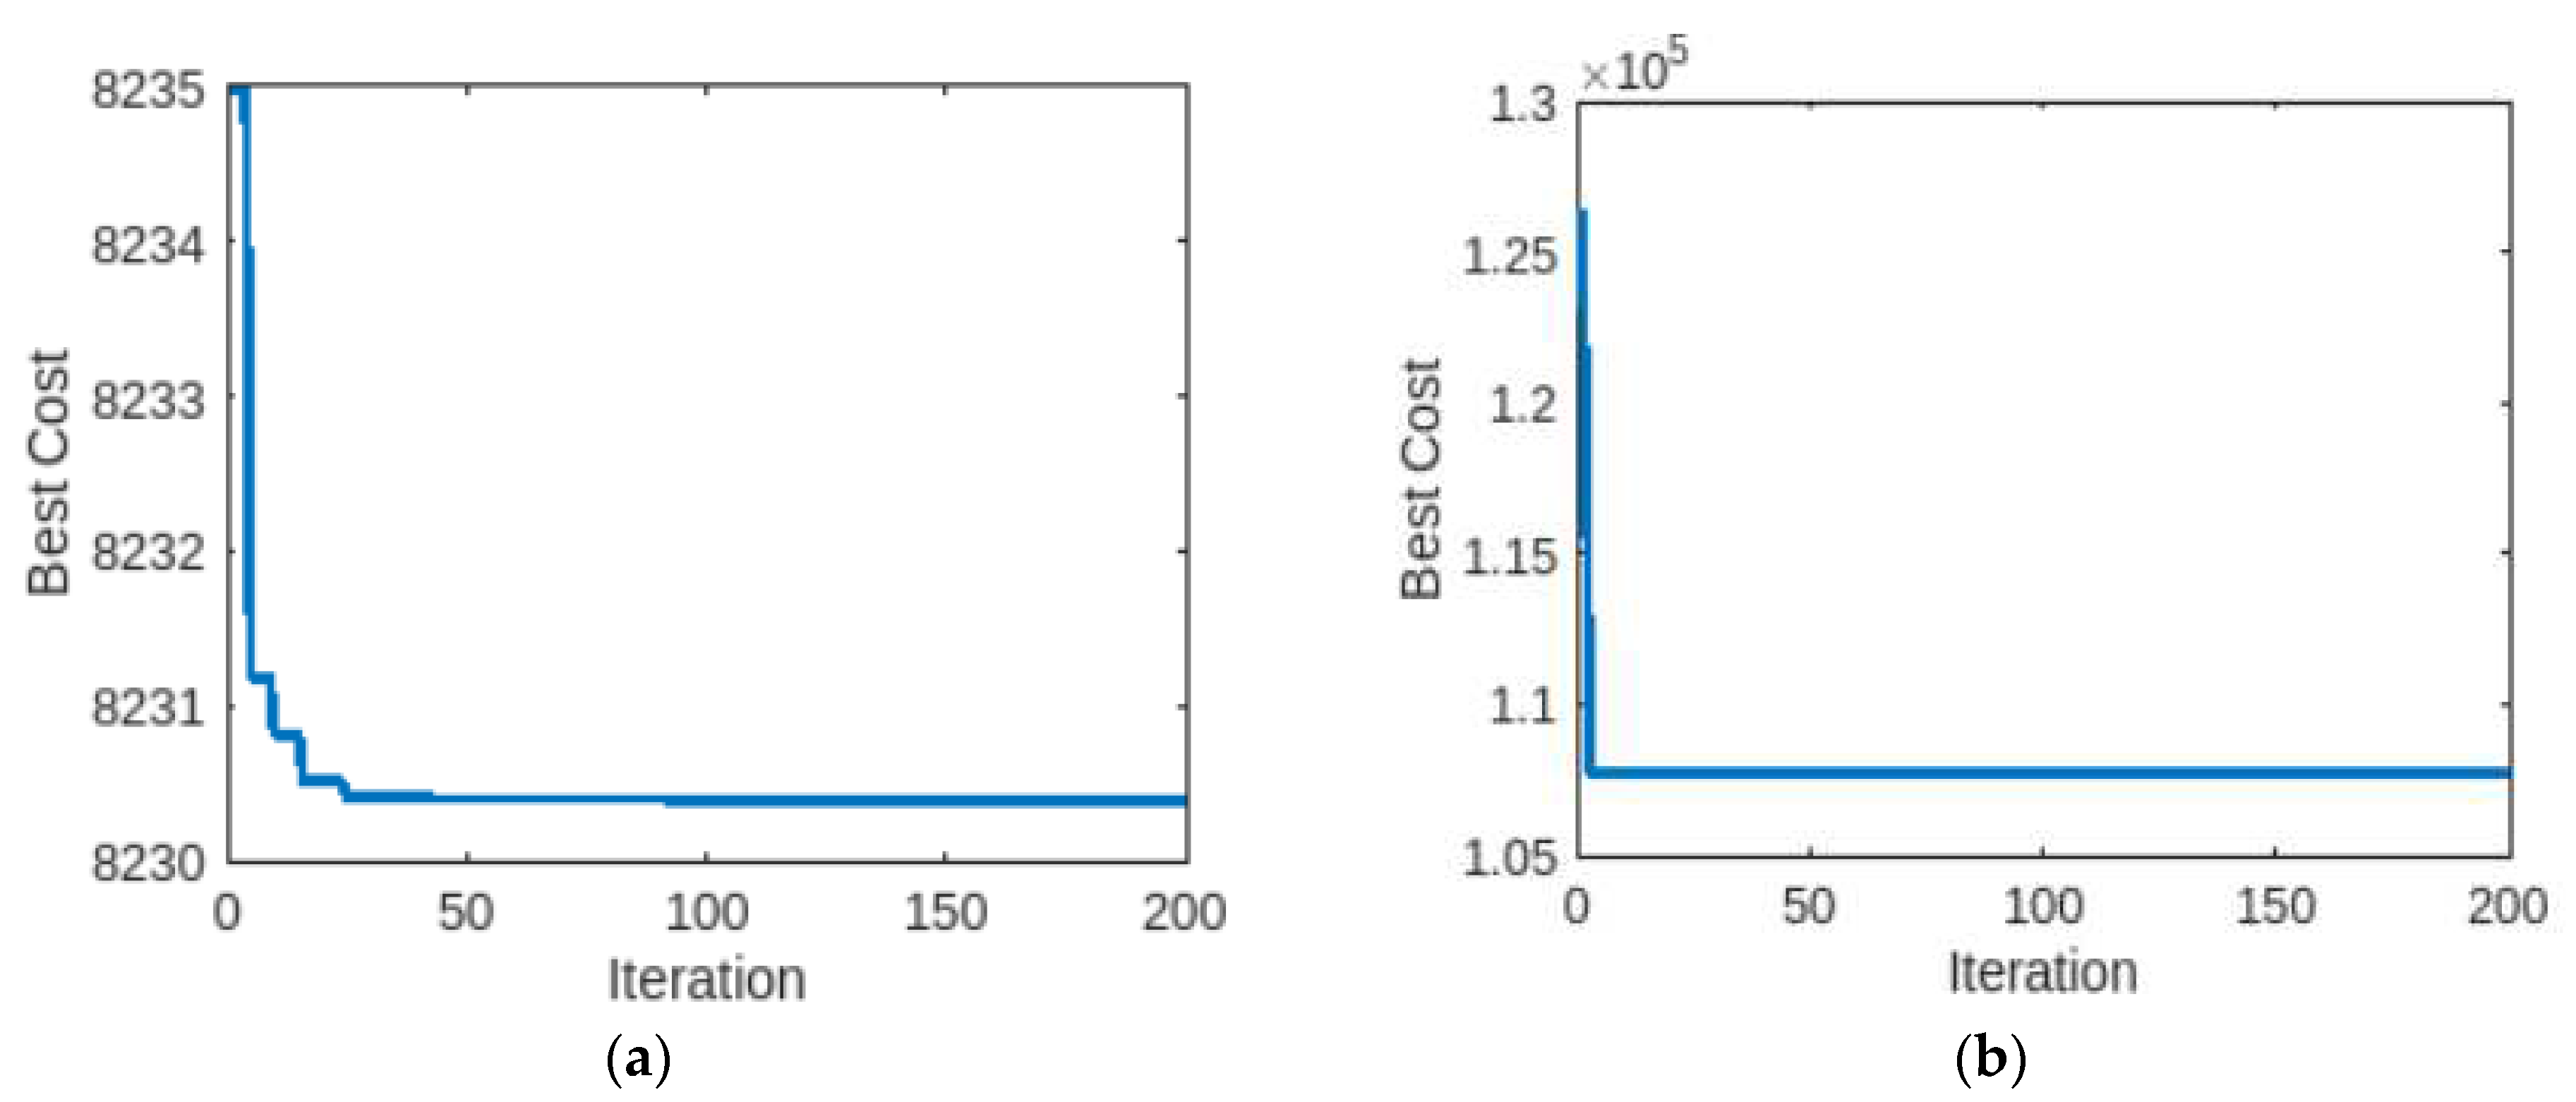
The case study comprises 3-unit generators with 850 MW load demand data taken from Ref. [51]. To identify the best solution, we do not require many particles in small cases, but at big scales, the swarm's ability to quickly and accurately search the issue space increases with the number of particles. Table 1 presents the data showing the evolutionary process of the proposed EPD PSO with UR and DR (up-ramp limits and down-ramp limits) and prohibited zones of the generators. The convergence property of the suggested approach is shown in Figure 3.

4.1.2. Case 1: 6-unit generator system with demand of 1263 MW

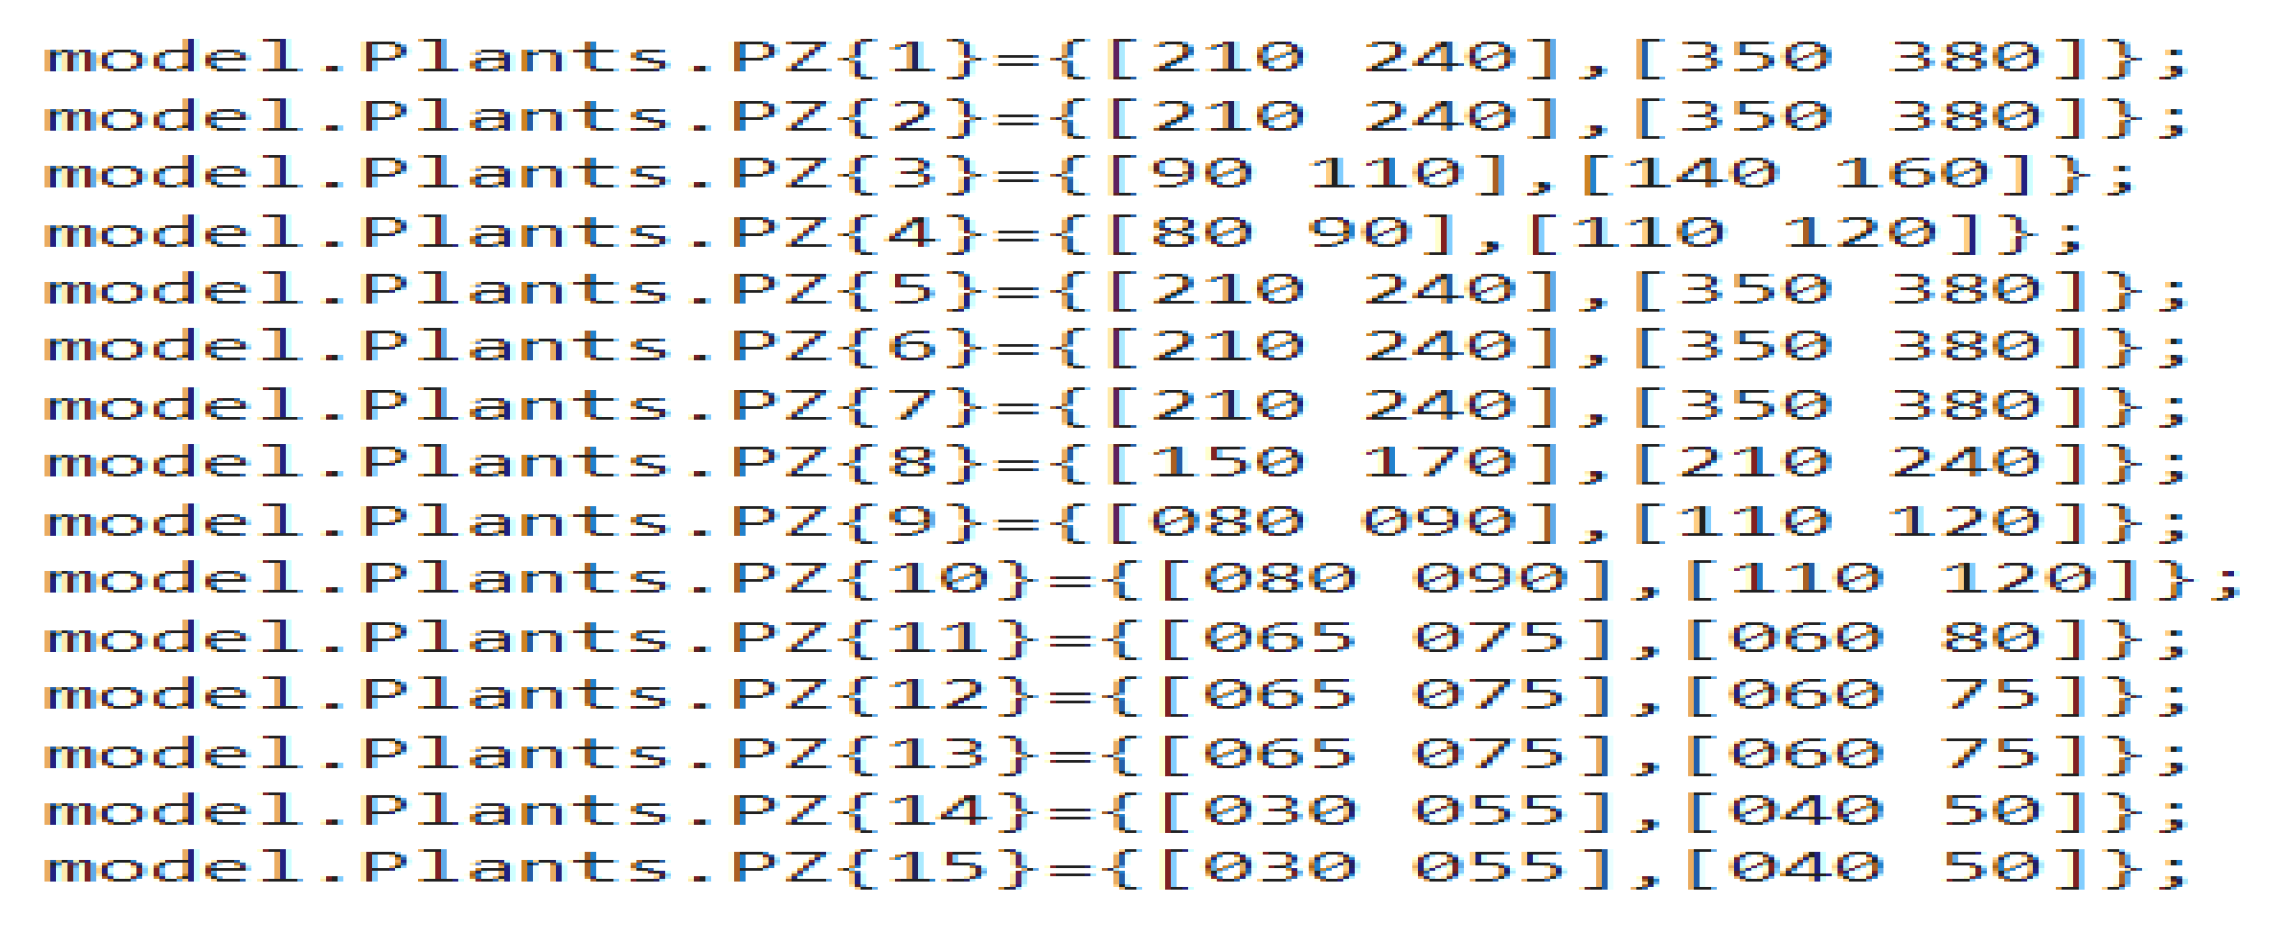
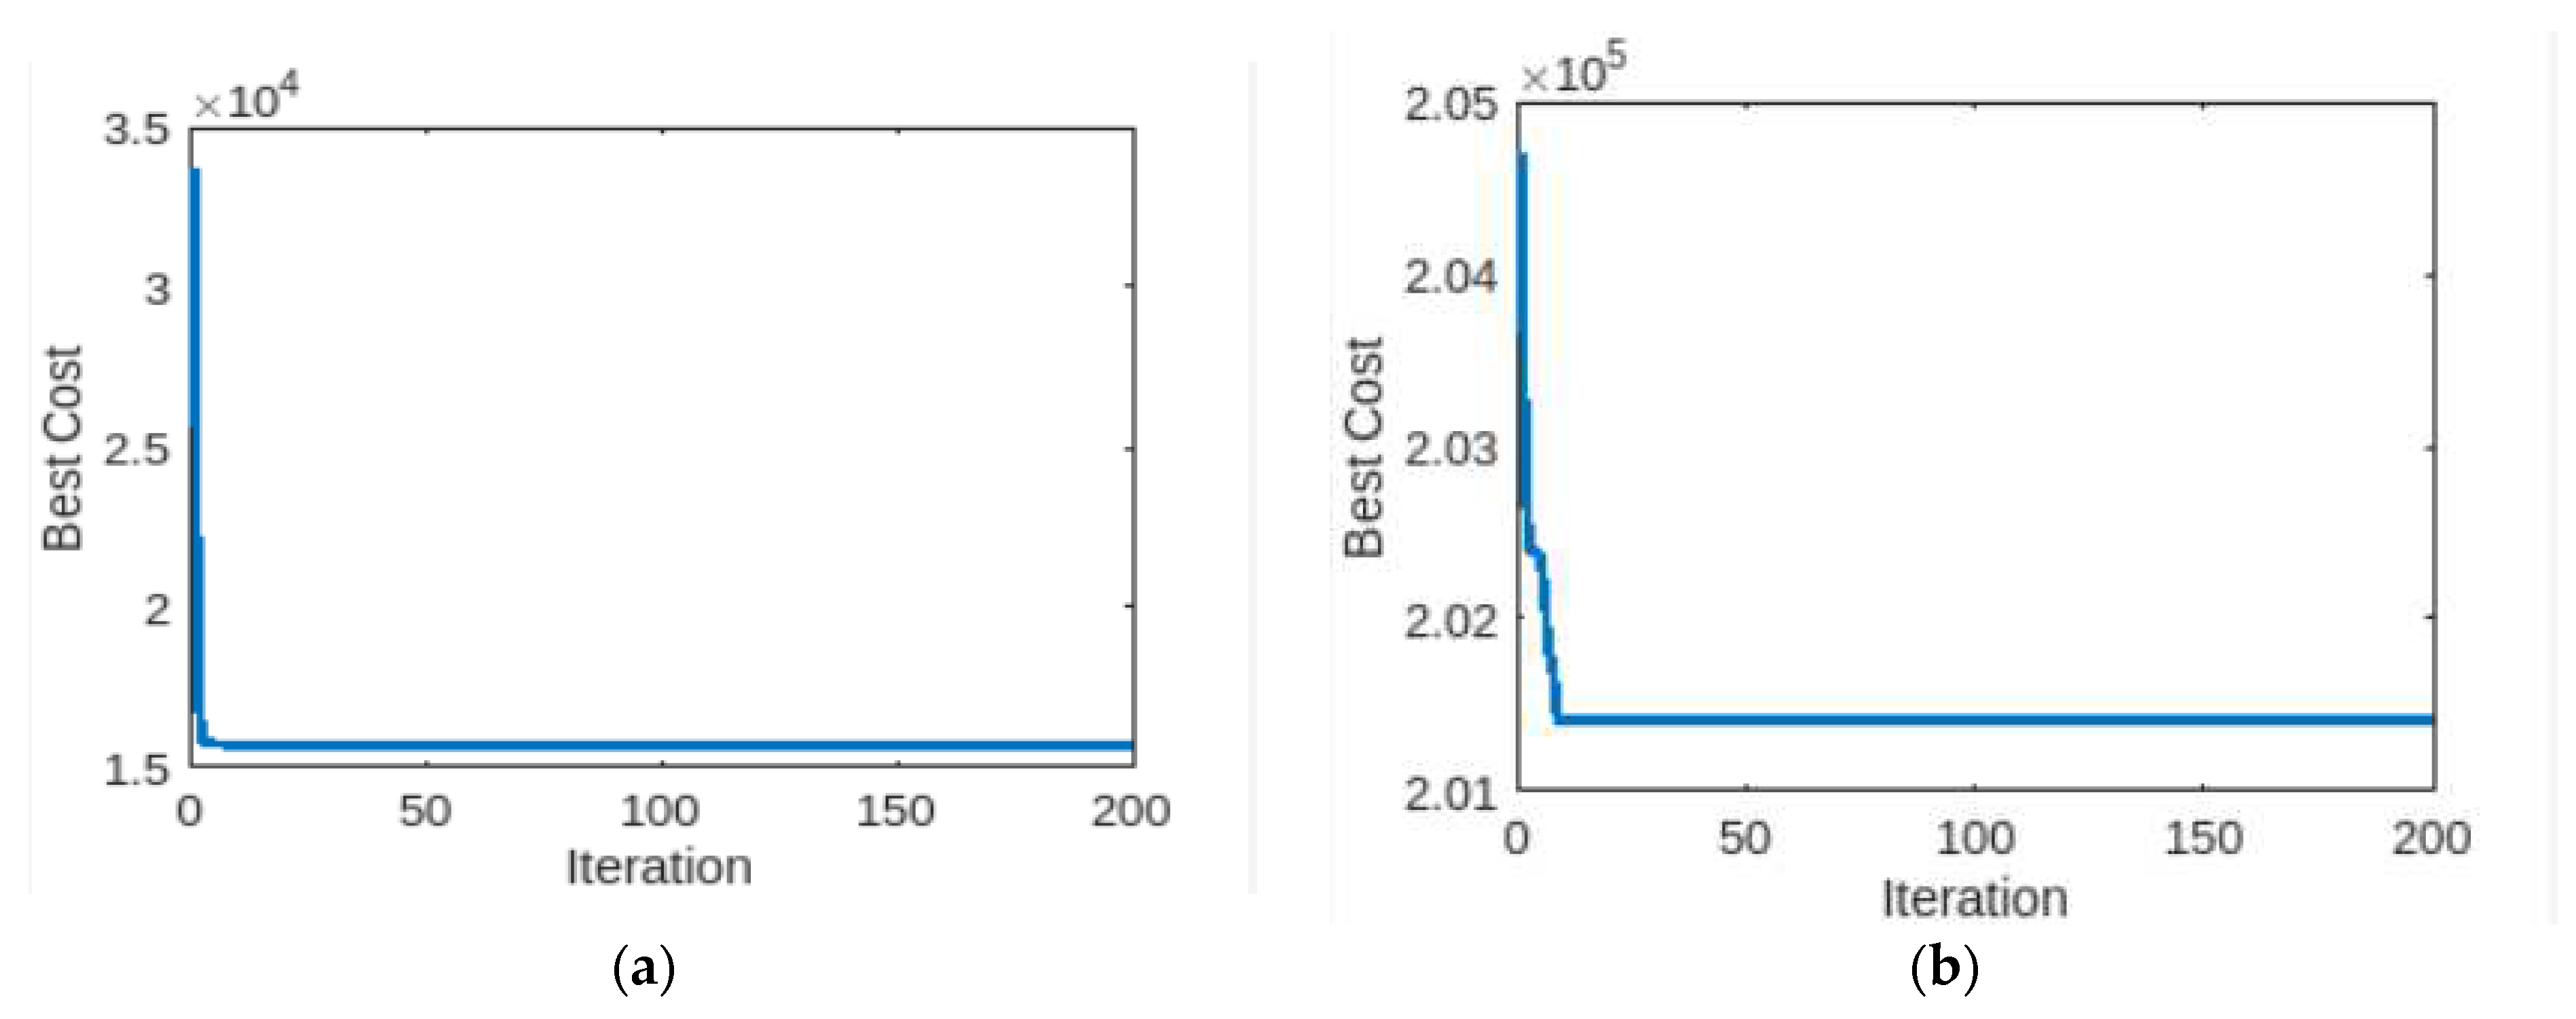
The case study comprises 6-unit generators with 1263 MW load demand data and loss coefficient are taken from Ref. [51]. The thermal units have 26 buses and 46 transmission lines of 6x100 population [52]. Table 2 presents the data showing the evolutionary process of the proposed EPD PSO with UR and DR (up-ramp limits and down-ramp limits) and prohibited zones of the generators as the main part of the algorithm for limiting the model, with the main cost function part as the parse solution for unit commitment. The fitness value is 99.0 for each independently run function to eliminate randomness in each algorithm. Figure presents the sample of the prohibited zones of the generating plants with respect to the unit’s number. Figure 5 is the 6-Units EPD simulation for the minimum cost (best cost).

4.1.3. Case 1: 15-unit generator system with demand of 2630 MW

The 15 thermal Units has input-output characteristics as shown in Table 3 with 15x100 population dimension presents the data showing the evolutionary process of the proposed EPD PSO with UR and DR (up-ramp limits and down-ramp limits) and Figure 6 as 15 x 15 prohibited zones of the generators
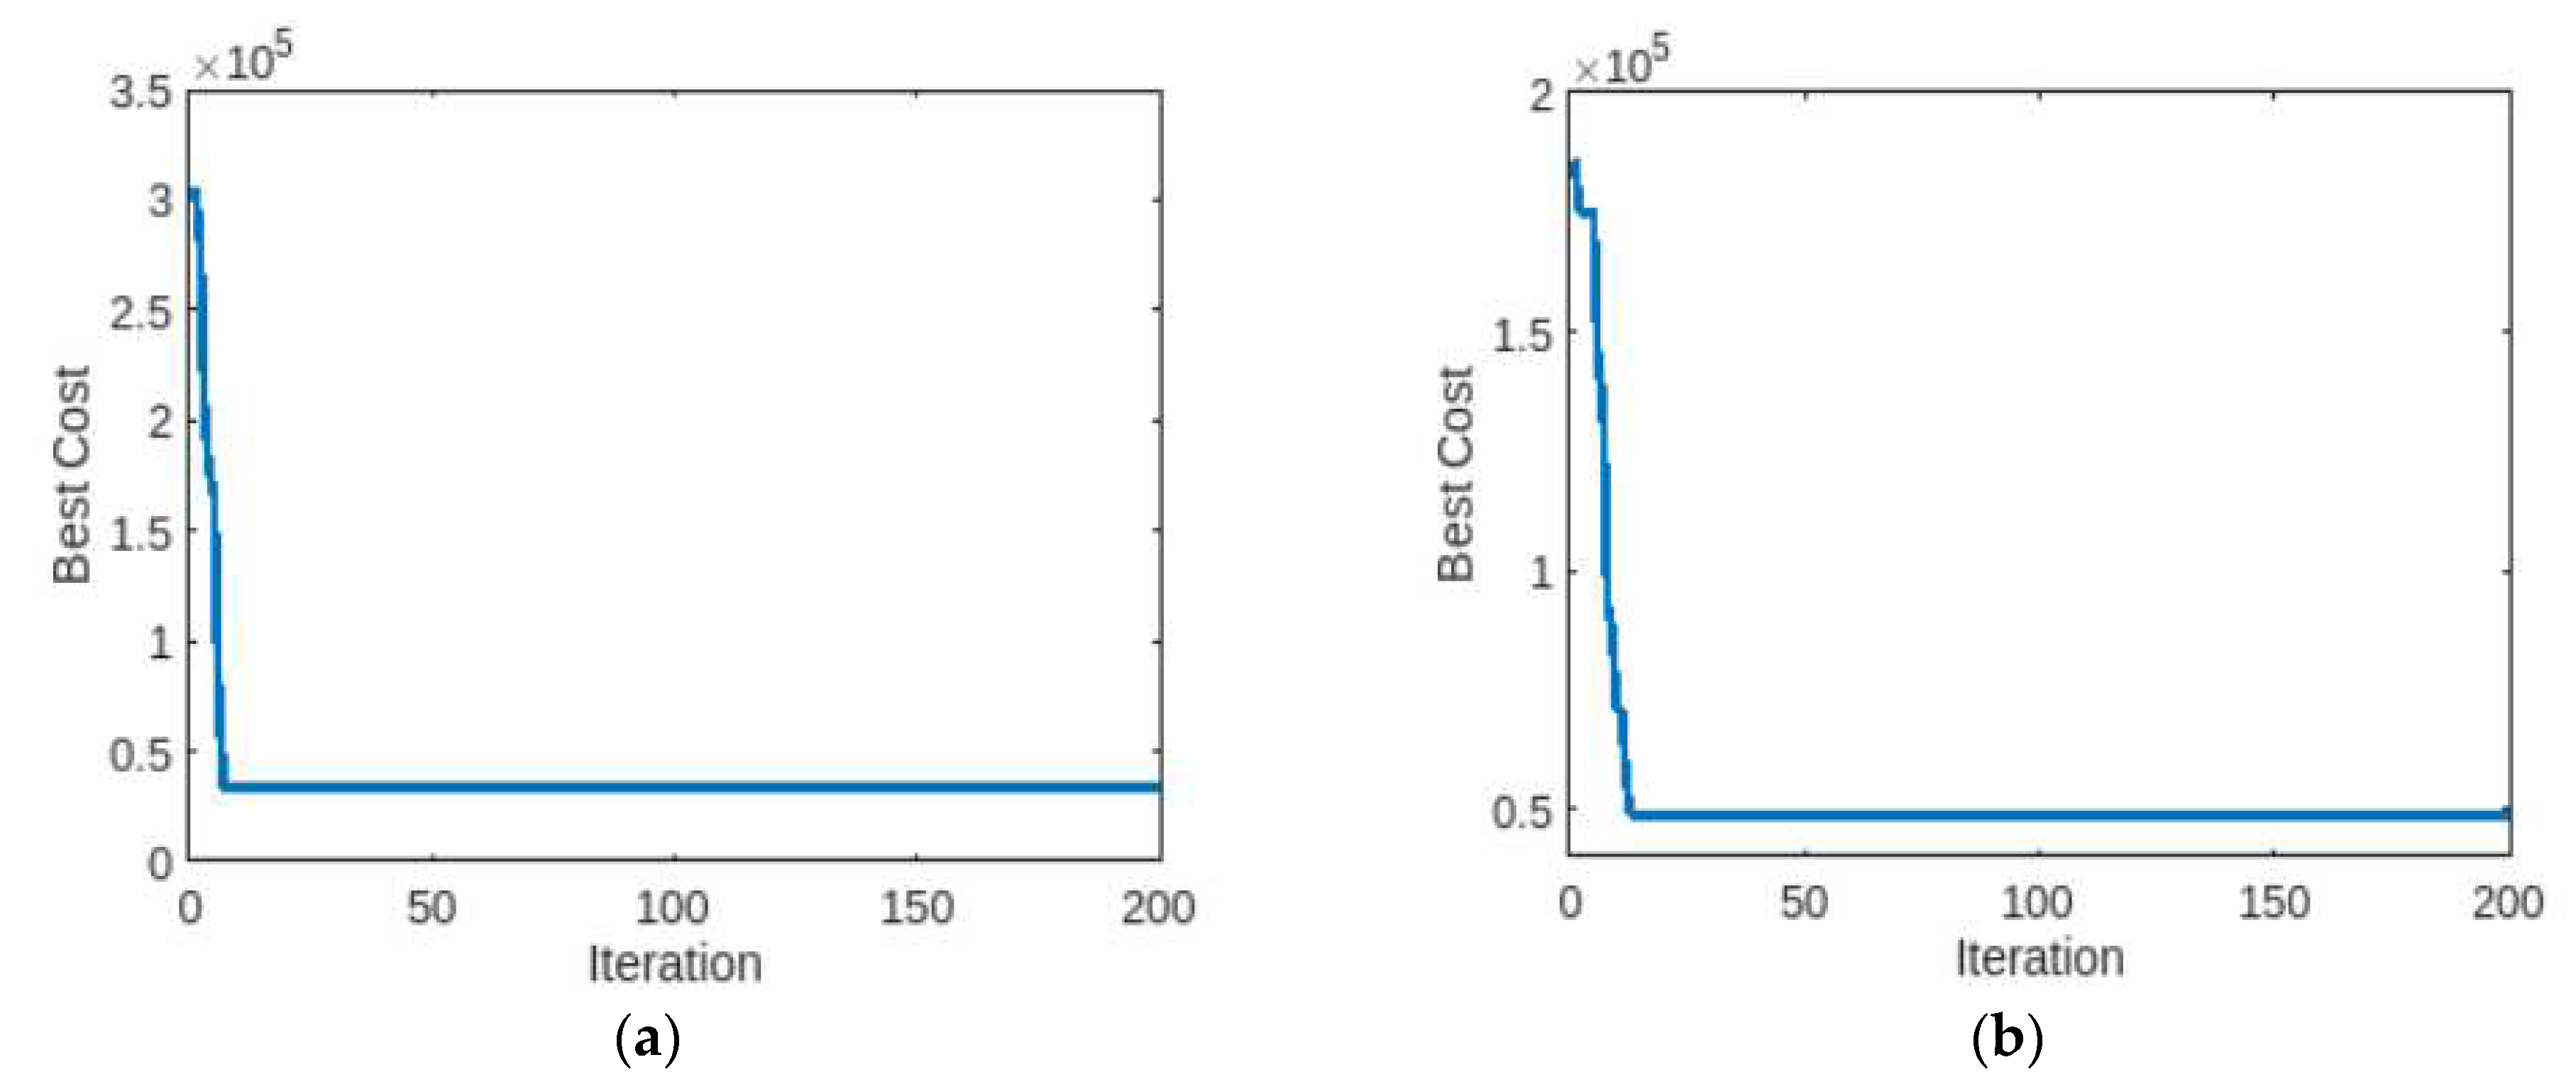
Figure 4 displays the suggested approach's convergence property for 15-Units EPD simulation for the minimum cost (best cost) .It is expected that the best plant selection is at the discretion of the grid operators to ensure the scheduling of the right plants.
In modest circumstances, we do not need many particles to find the optimum answer for small scale, but at medium and large scales, the number of particles increases the speed and accuracy of the swarm's search of the problem space. The maximum results according to the suggested technique and previous results are listed in Table 4.

5. Conclusions

The grid-tied solar PV-battery system's daily operation costs for an optimisation problem of minimising the total operational cost of all committed plants transmitted to the grid while meeting network (power flow) constraints and ensuring economic power dispatch (EPD) at the transmission level. In this paper, co-optimisation approach was developed and FMINCON technique is used in the MATLAB environment to resolve the performance of the hybrid EMS and support the power balance. The system is implemented under the conditions of rising self-consumption strategies. An approach made with a baseline method with consideration of the operational cost, battery SOC charge and recharge rate, and PSO Algorithm for EPD. Based on the outcomes of the simulation, the following conclusions can be drawn from the results indicate that the proposed EMS optimisation was successful in lowering the grid-connected system's daily running costs and increasing the self-consumption of RE sources.
The developed economic search optimisation PSO has successfully demonstrated an imperative cost reduction of maximum yearly cost savings and significant cost-benefit. The proposed co-optimisation approach can enhance a significant self-consumption ratio compared to the baseline method. Further work will cover the integration of wind turbines, electric vehicle charge station placement to further enhance a significant self-consumption ratio compared to the baseline method.

Author Contributions

Conceptualization, R.K.M. and O.T.A.; methodology, R.K.M.; software, O.T.A.; validation, R.K.M., O.T.A. and K.M.; formal analysis, R.K.M. and O.T.A.; investigation, O.T.A.; resources, R.K.M. and O.T.A.; data, O.T.A.; editing, K.M.; visualization, O.T.A.; supervision, O.T.A. and K.M.; project administration, R.K.M.; funding acquisition, K.M. All authors have read and agreed to the published version of the manuscript.

Funding

This work was supported in part by the National Research Foundation (NRF) under Thuthuka Grant 138177 and in part by Eskom Tertiary Education Support Program (TESP) through a research grant, and in part by the Eskom Power Plant Engineering Institute (EPPEI).

Data Availability Statement

No new data were created, and used were referenced in the paper.

Acknowledgments

The researchers acknowledge the support and assistance of the Department of Electrical, Electronic, and Computer Engineering, Cape Peninsula University of Technology, Bellville, Cape Town 7535, South Africa for their financial and material assistance in executing this research project. The opinions that are presented in this paper are those of the authors and not the funders.

Conflicts of Interest

The authors declare no conflict of interest.

References

  1. Gribkovskaia, V. Peak Price Hours in the Nordic Power Market Winter 2009/2010: Effects of Pricing, Demand Elasticity and Transmission Capacities. SSRN Electronic Journal. 2015.
  2. Zeng, B.; Feng, J.; Zhang, J.; Liu, Z. An optimal integrated planning method for supporting growing penetration of electric vehicles in distribution systems. Energy 2017, 126, 273–284. [Google Scholar] [CrossRef]
  3. Ai, X; Wu, J.; Hu, J.; Yang, Z.; Yang, G. Distributed congestion management of distribution networks to integrate prosumers energy operation. IET Generation, Transmission & Distribution, 2020; 14, 2988–2996. [Google Scholar]
  4. Tigas, K.; Giannakidis, G.; Mantzaris, J.; Lalas, D.; Sakellaridis, N.; Nakos, C.; Vougiouklakis, Y.; Theofilidi, M.; Pyrgioti, E.; Alexandridis, A.T. Wide scale penetration of renewable electricity in the Greek energy system in view of the European decarbonization targets for 2050, Renewable and Sustainable Energy Reviews. 2015, 42, pp. 158-169.
  5. Al-Hamidi, H.; Al Asfar, J. Hybrid renewable energy system with minimum noise wind turbine. Renewable Energy. 2017, 114, pp. 581–587 doiorg/101016/jrenene201707015. [Google Scholar] [CrossRef]
  6. Olusola, M.; Akinbami, S. R.; Oke, M.; Bodunrin, O. The state of renewable energy development in South Africa: An overview, Alexandria Engineering Journal, 2021, 60, Issue 6, pp. 5077-5093. [CrossRef]
  7. Gambhir, A.; Sandwell, P.; Nelson, J. The future costs of OPV – A bottom-up model of material and manufacturing costs with uncertainty analysis. Solar Energy Materials and Solar Cells 2016, 156, 49–58. [Google Scholar] [CrossRef]
  8. Zhang, Z.; Chen, Z. Optimal wind energy bidding strategies in real-time electricity market with multi-energy sources. IET Renewable Power Generation. 2019, 13, 2383–2390. [Google Scholar] [CrossRef]
  9. Jeter, S.M.; Phan, C.N. Site-specific clear-day solar irradiance model from long-term irradiance data. Journal of Energy. 1982. 6(2), pp.115–118.
  10. Bou-Rabee, M.; Shaharin, S. On Seasonal Variation of Solar Irradiation in Kuwait. International Journal of Renewable Energy Research (IJRER). 2015, 5.2, pp. 367-372.
  11. Srivastava, A.; Das, D.K. An adaptive chaotic class topper optimization technique to solve economic load dispatch and emission economic dispatch problem in power system. Soft Computing. 2022, 26, 2913–2914. [Google Scholar] [CrossRef]
  12. Jiawen, B.; Tao, D.; Zhe, W.; Ianhua, C. Day-Ahead Robust Economic Dispatch Considering Renewable Energy and Concentrated Solar Power Plants, Energies 2019, 12(20), pp. 3832. [CrossRef]
  13. Bishwajit, D.; Shyamal K., R.; Biplab, B. Solving multi-objective economic emission dispatch of a renewable integrated microgrid using latest bio-inspired algorithms, Engineering Science and Technology, an International Journal, 2019, Volume 22, Issue 1, pp. 55-66. [CrossRef]
  14. Lotfi Akbarabadi, M.; Sirjani, R. Achieving Sustainability and Cost-Effectiveness in Power Generation: Multi-Objective Dispatch of Solar, Wind, and Hydro Units. Sustainability 2023, 15, 2407. [Google Scholar] [CrossRef]
  15. Hasibuan, A.; Kurniawan, R.; Isa, M.; Mursalin, M. Economic Dispatch Analysis Using Equal Incremental Cost Method with Linear Regression Approach. Journal of Renewable Energy, Electrical, and Computer Engineering, 2021; 1, 16. [Google Scholar]
  16. Roy, C.; Das, D.K. A hybrid genetic algorithm (GA)–particle swarm optimization (PSO) algorithm for demand side management in smart grid considering wind power for cost optimization. Sādhanā. 2021, 46. [Google Scholar] [CrossRef]
  17. Stochastically coordinated transmission and distribution system operation with large-scale wind farms. CSEE Journal of Power and Energy Systems. 2020. [CrossRef]
  18. Silva, H.G.; Coelho, A.L.M.; Faria, I.P.; Araujo, B.G. ANN based impedance trajectory detection approach for loss of excitation protection of synchronous generators connected to transmission lines with SVCs. Electric Power Systems Research. 2022. 213:108766.
  19. Kusakana, K. Optimal scheduled power flow for distributed photovoltaic/wind/diesel generators with battery storage system. IET Renewable Power Generation. 2015, 9, 916–924. [Google Scholar] [CrossRef]
  20. Optimized Generation Scheduling of Thermal Generators Integrated to Wind Energy System with Storage. International Journal of Renewable Energy Research. 2018. (v8i2).
  21. Pandey, A.C.; Das, V.; Kumar, P.; Singh, R.; Maurya, S.K. AEFA Based Optimal Dynamic Economic Load Dispatch Problem Considering Penetration of Renewable Energy Systems. Distributed Generation & Alternative Energy Journal 2022.
  22. Xu, J.; Liu, A.; Qin, Y.; Xu, G.; Tang, Y. A Cost-Effective Solution to Dynamic Economic Load Dispatch Problem Using Improved Chimp Optimizer. Frontiers in Energy Research 2022. 10.
  23. Iweh, C.D.; Gyamfi, S.; Tanyi, E.; Effah-Donyina, E. Distributed Generation and Renewable Energy Integration into the Grid: Prerequisites, Push Factors, Practical Options, Issues and Merits. Energies 2021, 14, 5375 https:// doiorg/103390/en14175375. [Google Scholar] [CrossRef]
  24. Kempener, R.; Komor, P.; Hoke, A. Smart Grids and Renewables—A Guide for Effective Deployment; International Renewable Energy Agency (IRENA): 2013.Abu Dhabi, UAE.
  25. Bhattacharyya, B.; Kumar, S. Approach for the solution of transmission congestion with multi-type FACTS devices. IET Generation, Transmission & Distribution 2016. 10(11), pp. 2802–2809.
  26. Tuladhar, S.R.; Singh, J.G.; Ongsakul, W. Multi-objective approach for distribution network reconfiguration with optimal DG power factor using NSPSO. IET Gener. Transm. Distrib. 2016, 10, 2842–2851. [Google Scholar] [CrossRef]
  27. Peres, F.; Castelli, M. Combinatorial Optimization Problems and Metaheuristics: Review, Challenges, Design, and Development. Appl. Sci. 2021, 11, 6449. [Google Scholar] [CrossRef]
  28. Asl, S.A.F.; Gandomkar, M.; Nikoukar, J. Optimal Protection Coordination in the Micro-Grid Including Inverter-Based Distributed Generations and Energy Storage System with Considering Grid-Connected and Islanded Modes. Electric Power Systems Research 2020, 184, 106317. [Google Scholar] [CrossRef]
  29. Vlachogiannis, J.G. Marine-Current Power Generation Model for Smart Grids. Journal of Power Sources 2014, 249, 172–174. [Google Scholar] [CrossRef]
  30. Vyas, M.; Chowdhury, S.; Verma, A.; Jain, V.K. Solar Photovoltaic Tree: Urban PV Power Plants to Increase Power to Land Occupancy Ratio. Renewable Energy 2022, 190, 283–293. [Google Scholar] [CrossRef]
  31. Thabo, G.; Hlalele, J. Z.; Raj M., N.; Ramesh, C. Bansal. Multi-objective economic dispatch with residential demand response programme under renewable obligation. Energy 2021, 218, pp 119473. [Google Scholar]
  32. Lin, X. Theoretical analysis of battery soc estimation errors under sensor bias and variance, IEEE Trans. Ind. Electron 2018, 65 (9), pp. 7138–7148.
  33. Hu, X. , Li, S.E.; Yang, Y. Advanced machine learning approach for lithium-ion battery state estimation in electric vehicles, IEEE Trans. Transp. Electrific 2015, 2 (2), pp. 140–149.
  34. Naz, K.; Zainab, F.; Mehmood, K.K.; Bukhari, S.B.A.; Khalid, H.A.; Kim, C.H. An Optimized Framework for Energy Management of Multi-Microgrid Systems. Energies 2021, 14, 6012. [Google Scholar] [CrossRef]
  35. Babaei, M.; Azizi, E.; Beheshti, M.T.H.; Hadian, M. Data-Driven load management of stand-alone residential buildings including renewable resources, energy storage system, and electric vehicle, Journal of Energy Storage 2020, 28, pp. 10 1221.
  36. Leyffer, S.; Linderoth, J. Convex Mixed-Integer Nonlinear Optimization I. Summer School on Optimization of Dynamical Systems, 2018. Argonne National Laboratory, Department of Industrial and Systems, Engineering. University of Wisconsin-Madison.
  37. Majzoobi, A.; Khodaei, A. Application of Microgrids in Providing Ancillary Services to the Utility Grid. Energy 2017, 123, 555–563. [Google Scholar] [CrossRef]
  38. Fan, M.; Zhang, Z.; Wang, C. Mathematical Models and Algorithms for Power System Optimization, Modeling Technology for Practical Engineering Problems, An imprint of Elsevier. China Electric Power Press. Published by Elsevier Inc. 2019.
  39. Leyffer, S.; Linderoth, J. Introduction to Integer Nonlinear Optimization, Nonlinear Branch-and-Cut, Theoretical and Computational Challenges. Argonne National Laboratory. 2007. http://science.energy.gov/~/media/ascr/pdf/workshops-conferences/mathtalks/Leyffer.
  40. Kennedy, J. , Eberhart, R. In C. Particle swarm optimization. In Proceedings of the 1995 IEEE international conference on neural networks (Perth, Australia) 1995; 1942–1948. [Google Scholar]
  41. Rengasamy, S.; Murugesan, P. PSO Based Data Clustering with a Different Perception. Swarm and Evolutionary Computation 2021, 64, 100895. [Google Scholar] [CrossRef]
  42. Ananthan, D. Unit Commitment Solution Using Particle Swarm Optimisation (PSO). IOSR Journal of Engineering 2014, 4, 01–09. [Google Scholar] [CrossRef]
  43. Wang, P.; Ma, Y.; Wang, M. A Dynamic Multi-Objective Optimization Evolutionary Algorithm Based on Particle Swarm Prediction Strategy and Prediction Adjustment Strategy. Swarm and Evolutionary Computation 2022, 75, 101164. [Google Scholar] [CrossRef]
  44. LeSage, J. Microgrid Energy Management System (EMS) using Optimization (https://github.com/jonlesage/Microgrid-EMS-Optimization/releases/tag/v19.1.0), GitHub. Retrieved , 3 May 2023.
  45. Banerjee, S.; Deblina, M.; Chandan, K. C. Teaching learning-based optimization for economic load dispatch problem considering valve point loading effect. " International Journal of Electrical Power & Energy Systems 2015; 73:456-464.
  46. Velamuri, S.; Sreejith, S. Economic Dispatch and Cost Analysis on a Power System Network Interconnected with Solar Farm. International Journal of Renewable Energy Research 2015; 5: 4.
  47. Meryeme, A.; Mohammed, O.; Mohamed, M. Optimum Energy Flow Management of a Grid-Tied Photovaolatic-Wind-Battery System considering Cost, Reliabilty, and CO2 Emission. Hidawi, International Journal of Photoenergy vol 2021, Article ID 5591456.
  48. Xinyang, Z.; Chin-Yao, C.; Andrey, B.; Changhong, Z.; Lijun, C. Economic Dispatch with Distributed Energy Resources: Co-Optimization of Transmission and Distribution Systems, IEEE Control Systems Letters 2021; 5: 6.
  49. Heris, M. K. Particle Swarm Optimization (PSO) in MATLAB — Video Tutorial (URL: https://yarpiz.com/440/ytea101-particle-swarm-optimization-pso-in-matlab-video-tutorial), Yarpiz, 2016.
  50. Ali, R. Al-Roomi. Economic Load Dispatch Test Systems Repository [https://www.al-roomi.org/economic-dispatch]. Halifax, Nova Scotia, Canada: Dalhousie University, Electrical and Computer Engineering. 2016.
  51. Gaing, Z.L. Particle swarm optimization to solving the economic dispatch considering the generator constraints. IEEE Trans Power Syst 2003; 18:1187-95.
  52. Yoshida, H.; Kawata, K.; Fukuyama, Y.; Takayama, S.; Nakanishi, Y. A particle swarm optimization for reactive power and voltage control considering voltage security assessment," in IEEE Transactions on Power Systems 2000;15, 4 :1232-1239. [CrossRef]
  53. Kuo, C. C. A novel coding scheme for practical economic dispatch by modified particle swarm approach, Power Systems.
  54. IEEE Transactions on, 2008;23: 1825-1835,.
  55. Rahmani, R.; Othman, M. F.; Yusof, R.; Khalid, M. Solving Economic Dispatch Problem Using Particle Swarm Optimization by An Evolutionary Technique for Initializing Particle; Journal of Theoretical and Applied Information Technology 2012; 46: 2.
  56. Al-Betar, M.A.; Awadallah, M.A.; Zitar, R.A. Economic load dispatch using memetic sine cosine algorithm. J Ambient Intell Human Comput 2022. [CrossRef] [PubMed]
  57. Rajashree, B.; Upadhyay, P. PSO approach for ELD problem: A review, 2016 IEEE International WIE Conference on Electrical and Computer Engineering (WIECON-ECE), Pune, India, 2016: 225-228. [CrossRef]
  58. Senthil Krishnamurthy and Raynitchka Tzoneva, “Application of the Particle Swarm Optimization Algorithm to a Combined Economic Emission Dispatch Problem using a new penalty factor”, IEEE PES Power Africa 2012 – Conference and Exhibition, Johannesburg, South Africa, 9-13 July 2012.
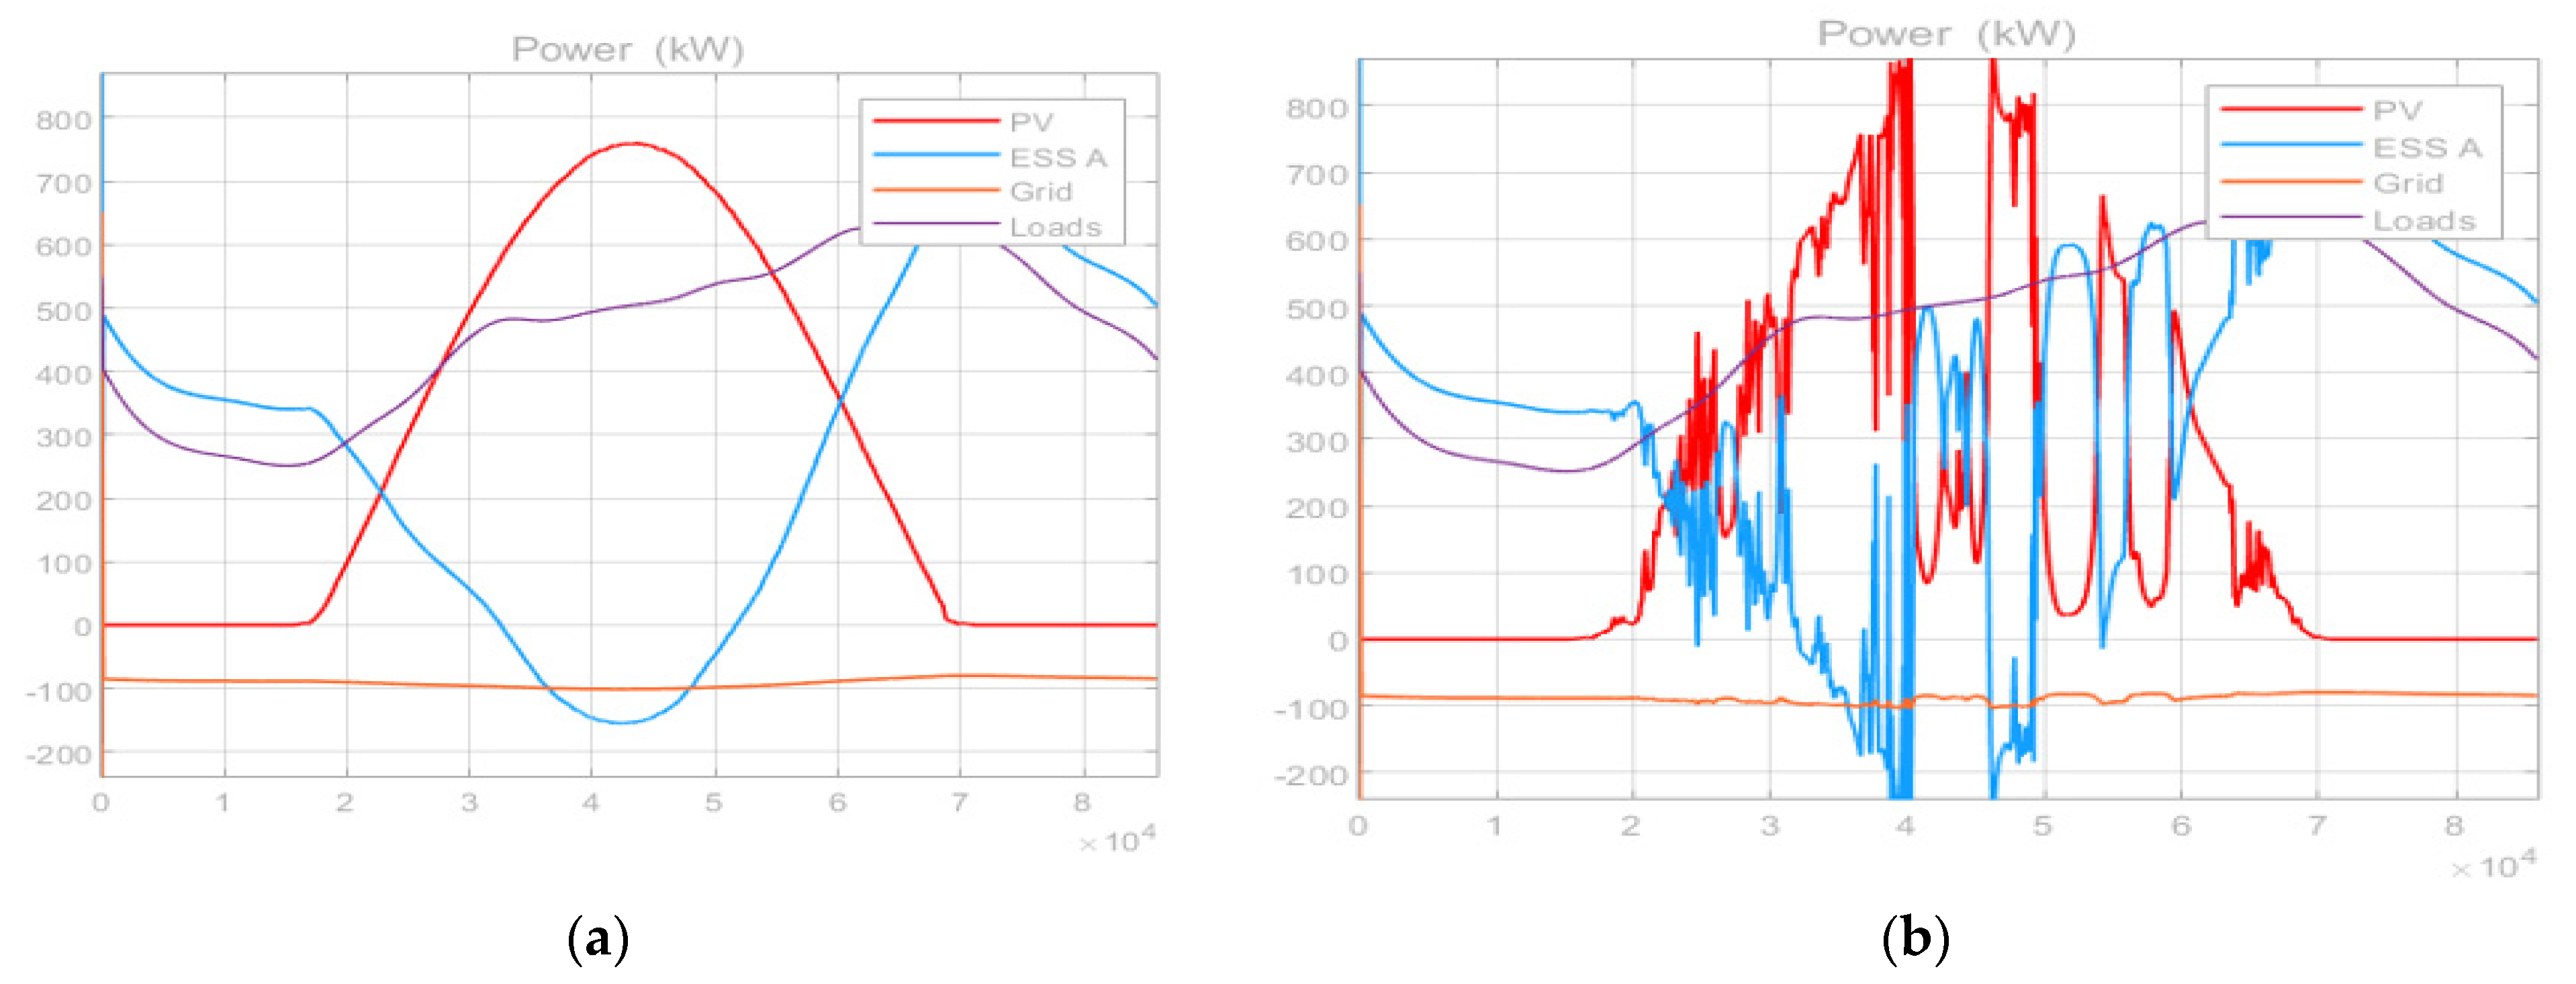
Figure 1. Generated power simulation: (a) energy usage exceeding 500 kWh during clear days in the heuristics approach simulation; (b) a peak of 800 kWh during cloudy days in the optimised-based approach.
Preprints 78415 g001
Figure 2. Grid cost simulation: (a) loss of grid supply and cost of ESS; (b) cumulative grid cost and grid usage for heuristic and optimization approach.
Preprints 78415 g002
Figure 3. 3-Units EPD simulation for the minimum cost (best cost) (a) convergence of the minimum cost (best cost) 3 thermal units; (b) second run convergence of the minimum cost (best cost) for 2 thermal and 1 solar PV units.
Preprints 78415 g003
Figure 4. Prohibited zones of the generating plants.
Preprints 78415 g004
Figure 5. 6-Units EPD simulation for the minimum cost (best cost) (a) convergence of the minimum cost (best cost) 6 thermal units; (b) second run convergence of the minimum cost (best cost) for 2 thermal and 4 solar PV units.
Preprints 78415 g005
Figure 6. 15-Units EPD simulation for the minimum cost (best cost) (a) convergence of the minimum cost (best cost) 15thermal units; (b) second run convergence of the minimum cost (best cost) for 7 thermal and 8 solar PV units.
Preprints 78415 g006
Table 1. IEEE 14-bus system data Cost Data and Power Constraints of 3-Unit System [49;40;52].
Coeff. without PV Coeff. with PV
Unit Pmin
(MW)
Pmax
(MW)
ai
($/MW2h)
bi ($/MWh) ci ($/MW) Unit Pmin
(MW)
Pmax
(MW)
ai
($/MW2h)
bi ($/MWh) ci ($/MW)
Unit 1 100 600 561 7.92 0.0016 Unit 1 100 600 561 7.92 0.0016
Unit 2 100 400 310 7.85 0.0019 PV 1 20 100 0 0 0
Unit 3 50 200 78 7.97 0.0048 PV 3 50 200 78 7.97 0.0048
Table 2. IEEE 14-bus Cost Data and Power Constraints Of 6-Unit System data [49, 50, 51].
Coeff. without solar PV Coeff. with solar PV
Unit Pmin
(MW)
Pmax
(MW)
ai
($/MW2h)
bi ($/MWh) ci ($/MW) Unit Pmin
(MW)
Pmax
(MW)
ai
($/MW2h)
bi ($/MWh) ci ($/MW)
Unit 1 100 500 240 7.00 0.0070 Unit 1 100 500 240 7.00 0.0070
Unit 2 50 200 200 10.0 0.0095 PV 1 20 200 0 0 0
Unit 3 80 300 220 8.5 0.0090 PV 3 80 300 0 0 0
Unit 3 50 150 200 11.0 0.0090 PV 3 50 150 0 0 0
Unit 3 50 200 220 10.5 0.0080 PV 3 50 200 0 0 0
Unit 3 50 120 190 12.0 0.0075 PV 3 50 120 190 12.0 0.0075
Table 3. IEEE 14-bus system Cost Data and Power Constraints Of 15-Unit System data [49,50; 51;52].
Coeff. without PV Coeff. with PV
Unit Pmin
(MW)
Pmax
(MW)
ai
($/MW2h)
bi ($/MWh) ci ($/MW) Unit Pmin
(MW)
Pmax
(MW)
ai
($/MW2h)
bi ($/MWh) ci ($/MW)
Unit 1 150 455 671 10.10 0.0003 Unit 1 150 455 671 10.10 0.0003
Unit 2 150 455 574 10.20 0.0001 Unit 2 150 455 574 10.20 0.0001
Unit 3 20 130 374 8.80 0.0011 PV 1 20 130 0 0 0
Unit 4 20 130 374 8.80 0.0011 PV 2 20 130 0 0 0
Unit 5 150 470 461 10.40 0.0002 Unit 3 150 470 461 10.40 0.0002
Unit 6 135 460 630 10.10 0.0003 Unit 4 135 460 630 10.10 0.0003
Unit 7 135 465 548 9.80 0.0003 Unit 5 135 465 548 9.80 0.0003
Unit 8 60 300 227 11.20 0.0003 Unit 6 60 300 227 11.20 0.0003
Unit 9 25 162 173 11.20 0.0008 PV 3 25 162 0 0 0
Unit 10 25 160 175 10.70 0.0012 PV 4 25 160 0 0 0
Unit 11 20 80 186 10.20 0.0035 PV 5 20 80 0 0 0
Unit 12 20 80 230 9.90 0.0055 PV 6 20 80 0 0 0
Unit 13 25 85 225 13.10 0.0003 PV 7 25 85 0 0 0
Unit 14 15 55 309 12.10 0.0019 PV 8 15 55 0 0 0
Unit 15 15 55 323 12.40 0.0044 Unit 7 15 55 323 12.40 0.0044
Table 4. IEEE 14-bus thermal units with 26 buses and 46 transmission lines system data [51].
Best cost (million $) (Iterations)
Unit PSO plants Model 1st 200th Difference % Best cost/day Compared Best cost
3- Units 3 Thermal 8234.97 8230.38 4.5932 0.055 8234.07 [55]
8194.35 [56]
2 Thermal and 1 PV 117238.1 95283.67 107709.5 91.87
6- Units 6 Thermal 33727.3 15709.8 29396.0 46.55 15447 [51; 53]
15450.00 [55]
2 Thermal and 4 PV 209331.5 201411.1 7920.48 3.784
15- Units 15 Thermal 306054.0 33330.2 137487.9 89.10 33049 [51; 53]
32708 [54]
32858.00 [55]
7 Thermal and 8 PV 186141.8 48653.8 272723.7 73.86
Disclaimer/Publisher’s Note: The statements, opinions and data contained in all publications are solely those of the individual author(s) and contributor(s) and not of MDPI and/or the editor(s). MDPI and/or the editor(s) disclaim responsibility for any injury to people or property resulting from any ideas, methods, instructions or products referred to in the content.
Copyright: This open access article is published under a Creative Commons CC BY 4.0 license, which permit the free download, distribution, and reuse, provided that the author and preprint are cited in any reuse.
Prerpints.org logo

Preprints.org is a free preprint server supported by MDPI in Basel, Switzerland.

Subscribe

© 2024 MDPI (Basel, Switzerland) unless otherwise stated