Preprint
Article

Effect of Supplementary Feeding on Milk Volume, Milk Composition, Blood Routine, and Fecal Flora Diversity of Grazing Yili Horses

Altmetrics

Downloads

125

Views

48

Comments

0

A peer-reviewed article of this preprint also exists.

Submitted:

03 July 2023

Posted:

04 July 2023

You are already at the latest version

Alerts
Abstract
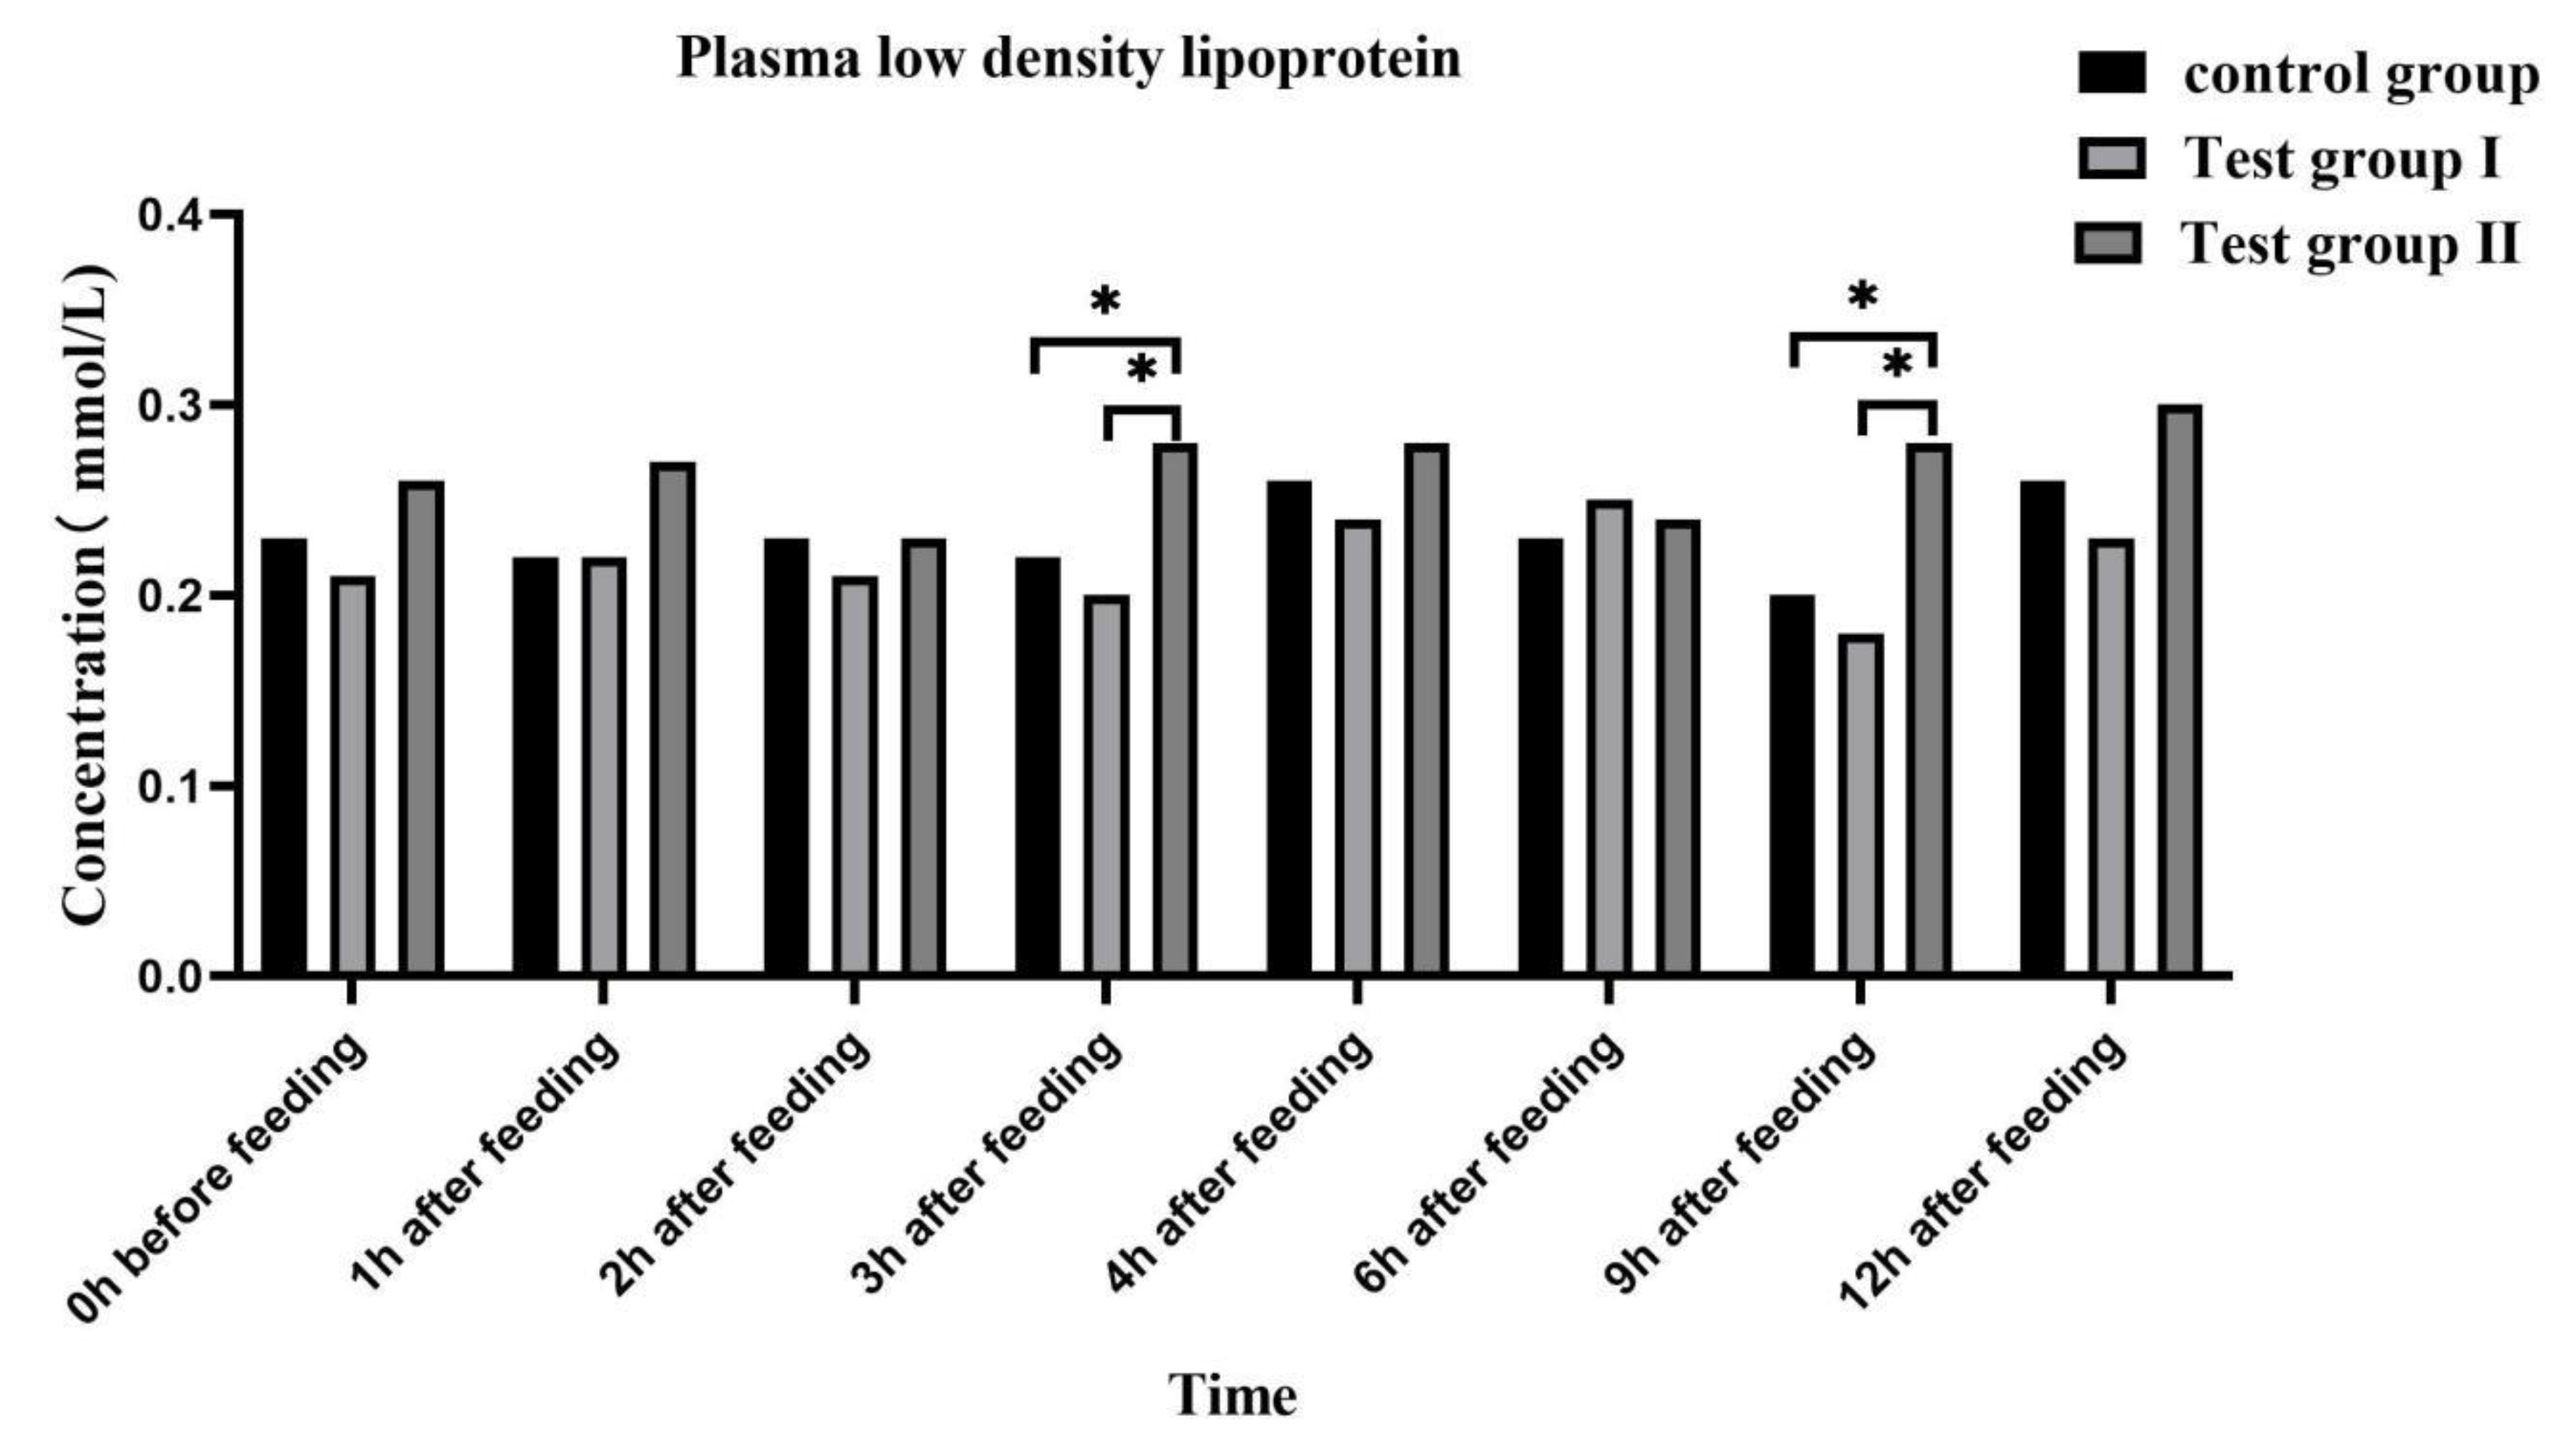
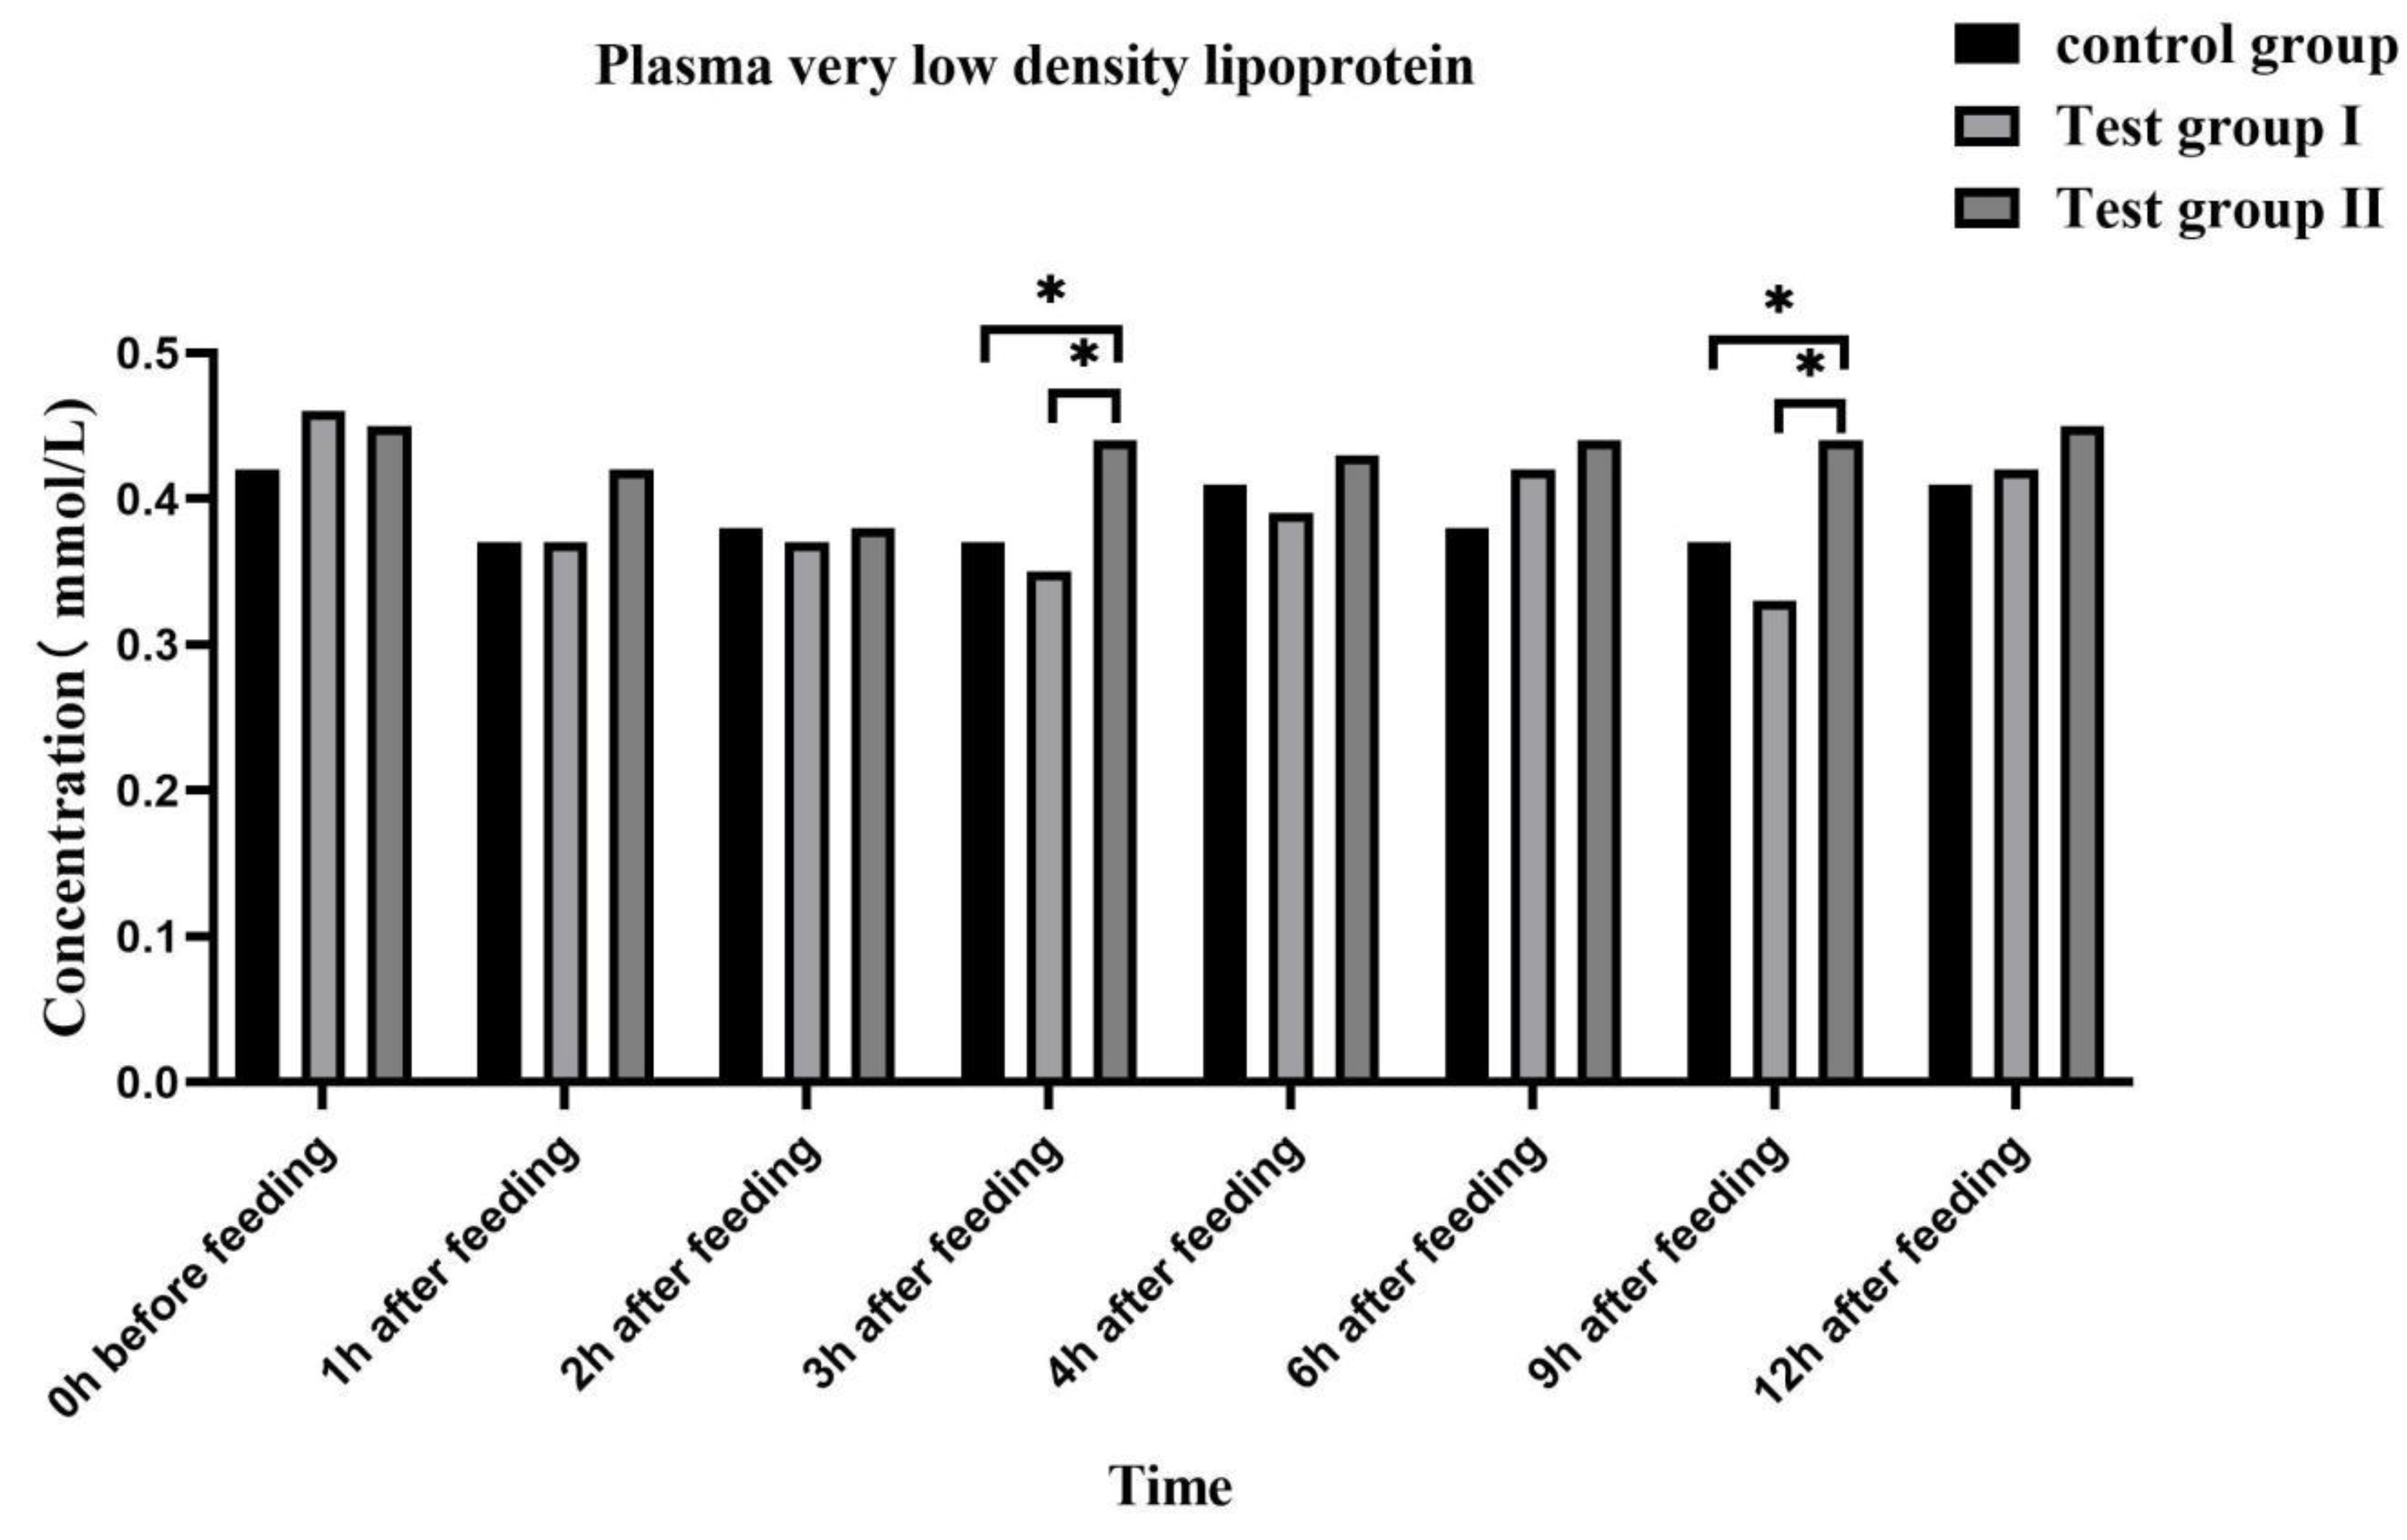
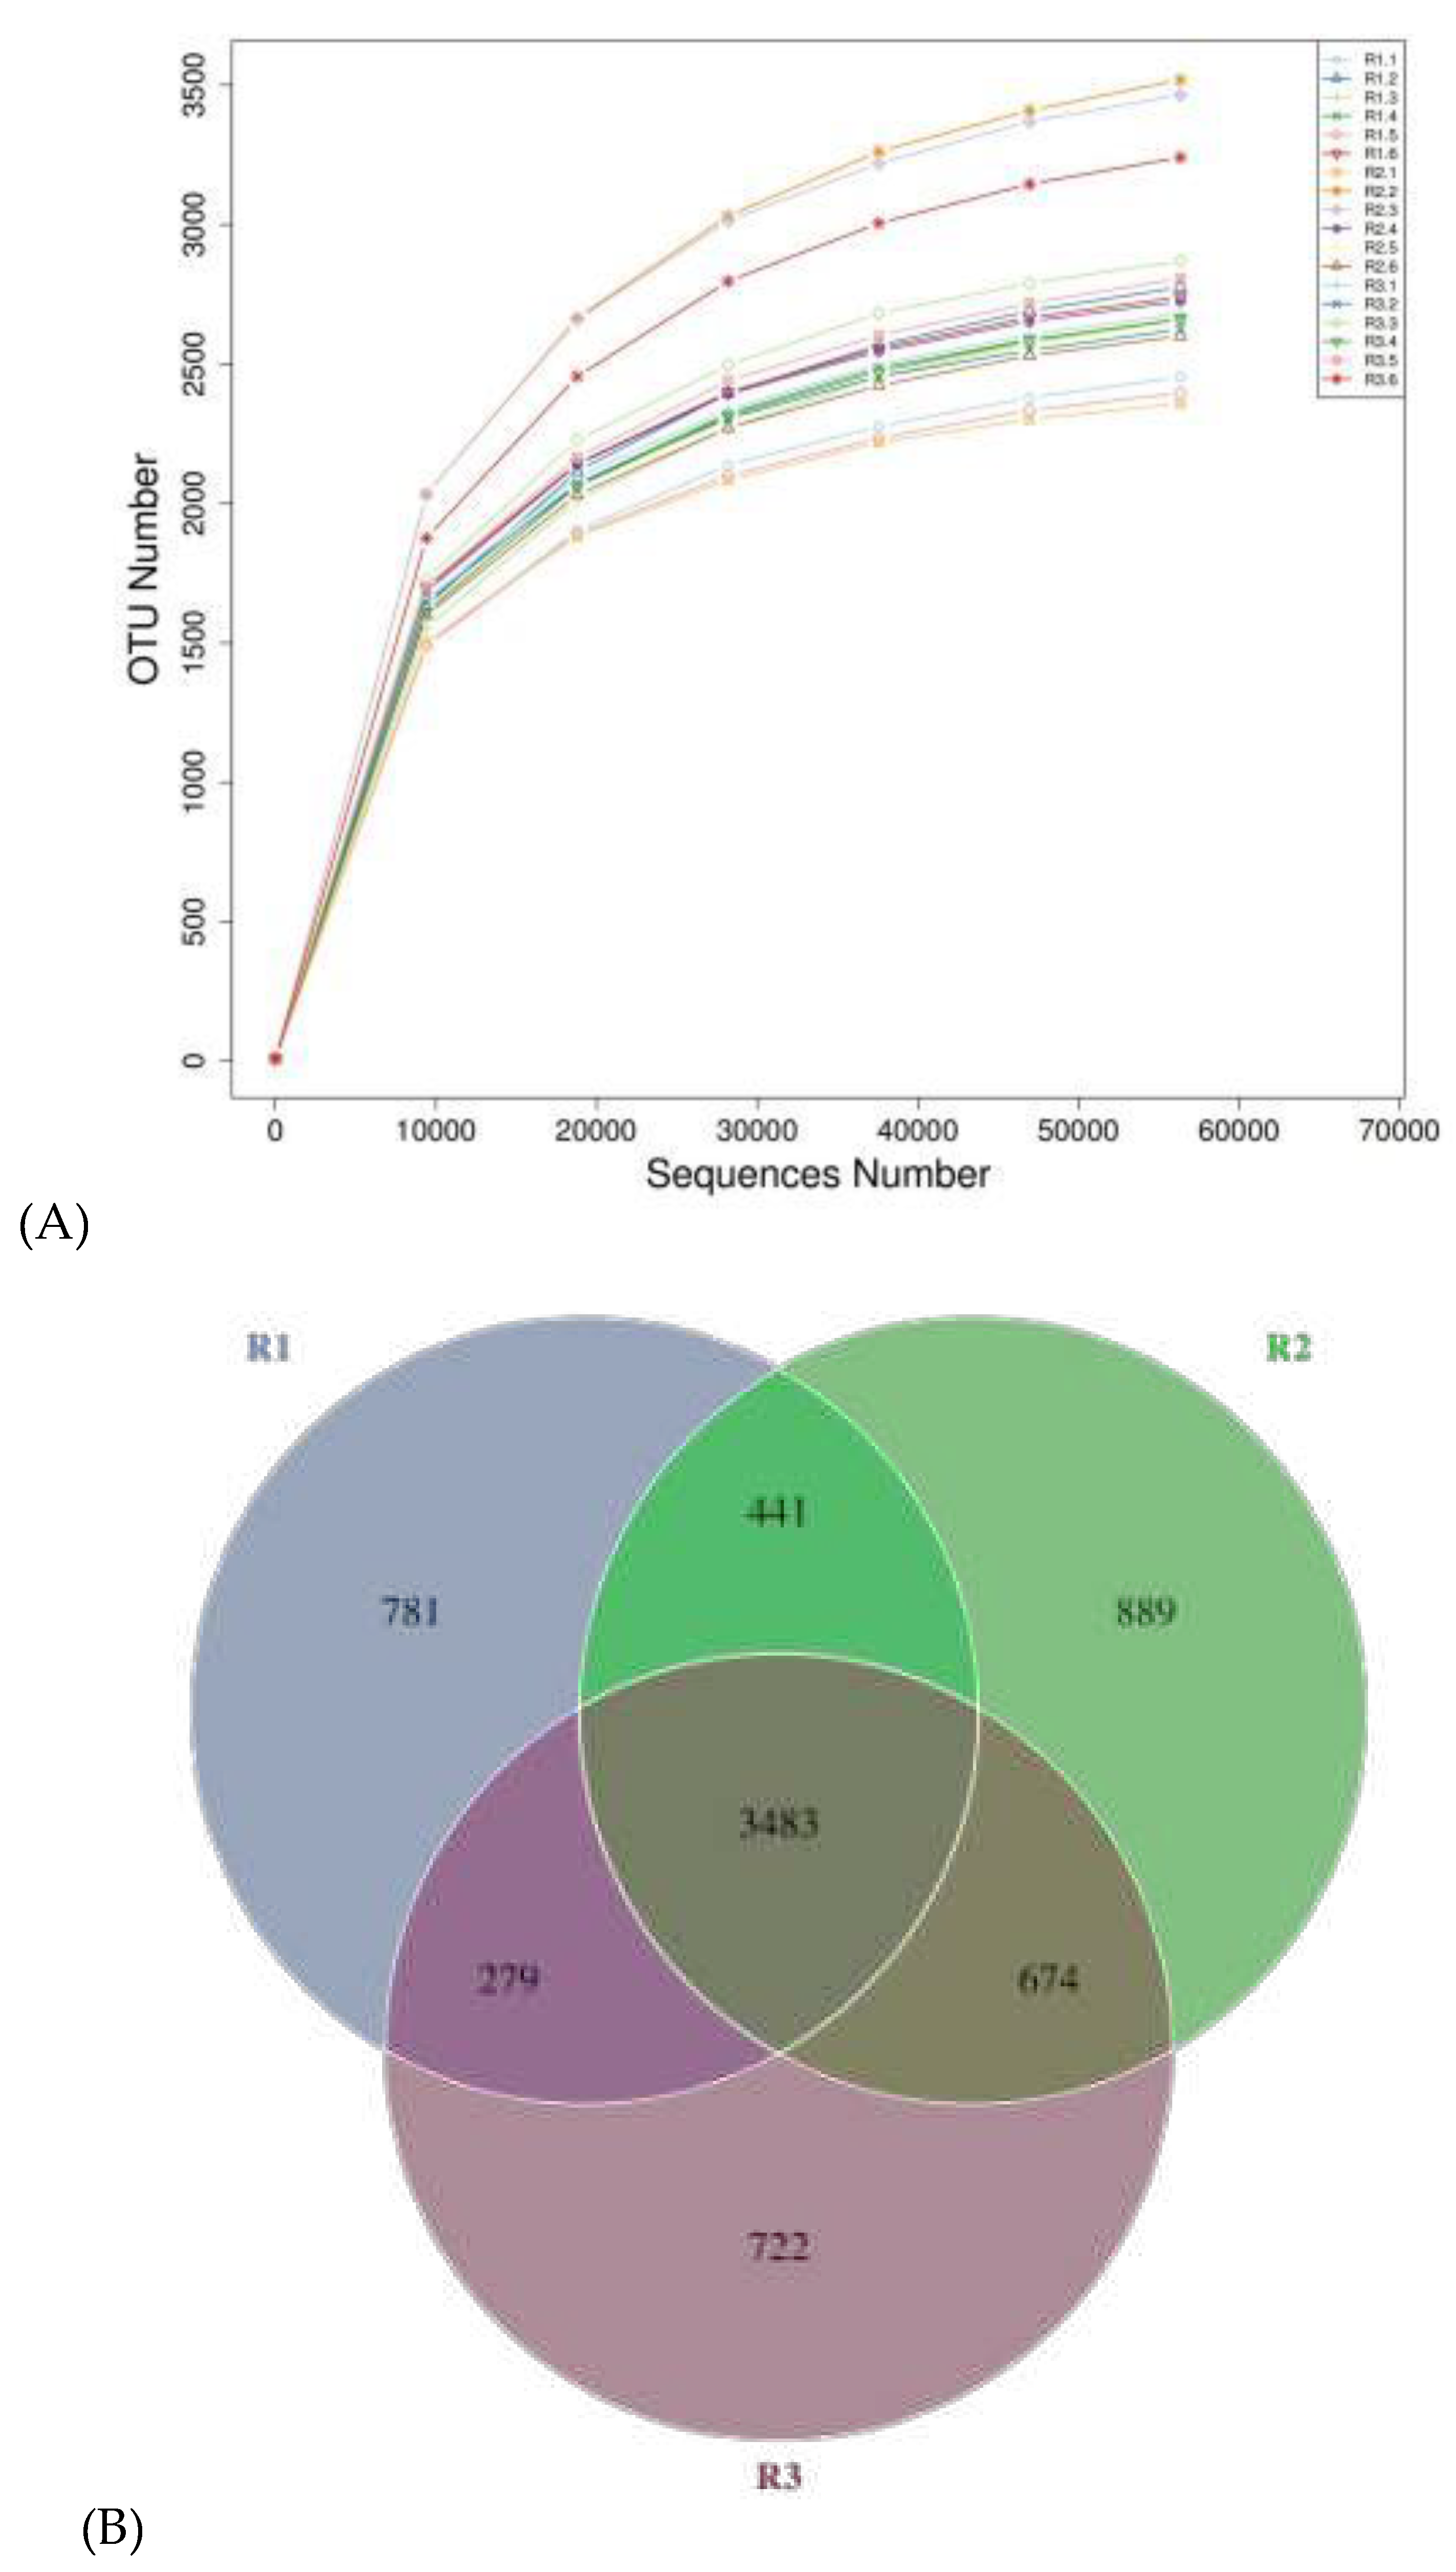
Abstract:This study aimed to explore the effects of supplementary feeding on milk yield, blood biochemical indexes, milk components, and fecal microflora diversity of Yili horses under grazing condition.18 grazing Yili mare horses with physiological condition consistent were randomly assigned to three groups with six mare horses each. The control group normal grazing, whereas the test group I and II were provided with supplemented with 1 kg/d of concentrate and 1 kg/d of concentrate + 0.4 kg/d coated fatty acids, respectively. After 3 days of pre-feeding, begin the experiment.Horse milk was collected every 7 days, and 10% of the milk yield of each horse was mixed in 100 mL milk sample bottles and stored in -20℃ refrigerator.Which blood samples were collected from the jugular vein before morning feeding (0 h) and at 1,2,3,4,6,9 and 12 h after morning feeding on day 40, and the plasma were centrifuged at 4000 rpm for 15 min and conservation at-20℃. Excrement was collected within 8 h on days 45 and 46 of the test, mixed with 5g of fresh fecal samples in a 5 mL frozen storage tubes and stored in liquid nitrogen. Compared with the control group, the lactation volume of Yili horses in test groups I and II was significantly higher throughout the trial period (P <0.05), and the late test group II was significantly higher than test group I (P <0.05). The yield of milk fat, lactose, and milk protein in test group II was significantly higher than that in test group I and control group (P <0.05); the urea nitrogen content in test group I was significantly lower than the control group (P <0.01). The lauric acid, tetradecanoic acid, cis-11,14,17-eicosotrienic acid, total saturated fatty acid, and total saturated fatty acid/total unsaturated fatty acid in test group II were significantly higher than those in the control group and test group I (P <0.05); The plasma glucose concentration of mares in test group II was significantly higher than that of control group and test group I at 1, 2 and 9 h after feeding (P <0.05), and significantly higher at 4 h after feeding (P <0.05); At 3 h and 6 h after feeding, test group II mares had significantly higher plasma free fatty acids and triglycerides concentrations than the control and test group I (P <0.05), at 4 h after feeding, the plasma triglyceride concentrations were significantly higher than the control and test I groups (P <0.05). Plasma low density lipoprotein and very low density lipoprotein concentrations were significantly higher in mares at 3 h and 9 h after feeding than in control and group I (P <0.05). The total number of OTUs was 3483, and the number of OTUs was 4984,5487, and 5158 in the control and test I and II, respectively. At the phylum level, the total abundance of Bacteroidetes and Firmicutes was more than 75%, and the test group Verrucomicrobia was significantly higher than the control group (P <0.05), and the test group II was significantly higher than the test group I (P <0.05). The Treponema_saccharophilum was significant difference in the feces of the control group (P <0.05); WCHB 1_41, kiritimatiellae, and Verrucomicrobia were significant difference of the test group II (P <0.05) and the fecal flora was mainly related to lipid synthesis, metabolism, and energy metabolism (P <0.05). Supplemental feeding can improve lactation volume of grazing Yili horses, improve the absorption and utilization of fatty acids, and improve the composition and diversity of horse milk and fecal flora to a certain extent.
Keywords: 
Subject: Biology and Life Sciences  -   Animal Science, Veterinary Science and Zoology

1. Introduction

Dairy Yili horse a breed independently bred by Xinjiang, China. It has excellent lactation performance, strong adaptability to ecological environmental conditions, and can be in harsh environmental conditions such as cold and short pasture growth period. The yield and quality of horse milk is not only important factors in determining the normal growth and development of offspring[1], but also has important economic value due to the fact that the nutritional composition of equine milk is similar to human milk and easy to absorb[2]. However, due to the low yield of horse milk and the food competition between humans and livestock during the 5-8 months of lactation[3], the produced horse milk cannot fully meet the growth, development, and nutritional needs of foals. Secondly, mares will use a large amount of energy and nutrient substrates to meet the need of milk composition synthesis during lactation, and the energy demand will rise by about 44%[4]. Grazing only cannot guarantee the highest performance of mares. The improvement of the lactation amount or improve the quality of milk components by nutritional supplementation during the lactation period is important to promote the healthy growth and development of foals and the performance of mares. Fat is a nutrient with more energy content and higher energy density than other nutrients[5]. Dietary fat has the functions of improving feed palatability, providing more essential fatty acids, advancing the absorption and utilization of fat-soluble vitamins, and reducing feed dust[6]. Spers et al. (2006) found that dietary oil supplementation significantly improved the performance of lactating mares. Doreau et al. (1992) also confirmed that the production of lactating milk increased by about 10% after feeding a high energy diet of lactating mares, but the content of fat and protein in the milk was slightly lower[7]. After exogenous fatty acid supplementation, the mammary glands of lactating mares can absorb long-chain fatty acids and some C16 fatty acids in the blood to synthesize new triglycerides, which are further polymerized into small milk fat droplets and finally secreted into horse milk[8], thereby improving the content of fat or fatty acids in horse milk[9]. In addition, the improvement of horse milk quality, intestinal immunity, and energy supply are closely related to the cecal microbial activities of horse animals[10], which is great significance for the stable maintenance of the intestinal environment of horses during exogenous supplementary feeding[11]. At present, lack of research on the effects of supplementary feeding on milk production performance of Yili horses. Therefore, this experiment grazing Yili horses were selected as the research object to explore the effect of supplementary feeding on the lactation yield, milk composition and fecal flora diversity of grazing Yili horses, in order to provide a reference for improving the milk yield, improving the quality of milk composition, promoting the healthy growth and development of foals.

2. Materials and methods

2.1. Test time and place

This study was conducted at the Zhaosu Yili Kazak Autonomous Prefecture (E80° 83′ 23″, N42° 83′ 12″) for 63 days from August 2022 to October 2022.

2.2. Experimental design

18 healthy Yili mare horses with similar foal date, lactation, and milk yield, and consistent physiological states were randomly divided into the control group and test groups I and II with each group have six mare horses. The control group was fed by grazing only, and the test I group per horse was fed with 1 kg/d of concentrate on the basis of the control group (Purchased from Xinjiang Yili Prefecture Zhaosu County Junli Agriculture and Animal Husbandry Technology Co., LTD), Group II per horse fed 0.4 kg/d coated fatty acids on the basis of Group I (Purchase from Shandong Linyi Positive Energy Biology Co., LTD).

2.3. Feed management

All the test horses were grazing in the same pasture, and fed at 10:30 every day, separating the mare from the foal, the control group wore a empty customized pocket, and groups I and II wore fully mixed with concentrate and concentrate + fat powder customized pocket. After the horses in groups I and II fed concentrate, all the horses picked the pocket. Horse milk was collected at 11:00 am every day, once every 2 h. After the last day horse milk collection (19:00), foals and mares were driven to the designated pasture for grazing. After 3 days of pre-feeding, begin the formal test, all horses were managed uniformly and consumed food and water freely. The concentrate supplement and nutrient levels are shown in Table 1, and the fatty acid compositions of concentrate supplement, pasture and fat powder are shown in Table 2.

2.4. Sample collection and testing

2.4.1. Horse milk sample collection

All-day milk samples were collected by manual milking every 7 d for 9 times. 10% of each daily milk yield of each horse was mixed in 100 mL milk sample bottles and stored in a-20℃ refrigerator waiting for testing.

2.4.2. Blood sample collection

On day of 40 test, on the empty stomach (0 h) and 1,2,3,4,6,9, and 12 h after morning feeding, 5mL of blood was collected from the jugular vein to heparin sodium, the samples were centrifuged at 4000rpm for 15 min, and the treated plasma was transferred to 2.0 mL Eppendorf tubes and stored in a-20℃ refrigerator waiting for testing.

2.4.3. Faecal sample collection

On day of 45 and 46 experiment, Horses' feces (11:30-19:30) within 8 h were collected into the bucket. After 2 d feces samples were fully mixed, 10% was randomly selected, weighed, air dried, crushed in 0.63 mm, stored for testing; and 5 g of fresh feces samples in 5 mL frozen storage tubes and stored in liquid nitrogen for testing.

2.5. Sample testing

2.5.1. Measurement of lactation volume

During the whole test, every times lactation volume of each horse was weighed by electronic scale and recorded, add together the lactation volume of every times (A total of 5 times), which was the lactation volume of each day.

2.5.2. Determination of milk composition

The test day 21,28,42,and 49 days milk samples mixed at room temperature after thawing, respectively. Samples in 42℃ water bath preheating, after preheating, each horse mixed milk sample slowly upside down about 20 times, to ensure fully mix, then according to the milk composition automatic analyzer (Hangzhou Zhejiang university optimal technology co., LTD. UL80BC-11) operation steps determine milk routine ingredients.Some samples were sent to Shandong Academy of Agricultural Sciences to determine the fatty acid content of high-efficiency gas chromatography.

2.5.3. Determination of plasma biochemical indexes

On day of 40 experiment, the plasma collected on the empty stomach (0 h) and 1,2,3,4,6,9, and 12 h after morning feeding were submitted to Beijing Huaying Institute of Biotechnology for determining the plasma concentrations of blood glucose, free fatty acid concentration, triglycerides, low density lipoprotein, and very low density lipoprotein were tested by using colorimetric method.

2.5.4. Determination of diversity in the fecal microflora

Faecal samples DNA extraction draws with the help of Beijing Nuohe Zhiyuan BioInformation Technology Co., Ltd. The 16S rDNA V3-V4 region was selected, using the diluted DNA fragment as template for PCR amplification with specific primers. (Double-end splicing, quality control, and then the resulting chimeras were filtered, purified and constructed) the library was sequencing based on the Illumina HiSeq platform to obtain the differences in species composition and community structure among the samples.

2.6. Data analyses

Data were preliminarily sorted using MS-Excel 2010, lactation volume and plasma biochemical indexes were analyzed using GraphPad Prism 8.0.2 mapping software, milk composition was analyzed by two-way ANOVA with SAS 8.1 statistical software, Fecal microflora structure and diversity were analyzed by ANOVE with SPSS 21.0 statistical software, Duncan's method for multiple comparisons.We used 0.05 ≤ P < 0.10, P < 0.05, and P < 0.01 to indicate a significant trend, significant difference, highly significant difference respectively

3. Results

3.1. Effect of concentrate supplementation and fatty acids on lactation volume of grazing Yili horses

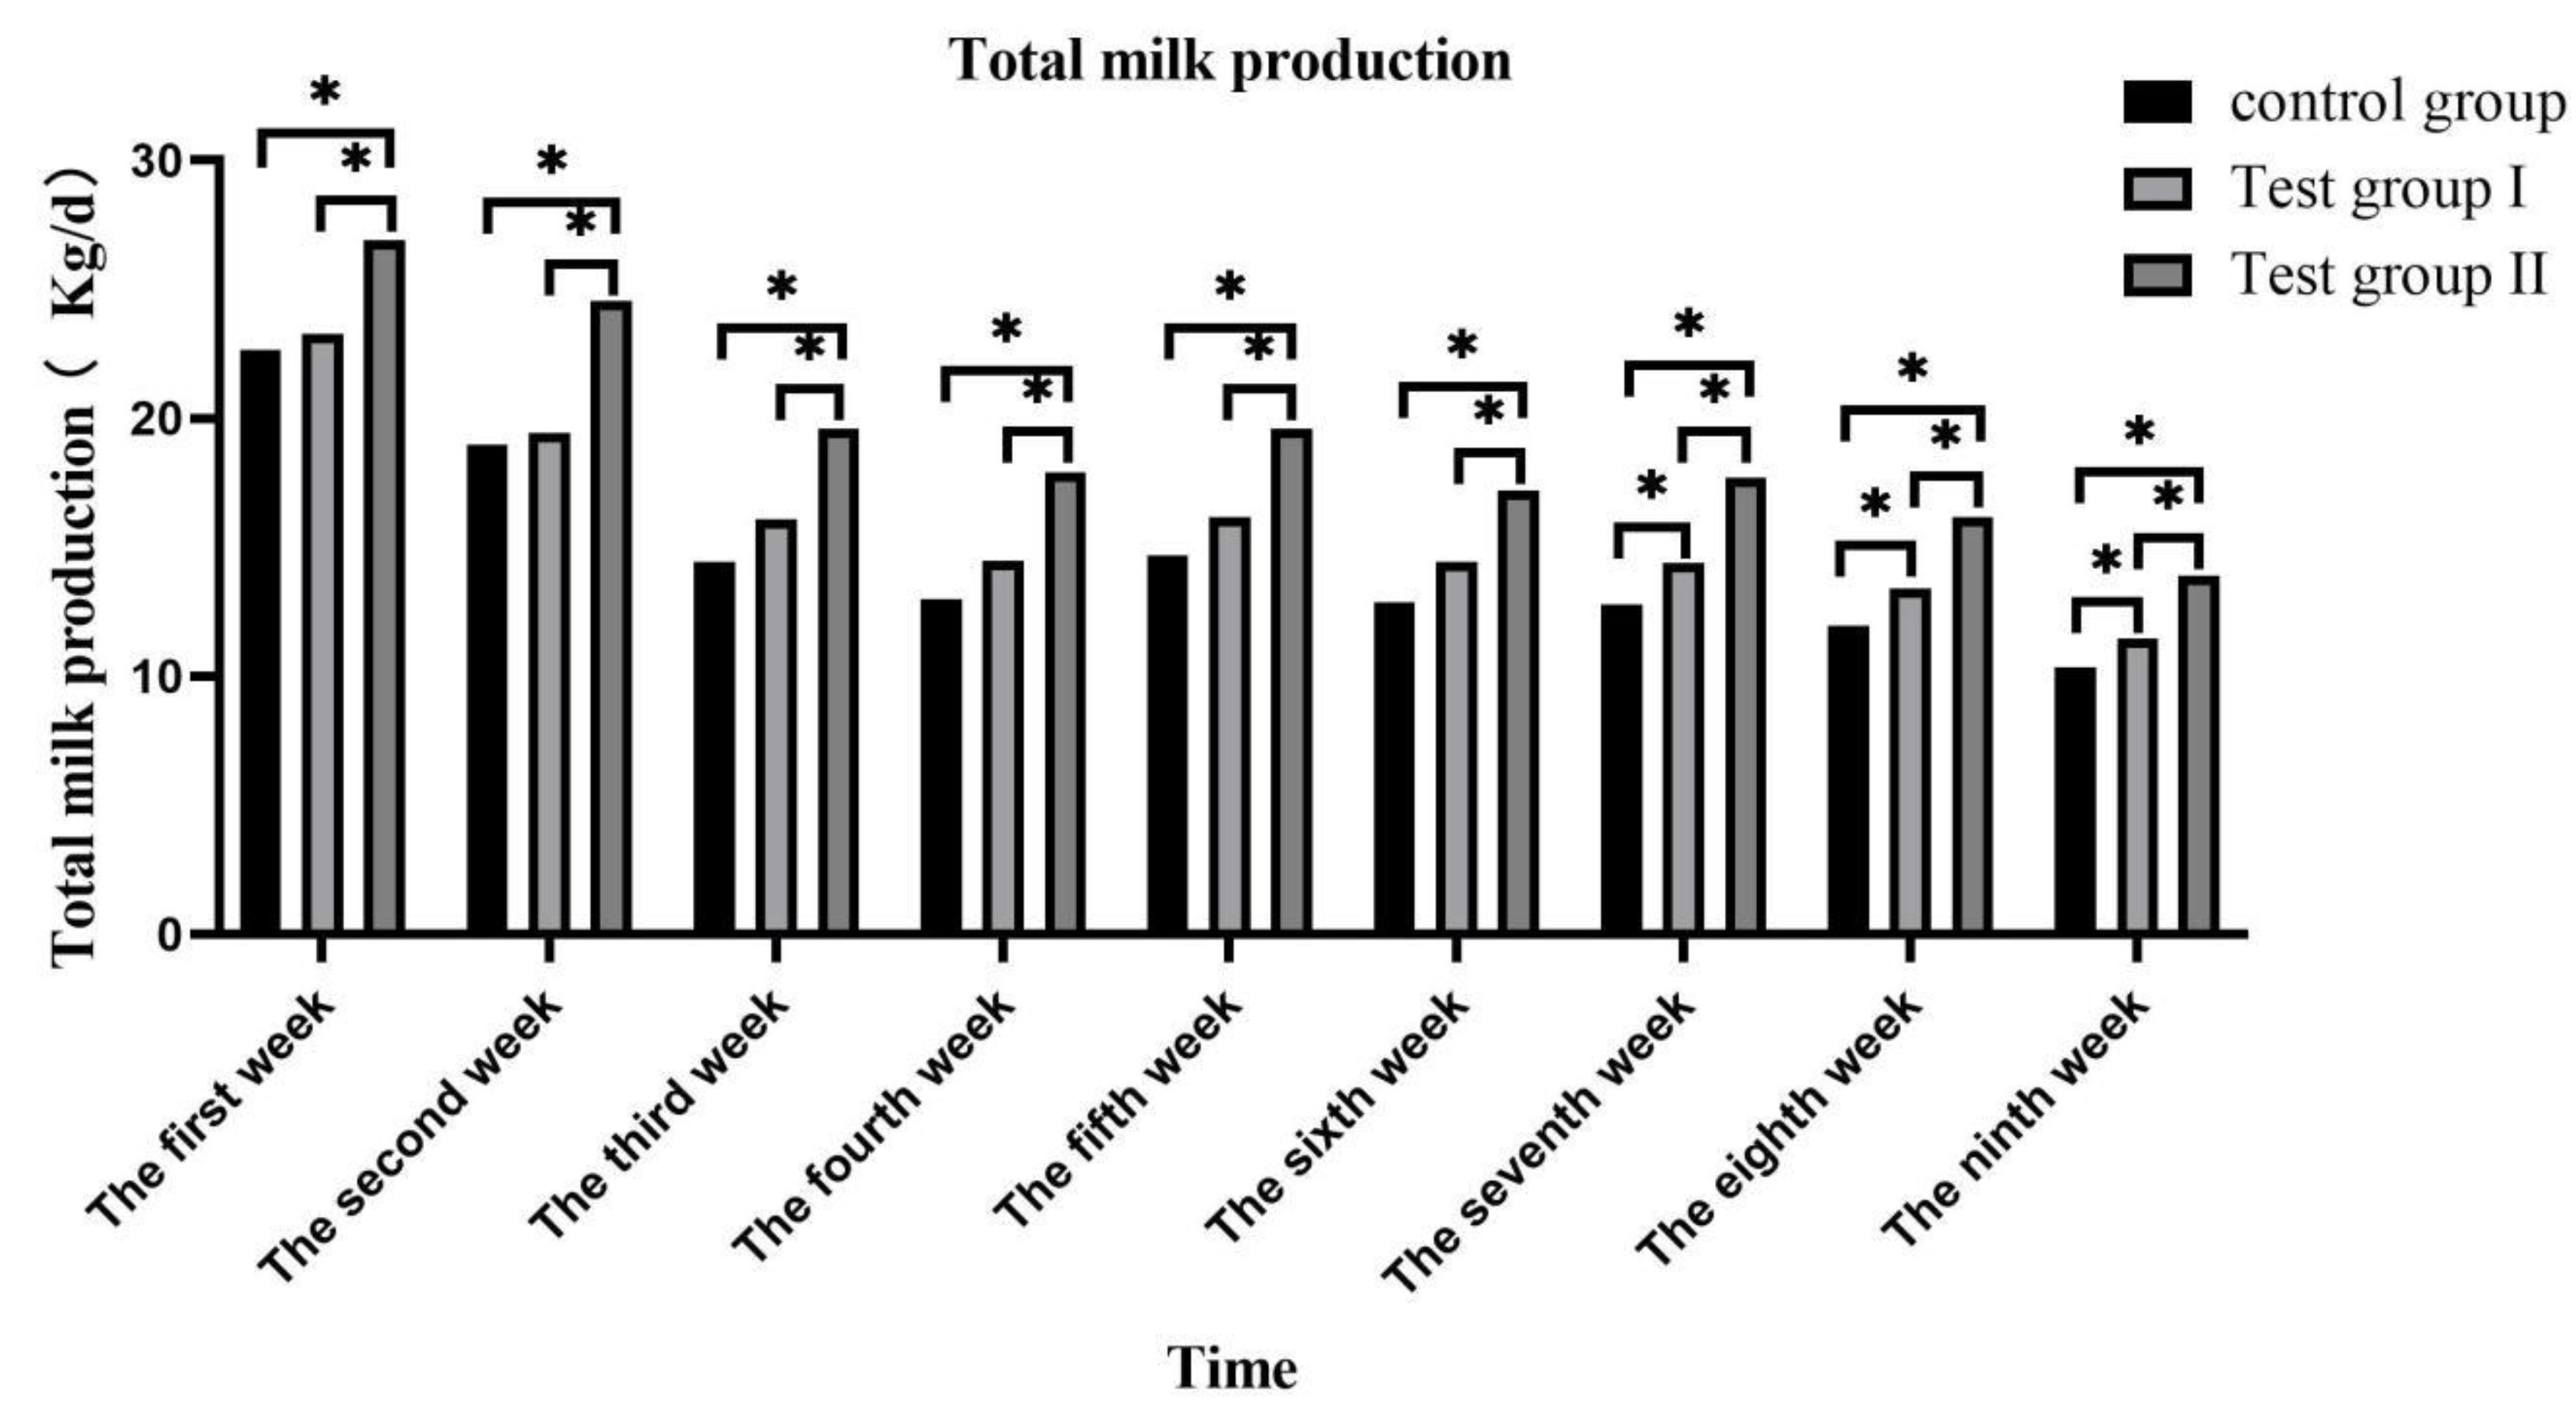
Lactation volume of daily average and total were peaked in the first week and then gradually decreased (Figure 1). Group II lactation volume of daily average and total was significantly higher than that of control group and group I (P <0.05), and group I significantly higher than that of control group (P <0.05) (Figure 2).

3.2. Effects of concentrate supplementation and fatty acids on milk composition of grazing Yili horses

Shown in Table 3. There were no significant differences in milk fat rate, milk protein rate, lactose rate, total solid, and somatic cell number among the groups (P> 0.05), the milk fat, milk protein, and lactose production were significantly higher than that of control group and test group I (P <0.05), and the urea nitrogen content test I and II were significantly lower than that of control group (P <0.05), showing a significant decrease in time (P <0.01).

3.3. Effects of concentrate supplementation and fatty acid on fatty acid constitute of grazing Yili horses

Shown in Table 4. Group II Lauuric acid, tetradecanoic acid, cis-11,14,17-eicosantrienoic acid , total saturated fatty acid, and total unsaturated fatty acid were significantly higher than that of control group and group I (P <0.05); Heptadecanoic acid monoenoic acid, γ-linolenic α-linolenic acid, total-linolenic acid and total polyunsaturated fatty acid were significantly lower than that of control group and group I (P <0.05), and pentadecanoic acid and linoleic acid were significantly lower than that of control group (P <0.05).

3.4. Effect of concentrate supplementation and fatty acids on plasma biochemical indexes of grazing Yili horses

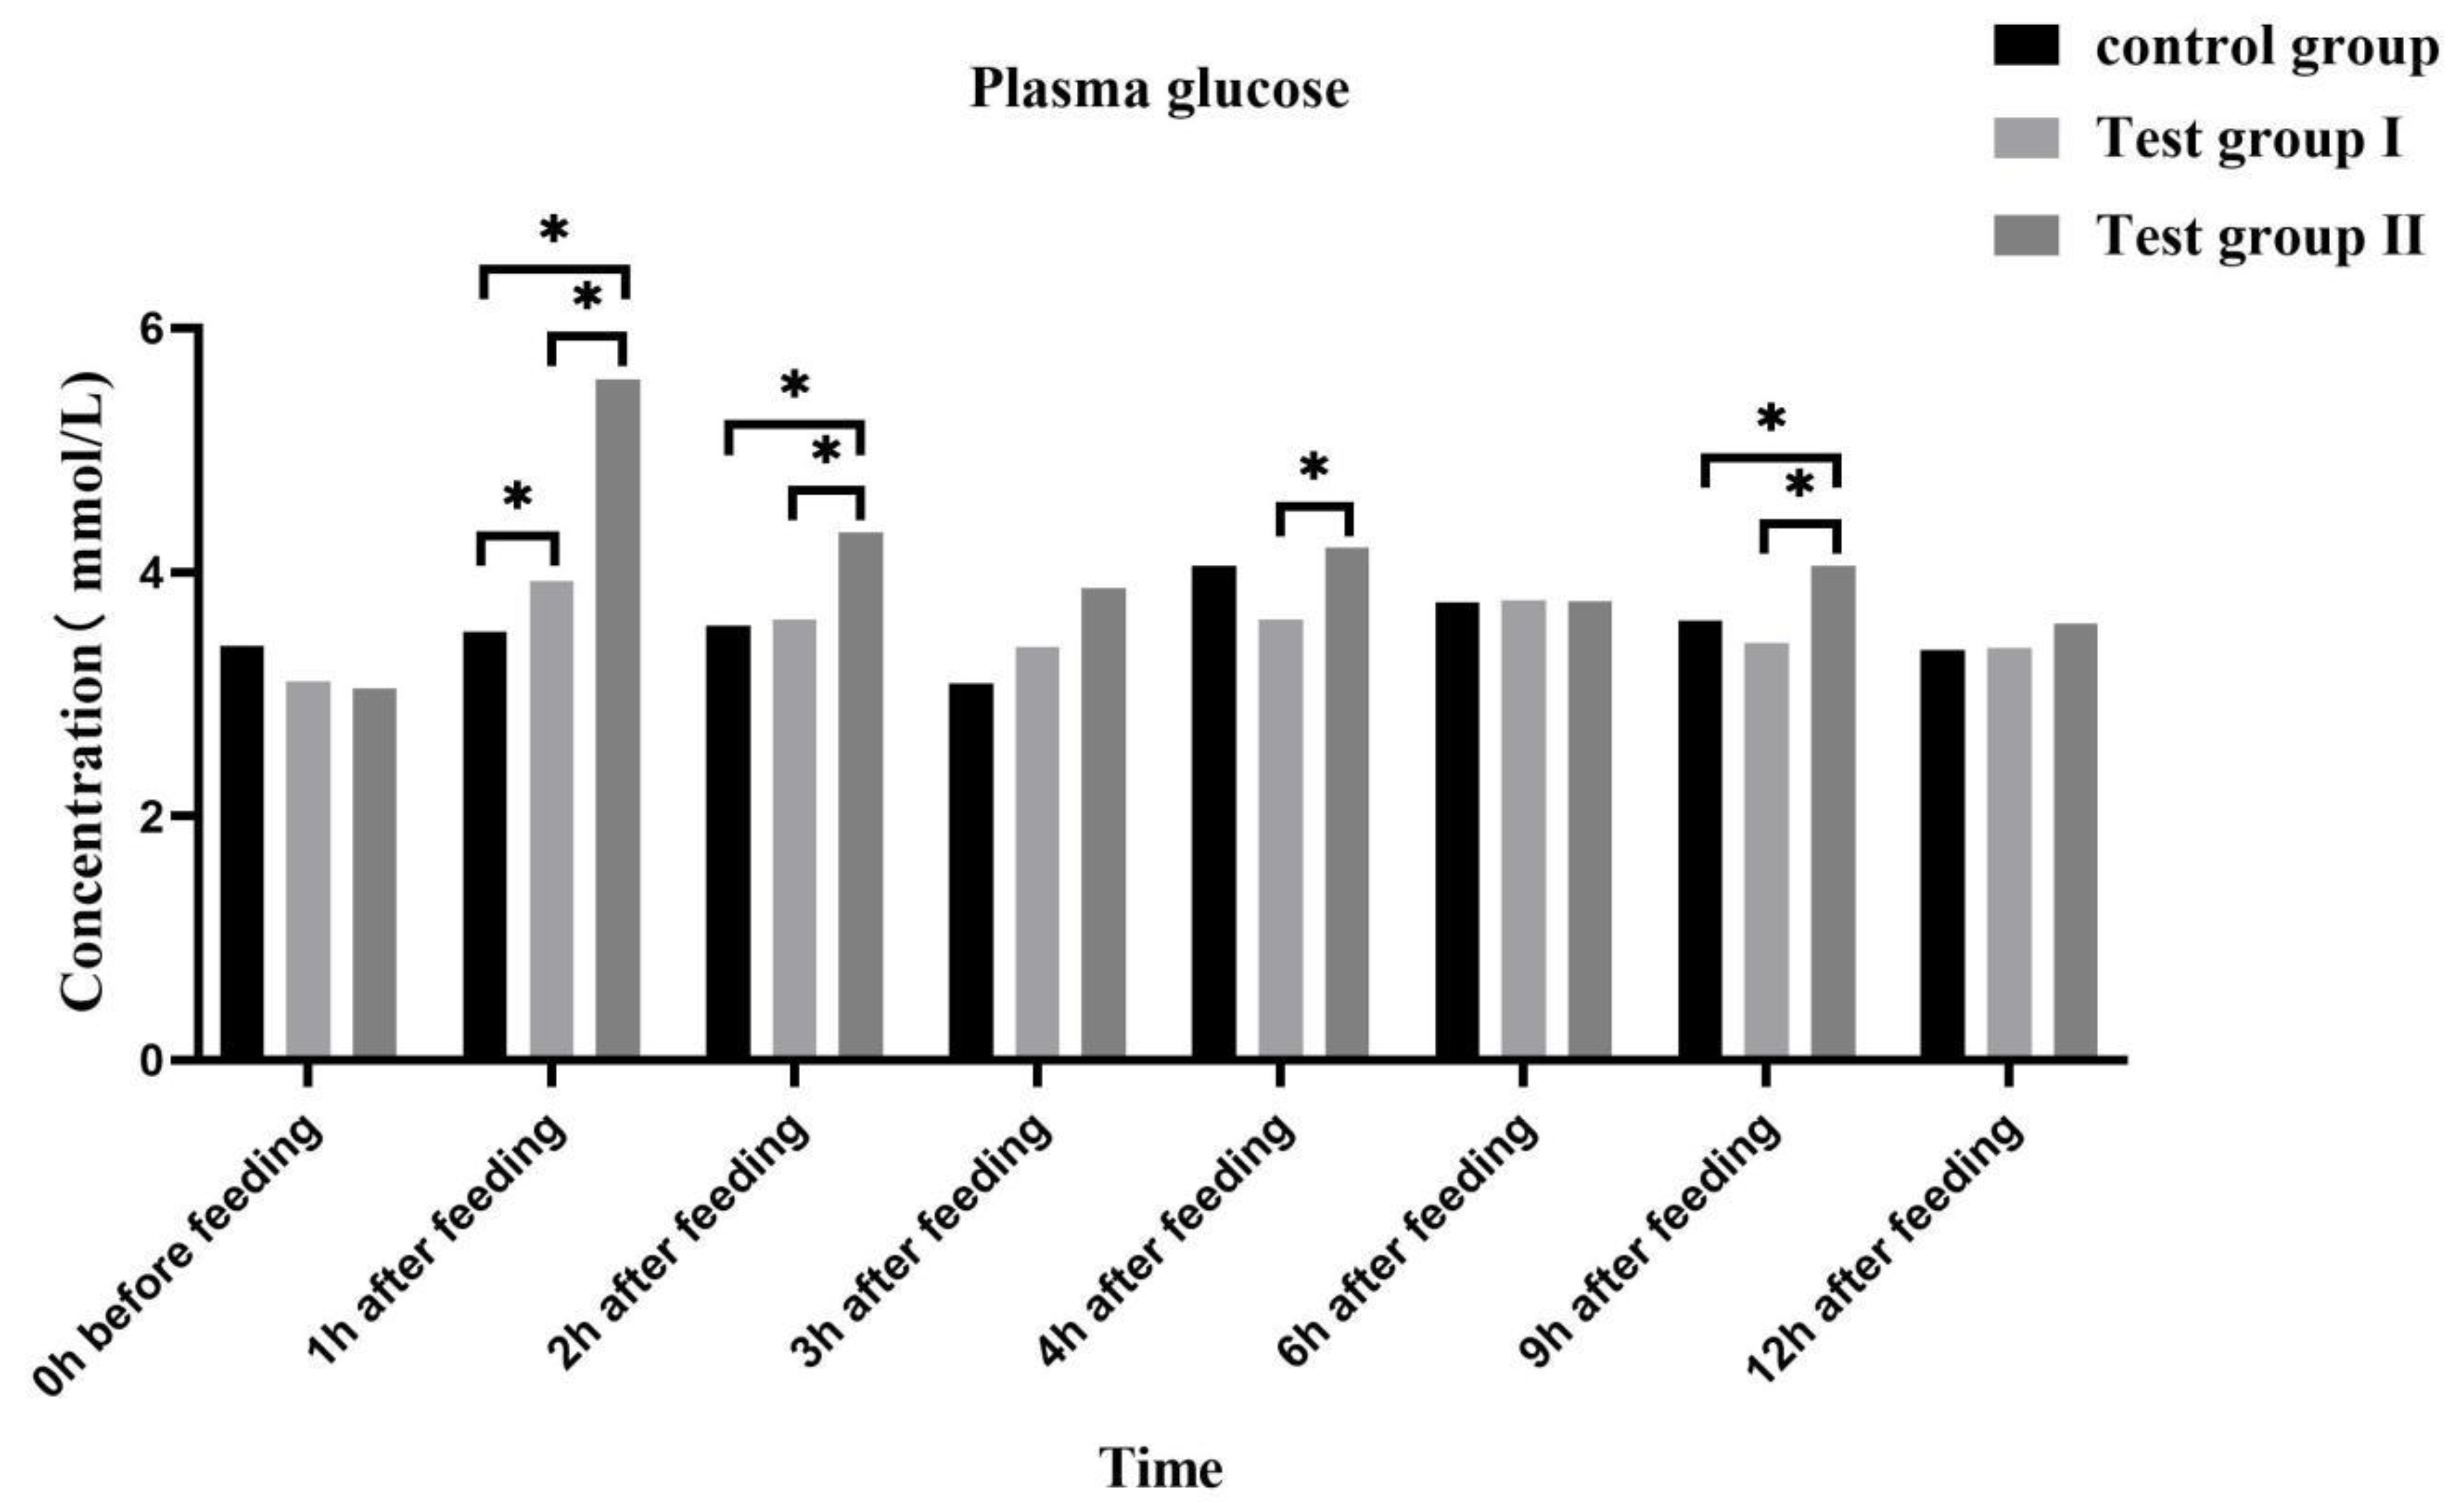
The plasma glucose (Figure 3) concentration in the experimental group increased first and then decreased, reaching the highest at 1 h after feeding, group II of plasma glucose concentration was significantly higher at 1 h, 2 h and 9 h than that of control group and group I (P <0.05), and significantly higher at 4 h after feeding than that of group I (P <0.05).
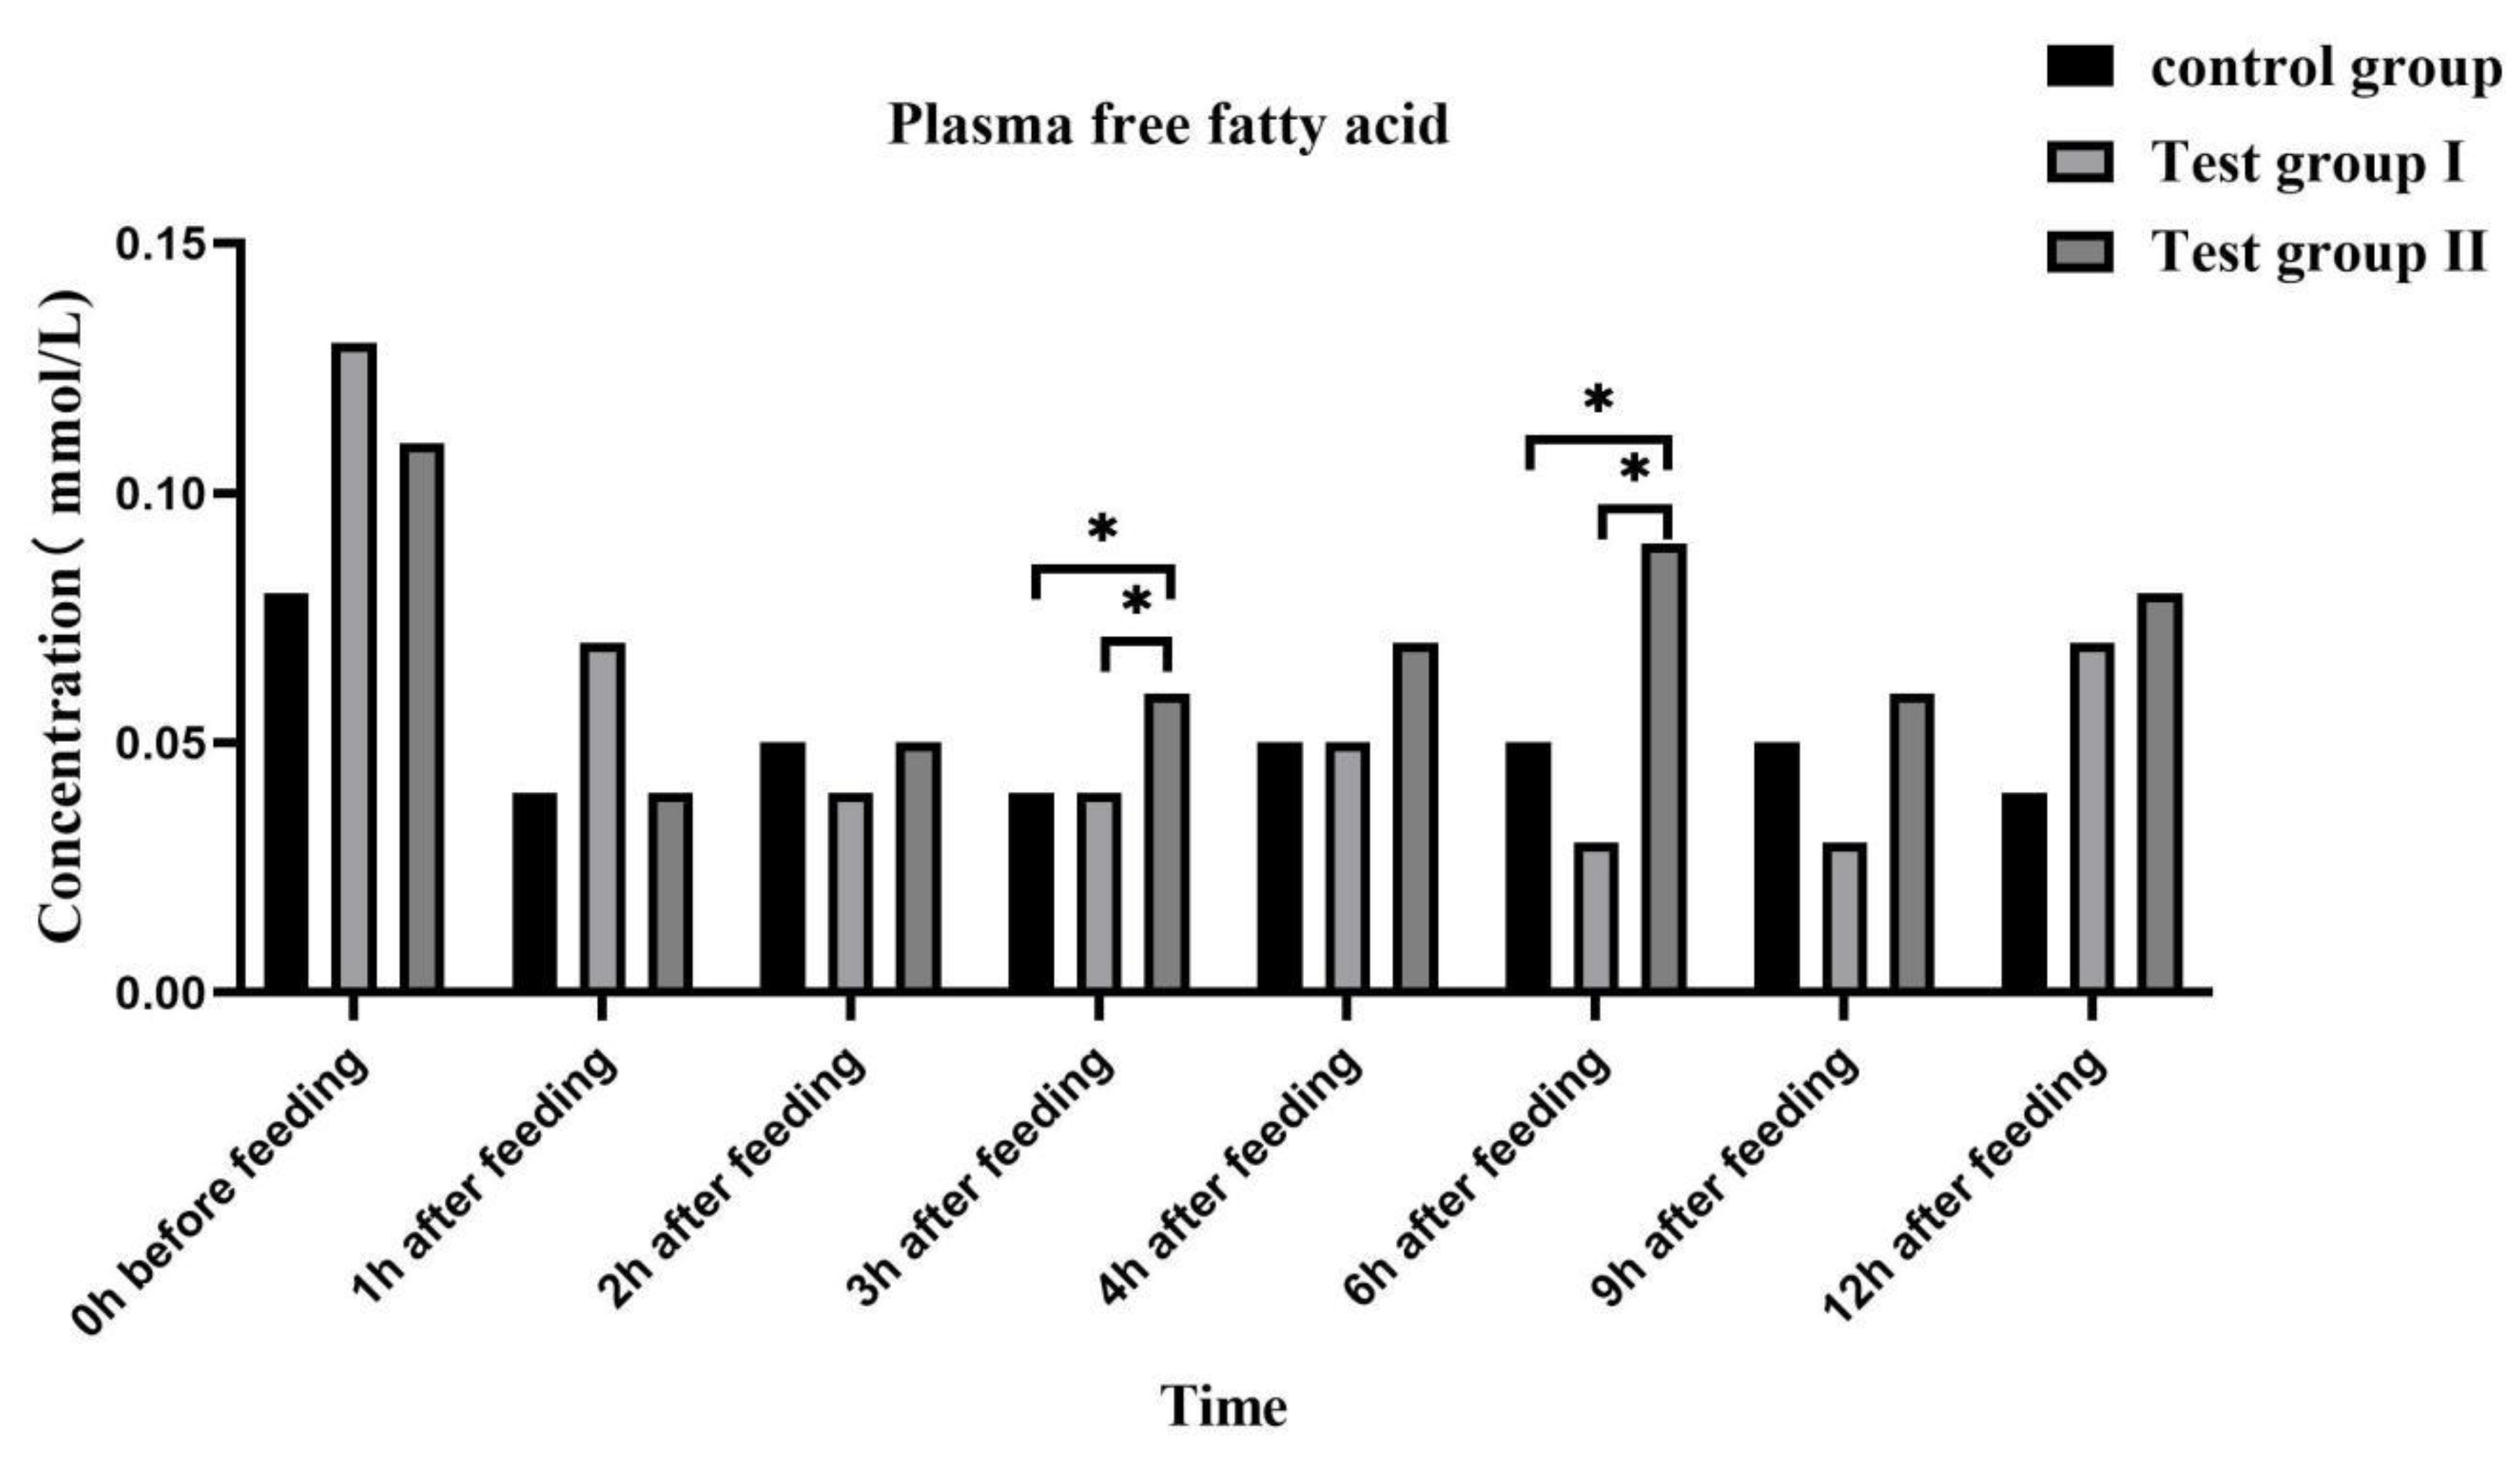
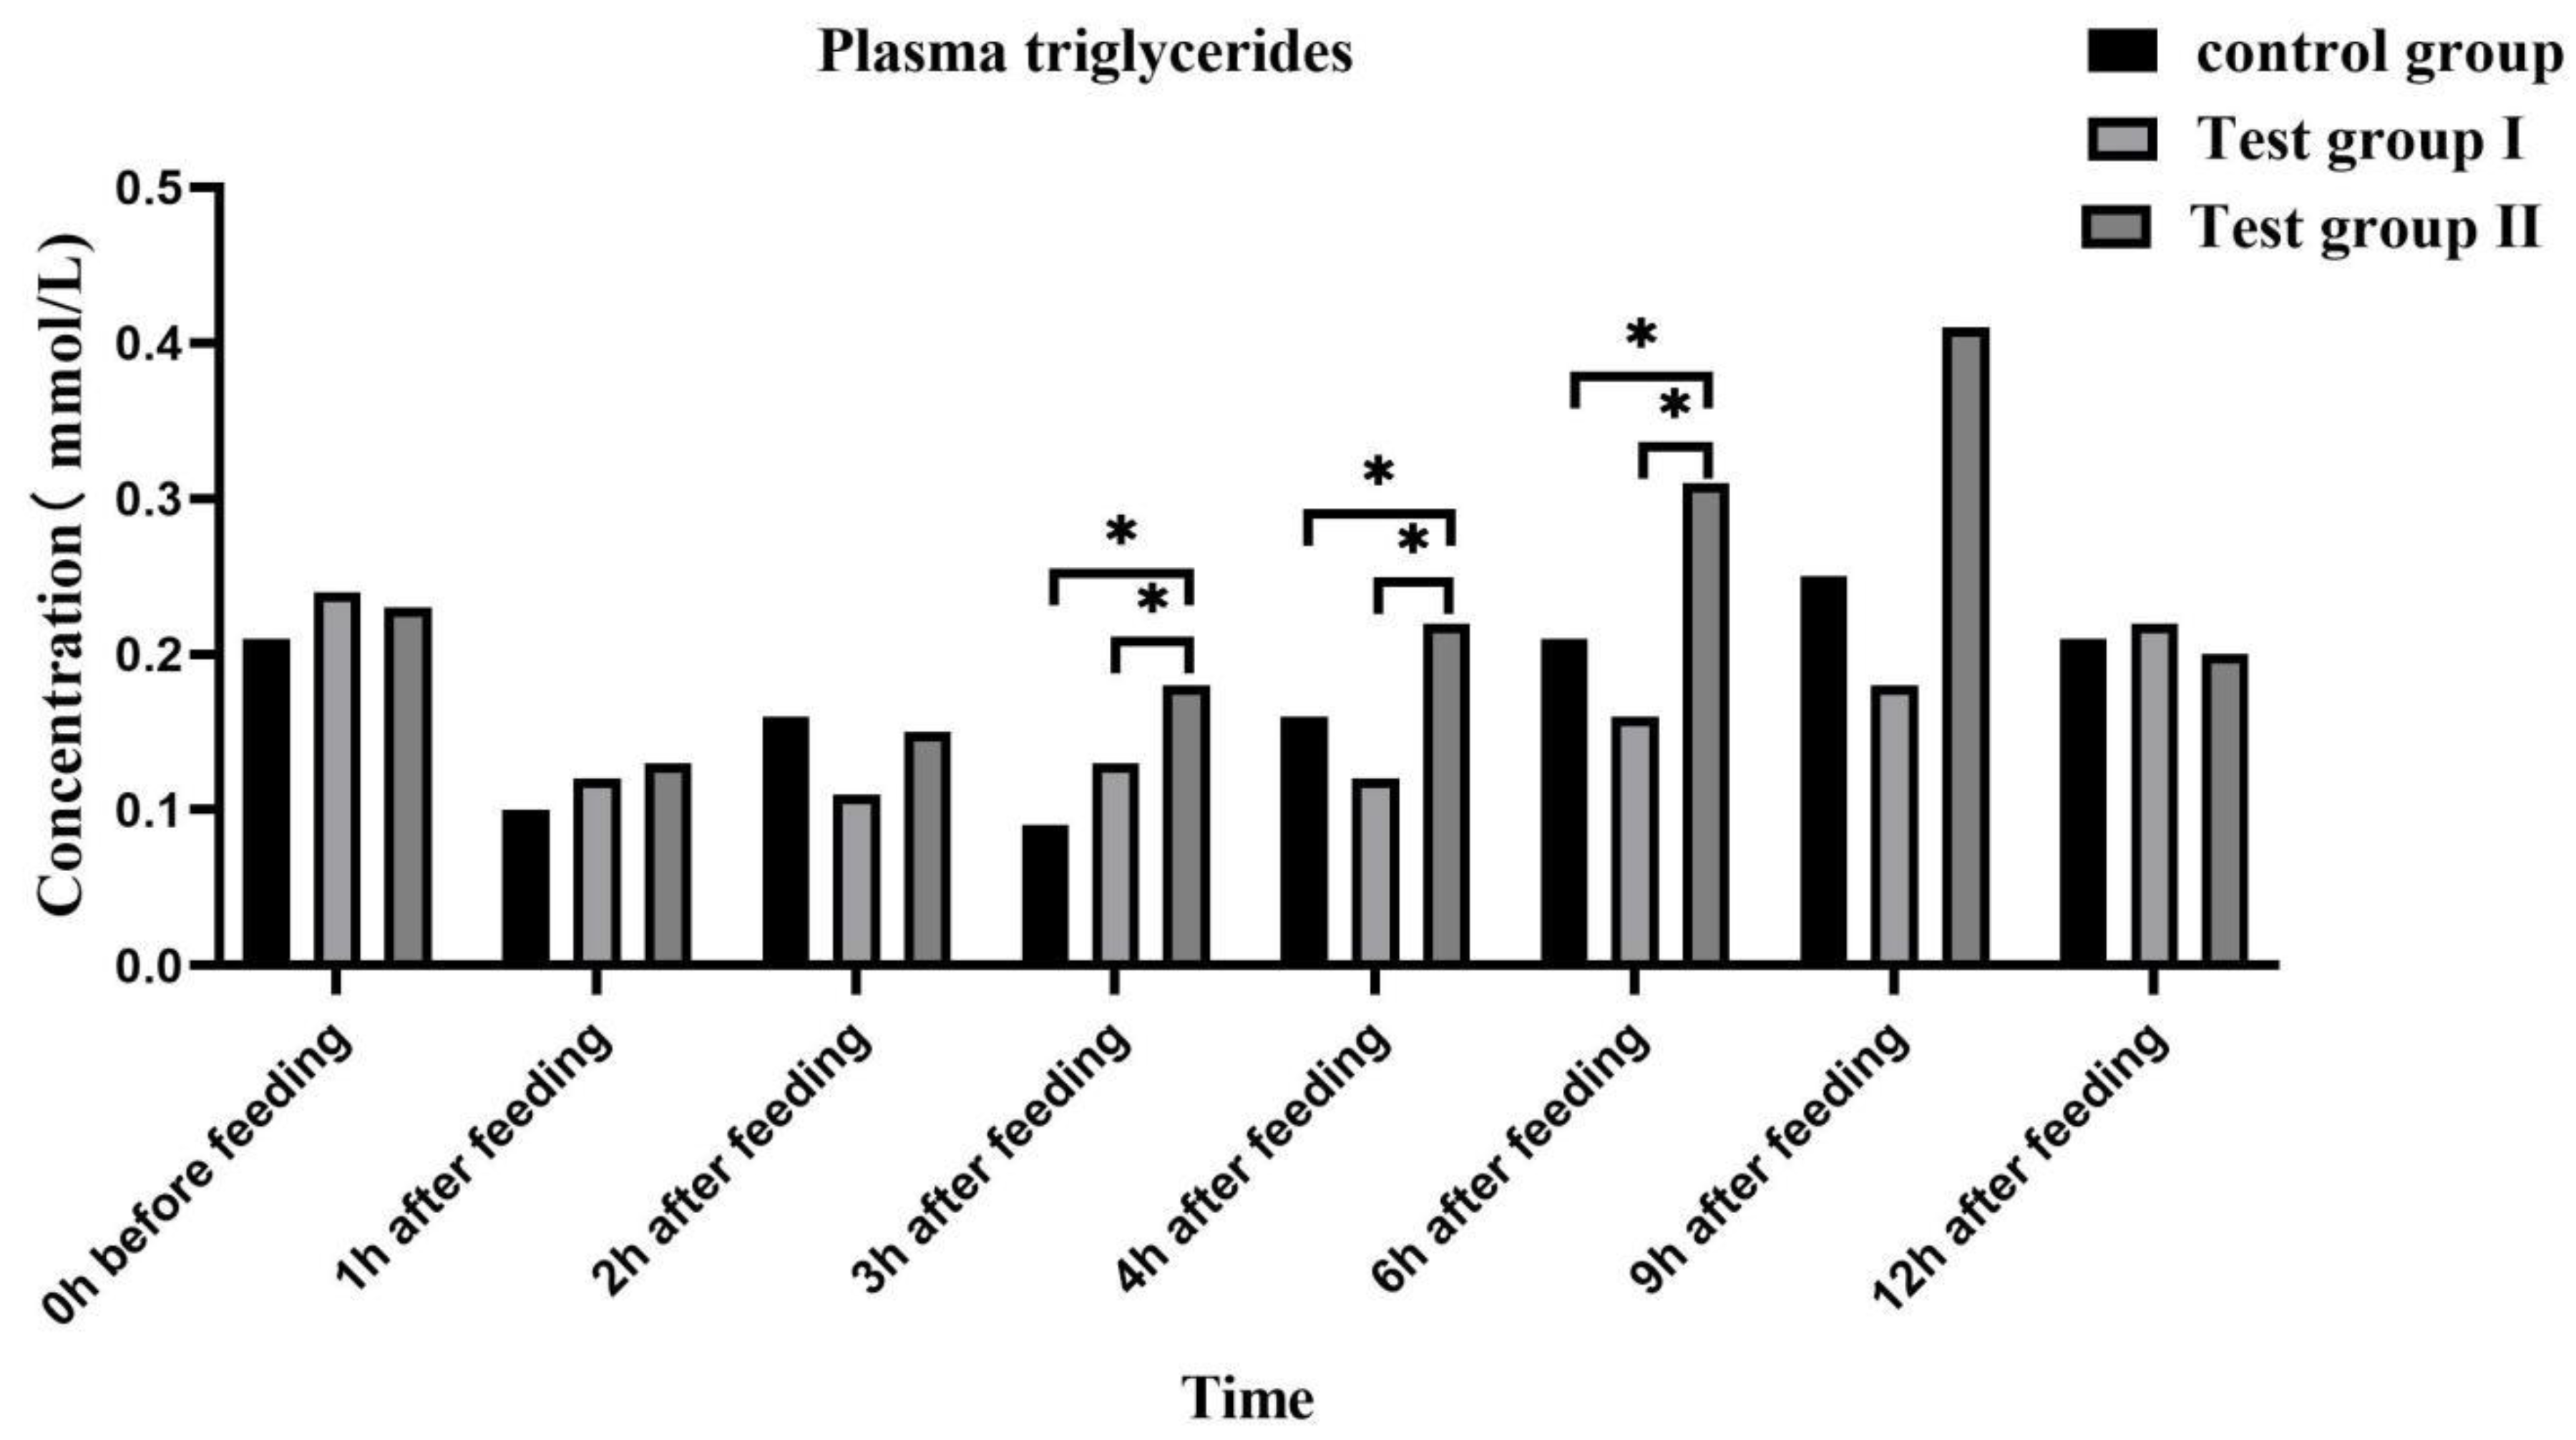
The concentrations of plasma free fatty acids (Figure 4) and plasma triglycerides (Figure 5) were high 0 h before feeding and low 1 h after feeding, and the ensemble concentration level was gradually increasing after feeding.
Compared with controls and group I, group II free fatty acid and triglyceride plasma concentrations were higher significantly (P <0.05), and significantly higher than that of group I at 4 h after feeding (P <0.05). Plasma free fatty acid concentrations increased compared to the experimental group I at 2 h after feeding (0.05 <P <0.10).
Plasma low density lipoprotein (Figure 6) and very low density lipoprotein (Figure 7) concentrations in the experimental group remained at relatively stable levels after feeding. Compared with controls and group I, group II plasma low density lipoprotein and very low density lipoprotein concentrations were significantly higher at after feeding 3 h and 9 h (P <0.05), respectively.

3.5. Effect of concentrate supplementation and fatty acids on the faecal flora diversity of grazing Yili horses

When the dilution curve reached a flat trend, it indicated that the number of faecal microflora samples of grazing Yili horses was deep enough for Alpha diversity analysis (fig 8-A). There were 4984,5487 and 5158 OTUs in the control group, group I, and II, respectively. And there were 3483 OTUs in common of the three groups (Figure 8-B), which indicated that more bacterial species were detected in groups I and II, indicating that concentrate supplement and fatty acids could increased the diversity of intestinal microflora of grazing horses.

3.6. Effect of concentrate supplementation and fatty acids on the Alpha diversity analysis of fecal phylum flora in grazing Yili horses

Shown in Table 5. The coverage of each group reached 0.99, indicating that the data of each group could accurately reflect the composition of intestinal flora of grazing Yili horses. The Shannon index, Chao1 index, and ACE index were all improved in the test group, but the difference was not significant (P> 0.05), indicating that the concentrate supplement and fatty acids improved the diversity and abundance of intestinal microflora of grazing Yili horses to a certain extent.

3.7. Effect of concentrate supplementation and fatty acids on the abundance of fecal phylum flora in grazing Yili horses

Shown in Table 6. The composition and relative abundance of grazing Yili horse fecal flora at the phylum level was Bacteroidetes, Firmicutes, Spirochaetes, Verrucomicrobia, Unidentified_Bacterri, Proteobacteria, Euryarchaeota, Halobacterota, Fibrobacterota, and Acidobacteriota. Among them, the sum of the abundance of Bacteroidetes and Firmicutes was more than 75%. Compared with the control group, the experimental group Verrucomicrobia was significantly higher (P <0.05), and the group II was significantly higher than the group I (P <0.05), and none of the rest was significantly different (P> 0.05).

3.8. Effect of concentrate supplementation and fatty acids on the abundance of bacteria in fecal families of grazing Yili horses

Shown in Table 7. In this experiment, the top 10 family level was detected in the family level, including Rikenellaceae, Lachnospiraceae, Spirochaetaceae, Prevotellaceae, p-251-o5, F082, Bacteroidales_RF16_group, Oscillospiraceae, Clostridiaceae, and Ruminococcaceae. There were no significant difference between groups (P> 0.05).

3.9. Effect of concentrate supplementation and fatty acids on the abundance of bacteria in genus level of grazing Yili horses

Shown in Table 8. In this experiment, the top 10 genus level was detected in the family level, including Treponema, Rikenellaceae_RC9_gut_group, Clostridium_sensu_stricto_1, Prevotellaceae_UCG-001, UCG-004, Prevotellaceae_UCG-004, Ruminococcus, Prevotellaceae_UCG-003, Lachnospiraceae_UCG-009, and Faecalibaculum. Compared with the control group, experimental group Prevotellaceae_UCG-001 was lower the trend (0.05 <P <0.10). Other genera increased significantly (P <0.05).

3.10. LEfSe analysis and Tax4Fun function prediction of feces on dietary Supplementary concentrate and fatty acids of grazing Yili horses

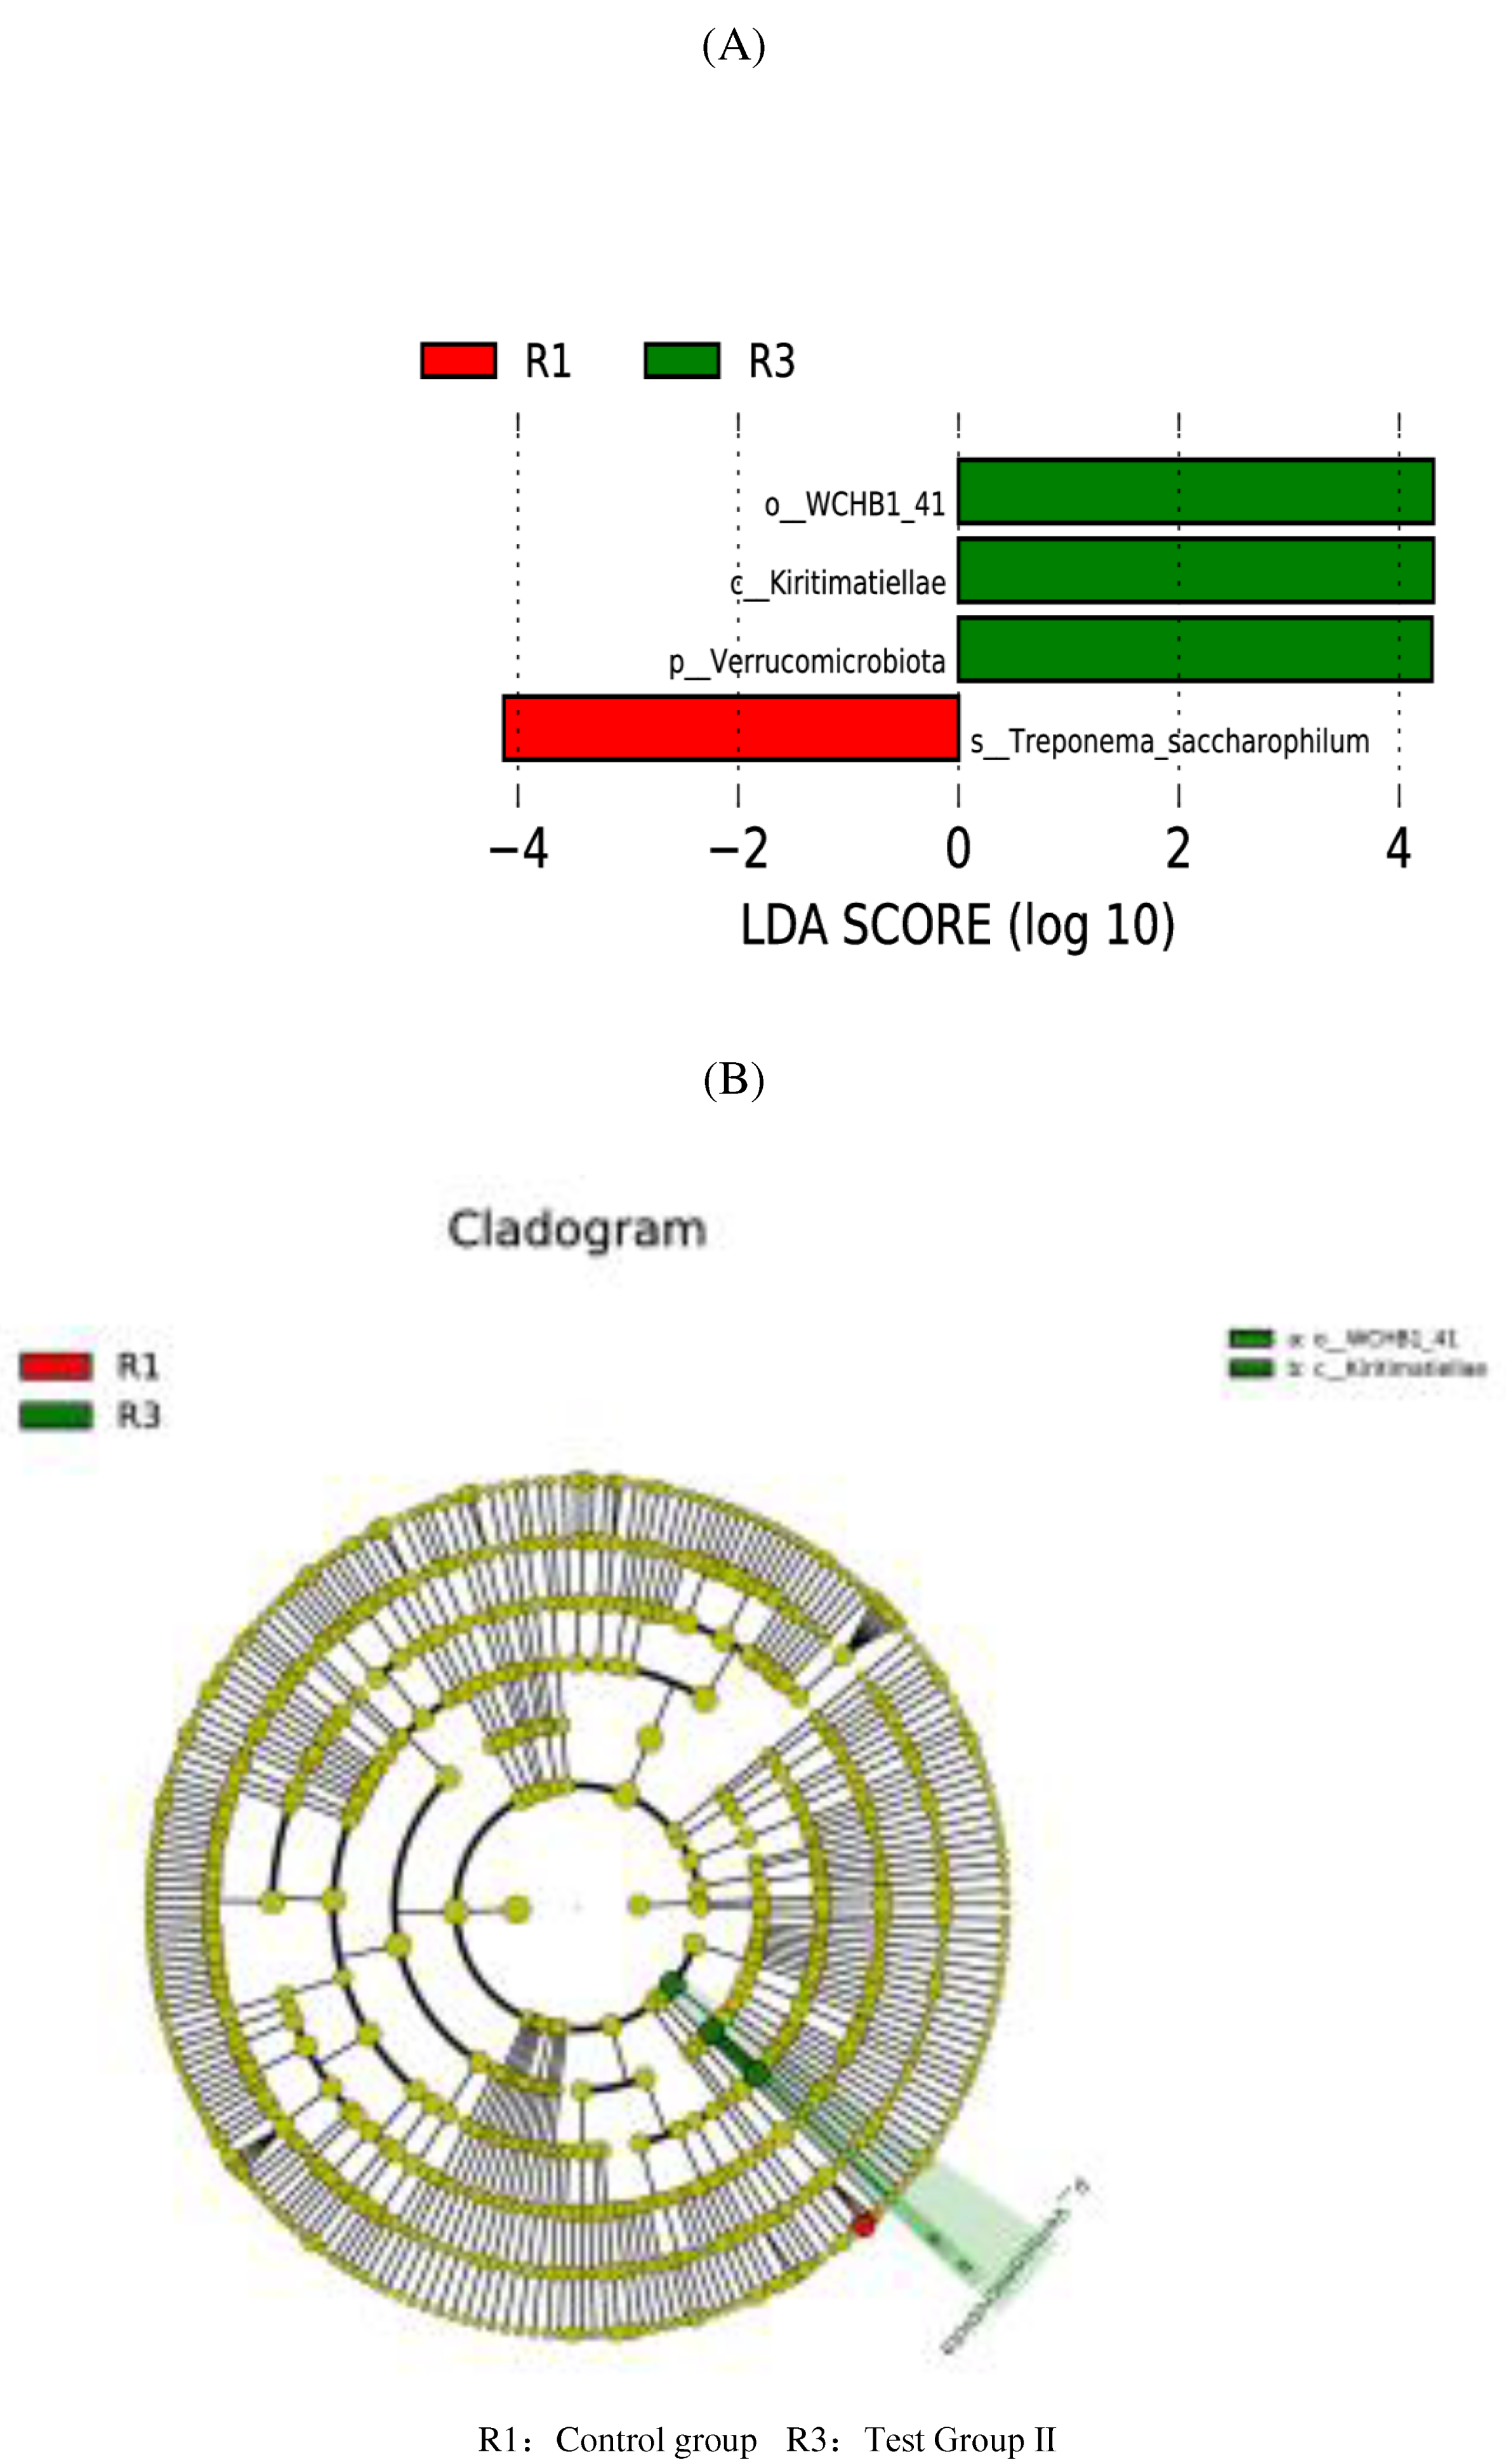
The control group in the taxonomic rank of the Treponema_saccharophilum detected significant differences, and the experimental group II, in the taxonomic rank of WCHB1_41, Kiritimatiellae, and Verrucomicrobia detected significant differences (Figure 9 A-B).

3.11. PICRUSt Functional prediction

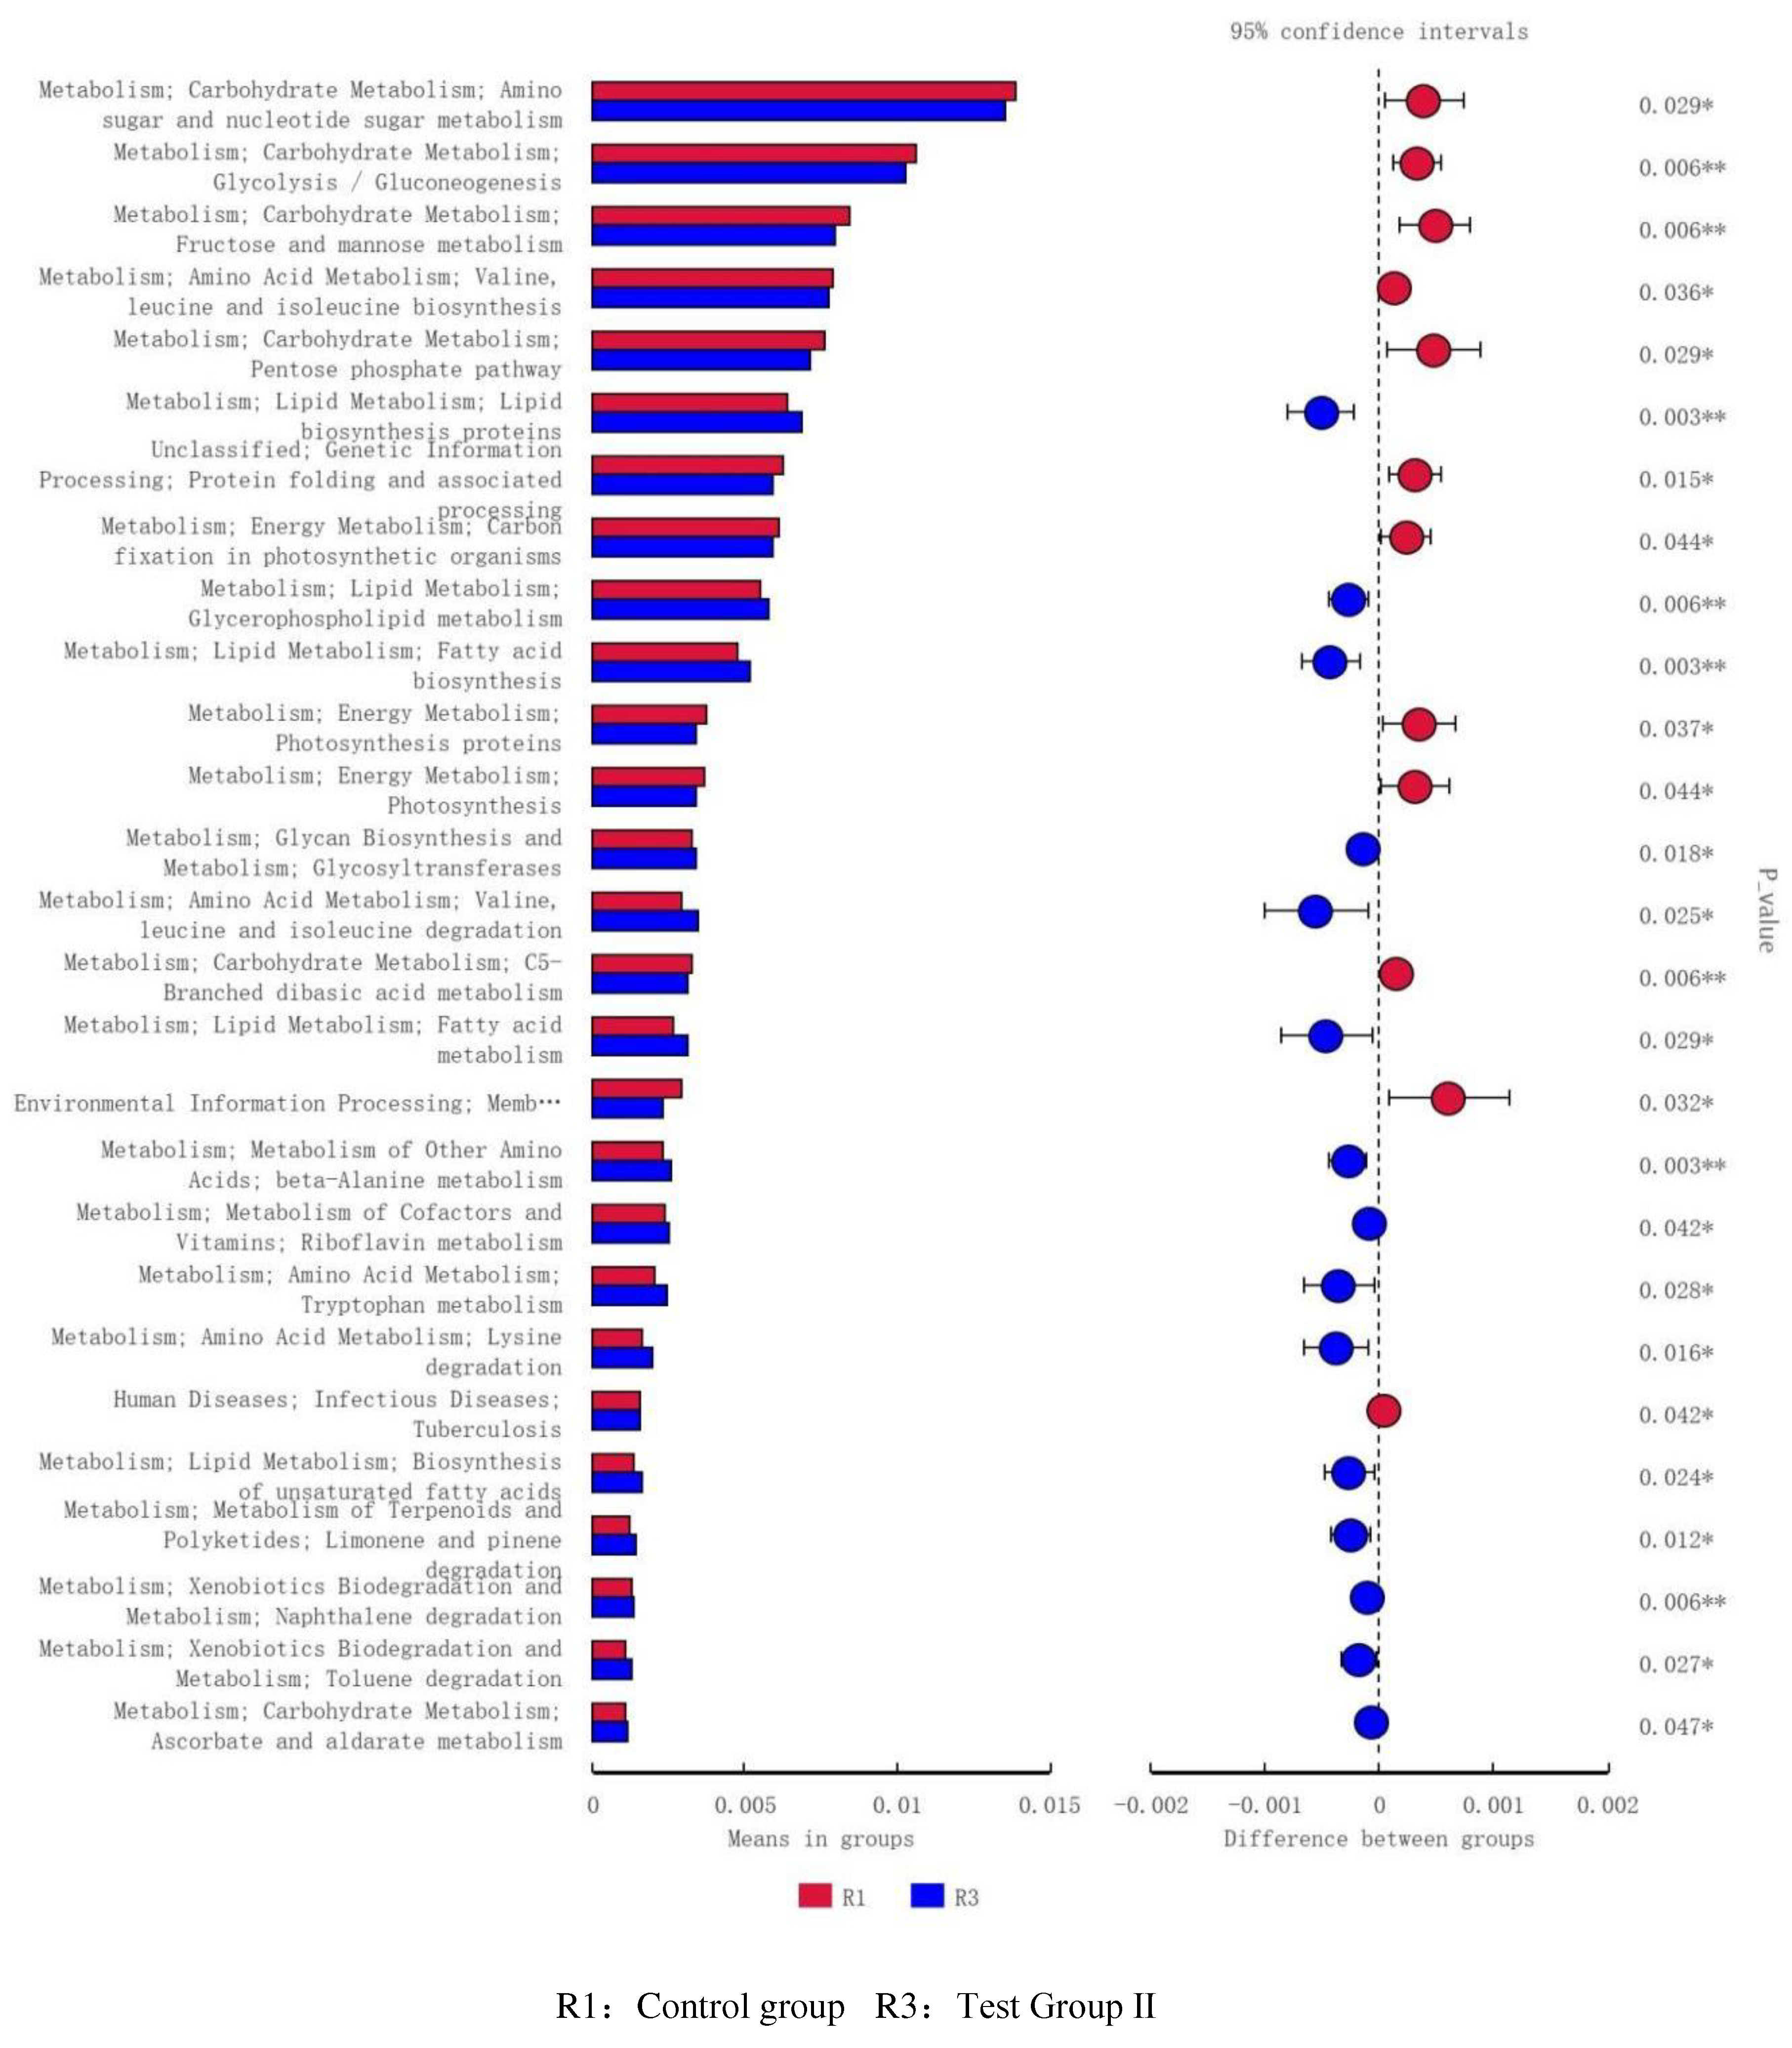
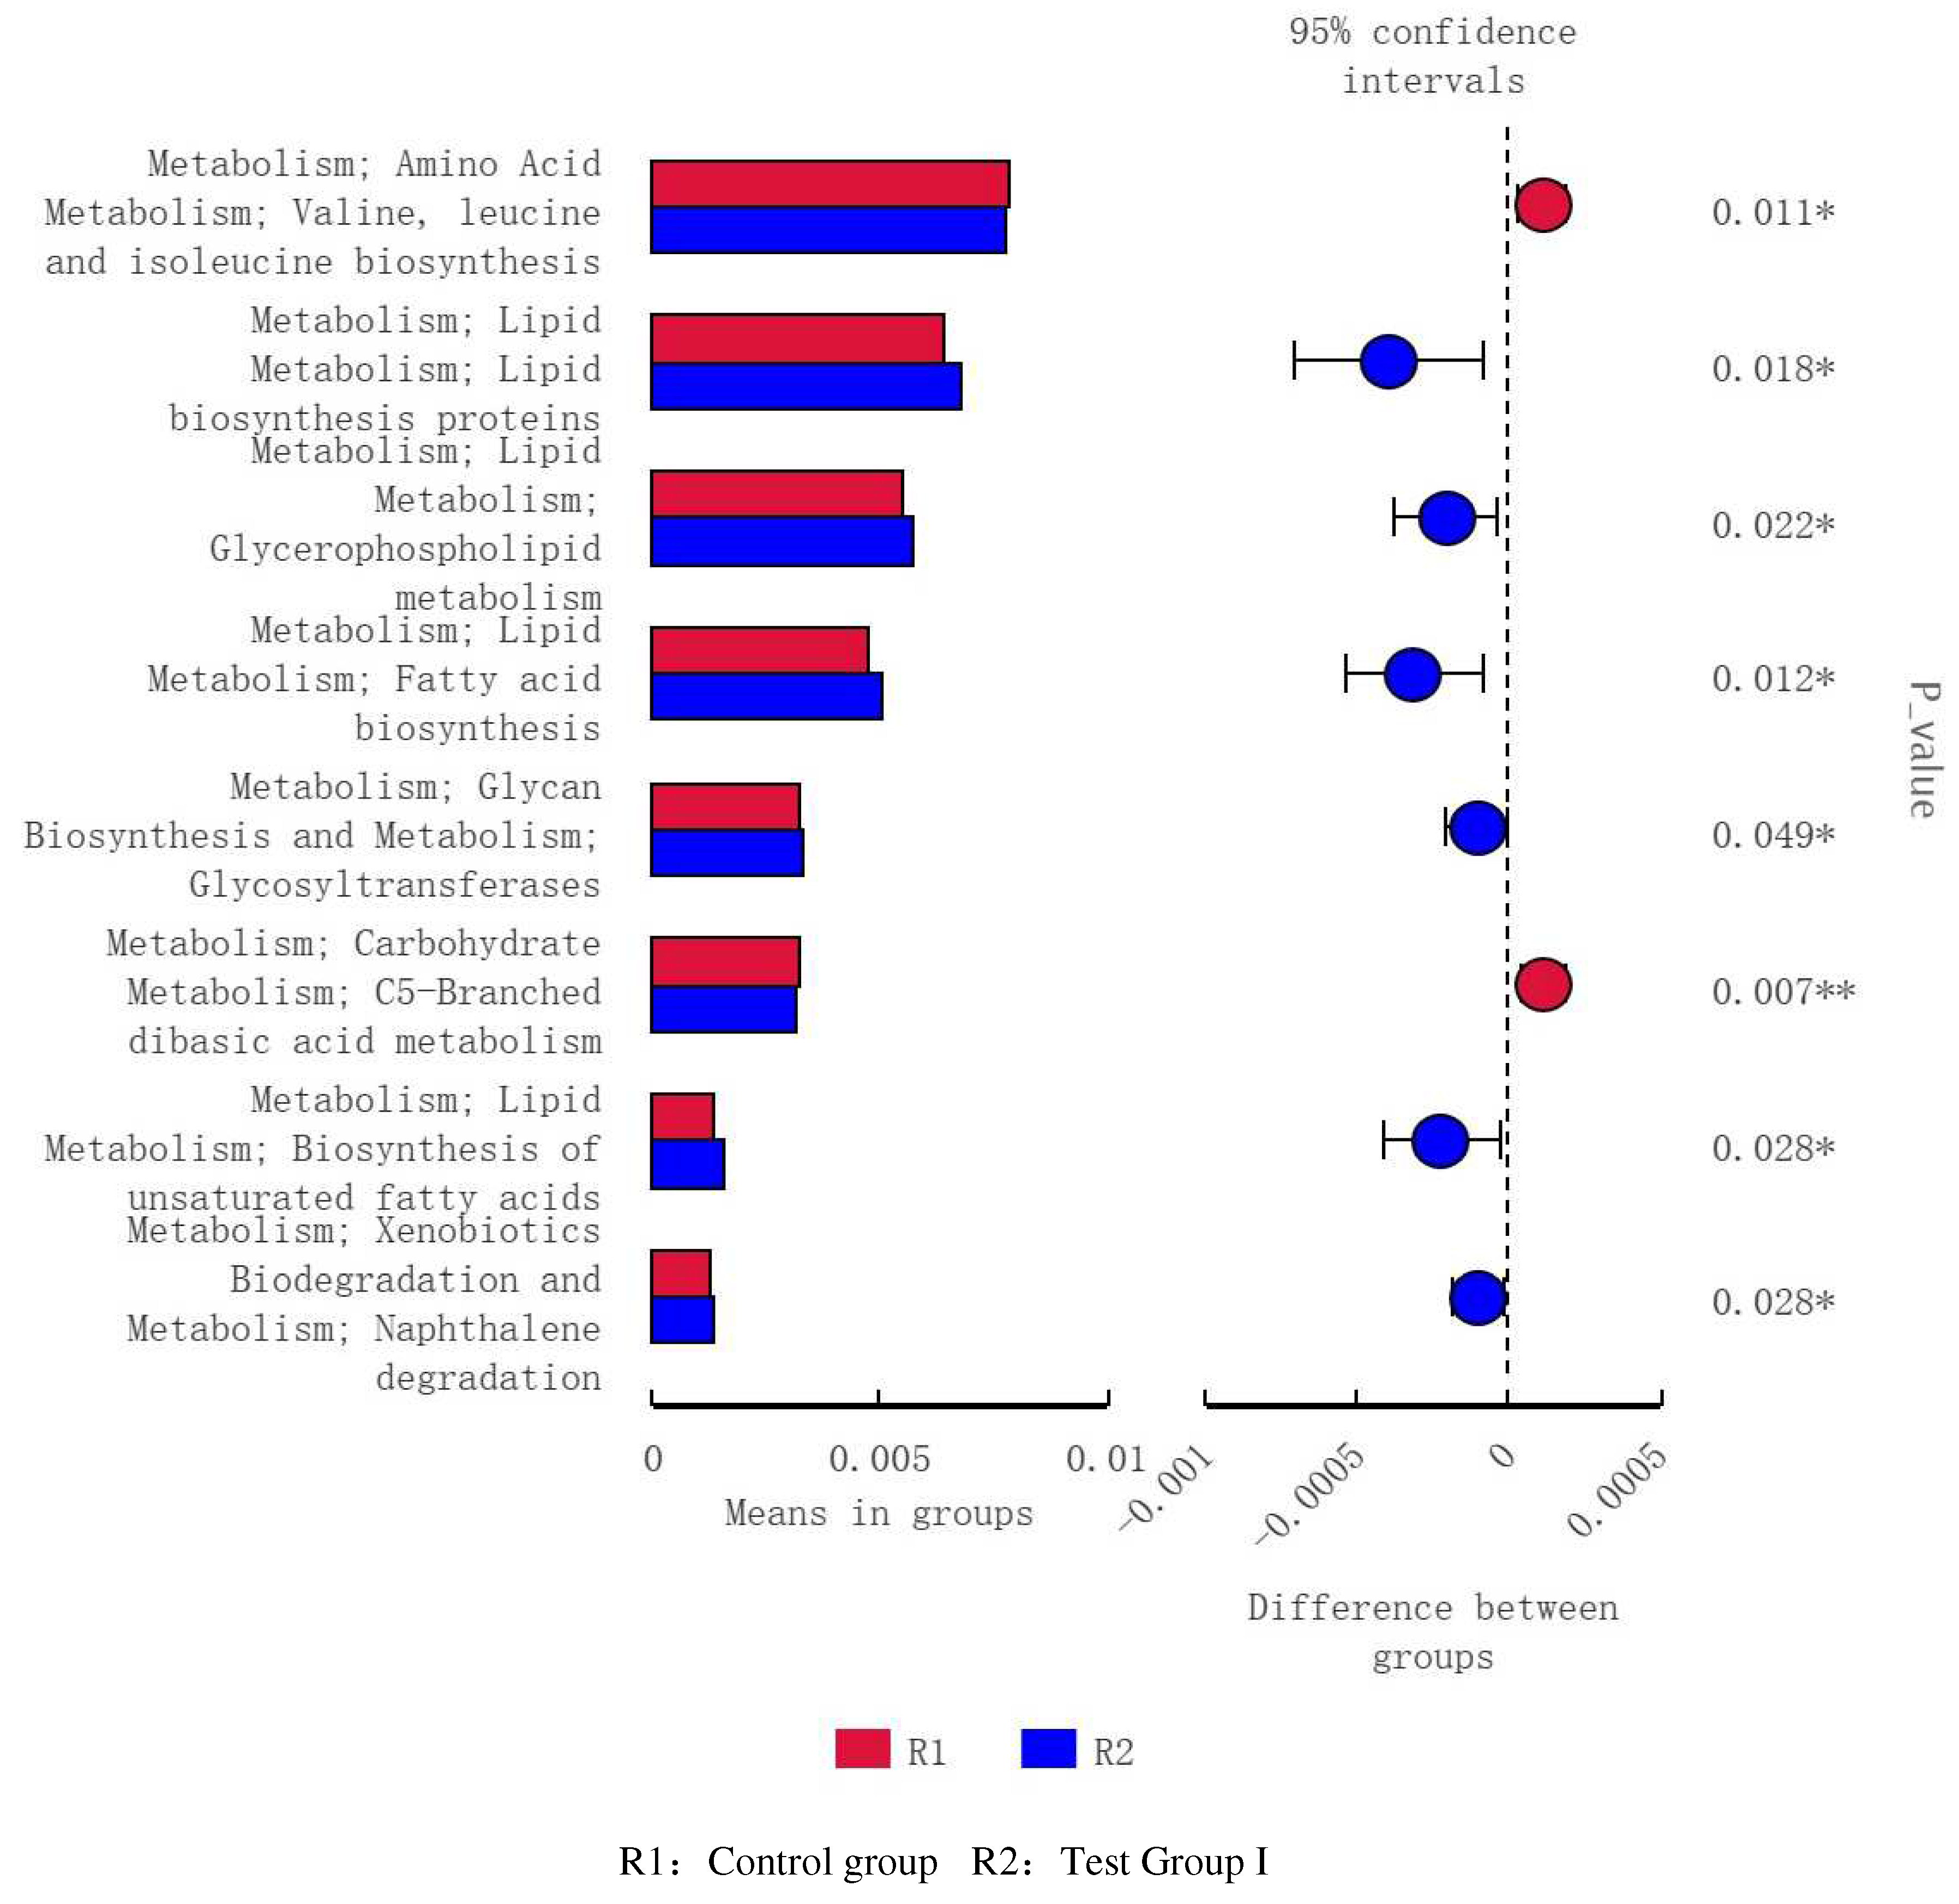
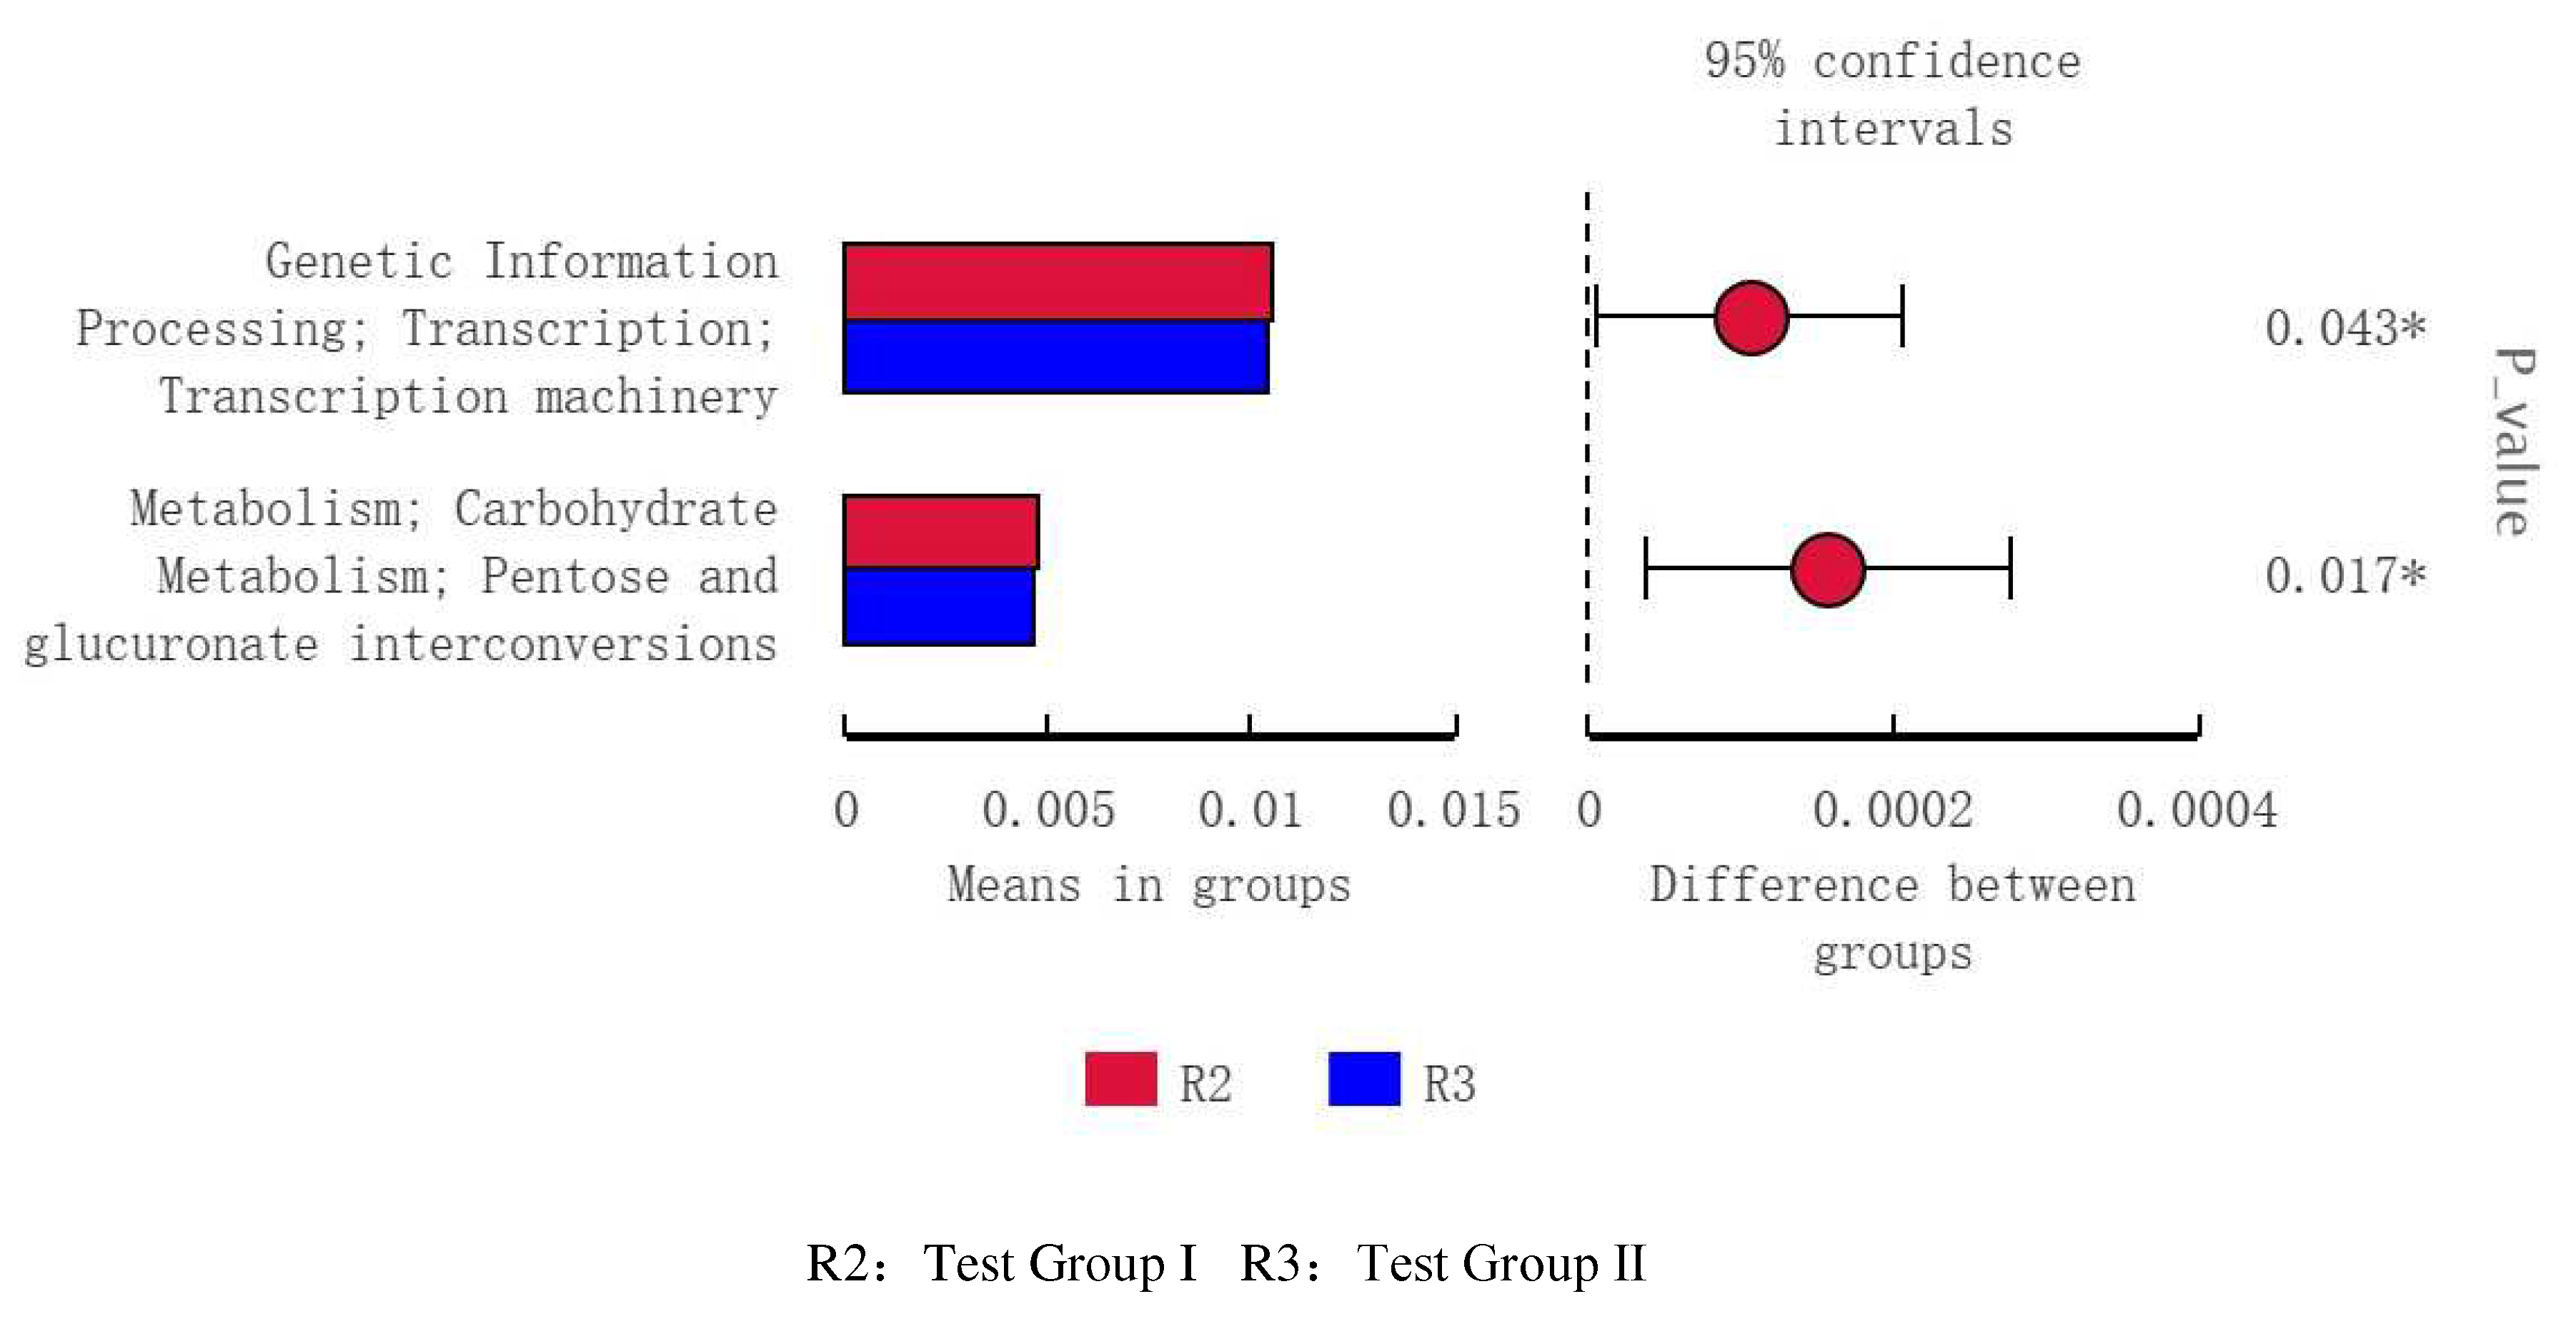
Compared with the control group, The fecal flora of grazing Yili horses was mainly related to lipid synthesis and metabolism, energy metabolism, and amino acid metabolism (Figure 10), The fecal flora of group I was mainly related to lipid synthesis and metabolism (Figure 11), Compared with the test group II, Test group I was mainly related to genetic information processing and carbohydrate metabolism (Figure 12).

4. Discussion

The lactation process of lactating female animals is accompanied by a large amount of energy consumption. Energy demand is 1.9times higher than usual[12]. When energy is insufficient, fat mobilization will occur, resulting in weight loss and lower lactation. Even worse low pregnancy rates and early embryo death occur in lactating mares under grazing[13]. Conditions, energy intake is far from sufficient to meet their own consumption resulting in a sustained low lactation yield[14,15]. Feeding fat sows in late pregnancy and early lactation have also been shown to increase milk production milk fat production and feed efficiency[16]. In this experiment the average daily milk yield and total dail milk viewer of the experiment Ⅱ mares were significantly higher than those of the experimental group I and the control group indicating that supplementation of fatty acid could effectively improve the lactation amount of grazing mares. In the last three weeks of the experiment. The milk production of mares in the group Ⅰ was significantly different from that of the control group of the reasons may be due to lack of rainfall, sparse grass quantity, grass quality is poor, and the late lactation of the mares. The effect of dietary nutrition regulation on milk composition in equines is more direct than in ruminants[17]. Davision et al(1991)showed that lipid substances can significantly increase the milk composition among the groups[18]. In this experiment, no significant changes between groups of the milk composition. Milk fat, lactose, and milk protein is significantly increased in group Ⅱ of the September trial. The reason maybe that priority participation of fatty acids in hydrolysis to promote lactation process. A large number of studies show, urea nitrogen content in milk and intake from the feeding amount of crude protein level and protein utilization ratio have higher correlation[19]. In this experiment, urea nitrogen in group1 was significantly decreased explaining that supplementing with concentrated feed can promote protein utilization in lactating mares. Milk fat is rich in fatty acids, having important physiologically activity functions. Research findings, lauric acid and myristic acid have the highest conversion efficiency to corresponding fatty acids in milk[20], and the former exhibits strong antibacterial effects, the later is promote metabolism in the body[21]. In this experiment, the contents of lauric acid and myristic acid in experimental group Ⅱ were significantly improved, to a certain extent, it can improve the immune system and digestive metabolism of mares, thus can improve horse milk production. Besides, lipid substances in the diet greatly affect the composition of the milk fat. Glasser et al (2008) discovered through an infusion of vegetable oil, unsaturated fat in milk increased significantly, saturated fatty acids is significantly decreased[22]. Experiment findings the proportion of fatty acids in horse milk is similar to that in human milk,this is mainly because the content of polyunsaturated fatty acids with high carbon atoms is higher, this also partly explains the nutritional value advantage of horse milk[23]. In this experiment, significant increase in total saturated fatty acid content in group Ⅱ, the content of the total unsaturated fat acid and total unsaturated fat acid decreased significantly, the reason may be related to different types of fat supplementation.
Plasma glucose as an important substance,can reflect the level of energy intake and fat accumulation. Zeyner et al (2010) found that, the blood sugar concentration of horses increases with the increase of dietary fat content[24]. There is also evidence of discovery, plasma glucose as an energy substance and preconditioning substances for biosynthesis of cellular components, plays an important role in physiological activities such as location[25]. In addition, fatty acids can improve glucose tolerance and reduce insulin sensitivity[26]. In this experiment, after feeding there was a significant increase in blood glucose concentration in experiment Ⅱ at 1-2-4-9hours, indicating that supplement with fatty acids can significantly improve the energy level of mares. When the body’s blood sugar rises, it will promote the free fatty acids in the plasma to be used by the liver to synthesize triglycerides and covert to adipose tissue. Lipoprotein as a carrier of fat metabolism, and mainly involved in the packaging and transport of lipids, reflecting the degree of the metabolism of lipids[27]. In this experiment, the concentrations of free fatty acids and triglycerides in plasma increased at 3 and 6h after supplementation, and the levels of low density lipoprotein and very low density lipoprotein increased at 3 and 9 h after supplementation. The results showed that, on the one hand, fatty acid supplementation could improve the blood glucose concentration of the liver, and on the other hand grazing could improve the ability of the liver to transport triglyceride and cholesterol. Promote fat metabolism and improve lactation performance of grazing Yili horse.
Animal bodies provide a suitable environment and necessary for gut microbiota[28], at the same time gut microbiota can regulate animal health and growth[29]. The experiment showed that, dietary nutrition is the main factor affecting the structure and diversity of gut microbiota in animals[30]. In this experiment,experiment Ⅱ the shannon, chao1, and ACE index of experiment Ⅱ were all improved, but they was no significant difference, to some extent, supplemented with refined feed, fatty acids it has improved the diversity and abundance of gut microbiota in grazing Yili horses. Besides, control group, experiment Ⅰ and Ⅱ were detected separately 4894, 5487, and 5187 outs, this shown that the experimental group contains more bacterial species, to some extent, supplemented with refined feed, fatty acids improved the diversity of Yili horses. The structure and number of intestinal microbiology population affect the growth and development of the animals themselves particularly during lactation of mare[28]. Bacteroides and pachymycetes have been found to promote the digestion and absorption of cellulose and carbohydrates[31,32]. In this experiment, there was no significant change in the abundance of Bacteroides and Plachymycetes at phyta level which may be related to the different kinds of fatty acids fed supplementary. In addition, some studies showed that Verrucomicrobia can not only provide energy for the body, its metabolites can also participate in the body’s immune regulation[33], has the function of inducing and regulating intestinal immune performance. Also has other studies shown that spirochete have a high pathogenic ability[34]. In this experiment, the relative abundance of Microphyllum verruciformis in the experimental group increased significantly, while the relative abundance of Spirillum decreased, these results suggest that supplementary feeding of concentrate and fatty acid may play an important role in reducing the inflammation and improving the Immunity of horses. Su et al (2020) found that, under natural grazing conditions, the dominant microbiota at the Mongolian horse family level is microbiota, Trichospiridae and prevotellidae so on, similar to the results of this experiment[35]. Prevotellidae as a beneficial bacterium, it can effectively degrade hemicellulose and protein[36]. There are studies shown that, both prevol_ucg_003and prevol-ucg-001 are related to cellulose digestibility[37,38], It was suggested that dietary supplements of concentrate and fatty acids might affect the digestibility and utilization ot cellulose in grazing Ⅱ horses, which might be related to the bacteriostasis of fatty acids.
Through Lefse analysis found that, the relative abundance of Treponema saccharophila in the control group was higher. Plays an important role in the digestion and decomposition of cellulose in the organism. Tredonema saccharophila, Treponema brucei, and Treponema purpura can participate in the decomposition of pectin widely, through trans-elimination of the final formation of acetate to participate in the regulation of the body. The dominant strains in the test II group were WCHB1-c1, Kiritimatielae, and Microbuctereium verruciformis. The influence of intestinal microbes on body health is expressed by the affinity of intestinal mucus layer. Which often uses as a marker of intestinal health. When the relative abundance of intestinal microbes decreases. This results in thinning of the mucus layer of the intestinal. As manifested by diarrhea[39]. Kiritimatielae intestinal microbes on body health is expressed by the affinity of intestinal mucus layer[40]. Which is often used as a marker of intestinal health, When the relative abundance of Kiritimatiellae is increased, it promotes the production of intestinal mucus and thus the return of intestinal function to normal[41]. In addition it has also been found in the intestinal microorganisms of horses suffering from diarrhea, in the genus Kiritimatiellaeota the relative abundance of WCHB1-41 decreased[42] significantly the relationship between WCHB1-41 and intestinal, inflammation remains to be determined[43]. The results showed that fat supplementation could reduce diarrhea in horses to some extent.In addition, Microflora, verruciformis, one of the most abundant microorganisms in the equine intestinal tract, often performs immunomodulator and energy supply functions in the body[44], This is basically in line with results predicted by the PICRUSTs function. Microbial communities and their functions are related to feeding types[45]. As a result of the function prediction, in the test Ⅱ group the fecal flora of horses was mainly related to the function of lipid anabolism, energy metabolism, and amino acid metabolism. The test group Ⅰ was mainly related to the synthesis and metabolism of lipid substances the control group was mainly related to carbohydrate metabolism. As for the specific relationship needs further study.

5. Conclusions

Supplementation could significantly increase the yield of milk fat, lactose, milk protein, and the composition and concentration of fatty acids of grazing mares. It can significantly increase the concentration of glucose, triglyceride, low density lipoproteinvery, low density lipoprotein, and free fatty acid in the plasma of grazing mares, it can improve the diversity and richness of intestinal flora of grazing mares to some extent.

Author Contributions

Guodong Zhao and Kailun Yang contributed to study design, data collection, data interpretation and manuscript preparation. Hao Lu and Wenjie Zhang contributed to data collection and manuscript preparation. Shuo Sun and Yingying Mei assisted with data collection. Hao Lu, Wenjie Zhang and Guodong Zhao performed data analysis. All authors approved the final version of the manuscript. Kailun Yang had full access to all the study data and takes responsibility for the integrity of the data and the accuracy of the data analysis.
Funding Information: We acknowledge the support of the Autonomous region "Key research and development projects of the 14th Five-Year plan: Study on characteristic quality analysis and characteristic standard of characteristic livestock milk and poultry egg" project. (Project No.: 2022YFD1600103).
Date Availability: The data that support the findings of this study are available from the corresponding author upon reasonable request.

Conflict of Interest

None of authors have any conflict of interest to declare.

Acknowledgments

We acknowledge the support of the Zhaosu Yili Kazak Autonomous prefecture Kalasu YIli horse breeding center.

Ethics Approval and Consent to Participate

All procedures in this study were approved by the Animal Experiment Ethics Committee of Xinjiang Agricultural University (permit number:2018012).

References

  1. Korosue K, Murase H, Sato F, et al. Successful induction of lactation in a barren Thoroughbred mare: growth of a foal raised on induced lactation and the corresponding maternal hormone profiles[J]. Journal of Veterinary Medical Science 2012, 74, 995–1002. [Google Scholar] [CrossRef] [PubMed]
  2. Li N, Xie Q, Chen Q, et al. Cow, Goat, and Mare Milk Diets Differentially Modulated the Immune System and Gut Microbiota of Mice Colonized by Healthy Infant Feces[J]. Journal of Agricultural and Food Chemistry 2020, 68, 15345–15357. [CrossRef] [PubMed]
  3. Yu X, Fang C, Liu L, et al. Transcriptome study underling difference of milk yield during peak lactation of Kazakh horse[J]. Journal of Equine Veterinary Science 2021, 102, 103424. [Google Scholar] [CrossRef] [PubMed]
  4. Coenen M, Kienzle E, Vervuert I, et al. Recent German Developments in the Formulation of Energy and Nutrient Requirements in Horses and the Resulting Feeding Recommendations[J]. Journal of Equine Veterinary Science 2011, 31, 219–229. [Google Scholar] [CrossRef]
  5. Mangwiro Y T, Cuffe J S, Vickers M H, et al. Maternal exercise alters rat fetoplacental stress response: Minimal effects of maternal growth restriction and high-fat feeding[J]. Placenta 2021, 104, 57–70. [Google Scholar] [CrossRef]
  6. Spers R C, Spers A, Fernandes W R, et al. Effect of dietary supplementation with coco-nut babaçu oil on performance of lactating mares[J]. Brazilian Journal of Veterinary Research & Animal Science 2006, 43, 120–128. [Google Scholar]
  7. Doreau M, Boulot S, Bauchart D, et al. Voluntary intake, milk production and plasma metabolites in nursing mares fed two different diets.[J]. Journal of Nutrition 1992, 122, 992–999. [Google Scholar] [CrossRef]
  8. Bernard L, Rouel J, Leroux C, et al. Mammary lipid metabolism and milk fatty acid secretion in Alpine goats fed vegetable lipids[J]. Journal of Dairy Science 2005, 88, 1478–1489. [Google Scholar] [CrossRef]
  9. Davison K E, Potter G D, Greene L W, et al. Lactation and reproductive performance of mares fed added dietary fat during late gestation and early lactation[J]. Journal of Equine Veterinary Science 1991, 11, 111–115. [Google Scholar] [CrossRef]
  10. Ericsson Aaron C, Johnson Philip J, Lopes Marco A, et al. A Microbiological Map of the Healthy Equine Gastrointestinal Tract[J]. PloS one 2016, 11, e0166523. [Google Scholar]
  11. Vermorel M, Martin-rosset W, Vernet J. Energy utilization of twelve forages or mixed diets for maintenance by sport horses[J]. Livestock Production Science 1997, 47, 157–167. [Google Scholar] [CrossRef]
  12. Frederic D, Jean-francois L, M R W, C N F. Allometric scaling of the elevation of maternal energy intake during lactation[J]. Frontiers in zoology 2016, 13, 32. [Google Scholar] [CrossRef] [PubMed]
  13. Stein H H, Nutrient requirementsof swine[J]. Feedstuffs 2018, 90 (Suppl. 1), 15–21.
  14. Miraglia N, Burger D, Kapron M, Flanagan J, Langlois B, Martin-Rosset W. eLocal animal ressources and products in sustainable development: role and potential of equids[C]. International Symposium on Livestock Farming Systems 2006, S8, 532. [Google Scholar]
  15. Hristov A N, Degaetano A T, Rotz C A, Hollinger DY. Climate change effects on livestock in the Northeast US and strategies for adaptation[J]. Springer Netherlands 2018, 146, 33–45. [Google Scholar]
  16. Laws J, Juniper D T, Lean I J, Amusquivar E, Herrera E, Dodds P F, Clarke L. Supplementing sow diets with palm oil during late gestation and lactation: effects on milk production, sow hormonal profiles and growth and development of her offspring[J]. Animal 2018, 12, 2578–2586. [Google Scholar] [CrossRef]
  17. Doreau M, Martin-Rosset W. Animals that Produce Dairy Foods | Horse[J]. Encyclopedia of Dairy Sciences (Second Edition) 2011, 40, 358–364. [Google Scholar]
  18. Davison K E, Potter G D, Greene L W, Evans J W, Mcmullan W C. Lactation and reproductive performance of mares fed added dietary fat during late gestation and early lactation[J]. Journal of Equine Veterinary Science 1991, 11, 111–115. [Google Scholar] [CrossRef]
  19. Harper M T, Oh J, Melgar A, Nedelkov K, Risnen S. Production effects of feeding extruded soybean meal to early-lactation dairy cows-ScienceDirect[J]. Journal of Dairy Science 2019, 102, 8999–9016. [Google Scholar] [CrossRef]
  20. Kadegowda A K G, Piperova L S, Delmonte P, Erdman R A. Abomasal Infusion of Butterfat Increases Milk Fat in Lactating Dairy Cows[J]. Journal of Dairy Science 2008, 91, 2370–2379. [Google Scholar] [CrossRef]
  21. Henry Dabadie, Evelyne Peuchant, Mireille Bernard, Pascale LeRuyet, François Mendy. Moderate intake of myristic acid in sn-2 position has beneficial lipidic effects and enhances DHA of cholesteryl esters in an interventional study[J]. The Journal of Nutritional Biochemistry 2005, 16, 375–382. [Google Scholar] [CrossRef] [PubMed]
  22. Glasser F, Ferlay A, Chilliard Y. Oilseed Lipid Supplements and Fatty Acid Composition of Cow Milk: A Meta-Analysis[J]. Journal of Dairy Science 2008, 91, 4687–4703. [Google Scholar] [CrossRef] [PubMed]
  23. Malacarne Massimo, Francesca Martuzzi, Andrea Summer, Mariani Primo. Protein and fat composition of mare's milk: some nutritional remarks with reference to human and cow's milk[J]. International Dairy Journal 2002, 12, 869–877. [Google Scholar] [CrossRef]
  24. Zeyner A, Bessert J, Gropp J M. Effect of feeding exercised horses on high-starch or high-fat diets for 390 days[J]. Equine Veterinary Journal 2010, 34, 50–57. [Google Scholar] [CrossRef] [PubMed]
  25. Krasnow S M, Steiner R A. Physiological Mechanisms Integrating Metabolism and Reproduction-ScienceDirect[J]. Knobil and Neill's Physiology of Reproduction(Third Edition) 2006, 2, 2553–2625. [Google Scholar]
  26. Han X F, Feng F J, Yu J P, Tang S X, Wang M. Effects of conjugated linoleic acid supplementation on growth, carcass characteristics and fatty acid profiles of muscle and fat in growing-finishing pigs[J]. Journal of Animal & Feed Sciences 2011, 20, 171–185. [Google Scholar]
  27. John Zhong Li, Yao Lei, Yue Wang, Yin xin Zhang, Jing Ye, Xia yu Xia, Xian ming Pan, Peng Li. Control of cholesterol biosynthesis, uptake and storage in hepatocytes by Cideb[J]. BBA-Molecular and Cell Biology of Lipids 2010, 1801, 577–586. [Google Scholar] [CrossRef]
  28. Huttenhower C, Gevers D, Knight R, Abubucker S, Jonathan H Badger. Structure, function and diversity of the healthy human microbiome[J]. Nature 2012, 486, 53–82. [Google Scholar]
  29. Thaiss C A, Zmora N, Levy M, Elinav E. The microbiome and innate immunity[J]. Nature 2016, 535, 65–74. [Google Scholar] [CrossRef]
  30. Ruth E Ley, Micah Hamady, Catherine Lozupone, Peter J Turnbaugh, Rob Roy Ramey, J Stephen Bircher, Michael L Schlegel, Tammy A Tucker, Mark D Schrenzel, Rob Knight, Jeffrey I Gordon. Evolution of Mammals and Their Gut Microbes[J]. Science 2008, 320, 1647–1651. [Google Scholar] [CrossRef]
  31. Evans N J, Brown J M, Murray R D, Getty B, Birtles R J, Hart C A, Carter S D. Characterization of novel bovine gastrointestinal tract Treponema isolates and comparison with bovine digital dermatitis treponemes[J]. Appl Environ Microbiol 2011, 77, 138–147. [Google Scholar] [CrossRef] [PubMed]
  32. Jiang F, Song P, Wang H, Zhang J, Liu D, Cai Z,; Gao H, Chi X, Zhang T. Comparative analysis of gut microbial composition and potential functions in captive forest and alpine musk deer[J]. Applied Microbiology and Biotechnology 2022, 106, 1325–1339. [Google Scholar] [CrossRef]
  33. Maslowski Kendle M, Vieira Angelica T, Ng Aylwin, Kranich Jan, Sierro Frederic, Yu Di, Schilter Heidi C, Rolph Michael S, Mackay Fabienne, Artis David, Xavier Ramnik J, Teixeira Mauro M, Mackay Charles R. Regulation of inflammatory responses by gut microbiota and chemoattractant receptor GPR43[J]. Nature 2009, 461, 1282–1286. [Google Scholar] [CrossRef] [PubMed]
  34. Caro-Quintero A, Ritalahti K M, Cusick K D, Löffler F E, Konstantinidis K T. The chimeric genome of Sphaerochaeta: nonspiral spirochetes that break with the prevalent dogma in spirochete biology[J]. mBio 2012, 3, 12–25. [Google Scholar]
  35. Su Shaofeng, Zhao Yiping, Liu Zongzheng, Liu Guiqin, Du Ming, Wu Jing, Bai Dongyi, Li Bei, Bou Gerelchimeg, Zhang Xinzhuang, Dugarjaviin Manglai. Characterization and comparison of the bacterial microbiota in different gastrointestinal tract compartments of Mongolian horses[J]. Microbiology Open 2020, 9, 1085–1101. [Google Scholar] [CrossRef] [PubMed]
  36. Gong L, Cao W, Chi H, Wang J, Zhang H, Liu J, Sun B. Whole cereal grains and potential health effects:involvement of the gut microbiota[J]. Food Research International 2018, 103, 84–102. [Google Scholar] [CrossRef]
  37. Yohei, Watanabe, Fumiko, Nagai, Masami, Morotomi. Characterization of Phascolarctobacterium succinatutens sp. nov, an Asaccharolytic, Succinate-Utilizing Bacterium Isolated from Human Feces[J]. Applied and Environmental Microbiology 2011, 78, 511–518. [Google Scholar]
  38. Zhao X H, Chen Z D, Zhou S, Song X Z, Ouyang K H, Pan K, Xu L J, Liu C J, Qu M R. Effects of daidzein on performance, serum metabolites, nutrient digestibility, and fecal bacterial community in bull calves[J]. Animal Feed Science and Technology 2017, 225, 87–96. [Google Scholar] [CrossRef]
  39. McGuckin Michael A, Lindén Sara K, Sutton Philip, Florin Timothy H. Mucin dynamics and enteric pathogens[J]. Nature reviews. Microbiology 2011, 9, 265–278. [Google Scholar] [CrossRef]
  40. McKinney Caroline A, Bedenice Daniela, Pacheco Ana P, Oliveira Bruno C M, Paradis MaryRose, Mazan Melissa, Widmer Giovanni. Assessment of clinical and microbiota responses to fecal microbial transplantation in adult horses with diarrhea[J]. PloS one 2021, 16, e0244381. [Google Scholar]
  41. Edwards J E, Shetty S A, van den Berg P, Burden F, van Doorn D A, Pellikaan W F, Dijkstra J, Smidt H. Multi-kingdom characterization of the core equine fecal microbiota based on multiple equine (sub) species[J]. Animal Microbiome 2020, 2, 231–268. [Google Scholar]
  42. McKinney Caroline A, Oliveira Bruno C M, Bedenice Daniela, Paradis Mary-Rose, Mazan Melissa, Sage Sophie, Sanchez Alfredo, Widmer Giovanni. The fecal microbiota of healthy donor horses and geriatric recipients undergoing fecal microbial transplantation for the treatment of diarrhea[J]. PloS one 2020, 15, e0230148. [Google Scholar]
  43. Byndloss Mariana X, Pernitzsch Sandy R, Bäumler Andreas J. Healthy hosts rule within: ecological forces shaping the gut microbiota[J]. Mucosal immunology 2018, 11, 1299–1305. [Google Scholar] [CrossRef]
  44. Lindenberg F, Krych L, Fielden J, Kot W, Frøkiær H, van Galen G, Nielsen D S, Hansen A K. Expression of immune regulatory genes correlate with the abundance of specific Clostridiales and Verrucomicrobia species in the equine ileum and cecum[J]. Scientific reports 2019, 9, 12674. [Google Scholar] [CrossRef] [PubMed]
  45. Quercia S, Freccero F, Castagnetti C, Soverini M, Turroni S, Biagi E, Rampelli S, Lanci A, Mariella J, Chinellato E, Brigidi P, Candela M. Early colonisation and temporal dynamics of the gut microbial ecosystem in Standardbred foals[J]. Equine Veterinary Journal 2019, 51, 231–237. [Google Scholar] [CrossRef] [PubMed]
Figure 1. Effect of supplementing with concentrate and fatty acids on daily average milk production of grazing Yili horses.
Preprints 78409 g001
Figure 2. Effect of supplementing with concentrate and fatty acids on daily total milk production of grazing Yili horses.
Preprints 78409 g002
Figure 3. Effect of supplementing with concentrate and fatty acids on plasma glucose in grazing Ili horses.
Preprints 78409 g003
Figure 4. Effect of supplementing with concentrate and fatty acids on plasma free fatty acids in grazing Ili horses.
Preprints 78409 g004
Figure 5. Effect of supplementing with concentrate and fatty acids on plasma triglycerides in grazing Ili horses.
Preprints 78409 g005
Figure 6. Effect of supplementing with concentrated feed and fatty acids on plasma low-density lipoprotein of grazing Ili horses.
Preprints 78409 g006
Figure 7. Effect of supplementing with concentrate and fatty acids on plasma very low density lipoprotein in grazing Ili horses.
Preprints 78409 g007
Figure 8. Dilution curve of intestinal flora(A), Venn diagram of intestinal flora(B).
Preprints 78409 g008
Figure 9. Histogram of LDA Value distribution(A), Evolutionary branch diagram(B).
Preprints 78409 g009
Figure 10. Analysis of functional differences between PICRUSt-T-test groups Level 3 functional prediction chart (R1vR3).
Preprints 78409 g010
Figure 11. Analysis of functional differences between PICRUSt-T-test groups Level 3 functional prediction chart (R1vR2).
Preprints 78409 g011
Figure 12. Analysis of functional differences between PICRUSt-T-test groups Level 3 functional prediction chart (R2vR3).
Preprints 78409 g012
Table 1. Composition and Nutrition Level of Concentrated Feed Supplement (Dry Matter Basis) %.
Items Content Items Content
Ingredients Nutrient levels2)
Barley 55.54 DM 89.25
Corn 36.00 CP 14.56
Soybean meal 6.00 EE 4.08
CaHPO4 1.30 OM 97.18
Premix1) 1.16 NDF 13.36
Total 100.00 ADF 5.18
Ash 2.82
Ca 0.31
P 0.46
1)The premix provided the following per kg of the concentrate: VA 14 mg,VB1 22 mg,VB2 332.1 mg,VB6 1.5 mg,VD 2.5 mg,VE 700 mg,Biotin 6 mg,Pantothenic acid 4.7 mg,Nicotinamide 12 mg,Cu 42 mg,Fe 113 mg,Mn 186 mg,Zn 176 mg,I 28 mg,Se 42 mg,Co 4 mg; 2)Nutritional levels was measured.
Table 2. Fatty Acid Composition of Concentrated Feed Supplement, Forage and Coated Fatty Acids %.
Items Concentrate Forage Coated fatty acids
Butyric acid
C4:0
0.43 0.82 0.24
Hexanoic acid
C6:0
0.06 0.43 0.49
Octoic acid
C8:0
0.25 1.17 0.37
Decanoic acid
C10:0
0.00 0.00 5.25
Ricinoleic acid
C11:0
0.00 0.00 0.02
Lauric acid
C12:0
0.00 4.06 44.83
Tetradecanoic acid
C14:0
0.12 0.86 18.42
Pentadecanoic acid
C15:0
0.03 0.00 0.02
Palmitic acid
C16:0
13.66 13.61 12.20
Palmitoleic acid
C16:1
0.12 0.33 0.02
Margaric acid
C17:0
0.05 0.32 0.01
Heptadecanoic acid monoenoic acid
C17:1
0.03 0.30 0.00
Stearic acid
C18:0
1.54 1.97 3.97
Elaidic acid
C18:1n9t
0.03 0.00 0.00
Oleic acid
C18:1n9c
25.17 3.02 3.91
Linoleic acid
C18:2n6c
45.40 13.60 2.20
γ- Linolenic acid
C18:3n6
0.45 4.07 0.05
α- Linolenic acid
C18:3n3
2.44 28.67 0.56
Arachidic acid
C20:0
0.39 2.66 0.12
Eicosaenoic acid
C20:1
0.56 0.00 0.04
Cis-11,14-eicosadienoic acid
C20:2
0.06 0.00 0.00
Behenic acid
C22:0
0.20 1.11 0.00
Total saturated fatty acids
∑SFA
16.74 27 85.94
Total unsaturated fat acids
∑UFA
74.27 49.99 6.78
Total monounsaturated fatty acids
∑MUFA
25.92 3.65 3.97
Total unsaturated fat acids
∑PUFA
48.34 46.34 2.80
Total saturated fatty acid/total unsaturated fat acid
∑SFA/∑UFA
0.23 0.54 12.68
The content of fatty acid was the measured value.
Table 3. Effects of concentrate supplement and fatty acid supplementation on milk composition of grazing Yili horses (n=6).
Items Control group Test Group I Test Group Ⅱ SEM P-value
Grous Time G*T
Butter-fat content (%) 1.47 1.45 1.49 0.07 0.944 0.104 0.897
Milk fat production (g/d) 3.59B 3.85B 4.77A 0.19 <0.001 0.088 0.793
Milk protein percentage (%) 1.63 1.61 1.58 0.04 0.643 0.918 0.982
Milk protein yield (g/d) 3.97B 4.27B 5.06A 0.11 <0.001 0.905 0.981
Lactose percentage (%) 6.68 6.76 6.76 0.04 0.307 0.563 0.555
Lactose production (g/d) 16.29C 17.90B 21.70A 0.11 <0.001 0.625 0.608
Total solids (%) 9.86 9.90 9.88 0.10 0.963 0.67 0.469
Somatic number (Thousand/mL) 21.25 13.33 18.25 4.67 0.489 0.331 0.418
Solid no fat (%) 8.54 8.58 8.57 0.06 0.858 0.654 0.681
Urea nitrogen (mg/dL) 26.64aA 24.24bB 24.58bAB 0.61 0.02 <0.001 0.967
In the same row, values with no letter or the same letter superscripts mean no significant difference (P>0.05), while with different small letter superscripts mean significant difference (P<0.05), and with different capital letter superscripts mean significant difference (P<0.01). The same as below.
Table 4. Effect of concentrate supplement and fatty acid on fatty acid composition of Yili horses milk %.
Items Control group Test Group I Test Group Ⅱ SEM P-value
Butyric acid
C4:0
0.34 0.42 0.37 0.02 0.390
Hexanoic acid
C6:0
0.22 0.20 0.21 0.01 0.895
Octoic acid
C8:0
1.22 1.20 1.29 0.05 0.742
Decanoic acid
C10:0
2.83 2.94 3.26 0.13 0.380
Ricinoleic acid
C11:0
0.35 0.37 0.38 0.02 0.805
Lauric acid
C12:0
3.93b 4.32b 8.78a 0.55 <0.001
Tetradecanoic acid
C14:0
5.13b 5.64b 7.50a 0.27 <0.001
Myristoleic acid
C14:1
0.77 0.77 0.91 0.03 0.091
Pentadecanoic acid
C15:0
0.32a 0.29ab 0.23b 0.01 0.013
Palmitic acid
C16:0
19.14 20.53 19.16 0.32 0.124
Palmitoleic acid
C16:1
7.98 7.77 6.93 0.23 0.139
Margaric acid
C17:0
0.18 0.17 0.16 0.01 0.738
Heptadecanoic acid monoenoic acid
C17:1
0.61a 0.59a 0.46b 0.02 0.005
Stearic acid
C18:0
0.67 0.73 0.78 0.03 0.265
Elaidic acid
C18:1n9t
0.19 0.21 0.17 0.01 0.268
Oleic acid
C18:1n9c
12.66 12.63 13.31 0.20 0.304
Linoleic acid
C18:2n6c
7.90a 7.73ab 7.24b 0.12 0.056
γ- Linolenic acid
C18:3n6
8.31a 7.90a 6.32b 0.26 <0.001
α- Linolenic acid
C18:3n3
20.55a 18.74a 15.32b 0.62 <0.001
Cis-11,14-eicosadienoic acid
C20:2
0.15b 0.13b 0.18a 0.01 0.002
Cis-8,11,14-eicosotrienic acid
C20:3n6
0.16 0.15 0.17 0.01 0.704
Cis-11,14,17-eicosotrienic acid
C20:3n3
0.41 0.40 0.39 0.01 0.928
Total saturated fatty acids
∑SFA
34.35b 36.81b 42.12a 0.94 <0.001
Total unsaturated fat acids
∑UFA
59.70a 57.03a 51.38b 1.04 <0.001
Total monounsaturated fatty acids
∑MUFA
22.22 21.97 21.77 0.28 0.824
Total unsaturated fat acids
∑PUFA
37.48a 35.06a 29.61b 0.93 <0.001
Total saturated fatty acid/total unsaturated fat acid
∑SFA/∑UFA
0.58b 0.65b 0.82a 0.03 <0.001
Table 5. Analysis of Alpha Diversity of Fecal Bacteria from Grazing Yili Horses by Supplementing Concentrate and Fatty Acids.
Items Control group Test Group I Test Group Ⅱ SEM P-value
Observed species 2163.67 2884.33 2814.00 76.73 0.348
Shannon index 9.30 9.59 9.53 0.06 0.108
Simpson index 0.99 1.00 1.00 0.0006 0.426
Chao1 index 2811.71 3084.11 3026.10 81.91 0.382
ACE index 2829.28 3107.67 3045.80 83.87 0.386
Goods coverage(%) 0.99 0.99 0.99 0.0003 0.883
Table 6. Effect of concentrate supplement and fatty acid supplementation on the horizontal flora abundance of fecal stool of grazing Yili horses (%).
Items Control group Test Group I Test Group Ⅱ SEM P-value
Bacteroidetes 44.20 42.75 43.51 1.30 0.911
Firmicutes 32.59 33.60 31.52 1.02 0.736
Spirochaetes 6.41 3.39 2.98 0.87 0.221
Verrucomicrobia 3.92c 6.81b 7.92a 0.63 0.017
Unidentified_Bacterri 2.27 2.61 3.01 0.21 0.372
Proteobacteria 1.20 1.66 2.17 0.25 0.309
Euryarchaeota 0.66 0.43 0.52 0.14 0.817
Halobacterota 0.72 0.43 0.52 0.14 0.248
Fibrobacterota 1.25 0.87 1.00 0.09 0.186
Acidobacteriota 0.18 0.32 0.23 0.08 0.804
Others 6.60 7.14 7.05 0.35 0.817
Table 7. Effect of concentrate supplement and fatty acid supplementation on fecal level flora abundance of grazing Yili horses (%).
Items Control group Test Group I Test Group Ⅱ SEM P-value
Rikenellaceae 11.95 12.84 13.77 0.98 0.773
Lachnospiraceae 11.18 10.39 9.96 0.61 0.733
Spirochaetaceae 6.26 3.25 2.82 0.86 0.213
Prevotellaceae 8.39 6.42 5.88 0.54 0.138
p-251-o5 8.72 6.34 6.44 0.67 0.279
F082 6.04 7.80 7.62 0.39 0.123
Bacteroidales_RF16_group 2.37 2.30 2.95 0.29 0.632
Oscillospiraceae 3.55 4.36 4.25 0.17 0.107
Clostridiaceae 0.96 0.48 0.52 0.22 0.644
Ruminococcaceae 2.42 2.43 2.46 0.13 0.992
Others 38.16 43.38 43.32 1.16 0.104
Table 8. Effect of concentrate supplement and fatty acid supplementation on fecal genus level flora abundance of grazing Yili horses (%).
Items Control group Test Group I Test Group Ⅱ SEM P-value
Treponema 6.09 3.13 2.74 0.85 0.219
Rikenellaceae_RC9_gut_group 9.33 9.60 10.33 0.69 0.849
Clostridium_sensu_stricto_1 0.90 0.34 0.34 0.22 0.518
Prevotellaceae_UCG-001 1.78 1.11 1.02 0.18 0.171
UCG-004 0.89 0.63 0.65 0.15 0.750
Prevotellaceae_UCG-004 1.24 1.61 1.49 0.11 0.405
Ruminococcus 2.00 1.87 1.80 0.12 0.810
Prevotellaceae_UCG-003 1.85 1.21 1.21 0.13 0.065
Lachnospiraceae_UCG-009 1.21 0.89 0.71 0.12 0.230
Faecalibaculum 0.53 0.44 0.43 0.17 0.227
Others 73.98b 79.17a 79.72a 1.00 0.024
Disclaimer/Publisher’s Note: The statements, opinions and data contained in all publications are solely those of the individual author(s) and contributor(s) and not of MDPI and/or the editor(s). MDPI and/or the editor(s) disclaim responsibility for any injury to people or property resulting from any ideas, methods, instructions or products referred to in the content.
Copyright: This open access article is published under a Creative Commons CC BY 4.0 license, which permit the free download, distribution, and reuse, provided that the author and preprint are cited in any reuse.
Prerpints.org logo

Preprints.org is a free preprint server supported by MDPI in Basel, Switzerland.

Subscribe

© 2024 MDPI (Basel, Switzerland) unless otherwise stated