Submitted:
03 July 2023
Posted:
05 July 2023
You are already at the latest version
Abstract
Keywords:
1. INTRODUCTION
2. MATERIALS AND METHODS
2.1. Neocortical Cytoarchitecture and Connectomics in Normal Piglets
2.2. Neonatal Piglet Model of Encephalopathy
2.3. Global HI Injury and Mild HT
2.4. Piglet Survival and Perfusion-Fixation
2.5. H&E Neuropathology and Cell Counting
Rbfox3 Immunohistochemistry (IHC)
2.6. EEG and Video Analysis
2.7. Sample Size and Statistical Analysis of Data
3. RESULTS
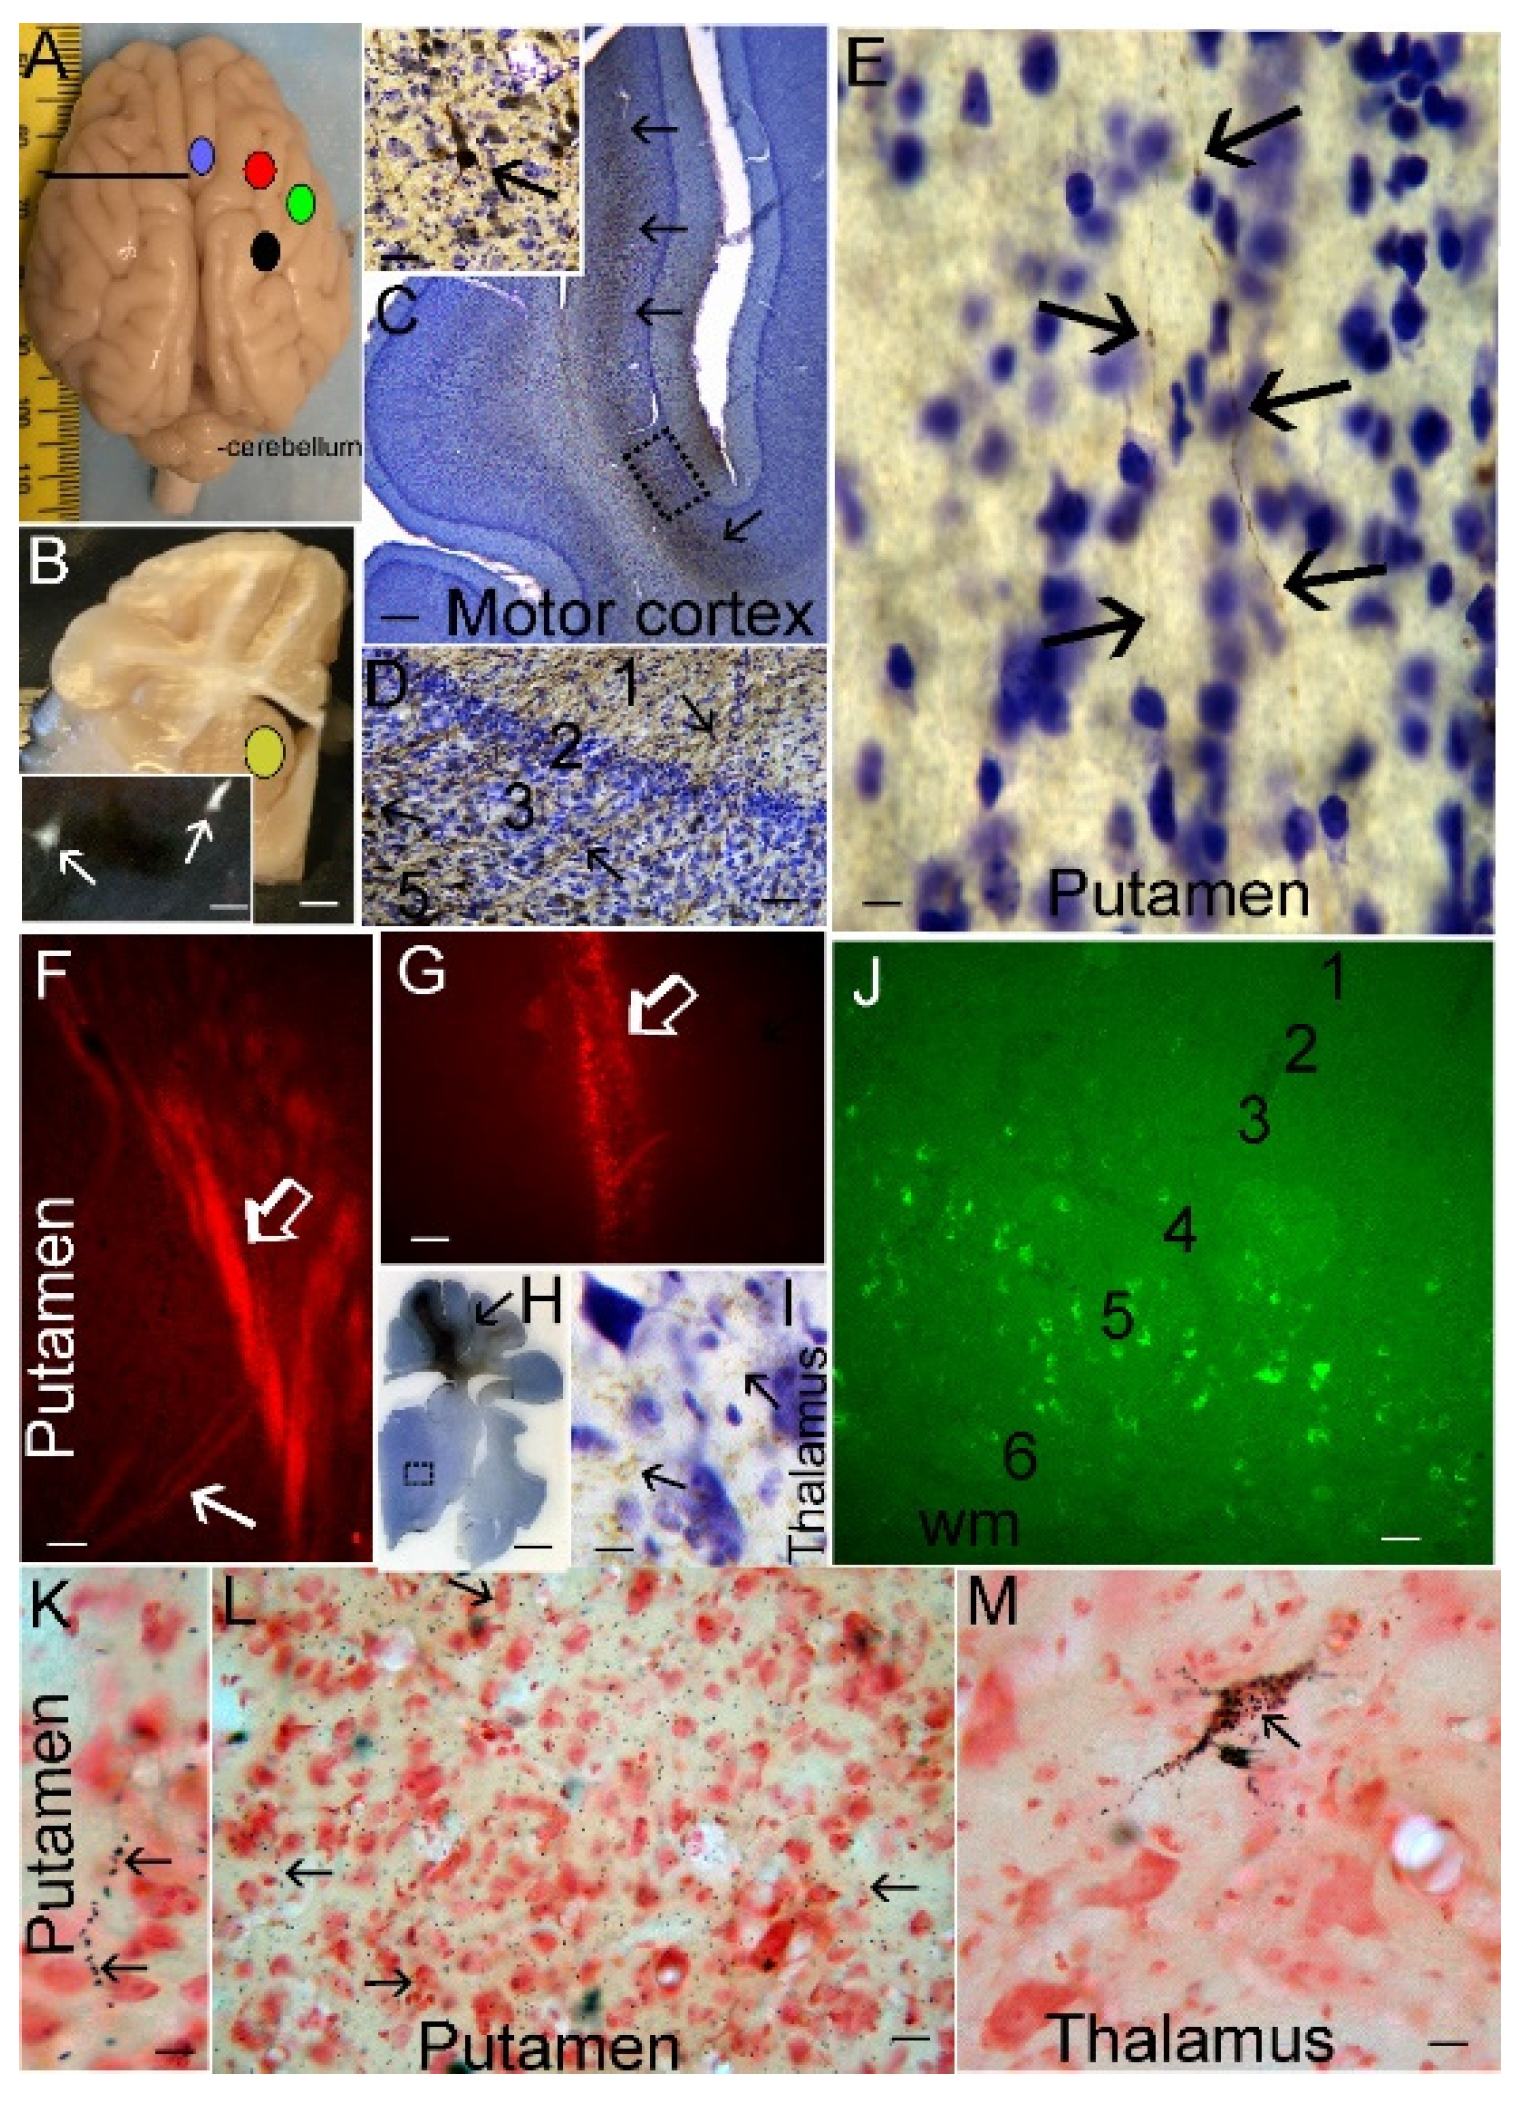
3.1. Neonatal Piglet Gyrencephaly, Cytoarchitecture, Chemoarchitecture, and Connectivity
3.2. Neonatal Piglet Brain Injury Model
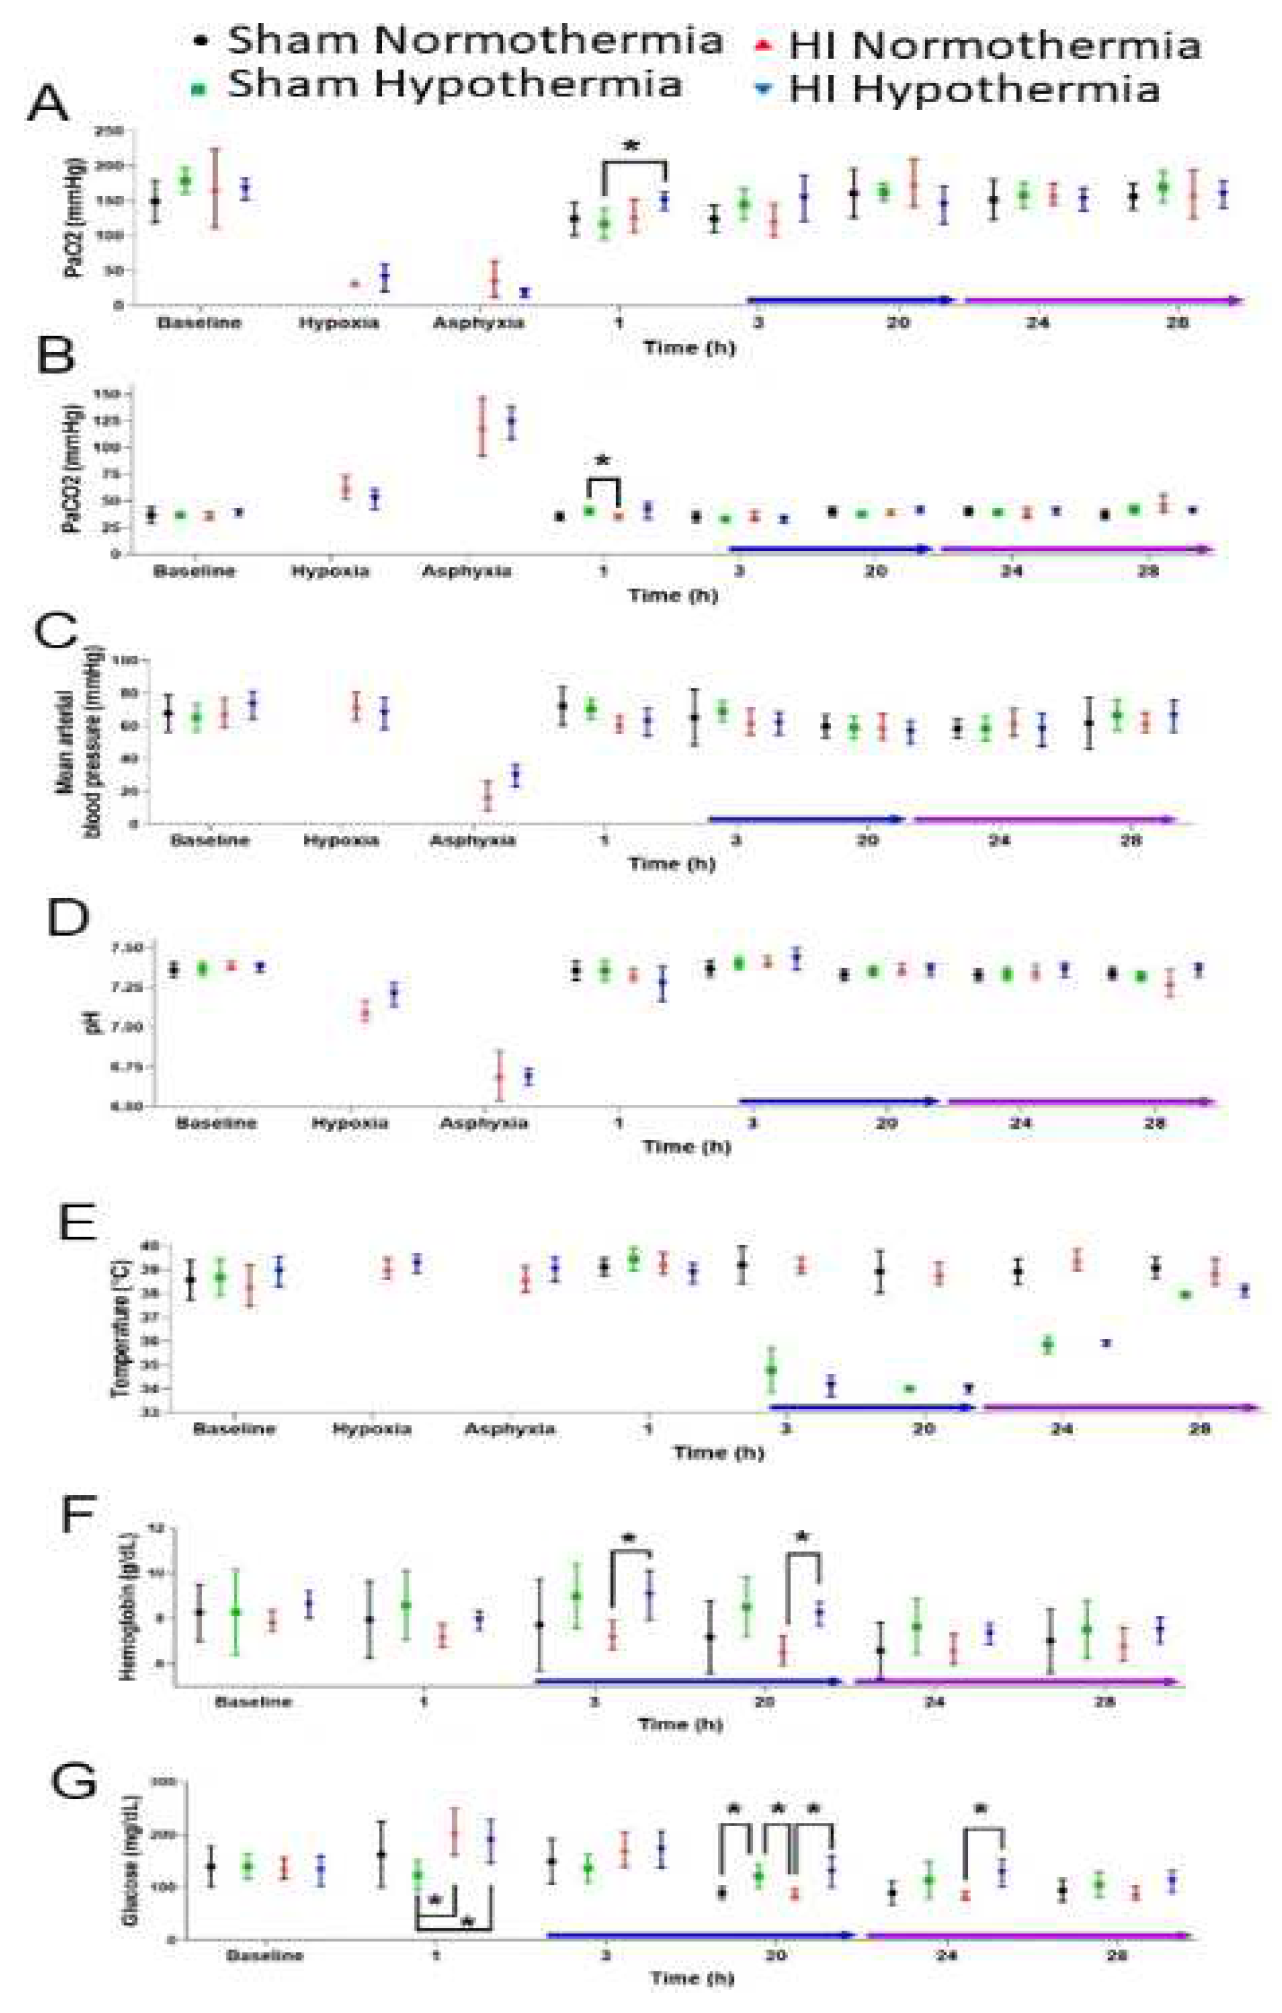
3.2.1. Pathophysiology
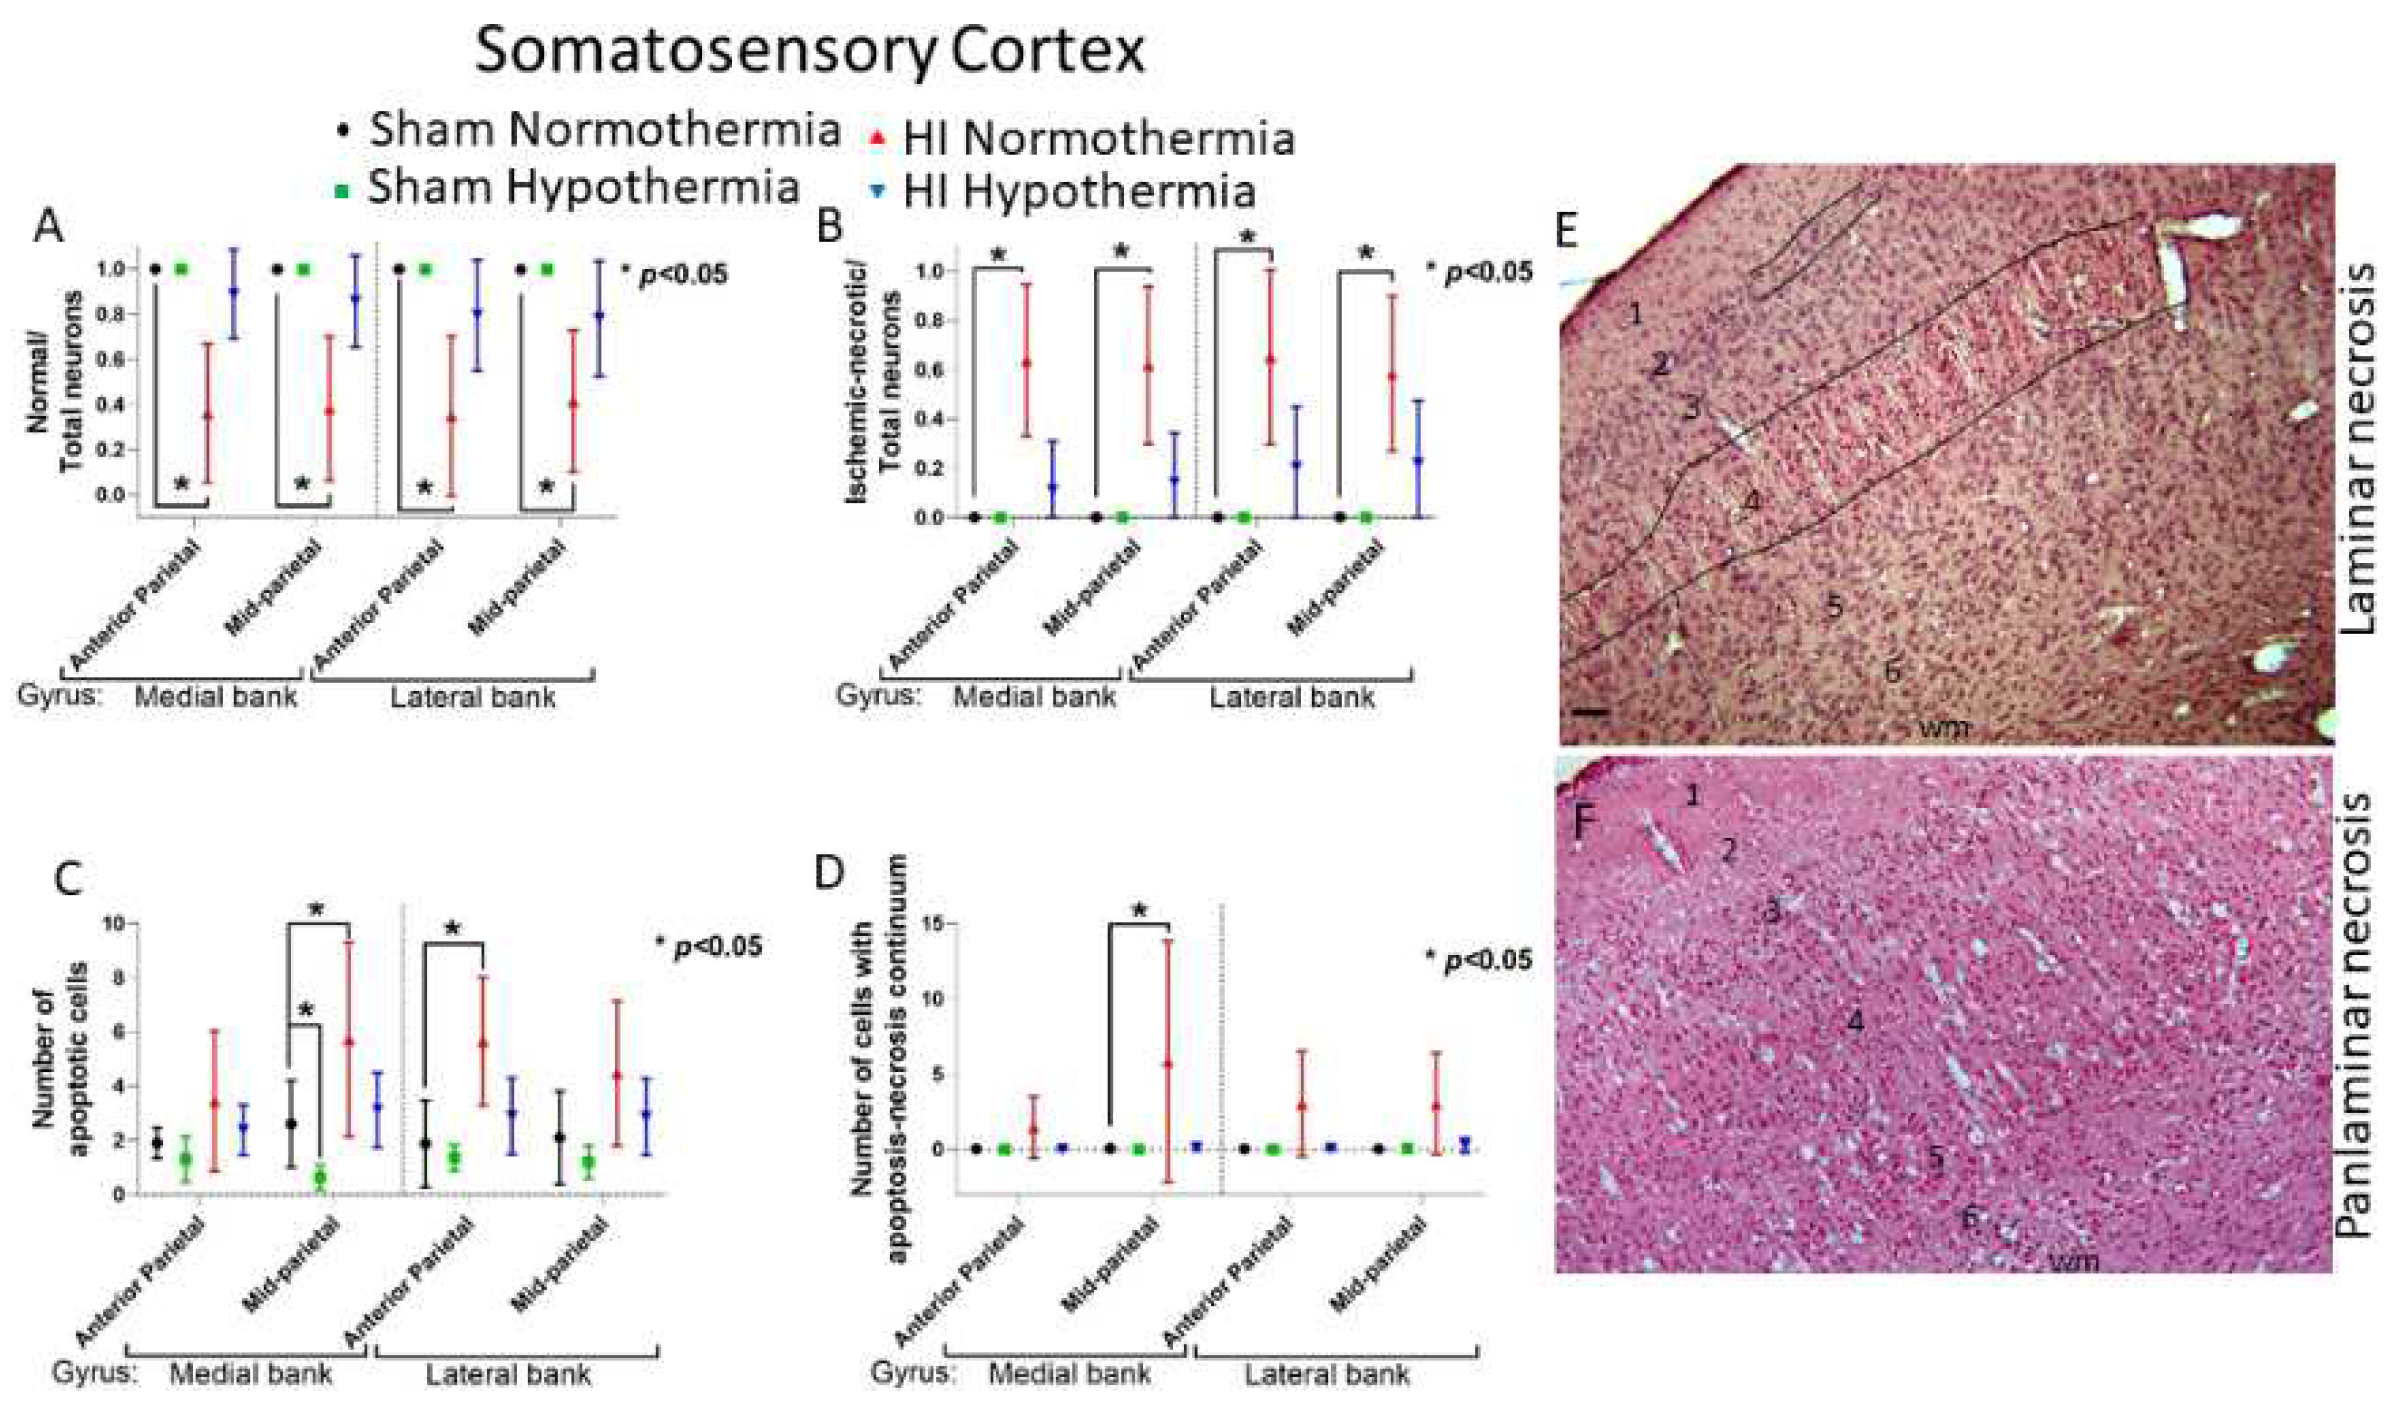
3.2.2. HT Protects Primary Somatosensory Cortex after HI
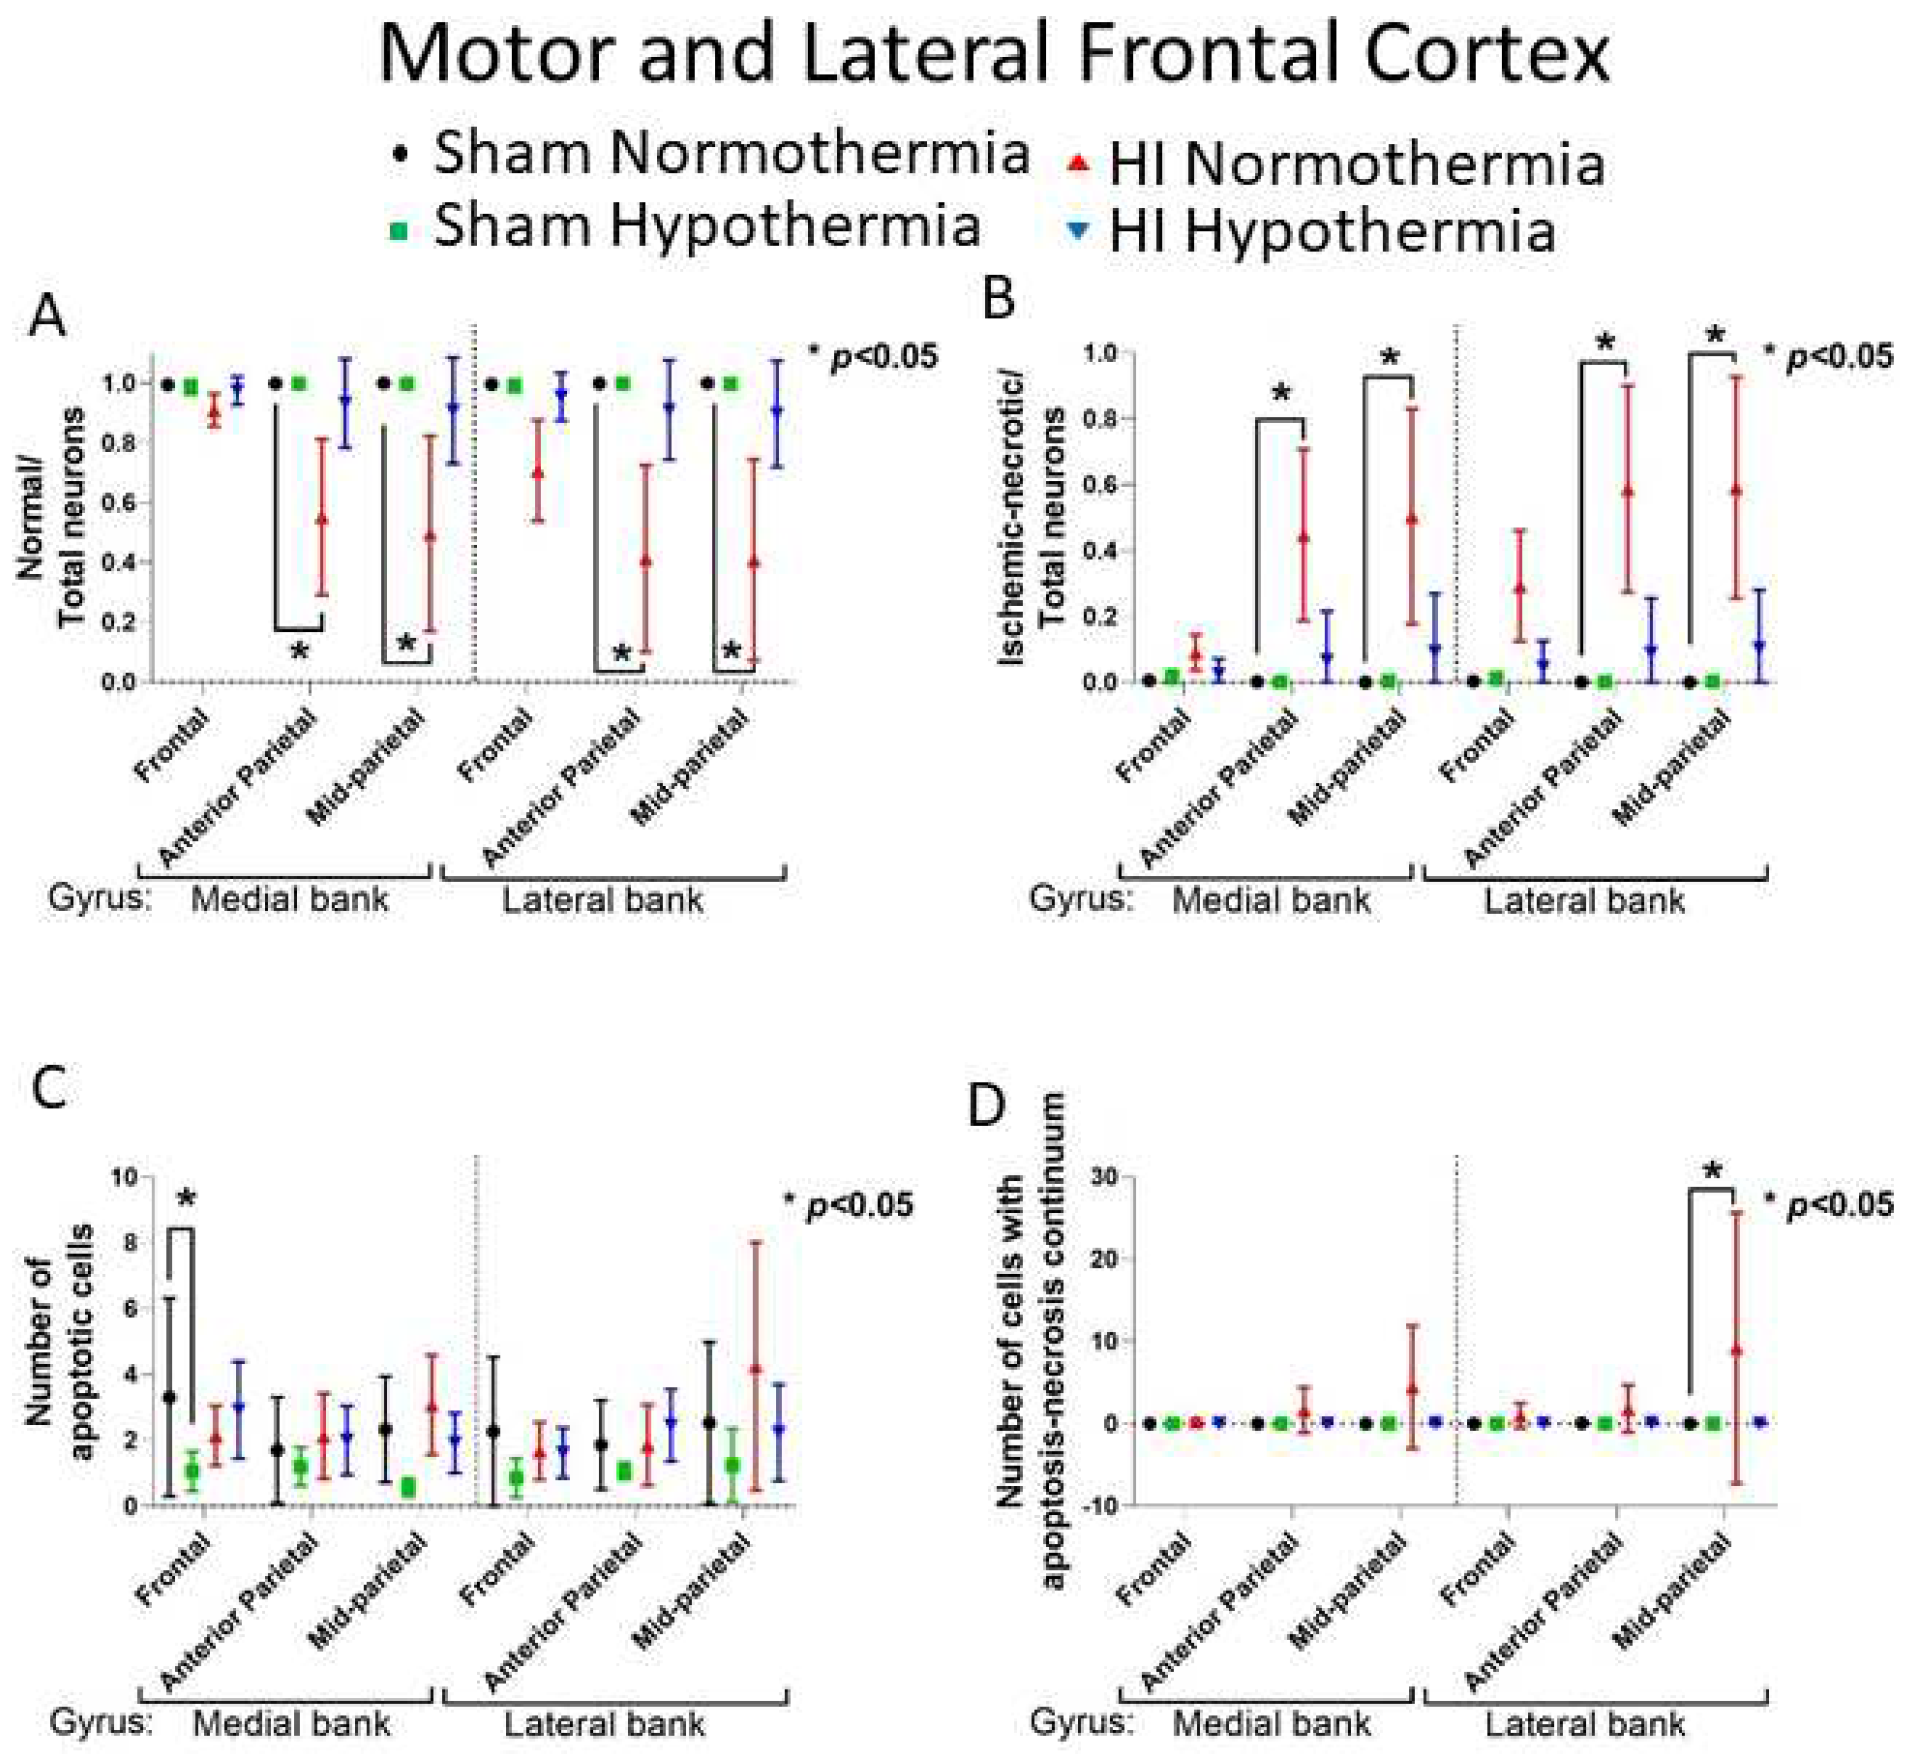
3.2.3. HT Protects Primary Motor Cortex after HI
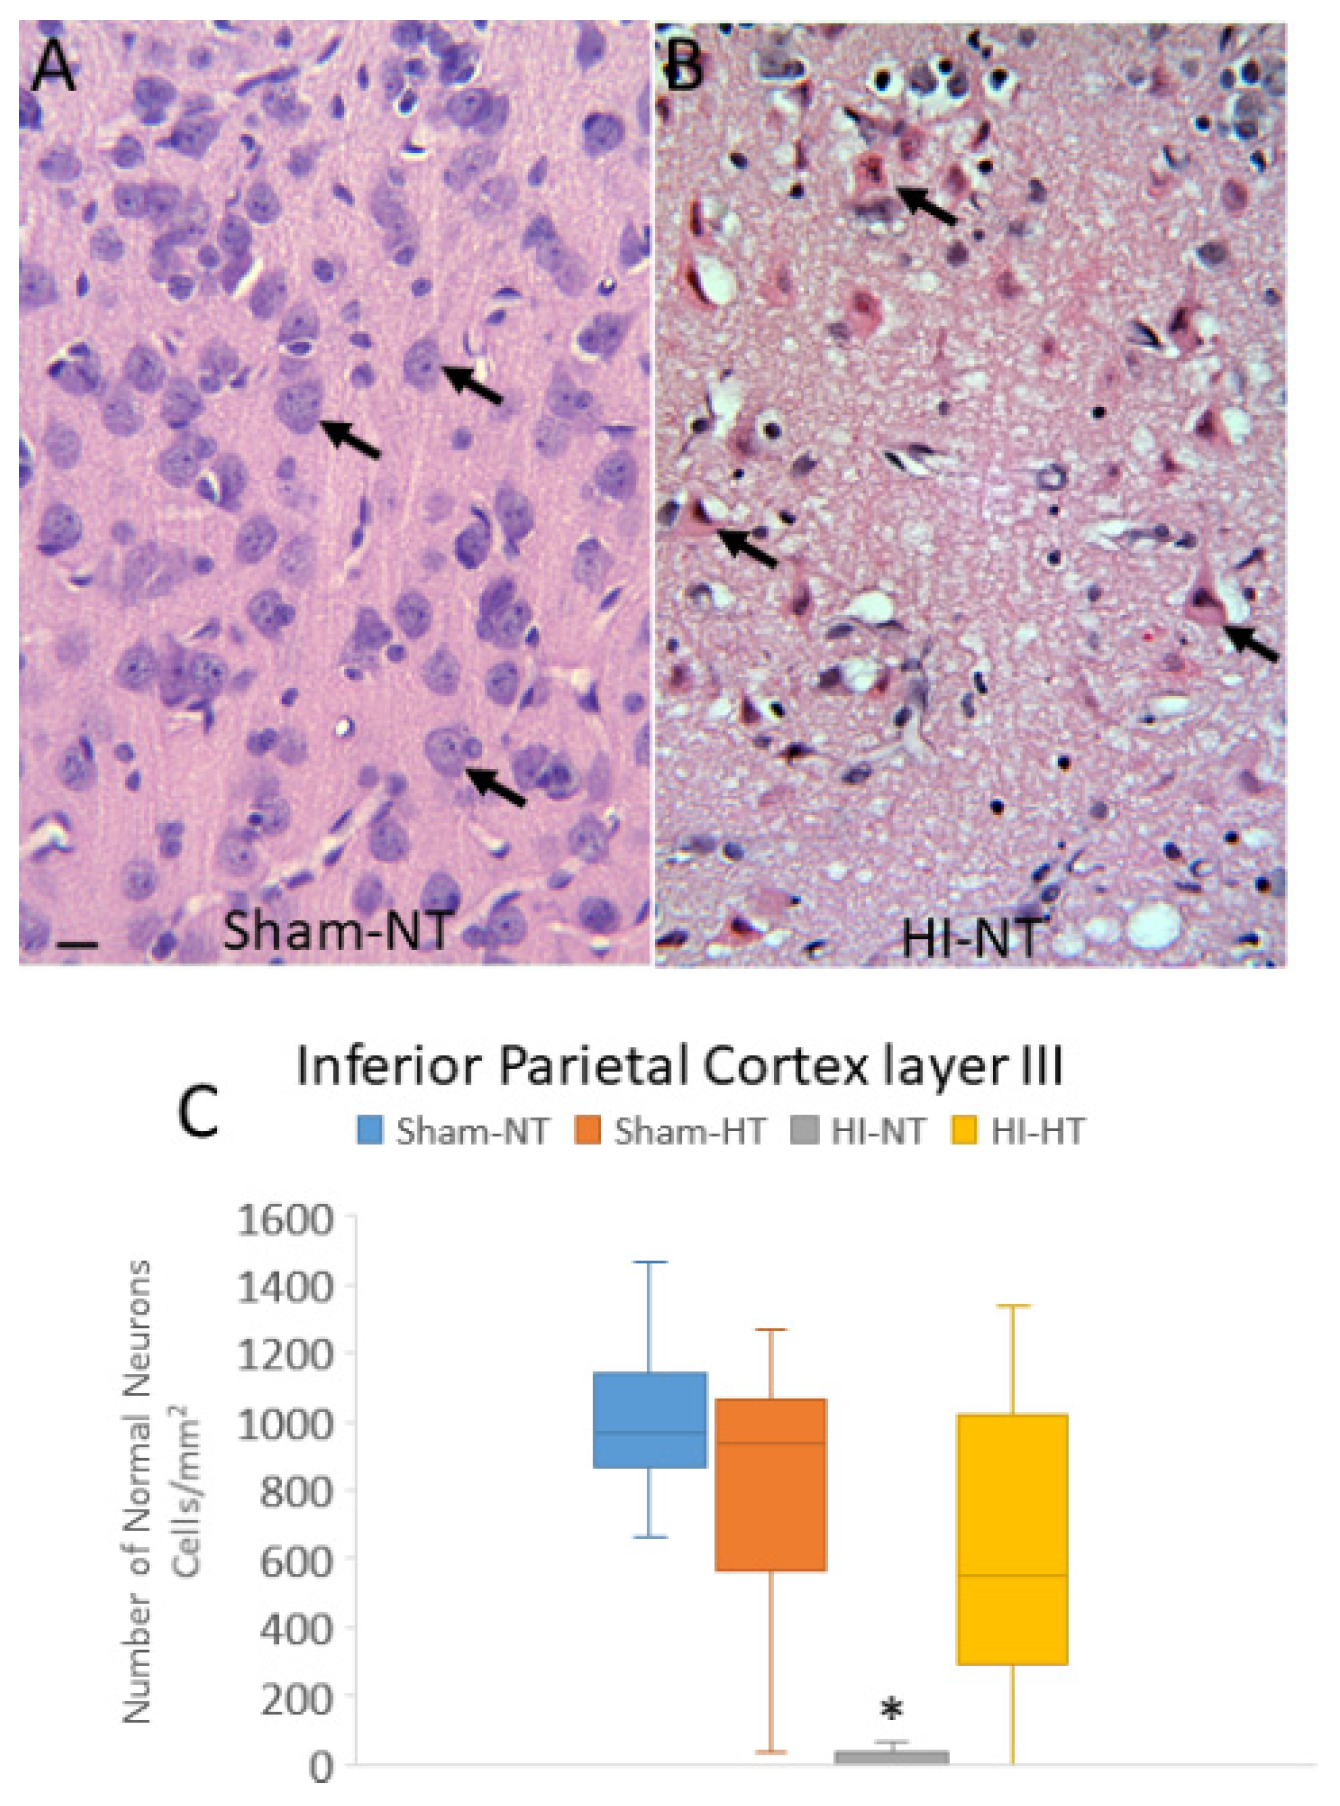
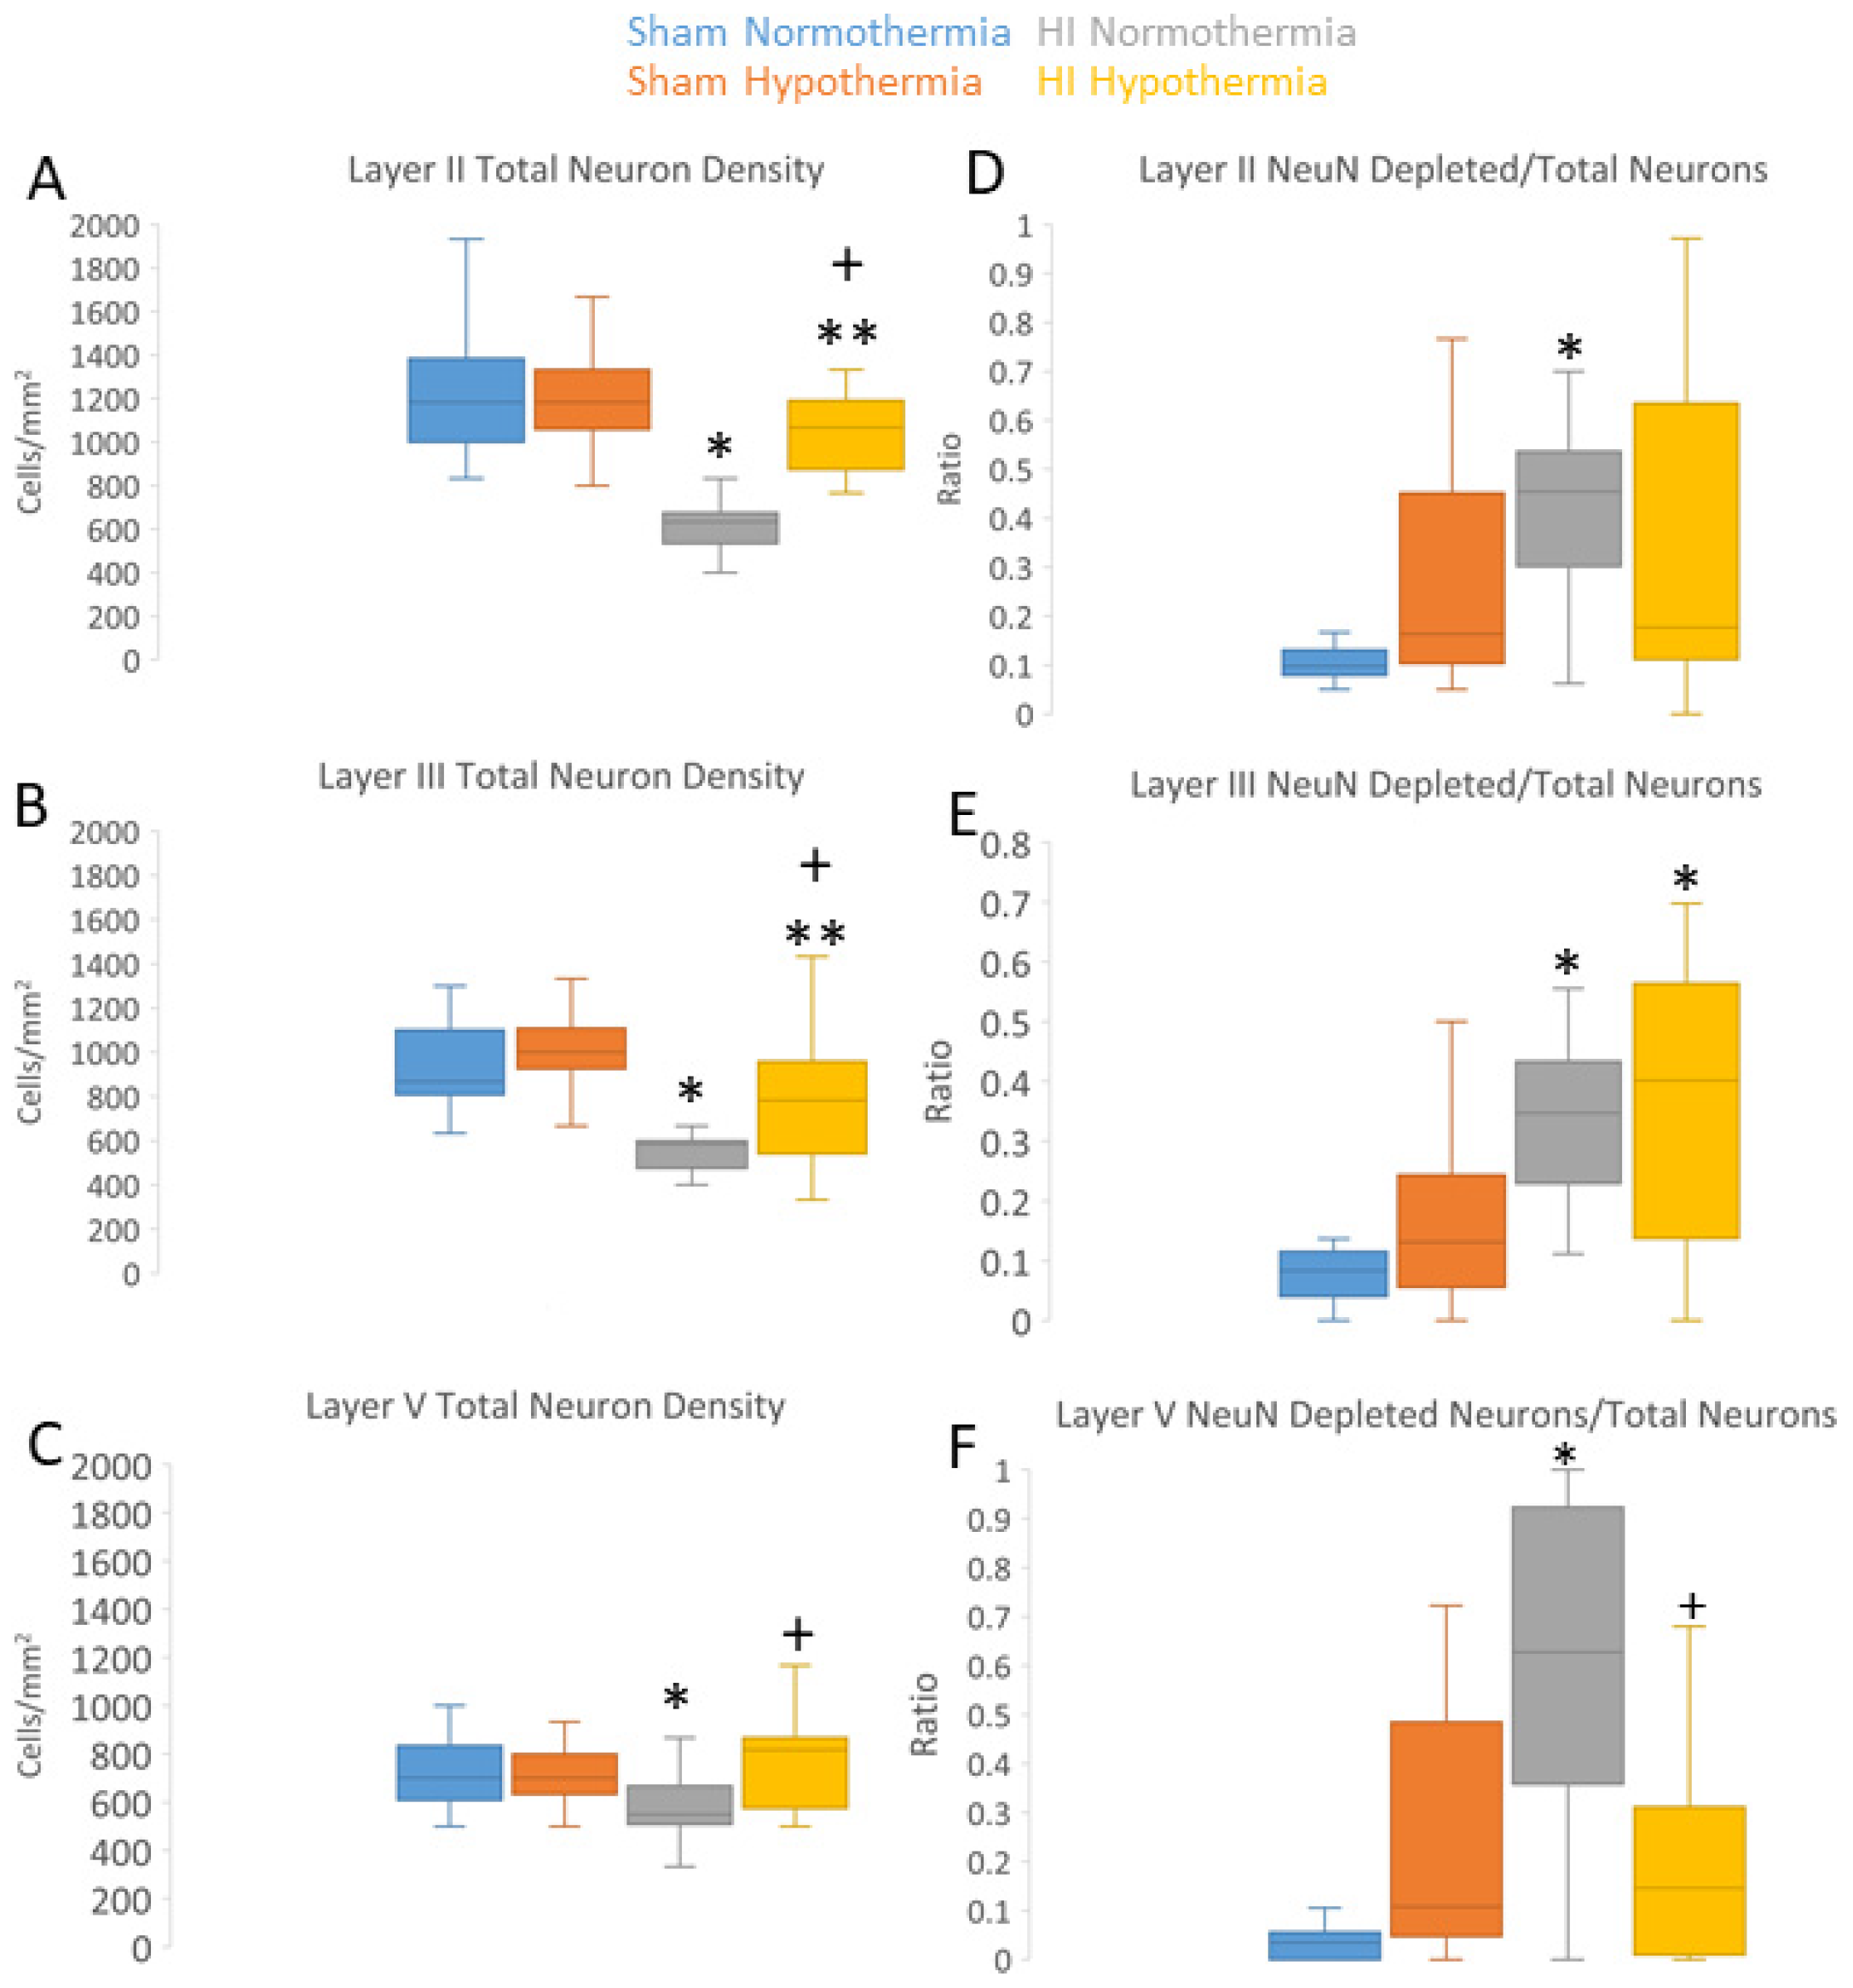
3.3. Neuropathology in Neocortex of HI Piglets Involves Laminar Vulnerability and Depletion of Nuclear Rbfox3
3.4. HT Reduces the Burden of Neuronal Injury in the Putamen after HI
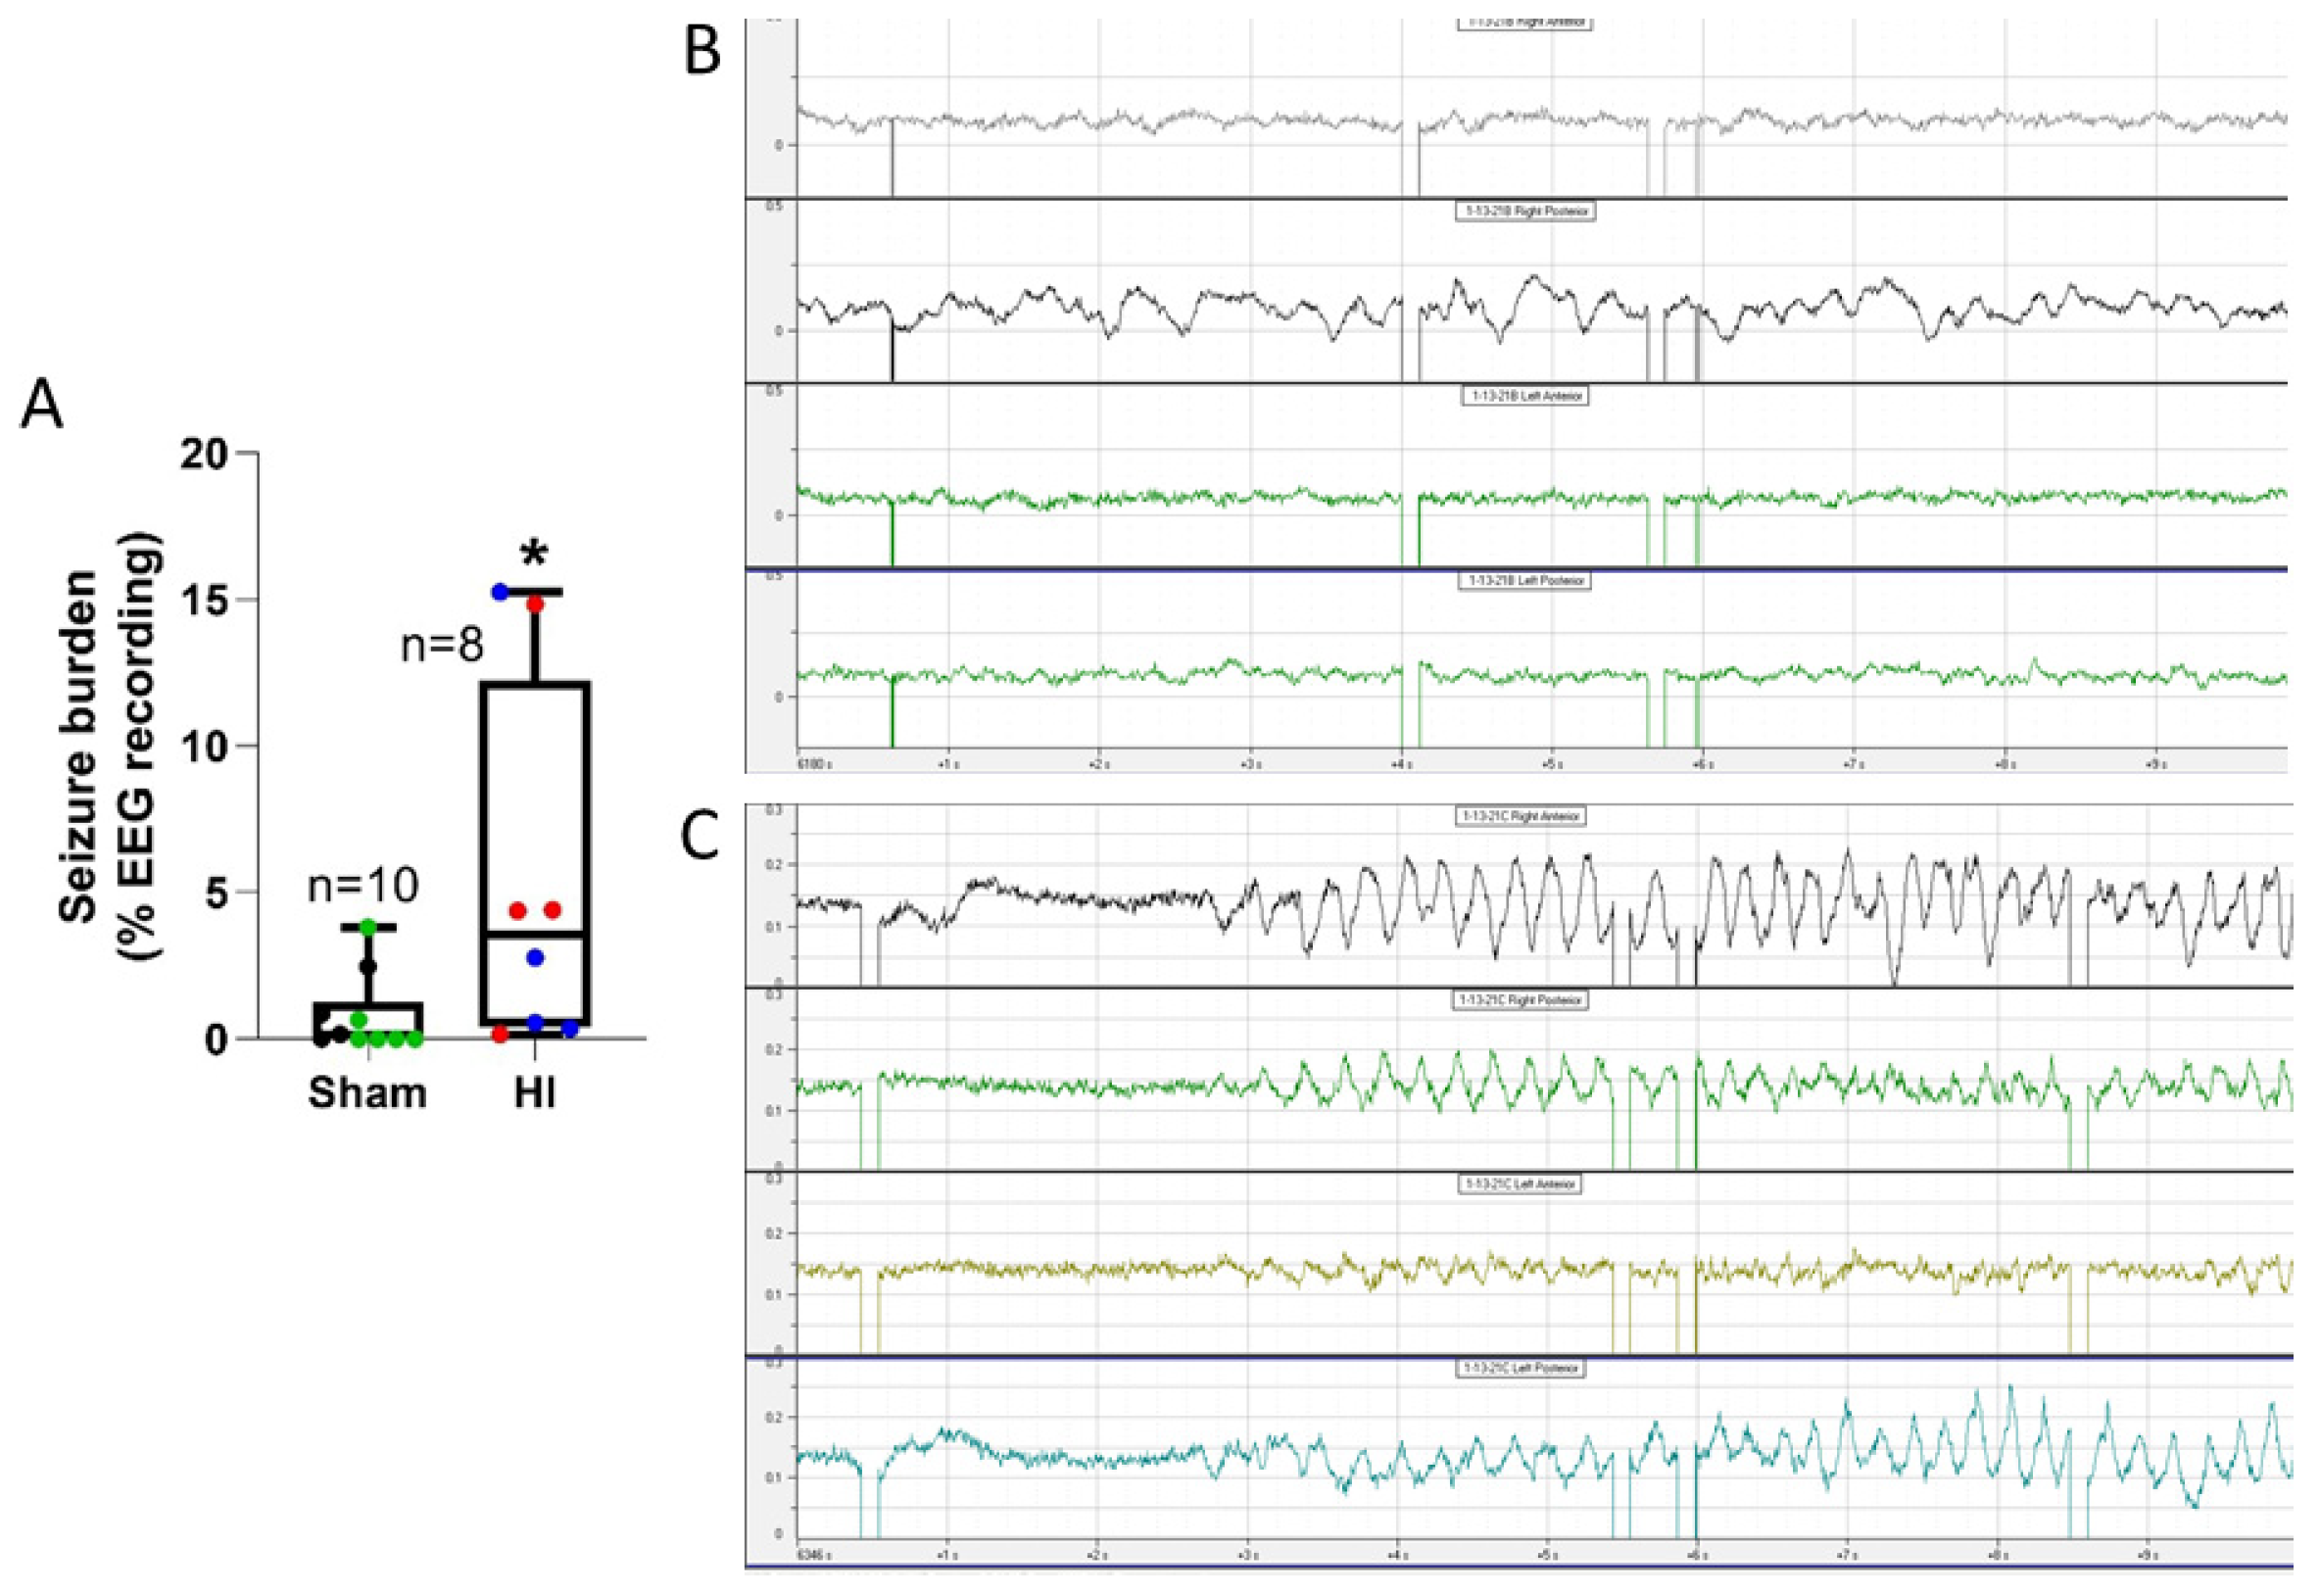
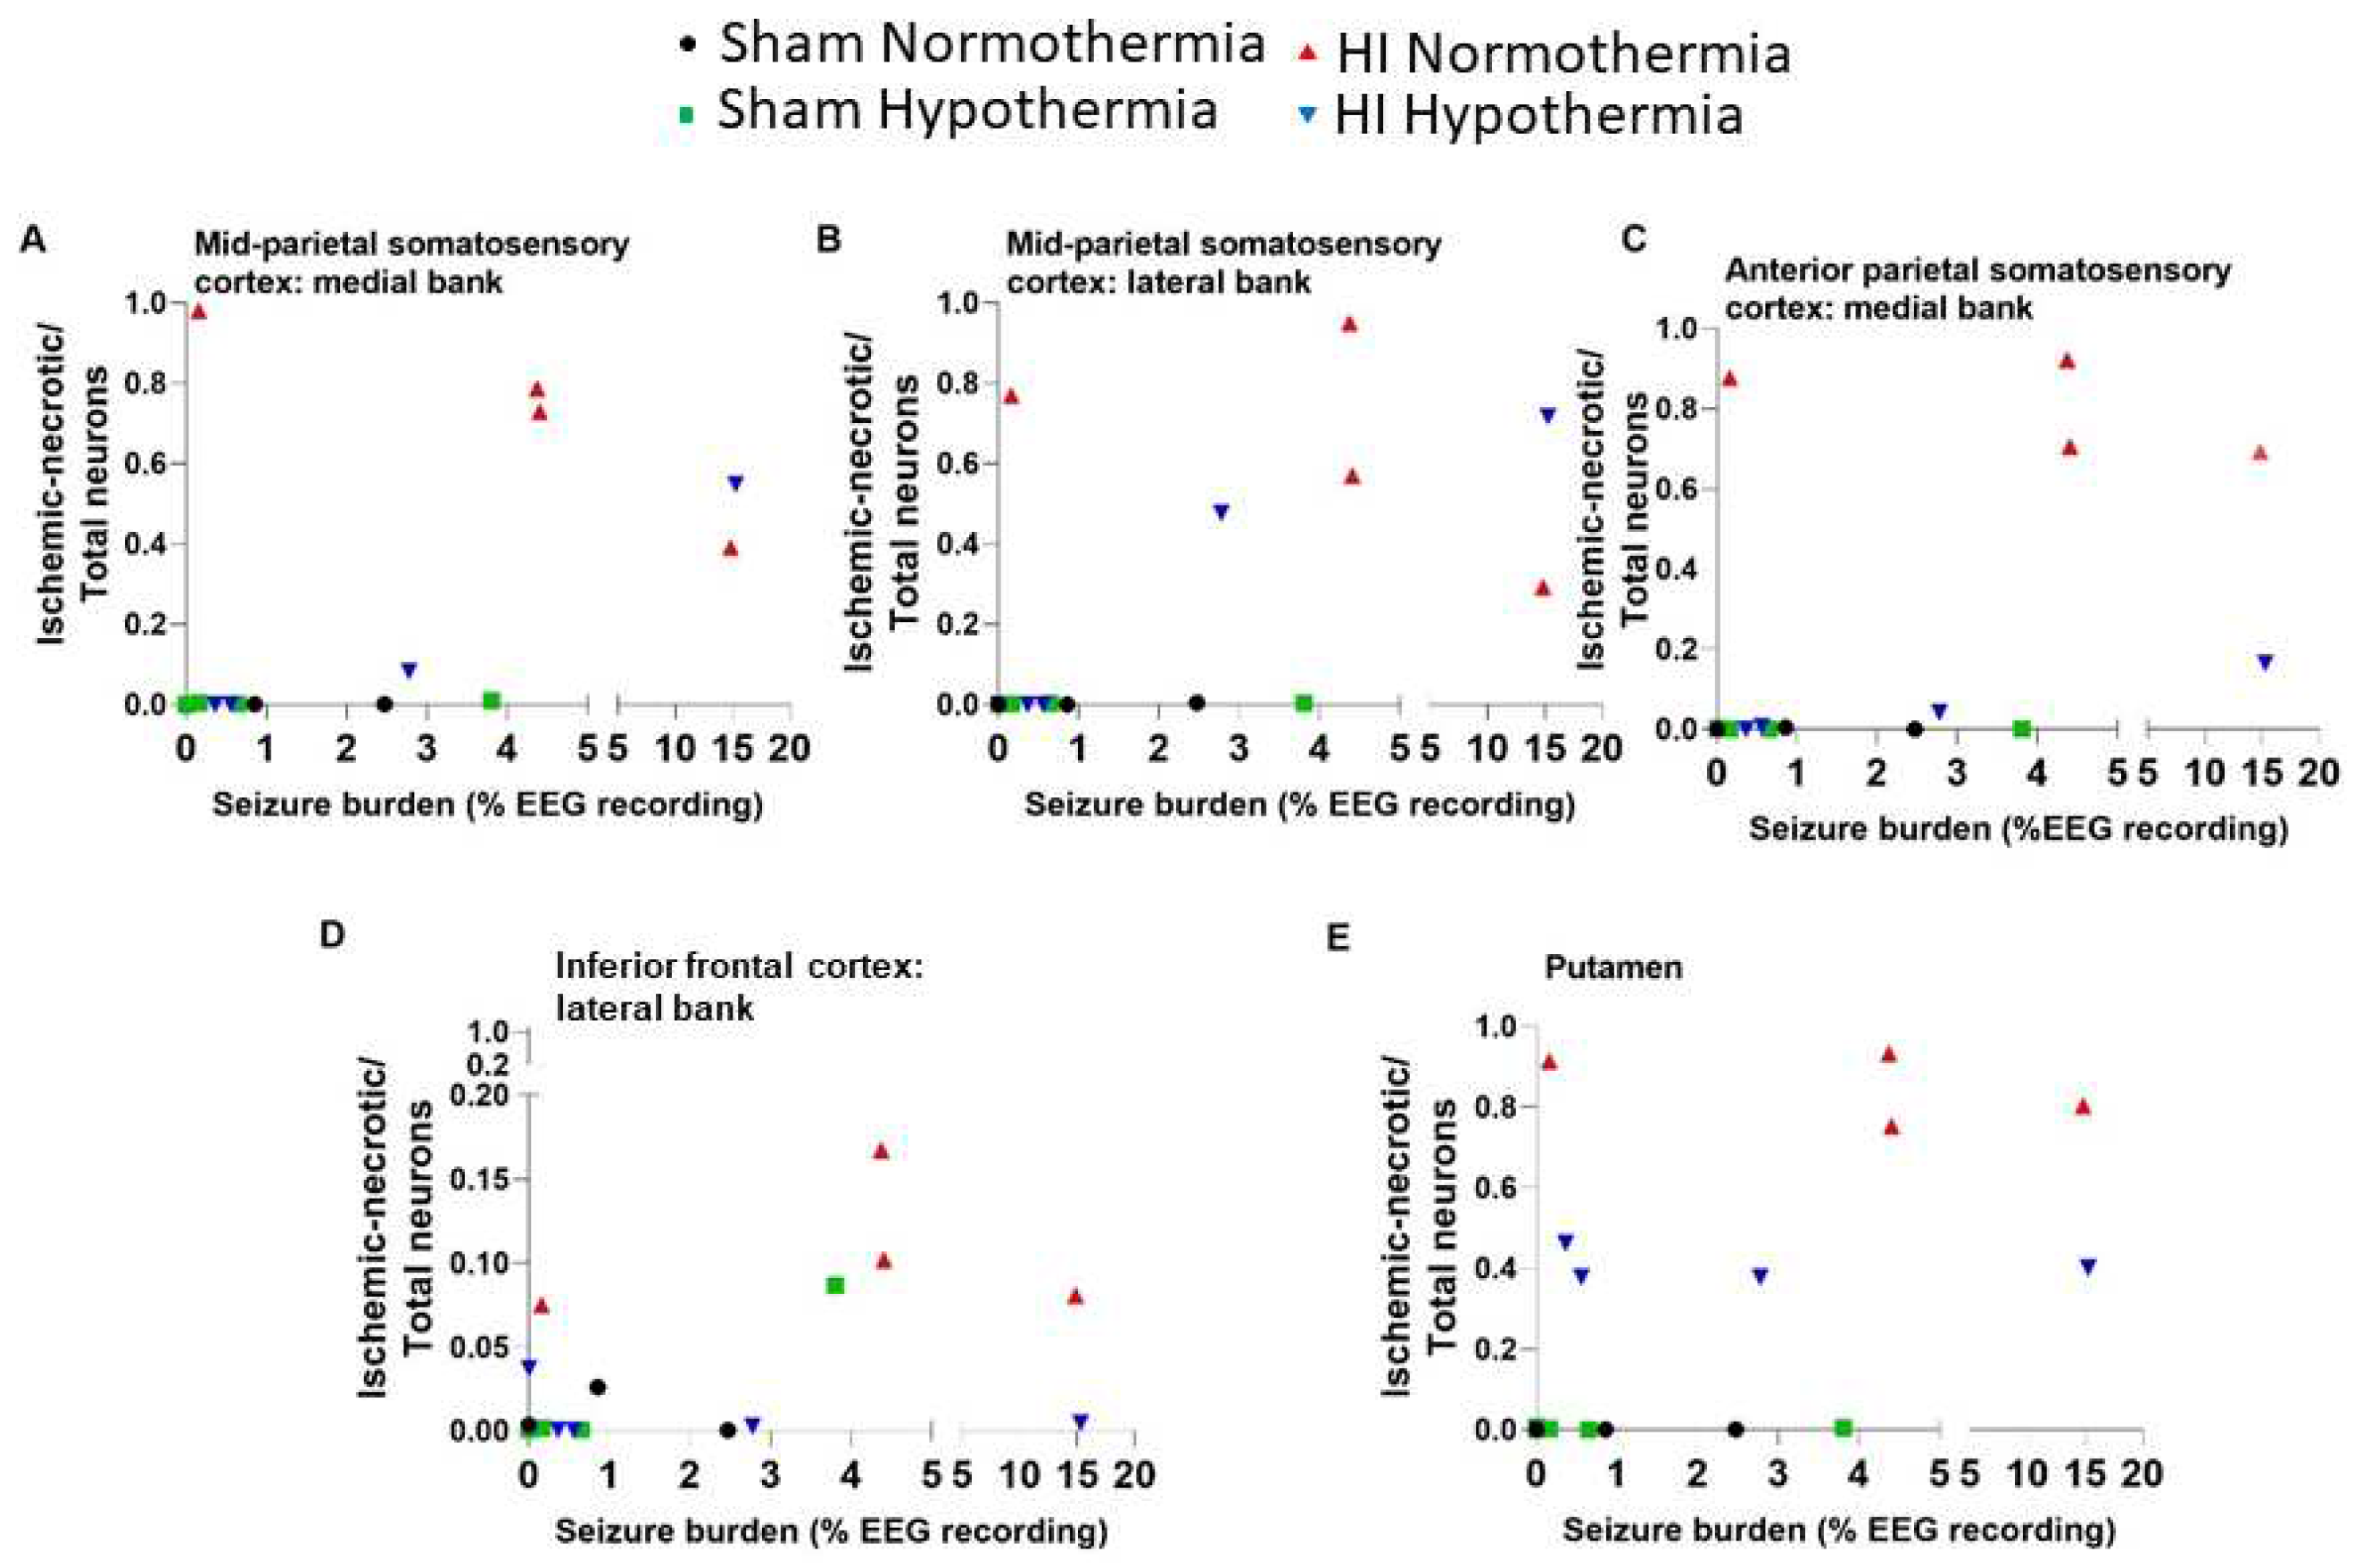
3.5. Electrographic and Clinical Seizures
4. DISCUSSION
4.1. Animal Models to Study Neocortical Organization, HIE, and Seizures in the Neonatal Brain
4.2. Our Piglet Pathophysiology Mimics Clinical Neonatal HIE
4.3. The Neonatal Piglet Neocortex has a Suprasylvian and Prefrontal Vulnerability to HIE
4.4. Neocortical Neuronal Degeneration in Piglet after HI and HT has a Limited Structural Phenotype Repertoire
4.5. Rbfox3 Immunophenotyping Identifies a New Form of Neocortical Neuropathology in Neonatal HIE
4.6. Study Caveats and Future Directions
Supplementary Materials
Author Contributions
Funding
Institutional Review Board Statement
Acknowledgments
References
- Liu, L.; Johnson, H.L.; Cousens, S.; et al. Global, regional, and national causes of child mortality: an updated systematic analysis for 2010 with time trends since 2000. Lancet (London, England). 2012, 379, 2151-2161.
- Lawn, J., Shibuya, K., Stein, C. No cry at birth: global estimates of intrapartum stillbirths and intrapartum-related neonatal deaths. Bull. World Health Organ. 2005, 83, 409-417.
- Shankaran, S.; Laptook, A.R.; Ehrenkranz, R.A.; Tyson, J.E.; McDonald, S.A.; Donovan, E.F.; Fanaroff, A.A.; Poole, W.K.; Wright, L.L.; Higgins, R.D. Whole-body hypothermia for neonates with hypoxic-ischemic encephalopathy. N. Engl. J. Med. 2005, 353, 1574–84. [Google Scholar] [CrossRef] [PubMed]
- Shankaran, S.; Pappas, A.; McDonald, S.A.; Vohr, B.R.; Hintz, S.R.; Yolton, K.; Gustafson, K.E.; Leach, T.M.; Green, C.; Bara, R.; et al. Childhood outcomes after hypothermia for neonatal encephalopathy. N. Engl. J. Med. 2012, 366, 2085–92. [Google Scholar] [CrossRef] [PubMed]
- Azzopardi, D. , Strohm, B., Marlow, N., et al. Effects of hypothermia for perinatal asphyxia on childhood outcomes. N. Engl. J. Med. 2014, 371, 371,140–149. [Google Scholar]
- Lee-Kelland, R., Jary, S., Tonks, J., Cowan, F.M., Thoresen, M., Chakkarapani, E. School-age outcomes of children without cerebral palsy cooled for neonatal hypoxic-ischaemic encephalopathy in 2008-2010. Arch. Dis. Child. Fetal Neonatal Ed. 2020, 105, 8-13. [CrossRef]
- Geschwind, N. Specializations of the human brain. Sci. Am. 1979, 241, 180–99. [Google Scholar] [CrossRef] [PubMed]
- Kolb, B.; Mychasiuk, R.; Muhammad, A.; Li, Y.; Frost, D.O.; Gibb, R. Experience and the developing prefrontal cortex. Proc. Natl. Acad. Sci. USA. 2012, 2 (Suppl 2), 17186–93. [Google Scholar] [CrossRef]
- Teffer, K.; Semendeferi, K. Human prefrontal cortex: evolution, development, and pathology. Prog. Brain Res. 2012, 195, 191–218. [Google Scholar] [CrossRef]
- Barkovich, A.J. MR and CT evaluation of profound neonatal and infantile asphyxia. Am. J. Neuroradiol. 1992, 13, 959–72. [Google Scholar]
- Roland, E.H.; Poskitt, K.; Rodriguez, E.; Lupton, B.A.; Hill, A. Perinatal hypoxic-ischemic thalamic injury: clinical features and neuroimaging. Ann. Neurol. 1998, 44, 161–6. [Google Scholar] [CrossRef]
- Miller, S.P.; Ramaswamy, V.; Michelson, D.; Barkovich, A.J.; Holshouser, B.; Wycliffe, N.; Glidden, D.V.; Deming, D.; Partridge, J.C.; Wu, Y.W.; Ashwal, S.; Ferriero, D.M. Patterns of brain injury in term neonatal encephalopathy. J. Pediatr. 2005, 146, 453–60. [Google Scholar] [CrossRef]
- van der Knaap, M.S.; Smit, L.S.; Nauta, J.J.; Lafeber, H.N.; Valk, J. Cortical laminar abnormalities--occurrence and clinical significance. Neuropediatrics. 1993, 24, 143–8. [Google Scholar] [CrossRef] [PubMed]
- Rutherford, M.A. The asphyxiated term infant. In, MRI of the neonatal brain. Rutherford MA, editor. eBook 2002-2023.
- Weeke, L.C.; Groenendaal, F.; Mudigonda, K.; Blennow, M.; Lequin, M.H.; Meiners, L.C.; van Haastert, I.C.; Benders, M.J.; Hallberg, B.; de Vries, L.S. A novel magnetic resonance imaging score predicts neurodevelopmental outcome after perinatal asphyxia and therapeutic hypothermia. J. Pediatr. 2018, 192, 33-40.e2. [CrossRef]
- Xu, Q.; Chau, V.; Sanguansermsri, C.; Muir, K.E.; Tam, E.W.Y.; Miller, S.P.; Wong, D.S.T.; Chen, H.; Wong, P.K.H.; Zwicker, J.G.; Poskitt, K.J.; Hill, A.; Roland, E.H. Pattern of brain injury predicts long-term epilepsy following neonatal encephalopathy. J. Child Neurol. 2019, 34, 199–209. [Google Scholar] [CrossRef] [PubMed]
- Kaas, J.H. Neocortex in early mammals and its subsequent variations. Ann. NY. Acad. Sci. 2011, 1225, 28–36. [Google Scholar] [CrossRef] [PubMed]
- Martin, L.J.; Chang, Q. DNA damage response and repair, DNA methylation, and cell death in human neurons and experimental animal neurons are different. J. Neuropathol. Exp. Neurol. 2018, 77, 636–655. [Google Scholar]
- Martin, L.J.; Brambrink, A.; Koehler, R.C.; Traystman, R.J. Primary sensory and forebrain motor systems in the newborn brain are preferentially damaged by hypoxia-ischemia. J. Comp. Neurol. 1997, 377, 262–285. [Google Scholar] [CrossRef]
- Martin, L.J.; Brambrink, A.; Koehler, R.C.; Traystman, R.J. Neonatal asphyxic brain injury is neural system preferential and targets sensory-motor networks. In: Fetal and neonatal brain injury: mechanisms, management, and the risks of practice. Stevenson DK, Sunshine P, editors, Oxford University Press, 1997, pp 374-399.
- Laptook, A.R.; Corbett, R.J.; Sterett, R.; Burns, D.K.; Garcia, D.; Tollefsbol, G. Modest hypothermia provides partial neuroprotection when used for immediate resuscitation after brain ischemia. Pediatr. Res. 1997, 42, 17–23. [Google Scholar] [CrossRef]
- Glass, H.C.; Wusthoff, C.J.; Shellhaas, R.A.; et al. Risk factors for EEG seizures in neonates treated with hypothermia: a multicenter cohort study. Neurology. 2014, 82, 1239–1244. [Google Scholar] [CrossRef]
- Shetty, J. Neonatal seizures in hypoxic-ischaemic encephalopathy--risks and benefits of anticonvulsant therapy. Dev. Med. Child Neurol. 2015, 3, 0–3. [Google Scholar] [CrossRef]
- Schmid, R.; Tandon, P.; Stafstrom, C.E.; Holmes, G.L. Effects of neonatal seizures on subsequent seizure-induced brain injury. Neurology. 1999, 53, 1754–61. [Google Scholar] [CrossRef]
- Miller, S.P.; Weiss, J.; Barnwell, A.; Ferriero, D.M.; Latal-Hajnal, B.; Ferrer-Rogers, A.; Newton, N.; Partridge, J.C.; Glidden, D.V.; Vigneron, D.B.; Barkovich, A.J. Seizure-associated brain injury in term newborns with perinatal asphyxia. Neurology. 2002, 58, 542–8. [Google Scholar] [CrossRef]
- Panayiotopoulos, C.P. Idiopathic generalized epilepsies: a review and modern approach. Epilepsia. 2005, 9, 1–6. [Google Scholar] [CrossRef]
- Samanta, D. Recent advances in the diagnosis and treatment of neonatal seizures. Neuropediatrics. 2021, 2021 52, 73–83. [Google Scholar] [CrossRef]
- Tao, J.D.; Mathur, A.M. Using amplitude-integrated EEG in neonatal intensive care. J. Perinatol. 2010, 30 Suppl, S73–81. [Google Scholar] [CrossRef]
- Chalak, L.F.; Pappas, A.; Tan, S.; Das, A.; Sánchez, P.J.; Laptook, A.R.; Van Meurs, K.P.; Shankaran, S.; Bell, E.F.; Davis, A.S.; et al. Association of increased seizures during rewarming with abnormal neurodevelopmental outcomes at 2-year follow-up: A nested multisite cohort study. JAMA Neurol. 2021, 78, 1–10. [Google Scholar] [CrossRef]
- Glass, H.C.; Glidden, D.; Jeremy, R.J.; Barkovich, A.J.; Ferriero, D.M.; Miller, S.P. Clinical neonatal seizures are independently associated with outcome in infants at risk for hypoxic-ischemic brain injury. J. Pediatr. 2009, 155, 318–23. [Google Scholar] [CrossRef] [PubMed]
- Kwon, J.M. , Guillet, R., Shankaran, S., Laptook, A.R., McDonald, S.A., Ehrenkranz, R.A., Tyson, J.E., O'Shea, T.M., Goldberg, R.N., Donovan, E.F.; et al. Clinical seizures in neonatal hypoxic-ischemic encephalopathy have no independent impact on neurodevelopmental outcome: secondary analyses of data from the neonatal research network hypothermia trial. J. Child Neurol. 2011, 26, 322–328. [Google Scholar] [CrossRef] [PubMed]
- Ranck, J.B. Jr.; Windle, W.F. Brain damage in the monkey, Macaca mulatta, by asphyxia neonatorum. Exp. Neurol. 1959, 1, 130–54. [Google Scholar] [CrossRef] [PubMed]
- Brann, A.W. Jr.; Myers, R.E. Central nervous system findings in the newborn monkey following severe in utero partial asphyxia. Neurology. 1975, 25, 327–38. [Google Scholar] [CrossRef]
- Thoresen, M.; Hallström, A.; Whitelaw, A.; Puka-Sundvall, M.; Løberg, E.M.; Satas, S.; Ungerstedt, U.; Steen, P.A.; Hagberg, H. Lactate and pyruvate changes in the cerebral gray and white matter during posthypoxic seizures in newborn pigs. Pediatr. Res. 1998, 44, 746–54. [Google Scholar] [CrossRef]
- Haaland, K.; Løberg, E.M.; Steen, P.A.; Thoresen, M. Posthypoxic hypothermia in newborn piglets. Pediatr. Res. 1997, 41(4 Pt 1) Pt 1, 505–12. [Google Scholar] [CrossRef]
- Brambrink, A.M.; Ichord, R.N.; Martin, L.J.; Koehler, R.C.; Traystman, R.J. Poor outcome after hypoxia-ischemia in newborns is associated with physiological abnormalities during early recovery. Possible relevance to secondary brain injury after head trauma in infants. Exp. Toxicol. Pathol. 1999, 51, 151–62. [Google Scholar] [CrossRef]
- Löscher, W. Animal models of seizures and epilepsy: past, present, and future role for the discovery of antiseizure drugs. Neurochem. Res. 2017, 42, 1873–1888. [Google Scholar] [CrossRef]
- Gracie, L.; Rostami-Hochaghan, D.; Taweel, B.; Mirza, N. ; SAGAS Scientists' Collaborative. The seizure-associated genes across species (SAGAS) database offers insights into epilepsy genes, pathways and treatments. Epilepsia. 2022, 63, 2403–2412. [Google Scholar] [CrossRef]
- Kossoff, E. Neonatal seizures due to hypoxic-ischemic encephalopathy: should we care? Epilepsy Curr. 2011, 11, 147–8. [Google Scholar] [CrossRef]
- Zhou, K.Q.; McDouall, A.; Drury, P.P.; Lear, C.A.; Cho, K.H.T.; Bennet, L.; Gunn, A.J.; Davidson, J.O. Treating seizures after hypoxic-ischemic encephalopathy -current controversies and future directions. Int. J. Mol. Sci. 2021, 22, 7121. [Google Scholar] [CrossRef]
- Bittigau, P.; Sifringer, M.; Genz, K.; Reith, E.; Pospischil, D.; Govindarajalu, S.; Dzietko, M.; Pesditschek, S.; Mai, I.; Dikranian, K.; Olney, J.W.; Ikonomidou, C. Antiepileptic drugs and apoptotic neurodegeneration in the developing brain. Proc. Natl. Acad. Sci. USA. 2002, 99, 15089–94. [Google Scholar] [CrossRef] [PubMed]
- Forcelli, P.A.; Janssen, M.J.; Vicini, S.; Gale, K. Neonatal exposure to antiepileptic drugs disrupts striatal synaptic development. Ann. Neurol. 2012, 72, 363–72. [Google Scholar] [CrossRef]
- Noguchi, K.K.; Fuhler, N.A.; Wang, S.H.; Capuano, S. 3rd; Brunner, K.R.; Larson, S.; Crosno, K.; Simmons, H.A.; Mejia, A.F.; Martin, L.D.; Dissen, G.A.; Brambrink, A.; Ikonomidou, C. 3rd; Brunner, K.R.; Larson, S.; Crosno, K.; Simmons, H.A.; Mejia, A.F.; Martin, L.D.; Dissen, G.A.; Brambrink, A.; Ikonomidou, C. Brain pathology caused in the neonatal macaque by short and prolonged exposures to anticonvulsant drugs. Neurobiol. Dis. 2021, 149, 105245. [Google Scholar] [CrossRef]
- Lal, D.; Reinthaler, E.M.; Altmüller, J.; Toliat, M.R.; Thiele, H.; Nürnberg, P.; Lerche, H.; Hahn, A.; Møller, R.S.; Muhle, H.; et al. RBFOX1 and RBFOX3 mutations in rolandic epilepsy. PLoS One. 2013, 8, e73323. [Google Scholar] [CrossRef]
- Bobbili, D.R.; Lal, D.; May, P.; Reinthaler, E.M.; Jabbari, K.; Thiele, H.; Nothnagel, M.; Jurkowski, W.; Feucht, M.; Nürnberg, P.; et al. Exome-wide analysis of mutational burden in patients with typical and atypical Rolandic epilepsy. Eur. J. Hum. Genet. 2018, 26, 258–264. [Google Scholar] [CrossRef]
- Numis, A.L.; da Gente, G.; Sherr, E.H.; Glass, H.C. Whole-exome sequencing with targeted analysis and epilepsy after acute symptomatic neonatal seizures. Pediatr. Res. 2022, 91, 896–902. [Google Scholar] [CrossRef] [PubMed]
- Al-Abdulla, N.A.; Martin, L.J. Apoptosis of retrogradely degenerating neurons occurs in association with the accumulation of perikaryal mitochondria and oxidative damage to the nucleus. Am. J. Pathol. 1998, 153, 447–456. [Google Scholar] [PubMed]
- Martin, L.J.; Brambrink, A.M.; Price, A.C.; Kaiser, A.; Agnew, D.M.; Ichord, R.N.; Traystman, R.J. Neuronal death in newborn striatum after hypoxia-ischemia is necrosis and evolves with oxidative stress. Neurobiol. Dis. 2000, 7, 169–191. [Google Scholar]
- Salinas-Zeballos, M.E.; Zeballos, G.A.; Gootman, P.M. A stereotaxic atlas of the developing swine (Sus scrofa) forebrain. In, Swine in biomedical research, Tumbleson ME, editor, Plenum Press, New York, USA, 1986, pp. 887–906.
- Rose, V.C.; Shaffner, D.H.; Gleason, C.A.; Koehler, R.C.; Traystman, R.J. Somatosensory evoked potential and brain water content in post-asphyxic immature piglets. Pediatr. Res. 1995, 37, 661–6. [Google Scholar] [CrossRef] [PubMed]
- Martin, L.J.; Kaiser, A.; Price, A.C. Motor neuron degeneration after sciatic nerve avulsion in adult rat evolves with oxidative stress and is apoptosis. J. Neurobiol. 1999, 40, 185–201. [Google Scholar] [CrossRef]
- Natale, J.E.; Cheng, Y.; Martin, L.J. Thalamic neuron apoptosis emerges rapidly after cortical damage in immature mice. Neuroscience. 2002, 112, 665–676. [Google Scholar] [CrossRef]
- Mesulam, M.M. Tetramethyl benzidine for horseradish peroxidase neurohistochemistry: a non-carcinogenic blue reaction product with superior sensitivity for visualizing neural afferents and efferents. J. Histochem. Cytochem. 1978, 26, 106–17. [Google Scholar] [CrossRef]
- Lee, J.K.; Santos, P.T.; Chen, M.W.; et al. Combining hypothermia and oleuropein subacutely protects subcortical white matter in a swine model of neonatal hypoxic-ischemic encephalopathy. J. Neuropathol. Exp. Neurol. 2021, 80, 182–198. [Google Scholar] [CrossRef]
- El Demerdash, N.; Chen, M.W.; O'Brien, C.E.; et al. Oleuropein activates neonatal neocortical proteasomes, but proteasome gene targeting by AAV9 is variable in a clinically relevant piglet model of brain hypoxia-ischemia and hypothermia. Cells. 2021, 10. [Google Scholar] [CrossRef]
- Chen, M.W.; Santos, P.; Kulikowicz, E.; Koehler, R.C.; Lee, J.K.; Martin, L.J. Targeting the mitochondrial permeability transition pore for neuroprotection in a piglet model of neonatal hypoxic-ischemic encephalopathy. J. Neurosci. Res. 2021, 99, 1550–1564. [Google Scholar] [CrossRef]
- Dudgeon, D.L.; Randall, P.A.; Hill, R.B.; McAfee, J.G. Mild hypothermia: its effect on cardiac output and regional perfusion in the neonatal piglet. J. Pediatr. Surg. 1980, 15, 805–10. [Google Scholar] [CrossRef] [PubMed]
- Busija, D.W.; Leffler, C.W. Hypothermia reduces cerebral metabolic rate and cerebral blood flow in newborn pigs. Am. J. Physiol. 1987, 253(4 Pt 2) Pt 2, H869–73. [Google Scholar] [CrossRef]
- Laptook, A.R.; Corbett, R.J.; Sterett, R.; Burns, D.K.; Tollefsbol, G.; Garcia, D. Modest hypothermia provides partial neuroprotection for ischemic neonatal brain. Pediatr. Res. 1994, 35(4 Pt 1) Pt 1, 436–42. [Google Scholar] [CrossRef]
- Carrasco, M.; Perin, J.; Jennings, J.M.; et al. Cerebral autoregulation and conventional and diffusion tensor imaging magnetic resonance imaging in neonatal hypoxic-ischemic encephalopathy. Pediatr. Neurol. 2018, 82, 36–43. [Google Scholar] [CrossRef] [PubMed]
- Gilmore, M.M.; Tekes, A.; Perin, J.; et al. Later cooling within 6 h and temperatures outside 33-34 degrees C are not associated with dysfunctional autoregulation during hypothermia for neonatal encephalopathy. Pediatr. Res. 2021, 89, 223–230. [Google Scholar] [CrossRef] [PubMed]
- Wylie, T.; Sandhu, D.S.; Murr, N. Status epilepticus. In, StatPearls [Internet]. Treasure Island, Florida, StatPearls Publishing, 2022.
- Endisch, C.; Westhall, E.; Kenda, M.; Streitberger, K.J.; Kirkegaard, H.; Stenzel, W.; Storm, C.; Ploner, C.J.; Cronberg, T.; Friberg, H.; Englund, E.; Leithner, C. Hypoxic-ischemic encephalopathy evaluated by brain autopsy and neuroprognostication after cardiac arrest. JAMA Neurol. 2020, 77, 1430–1439. [Google Scholar] [CrossRef]
- O'Brien, C.E.; Santos, P.T.; Kulikowicz, E.; et al. Hypoxia-ischemia and hypothermia independently and interactively affect neuronal pathology in neonatal piglets with short-term recovery. Dev. Neurosci. 2019, 41, 17–33. [Google Scholar] [CrossRef]
- Liu, D.; Jiang, D.; Tekes, A.; Kulikowicz, E.; Martin, L.J.; Lee, J.K.; Liu, P.; Qin, Q. Multi-parametric evaluation of cerebral hemodynamics in neonatal piglets using non-contrast-enhanced magnetic resonance imaging methods. J. Magn. Reason. Imaging. 2021, 54, 1053–1065. [Google Scholar] [CrossRef]
- Martin, L.J. Neuronal cell death in nervous system development, disease, and injury. Int J. Mol. Med. 2001, 7, 455–478. [Google Scholar] [CrossRef]
- Agnew, D.M.; Koehler, R.C.; Guerguerian, A.M.; Shaffner, D.H.; Traystman, R.J.; Martin, L.J.; Ichord, R.N. Hypothermia for 24 hours after asphyxic cardiac arrest in piglets provides striatal neuroprotection that is sustained 10 days after rewarming. Pediatr. Res. 2003, 54, 1–10. [Google Scholar] [CrossRef]
- Mueller-Burke, D.; Koehler, R.C.; Martin, L.J. Rapid NMDA receptor phosphorylation and oxidative stress precede striatal neurodegeneration after hypoxic ischemia in newborn piglets and are attenuated with hypothermia. Int. J. Devl. Neurosci. 2008, 26, 67–76. [Google Scholar] [CrossRef]
- Martin, L.J.; Al-Abdulla, N.A.; Brambrink, A.M.; Kirsch, J.R.; Sieber, F.E.; Portera-Cailliau, C. Neurodegeneration in excitotoxicity, global cerebral ischemia, and target deprivation: a perspective on the contributions of apoptosis and necrosis. Brain Res. Bull. 1998, 46, 281–309. [Google Scholar] [CrossRef]
- Ingvar, M.; Morgan, P.F.; Auer, R.N. The nature and timing of excitotoxic neuronal necrosis in the cerebral cortex, hippocampus and thalamus due to flurothyl-induced status epilepticus. Acta Neuropathol. 1988, 75, 362–9. [Google Scholar] [CrossRef] [PubMed]
- Rubleva, E.Y.; Savulev, Y.I.; Pylaev, A.S. Comparative electron microscopic and autoradiographic studies of "dark" and "light" neurons of the cerebral cortex. Neurosci. Behav. Physiol. 1980, 10, 5–9. [Google Scholar] [CrossRef] [PubMed]
- Martin, L.J.; Doebler, J.A.; Anthony, A. Cytophotometric analysis of neuronal chromatin and RNA changes in oxotremorine-treated rats. Proc. Soc. Exp. Biol. Med. 1986, 181, 41–48. [Google Scholar] [CrossRef]
- Martin, L.J.; Brambrink, A.M.; Lehmann, C.; Portera-Cailliau, C.; Koehler, R.; Rothstein, J.; Traystman, R.J. Hypoxia-ischemia causes abnormalities in glutamate transporters and death of astroglia and neurons in newborn striatum. Ann. Neurol. 1997, 42, 335–348. [Google Scholar] [CrossRef] [PubMed]
- Martin, L.J.; Katzenelson, A.; Koehler, R.C.; Chang, Q. The olfactory bulb in newborn piglet is a reservoir of neural stem and progenitor cells. PLoS One. 2013, 8, e81105. [Google Scholar] [CrossRef]
- Lee, J.K.; Wang, B.; Reyes, M.; et al. Hypothermia and rewarming activate a macroglial unfolded protein response independent of hypoxic-ischemic brain injury in neonatal piglets. Dev. Neurosci. 2016, 38, 277–294. [Google Scholar] [CrossRef]
- Lee, J.K.; Liu, D.; Jiang, D.; et al. Fractional anisotropy from diffusion tensor imaging correlates with acute astrocyte and myelin swelling in neonatal swine models of excitotoxic and hypoxic-ischemic brain injury. J. Comp. Neurol. 2021, 529, 2750–2770. [Google Scholar] [CrossRef]
- Martin, L.J. p53 is abnormally elevated and active in the CNS of patients with amyotrophic lateral sclerosis. Neurobiol. Dis. 2000, 7, 613–622. [Google Scholar] [CrossRef]
- Martin, L.J.; Price, A.C.; McClendon, K.B.; Al-Abdulla, N.A.; Subramaniam, J.R.; Wong, P.C.; Liu, Z. Early events of target deprivation/axotomy-induced neuronal apoptosis in vivo: oxidative stress, DNA damage, p53 phosphorylation and subcellular redistribution of death proteins. J. Neurochem. 2003, 85, 234–247. [Google Scholar] [CrossRef] [PubMed]
- von Economo, C.; Koskinas, G.N. Atlas of cytoarchitectonics of the adult human cerebral cortex. Triarhou LC, editor and translator, 1926, 182 pp.
- Zilles, K.; Amunts, K. Centenary of Brodmann's map--conception and fate. Nat. Rev. Neurosci. 2010, 11, 139–45. [Google Scholar] [CrossRef] [PubMed]
- Elston, G.N.; Garey, L.J. The cytoarchitectonic map of Korbinian Brodmann: arealisation and circuit specialization. In: Geyer S, Turner R, editors. Microstructural parcellation of the human cerebral cortex. Springer, Berlin, Heidelberg. 2013. [Google Scholar] [CrossRef]
- Adrian, E.D. Afferent areas in the brain of ungulates. Brain. 1943, 66, 89–103. [Google Scholar] [CrossRef]
- Sauleau, P.; Lapouble, E.; Val-Laillet, D.; Malbert, C.H. The pig model in brain imaging and neurosurgery. Animal. 2009, 3, 1138–51. [Google Scholar] [CrossRef]
- Martin, L.J. DNA methylation in motor neuron biology and epigeneticopathy in ALS. In, Handbook of Clinical Neurology, Szyf M, editor, 2023, Elsevier.
- Mullen, R.J.; Buck, C.R.; Smith, A.M. NeuN, a neuronal specific nuclear protein in vertebrates. Development. 1992, 116, 201–11. [Google Scholar] [CrossRef]
- Rutherford, M.A.; Azzopardi, D.; Whitelaw, A.; Cowan, F.; Renowden, S.; Edwards, A.D.; Thoresen, M. Mild hypothermia and the distribution of cerebral lesions in neonates with hypoxic-ischemic encephalopathy. Pediatrics. 2005, 116, 1001–6. [Google Scholar] [CrossRef]
- Krieg, W.J. Connections of the cerebral cortex; the albino rat; topography of cortical areas. J. Comp. Neurol. 1946, 84, 221–275. [Google Scholar] [CrossRef]
- Minervini, S.; Accogli, G.; Pirone, A.; Graïc, J.M.; Cozzi, B.; Desantis, S. Brain mass and encephalization quotients in the domestic industrial pig (Sus scrofa). PLoS One. 2016, 11, e0157378. [Google Scholar] [CrossRef]
- White, L.E.; Andrews, T.J.; Hulette, C.; Richards, A.; Groelle, M.; Paydarfar, J.; Purves, D. Structure of the human sensorimotor system. I: Morphology and cytoarchitecture of the central sulcus. Cereb. Cortex. [CrossRef]
- Martin, L.J.; Adams, D.A.; Niedzwiecki, M.V.; Wong, M. Aberrant DNA and RNA methylation occur in spinal cord and skeletal muscle of human SOD1 mouse models of ALS and in human ALS: targeting DNA methylation is therapeutic. Cells. 2022, 11, 3448. [Google Scholar] [CrossRef]
- Craner, S.L.; Ray, R.H. Somatosensory cortex of the neonatal pig: I. Topographic organization of the primary somatosensory cortex (SI). J. Comp. Neurol. 1991; 306, 24–38. [Google Scholar] [CrossRef]
- Bernard, P.B.; Benke, T.A. Early life seizures: evidence for chronic deficits linked to autism and intellectual disability across species and models. Exp. Neurol. 2015, 263, 72–78. [Google Scholar]
- Cornejo, B.J.; Mesches, M.H.; Coultrap, S.; Browning, M.D.; Benke, T.A. A single episode of neonatal seizures permanently alters glutamatergic synapses. Ann. Neurol. 2007, 61, 411–426. [Google Scholar] [CrossRef] [PubMed]
- Lin, Y.K.; Hwang-Bo, S.; Seo, Y.M.; Youn, Y.A. Clinical seizures and unfavorable brain MRI patterns in neonates with hypoxic ischemic encephalopathy. Medicine (Baltimore). 2021, 100, e25118. [Google Scholar] [CrossRef]
- Defelipe, J. The evolution of the brain, the human nature of cortical circuits, and intellectual creativity. Front. Neuroanat. 2011, 16, 5. [Google Scholar] [CrossRef] [PubMed]
- Gunn, A.J.; Gunn, T.R.; de Haan, H.H.; Williams, C.E.; Gluckman, P.D. Dramatic neuronal rescue with prolonged selective head cooling after ischemia in fetal lambs. J. Clin. Invest. 1997, 99, 248–56. [Google Scholar] [CrossRef] [PubMed]
- Drury, P.P.; Davidson, J.O.; van den Heuij, L.G.; Wassink, G.; Gunn, E.R.; Booth, L.C.; Bennet, L.; Gunn, A.J. Status epilepticus after prolonged umbilical cord occlusion is associated with greater neural injury in fetal sheep at term-equivalent. PLoS One. 2014, 9, e96530. [Google Scholar] [CrossRef]
- Beaulieu-Laroche, L.; Brown, N.J.; Hansen, M.; Toloza, E.H.S.; Sharma, J.; Williams, Z.M.; Frosch, M.P.; Cosgrove, G.R.; Cash, S.S.; Harnett, M.T. Allometric rules for mammalian cortical layer 5 neuron biophysics. Nature. 2021, 600. 274-278. [CrossRef]
- Gailus, B.; Naundorf, H.; Welzel, L.; et al. Long-term outcome in a noninvasive rat model of birth asphyxia with neonatal seizures: Cognitive impairment, anxiety, epilepsy, and structural brain alterations. Epilepsia. 2021, 62, 2826–2844. [Google Scholar] [CrossRef]
- Wagley, P.K.; Williamson, J.; Skwarzynska, D.; Kapur, J.; Burnsed, J. Continuous Video Electroencephalogram during hypoxia-ischemia in neonatal mice. J. Vis. Exp. 2020, 160. [Google Scholar]
- Rensing, N.; Moy, B.; Friedman, J.L.; Galindo, R.; Wong, M. Longitudinal analysis of developmental changes in electroencephalography patterns and sleep-wake states of the neonatal mouse. PLoS One. 2018, 13, e0207031. [Google Scholar] [CrossRef]
- Pirzada, N. The ethical dilemma of non-human primate use in biomedical research. Voices in Bioethics. 2022, 8. [Google Scholar] [CrossRef]
- Martin, L.J.; Spicer, D.M.; Lewis, M.H.; Gluck, J.P.; Cork, L.C. Social deprivation of infant rhesus monkeys alters the chemoarchitecture of the brain: I. Subcortical regions. J. Neurosci. 1991, 11, 3344–58. [Google Scholar] [CrossRef]
- Martin, L.J. , Cork, L.C. The non-human primate striatum undergoes marked prolonged remodeling during postnatal development. Front. Cell. Neurosci. 2014, 8, 294. [Google Scholar] [CrossRef] [PubMed]
- Singh, R.; Kulikowicz, E.; Santos, P.T.; Koehler, R.C.; Martin, L.J.; Lee, J.K. Spatial T-maze identifies cognitive deficits in piglets 1 month after hypoxia-ischemia in a model of hippocampal pyramidal neuron loss and interneuron attrition. Behav. Brain Res. 2019, 369, 111921. [Google Scholar] [CrossRef] [PubMed]
- Hunt, R.W.; Liley, H.G.; Wagh, D.; Schembri, R.; Lee, K.J.; Shearman, A.D.; Francis-Pester, S.; deWaal, K.; Cheong, J.Y.L. ; Olischar. M.; et al. Newborn electrographic seizure trial investigators. Effect of treatment of clinical seizures vs electrographic seizures in full-term and near-term neonates: A randomized clinical trial. JAMA Netw. Open. 2021, 4, e2139604. [Google Scholar] [CrossRef]
- Sun, H.; Juul, H.M.; Jensen, F.E. Models of hypoxia and ischemia-induced seizures. J. Neurosci. Methods. 2016, 260, 252–260. [Google Scholar] [CrossRef] [PubMed]
- Glass, H.C.; Nash, K.B.; Bonifacio, S.L.; et al. Seizures and magnetic resonance imaging-detected brain injury in newborns cooled for hypoxic-ischemic encephalopathy. J. Pediatr. 2011, 159, 731-735.e731.
- Lee, J.K.; Perin, J.; Parkinson, C.; O'Connor, M.; Gilmore, M.M.; Reyes, M.; Armstrong, J.; Jennings, J.M.; Northington, F.J.; Chavez-Valdez, R. Relationships between cerebral autoregulation and markers of kidney and liver injury in neonatal encephalopathy and therapeutic hypothermia. J. Perinatol. 2017, 37, 938–942. [Google Scholar] [CrossRef] [PubMed]
- Mallet, M.L. Pathophysiology of accidental hypothermia. QJM. 2002, 95, 775–785. [Google Scholar] [CrossRef]
- Escalda, A.; Marques, M.; Silva-Carvalho, L.; et al. Hypothermia-induced haemostatic and biochemical phenomena. An experimental model. Platelets. 1993, 4, 17–22. [Google Scholar] [CrossRef] [PubMed]
- Lee, I.C.; Yang, J.J.; Liou, Y.M. Early blood glucose level post-admission correlates with the outcomes and oxidative stress in neonatal hypoxic-ischemic encephalopathy. Antioxidants (Basel). 2021, 11. [Google Scholar] [CrossRef]
- Thornton, P.S.; Stanley, C.A.; De Leon, D.D.; et al. Recommendations from the pediatric endocrine society for evaluation and management of persistent hypoglycemia in neonates, infants, and children. J. Pediatr. 2015, 167, 238–245. [Google Scholar] [CrossRef] [PubMed]
- Nakajima, W.; Ishida, A.; Lange, M.S.; Gabrielson, K.L.; Wilson, M.A.; Martin, L.J.; Blue, M.E.; Johnston, M.V. Apoptosis has a prolonged role in the neurodegeneration after hypoxic ischemia in the newborn rat. J. Neurosci. 2000, 20, 7994–8004. [Google Scholar] [CrossRef] [PubMed]
- Northington, F.J.; Ferriero, D.M.; Graham, E.M.; Traystman, R.J.; Martin, L.J. Early neurodegeneration after hypoxia-ischemia in neonatal rat is necrosis while delayed neuronal death is apoptosis. Neurobiol. Dis. 2001, 8, 207–219. [Google Scholar] [CrossRef]
- Steinman, K.J.; Gorno-Tempini, M.L.; Glidden, D.V.; Kramer, J.H.; Miller, S.P.; Barkovich, A.J.; Ferriero, D.M. Neonatal watershed brain injury on magnetic resonance imaging correlates with verbal IQ at 4 years. Pediatrics. 2009, 123, 1025–30. [Google Scholar] [CrossRef] [PubMed]
- Kringelbach, M.L.; Rolls, E.T. The functional neuroanatomy of the human orbitofrontal cortex: evidence from neuroimaging and neuropsychology. Prog. Neurobiol. 2004, 72, 341–72. [Google Scholar] [CrossRef] [PubMed]
- Wikenheiser, A.M.; Schoenbaum, G. Over the river, through the woods: cognitive maps in the hippocampus and orbitofrontal cortex. Nat. Rev. Neurosci. 2016, 17, 513–23. [Google Scholar] [CrossRef] [PubMed]
- Fettes, P.W.; Moayedi, M.; Dunlop, K.; Mansouri, F.; Vila-Rodriguez, F.; Giacobbe, P.; Davis, K.D.; Lam, R.W.; Kennedy, S.H.; Daskalakis, Z.J.; Blumberger, D.M.; Downar, J. Abnormal functional connectivity of frontopolar subregions in treatment-nonresponsive major depressive disorder. Biol. Psychiatry Cogn. Neurosci. Neuroimaging. 2018, 3, 337–347. [Google Scholar] [CrossRef]
- Akbarian, S.; Grüsser, O.J.; Guldin, W.O. Corticofugal connections between the cerebral cortex and brainstem vestibular nuclei in the macaque monkey. J. Comp. Neurol. 1994, 339, 421–37. [Google Scholar] [CrossRef]
- Sherrington, C.S. The integrative actions of the nervous system. Yale University Press, 1906, New Haven, CT.
- Sukoff, M.H.; Ragatz, R.E. Cerebellar stimulation for chronic extensor-flexor rigidity and opisthotonus secondary to hypoxia. Report of two cases. J. Neurosurg. 1980, 53, 391–6. [Google Scholar] [CrossRef]
- Stitt, I.M.; Wellings, T.P.; Drury, H.R.; Jobling, P.; Callister, R.J.; Brichta, A.M.; Lim, R. Properties of Deiters' neurons and inhibitory synaptic transmission in the mouse lateral vestibular nucleus. J. Neurophysiol. 2022, 128, 131–147. [Google Scholar] [CrossRef]
- Armstrong, D.M. The supraspinal control of mammalian locomotion. J. Physiol. 1988, 405, 1–37. [Google Scholar] [CrossRef]
- Wilson, V.J.; Zarzecki, P.; Schor. R.H.; Isu, N.; Rose, P.K.; Sato, H.; Thomson, D.B.; Umezaki, T. Cortical influences on the vestibular nuclei of the cat. Exp. Brain Res. 1999, 125, 1–13. [Google Scholar] [CrossRef]
- Pavlidis, E.; Cantalupo, G.; Cattani, L.; Tassinari, C.A.; Pisani, F. Neonatal seizure automatism and human inborn pattern of quadrupedal locomotion. Gait Posture. 2016, 49, 232–234. [Google Scholar] [CrossRef]
- Silvestri, R.; Walters, A.S. Rhythmic movements in sleep disorders and in epileptic seizures during sleep. Sleep Science Practice. 2020, 4, 5. [Google Scholar] [CrossRef]
- Connors, B.W.; Pinto, D.J.; Telfeian, A.E. Local pathways of seizure propagation in neocortex. Int. Rev. Neurobiol. 2001, 45, 527–46. [Google Scholar] [CrossRef] [PubMed]
- Schmidt, E.R.E.; Zhao, H.T.; Park, J.M.; Dipoppa, M.; Monsalve-Mercado, M.M.; Dahan, J.B.; Rodgers, C.C.; Lejeune, A.; Hillman, E.M.C.; Miller, K.D.; Bruno, R.M.; Polleux, F. A human-specific modifier of cortical connectivity and circuit function. Nature. 2021, 599, 640–644. [Google Scholar] [CrossRef] [PubMed]
- Multani, P.; Myers, R.H.; Blume, H.W.; Schomer, D.L.; Sotrel, A. Neocortical dendritic pathology in human partial epilepsy: a quantitative Golgi study. Epilepsia. 1994, 35, 728–36. [Google Scholar] [CrossRef]
- Du, F.; Eid, T.; Lothman, E.W.; Köhler, C.; Schwarcz, R. Preferential neuronal loss in layer III of the medial entorhinal cortex in rat models of temporal lobe epilepsy. J. Neurosci. 1995, 15, 6301–13. [Google Scholar] [CrossRef]
- Pfisterer, U.; Petukhov, V.; Demharter, S.; Meichsner, J.; Thompson, J.J.; Batiuk, M.Y.; Asenjo-Martinez, A.; Vasistha, N.A.; Thakur, A.; Mikkelsen, J. , et al. Identification of epilepsy-associated neuronal subtypes and gene expression underlying epileptogenesis. Nat. Commun. 2020, 11, 5038. [Google Scholar] [CrossRef]
- Zhu, J.; Wang, B.; Lee, J.H.; Armstrong, J.S.; Kulikowicz, E.; Bhalala, U.S.; Martin, L.J.; Koehler, R.C.; Yang, Z.J. Additive neuroprotection of a 20-HETE inhibitor with delayed therapeutic hypothermia after hypoxia-ischemia in neonatal piglets. Dev. Neurosci. 2015, 37, 376–389. [Google Scholar] [CrossRef]
- Martin, L.J. Mitochondrial and cell death mechanisms in neurodegenerative diseases. Pharmaceuticals (Basel). 2010, 3, 839–915. [Google Scholar] [CrossRef]
- Martin, L.J; Chen, K.; Liu, Z. Adult motor neuron apoptosis is mediated by nitric oxide and Fas death receptor linked by DNA damage and p53 activation. J. Neurosci. 2005, 25, 6449–59. [Google Scholar] [CrossRef]
- Martin, L.J.; Gertz, B.; Pan, Y.; Price, A.C.; Molkentin, J.D.; Chang, Q. The mitochondrial permeability transition pore in motor neurons: involvement in the pathobiology of ALS mice. Exp. Neurol. 2009, 218, 333–46. [Google Scholar] [CrossRef]
- Martin, L.J.; Fancelli, D.; Wong, M.; Niedzwiecki, M.; Ballarini, M.; Plyte, S.; Chang, Q. GNX-4728, a novel small molecule drug inhibitor of mitochondrial permeability transition, is therapeutic in a mouse model of amyotrophic lateral sclerosis. Front. Cell. Neurosci. 2014, 8, 433. [Google Scholar] [CrossRef]
- Kim, K.K.; Adelstein, R.S.; Kawamoto, S. Identification of neuronal nuclei (NeuN) as Fox-3, a new member of the Fox-1 gene family of splicing factors. J. Biol. Chem. 2009, 284, 31052–61. [Google Scholar] [CrossRef] [PubMed]
- Salamon, I.; Rasin, M.R. Evolution of the neocortex through RNA-binding proteins and post-transcriptional regulation. Front. Neurosci. 2022; 10, 803107. [Google Scholar] [CrossRef]
- Dent, M.A.; Segura-Anaya, E.; Alva-Medina, J.; Aranda-Anzaldo, A. NeuN/Fox-3 is an intrinsic component of the neuronal nuclear matrix. FEBS Lett. 2010, 584, 2767–71. [Google Scholar] [CrossRef]
- Duan, W.; Zhang, Y.P.; Hou, Z.; Huang, C.; Zhu, H.; Zhang, C.Q.; Yin, Q. Novel Insights into NeuN: from Neuronal Marker to Splicing Regulator. Mol. Neurobiol. 2016, 53, 1637–1647. [Google Scholar] [CrossRef] [PubMed]
- Fogel, B.L.; Wexler, E.; Wahnich, A.; Friedrich, T.; Vijayendran, C.; Gao, F.; Parikshak, N.; Konopka, G.; Geschwind, D.H. RBFOX1 regulates both splicing and transcriptional networks in human neuronal development. Hum. Mol. Genet. 2012, 21, 4171–86. [Google Scholar] [CrossRef] [PubMed]
- Utami, K.H.; Hillmer, A.M.; Aksoy, I.; Chew, E.G.; Teo, A.S.; Zhang, Z.; Lee, C.W.; Chen, P.J.; Seng, C.C.; Ariyaratne, P.N.; et al. Detection of chromosomal breakpoints in patients with developmental delay and speech disorders. PLoS One. 2014, 9, e90852. [Google Scholar] [CrossRef] [PubMed]
- Turner, S.J.; Morgan, A.T.; Perez, E.R.; Scheffer, I.E. New genes for focal epilepsies with speech and language disorders. Curr. Neurol. Neurosci. Rep. 2015, 15, 35. [Google Scholar] [CrossRef]
- Wang, H.Y.; Hsieh, P.F.; Huang, D.F.; Chin, P.S.; Chou, C.H.; Tung, C.C.; Chen, S.Y.; Lee, L.J.; Gau, S.S.; Huang, H.S. RBFOX3/NeuN is required for hippocampal circuit balance and function. Sci. Rep. 2015, 5, 17383. [Google Scholar] [CrossRef]
- Huang, D.F.; Lee, C.Y.; Chou, M.Y.; Yang, T.Y.; Cao, X.; Hsiao, Y.H.; Wu, R.N.; Lien, C.C.; Huang, Y.S.; Huang, H.P.; Gau, S.S.; Huang, H.S. Neuronal splicing regulator RBFOX3 mediates seizures via regulating Vamp1 expression preferentially in NPY-expressing GABAergic neurons. Proc. Natl. Acad. Sci. USA. 2022, 119, e2203632119. [Google Scholar] [CrossRef]
- Jacko, M.; Weyn-Vanhentenryck, S.M.; Smerdon, J.W.; Yan, R.; Feng, H.; Williams, D.J.; Pai, J.; Xu, K.; Wichterle, H.; Zhang, C. Rbfox splicing factors promote neuronal maturation and axon initial segment assembly. Neuron. 2018, 97, 853-868.e6. [CrossRef]
- Maxeiner, S.; Glassmann, A.; Kao, H.T.; Schilling, K. The molecular basis of the specificity and cross-reactivity of the NeuN epitope of the neuron-specific splicing regulator, Rbfox3. Histochem. Cell Biol. 2014, 141, 43–55. [Google Scholar] [CrossRef]
- Dredge, B.K.; Jensen, K.B. NeuN/Rbfox3 nuclear and cytoplasmic isoforms differentially regulate alternative splicing and nonsense-mediated decay of Rbfox2. PLoS One. 2011, 6, e21585. [Google Scholar] [CrossRef] [PubMed]
- Damianov, A.; Ying, Y.; Lin, C.H.; Lee, J.A.; Tran, D.; Vashisht, A.A.; Bahrami-Samani, E.; Xing, Y.; Martin, K.C.; Wohlschlegel, J.A.; Black, D.L. Rbfox proteins regulate splicing as part of a large multiprotein complex LASR. Cell. 2016, 165, 606–19. [Google Scholar] [CrossRef] [PubMed]
- Carvill, G.L.; Engel, K.L.; Ramamurthy, A.; Cochran, J.N.; Roovers, J.; Stamberger, H.; Lim, N.; Schneider, A.L.; Hollingsworth, G. ; Holder. D.H.; et al. Aberrant inclusion of a poison exon causes Dravet syndrome and related SCN1A-associated genetic epilepsies. Am. J. Hum. Genet. 2018, 103, 1022–1029. [Google Scholar] [CrossRef]
- Halász, P.; Kelemen, A.; Rosdy, B.; Rásonyi, G.; Clemens, B.; Szűcs, A. Perisylvian epileptic network revisited. Seizure. 2019, 65, 31–41. [Google Scholar] [CrossRef] [PubMed]
Disclaimer/Publisher’s Note: The statements, opinions and data contained in all publications are solely those of the individual author(s) and contributor(s) and not of MDPI and/or the editor(s). MDPI and/or the editor(s) disclaim responsibility for any injury to people or property resulting from any ideas, methods, instructions or products referred to in the content. |
© 2023 by the authors. Licensee MDPI, Basel, Switzerland. This article is an open access article distributed under the terms and conditions of the Creative Commons Attribution (CC BY) license (http://creativecommons.org/licenses/by/4.0/).


