1. Introduction
A Fibroblast Growth Factor 23 (FGF-23) is a member of Fibroblast Growth Factors (FGF) family. These factors are produces by macrophages and are involved in a different processes connected with normal development of cells. They show mitogenic, endocrine, morphological and regulatory effects. Any irregularities in their functioning cause developmental defects [
1,
2].
The FGF-23 is produced primarily by osteocytes and osteoblasts as an inactive form. Its transformation into the active form occurs by cutting off the N-terminal fragment from the inactive molecule. The resulting "mature" FGF-23 (iFGF-23) molecule can be secreted into the blood or undergo intracellular degradation into two metabolically inactive peptides: N-terminal and C-terminal. Due to the fact that FGF-23 is released into the blood, what affects the functioning of many tissues and organs, it is called a hormone - phosphatonin [
3]. Beside FGF-23, to the group of the endocrine FGFs two other members – FGF-19 and FGF-21 – are classified [
4].
The FGF-23 is mainly responsible for maintaining the metabolic balance of phosphates and vitamin D. However, this factor is involved not only in bone metabolism, but also in iron metabolism, erythropoiesis, development of inflammatory processes, insulin resistance in tissues and left ventricular hypertrophy. In recent years, there have been more and more reports on the role of FGF-23 in acute kidney injury (AKI) [
5,
6].
FGF-23 binds to target cells via the fibroblast growth factor receptor 1 (FGFR1). However, the presence of the αKlotho protein co-receptor is also required. Together, these molecules form a ternary complex that initiates signal conduction to the target cell [
6,
7,
8].
A newly developed biosensor was used to measure the FGF-23 concentration in the blood plasma samples taken from clear cell carcinoma of the kidney (ccRCC) patients as well as taken from healthy individuals. Renal clear cell carcinoma is the most common histopathological type of renal cell carcinoma (CRC). Renal cell carcinoma (RNC) accounts for more than 90% of all renal malignancies [
7].
Two aspects decided about the development of the new SPRI biosensor for quantification of FGF- 23: a huge number of reports about the influence of FGF-23 on the functioning of the kidneys and limitation of the scientists to only two methods - ELISA or CLEIA that might be used to measure FGF-23 concentration in biological samples [
8]. Using in the ELISA, as well as in the other analytical methods, special labels may sometimes lead to false positive or negative results by interfering with the normal function of the protein they are attached to. The newly developed biosensor omits this issue and more over has one very important advantage, i.e. measurement of the FGF-23 concentration is cheaper per sample that ELISA [
9].
During the development of the FGF-23 biosensor the Surface Plasmon Resonance imaging was used as a detection technique. This technique bases on the measurements of the SPR signal that is sensitive to and changes with mass increasing what is caused by binding of the subsequent layers on the chip’s surface. In the SPRi technique the SPR signal is converted into the images that are used as a base to determine the final SPRi signal.
The SPRi method and its usefulness as a detection technique were widely described and confirmed in series of the articles (more than 20 developed SPRi biosensors) under the direction of prof. Gorodkiewicz (not all cited) [
10,
11,
12,
13,
14].
Generally, to properly perform SPRi measurements it is necessary to immobilize detected compound (in this study FGF-23) onto the chip’s surface. To do this two types of immobilization can be used. The first one bases on the antigen - antibody interaction [
13], the second one bases on antigen - inhibitor interaction [
15]. During the development of the discussed biosensor the antibody – antigen type of immobilization was used. For this purpose monoclonal, anti-human mouse antibody that bound the FGF-23 from the tested samples was used.
In the performed studies, a cysteamine was used as a linker that allowed binding the FGF-23 antibody with a bare gold. It was caused by the presence of thiol (SH-) and amine (NH2-) groups on both of the cysteamine’s ends. The thiol group interacted with the bare gold layer what created self-assembled cysteamine monolayer on the chips surface. In the further steps of the experiments, this monolayer was used to bind the FGF-23 antibody. It was caused by the interaction of the free amine group with the antibody’s carboxyl group what led to creation of a strong, covalent amide bond and allowed FGF-23 binding, finally.
In addition, αKlotho protein was added to increase the SPRi signal in the samples. This protein increased the mass of the detected FGF-23 by binding to it and therefore al-lowed for a broadering of the calibration curve’s range, which was used to determine the concentration of FGF-23.
The aim of the described work was to develop the new SPRi biosensor that can be used as a new method for quantification measurements of the FGF-23. For this purpose antigen – antibody type of immobilization was used and the analytical parameters of the biosensor were validated. Next, its usefulness was checked by comparison with the ELISA results.
2. Results
2.1. Selection of the optimal FGF-23 antibody concentration
The first step during the development of the biosensor was choosing of the optimal FGF-23 antibody’s concentration that provided the full saturation of the biosensor surface.
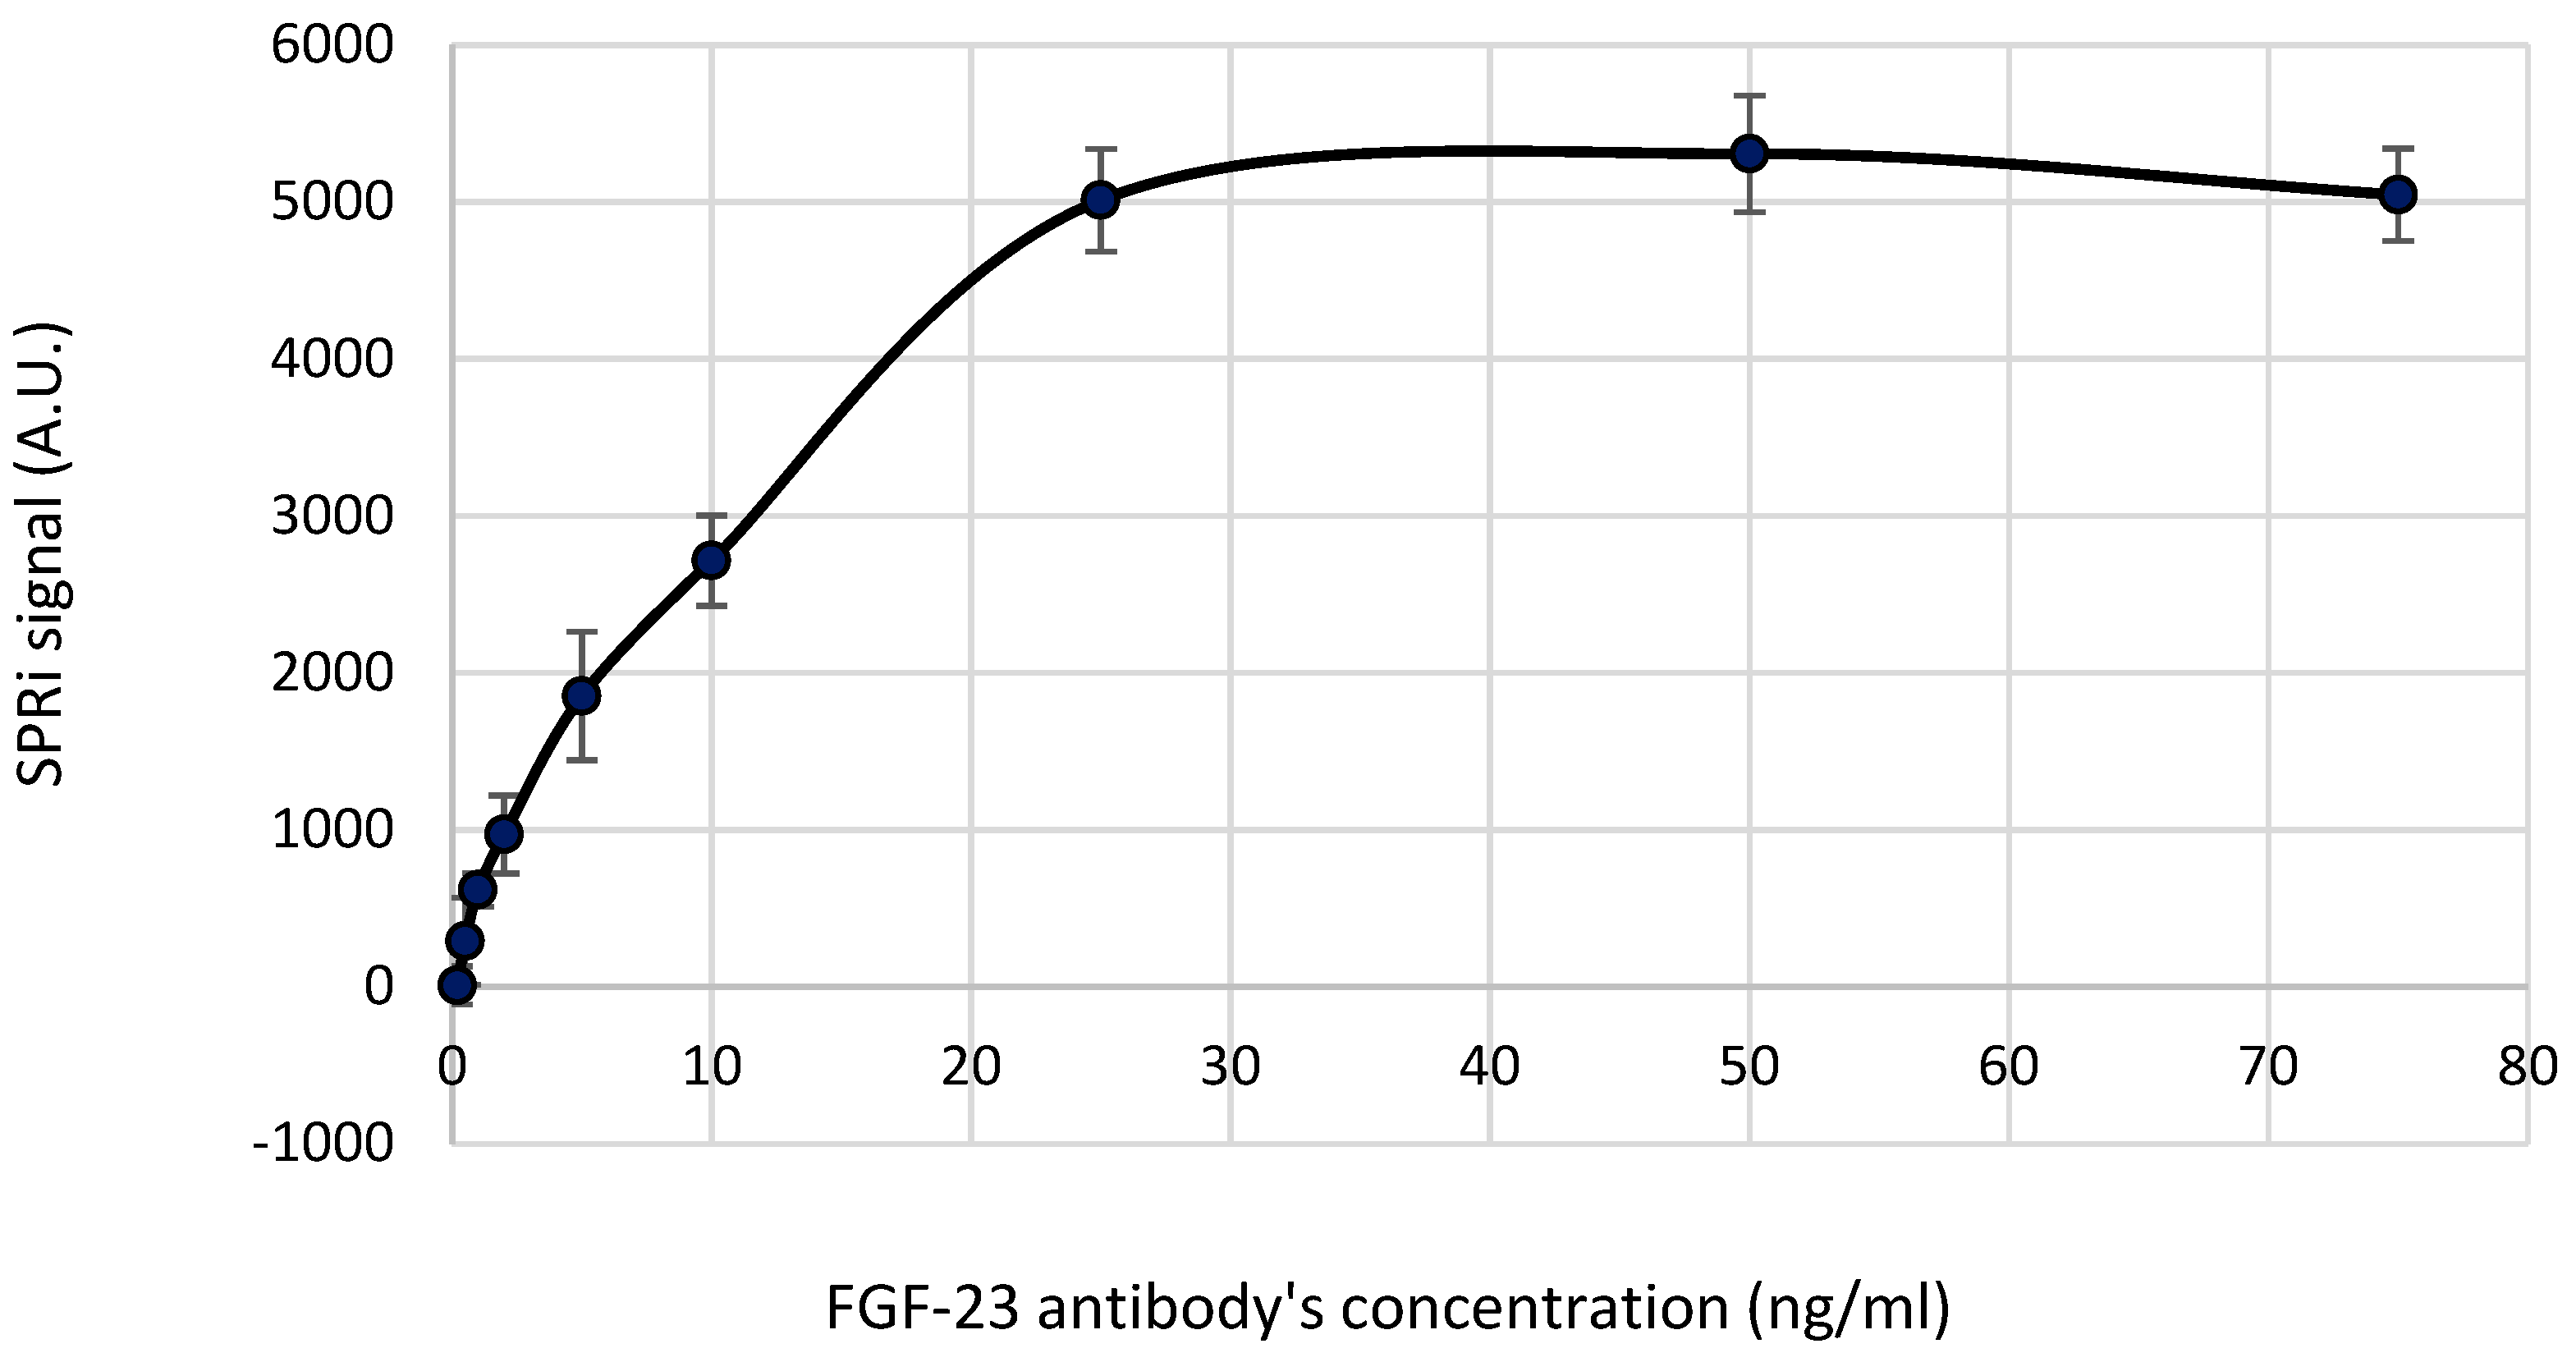
For this purpose 9 samples of different FGF-23 antibody’s concentrations prepared in a PBS buffer, i.e. 0.2; 0.5; 1.0; 2.0; 5.0; 10.0; 25.0; 50.0; 75.0 ng/ml as well as PBS sample were applied onto the chip with the cysteamine’s monolayer. The volume of the each ap-plied sample was 2.5 µl.
Such prepared chip was incubated and cleaned as it is described in paragraph 4.4. Next, onto the biosensor’s active sites, a mixture of the FGF-23 and αKlotho (40:169.2 pg/ml) were applied. A purpose of using of this mixture and a method of its selection and preparation are described in paragraph 2.3.
After 10 minutes of the antibody’s interaction with the FGF-23-αKlotho complex, the biosensor was wash 3 times by the HBS-ES buffer and 5 times by the distilled water and then dried. Afterwards, the SPRi signal for all of samples was determined.
The results of this part of the experiment are shown in
Figure 1 where a relation between SPRi signal and the concentration of FGF-23 antibody is drawn. The obtained SPRi signal was reduced by the signal of the PBS buffer.
Based on the
Figure 1 it might be noted that plateau of this curve starts from the 25 ng/ml of the FGF-23 antibody. This concentration was chosen as the optimal one where the full saturation of the chip's surface by FGF-23 antibody was observed. That is why, in the further steps of the biosensor development and during its validation, solution of the FGF-23 antibody’s equal 25 ng/ml was used.
2.2. Calibration curve – the biosensor’s response on the increasing FGF-23 concentration
Another step of the biosensor’s development was preparation of the calibration curve, i.e. the biosensor’s response on the FGF-23 concentration increasing. The linear part of this curve, where the SPRi signal increases with the FGF-23 concentration increasing was used for determination of FGF-23 concentration in the tested samples.
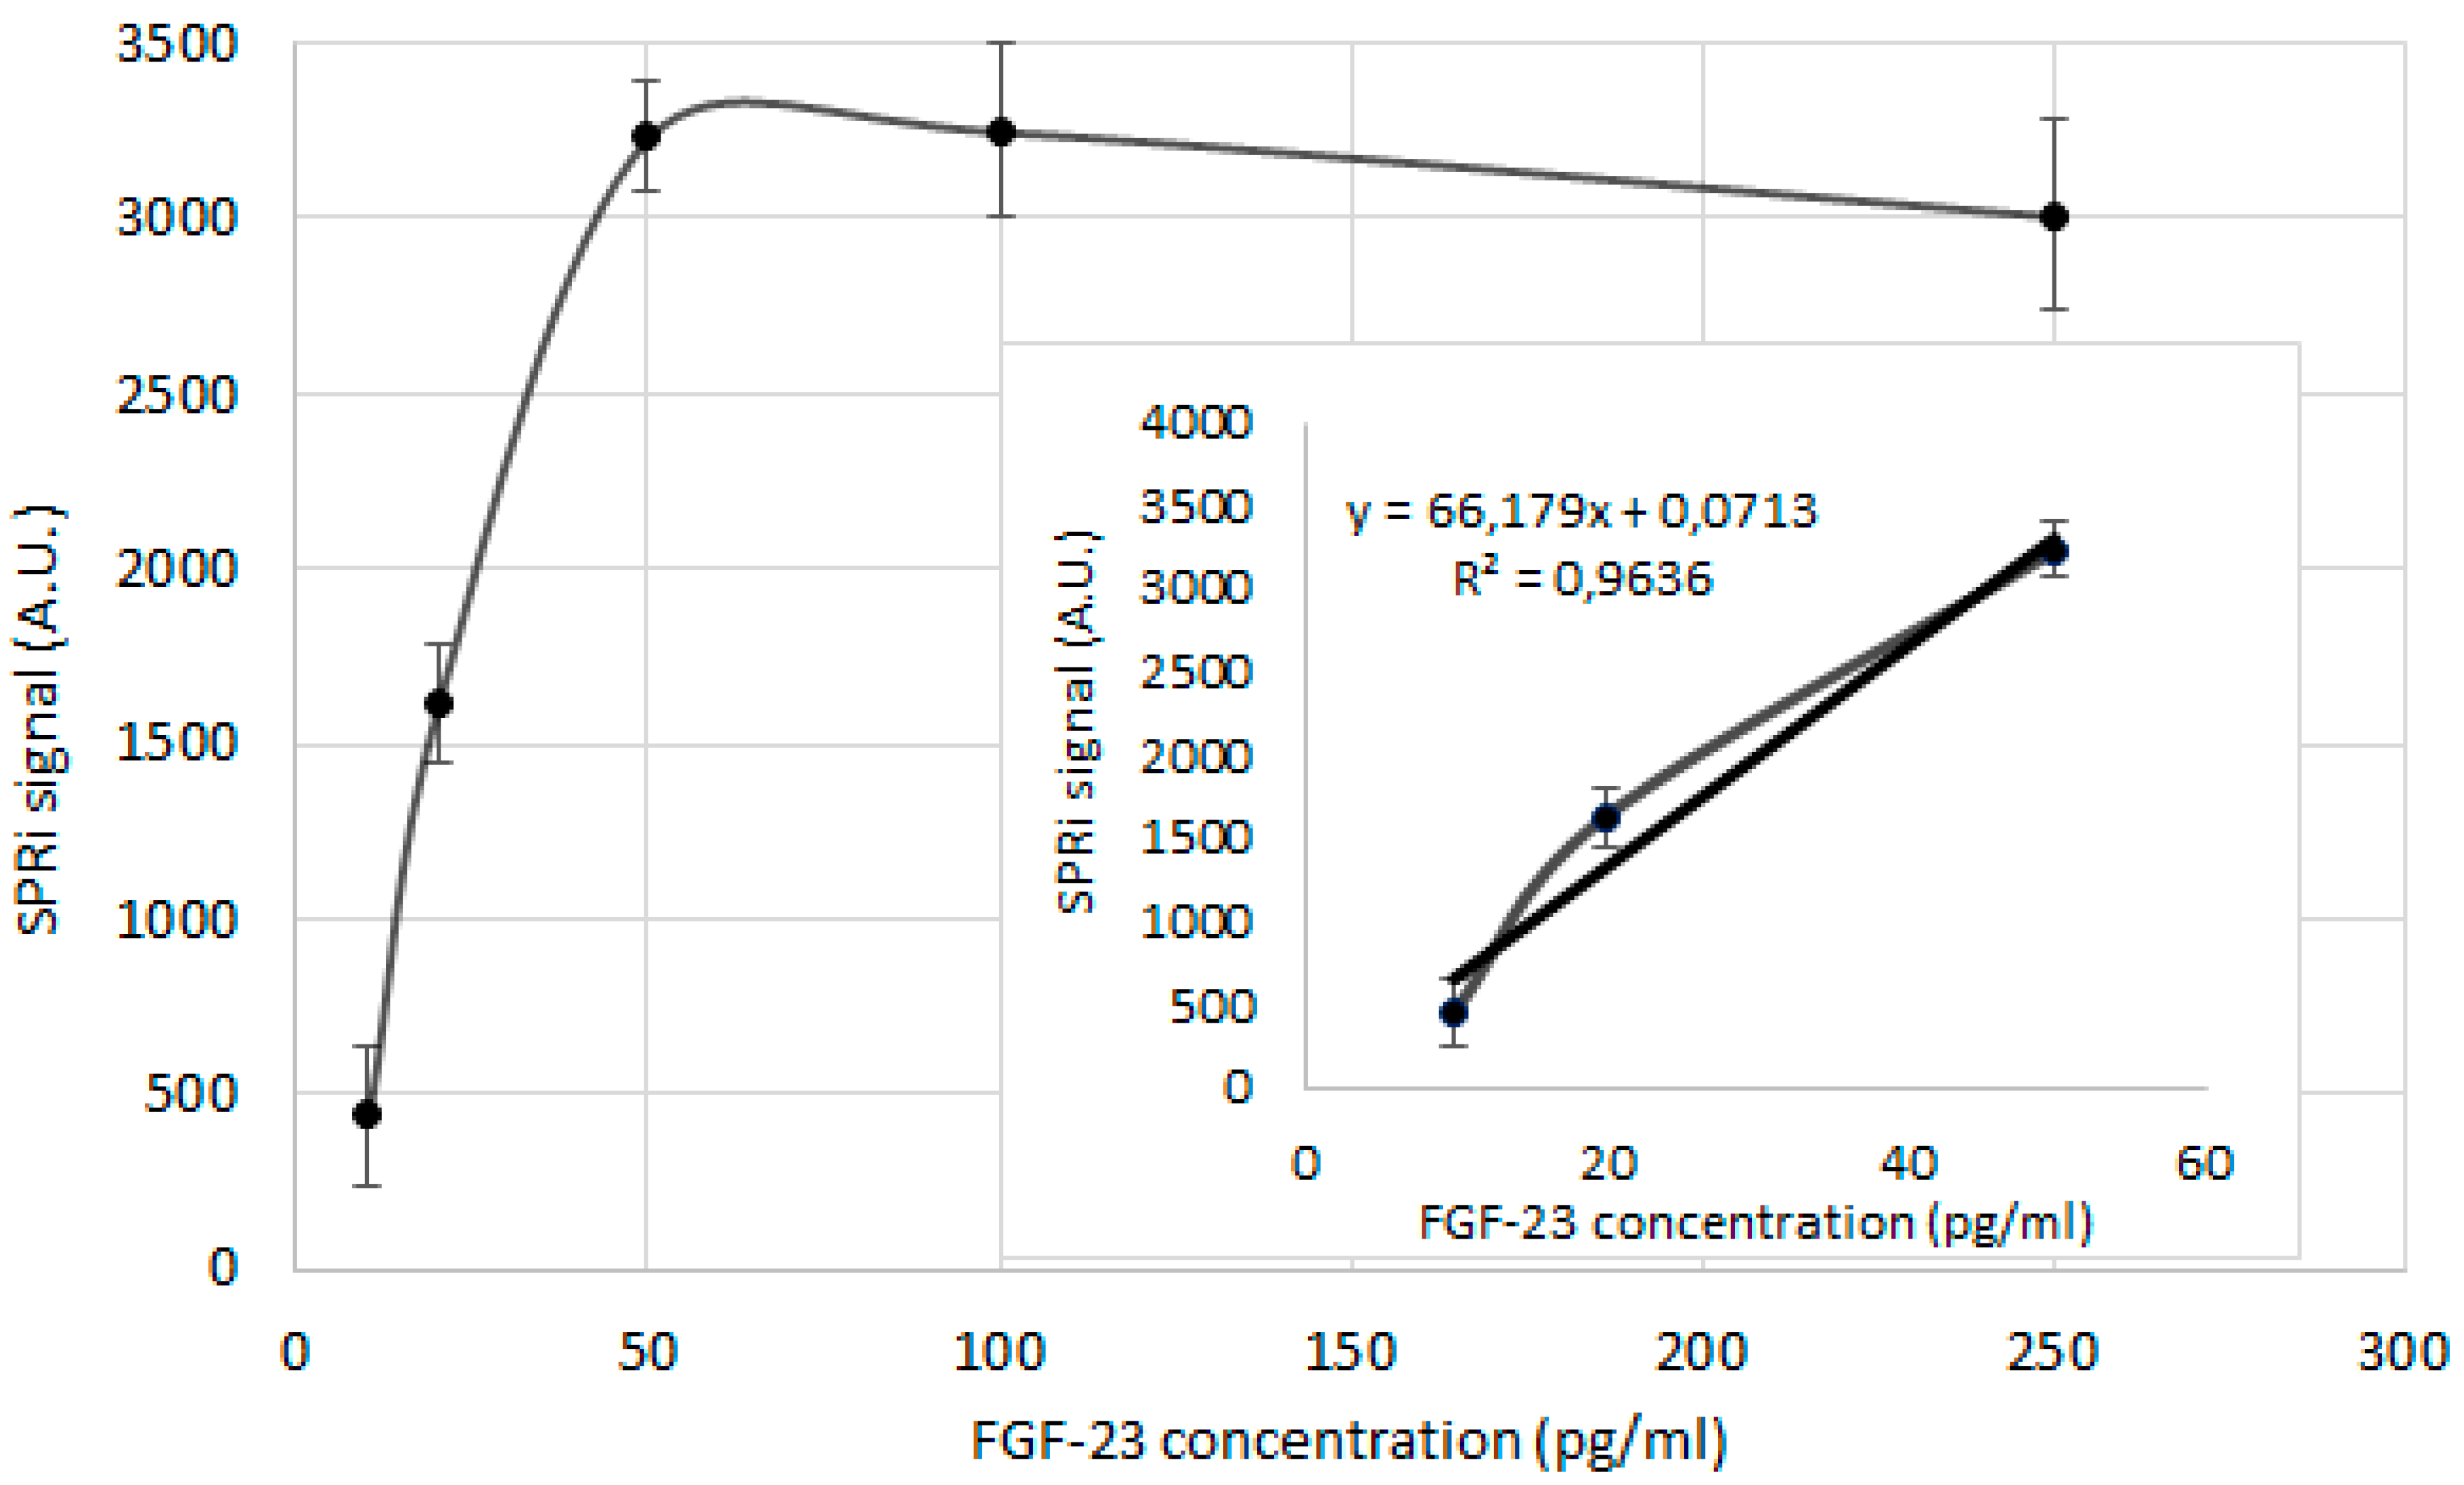
On the chip with the FGF-23 antibody (25 ng/ml) immobilized layer the series of the different FGF-23 concentration samples (2.5 µl each) as well as PBS sample were applied. The chosen concentrations of the FGF-23 protein were: 10.0; 20.0; 50.0; 100.0; 250.0 pg/ml. To allow the FGF-23 protein to interact with the antibody, the biosensor was left for 10 minutes. After this process, the biosensor was cleaned properly according to technique described in paragraph 4.4.
The
Figure 2 shows the calibration curve and its linear part. The obtained SPRi signal was reduced by the signal of the PBS buffer.
The determined linear response of the biosensor was in the range of 10 – 50 pg/ml. Therefore, it was decided to try to extend this range by increasing the detected mass as a result of the complex of FGF-23 with the αKlotho protein forming.
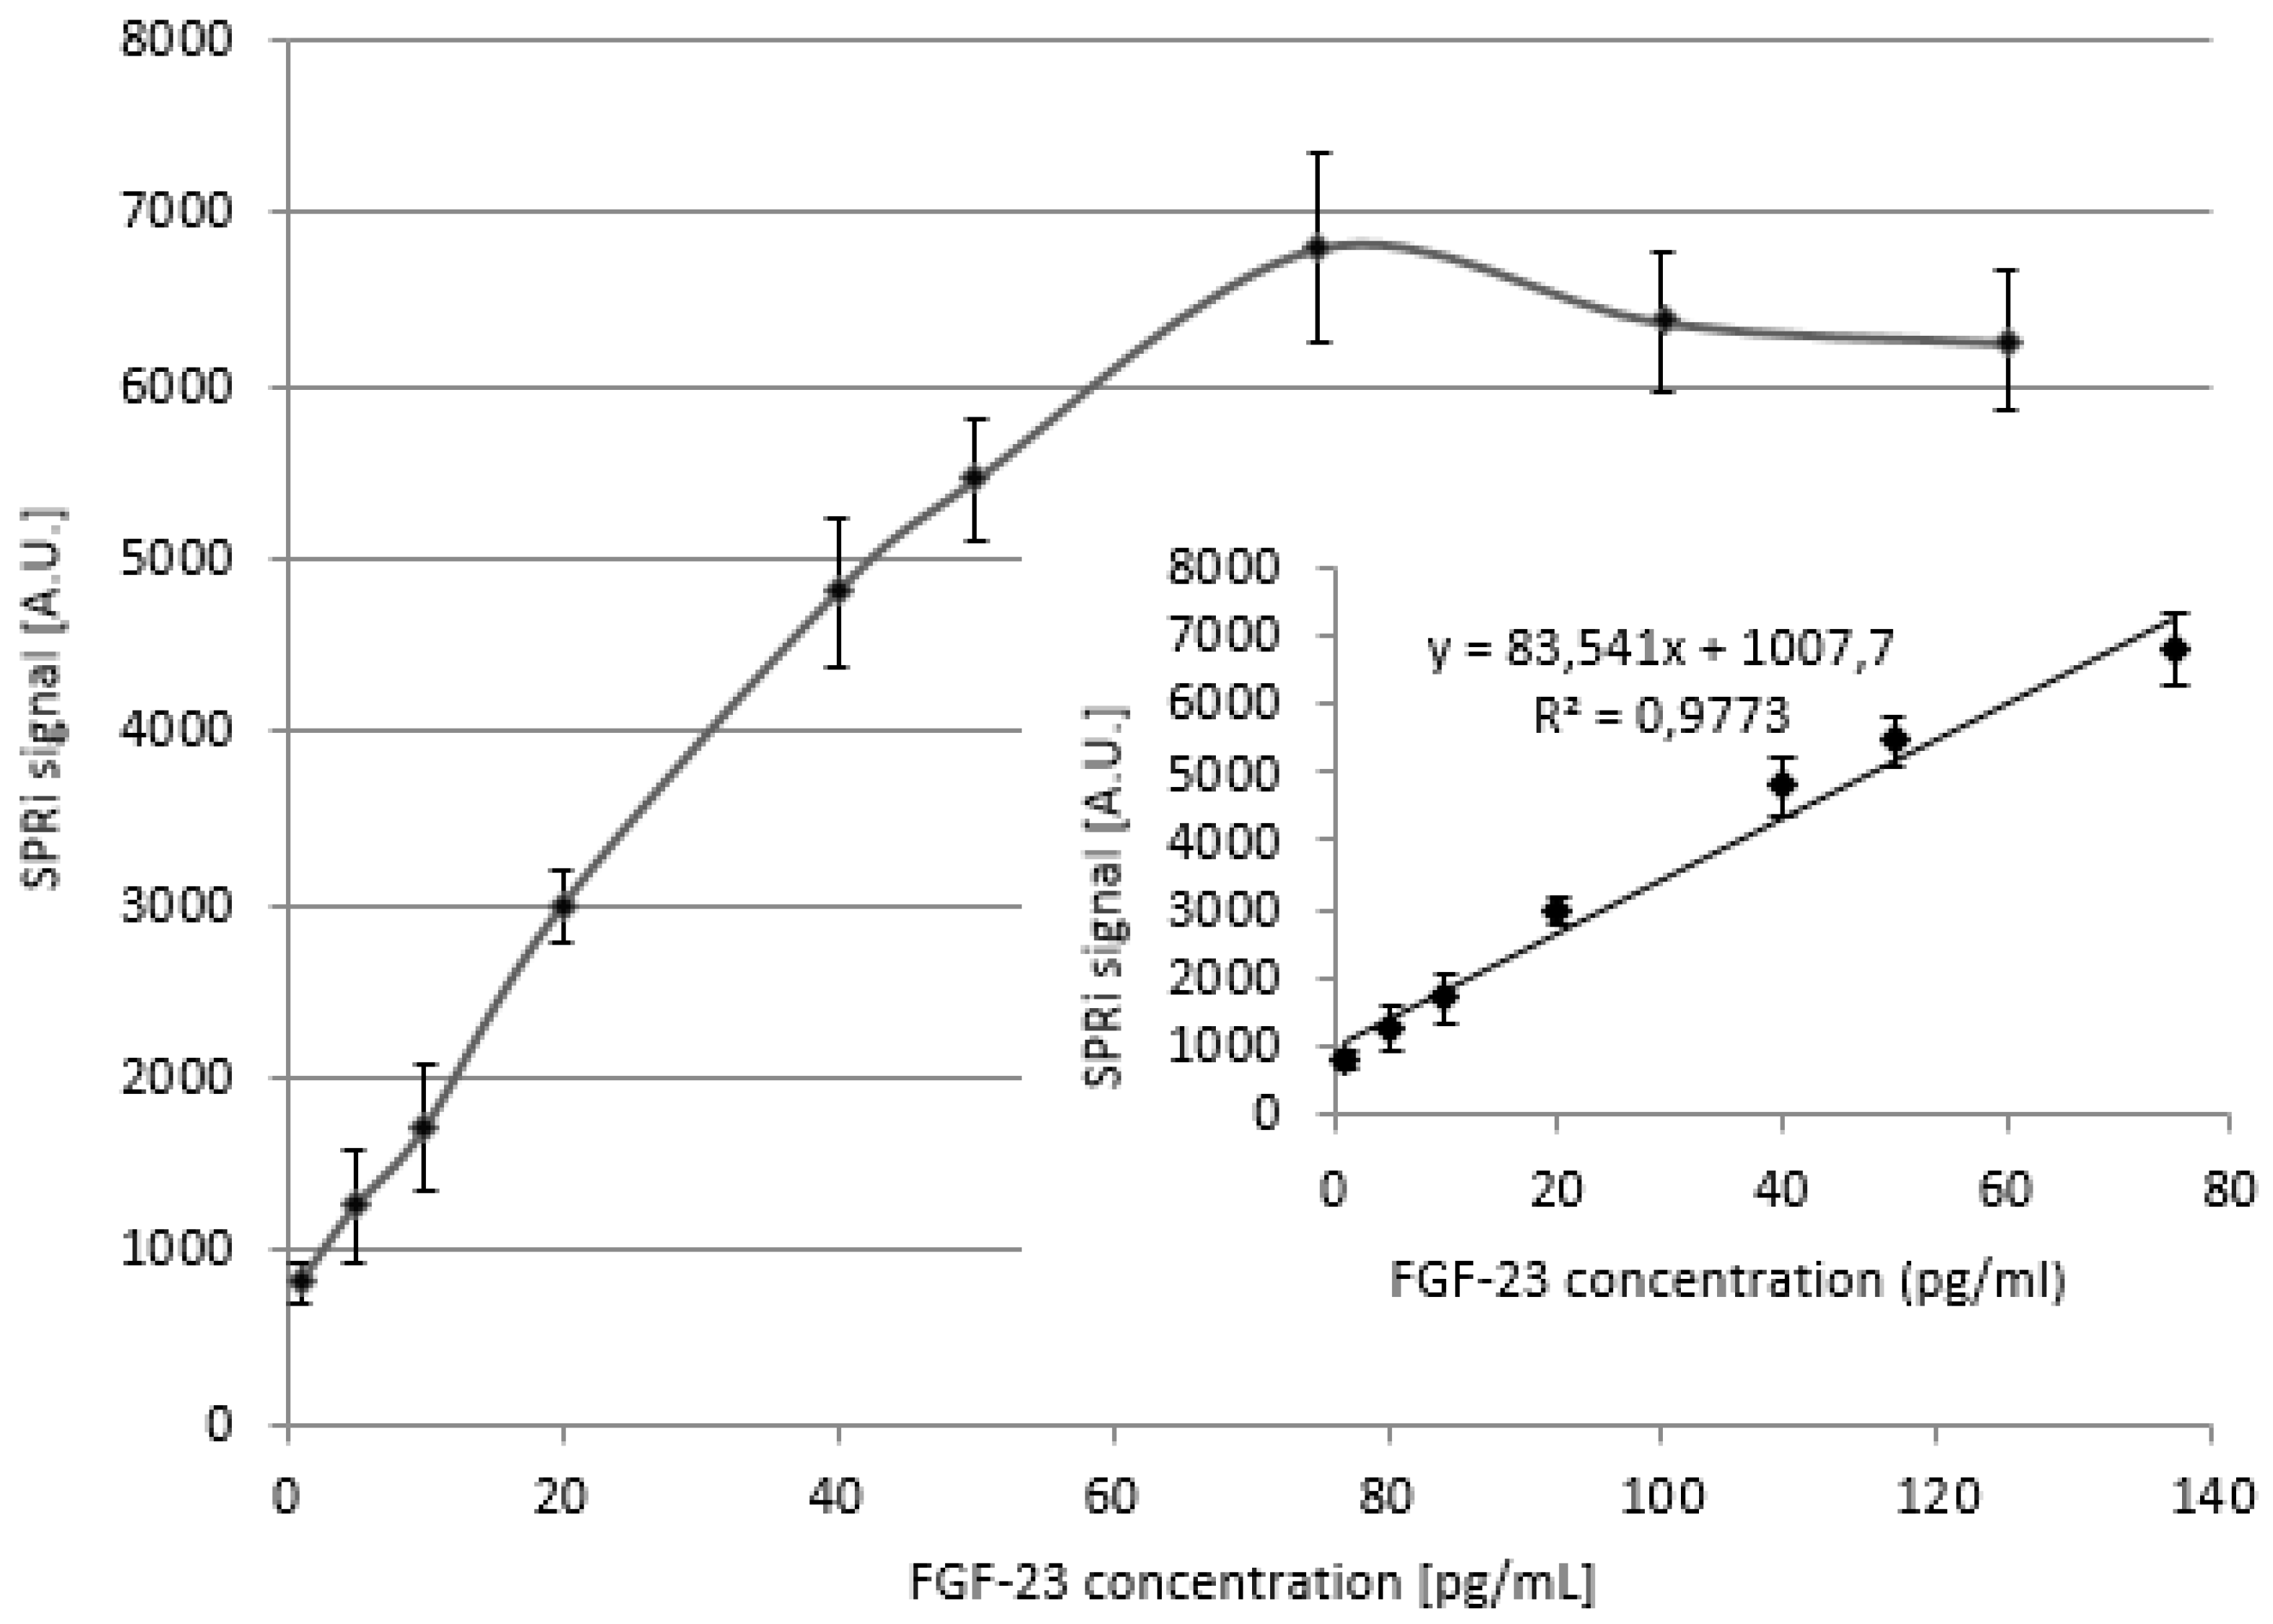
For this purpouse 9 different samples of different FGF-23 concentration were prepared, i.e. 1.0; 5.0; 10.0; 20.0; 40.0; 50.0; 75.0; 100.0; 125.0 pg/ml. To the samples, the αKlotho protein that bound with the FGF-23 and created detectable complex was added. The mass ratio of the mixture preapred in such a way was 1:4.23 (FGF-23: αKlotho).
The calibration curve and its linear range obtained with the addition of the αKlotho are shown in
Figure 3. The obtained SPRi signal was reduced by the signal of the PBS buffer.
The determined linear response of the biosensor with the addition of the αKlotho was wider that without this protein and was in range 1 – 75 pg/ml. This was the reason why the addition of the αKlotho protein was used in further parts of experiment.
2.3. Chosing of the αKlotho concentration
As it was mentioned in the paragraph 2.2. during the measurements, αKlotho protein was added to all of the tested samples to obtain a mass ratio of FGF-23 to αKlotho protein equal 1:4.23.
The choice of such a mass ratio value was dictated by the fact that it was assumed that 1 molecule of the FGF-23 (approximately 26 kDa) binds with one molecule of the αKlotho protein (approximately 110 kDa) and creates the detected complex.
To test the validity of this assumption, it were performed measurements where 6 different samples with different concentrations of both FGF-23 and αKlotho protein (in the excess as well) were prepared. The following samples were used in this part of the experiment where the concentration of the FGF-23 is given first: 5:21.5; 5:42.3; 50:215.0; 50:423.0; 100:423.0; 100:846.0 pg/ml.
The obtained results of the SPRi signal measurments are gathered in
Table 1.
Based of the results in the
Table 1 it might be noticed that no influence of the αKlotho protein excess on the measurments of the FGF-23 concentration was observed (recovery less than ± 7%). That is why in all of the performed measurments where the FGF-23 concentration was determined, the αKlotho protein in mass ratio 1: 4.23 was added to the samples.
2.4. Checking of the complex creation time
To test the time required to form the FGF-23 – αKlotho complex, 4 samples with different concentrations of the FGF-23 (1.0; 10.0; 50.0; 100.0 pg/ml) were prepared. Next, an appropriate amount of αKlotho (mass ratio 1:4,23) was added to the samples and the concentration of the FGF-23 was determined immediately (0 min.) after the addition of this compound as well as 30 minutes after its addition. The obtained results are shown in
Table 2.
Results gathered in the
Table 2 show that there was no difference beetwen determined concentrations of FGF-23 in samples applied on the biosensor in time 0 and after 30 minutes. Complex of FGF-23 with αKlotho formed immidately after mixing of these two components together.
2.5. Selectivity of the biosensor
The newly developed biosensor was tested for its selectivity. Based on the available literature, 3 potential interferents were selected. These were FGF-19, FGF-21 and albumin.
Both of the FGFs molecules were chosen because they are classified to the same FGFs endocrine family [
4], while albumin is the protein found the most abundantly in the blood plasma – 60 % of the total plasma protein mass [
16].
Twelve different mixtures (samples) were prepared that contained FGF-23 (40 pg/ml) and the interferents with increasing concentration ratios, i.e. 1:1 (40:40 pg/ml), 1:10 (40:400 pg/ml); 1:100 (40:4 ng/ml); 1:1000 (40:40 ng/ml). αKlotho protein was also added to the mixtures during their preparation. However, due to the fact that FGF-19 and FGF-21 also bind with this protein, to correctly determine the FGF-23 concentration, Klotho protein was added in a 4-fold excess (1:16.92 instead of 1:4.23).
Next, in the prepared mixtures, with the taking into account SPRi signal of the PBS, the concentration of the FGF-23 was determined.
The results of this part of the experiment are shown in
Table 3 below.
The determined recovery of the FGF-23 concentration for all of the tested samples with the interferents was lower that ±10%. The influence of the interferents on the performed measurements was not significant and the developed biosensor showed a high selectivity against the mentioned interferents.
2.6. Precision and accuracy of the biosensor
In order to check the precision and accuracy of the newly developed biosensor three different samples (concentrations) of the FGF-23 – Klotho mixture (1:4.23) were applied on the biosensor, i.e. 1.0 (the lowest concentration of the calibration curve’s linear range); 40.0 (the middle concentration of the calibration curve’s linear range) and 75.0 pg/ml (the highest concentration of the calibration curve’s linear range). Each of them was applied on three active sites of the biosensor, what gave 36 repetitions for each of the concentration in total. Next, the concentration of the FGF-23, its standard deviation, recovery (measure of the accuracy) and relative standard deviation (measure of the precision) were determined. All of the obtained results are gathered in
Table 4.
The determined recovery of the tested concentration is lower than ±5%, what indicated that accuracy of the newly developed method was high.
The determined relative standard deviation, which was a measure of precision, increased with the concentration increasing. For a value of 40 pg/ml, a low and acceptable value of this parameter was obtained.
2.7. Detection and quantification limits of the biosensor
Another, necessary part of the newly developed method’s validation was determination of detection and quantification limits.
In this purpouse, on the 3 active sites of the biosensor (12x3=36 spots) PBS buffer (pH=7.4, blank sample) was applied. After 10 minutes of the interaction biosensor was properly cleaned (paragraph 4.4). Next, the FGF-23 concentration was determined.
The limit of detection was calculated based on the equation:
where “a” was directional coefficient of the the calibration curve’s slope (83.541). Its value is 0.033 pg/ml.
The limit of quantification was calculated from equation:
and its value is 0.107 pg/ml.
2.8. Recovery, precision and selectivity of the biosensor in a biological sample
Additionally, some of the analitycal parameters as the recovery, precision as well as the selectivity (an infulence of the sample matrix backgroud) on the FGF-23 concentration measurments were tested in the biological sample.
To the sample of the blood plasma where FGF-23 concentration had been determined 5 times prior – C0, the FGF-23-αKlotho mixture (1:16.92) was added in such a manner that the added FGF-23 concentration was 25 pg/ml – Cadded. Due to the fact that the biological samples might contained other αKlotho protein-binding compounds such as the FGF-19 and the FGF-21, it was decided to increase the amount of added αKlotho protein to the sample.
In further step, the final concentration – Cfound (sum of the C0 and the Cadded) of the FGF-23 in this sample was measured 5 times with taking into account the PBS buffer signal. The FGF-23 concentration C0 and Cfound were determined from 12 individual measurments for each out of 5 times. Based on the measurments the diffrence between C0 and Cfound, its recovery, SD and RSD of Cfound were determined.
The results of the measurements in the
Table 5 indicated that the biological sample matrix showed almost zero effect on the FGF-23 concentration measurements performed by the SPRi biosensor - the recovery of the C
found in almost all of the cases was lower than ±10% and RSD of the C
found was lower than 5%. These results are consistent with the results obtained in paragraph 3.5 and once again confirmed the high selectivity of the developed biosensor over potential interferents.
2.9. Scanning Electron Microscope measurements
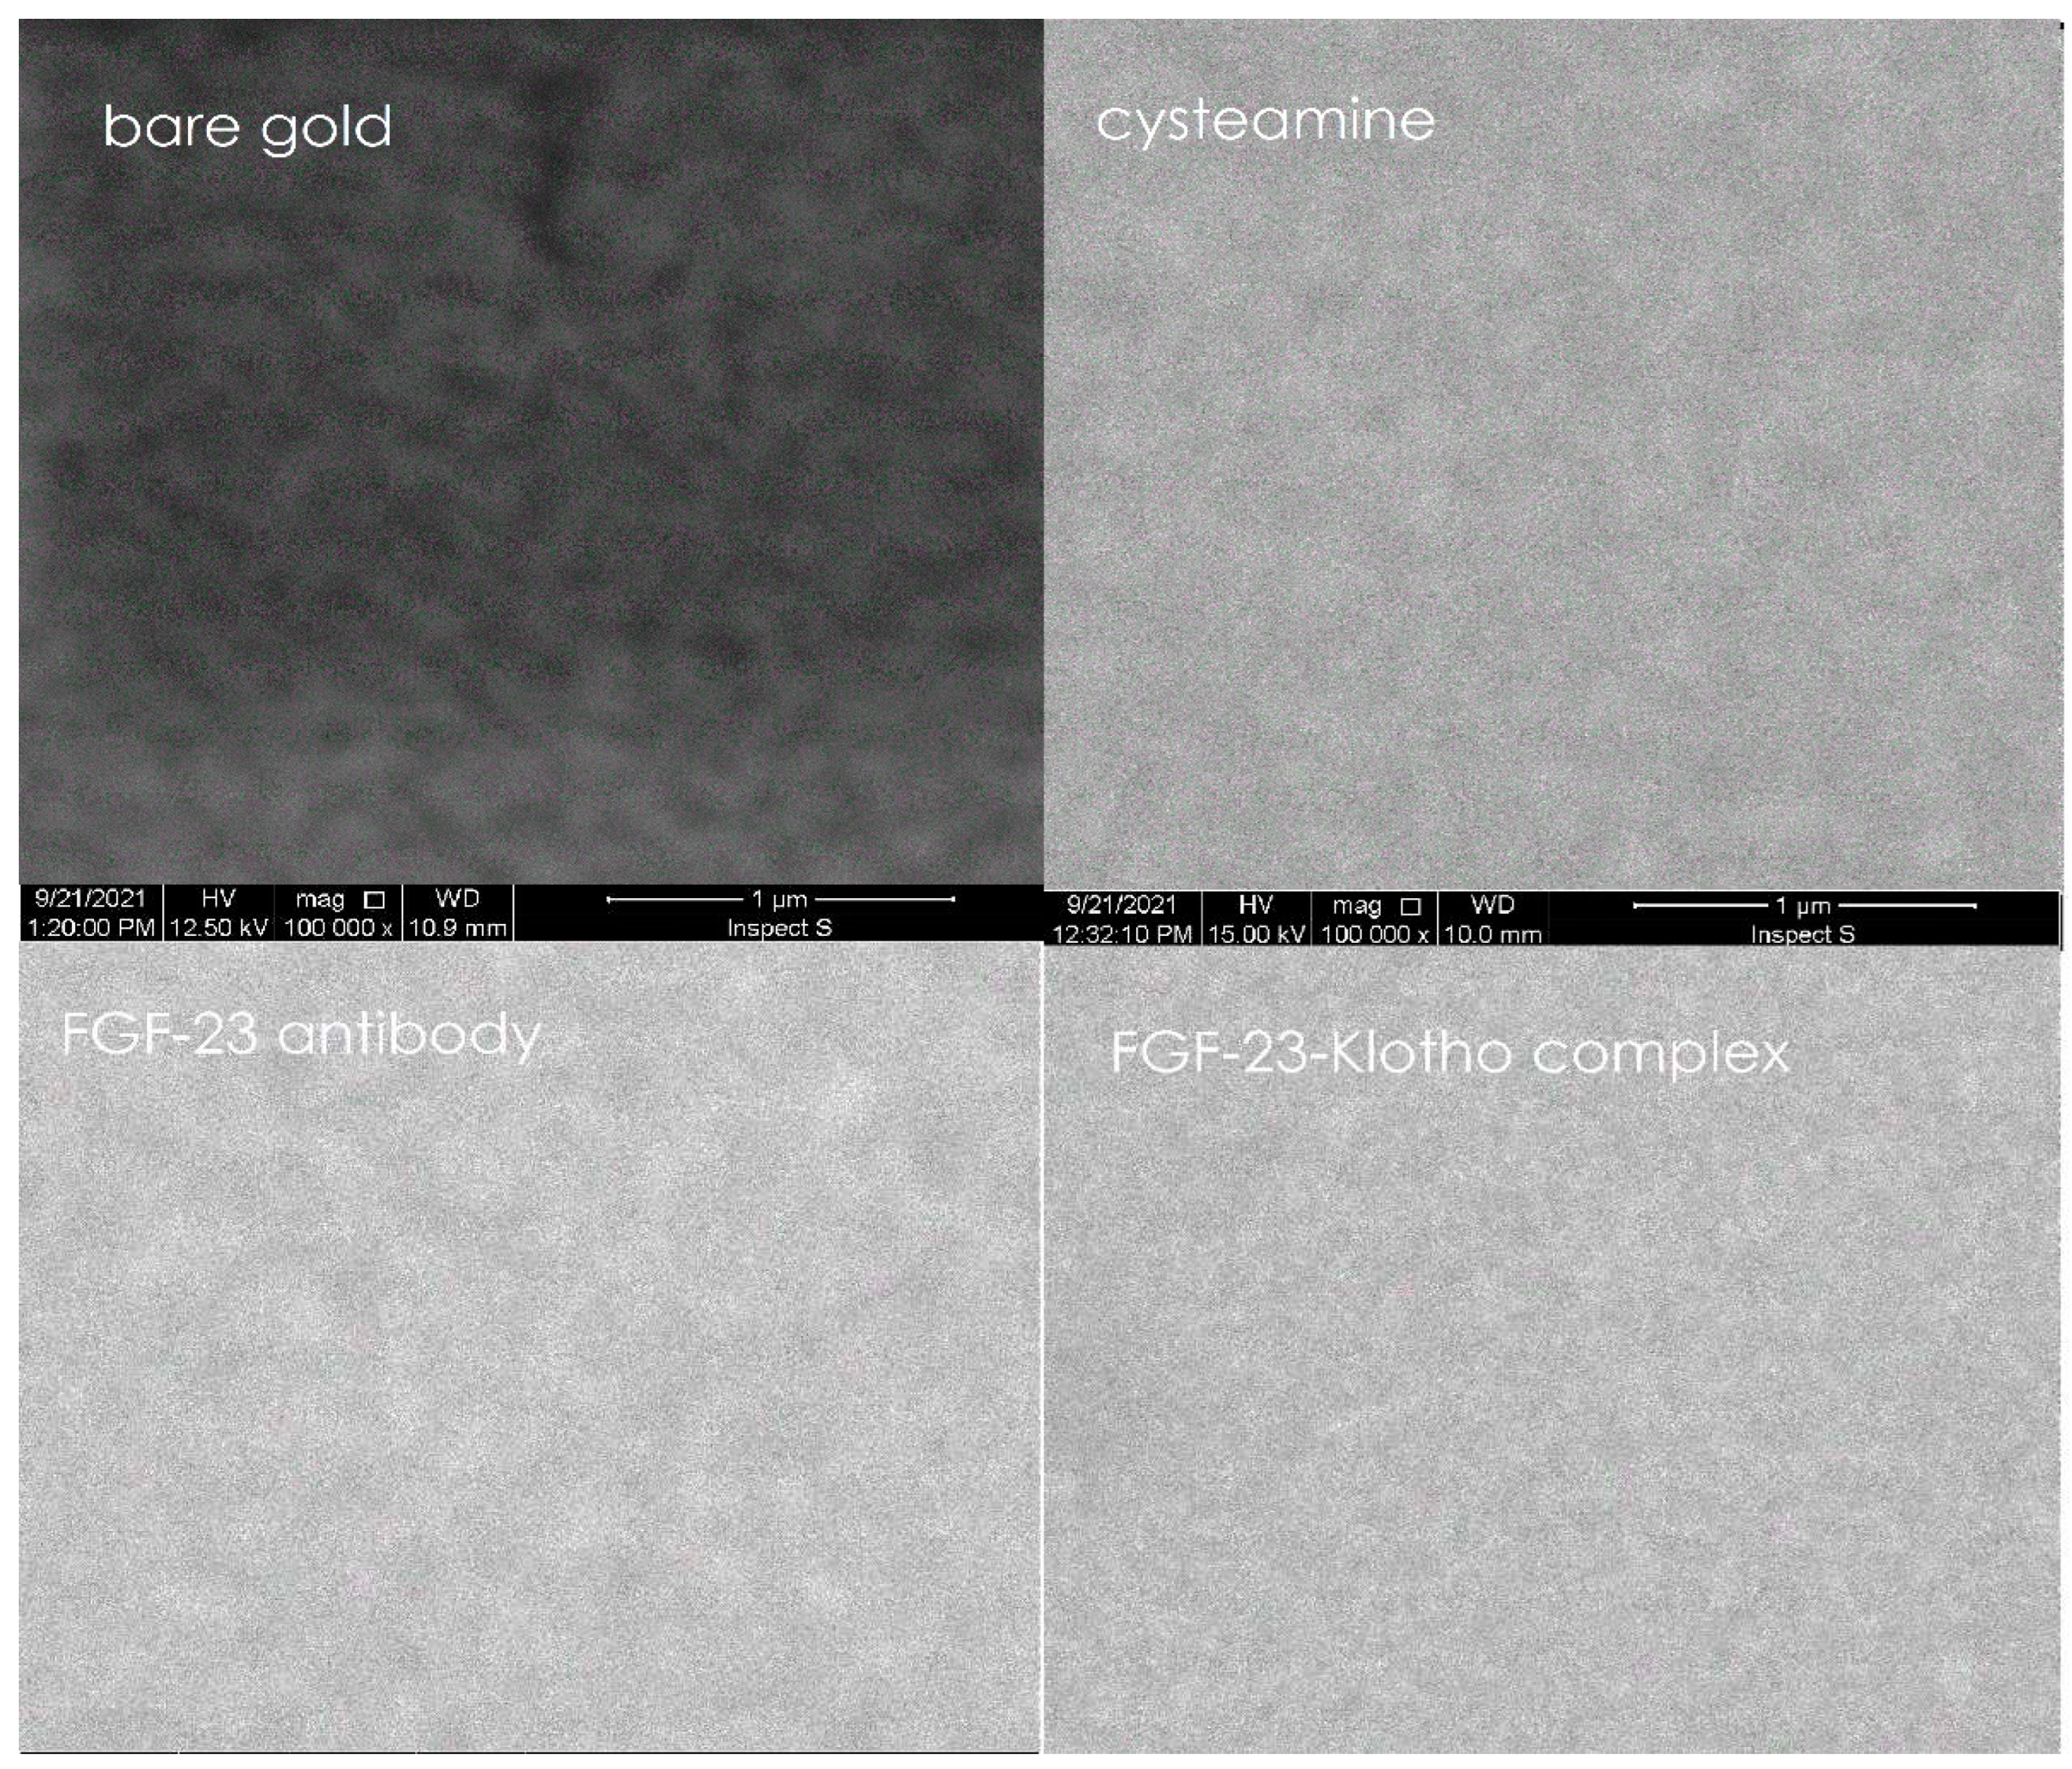
The Scanning Electron Microscope (SEM) measurements were performed to control the formation of individual, different layers on the surface of the biosensor, i.e. the bare gold, the cysteamine, the FGF-23 antibody and the complex of FGF-23 with αKlotho protein.
The SEM measurements were performed with INSPEC S60 microscope from FEI equipped with a tungsten electron source. For these tests voltage of 12.5 or 15 kV were applied as well as a backscattered electron detector. Samples were placed on the aluminum tables and attached with carbon conductive tape to achieve better conductivity. A magnification of 100 000x was used.
After each of the applied layer the biosensor was rinsed as it is described in paragraph 4.4.
Pictures obtained for each of the biosensor’s layer with using of the SEM are presented in
Figure 4 below.
In
Figure 4 it can be seen that each of the successively applied layers on the biosensor was characterized by a different structure and each of them smoothed and made the bare gold more homogeneous. Observation of this process confirmed the formation of successive layers on the biosensor.
2.10. ELISA measurments
The final step of the FGF-23 SPRi biosensor development was to confirm of its utility by comparing results obtained by it with the results obtained by ELISA.
For this purpouse, the FGF-23 concentrations were measured in blood plasma samples taken from both, the healthy individuals as well as from the cancer patients. These measurements were performed using of both, the SPRI biosensor and the ELISA.
The ELISA (Immunotopics, cat. No 60-6600) was performed according to the manufacturer's procedure.
The SPRi biosensor was properly prepared and cleaned after each of the experiment’s step (paragraph 4.4). The PBS buffer signal was taken into account and the αKlotho protein was added to samples in excess – potential present αKlotho protein-binding compounds (1:16.92).
The results obtained by using the two techniques and their comparison are summarized in
Table 6 below.
Additionally, based on the obtained results, the Pearson correlation coefficient was calculated.
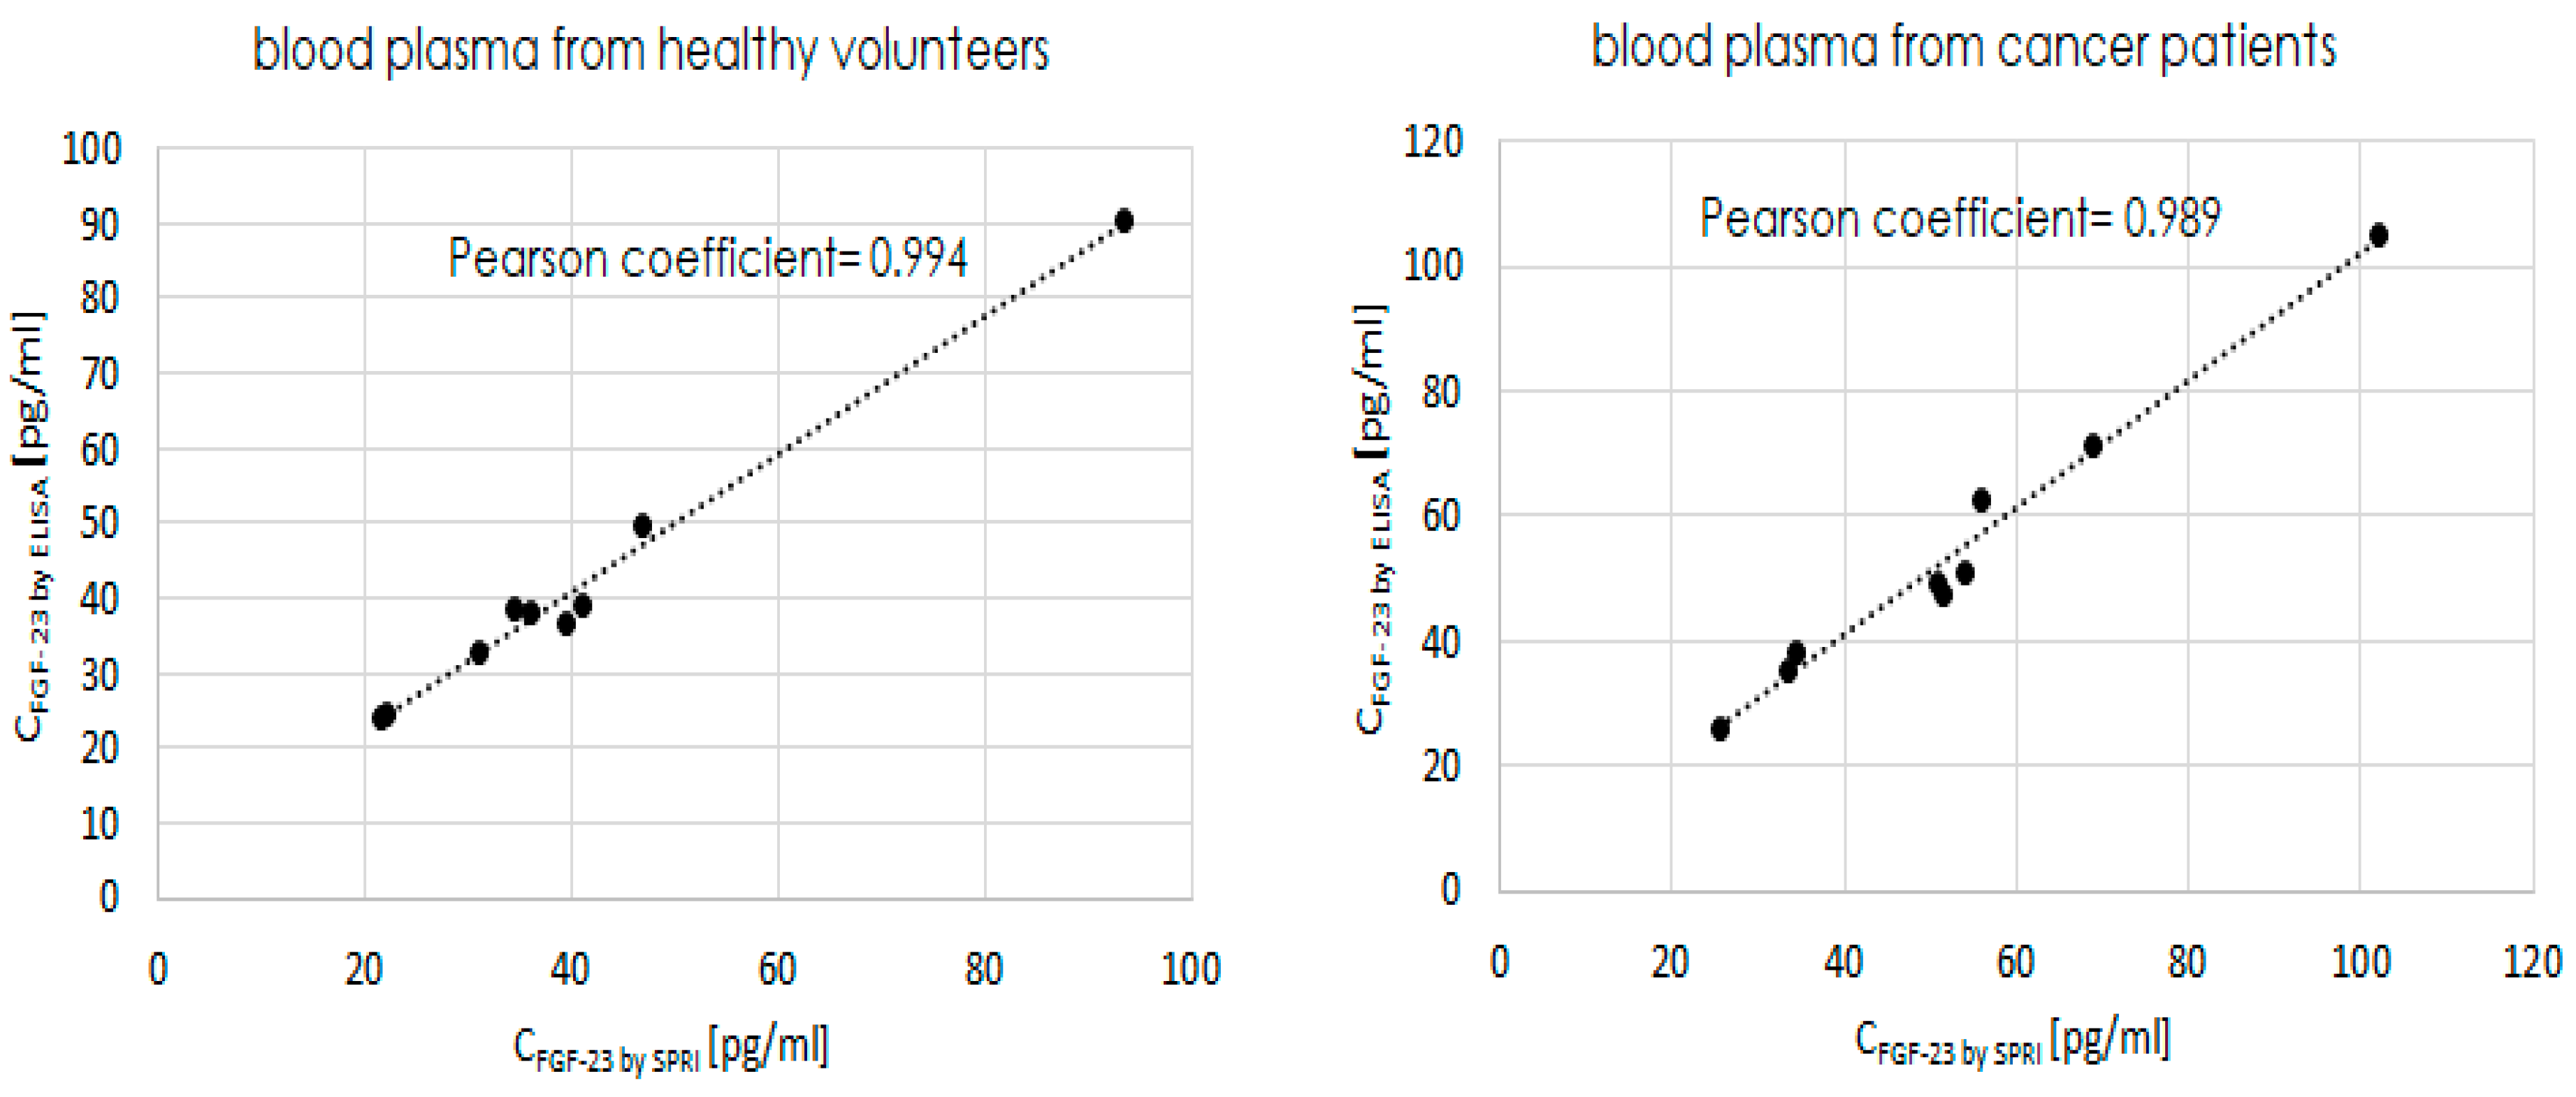
Overall, the coefficient reflects the linear correlation between the two variables, which in this part of the described experiment were the two methods used to determine FGF-23 concentrations - ELISA and the newly developed SPRi biosensor. The coefficients were determined separatelly in two types of the biological samples, the correlations are shown in
Figure 5.
The diffrence between determined FGF-23 concentrations in two types of the biological samples with using the ELISA and SPRi biosensor are in almost all of the cases lower than ±10%. The Pearson coefficients of the two used methods calculated for two types of the biological samples were very close to the 1, i.e. 0.994 and 0.989 for blood plasma taken from healthy individuals and blood plasma taken from cancer patients, respectivelly. These coefficents indicated that beetwen ELISA and SPRi biosensor existed strong positive relationship.
The aboved mentioned observations indicated that the newly developed biosensor gave very similar results of FGF-23 concentrations in biological samples to ELISA’s results and therefore can be used interchangeably with ELISA for this purpose.
3. Discussion
The main aim of the experiments described in this article was to develop a new label-free and optical method for measuring the concentration of FGF-23 in biological samples.
For this purpose, a biosensor based on the Surface Plasmon Resonance in imaging version - SPRi - was developed.
In order to properly develop this new method, it was necessary to determine its analytical parameters and validate it. For this purpose, a series of different experiments that gave the possibility to determine of: optimal concentration of FGF-23 antibody (25 ng/ml), linear range of the calibration curve (1-75 pg/ml), limit of detection (0.033 pg/ml), limit of quantification (0. 107 pg/ml), interaction time and concentration of aKlotho protein and selectivity (>±10%) were carried out.
The last, but very important step in the development of the new method was to confirm its utylity by comparing the FGF-23 concentration’s results obtained by it with those obtained by so-called "gold standard"- ELISA.
The results of this step of the experiment confirmed that the newly developed method based on the SPRi biosensor gives results very similar to those obtained by the ELISA (Pearson coefficients were very close to 1 and the diffrence in the determined concentrations were lower than 10%). Therefore, it can be concluded that the SPRI biosensor is suitable and can be used for accurate determination of FGF-23 concentrations interchangeably with ELISA.
4. Materials and Methods
4.1. Chemical reagents and materials
As standards: recombinant human FGF-23 protein from mouse myeloma cell line (M= 26.1 kDa), recombinant human αKlotho protein from mouse myeloma cell line (109.8 kDa), recombinant human FGF-19 from E.coli (21 kDa), recombinant human FGF-21 from E.coli (20.2 kDa) all from R&D Systems and an albumin from human serum (Sigma- Aldrich) were used. Monoclonal mouse anti-human FGF-23 antibody (R&D Systems) was used as a receptor that bound the FGF-23 protein from samples onto the chip’s surface. As a linker cysteamine hydrochloride (Sigma- Aldrich) was used.
Additionally, N-ethyl-N’-(3-dimethylaminopropyl) carbodiimide (EDC), N-Hydroxysuccinimide (NHS, all Sigma- Aldrich), absolute ethanol, acetic acid, sodium chloride, sodium acetate (all POCh, Gliwice, Poland), HBS-ES buffer pH=7.4 (0.01 M HEPES, 0.15 M sodium chloride, 0.005% Tween 20, 3 mM EDTA), Michaelis phosphate buffer pH= 7.40 (BIOMED, Lublin, Poland) were used as received. Aqueous solutions were prepared with miliQ water (Simplicity®MILLIPORE). High purity (99,999%) argon N 5.0 (AIR LIQUIDE Polska Sp. z o. o., Poland), and human FGF-23 ELISA kit (cat. No 60-6600, Immunotopics) were used.
4.2. Biological samples used in the study
All used in the experiment samples of patients’ blood were taken before surgical procedures of an open nephrectomy and were provided by the Department of Urology, Medical University of Bialystok. Also, the blood samples taken from some healthy individuals who were honorary blood donors of the Regional Blood Donor Centre of Bialystok – the control group, were taken. During the procedure of the blood collection EDTA was used as an anticoagulant.
Blood samples used in the study were prepared as follows: two ml of collected blood was centrifuged (1000x g) for over 15 minutes and filtered three times for the separation of blood plasma from the cells. The blood plasma samples prepared in this way were frozen and stored at -70*C until further use.
The study was conducted in accordance with the Declaration of Helsinki, and approved by the Bioethical Committee of the Medical University of Bialystok (R-I-002/500/2019, 28th of November 2019). Informed consent was obtained from all subjects involved in the study.
4.3. SPRi apparatus and the SPRi signal measurement
All of the SPRi experiments were performed using a stationary (non-fluidic), apparatus developed by the University of Bialystok and AC S.A.
The base of each of the used FGF-23 biosensor was glass slide covered with a 1 nm titanium layer and 50 nm gold layer manufactured by Ssens, Enschede, The Netherlands. Onto the chip’s gold surface individual layers of: proper linker – cysteamine, FGF-23 antibody and tested samples, which contained complex of FGF-23 with αKlotho protein (analyte), were applied.
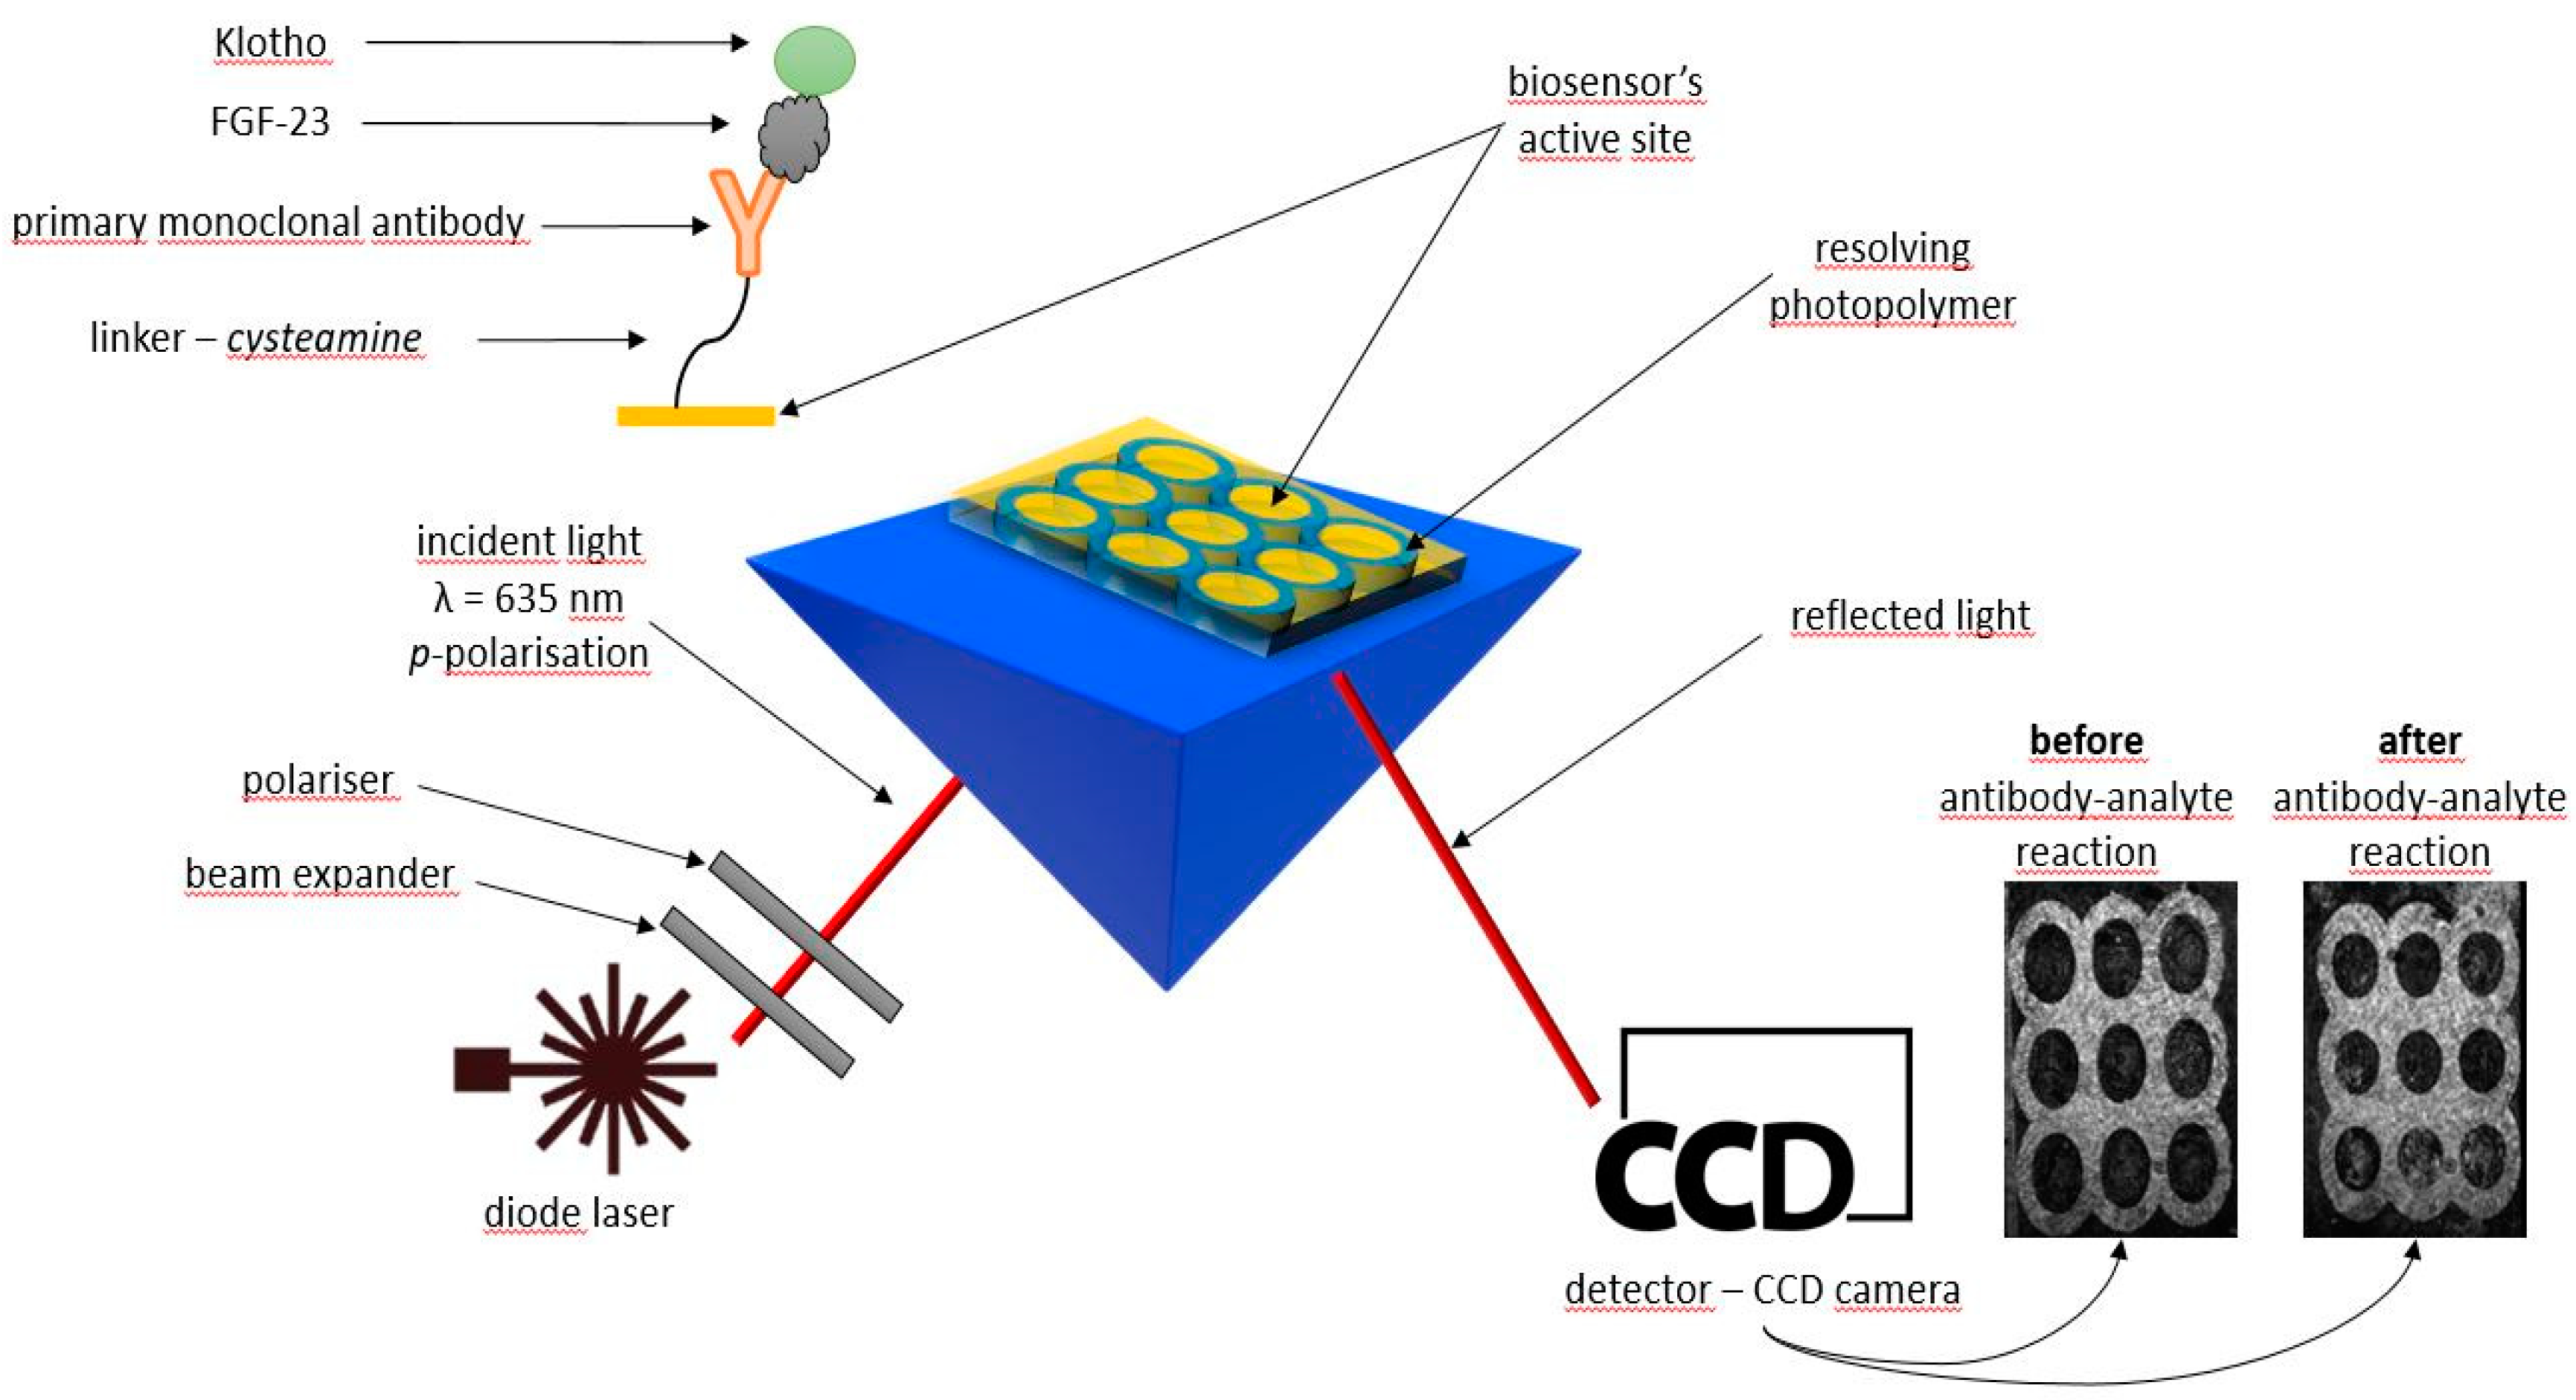
A measuring system of the SPRI apparatus consisted of a light source (monochromatic laser diode, λ = 635 nm) that emitted light passing through a system of lenses and polarizers. Next, the emitted light reflected off the biosensor’s surface and was registered by a detector (CCD camera), finally. All mentioned elements were mounted on movable arms which allowed to change the angle of light incidence on the biosensor. Each of the used in the study biosensors consisted of nine active sites with a suitably modified gold surface, so that subsequent biosensor layers could be bonded to its surface. The active sites had been separated from each other by a special light-curing polymer.
To excite surface plasmons during the measurements, the diode laser (635 nm) was used. SPRi measurements were carried out in two light polarizations – p polarization (responsible for the SPR effect) and s polarization (responsible for suppressing the SPR effect and used to correct small changes in the intensity of the radiation emitted by the diode).
The final, analytical signal was calculated as a difference in the light intensity of the biosensor’s active sites and was determined based on the photos recorded before and after the interaction of the FGF-23 antibody with the FGF-23. During the measurements both light polarizations were taken into account. ImageJ software (version 1.51k, National Institutes of Health, USA) was used for a mathematical processing of the obtained images. In such a way the SPRi signal was determined for of all the performed measurements.
The schemes of the SPRi apparatus and the used chips are shown in
Figure 6.
4.4. Preparation of the chip’s surface to measurements
Each of the used chip had to be properly prepared to be considered as a FGF-23 biosensor. This process consisted of the cysteamine and the FGF-23 antibody’s layers creation.
For this purpose, chips with gold layer were submerged for at least 12 h at room temperature in a 20 mM alcohol cysteamine solution. Next, the chips with the cysteamine monolayer were washed in an absolute ethyl alcohol and rinsed milli-Q water. After washing the chips were dried in an argon atmosphere.
In order to bind the FGF-23 antibody, onto the active sites of the chips with the cys-teamine’s self- assemble monolayer, the mixture of activated antibody was applied. The mixture consisted of EDC and NHS (concentration ratio 1:1) in carbonate buffer solution, which provided the optimal pH=8.5, as well as the FGF-23 antibody. In next stage, the chips with the applied mixture, were incubated for 1h at 37°C. After this process the chips were washed with distilled water 10 times and dried. Such prepared biosensors, were used in all of the experiments described in this study.
Additionally, a 1ng/ml bovine serum albumin (BSA) solution was applied on the active sites of the biosensor with the antibody’s layer and was washed 10 times with distilled water. This procedure was used to eliminate the nonspecific adsorption.
Author Contributions
Conceptualization, A.T. and E.G.; methodology, A.T and E.G.; validation, A.T., L.O. and E.G.; formal analysis, L.O. and A.T.; investigation, A.T, L.O. and U.K..; resources, G.M., A.T. and E.G.; data curation, A.T. and L.O.; writing—original draft preparation, A.T, L.O., G.M., U.K. and E.G.; writing—review and editing, A.T, L.O., G.M., U.K. and E.G.; visualization, A.T and L.O.; supervision, A.T and E.G.; project administration, A.T and E.G.; funding acquisition, A.T. All authors have read and agreed to the published version of the manuscript.
Funding
This research was funded by National Science Centre, grant number 2019/03/X/NZ1/00333; SEM measurements was partially financed by EU funds via project with contract numbers POPW.01.03.00-20-034/09-00, POPW 01.03.00-20-004/11-00.
Institutional Review Board Statement
The study was conducted in accordance with the Declaration of Helsinki, and approved by the Institutional Review Board (or Ethics Committee) of Medical University of Bialystok (R-I-002/500/2019, 28th of November 2019).
Informed Consent Statement
Informed consent was obtained from all subjects involved in the study.
Acknowledgments
The authors would like to thank Lech Romanowicz and Krzysztof Sobolewski (Medical Biochemistry Department) for valuable methodological suggestions during the research and Barbara Darewicz (Department of Urology) for the possibility of biological material collecting.
Conflicts of Interest
The authors declare no conflict of interest.
References
- Vlodavsky, I.; Korner, G.; Ishai-Michaeli, R., et all. Extracellular matrix-resident growth factors and enzymes: possible involvement in tumor metastasis and angiogenesis. Cancer and Metastasis Reviews 1990, 3, 203–26. [CrossRef]
- Green, P.J.; Walsh, F.S.; Doherty, P. Promiscuity of fibroblast growth factor receptors. BioEssays 1996, 18, 639–46. [CrossRef]
- Cavalli, L.; Mazzotta, C.; Brandi, M.L. Phosphatonins: physiological role and pathological changes. Clin Cases Miner Bone Metab. 2012, 9, 9-12.
- Itoh ,N.; Ohta, H.; Konishi, M. Endocrine FGFs: Evolution, Physiology, Pathophysiology, and Pharmacotherapy. Front Endocrinol 2015, 6, 154. [CrossRef]
- Mansinho, A.; Ferreira, A.R.; Casimiro, S.; Alho, I., et al.. Levels of Circulating Fibroblast Growth Factor 23 (FGF23) and Prognosis in Cancer Patients with Bone Metastases. Int J Mol Sci 2019, 20, 695. [CrossRef]
- Urakawa, I.; Yamazaki, Y.; Shimada, T. Klotho converts canonical FGF receptor into a specific receptor for FGF23. Nature 2006, 444, 770-774. [CrossRef]
- Vervloet, M. Renal and extrarenal effects of fibroblast growth factor 23. Nat Rev Nephrol 2019; 15, 109 -120. [CrossRef]
- Heijboer, A.C.; Cavalier E. The Measurement and Interpretation of Fibroblast Growth Factor 23 (FGF23) Concentrations. Calcif Tissue Int 2023, 112, 258–270. [CrossRef]
- Chen, C.-Y.; Chang, C.-C.; Yu, C.; Lin, C.-W. Clinical Application of Surface Plasmon Resonance-Based Biosensors for Fetal Fibronectin Detection. Sensors 2012, 12, 3879-3890. Heijboer, A.C.; Cavalier E. The Measurement and Interpretation of Fibroblast Growth Factor 23 (FGF23) Concentrations. Calcif Tissue Int 2023, 112, 258–270. [CrossRef]
- Oldak, L.; Zelazowska-Rutkowska, B.; Lesniewska, A.; Mrozek, P.; Skoczylas, M.; Lukaszewski, Z. ;Gorodkiewicz, E. Two Biosensors for the Determination of VEGF-R2 in Plasma by Array SPRi. Molecules 2023, 28. [CrossRef]
- Oldak, L.; Sankiewicz, A.; Żelazowska-Rutkowska, B.; Cylwik, B.; Lukaszewski, Z.; Skoczylas, M.; Gorodkiewicz, E . Two SPRi biosensors for the determination of cathepsin S in blood plasma. Talanta 2021, 225. [CrossRef]
- Oldak L.; Leśniewska, A.; Zelazowska-Rutkowska, B.; Latoch, E.; Lukaszewski, Z.; Krawczuk-Rybak, M.; Gorodkiewicz, E. An Array SPRi Biosensor for Simultaneous VEGF-A and FGF-2 Determination in Biological Samples. Appl. Sci. 2022, 12. [CrossRef]
- Sankiewicz, A.; Oldak, L.; Zelazowska-Rutkowska, B.; Hermanowicz, A.; Lukaszewski, Z.; Gorodkiewicz, E. An Immunosensor for the Determination of Cortisol in Serum and Saliva by Array SPRi. Sensors 2022, 22. [CrossRef]
- Tokarzewicz, A.; Romanowicz, L.; Sveklo, I.; Ewa Gorodkiewicz. The development of a matrix metalloproteinase-1 biosensor based on the surface plasmon resonance imaging technique. Anal. Methods, 2016, 8, 6428–6435. [CrossRef]
- Tokarzewicz A.; Romanowicz L., Sankiewicz, A.; Hermanowicz, A.; Sobolewski, K.; Gorodkiewicz. E. A New Analytical Method for Determination of Cathepsin L Based on the Surface Plasmon Resonance Imaging Biosensor. Int. J. Mol. Sci. 2019, 20, 2166. [CrossRef]
- Murray, R. K.; Granner, D.K.; Mayes, P.A; Rodwell, V.W. Plasma Proteins and Immunoglobulins. Harper’s illustrated Biochemistry, 30th ed.; Rodwell, V.W.,Bender, D. A., Botham, K.M., Kennelly, P. J., Weil, P. A., Eds.; Lange Medical Books/McGraw- Hill Companies, Inc., 2018.
|
Disclaimer/Publisher’s Note: The statements, opinions and data contained in all publications are solely those of the individual author(s) and contributor(s) and not of MDPI and/or the editor(s). MDPI and/or the editor(s) disclaim responsibility for any injury to people or property resulting from any ideas, methods, instructions or products referred to in the content. |
© 2023 by the authors. Licensee MDPI, Basel, Switzerland. This article is an open access article distributed under the terms and conditions of the Creative Commons Attribution (CC BY) license (http://creativecommons.org/licenses/by/4.0/).
