Preprint
Article

Hospital Readmission and Length of Stay Prediction Using an Optimized Hybrid Deep Model

Altmetrics

Downloads

273

Views

59

Comments

0

A peer-reviewed article of this preprint also exists.

Submitted:

04 July 2023

Posted:

05 July 2023

You are already at the latest version

Alerts
Abstract
Hospital readmission and length of stay prediction provide info to manage hospitals’ bed capacity and the number of required staff, especially during pandemics. We present a hybrid deep model called Genetic Algorithm-Optimized Convolutional Neural Network (GAOCNN) with a unique preprocessing method to predict hospital readmission and the length of stay in patients having various conditions. GAOCNN uses one-dimensional convolutional layers to predict hospital readmission and length of stay. The parameters of the layers are optimized using a genetic algorithm. To show the performance of the proposed model in patients with various conditions, we evaluate the model under three healthcare datasets; the Diabetes 130-US hospitals dataset, the COVID-19 dataset, and the MIMIC-III dataset. The diabetes 130-US hospitals dataset has information on both readmission and the length of stay, while COVID-19 and MIMIC-III datasets just include information on the length of stay. Experimental results show that the proposed model’s accuracy for hospital readmission is 97.2% for diabetic patients. Also, the accuracy of the length of stay prediction is 89%, 99.4%, and 94.1% for diabetic, COVID-19, and ICU patients, respectively. These results confirm the superiority of the proposed model compared to existing methods. Our findings offer a platform for managing healthcare funds and resources for patients with various diseases.
Keywords: 
Subject: Computer Science and Mathematics  -   Artificial Intelligence and Machine Learning

2. INTRODUCTION

Hospital readmission and length of Stay (LOS) have major roles in hospitals’ expenditures. Recently, healthcare systems’ main focus is patients being readmitted to hospitals within a short time frame (mostly considered 30 days) after discharge [1]. According to the latest report, the United States healthcare system’s burden was 41 billion dollars due to hospital readmissions of diabetic patients within 30 days [2]. A study in Spain revealed that while the total annual cost of diabetic patients was 1803.6 euros per person, the cost of hospitalization for these patients was 801.6 euros [3]. Another research conducted in the United States showed that the direct annual cost of diabetes is about 9,595 dollars per person [4]. There are direct and indirect costs of healthcare systems related to inpatient hospitalization. Direct medical costs include the costs associated with services provided at the hospital such as inpatient stays, ICU stays, laboratory tests, and other types of hospital visits. For various diseases, the hospitalization share of the total cost is different. For diabetic patients, 35% of the total cost is considered for hospitalization [5]. This share for swine flu is 40%. The hospitalization cost for COVID-19 patients varies based on age [6]. On average 92.6% of the total cost of COVID-19 patients is for hospitalization [7]. These facts indicate that readmission time and LOS are responsible for more than 50% of the total cost to the patients. Besides the cost to the patients and healthcare systems, long LOS and repeated readmission lead to other problems too. An increase in LOS downgrades the quality of healthcare services due to the increase of patients to nurses ratio. During the COVID-19 pandemic, it has been reported that for every extra patient per nurse, a 7% increase in the odds of patient failure-to-rescue and a 7% increase in the likelihood of dying within 30 days [8]. Recently, with the emergence of COVID-19, the need for hospital beds has increased. The LOS for COVID-19 patients varies based on the level of severity and age group; the LOS of COVID-19 patients increases with age for patients older than 60. However, the LOS for COVID-19 patients at ICU decreases for people aged 80 years or older due to a higher mortality rate [9]. The hospital readmission of diabetic patients within 30 days will increase the risk of getting COVID-19 [10]. Diabetic patients have a risk factor for hospitalization and a high mortality rate of COVID-19. According to recent research in China, the COVID-19 mortality rate in diabetes patients is about threefold more elevated than the general patients’ mortality rate [10]. Thus, precise prediction of readmission and LOS help the healthcare system to manage the availability of hospitals’ beds and quality of service. In this research, we propose a hybrid model with the combination of deep learning and evolutionary algorithms under the name of Genetic Algorithm-Optimized Convolutional Neural Network (GAOCNN). Proposed algorithms are evaluated by 3 different datasets to predict the readmission time frame for diabetic patients and LOS for diabetic, COVID-19, and ICU patients. Experimental results indicate that the GAOCNN estimates the readmission with 97.2% accuracy. Also, the accuracy of the GAOCNN for the length of stay prediction is 89%, 99.4%, and 94.1% for diabetic, COVID-19, and ICU patients, respectively. Comparing results of proposed algorithms with similar research in Table 5 and Table 6 show superior performance for both LOS and readmission time frame prediction.

3. RELATED WORKS

Numerous models have been developed to predict patients’ conditions in medical facilities [11,12]. Recent studies have focused on utilizing machine learning techniques for readmission prediction. Forsman and Jonsson used k-nearest neighbor, logistic regression, boosted decision tree [13], and artificial neural network [14] for readmission prediction. Their purpose was to classify patients into two groups: patients who never returned to the hospital and patients who returned within 30 days. The best result for this research was 80.1% accuracy with the logistic regression model. Alloghani et al. [15] applied machine learning to diabetes data to recognize patterns and combinations of factors that characterize the readmission of diabetes patients. They used a range of classifiers including Linear Discriminant Analysis [16], Random Forest, k-Nearest Neighbor, Naive Bayes, Decision Tree, and Support Vector Machine (SVM) [17]. Their best result was the area under the receiver operating characteristic curve (AUROC) and the precision of 64% and 51%, respectively, using the Naive Bayes algorithm. Hammoudeh et al. [18] presented a convolutional neural network model as a binary classifier to predict readmission. Their goal was to distinguish between patients who returned to the hospital and others who did not return. They reported accuracy and AUROC of 80% and 85%, respectively. Mingle [19] used machine learning classifiers such as Random Forest, Extreme Gradient Boosted Trees, Balanced Random Forest, Gradient Boosted Trees, Gradient Boosted Greedy Trees, Extreme Gradient Boosted Trees, Extreme Gradient Boosted Classifier [20] and Nystroem Kernel SVM [21] with a range of encoding procedures. The best accuracy of classifying patients into either never returned to the hospital or returned within 30 days was 78%. Morton et al. [22] tested supervised machine learning algorithms such as Support Vector Machines Plus (SVM+) and random forest for predicting short-term stays (stays that are less than 3 days) at hospitals for diabetic patients. They worked on a 3-class classification and reported 68% accuracy with 1% tolerance which they achieved with SVM+. Yakovlev et al. [23] used a multilayer perceptron to predict the hospital LOS for coronary syndrome patients. They used 6,000 samples which were divided into 5,000 training samples and 1,000 testing samples. The average and the standard deviation of the predicted LOS were 15 and 9.5 days, respectively. Tsai et al. [24] proposed a machine learning algorithm for hospital management by predicting the length of stay before patients’ admission. They developed deep learning models to predict the length of stay for patients with one of three primary diagnoses: coronary atherosclerosis, heart failure, and acute myocardial infarction in a cardiovascular unit. They reported 67% accuracy with a 2-day tolerance. Schorr [25] introduced a theoretical structure for predicting the hospital’s length of stay. The result of the mentioned paper proposes that the length of stay is difficult to be predicted by a single feature.
For the length of stay prediction in COVID-19 patients, various machine learning models have been used. Manhub et al. [26] used a decision tree to predict the COVID-19 patients’ length of stay. They analyzed 2,017 patients from January to July 2020. The result of their work indicates an R2-score of 49.8% and a median absolute deviation of 2.85 days. For the prediction of discharge time in COVID-19 patients, Nemati et al.[27] used the health records of 1,182 patients. They used only age and gender as input features for the discharge time prediction. They tested the gradient boost algorithm, Cox regression, and fast SVM for the discharge time prediction. They reported that the best result was achieved by the gradient boost algorithm with an accuracy of 71.7%.
None of the above-mentioned methods has taken any action to predict patients’ long-term hospital length of stay. All existing length of stay classifications is restricted to three or fewer classes. Also, the existing models do not have a high performance for the classification of readmitted patients into more than two categories. Most of the reviewed works have focused on using standard machine learning models for the length of stay prediction and their performance has been reported on a single disease only. To overcome the limitations of previous works, we propose a method to predict both the readmission and the length of stay in patients with various conditions using a novel hybrid deep model(GAOCNN). In the GAOCNN, the Convolutional Neural Network (CNN) predicts the hospital readmission and the length of stay, while the genetic algorithm optimizes the parameters of the layers to improve the performance. The proposed model is evaluated using three datasets of diabetic, COVID-19, and ICU patients. To compare GAOCNN performance with other artificial intelligence techniques, we used a traditional machine learning model such as SVM, or a traditional deep learning model such as VGG16 [28]. Also, we combine traditional machine learning with deep learning models such as CNN+SVM to ensure the capability of GAOCNN compared to the hybrid model. The experimental results indicate superior performance compare to machine learning, deep learning models, and hybrid models (Table 2, Table 3 and Table 4). Compared to similar research proposed algorithms can help to predict LOS with a lower time frame too. Lower time frame length leads to a better knowledge of the number of patients each day and this knowledge can help the hospital to manage nurse scheduling programs better, especially during the pandemic.

4. DATASET

To show the performance of the proposed model in patients with various conditions, we evaluate the proposed model using datasets of diabetic, COVID-19, and ICU patients. The dataset we have used for diabetic patients has information on both readmission and the length of stay, while the other two datasets just include information on the length of stay. The details of each dataset are explained in the following sections.

4.1. Diabetes

For diabetic patients, we use a dataset of 130 hospitals in the United States from 1999 to 2008 [29]. The dataset consists of 101,766 records with 50 attributes, such as ethnicity, gender, age, weight, and hospital visits. The data also contains features such as patient identification number, admission type, hospital length of stay, the specialty of the admitting physician, the number of performed lab tests, glycated hemoglobin (HbA1c) test results, diagnosis, the number of medications, diabetic medications, the number of inpatients and outpatient, and the number of emergency visits in the year before the hospitalization. Weight and age are recorded in 10-year and 25-pound intervals, respectively. Gender was mentioned as male, female, or unknown. The percentage of patients with male, female, and unknown gender is 53.77%, 46.22.%, and 0.01%, respectively.
The hospital inpatient and outpatient visits within the year before the hospitalization have been recorded in the dataset. The specialty of the admitting physician had been recorded as 84 distinct values such as cardiology, internal medicine, family or general practice, and surgeon. In the dataset, the range of the glucose serum test result had been recorded as "normal", "more than 200", "more than 300", or "not measured". The primary, secondary, and additional secondary diagnoses have been recorded in the International Statistical Classification of Diseases (ICD) codes [30]. The attributes of the primary, secondary, and additional secondary diagnosis have been coded as the first three digits of the ICD-9 [30] having 848, 923, and 954 distinct values, respectively. More than 44% of the primary diagnosis in the dataset are related to circulatory and respiratory systems diseases.

4.2. COVID-19

We have gathered the medical records of 1,085 COVID-19 patients from January to February 2020 from a publicly available COVID-19 dataset [31]. The dataset consists of information including symptom-onset, hospital visit date, exposure date, recovered date, and death. Personal information about age, gender, location of hospitalization (country/state), and travel history from Wuhan is also reported. The most significant information is the date of exposure to the public and the date before the critical condition. The length of stay has not been reported in the dataset directly, but it can be extracted using the difference between the hospital visit and discharge or death. Most of the patients lived in China, South-East Asia, and the United States.

4.3. ICU

Intensive Care Unit (ICU) patients’ information is extracted from the MIMIC-III clinical dataset [32]. This dataset consists of 58,976 patients, 42,071 of whom are admitted to the hospital with an emergency condition. The dataset had been gathered from Beth Israel Deaconess Medical Center between 2001 and 2012. The dataset consists of personal characteristics such as sex, age, ethnicity, and detailed admit information for each patient including type and location of admission. Other information such as the number of lab procedures, the number of transformations between hospitals, and the length of stay are reported in this dataset.

5. MODEL

5.1. GAOCNN

We present a hybrid deep model called Genetic Algorithm-Optimized Convolutional Neural Network (GAOCNN). In this model, the convolutional layers are used for feature extraction and dense layers for classification, while the Genetic Algorithm (GA) is applied for optimizing the layers’ parameters. The overall structure of the proposed model is shown in Figure 1. The GAOCNN has two convolutional layers. After the convolutional layers, there is a pooling layer that is specified as average pooling functions [33]. Also, we use two fully connected layers with a dropout which mitigates the risk of overfitting [34].
The convolutional layers employ local connections and weights to extract features from input data and build dense feature vectors. Since our data is two-dimensional (samples, attribute), we apply one-dimensional convolutional layers. The main algorithm is a simple CNN model. The main drawback of deep neural network models is their vast space of hyperparameters which makes the parameter selection tedious. Most researchers use techniques such as random search [35] and grid search [36]. When we use these searching techniques, there is a trade-off between increasing layers and run time to reach a proper solution. To overcome this challenge, we use the Genetic Algorithm (GA) for the scientific selection of parameters. Also, the whole process can be completed without human intervention. This automation in the learning process will help healthcare systems in reaching the right performance without expert supervision. The GA has been used widely in artificial intelligence fields, such as medical image processing, machine learning, and deep learning hybrid models [37]. The most important elements of the GA are the environment and the fitness function. By defining a proper fitness function, we can guide the model to improve performance. The GA uses the process of selection, crossover, and mutation to choose the number of convolution kernels, the number of convolution filters, and the number of epochs and neurons of the model. The GA’s standard steps are the initialization of the population, selection between created population, logical combination (crossover), randomness (mutation), and decoding. Before importing the data into GA algorithms, the encoding procedure is performed. After making the first random generation of the population’s data, according to the principle of ’survival of the fittest, only the fittest generation of the population are surviving. In each generation, individuals are selected according to their fitness. The surviving populations will be the parents of the next generations. Because new generations tend to maximize the defined fitness function, more generation production increases the chance of reaching a better solution. In the proposed algorithm, we use a maximum filter to choose the best hyper-parameters according to the highest fitness function in every step.
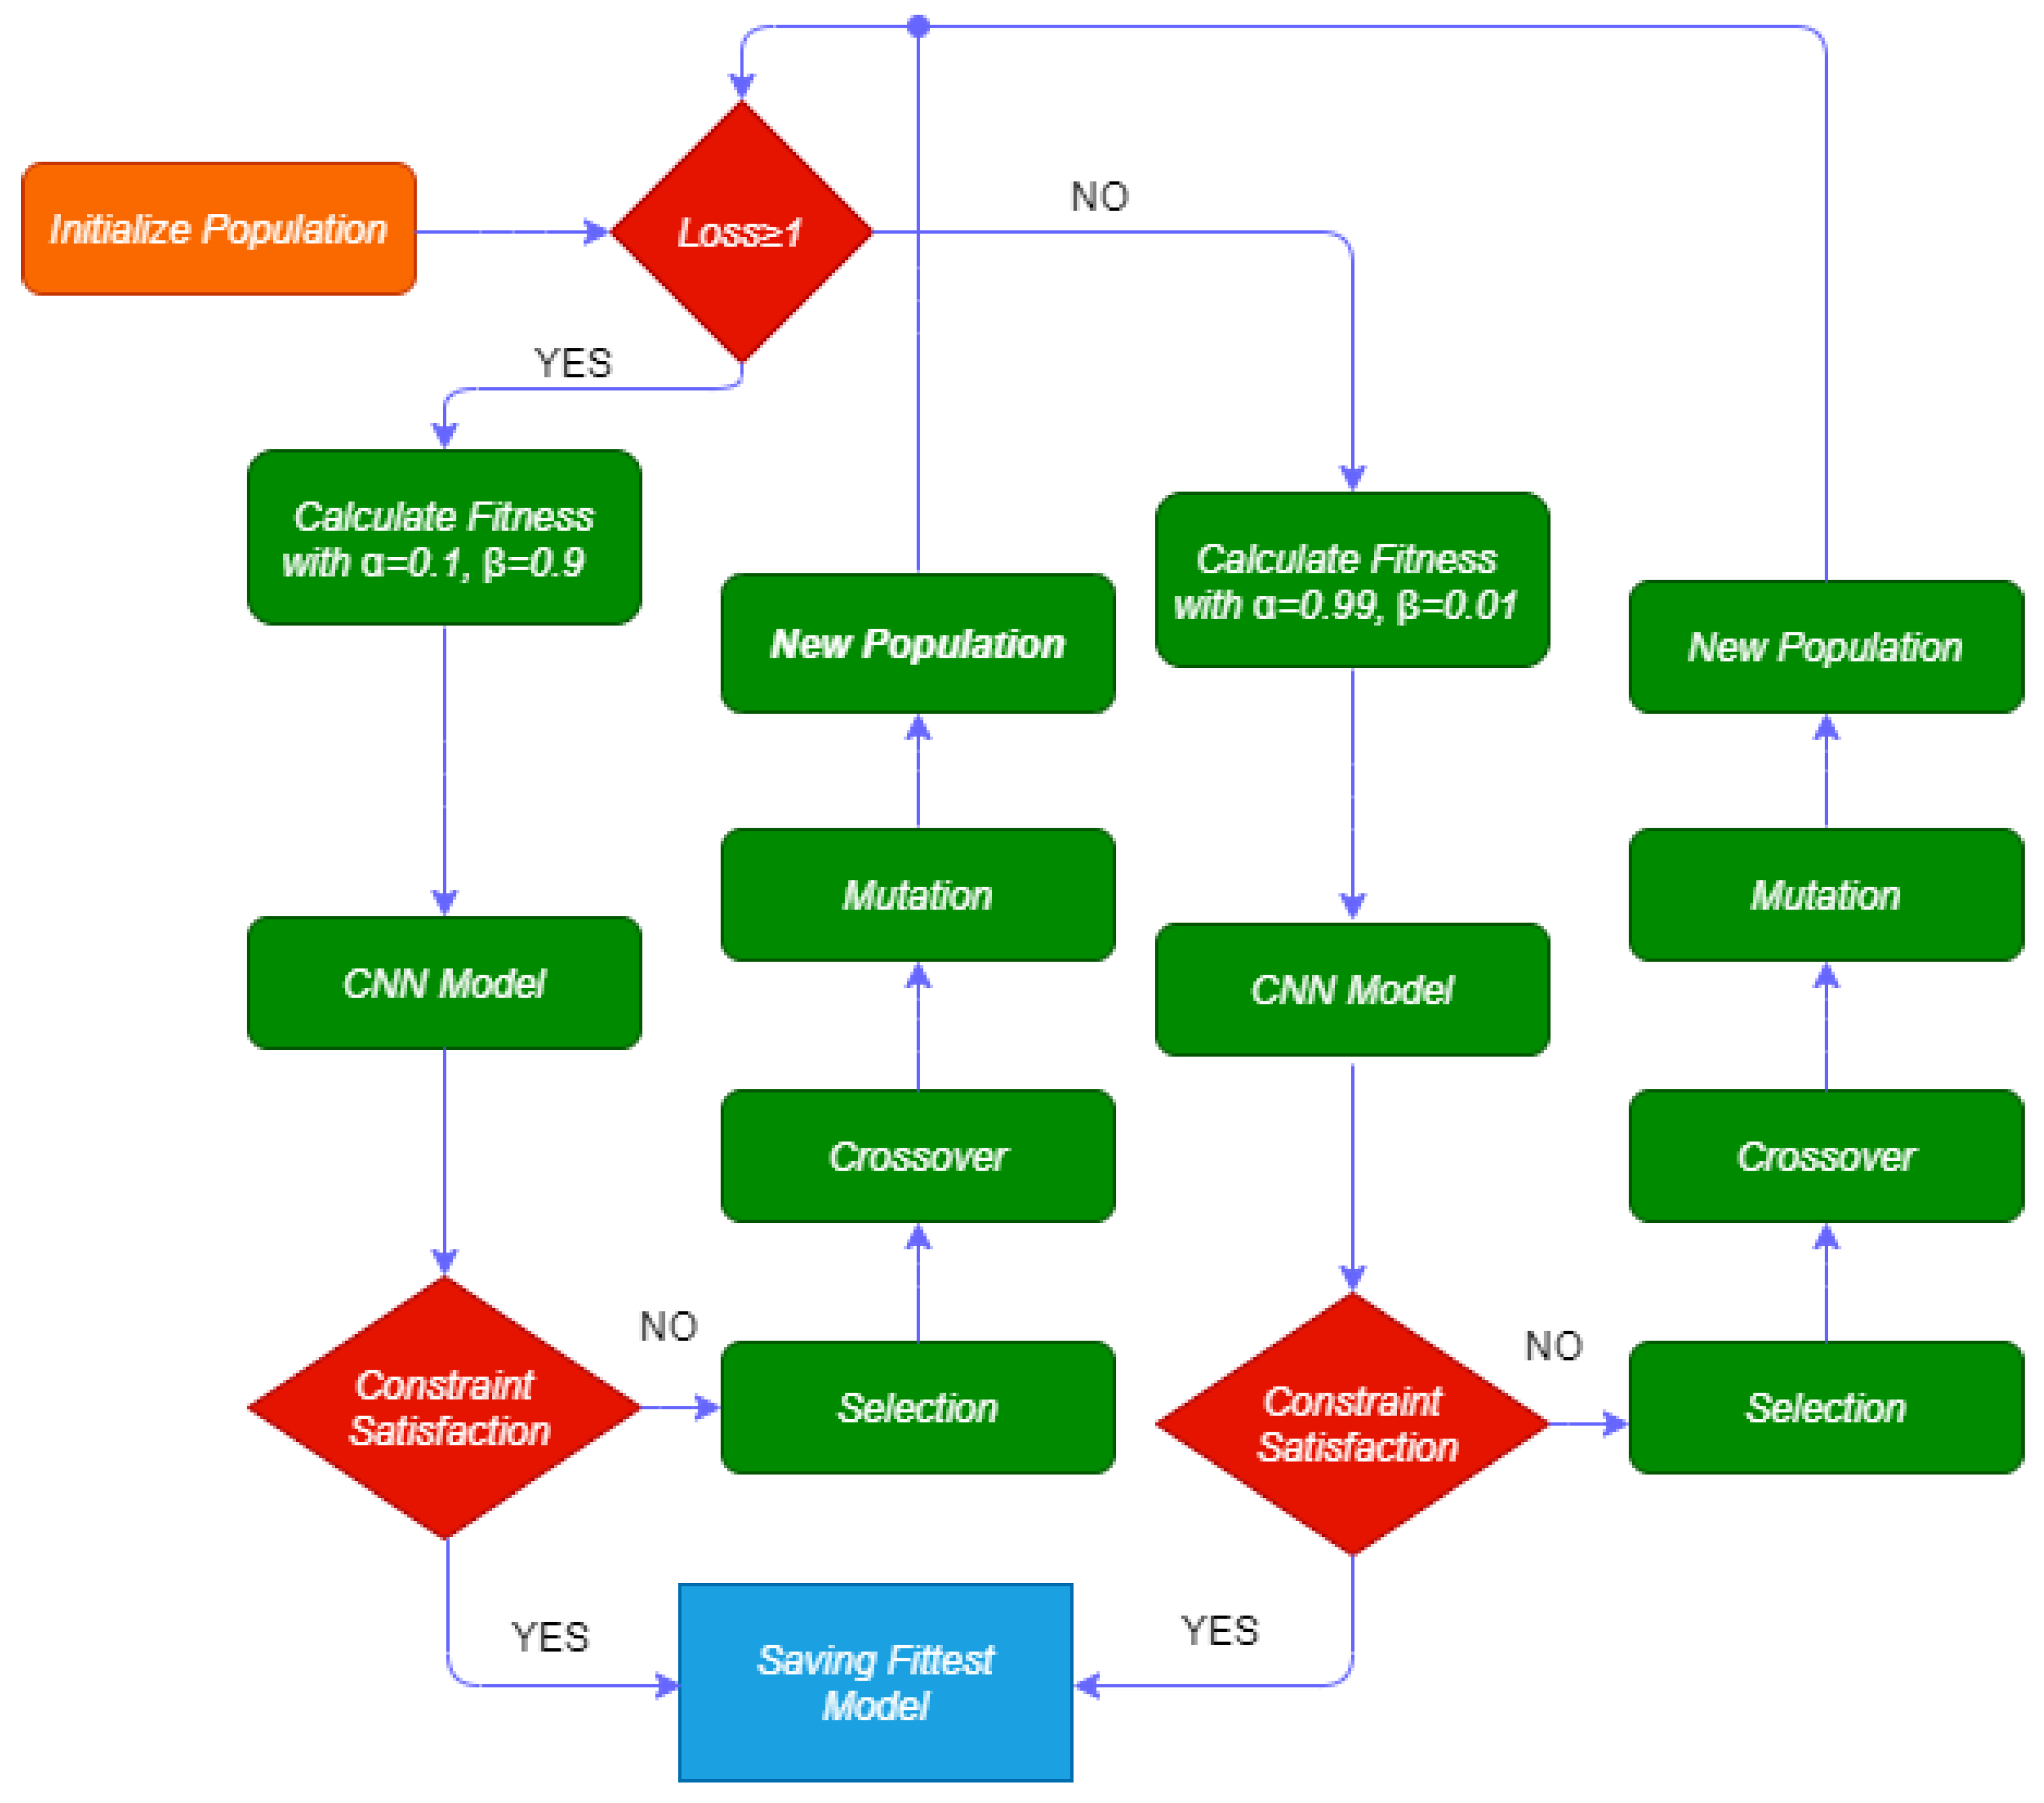
The flowchart of the applied genetic algorithm has shown in Figure 2. At the beginning of the training phase, the number of filters, the number of convolution kernels, and the number of neurons in each layer are randomly initialized. Then, the fitness function is calculated for the first generation. Using crossover and possible mutation of the parents, the next generations are created. The fitness values for new children are sorted in descending order and the best of them are selected for the next generations. Using this algorithm, the model’s loss decreases gradually and the accuracy increases continuously.
The fitness function of the genetic algorithm is defined as
F = α · a · V 1 + β 1 l + ε V 2
where a and l are the accuracy and the loss, respectively, measured on the test set. α and β are two hyperparameters that are specified based on calculated loss (2). ε is a small value that has been added to the denominator to avoid dividing by zero. V 1 and V 2 are defined below to select the best kernel size, the filter size, and the number of neurons and epochs.
V 1 = 0.3 * N F N F T + 0.3 * N K N K T + 0.2 * N U N U T + 0.2 * N E 1.5
and
V 2 = 0.3 * 1 N F N F T + 0.3 * 1 N K N K T + 0.2 * 1 N U N U T + 0.2 * 1 N E 1.5
where N F is the number of convolution filters, N F T is the total number of convolution filters. N K is the number of convolution kernels. N K T is the total number of convolution kernels. N U is the number of neurons at the deep layer. N U T is the total number of neurons at the deep layer, and N E is the total number of epochs.
The fitness function has been defined in a way that increases the accuracy while decreasing the loss. To make sure the value of the fitness function is smooth, we define the values of α and β as
  • If the loss (l), is greater than or equal to 1, the Categorical Crossentropy Loss (CCL) varies between 1 and 10. So, we define alpha and beta as 0.1 and 0.9, respectively.
  • If the loss (l), is less than 1, the CCL varies between 0.001 and 1. So, we define α and β as 0.99 and 0.01, respectively.
In summary, the proposed approach sets the number of neurons, convolutional kernel size, and convolutional filter size. Besides choosing mentioned parameters of the model, GAOCNN indicates the number of epochs for training the model too. Thus, GAOCNN tries to increase the number of epochs as long as the tuned structure increases the accuracy and decreases the loss. Choosing the number of epochs for training leads to the optimal time for training.

6. EXPERIMENTAL RESULT

To evaluate the proposed model for diabetic patients, we use the diabetes 130-US hospitals dataset [29]. The dataset represents ten years (1999–2008) of clinical care at 130 hospitals and integrated delivery networks in the United States. In total, there are 101,766 records (encounters) available for analysis. This data source generally has 50 attributes (13 attributes are integer types and 37 attributes are object types). In this research, we use the attributes in which the missing value percentage is less than 20%. We have also removed constant and quasi-constant attributes for our dataset, as these provide no information for the classification task. Constant attributes are the features that contain a single value for all records in the dataset [38]. Quasi-constant attributes are almost stable features. Here, we consider features as the quasi-constant with the same value in more than 99.99% of the records. Hospital readmission was stratified into three cohorts: patients who are never readmitted after discharge, patients who are readmitted within 30 days of discharge, and patients who are readmitted after 30 days of discharge (up to a year) [29]. Figure 3 shows the population size of each diabetic patient. As can be seen, 54% of the patients are never readmitted after discharge, resulting in imbalanced data.
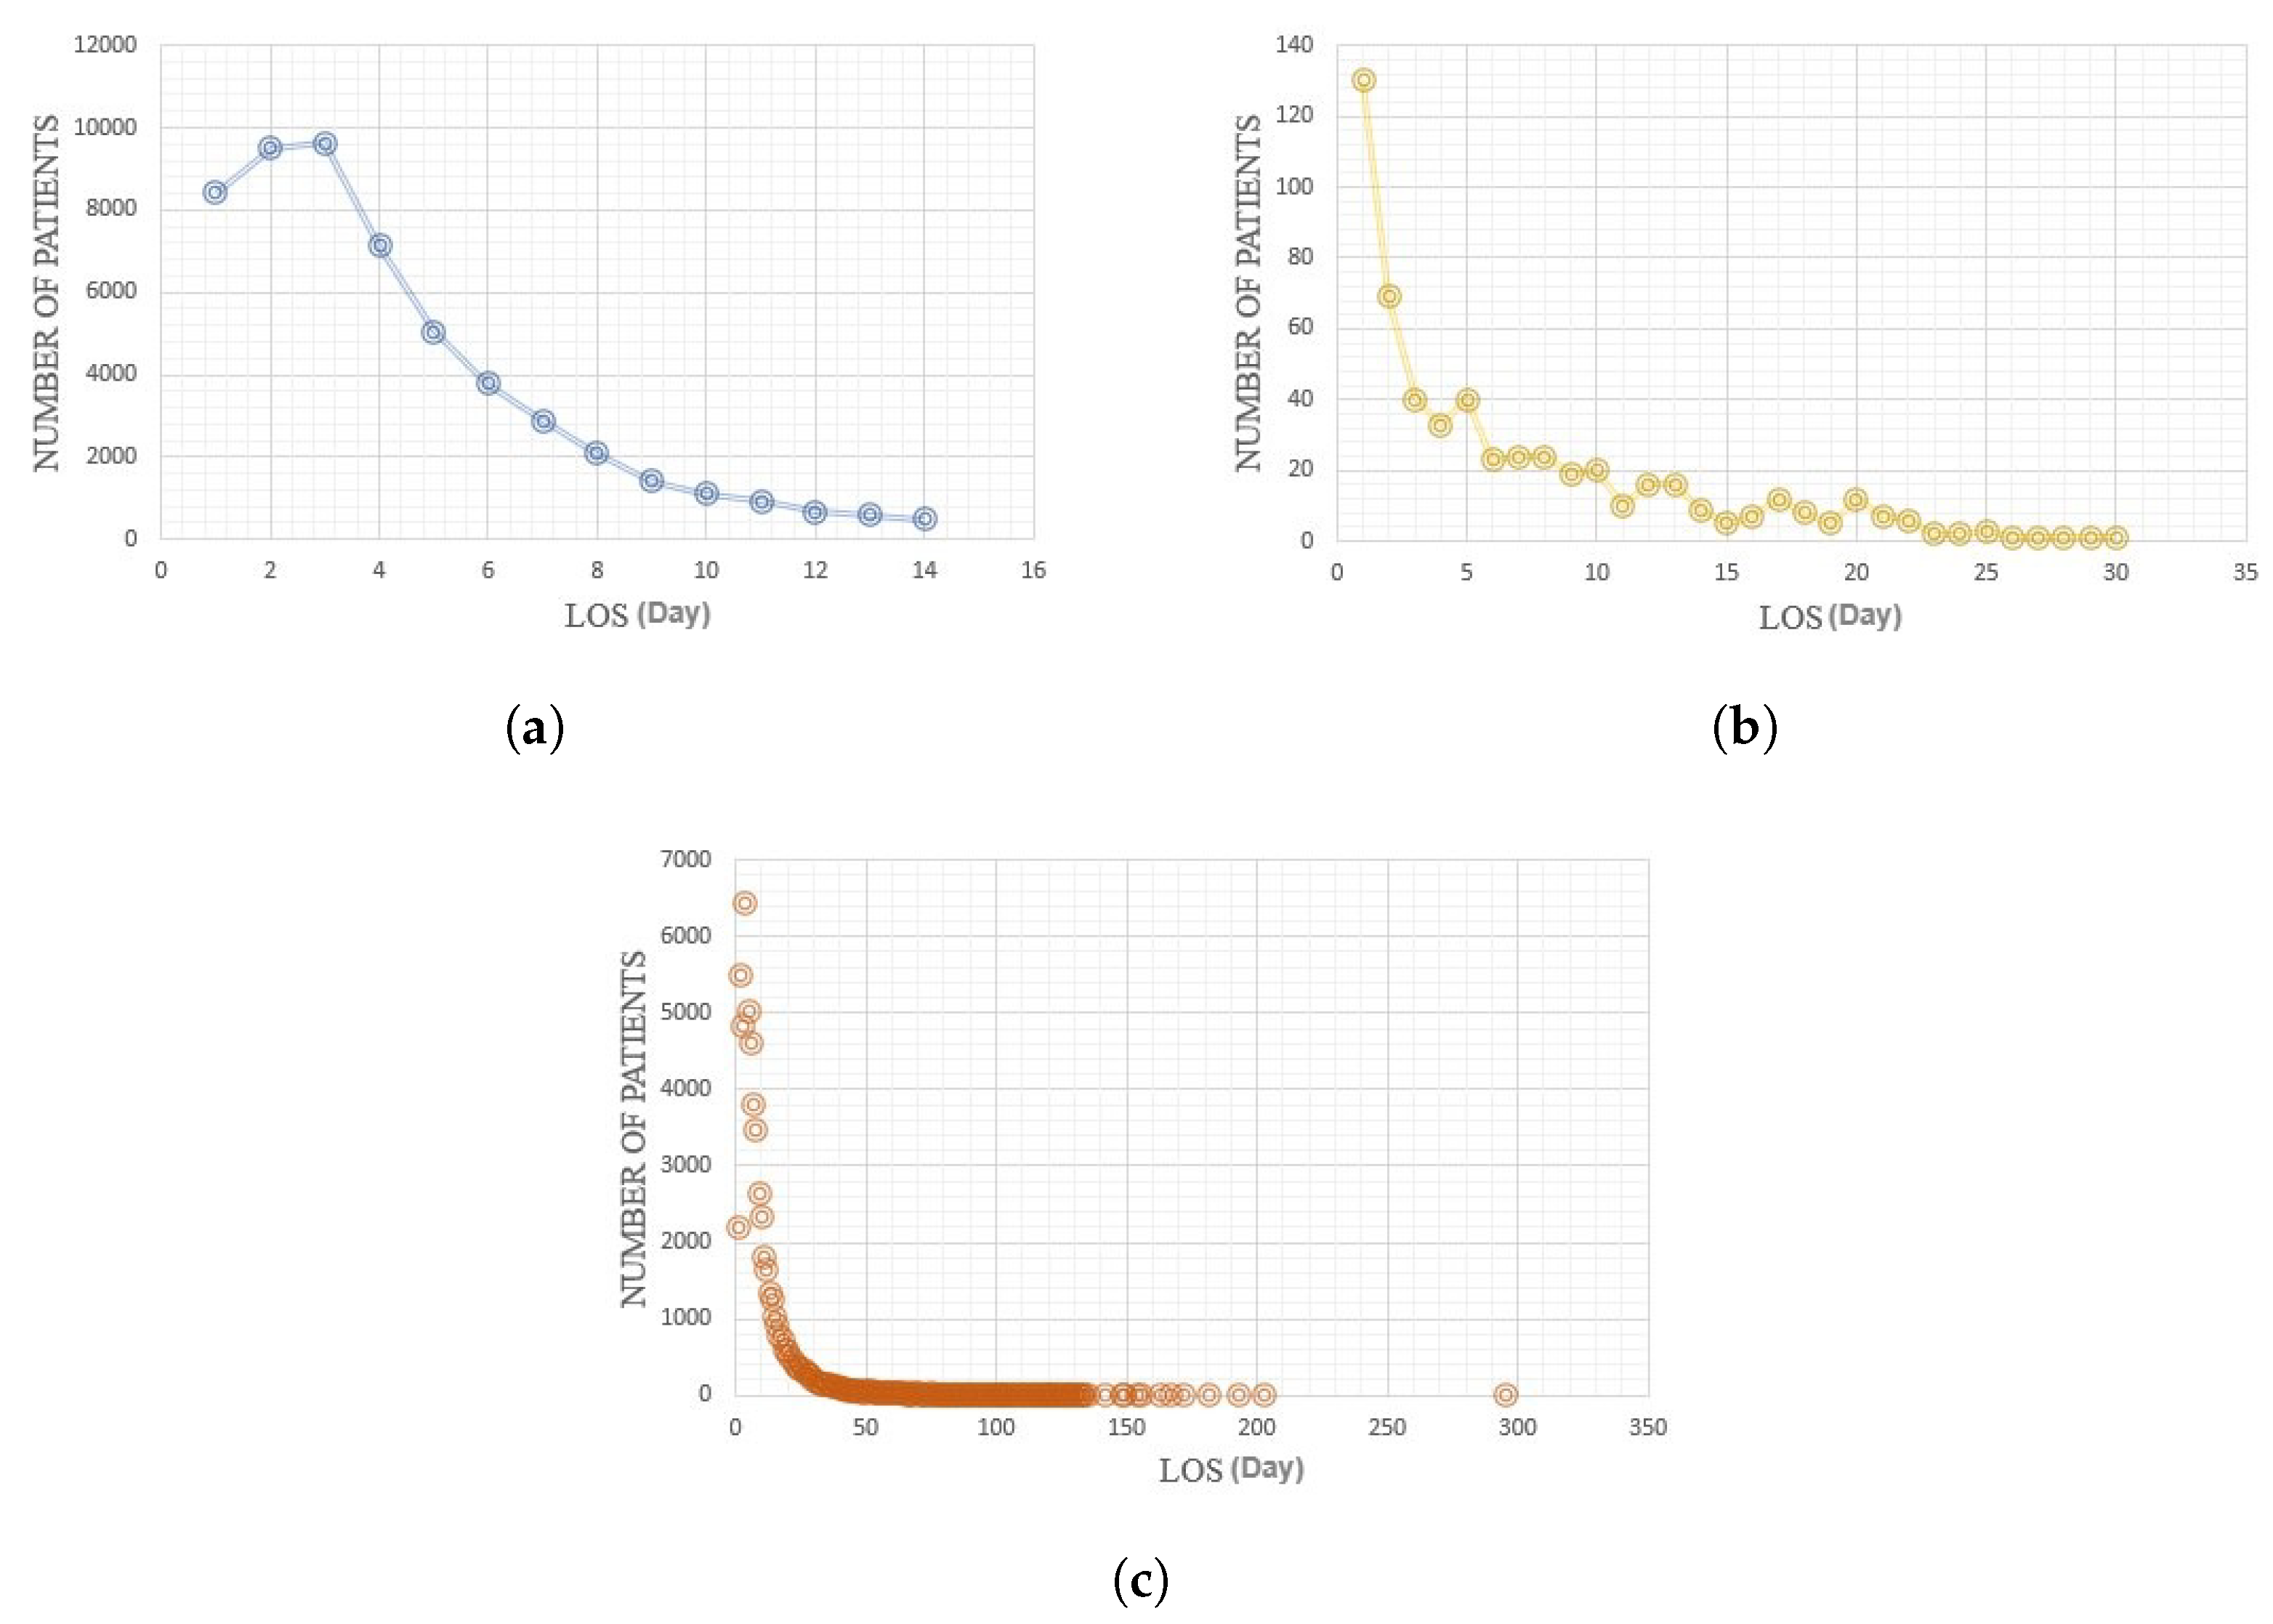
The hospital length of stay (LOS) range varies for different diseases. For diabetic patients, the length of stay is between 1 to 14 days. For COVID-19 patients, the LOS is between 1 to 27 days in the dataset. For ICU patients, it is between 1 to 289 days in the MIMIC-III dataset. To consider these variations, we create different classes for the length of stay on each disease. For diabetic patients, we consider seven classes: 1–2 days, 3–4 days, 5–6 days, 7–8 days, 9–10 days, 11–12 days, and 13–14 days. For COVID-19 patients, we consider these classes: 1–2 days, 3–4 days, 5–6 days, 7–8 days, 9–10 days, 11–12 days, 13–16 days, 17–20 days, and 21–27 days. For the MIMIC-III dataset, we consider the classes the same as the COVID-19 dataset up to a 20-day LOS. But, for a LOS longer than 20 days, we make these classes: 21–30 days, 31–50 days, 51–80 days, 81–110 days, and longer than 110 days. We have considered 3-day intervals for short-term length of stays similar to the existing research [22,39,40]. For the long-term length of stays, we considered larger intervals to avoid having many classes. The narrow class division will help hospitals and the healthcare system to determine hospital staff and necessary beds for servicing patients better.
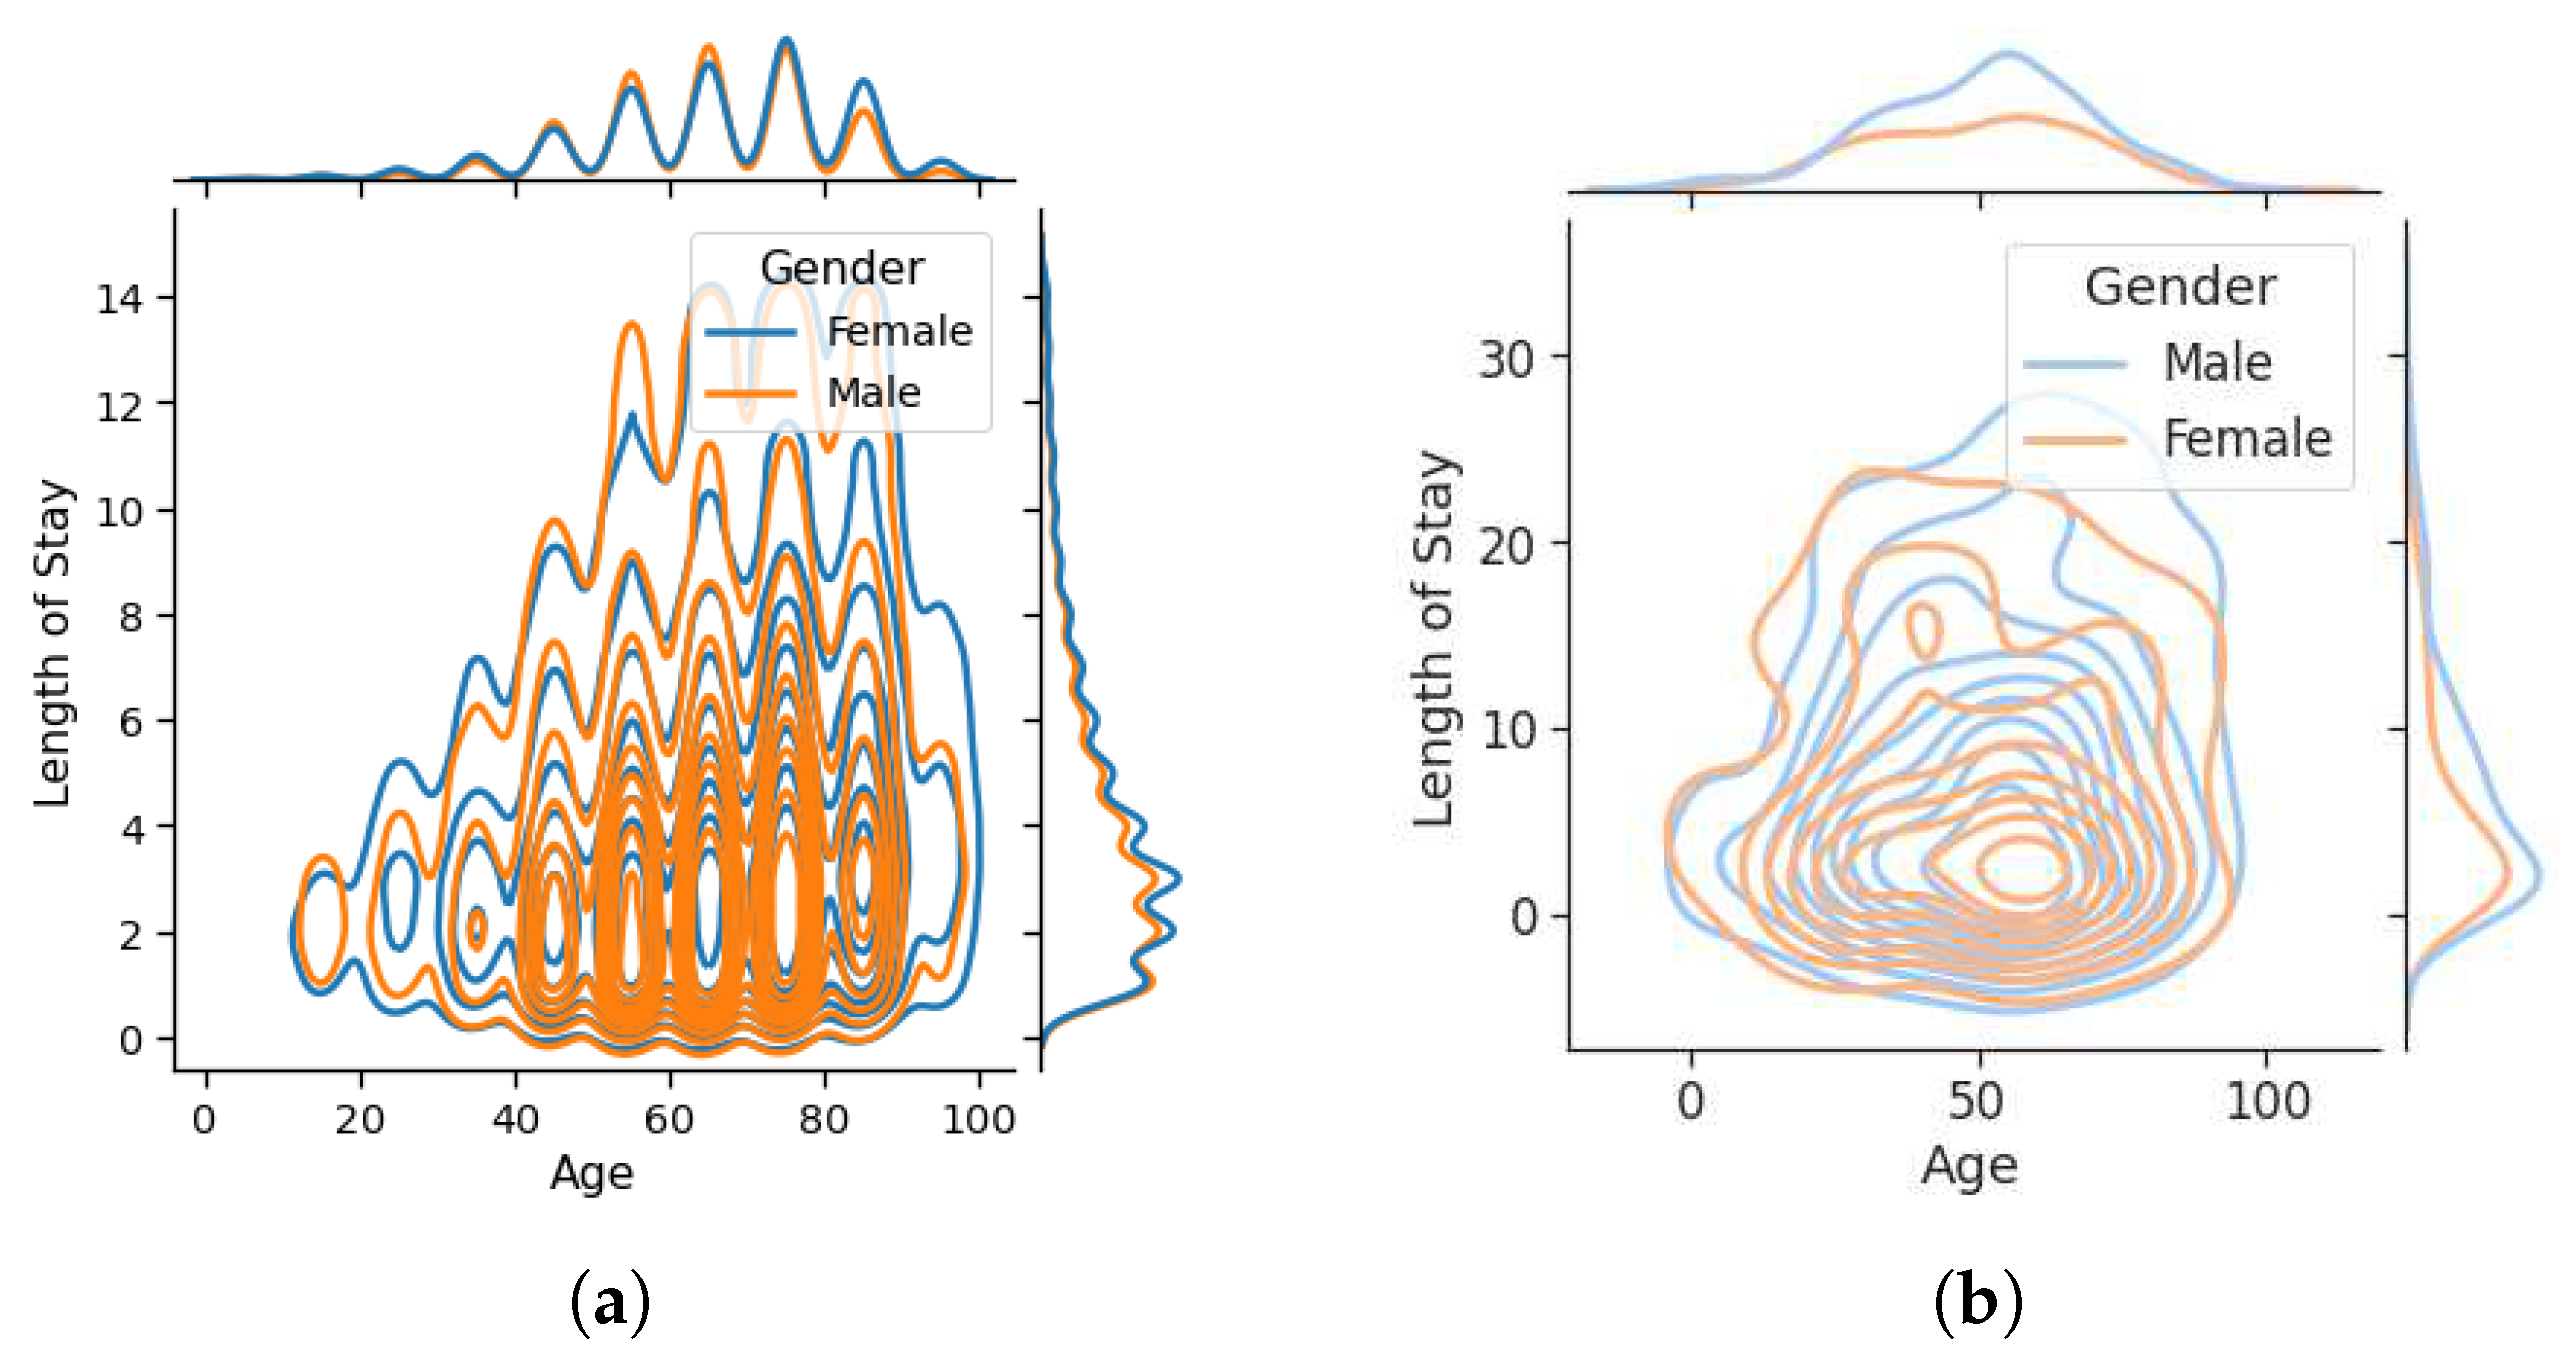
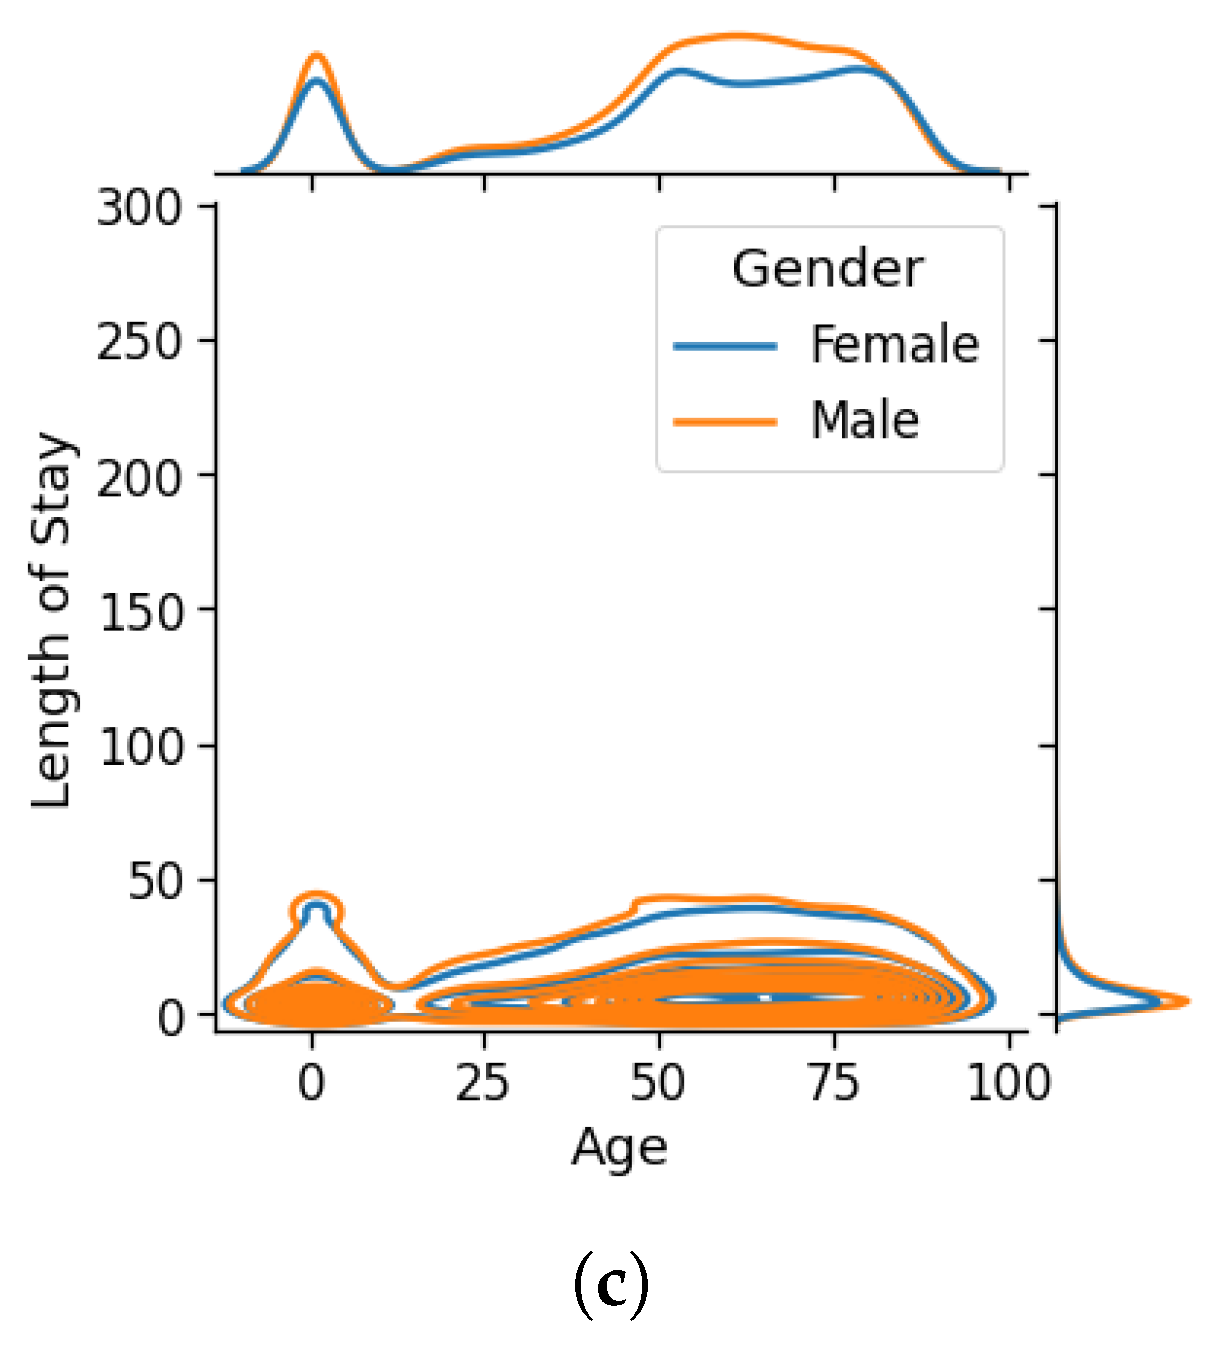
The distribution of the length of stay in each dataset is shown in Figure 4. As can be seen, by the increase in the length of stay, the density (the number of patients) decreases. One of the most important features that affect patients’ LOS is age [41]. Figure 5 shows the relationship between age and length of stay for different genders in the used datasets. The figure shows that most patients are aged 50 to 70 years and the length of stay increases with age. In the MIMIC-III dataset, a surge of length has been recorded for patients aged 0 to 2 years that belong to young children.

6.1. Preprocessing

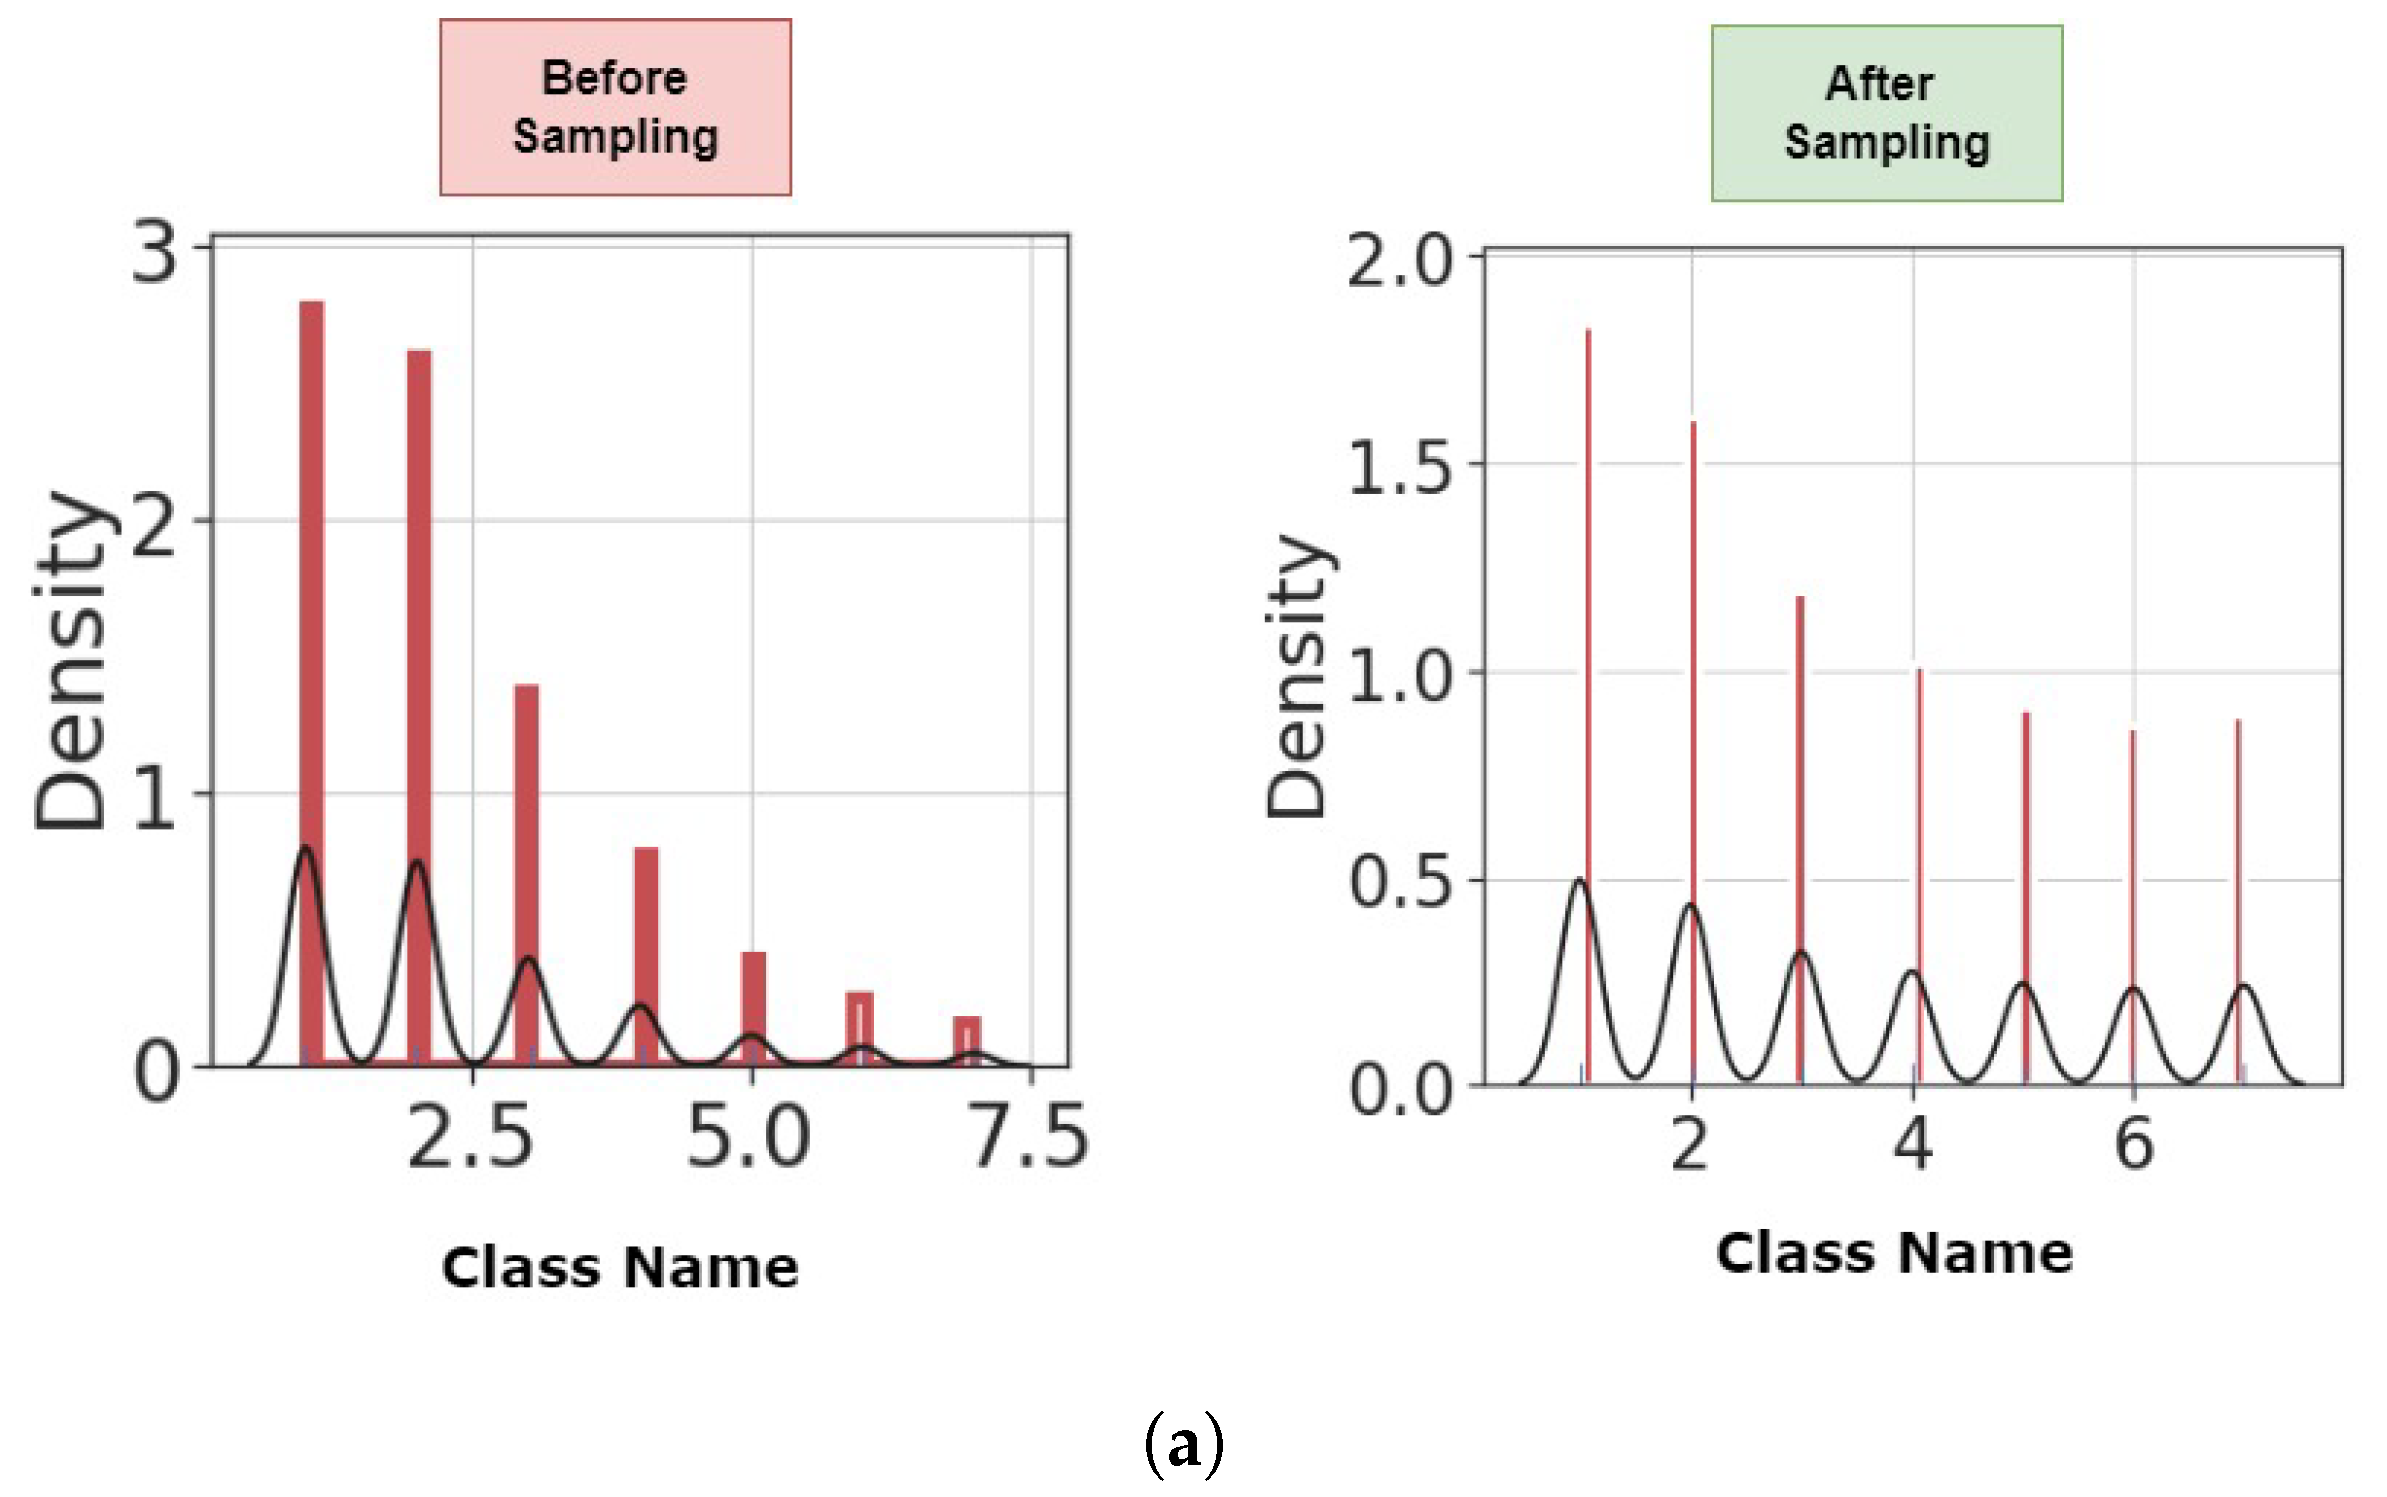
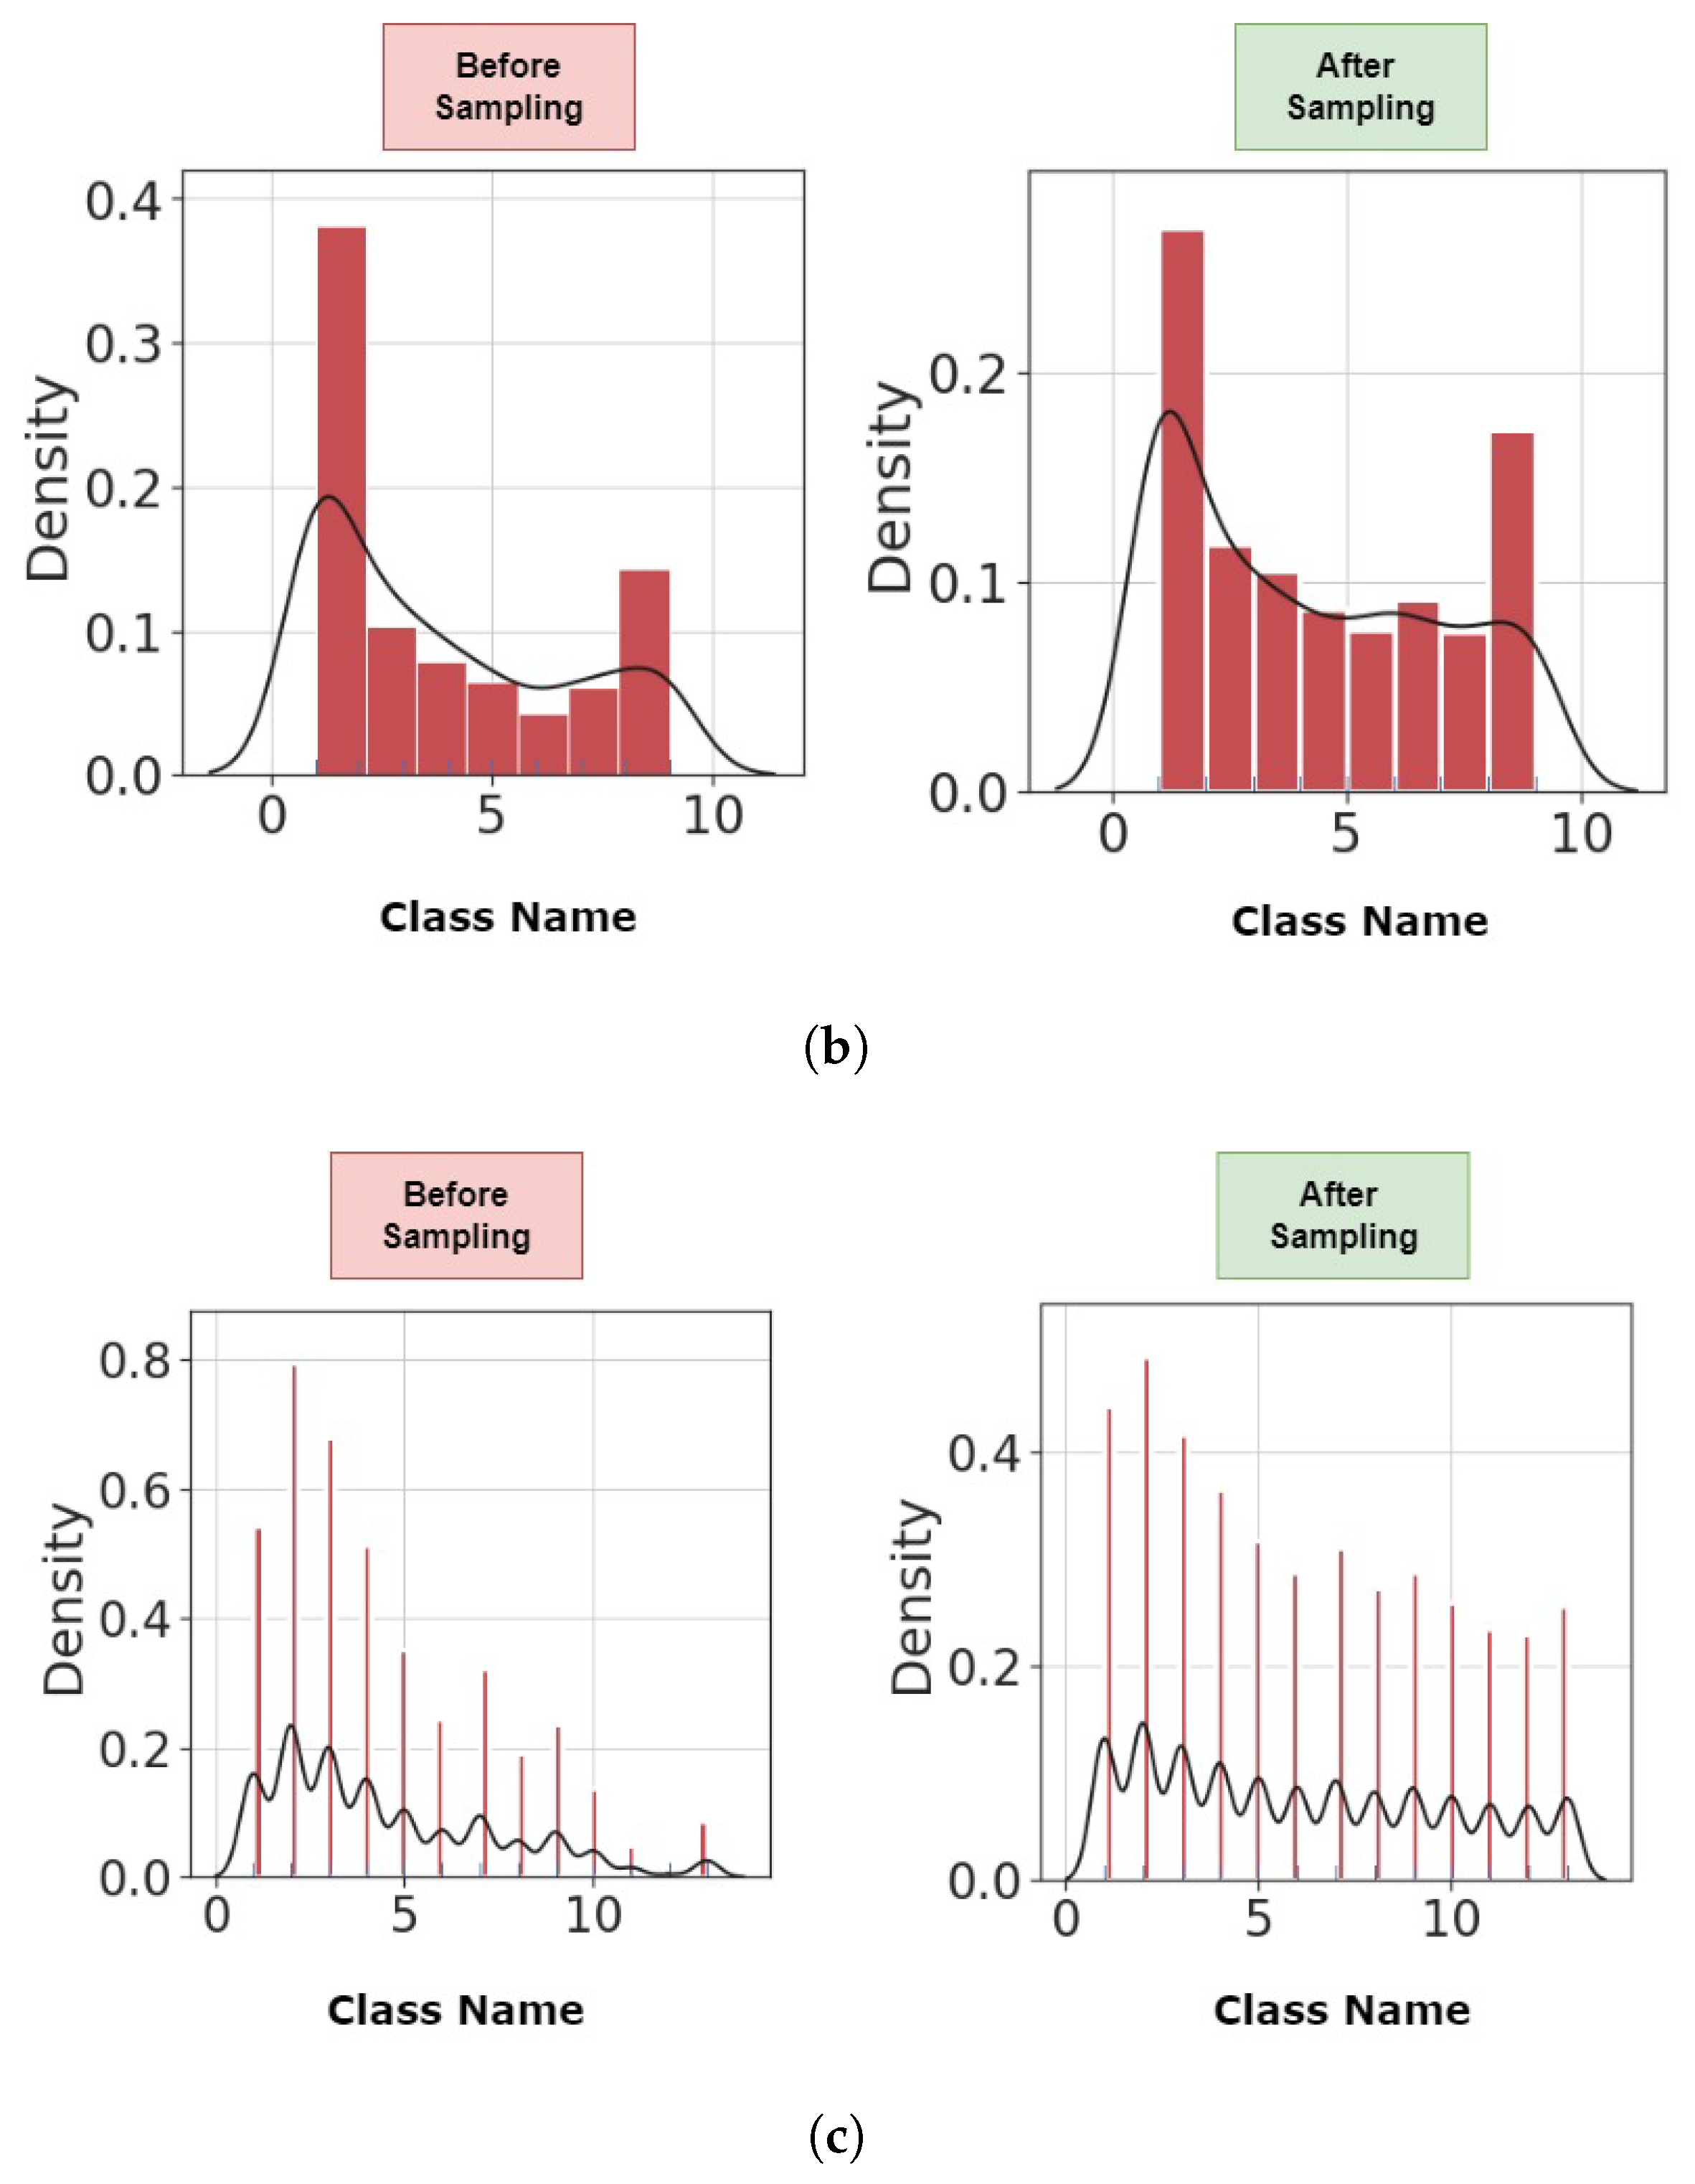
Considering the number of null values for each feature in the datasets, we ignored features with more than 20% unknown value. We imputed the features that have a null value less than 20% with the use of k nearest neighbor [42]. Also, we computed the correlation between features and eliminated the features having more than 50% correlation. We also eliminated features with constant values. After cleaning the datasets, we applied three different encoding procedures. First, we used a label encoder that converts ’No’ values to ’0’ and ’Yes’ values to ’1’. Then, we applied the One-hot encoding and target encoding [43] to the cleaned datasets. The use of one-hot and target encoders has shown promising results when CNN is used as a classifier [44]. As mentioned, the used datasets are imbalanced in terms of both the readmission and the length of stay. This can affect the performance of the proposed model. Here, we use an advanced sampling technique called T-Link [45], followed by an oversampling technique to make the datasets balanced. Using this method, the total number of instances for the readmission prediction will decrease to 33,104 samples (11,150 never readmitted, 11,150 readmitted within 30 days, and 10,804 readmitted after 30 days). The distribution of the length of stay in the balanced datasets is shown in Figure 6.
As it is shown in Figure 6 after using sampling methods the distance between the distribution of each class is decreased while the original distribution is saved.

6.2. Performance Analysis

After preprocessing, we divide each dataset into three sets: train, validation, and test. For better evaluation of the proposed model, we use k-fold cross-validation [46]. Here, we consider K as 10. A single fold acts as a test set, while the remaining nine folds are used as the training set. Finally, the results are averaged to represent a single estimation. The model was trained using the Tesla P100 graphics processing unit. The runtime for reaching the desired result was different based on the dataset and the number of classes for prediction. For MIMIC-III and diabetes datasets, the runtime to train the model was between 3 to 4 days whereas for LOS prediction on the COVID-19 dataset, the runtime was about 6 hours. To compare the proposed model, we used VGG16, ResNet, GoogLeNet [28], Logistic Regression (LR) [17], Random Forest (RF) [17], eXtreme Gradient Boosting (XGBoost) to [20]), and Support Vector Machine (SVM) as the benchmarks. Also, we implemented a combination of CNN and LR, CNN and RF, CNN and XGBoost, CNN and SVM, and a semi-supervised Generative Adversarial Network (SGAN) model. For combining CNN with other machine learning methods we used convolutional layers as feature extractors and machine learning models as classifiers [47]. SGAN uses the CNN model achieved by GAOCNN as a generator and a multi-layer perception with 3 hidden layers and 128, 64, and 23 units respectively as discriminator [48]. We just converted the structure of the 2D convolutional layer of the mentioned model into 1D convolutional to match the structure of healthcare data. Table 1 indicates the performance of the readmission prediction using the proposed model (GAOCNN) and the benchmark models for diabetic patients. As can be seen, the GAOCNN outperforms all benchmarks.
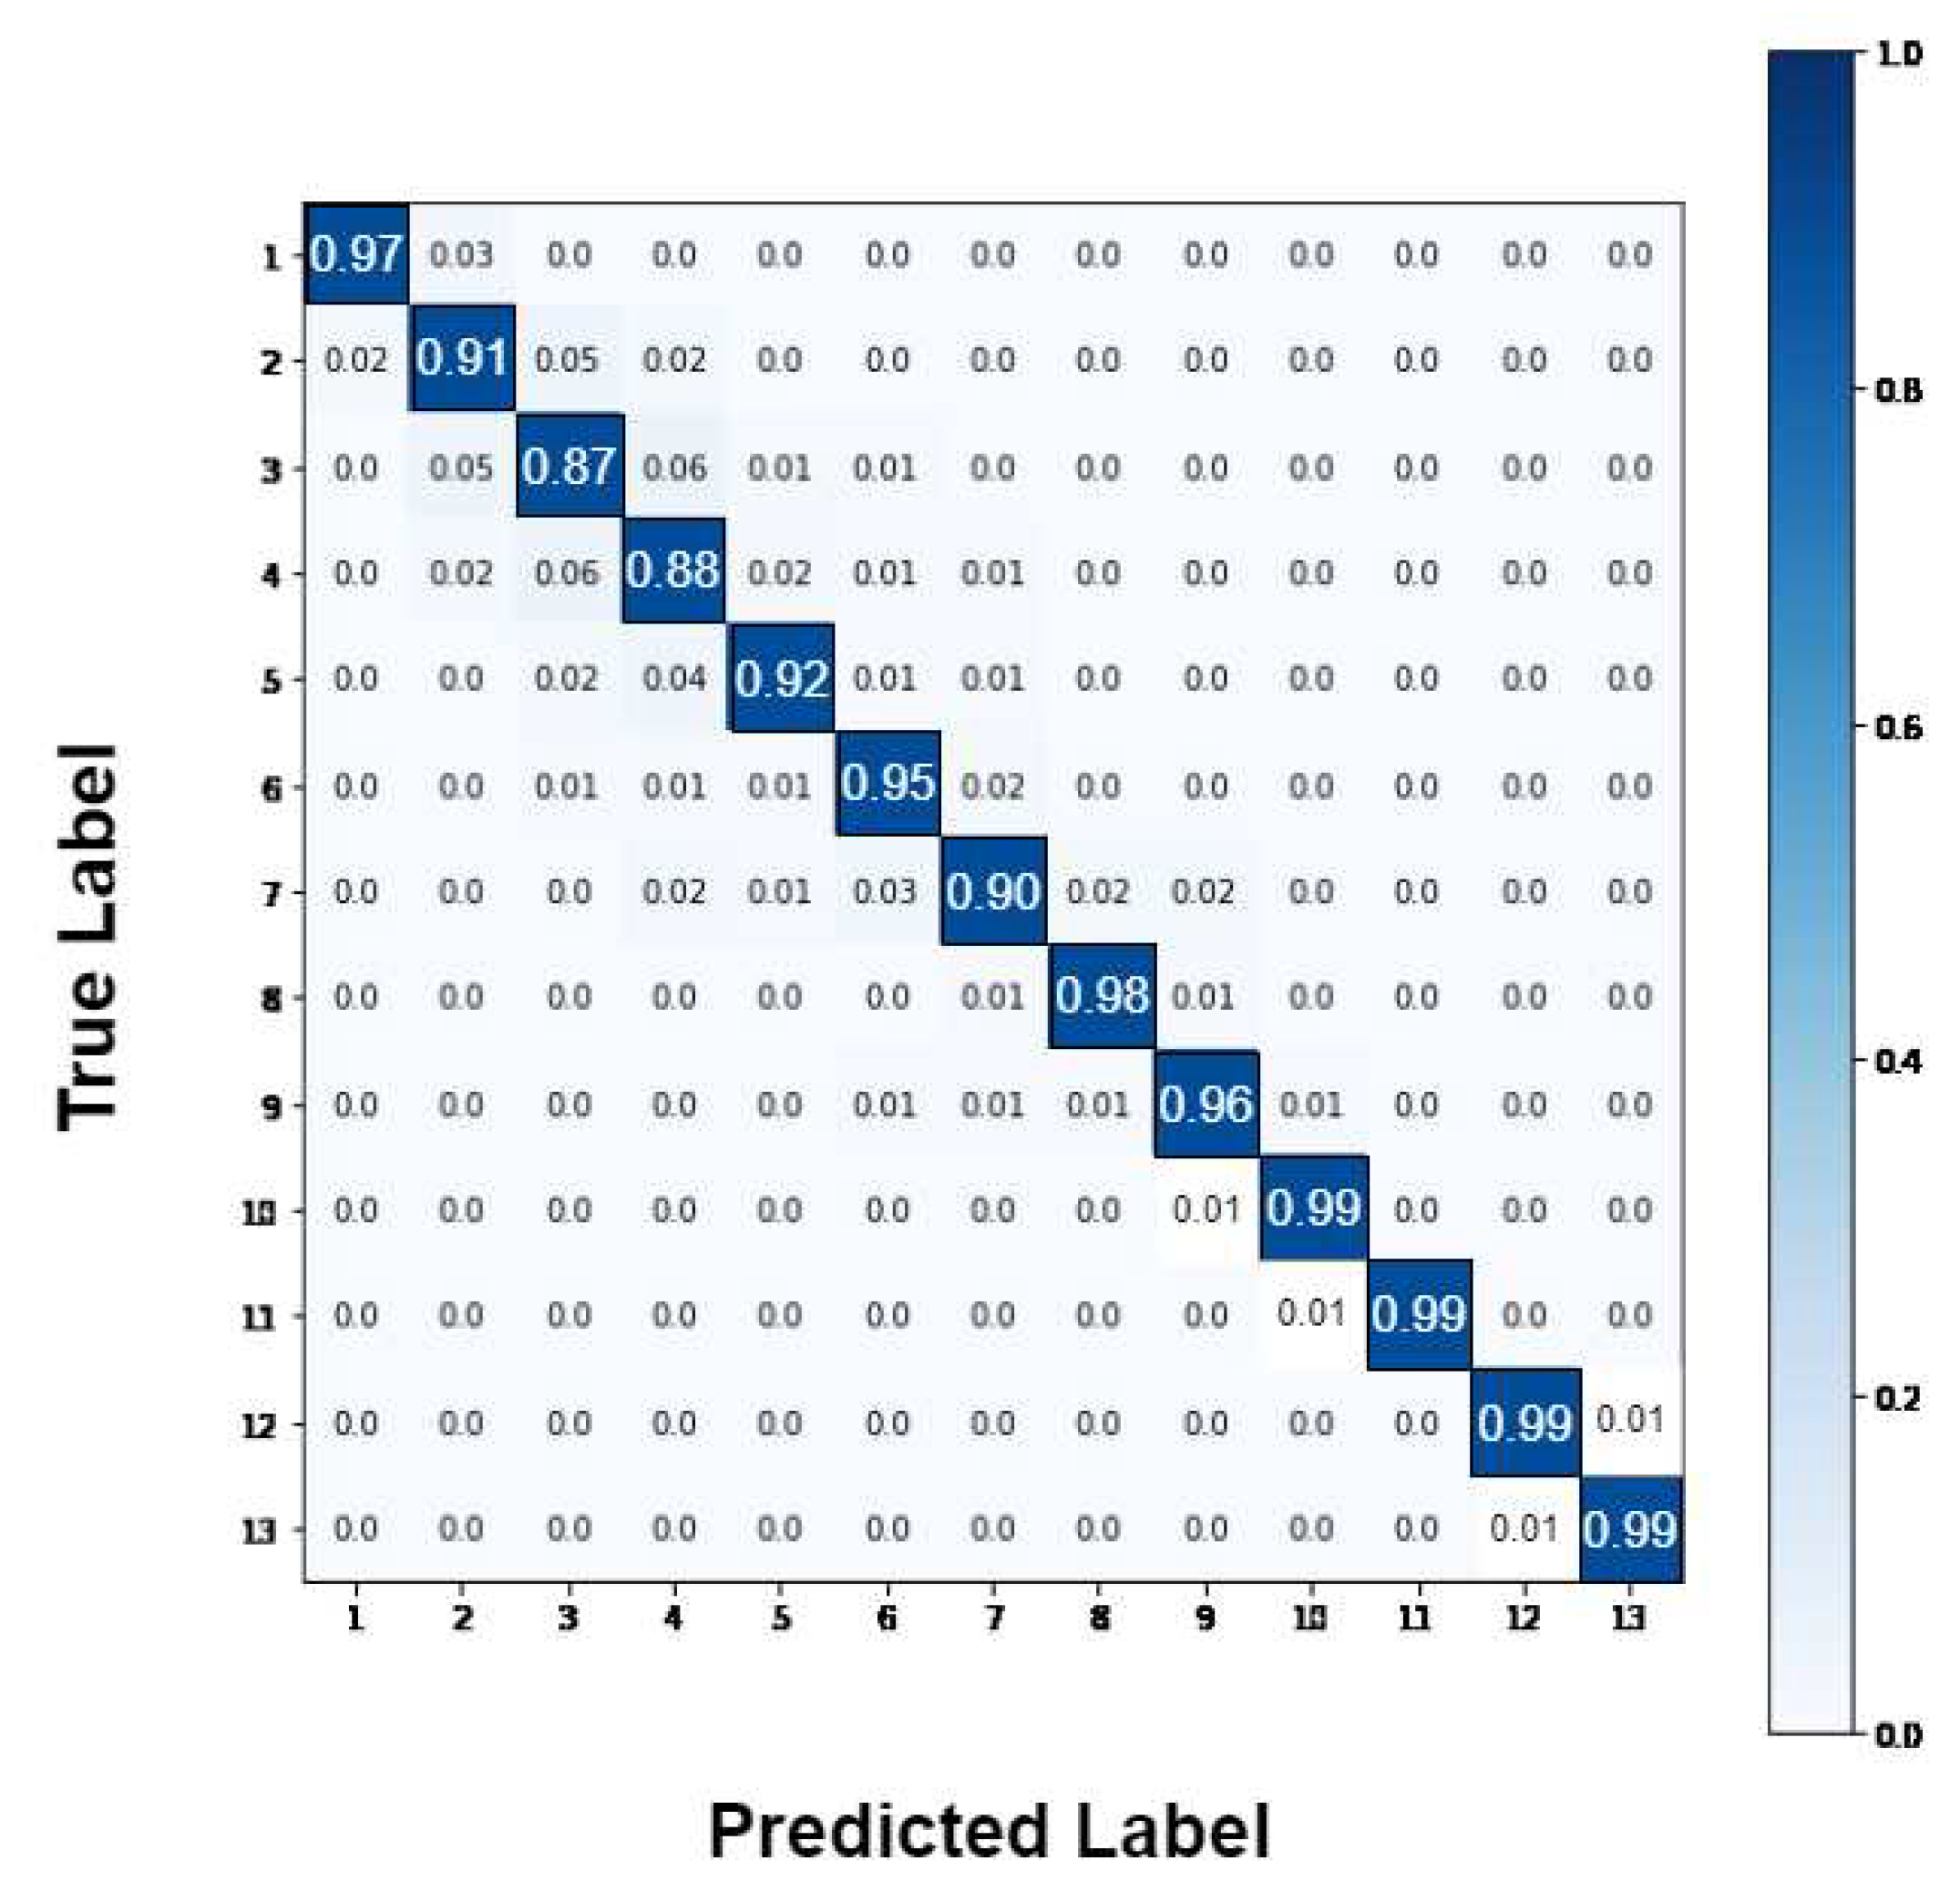
The classification results of the length of stay for diabetic, COVID-19, and ICU patients are shown in Figures 2, 3 and 4, respectively. As can be seen, the performance of the GAOCNN is higher than all benchmarks for the length of stay prediction in all diseases.
Table 2. Results of the length of stay prediction using different models for diabetic patients.
Model Accuracy (%) Sensitivity (%) Specificity (%) F1-Measure (%) Precision (%)
GAOCNN 89.0 89.8 97.8 90.2 90.4
VGG16 18.1 18.1 25.4 18.1 18.1
ResNet 17.7 17.7 20.8 17.7 17.7
GoogLeNet 28.6 2.3 35.6 4.5 67.9
LR 28.9 28.9 32.6 26.4 26.3
RF 79.9 79.9 92.7 79.7 79.6
XGBoost 78.8 78.8 92.6 78.3 77.9
SVM 36.5 33.5 42.3 32.1 31.9
CNN + LR 32.7 32.7 45.3 31.3 30.9
CNN + RF 80.0 80.0 93.4 79.7 79.6
CNN + XGBoost 78.8 78.8 94.4 78.3 77.9
CNN + SVM 36.2 36.2 43.3 34.8 34.5
SGANs 43.5 14.9 75.1 23.6 72.9
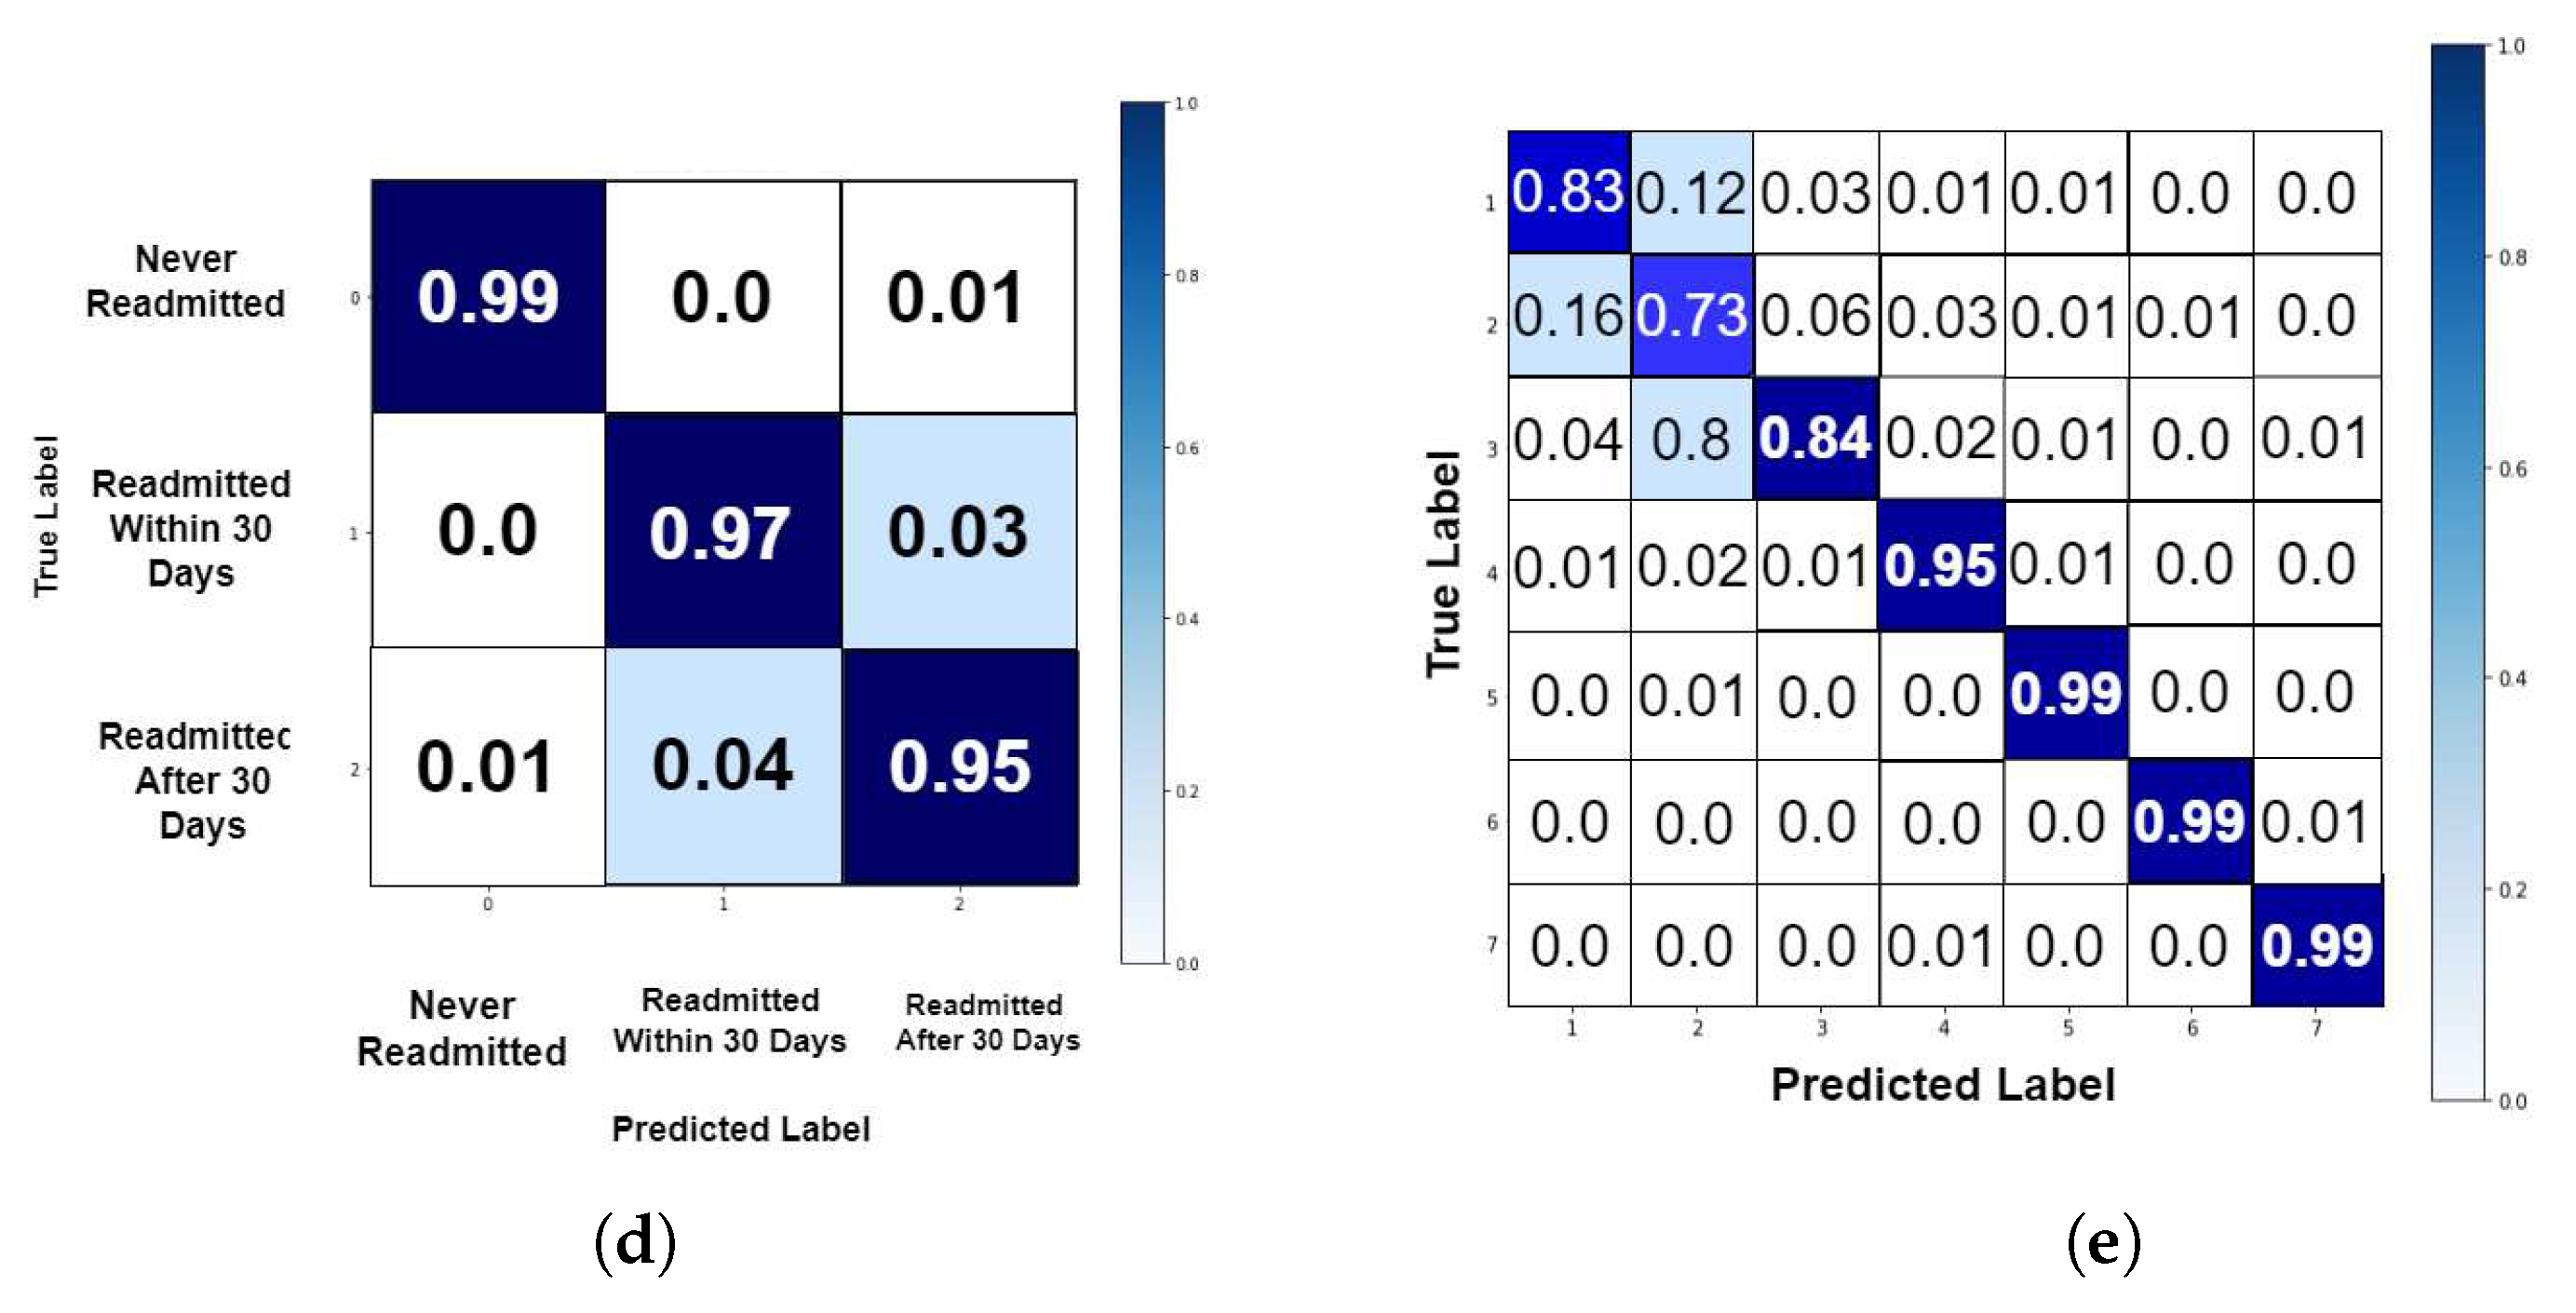
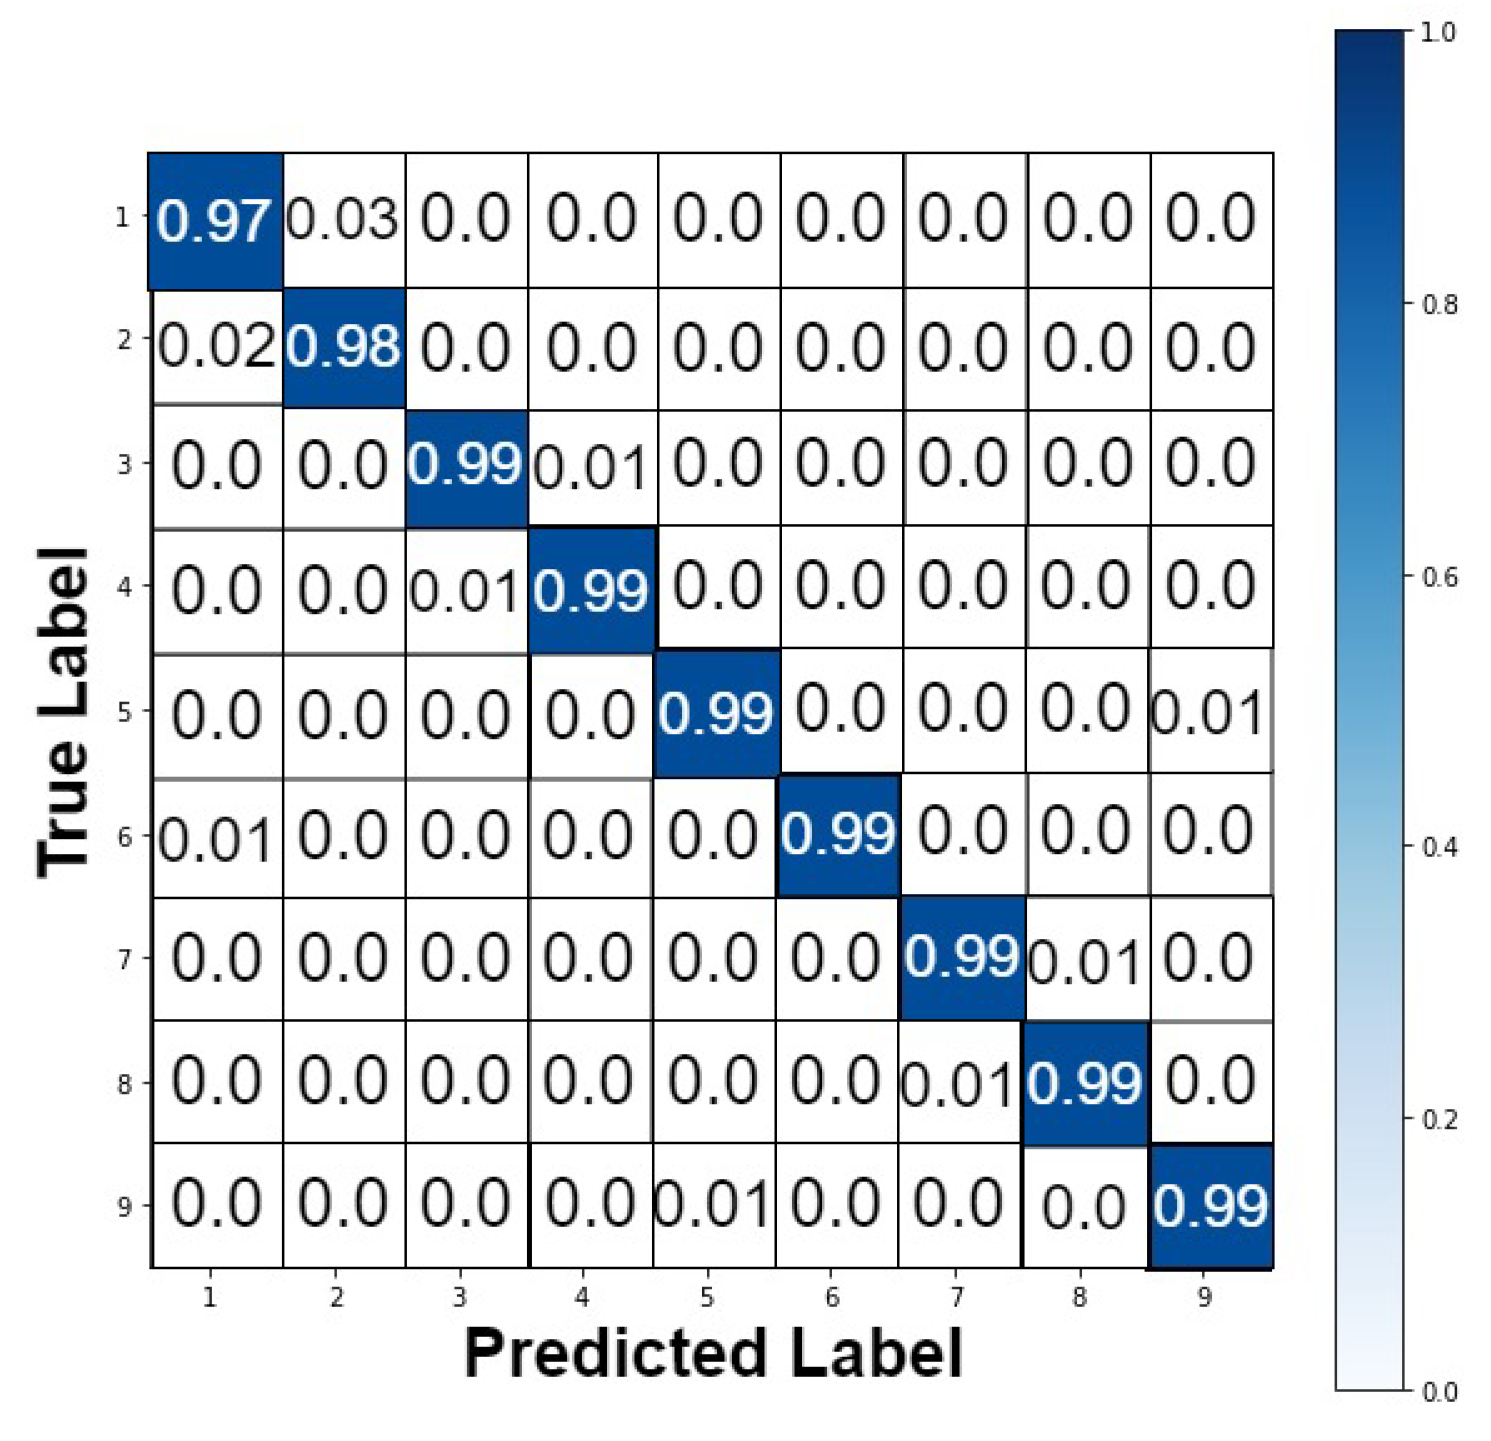
For better observation of the performed prediction tasks using GAOCNN, we compute the normalized confusion matrix [49] of the model. For readmission prediction in diabetic patients, the confusion matrix is shown in Figure 7. The result shows that for the patients that are readmitted within 30 days, there is just a 3% chance of incorrect prediction. Also, for the patients who are readmitted after 30 days, the error rate is 5%. For the length of stay, the normalized confusion matrix of the prediction in diabetic, COVID-19, and ICU patients is shown in Figure 7, Figure 8 and Figure 9, respectively.
Table 3. Results of the length of stay prediction using different models for COVID-19 patients.
Model Accuracy (%) Sensitivity (%) Specificity (%) F1-Measure (%) Precision (%)
GAOCNN 99.4 99.4 99.8 99.4 99.4
VGG16 14.1 14.6 20.5 14.6 14.6
ResNet 12.7 12.7 17.8 12.7 12.7
LR 92.1 92.1 98.8 92.1 92.3
RF 89.3 89.3 95.6 89.2 89.1
XGBoost 91.4 91.4 98.4 91.4 91.3
SVM 84.7 84.7 92.8 84.7 84.8
CNN + LR 70.3 70.3 89.9 70.2 70.6
CNN + RF 87.3 87.3 96.1 87.3 87.4
CNN + XGBoost 87.7 87.7 96.2 87.8 88.6
CNN + SVM 81.3 81.3 92.5 81.3 81.8
SGANs 93.5 93.3 98.8 93.6 93.9
Table 4. Results of LOS prediction using different models for ICU patients.
Model Accuracy (%) Sensitivity (%) Specificity (%) F1-Measure (%) Precision (%)
GAOCNN 94.1 94.0 98.8 94.2 94.5
VGG16 10.1 10.1 20.6 10.1 10.1
ResNet 8.7 28.7 8.9 17.7 17.7
GoogLeNet 17.7 15.9 42.6 25.2 60.1
LR 43.9 43.9 65.1 38.4 36.2
RF 76.1 76.1 89.6 76.1 76.0
XGBoost 83.5 83.5 93.7 83.3 83.2
SVM 56.0 59.4 83.3 56.1 56.0
CNN + LR 43.6 43.6 72.7 42.4 41.8
CNN + RF 80.9 80.9 90.6 80.9 81.0
CNN + XGBoost 83.2 83.2 96.5 83.1 82.9
CNN + SVM 39.8 39.8 59.0 39.3 39.6
SGANs 56.1 45.7 92.6 54.5 67.7
To compare the performance of the GAOCNN with other research, we surveyed the recently published work on hospital readmission and length of stay prediction. In this comparison, we used accuracy and area under receiving operation characteristic (AUROC) reported in the papers. The result of this comparison is shown in Table 5 and Table 6. The missing values in the tables mean that the papers have not reported them. This comparison result confirms that the GAOCNN is superior to the published works in both hospital readmission and length of stay prediction tasks.
Table 5. Comparison of the proposed model with the published works for readmission prediction on the diabetes dataset.
Model Accuracy (%) AUROC (%)
Tamin and Iswari ([50]) 75.9 -
Hammoudeh et al. ([18]) 92 95
Popel et al. ([45]) 82.27 -
Alturki et al. ([51]) 94.8 -
Goudjerkan and Jayabalan ([52]) 95 95
Seraphim et al. ([53]) 86 66.7
Norbrun ([54]) 89.7 96
GAOCNN 97.2 99
Table 6. Comparison of the proposed model and the published works for the length of stay prediction on diabetes, COVID-19, and MIMIC-III datasets.
Model Number of Classes Accuracy (%) AUROC (%) Dataset
Gentimis et al. ([55]) 2 79.8 - MIMIC-III
Steele and Thompson ([56]) 2 87.7 88 Diabetes
Alturki et al. ([51]) 3 85.4 - Diabetes
Nallabasannagari et al. ([57]) 2 66.2 88 MIMIC-III
Wang et al. ([58]) 2 68.3 73.3 MIMIC-III
Wang et al. ([58]) 2 91.2 71 MIMIC-III
Etu et al. ([59]) 2 85 93 COVID-19
Alabbad et al. ([60]) 9 94.16 - COVID-19
GAOCNN 7 89 96 Diabetes
GAOCNN 13 94.1 99 MIMIC-III
GAOCNN 9 99.4 99 COVID-19

7. DISCUSSION

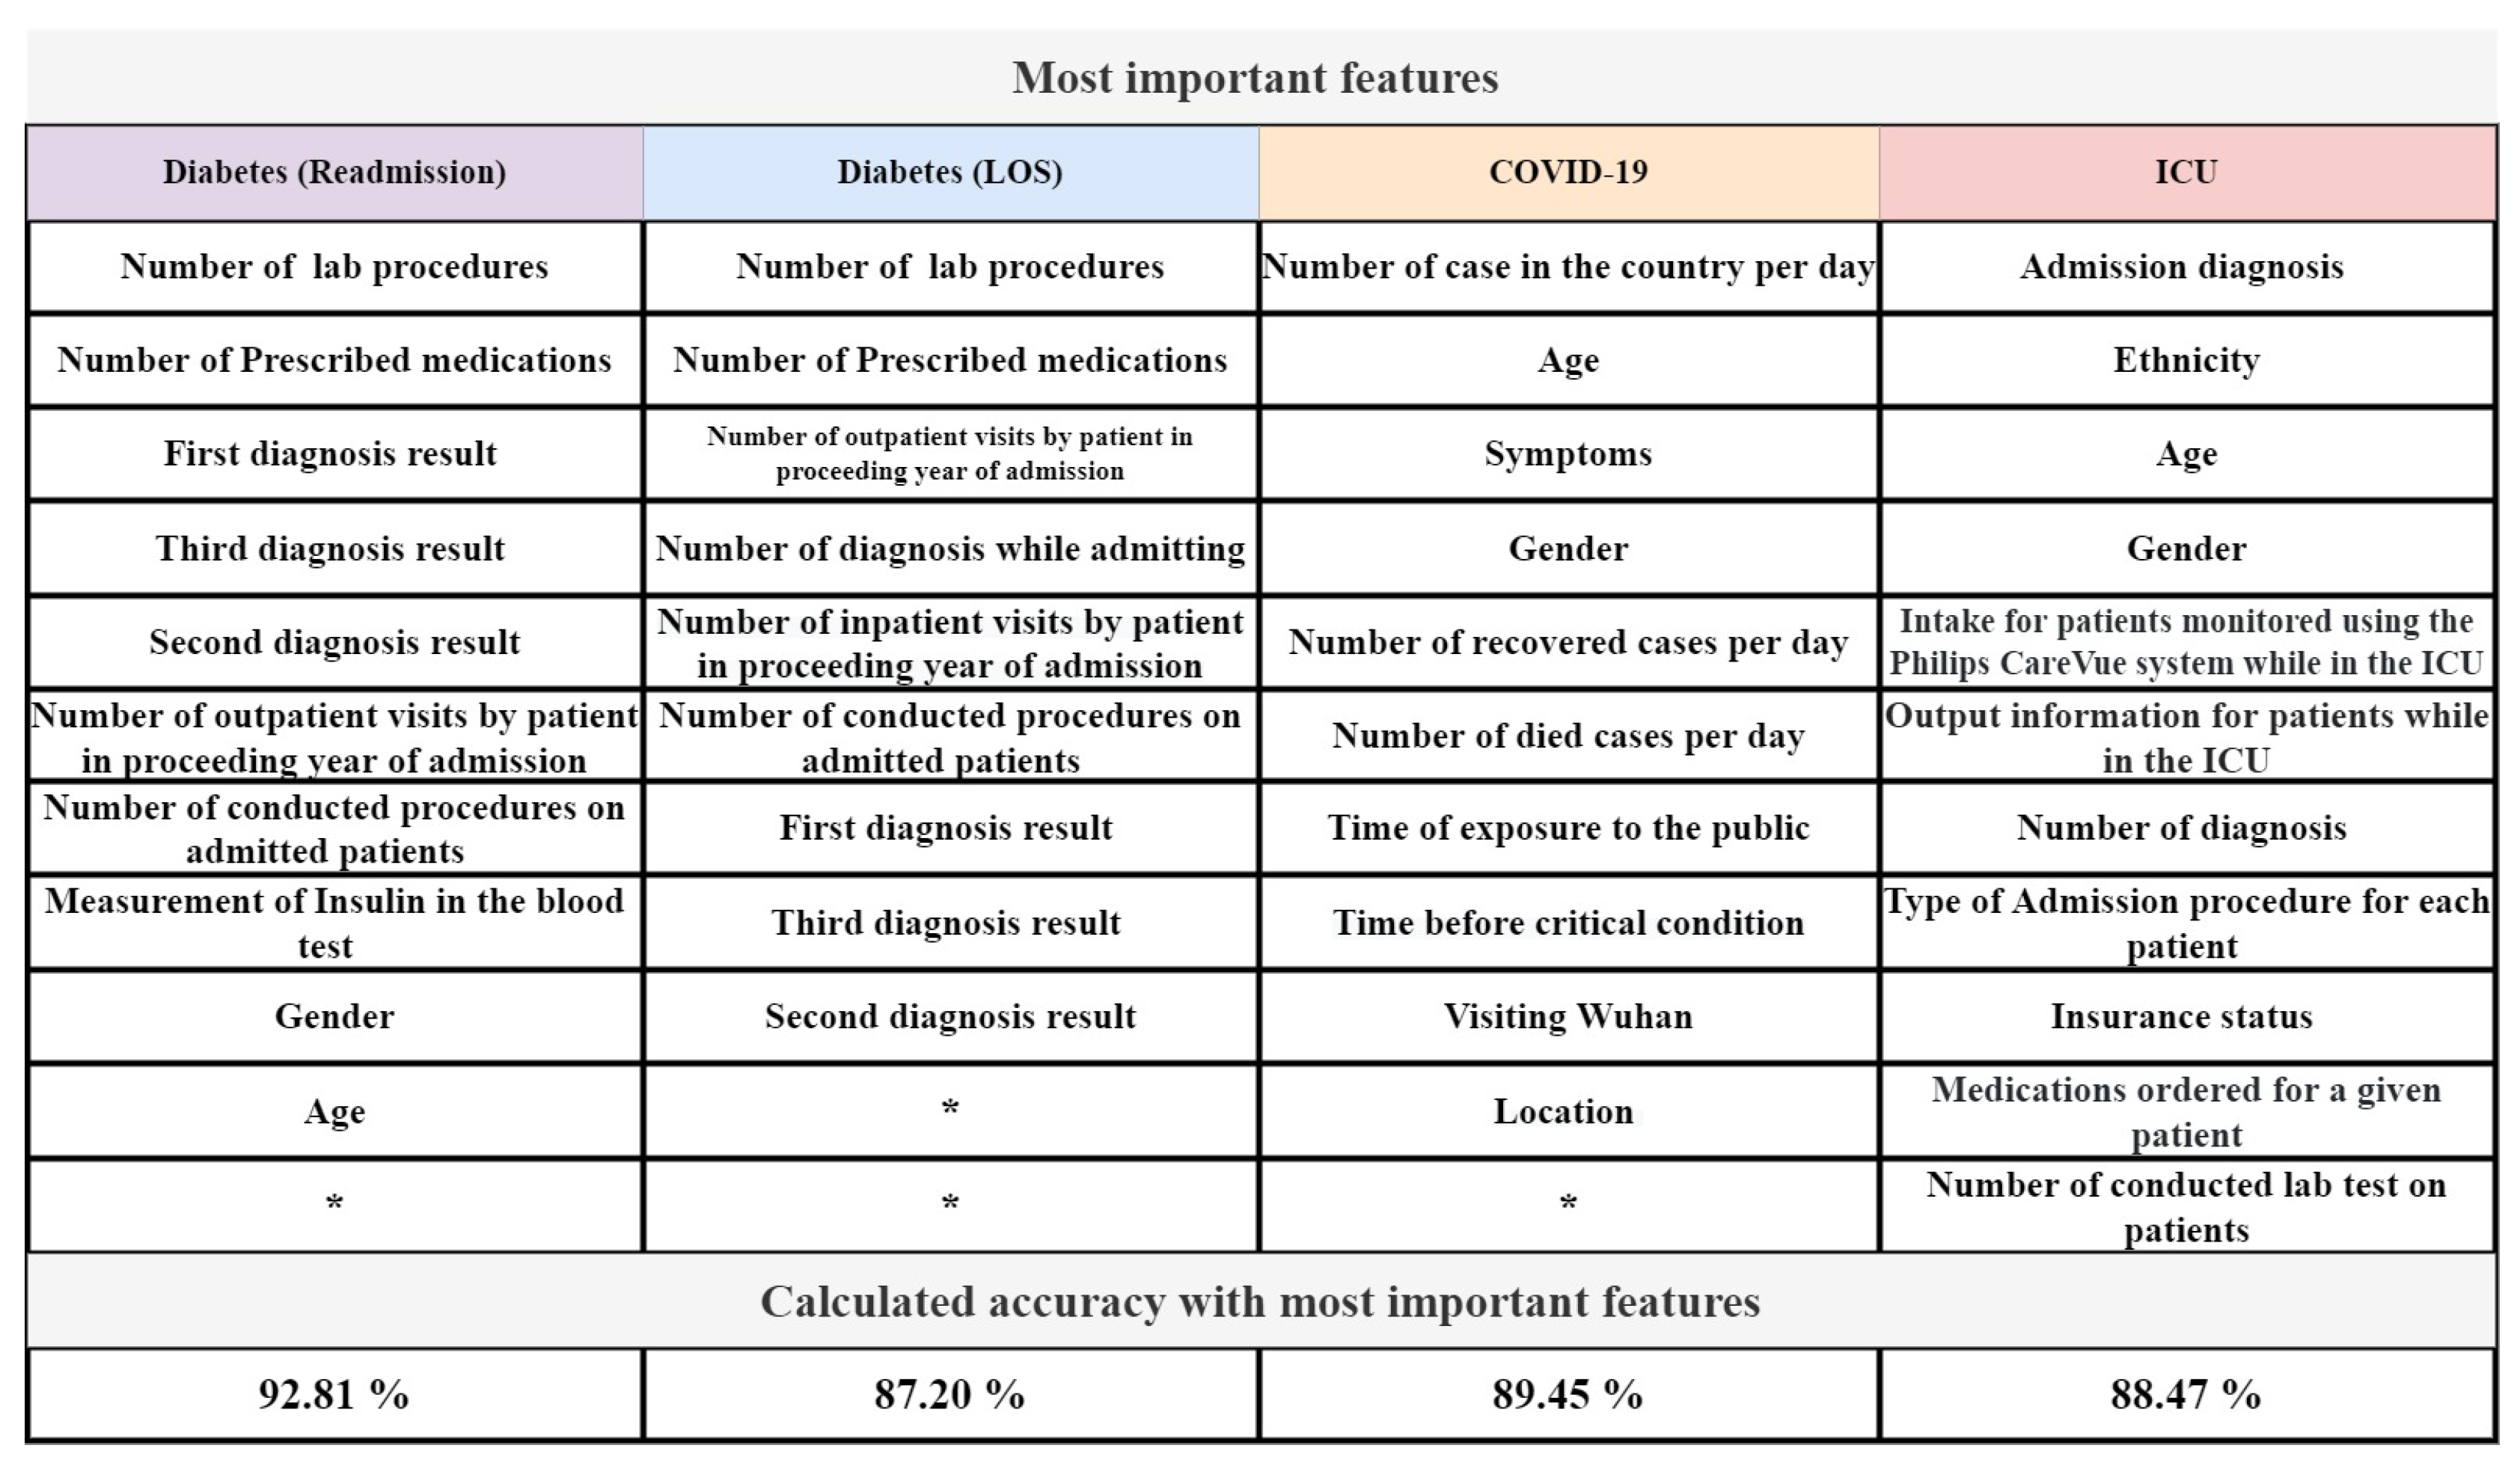
The GAOCNN uses a hybrid structure of deep 1D convolutional networks with genetic algorithms, and it is effective for situations where the existing data is imbalanced and gathering more data is difficult. Notably, applying the proposed model is useful to develop an expert system to predict hospital readmission and length of stay with precise accuracy. The GAOCNN is well-tuned for the readmission and the length of stay prediction tasks. To evaluate the GAOCNN, We have used datasets of diabetic, COVID-19, and ICU patients. The results show that the GAOCNN has a significant accuracy to predict hospital readmission and length of stay compared to existing techniques. The main contribution of this research is to help manage hospitals’ resources more accurately. Also, the proposed model applies to various conditions such as chronic diseases, pandemics, and intensive care. This is another contribution of this research proposing one model for different conditions. GAOCNN presents a CNN model for accurate LOS prediction thus, we used forward and backward feature selection techniques [61] to specify the most important features for LOS and readmission time frame classification. The result of feature selection based on accuracy has shown in Figure 10.
As it has shown in Figure 10, specific sets of features such as first diagnosis, symptoms, age, and gender are more important than other features for LOS and readmission time frame classification. Using the proposed approach, there is no need to deal with hyperparameters. To achieve a balanced dataset, we considered different numbers of classes for length of stay. Then, we used a combination of over and under-sampling methods to decrease the difference between class densities. Considering the high performance of the GAOCNN model, we can develop a system that aids healthcare systems to improve their medical services allocation and apply proper management to staff and patients. To predict the readmission time frame, we have prioritized accuracy over the loss, while for predicting the length of stay, we have prioritized loss over accuracy.

8. CONCLUSIONS

The prediction of hospital readmission and the length of stay for diabetic, COVID-19, and ICU patients is a challenging task that is essential in disease trend monitoring and cost management. With the growth in the number of patients and the emergence of COVID-19, we should equip our healthcare systems with expert systems to extract useful information for resource planning. We presented the GAOCNN as a high-performing machine learning model to predict hospital readmission and the length of stay. The GAOCNN is robust to missing and null values and can make precise predictions in the presence of imbalanced data and errors in the recorded attributes. The GAOCNN model is state-of-the-art for both hospital readmission and length of stay predictions. For the readmission prediction, we reached a total accuracy of 97.1% including 97% accuracy for the patients who were readmitted within 30 days. For the length of stay prediction, the proposed model reached 89.0%, 99.4%, and 94.1% accuracy for diabetic, COVID-19, and ICU patients including 99% accuracy for long-term stays of all diseases. Using the GAOCNN, healthcare systems can develop a framework for predicting both the readmission and the length of stay of diabetic patients. Also, the GAOCNN can help healthcare providers in pandemic situations by providing a lower mortality risk factor for diabetic patients and preventing the prevalence of pandemic diseases.

References

  1. Desai, D.; Mehta, D.; Mathias, P.; Menon, G.; Schubart, U.K. Health care utilization and burden of diabetic ketoacidosis in the US over the past decade: a nationwide analysis. Diabetes care 2018, 41, 1631–1638. [Google Scholar]
  2. Friedberg, M.W.; Rosenthal, M.B.; Werner, R.M.; Volpp, K.G.; Schneider, E.C. Effects of a medical home and shared savings intervention on quality and utilization of care. JAMA internal medicine 2015, 175, 1362–1368. [Google Scholar]
  3. Mata-Cases, M.; Casajuana, M.; Franch-Nadal, J.; Casellas, A.; Castell, C.; Vinagre, I.; Mauricio, D.; Bolíbar, B. Direct medical costs attributable to type 2 diabetes mellitus: a population-based study in Catalonia, Spain. The European Journal of Health Economics 2016, 17, 1001–1010. [Google Scholar]
  4. Huang, E.S.; Laiteerapong, N.; Liu, J.Y.; John, P.M.; Moffet, H.H.; Karter, A.J. Rates of complications and mortality in older patients with diabetes mellitus: the diabetes and aging study. JAMA internal medicine 2014, 174, 251–258. [Google Scholar]
  5. Riddle, M.C.; Herman, W.H. The cost of diabetes care—an elephant in the room. Diabetes Care 2018, 41, 929–932. [Google Scholar]
  6. Pasquini-Descomps, H.; Brender, N.; Maradan, D. Value for money in H1N1 influenza: a systematic review of the cost-effectiveness of pandemic interventions. Value in Health 2017, 20, 819–827. [Google Scholar]
  7. Tsai, Y.; Vogt, T.M.; Zhou, F. Patient characteristics and costs associated with COVID-19–related medical care among Medicare fee-for-service beneficiaries. Annals of Internal Medicine 2021. [Google Scholar]
  8. Gural, A. Algorithmic Techniques for Neural Network Training on Memory-Constrained Hardware; Stanford University, 2021.
  9. Faes, C.; Abrams, S.; Van Beckhoven, D.; Meyfroidt, G.; Vlieghe, E.; Hens, N.; et al. Time between symptom onset, hospitalisation and recovery or death: statistical analysis of Belgian COVID-19 patients. International journal of environmental research and public health 2020, 17, 7560. [Google Scholar]
  10. Muniyappa, R.; Gubbi, S. COVID-19 pandemic, coronaviruses, and diabetes mellitus. American Journal of Physiology-Endocrinology and Metabolism 2020, 318, E736–E741. [Google Scholar]
  11. Tavakolian, A.; Hajati, F.; Rezaee, A.; Fasakhodi, A.O.; Uddin, S. Source code Optimized Parallel Inception: A fast COVID-19 screening software. Software Impacts 2022, p. 100337.
  12. Tavakolian, A.; Hajati, F.; Rezaee, A.; Fasakhodi, A.O.; Uddin, S. Fast COVID-19 versus H1N1 screening using Optimized Parallel Inception. Expert Systems with Applications 2022, p. 117551.
  13. Shinde, P.P.; Shah, S. A review of machine learning and deep learning applications. In Proceedings of the 2018 Fourth international conference on computing communication control and automation (ICCUBEA). IEEE; 2018; pp. 1–6. [Google Scholar]
  14. Desai, K.M.; Survase, S.A.; Saudagar, P.S.; Lele, S.; Singhal, R.S. Comparison of artificial neural network (ANN) and response surface methodology (RSM) in fermentation media optimization: case study of fermentative production of scleroglucan. Biochemical Engineering Journal 2008, 41, 266–273. [Google Scholar]
  15. Alloghani, M.; Aljaaf, A.; Hussain, A.; Baker, T.; Mustafina, J.; Al-Jumeily, D.; Khalaf, M. Implementation of machine learning algorithms to create diabetic patient re-admission profiles. BMC medical informatics and decision making 2019, 19, 1–16. [Google Scholar] [CrossRef]
  16. Mai, Q. A review of discriminant analysis in high dimensions. Wiley Interdisciplinary Reviews: Computational Statistics 2013, 5, 190–197. [Google Scholar] [CrossRef]
  17. Pranckevičius, T.; Marcinkevičius, V. Comparison of naive bayes, random forest, decision tree, support vector machines, and logistic regression classifiers for text reviews classification. Baltic Journal of Modern Computing 2017, 5, 221. [Google Scholar] [CrossRef]
  18. Hammoudeh, A.; Al-Naymat, G.; Ghannam, I.; Obied, N. Predicting hospital readmission among diabetics using deep learning. Procedia Computer Science 2018, 141, 484–489. [Google Scholar] [CrossRef]
  19. Mingle, D.; et al. Predicting diabetic readmission rates: moving beyond Hba1c. Current Trends in Biomedical Engineering & Biosciences 2017, 7, 555707. [Google Scholar]
  20. Voyant, C.; Notton, G.; Kalogirou, S.; Nivet, M.L.; Paoli, C.; Motte, F.; Fouilloy, A. Machine learning methods for solar radiation forecasting: A review. Renewable Energy 2017, 105, 569–582. [Google Scholar] [CrossRef]
  21. Chauhan, V.K.; Dahiya, K.; Sharma, A. Problem formulations and solvers in linear SVM: a review. Artificial Intelligence Review 2019, 52, 803–855. [Google Scholar] [CrossRef]
  22. Morton, A.; Marzban, E.; Giannoulis, G.; Patel, A.; Aparasu, R.; Kakadiaris, I.A. A comparison of supervised machine learning techniques for predicting short-term in-hospital length of stay among diabetic patients. In Proceedings of the 2014 13th International Conference on Machine Learning and Applications. IEEE; 2014; pp. 428–431. [Google Scholar]
  23. Yakovlev, A.; Metsker, O.; Kovalchuk, S.; Bologova, E. Prediction of in-hospital mortality and length of stay in acute coronary syndrome patients using machine-learning methods. Journal of the American College of Cardiology 2018, 71, A242–A242. [Google Scholar] [CrossRef]
  24. Tsai, P.F.J.; Chen, P.C.; Chen, Y.Y.; Song, H.Y.; Lin, H.M.; Lin, F.M.; Huang, Q.P. Length of hospital stay prediction at the admission stage for cardiology patients using artificial neural network. Journal of healthcare engineering 2016, 2016. [Google Scholar] [CrossRef]
  25. Schorr, E. Theoretical framework for determining hospital length of stay (LOS). In Proceedings of the BMC Proceedings. BioMed Central, 2012, Vol. 6, pp. 1–1.
  26. Mahboub, B.; Al Bataineh, M.T.; Alshraideh, H.; Hamoudi, R.; Salameh, L.; Shamayleh, A. Prediction of COVID-19 hospital length of stay and risk of death using artificial intelligence-based modeling. Frontiers in medicine 2021, 8. [Google Scholar] [CrossRef]
  27. Nemati, M.; Ansary, J.; Nemati, N. Machine-learning approaches in COVID-19 survival analysis and discharge-time likelihood prediction using clinical data. Patterns 2020, 1, 100074. [Google Scholar] [CrossRef]
  28. Ajit, A.; Acharya, K.; Samanta, A. A review of convolutional neural networks. In Proceedings of the 2020 International Conference on Emerging Trends in Information Technology and Engineering (ic-ETITE). IEEE; 2020; pp. 1–5. [Google Scholar]
  29. Strack, B.; DeShazo, J.P.; Gennings, C.; Olmo, J.L.; Ventura, S.; Cios, K.J.; Clore, J.N. Impact of HbA1c measurement on hospital readmission rates: analysis of 70,000 clinical database patient records. BioMed research international 2014, 2014. [Google Scholar] [CrossRef]
  30. Quan, H.; Sundararajan, V.; Halfon, P.; Fong, A.; Burnand, B.; Luthi, J.C.; Saunders, L.D.; Beck, C.A.; Feasby, T.E.; Ghali, W.A. Coding algorithms for defining comorbidities in ICD-9-CM and ICD-10 administrative data. Medical care 2005, pp. 1130–1139.
  31. Xu, B.; Kraemer, M.U.; et al. Open access epidemiological data from the COVID-19 outbreak. 2020.
  32. Johnson, A.E.; Pollard, T.J.; Shen, L.; Li-Wei, H.L.; Feng, M.; Ghassemi, M.; Moody, B.; Szolovits, P.; Celi, L.A.; Mark, R.G. MIMIC-III, a freely accessible critical care database. Scientific data 2016, 3, 1–9. [Google Scholar] [CrossRef] [PubMed]
  33. Sun, Y.; Xue, B.; Zhang, M.; Yen, G.G.; Lv, J. Automatically designing CNN architectures using the genetic algorithm for image classification. IEEE transactions on cybernetics 2020, 50, 3840–3854. [Google Scholar] [CrossRef]
  34. Peng, Y.; Nagata, M.H. An empirical overview of nonlinearity and overfitting in machine learning using COVID-19 data. Chaos, Solitons & Fractals 2020, 139, 110055. [Google Scholar]
  35. Luo, G. A review of automatic selection methods for machine learning algorithms and hyper-parameter values. Network Modeling Analysis in Health Informatics and Bioinformatics 2016, 5, 1–16. [Google Scholar] [CrossRef]
  36. Isa, S.M.; Suwandi, R.; Andrean, Y.P. Optimizing the Hyperparameter of Feature Extraction and Machine Learning Classification Algorithms. Int. J. Adv. Comput. Sci. Appl 2019, 10, 69–76. [Google Scholar] [CrossRef]
  37. Kumar, A.; Kumar, D.; Jarial, S. A review on artificial bee colony algorithms and their applications to data clustering. Cybernetics and Information Technologies 2017, 17, 3–28. [Google Scholar] [CrossRef]
  38. García, S.; Luengo, J.; Herrera, F. Tutorial on practical tips of the most influential data preprocessing algorithms in data mining. Knowledge-Based Systems 2016, 98, 1–29. [Google Scholar] [CrossRef]
  39. Daghistani, T.A.; Elshawi, R.; Sakr, S.; Ahmed, A.M.; Al-Thwayee, A.; Al-Mallah, M.H. Predictors of in-hospital length of stay among cardiac patients: A machine learning approach. International journal of cardiology 2019, 288, 140–147. [Google Scholar] [CrossRef]
  40. Gowd, A.K.; Agarwalla, A.; Amin, N.H.; Romeo, A.A.; Nicholson, G.P.; Verma, N.N.; Liu, J.N. Construct validation of machine learning in the prediction of short-term postoperative complications following total shoulder arthroplasty. Journal of shoulder and elbow surgery 2019, 28, e410–e421. [Google Scholar] [CrossRef]
  41. Guo, A.; Lu, J.; Tan, H.; Kuang, Z.; Luo, Y.; Yang, T.; Xu, J.; Yu, J.; Wen, C.; Shen, A. Risk factors on admission associated with hospital length of stay in patients with COVID-19: a retrospective cohort study. Scientific Reports 2021, 11, 1–7. [Google Scholar] [CrossRef] [PubMed]
  42. Kumar, R.N.; Kumar, M.A.; et al. Enhanced fuzzy K-NN approach for handling missing values in medical data mining. Indian Journal of Science and Technology 2016, 9, 1–6. [Google Scholar]
  43. Rodríguez, P.; Bautista, M.A.; Gonzalez, J.; Escalera, S. Beyond one-hot encoding: Lower dimensional target embedding. Image and Vision Computing 2018, 75, 21–31. [Google Scholar] [CrossRef]
  44. Gikunda, P.K.; Jouandeau, N. State-of-the-art convolutional neural networks for smart farms: A review. In Proceedings of the Intelligent Computing-Proceedings of the Computing Conference. Springer; 2019; pp. 763–775. [Google Scholar]
  45. Popel, M.H.; Hasib, K.M.; Habib, S.A.; Shah, F.M. A hybrid under-sampling method (HUSBoost) to classify imbalanced data. In Proceedings of the 2018 21st International Conference of Computer and Information Technology (ICCIT). IEEE; 2018; pp. 1–7. [Google Scholar]
  46. Li, Y.; Xia, J.; Zhang, S.; Yan, J.; Ai, X.; Dai, K. An efficient intrusion detection system based on support vector machines and gradually feature removal method. Expert systems with applications 2012, 39, 424–430. [Google Scholar] [CrossRef]
  47. Yang, S.; Gu, L.; Li, X.; Jiang, T.; Ren, R. Crop classification method based on optimal feature selection and hybrid CNN-RF networks for multi-temporal remote sensing imagery. Remote Sensing 2020, 12, 3119. [Google Scholar] [CrossRef]
  48. Miao, X.; Wu, Y.; Wang, J.; Gao, Y.; Mao, X.; Yin, J. Generative semi-supervised learning for multivariate time series imputation. In Proceedings of the Proceedings of the AAAI Conference on Artificial Intelligence, 2021, Vol. 35, pp. 8983–8991.
  49. Balasch, A.; Beinhofer, M.; Zauner, G. The Relative Confusion Matrix, a Tool to Assess Classifiablility in Large Scale Picking Applications. In Proceedings of the 2020 IEEE International Conference on Robotics and Automation (ICRA). IEEE; 2020; pp. 8390–8396. [Google Scholar]
  50. Tamin, F.; Iswari, N.M.S. Implementation of C4. 5 algorithm to determine hospital readmission rate of diabetes patient. In Proceedings of the 2017 4th International Conference on New Media Studies (CONMEDIA). IEEE, 2017, pp. 15–18.
  51. Alturki, L.; Aloraini, K.; Aldughayshim, A.; Albahli, S. Predictors of Readmissions and Length of Stay for Diabetes Related Patients. In Proceedings of the 2019 IEEE/ACS 16th International Conference on Computer Systems and Applications (AICCSA). IEEE; 2019; pp. 1–8. [Google Scholar]
  52. Goudjerkan, T.; Jayabalan, M. Predicting 30-day hospital readmission for diabetes patients using multilayer perceptron. International Journal of Advanced Computer Science and Applications 2019, 10. [Google Scholar] [CrossRef]
  53. Seraphim, I.; Ravi, V.; Rajagopal, A. Prediction of Diabetes Readmission using Machine Learning 2020.
  54. Norbrun, G. Reduction of Hospital Readmissions in Patients with a Diagnosis of COPD: An Integrative Review 2021.
  55. Gentimis, T.; Ala’J, A.; Durante, A.; Cook, K.; Steele, R. Predicting hospital length of stay using neural networks on mimic iii data. In Proceedings of the 2017 IEEE 15th Intl Conf on Dependable, Autonomic and Secure Computing, 15th Intl Conf on Pervasive Intelligence and Computing, 3rd Intl Conf on Big Data Intelligence and Computing and Cyber Science and Technology Congress (DASC/PiCom/DataCom/CyberSciTech). IEEE; 2017; pp. 1194–1201. [Google Scholar]
  56. Steele, R.J.; Thompson, B. Data mining for generalizable pre-admission prediction of elective length of stay. In Proceedings of the 2019 IEEE 9th Annual Computing and Communication Workshop and Conference (CCWC). IEEE; 2019; pp. 0127–0133. [Google Scholar]
  57. Nallabasannagari, A.R.; Reddiboina, M.; Seltzer, R.; Zeffiro, T.; Sharma, A.; Bhandari, M. All Data Inclusive, Deep Learning Models to Predict Critical Events in the Medical Information Mart for Intensive Care III Database (MIMIC III). arXiv preprint. arXiv:2009.01366 2020.
  58. Wang, S.; McDermott, M.B.; Chauhan, G.; Ghassemi, M.; Hughes, M.C.; Naumann, T. Mimic-extract: A data extraction, preprocessing, and representation pipeline for mimic-iii. In Proceedings of the Proceedings of the ACM Conference on Health, Inference, and Learning, 2020; pp. 222–235.
  59. Etu, E.E.; Monplaisir, L.; Arslanturk, S.; Masoud, S.; Aguwa, C.; Markevych, I.; Miller, J. Prediction of Length of Stay in the Emergency Department for COVID-19 Patients: A Machine Learning Approach. IEEE Access 2022, 10, 42243–42251. [Google Scholar] [CrossRef]
  60. Alabbad, D.A.; Almuhaideb, A.M.; Alsunaidi, S.J.; Alqudaihi, K.S.; Alamoudi, F.A.; Alhobaishi, M.K.; Alaqeel, N.A.; Alshahrani, M.S. Machine learning model for predicting the length of stay in the intensive care unit for Covid-19 patients in the eastern province of Saudi Arabia. Informatics in Medicine Unlocked 2022, 30, 100937. [Google Scholar] [CrossRef]
  61. Déjean, S.; Ionescu, R.T.; Mothe, J.; Ullah, M.Z. Forward and backward feature selection for query performance prediction. In Proceedings of the Proceedings of the 35th annual ACM symposium on applied computing, 2020; pp. 690–697.
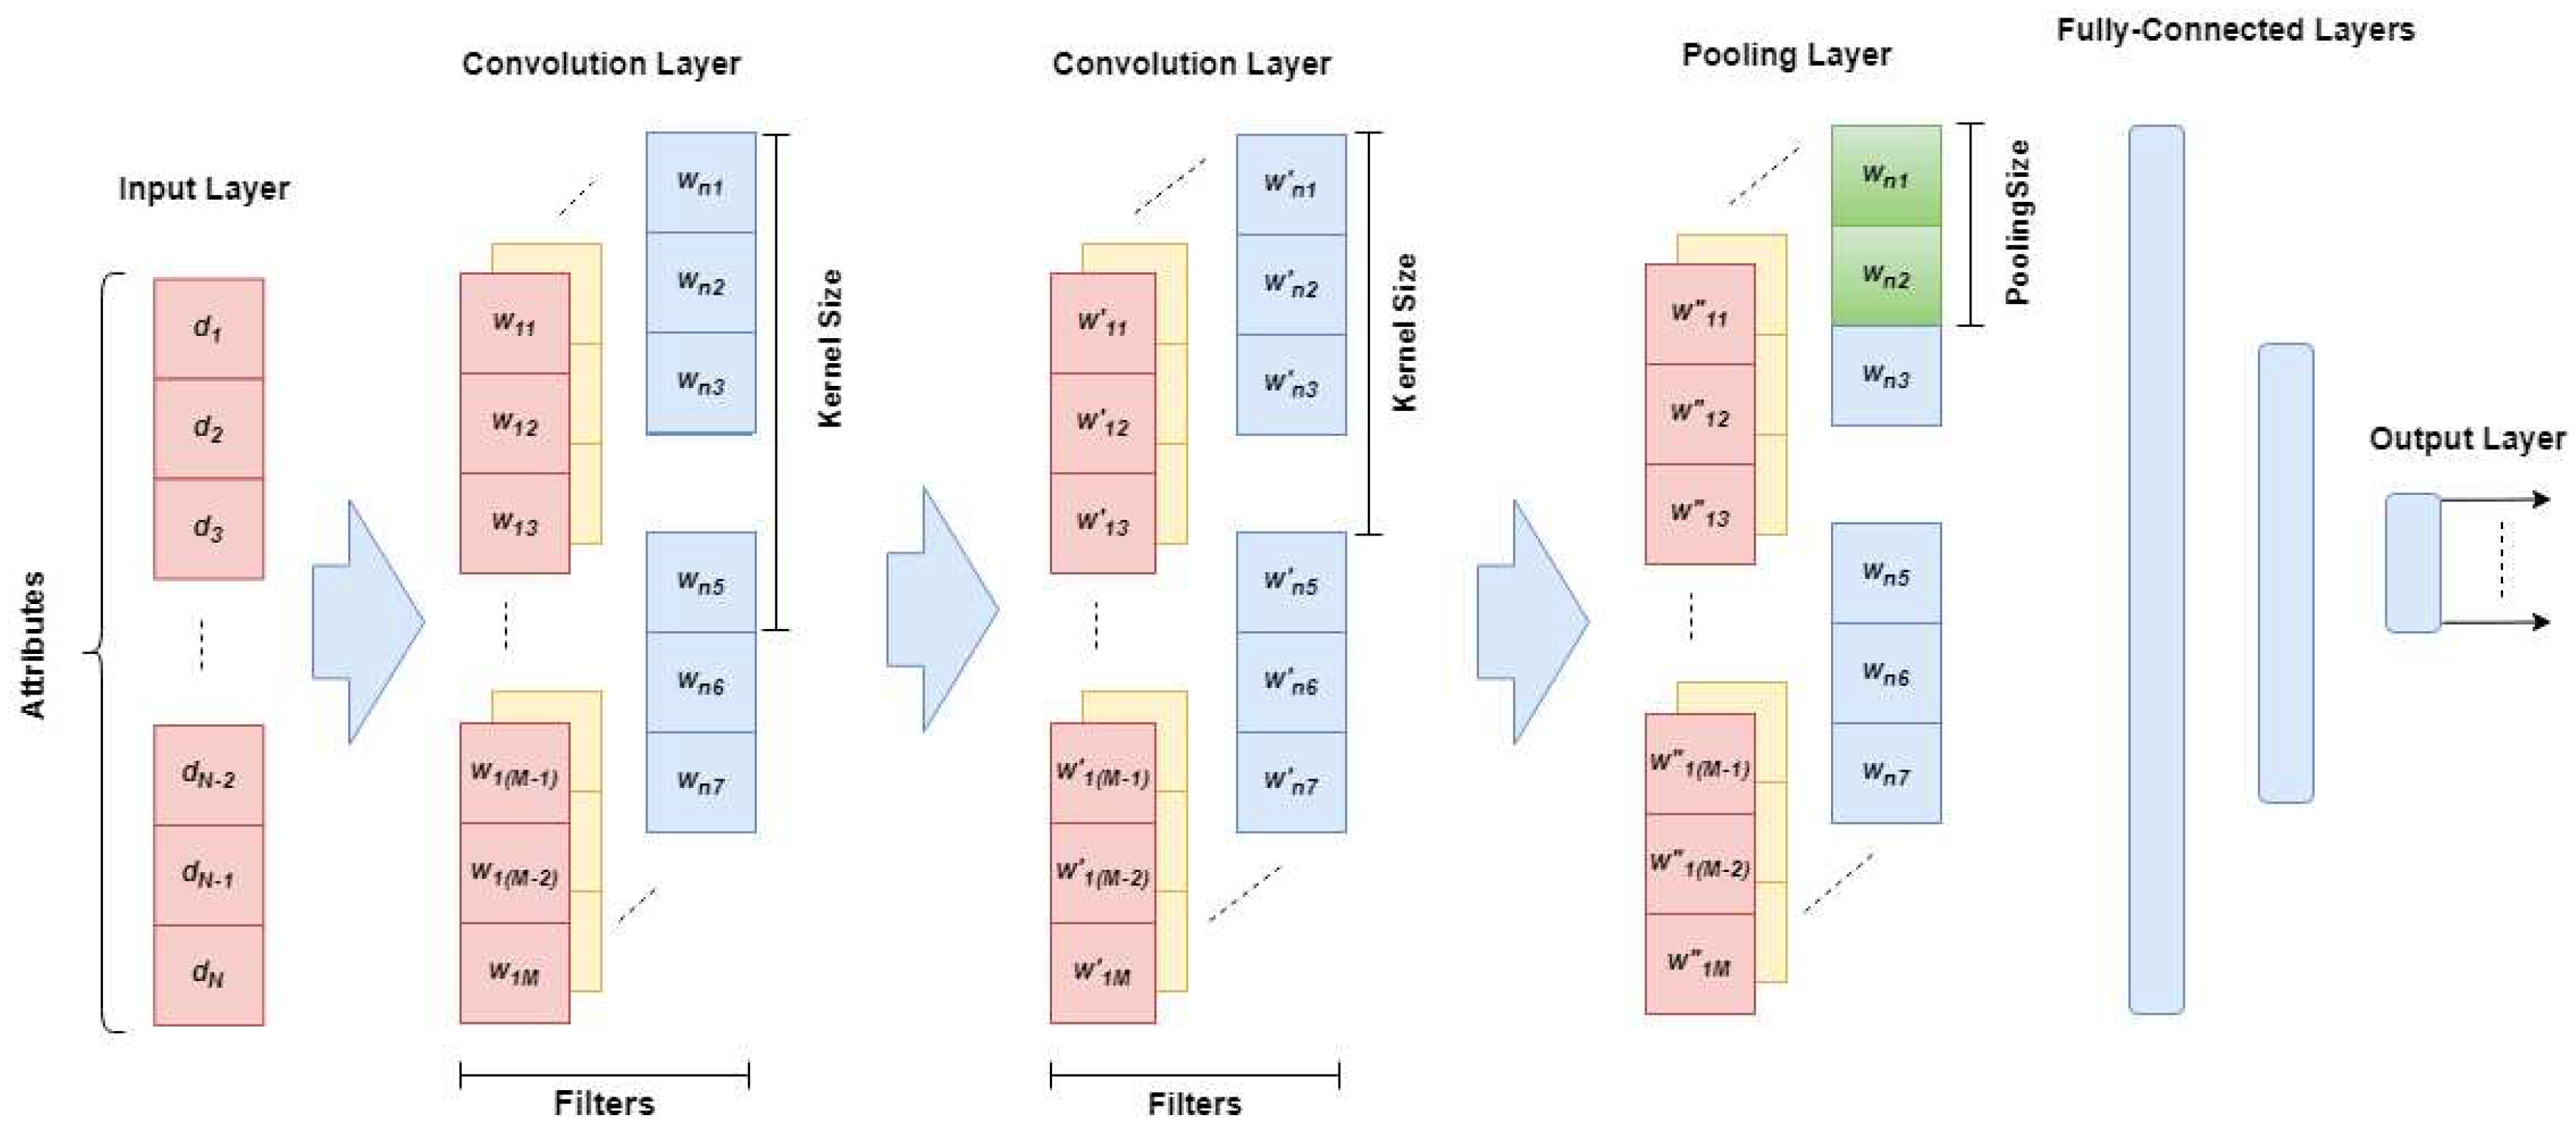
Figure 1. Structure of the proposed model.
Preprints 78579 g001
Figure 2. The flowchart of the proposed genetic algorithm.
Preprints 78579 g002
Figure 3. Distributions of the readmission in diabetic patients.
Preprints 78579 g003
Figure 4. Length of stay distribution; (a) Diabetes, (b) COVID-19, (c) MIMIC-III.
Preprints 78579 g004
Figure 5. Relation between age and length of stay for different genders; (a) Diabetes, (b) COVID-19, (c) MIMIC-III.
Preprints 78579 g005aPreprints 78579 g005b
Figure 6. Distributions of the length of stay in the original and balanced datasets; (a) Diabetes, (b) COVID-19, (c) MIMIC-III.
Preprints 78579 g006aPreprints 78579 g006b
Figure 7. The normalized confusion matrix; (a) readmission prediction in diabetic patients, (b) length of stay prediction in diabetic patients.
Preprints 78579 g007
Figure 8. The normalized confusion matrix for the length of stay prediction in COVID-19 patients.
Preprints 78579 g008
Figure 9. The normalized confusion matrix for the length of stay prediction in ICU patients.
Preprints 78579 g009
Figure 10. Best selected features based on accuracy with wrapper feature selection.
Preprints 78579 g010
Table 1. Results of readmission prediction for diabetics patients.
Model Accuracy (%) Sensitivity (%) Specificity (%) F-Measure (%) Precision (%)
GAOCNN 97.2 96.7 99.3 96.9 97.1
VGG16 38.0 38.2 37.8 45.6 38.2
ResNet 38.0 38.2 38 44.2 38.2
GoogLeNet 39.6 38.4 50.3 38.4 38.4
LR 86.8 86.8 93.4 86.8 86.8
RF 90.0 94.4 96.5 90.0 90.0
XGBoost 94.4 94.4 97.8 94.4 94.5
SVM 94.9 94.3 98.4 94.9 94.9
CNN + LR 87.5 86.5 94.2 87.5 87.4
CNN + RF 91.7 91.4 96.8 91.7 91.7
CNN + XGBoost 94.8 94.6 98.9 94.8 94.8
CNN + SVM 95.1 95.1 95.1 95.1 95.1
SGANs 58.9 51.7 52.6 56.9 63.3
Disclaimer/Publisher’s Note: The statements, opinions and data contained in all publications are solely those of the individual author(s) and contributor(s) and not of MDPI and/or the editor(s). MDPI and/or the editor(s) disclaim responsibility for any injury to people or property resulting from any ideas, methods, instructions or products referred to in the content.
Copyright: This open access article is published under a Creative Commons CC BY 4.0 license, which permit the free download, distribution, and reuse, provided that the author and preprint are cited in any reuse.
Prerpints.org logo

Preprints.org is a free preprint server supported by MDPI in Basel, Switzerland.

Subscribe

© 2024 MDPI (Basel, Switzerland) unless otherwise stated