Preprint
Article

Tuning of Structural, Morphological and Optical Properties of Pa 6 upon Stepwise Insertion of Amorphous Se, Cd2+ and Ag+ Ions

Altmetrics

Downloads

148

Views

35

Comments

0

A peer-reviewed article of this preprint also exists.

This version is not peer-reviewed

Submitted:

04 July 2023

Posted:

06 July 2023

You are already at the latest version

Alerts
Abstract
Increasing photon absorption by capturing light is an important way to increase the efficiency of photovoltaic devices. In this regard, the small optical band gap (Eg) and high absorption coefficient of Se-containing thin nanofilms make them ideal for next generation photovoltaic devices based on selenides. This study reports on chemical synthesis processes in a bath for the insertion of amorphous selenium into polyamide-6 (PA 6) matrix and the effect of incorporation of Cd2+ and Ag+ on the structural, morphological and optical properties. The resulting films had a pyramidal structure of single crystals, nanosized particles of nonspecific shape, agglomerated and indistinct grains. ATR-FTIR spectroscopy revealed the interaction between PA 6 and inorganic components, which causes obvious conformational changes in PA 6 chains. The data of X-ray diffraction analysis, depending on the stage of synthesis, showed a mixture of various compounds: Se8, CdSe, Ag2Se and Ag. This may explain the observed optical properties. The optical properties of the composites indicate a shift in the band gap from 4.46 eV for PA 6 to 2.23-1.64 eV upon stepwise insertion of amorphous Se, Cd2+ and Ag+ ions. Eg is conveniently located in the visible region of solar energy, making the obtained nanofilms ideal for solar energy harvesting.
Keywords: 
Subject: Chemistry and Materials Science  -   Surfaces, Coatings and Films

1. Introduction

Nanoscale sized inorganic materials within the polymers are interesting in optoelectronics as light emitting devices [1] or photovoltaics [2], separation-catalysis [3] and bioelectronics [4]. The semiconductor nanoparticles embedded in the polymer film are easy to process [5]. These composites are usually made by mixing inorganic and organic components, and the obtained structure has physical and chemical properties that are not present in the individual components [1].
Selenium and selenium-containing materials have become the subject of many scientific studies due to their exceptional physical-chemical properties and photoelectric characteristics [6,7,8]. As an important inorganic material, selenium has also received a lot of attention due to its good semiconductor properties. For an a-Se film with a thickness of 4200 Å, the value of the band gap is 1.76 eV [9,10]. Due to their high photoconductivity, various selenides are one of the key materials widely used in optoelectronic devices such as photocopiers, light emitting diodes, xerography, and solar cells [8,11,12,13].
Doping with impurity atoms is an effective strategy for optimising the properties required for the development of semiconductor technologies. Newly developed aliovalent doping provides extra electrons (n-type doping) or extra holes (p-type doping) to redefine their doping type for electronic requirements. For CdSe, the most studied nanocrystalline system, it has been proved that additional carriers from heterovalent dopants such as Ag, Cu and In [14,15] can enhance the electronic conductivity in films when they are excited by external energy. Incorporating aliovalent metal cations into binary, such as CdSe, semiconductors change the optoelectronic properties of the newly formed base material, providing greater performance in a number of applications, including solar cells, batteries, and LEDs [16,17,18].
Polyamides are widely used as technical polymers with applications ranging from synthetic fibres to industrial and structural applications. Typically, optoelectronic devices use a combination of highly conductive semiconductor components due to their electrical pumping capability and the strong interaction of light and matter of the organic component [19]. The efficient inorganic materials used include cadmium selenide (CdSe) [11] and silver selenide (Ag2Se) [12,13]. CdSe and Ag2Se are direct bandgap semiconducting materials with the corresponding bandgaps of 1.9 eV [20] and 1.8 eV [21], respectively.
Due to the high reduction potential of Se(IV)/Se(0), various reagents for reduction of selenium (IV) compounds in several types of aqueous solutions have been evaluated. N2H4 [6,22], (NH2)2CS [23], metallic Fe or Zn [24,25,26,27], CuCl [28], TiCl3 [29], SnCl2 [30], Na2S2O4 [31], D-fructose [32], and ascorbic acid [33] have been proposed as quantitative reducing agents for Se(IV) in acidic solutions. In industrial applications, SO2 is the preferred reagent for the reduction of Se(IV) to its elemental state. According to literature data [10,34], when working with hot (>80 °C) and relatively concentrated solutions of H2SO4 or HCl (pH <1), the complete reduction of selenium occurs very quickly. However, high toxicity (hydrazine and thiourea), low efficiency (zinc, D-fructose, ascorbic acid) and high cost (CuCl, TiCl3, Na2S2O4 and SnCl2) limit the applicability of these reagents. The better candidate for this purpose as a strong reducing agent is sodium sulphite (Na2SO3), because of its fast reaction rate, low cost, and relatively low toxicity.
Solution-based chemical methods provide an excellent way to produce nano selenium and nano selenides. Each synthesis method has its own advantages in obtaining the appropriate structures and properties for each system, and hence the right combinations of processing along with suitable systems must be found to achieve the desired goal.
This work is aimed at studying the change in the properties of PA6 upon the stepwise introduction of amorphous Se, Cd2+ and Ag+ ions and understanding the factors that determine the properties of these light-absorbing materials. These composites in the PA6 membrane were prepared using various chemical synthesis methods: Se—by chemical bath deposition (CBD), Cd2+ and Ag+ selenide—by successive ionic layer adsorption and reaction (SILAR), and mixed Ag+-Cd2+ selenide composites were prepared using cation exchange (CE). For a deeper understanding of the relationship between the composition and consumer properties of polyamide-6-based selenium nanocomposites, the main attention was paid to the description of the microstructure, morphology, and physicochemical properties.

2. Materials and Methods

Semicrystalline flexible TECAMID®6 (polyamide 6, PA 6) produced by Ensinger GmbH (Germany) was used as a thermoplastic matrix. Nominal characteristics provided by the manufacturer are: PA 6 film was opaque, 0.5 mm thick, density 1.13 g/cm3, moisture absorption 3 %, water absorption to equilibrium 9.5 %. Experiments were performed on 2′6 cm2 cuts in a film. Prior to the experiments, PA 6 film cuts were washed with NaHCO3 and heated in distilled water for 2 h at 100oC to remove surface contamination. The criterion for the quality treatment of the PA 6 substrate surface was its uniform wetting with distilled water. After treatment, the substrates were stored in a desiccator.
Selenious acid (H2SeO3, 99.0%), sodium sulphite heptahydrate (Na2SO3∙7H2O, 99.0%), sulphur acid (H2SO4, 96%), cadmium nitrate tetrahydrate (Cd(NO3)2∙4H2O, 99.997% trace metals basis), silver nitrate (AgNO3, 99.0%) were purchased from Aldrich Chemical Co and used as received. All solutions were prepared using distilled water.
The first step involved the synthesis of Se via the CBD process. For Se deposition/insertion, the cleaned PA 6 films cuts were vertically immersed into a beaker with 0.1 M H2SeO3 and 0.15 M Na2SO3 solutions and exposed in a thermostatic vessel for 24 h at 20±1 oC. The concentrations of the H2SeO3 and Na2SO3 solutions (pH 2 with the addition of H2SO4), the deposition temperature and exposure time were chosen to give excellent composites in terms of continuity, smoothness and adhesion to the substrate. The solution was clear at first, became slightly turbid after two hours and turned into a light red liquid after a few hours. The Se precipitate was very fine, but it aggregated into large clusters within ∼24 h. This proposed mechanism for the formation of Se films is based on nucleation and the Ostwald ripening process [35]. This process is simple, controllable and reproducible. After deposition/insertion of the Se, the upper layer (Figure 1) was removed from the PA6 surface with filter paper, samples were thoroughly washed with distilled water, and stored in a desiccator between the individual processing steps. Then obtained composites (in the text referred to as a-Se/PA 6) were used as the initial composite for the stepwise insertion of Cd2+ and Ag+ ions. For this, half of the a-Se/PA6 composites were treated for 3 h with a 0.1 M solution of Cd(NO3)2 (pH 5.4) at a temperature of 80±1 oC. The second half of a-Se/PA6 composites were treated for 2 h with a 0.1 M solution of AgNO3 (pH 6.35) at a temperature of 20±1 oC. The obtained composites were labelled as Cd-Se/PA 6 and Ag-Se/PA 6, respectively. Then one part of the Cd-Se/PA 6 composites were treated for 10 min with a 0.05 M AgNO3 solution (pH 6.45, temperature of 20±1 oC) and washed well as described above. After immersion in the AgNO3 solution, the resulting composites (throughout the text labelled as Ag-Cd-Se/PA 6) were black uniform and highly reflective with good adhesion. In all cases samples were treated in a thermostated vessel. During the deposition process, the beaker was kept undisturbed. All deposited films were evaluated for adhesion by subjecting them to a steady stream of distilled water. After each deposition step, the samples were washed first with hot and then cold distilled water, dried at ambient temperature, and stored in a desiccator until analysis. Figure 1 shows schematic outline of the approach and optical micrographs image of PA 6 membrane and obtained composites.
The porosity of the PA 6 film samples was measured by the BET (abbreviated from Brunauer-Emmett-Teller theory) method using nitrogen adsorption porosimeter Nova 2200 E-Series (Quantachrome Instruments, Boynton Beach, FL, USA). Before analysis, the film samples were degassed under vacuum at 100 °C.
Solution pH was measured using a pH-meter WTW330 (WTW GmbH, Weilheim, Germany). Optical microscopy images were obtained using an Olympus CX31 optical microscope and a C-5050 camera (Japan).
The structure of the composites was analysed using X-ray diffraction method (XRD) on a Bruker Advance D8 diffractometer. The XRD patterns were produced with CuKα (λ = 0.154178 nm) radiation in the 2θ scanning mode. The XRD data were analysed by observing characteristic peaks in the X-ray diffraction patterns using Search Match software and PDF-2 and PDF-4 database. Crystallite size (Dc) values were calculated from XRD patterns based on Bragg and Scherrer equation [36]:
D C = K λ β ( 2 θ ) cos θ 1 ,
where K—constant with a normal value of 0.89, λ –wavelength of CuKα radiation, β(2θ) represents the full width at the half-maximum, and θ—Bragg angle. The dislocation density (δ) was evaluated by using the equation [37]:
δ = 1 D 2 ( line · m 2 ) ,
The strain values (ε) were calculated from the following relation:
ε = β cos θ 4 ( line 2 · m 4 ) ,
Surface topography imaging was conducted using atomic force microscopy (AFM) using a NanoWizard®3 NanoScience microscope, data were analysed using JPKSPM Data Processing software. The AFM images (scanning area 5×5 μm2) were collected using an AppNano production pyramidal-shaped i-type silicon cantilever (0.01–0.025 ohm/cm, spring constant of 2 N/m) working in contact mode.
Ultraviolet-visible (UV-Vis) absorption spectra (200 to 1100 nm) were recorded on a Spectronic Genesys 8 UV-Vis spectrophotometer with compensation for PA6 absorption. The energy optical band gaps (𝐸𝑔) were determined by applying the absorption spectrum fitting method [38]. The fundamental absorption edge (λg) can be found from the plot:
A λ 1 / m = f 1 λ ,
where A—absorption, λ—wavelength, m—index which takes values 0.5, 1.5, 2 and 3 for direct allowed, direct forbidden, indirect allowed and indirect forbidden transitions, respectively. Extrapolating of straight-line portion to cut the energy axis gives λg. Then employing the obtained value of λg the 𝐸𝑔 can be directly calculated from the following relation [38]:
E g = 1239.83 λ g ,
The Urbach energy (EU) is related to the absorption coefficient by the following exponential equation [39]:
α = α 0 · e h ν / E U ,
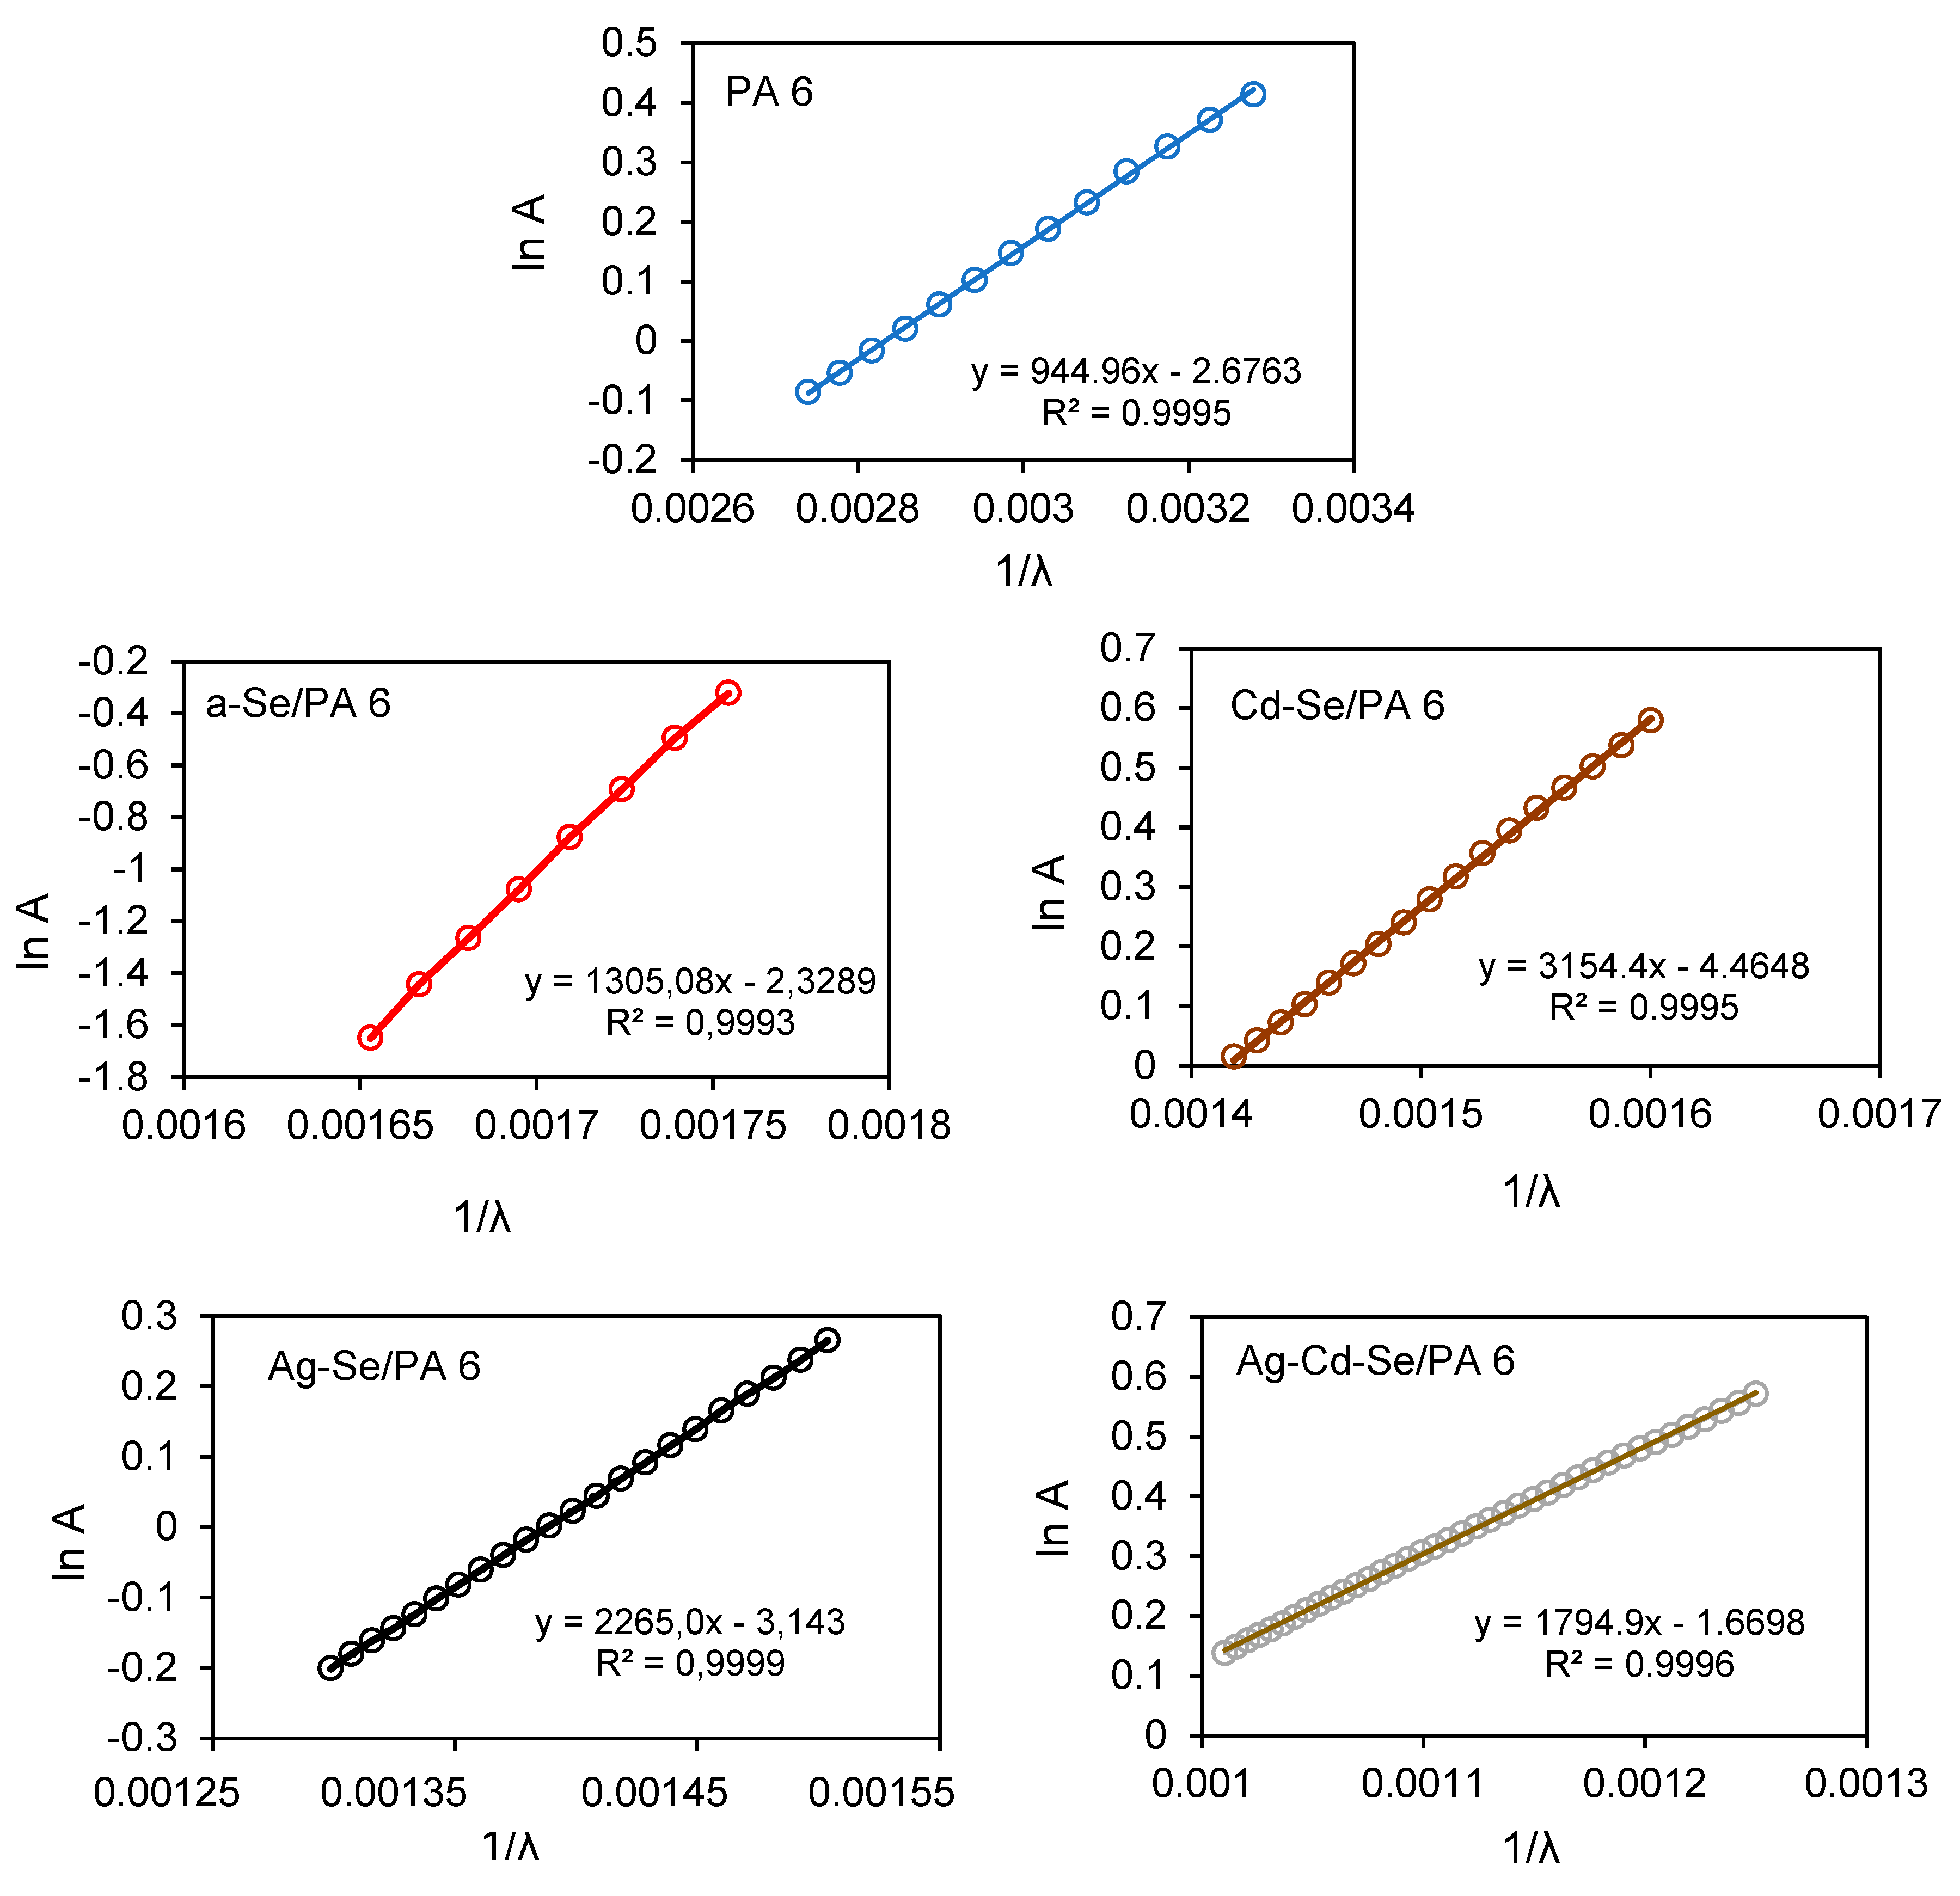
EU was calculated using the slope determined from the linear part of the plot between ln(A) versus 1/λ according to the following relation:
E U · t g α = 1239.83 ,
The steepness parameter σ is related with EU the by following equation:
σ = k · T E U ,
where k is the Boltzmann constant, 8.617343·10‒5 eV/K and T the absolute temperature assumed to be 298 K. The following equation is applied for calculating the interaction strength of electron–phonon (Ee-p) [40]:
𝐸𝑒−𝑝=23𝜎,
The optical electronegativity χ is related with Eg by following equation:
χ = 2.688   · E g ,
The changes in the chemical structure and the binding configuration of the samples were analysed using attenuated total reflectance (ATR) Fourier transform infra-red spectroscopy (FTIR). The ATR-FTIR spectra were recorded on a Perkin Elmer FT-IR Spectrum GX system (Perkin Elmer, Waltham, MA, USA) in the wavenumber range 4000–600 cm−1. Spectra were recorded by averaging 64 scans with a wavenumber resolution of 1 cm−1 at room temperature

3. Results and Discussions

Adsorption membranes are one of the best ways to obtain semiconductor composites from aqueous solutions. The established pore size less than 2 nm indicates that the PA 6 film is microporous. Therefore, it can adsorb Se micro particles and Cd2+ and Ag+ cations followed by their diffusion into the polymer membrane. In most cases, adsorption membranes are charged. There is an attraction of charges between the ions and the surface of the adsorption membrane.

3.1. XRD Analysis

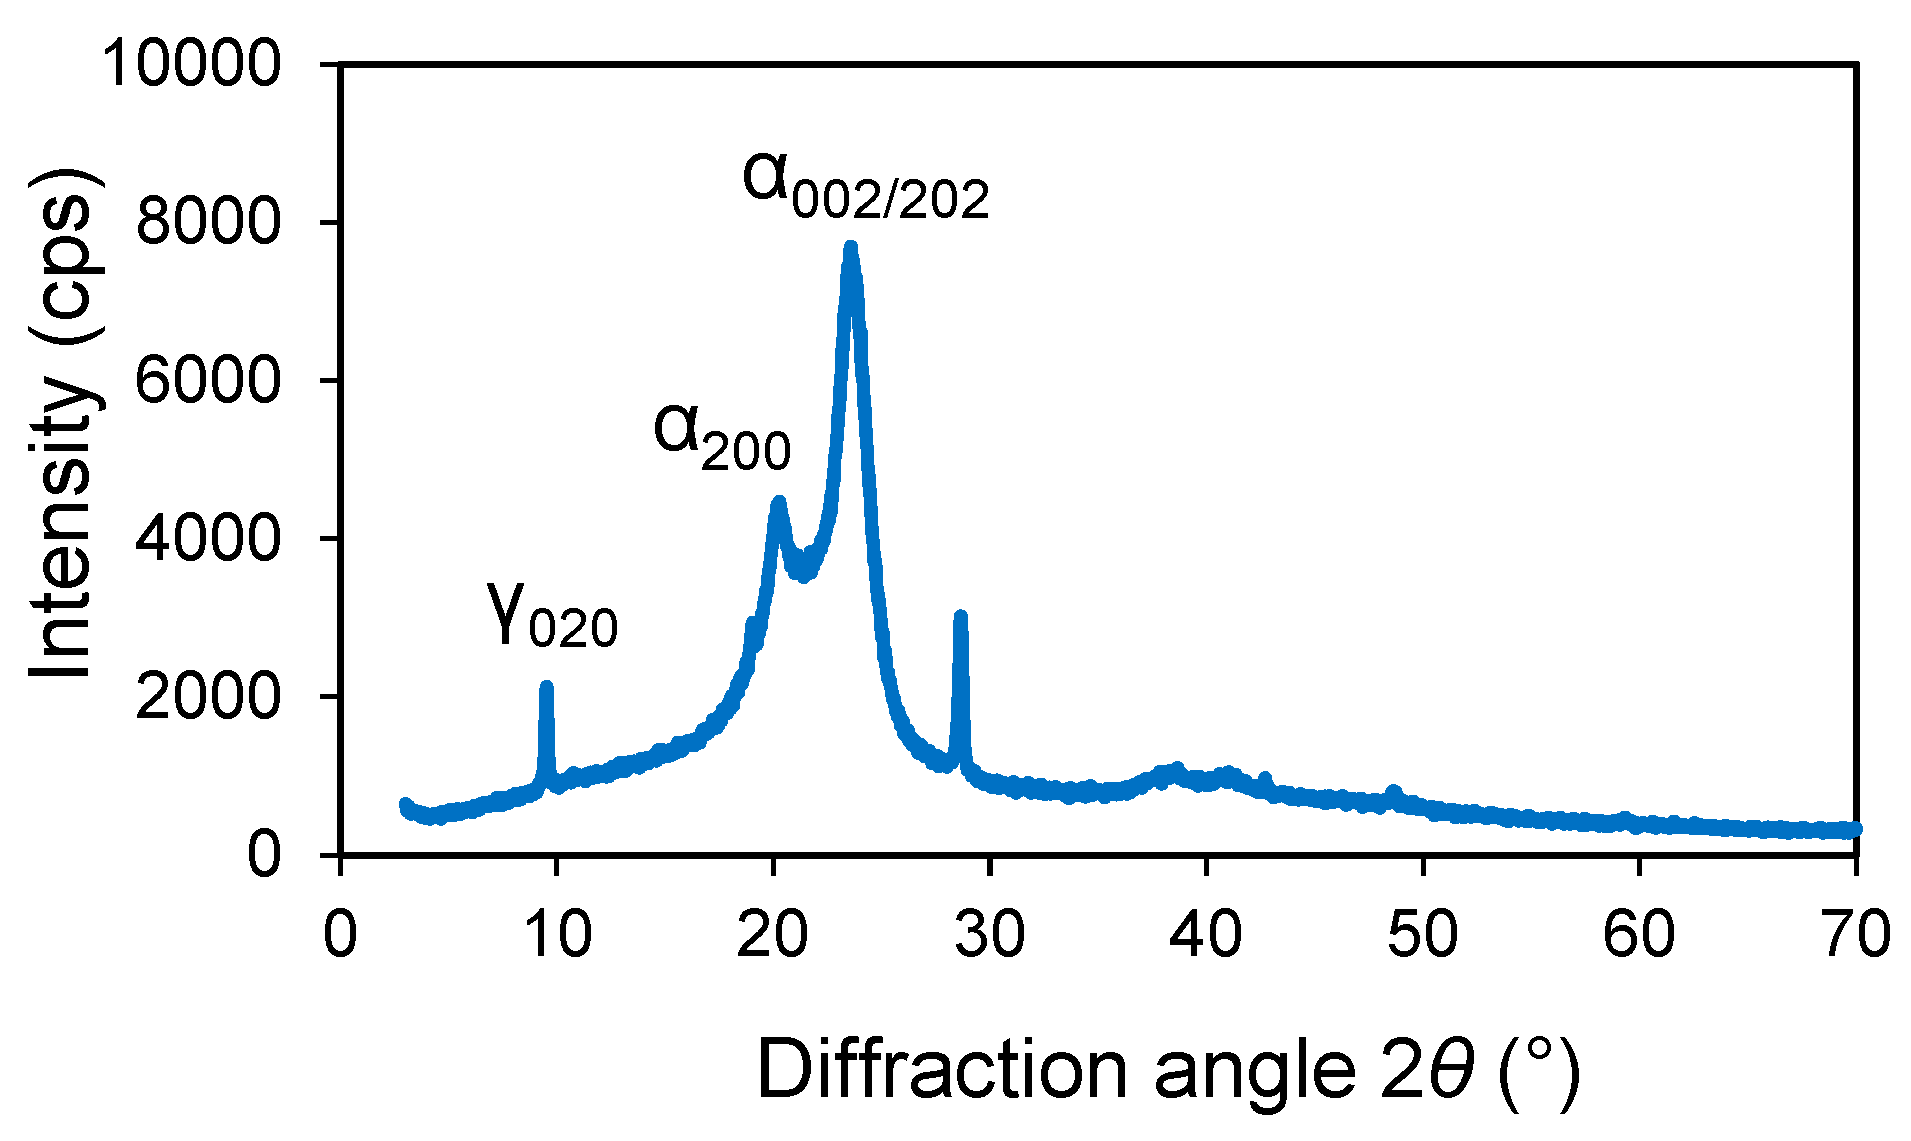
To determine the structural properties of the PA 6 and the obtained composites, XRD patterns were analysed. The XRD pattern of PA 6 sample heated in distilled water is shown in Figure 2and 4, while XDR pattern of the obtained composites is shown in Figure 4.
PA 6 crystallizes into stable α- and γ-, as well as unstable β-forms [41]. XRD studies of the PA 6 sample revealed the presence of a main peaks at 2θ 9.52°, 20.26°, 23.56° and 28.64°. The small diffraction peak at 2θ = 9.52°, which was attributed to the (020) reflection of the γ crystalline form [40]. The other two peaks at 2θ = 20.26° and 23.56° were assigned to the (200) reflection and (002)/(202) reflections of the α crystalline form of PA 6 [41]. The peak at 28.64° appears after polymer treatment in hot water and cannot be assigned for neither forms of the crystalline PA 6. When the polymer is exposed directly to water, water initiates degradation/hydrolysis reactions in the polymer.
Mixing H2SeO3 and Na2SO3 solutions leads to the release of Se according to the following reaction [42]:
Na2SeO3(aq) + 2Na2SO3(aq) + H2SO4(aq) → Se(s) + 3Na2SO4(aq) + H2O(l)
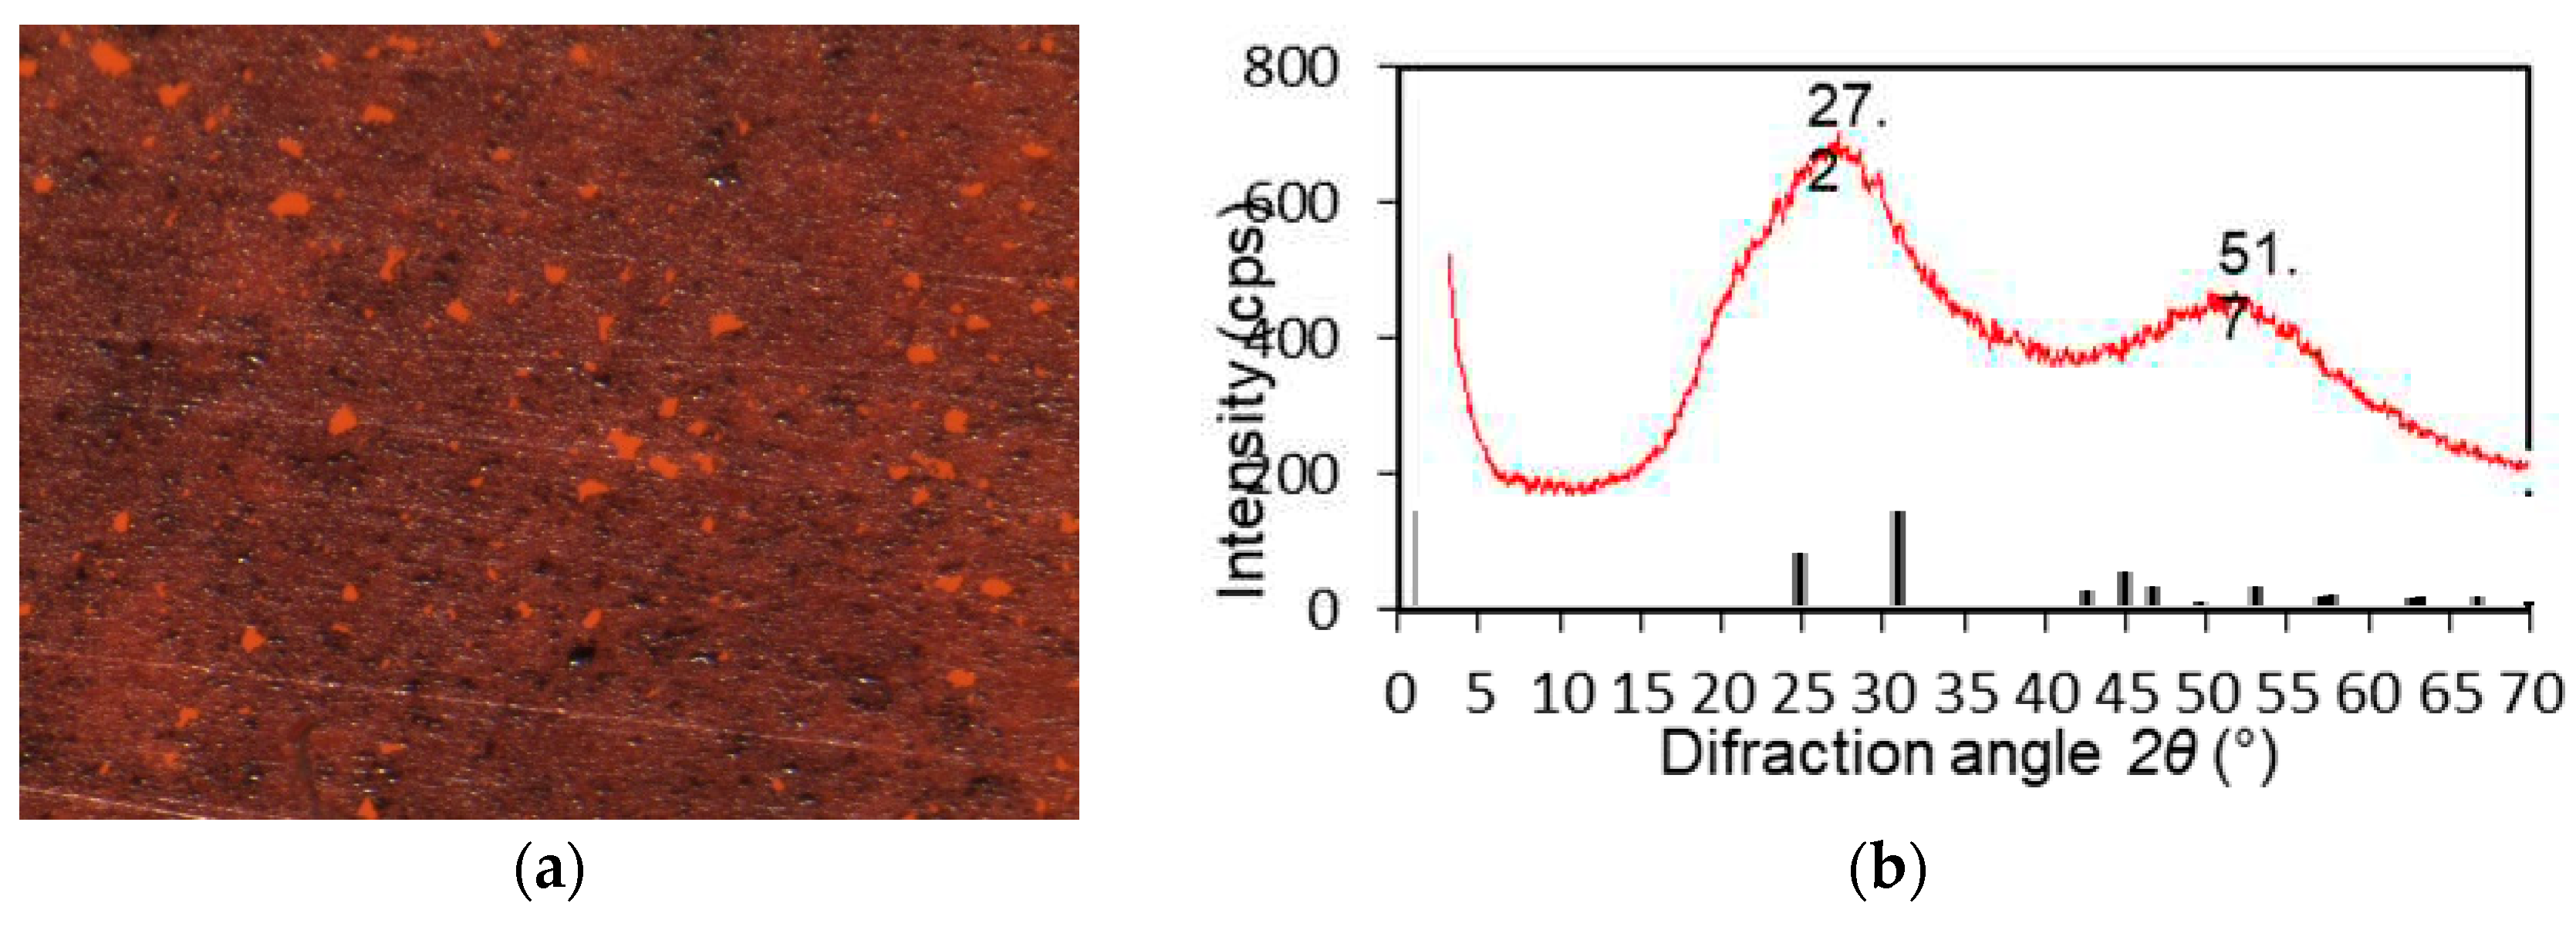
A red film was observed on PA 6 (Figure 3). The precipitate, characterised by XRD analysis (Figure 3 and Figure 4), was identified as red amorphous selenium (a-Se).
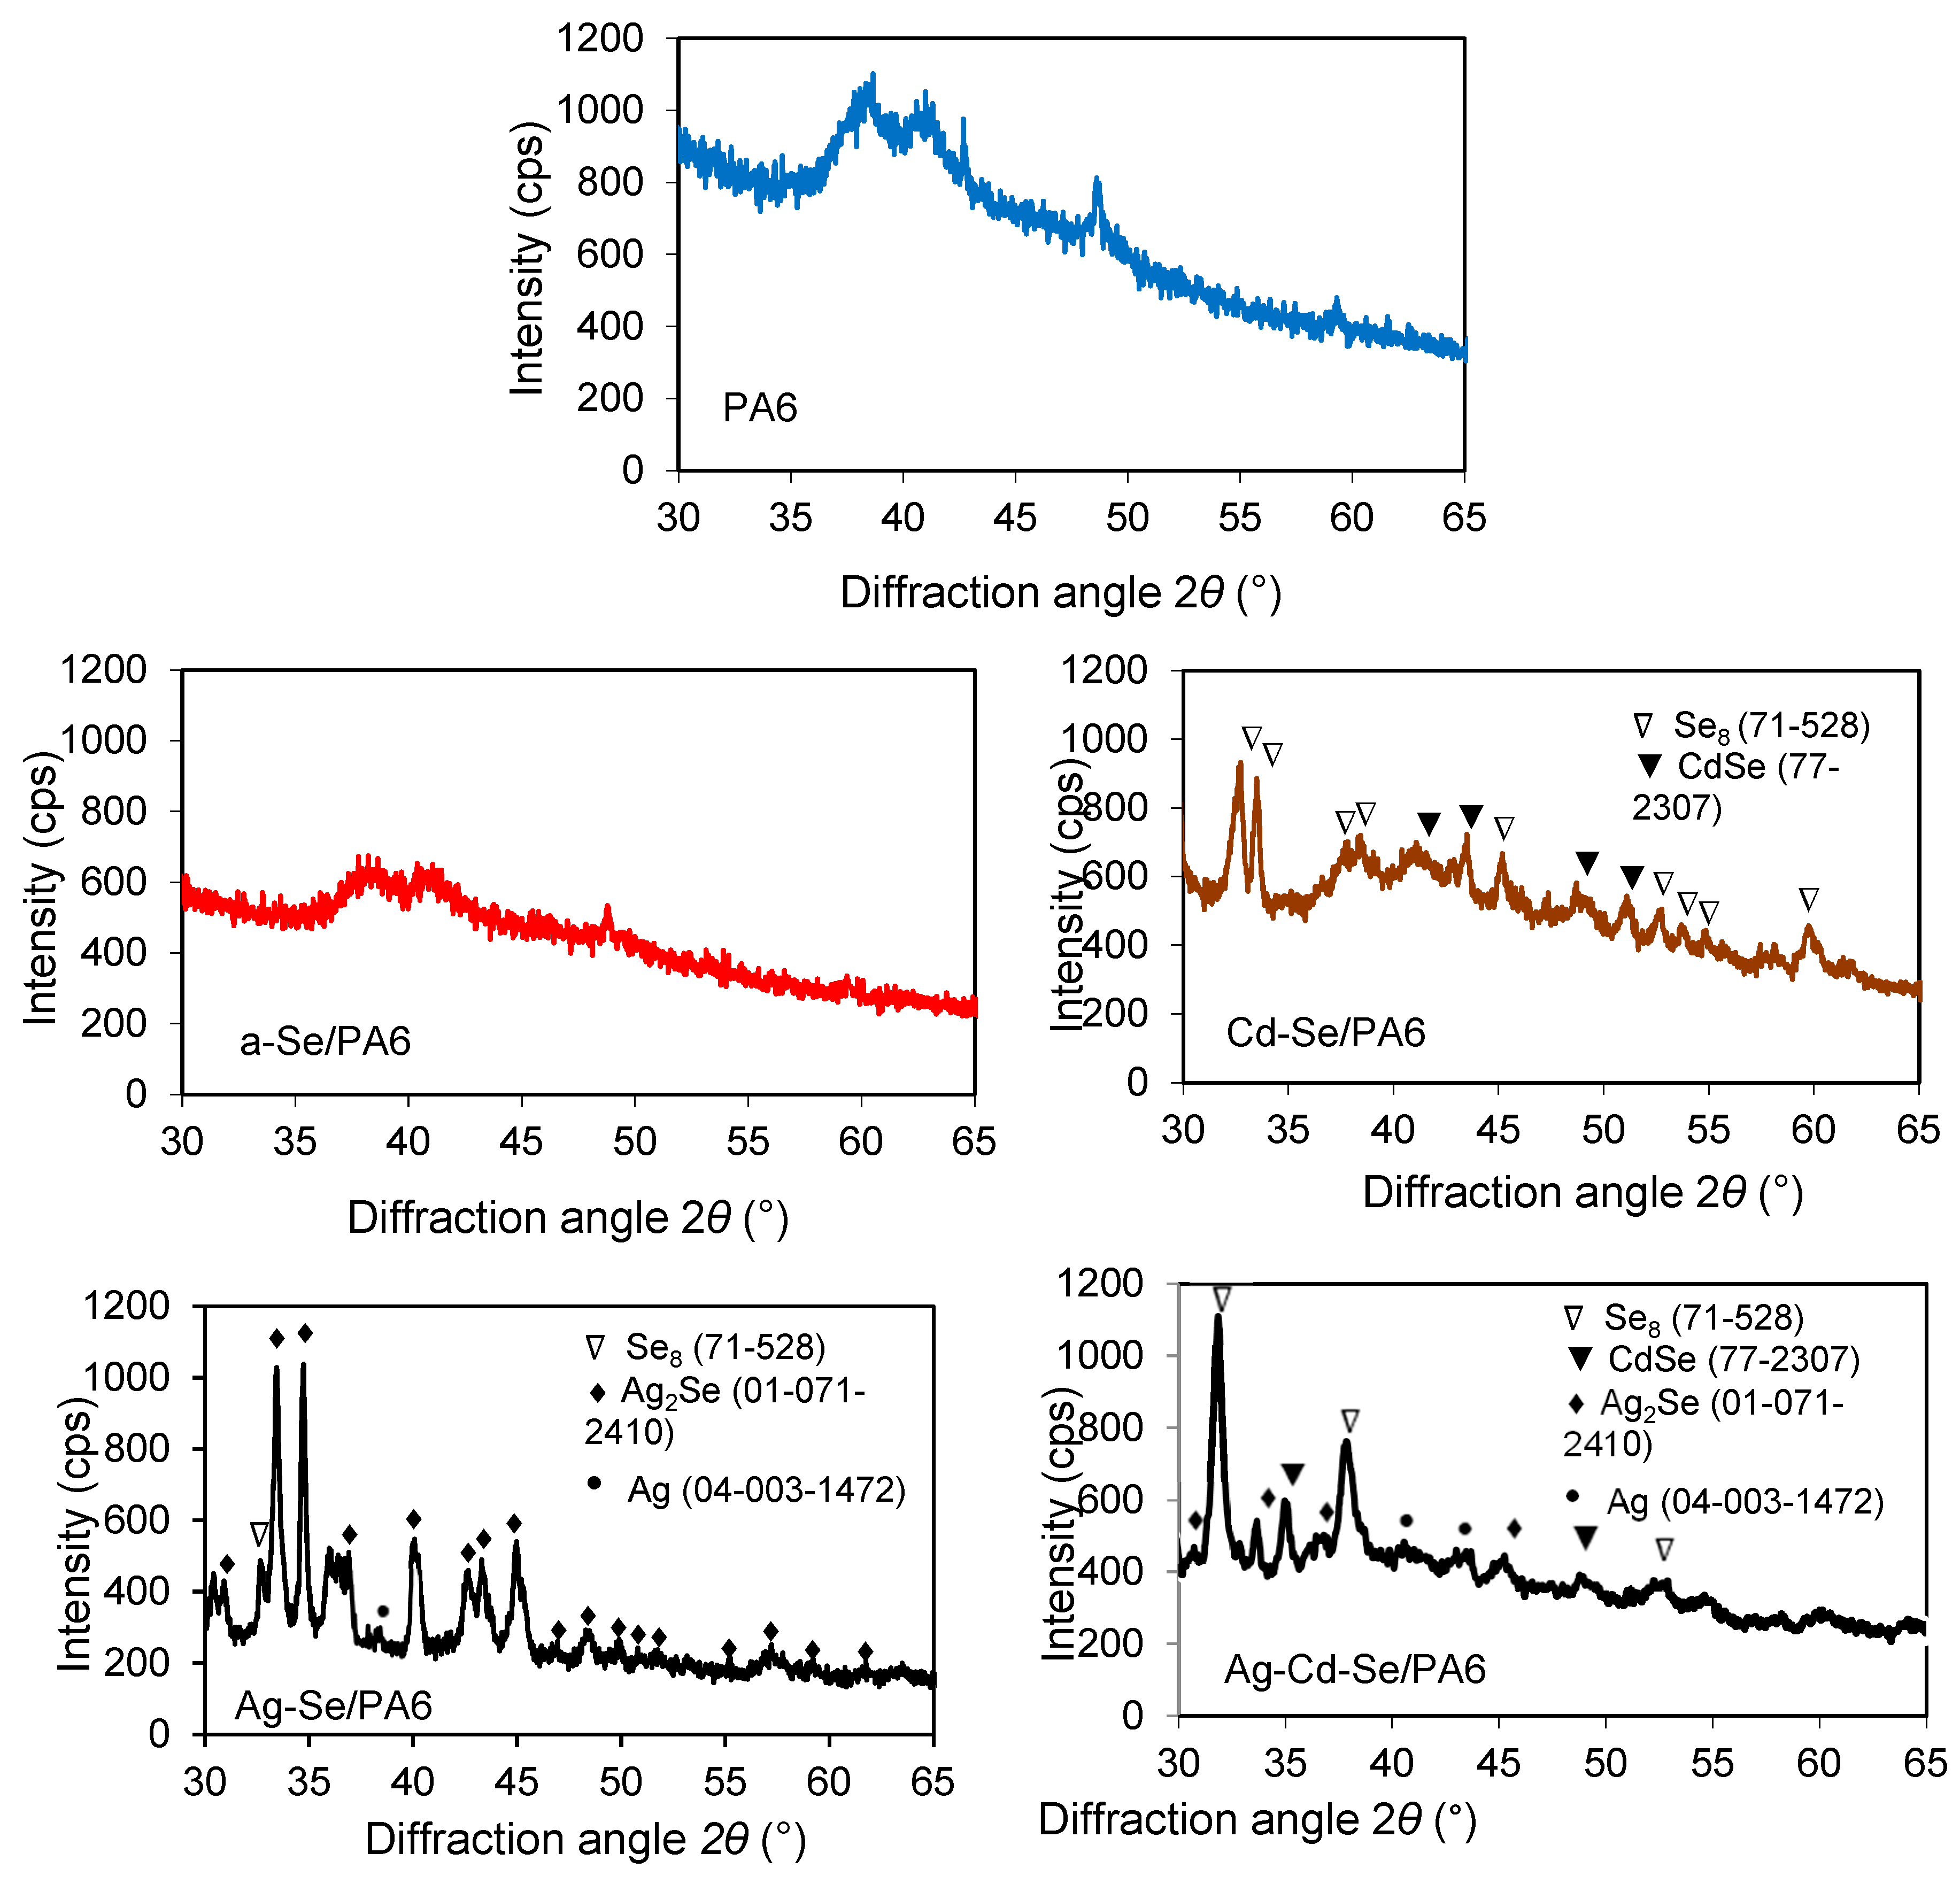
Because intensities of the diffraction peaks of PA 6 are very high and overlap with main peaks of the materials inserted/deposited on the polymer, the XRD patterns of the obtained composites were given in the 2θ assortment of 30–65°. As can be seen from Figure 4, in the a- Se/PA6 composite, Se formed at the end of reaction (9) is in the amorphous form, i.e., not detected by XRD analysis.
The obtained positions of the diffraction peaks at 2θ 42.74°, 43.46°, 48.68°, 51.09° in the Cd-Se/PA6 composite (Figure 4) were compared with standard values and mainly indexed as CdSe (PDF 77-2307). The peaks at 2θ 32.66°, 33.49°, 37.64°, 38.46°, 45.16°, 52.66°, 53.77°, 54.83° and 59.73° are indexed as Se8 (PDF no. 71-528) with hexagonal and monoclinic unit cells, respectively (Figure 4, Cd-Se/PA6 composite). It was found that CdSe has a polycrystalline nature with predominant (110) orientation plane. These experimental results agree well with the literature data. It is well known [43] that in the case of hexagonal lattices the strongest chemical bonds are formed by atoms located in a semi crystalline configuration on crystallographic planes (110) or (101).
Based on the analysis of the XRD results, it can be concluded that the immersion of the a-Se/PA6 nanocomposite in a Cd(NO3)2 solution at a temperature of 80±1 oC contributes to the gradual crystallisation of red a-Se into grey cr-Se. It is very reactive and reacts with many metal cations [44,45]. The solubility of a-Se (2.2∙10‒8 mol/dm3 [46]) was approximately an order of magnitude higher than the solubility of cr-Se (1.5∙10‒9 mol/dm3 [46]). The formation of CdSe can be explained by the following reaction [47,48,49]:
2Se(s) + 3Cd2+(aq) + 3H2O(l) → 2CdSe(s) + CdSeO3(s) + 6H+(aq),
The formation of the Cd-Se/PA 6 composite leads to a colour change of from red to brown (Figure 1).
The Ag-Se-6/PA 6 nanocomposite shows diffraction peaks corresponding to the orthorhombic phase of Ag2Se naumannite (PDF No. 01-071-2410). As can be seen from Figure 4, the dominant peak (121) of the orthorhombic system represents the preferred orientation along this plane. The identified peak positions are in good agreement with those indicated in the literature for Ag2Se nanowires [50] and nanoparticles [51]. The diffraction pattern of the Ag-Se/PA 6 nanocomposite shows two sharp lines of approximately the same intensity along the (112) and (121) planes respectively. The reaction involved in this process can be summarised as the following [47,48,49]:
3Se(s) + 6Ag+(aq) + 3H2O(l) → 2Ag2Se(s) + Ag2SeO3(s) + 6H+(aq),
The formation of Ag2Se leads to a colour change from red to black. Together with the Ag2Se phase, a minor amount of monoclinic Se8 (PDF No. 71-528) at 2θ 32.66° Se8 may remain unreacted in the deposited film phase. Ag-Se/PA6 composite (Figure 4) XRD analysis showed that not only Ag2Se but also the metallic Ag phase (PDF No. 04-003-1472) was identified in the diffractogram. Typically, the metallic structure of Ag is depicted by a sharp XRD peak at 2θ 38.12° corresponding to the preferred (111) texture. Metallic Ag is the most likely impurity in chemically deposited Ag2Se layers [50] as shown in the reaction as follows:
Se(s) + 4AgNO3(aq) + 3H2O(l) → 4Ag(s) + H2SeO3(aq) + 4HNO3(aq).,
As discussed in [52], excess Ag can be introduced in several ways: in the form of adsorbed metal chains, in the form of point defects, or in the form of three-dimensional nano- or micro-inhomogeneities.
The XRD pattern of the Ag-Cd-Se/PA 6 composite shows the multiphase crystalline composition of the film. Compared to the XRD pattern of the Cd-Se/PA 6 composite, Se8 and CdSe phases remain. The XRD peaks corresponding to CdSe are not shifted, which indicates the same structure, regardless of the cation exchange with Ag+ ions and the appearance of new phases associated with orthorhombic Ag2Se and metallic Ag. On Figure 4 also shows that the intensity of the peaks of the Ag-Cd-Se/PA 6 composite increases with the appearance of new phase, which additionally shows an increase in crystallinity. Broadening of the diffraction peaks is associated primarily with the finite sizes of the crystallites. The formation of Ag2Se in Cd-Se/PA6 composite leads to a colour change from brown to black.
Since the other phases were not found in Cd-Se/PA6, Ag-Se/PA6 and Ag-Cd-Se/PA6 nanocomposites, it could be assumed that the SeO32–, SO32– and SO42– ions diffused from the a-Se/PA 6, reacted with the Cd2+ and Ag+ ions to form these compounds in solution near the sample area. In another case, by-products of Equations (10) and (11) due to the sufficiently high solubility (Table 2, CdSeO3 (KSP = 5.0·10‒9 (mol/dm3)2) and Ag2SeO3 (KSP = 1.35·10‒16 (mol/dm3)3) were removed from the surface of the samples by rinsing the as-synthesized composites with excess hot water.
The structural parameters of PA 6 and the prepared composites calculated from XRD data are listed in Table 1.
A theoretical framework provides a general background to support our investigation. The sequence of phase formation in multicomponent systems depends on the structure of the starting material (SM). It is common knowledge that the exchange of cations can be achieved through simple mutual diffusion with other cations [53]. In addition, considering phase formation, the driving force of the solid-state interaction is also determined by the change in the Gibbs free energy, since the system always tends to the lowest possible free energy state [54]. The feasibilities of possible CE reactions were studied by thermodynamic deduction based on the thermodynamic law. CE reactions based on major difference in solubility product (KSP) between the starting material (SM) and the final product (FP). Gibbs free energy (ΔG) for insoluble materials expressed according to Equation (15):
G = R T × l n J C P K S P ,
where R—universal gas constant (8.319 J/mol·K), T—temperature (K), KSP—the solubility product of the SM (in our case CdSe), ICP—the product of the concentration of FP ions (in our case Ag2Se). ICP can be calculated according to Equation 16:
I C P = C A g + 2 × C S e 2 ,
where C A g + and C S e 2 —the concentration of ions (mol/dm3). In this way, the reaction of transition from a material with higher KSP (CdSe) to a lower one (Ag2Se) can proceed spontaneously. However, it is not easy to judge whether the CE reaction can proceed or not since this process is very complex and is associated with many factors: barrier to the activation energy of the phase transition, change in surface free energy, temperature, the active concentrations of ions in the solution, etc. [55]. Therefore, a more correct criterion should be the difference in solubility (S) of the SM and the FP (see Table 2).
The stoichiometric reactions at an interface between the Cd-Se/PA 6 and Ag+ salt aqueous solution can be considered as follows:
C d S e ( s ) + 2 A g ( a q ) + A g 2 S e ( s ) + C d ( a q ) 2 + , G r e a c , 298 ° = 144.60
The negative values of ΔG°reac,298 indicate that thermodynamic conditions are provided for the proceeding of this reaction. However, it should be emphasised that in the case of solid-phase interaction in multicomponent systems, phase formation at the precursor/solution interface is a dynamic non-equilibrium process that requires careful consideration of the mechanistic pathways along which they proceed [57]. Apparently, the determining criterion for the possibility of a thermodynamic reaction in hybrid materials is the solubility of CdSe in the starting Cd-Se/PA6 material. The higher solubility of CdSe (Table 2) favours the transformation into Ag2Se. When Cd-Se/PA6 is immersed in AgNO3 solution, Ag+ reacts with Se2‒ ions formed from the ionisation of dissolved CdSe leading to the formation of Ag2Se particles, which results in the reduction of Cd2+ ions in the solution. Before explaining the formation of the Ag2Se phase, it is necessary to discuss the active species that might be involved in the reaction path. Based on the discussion presented above, we speculated that the formation of Ag2Se phases in the Cd-Se/PA6 composite could be explained through complex mechanism reactions: Ag+ ions were attracted to the surfaces of metal chalcogenides particles due to the large specific area, then adsorbed Ag+ replaced Cd2+ ions from the CdSe lattice and formed Ag2Se. In parallel, some Ag+ ions featuring relatively high ion diffusivity [58,59] propagate into the interior of the polymer and react with the cr-Se to form Ag2Se according to reaction (13). The obtained composites (denoted in the text as a-Se/PA6, Cd-Se/PA6, Ag-Se/PA6 and Ag- Cd-Se/PA 6) were homogeneous with good adhesion.

3.2. AFM Analysis

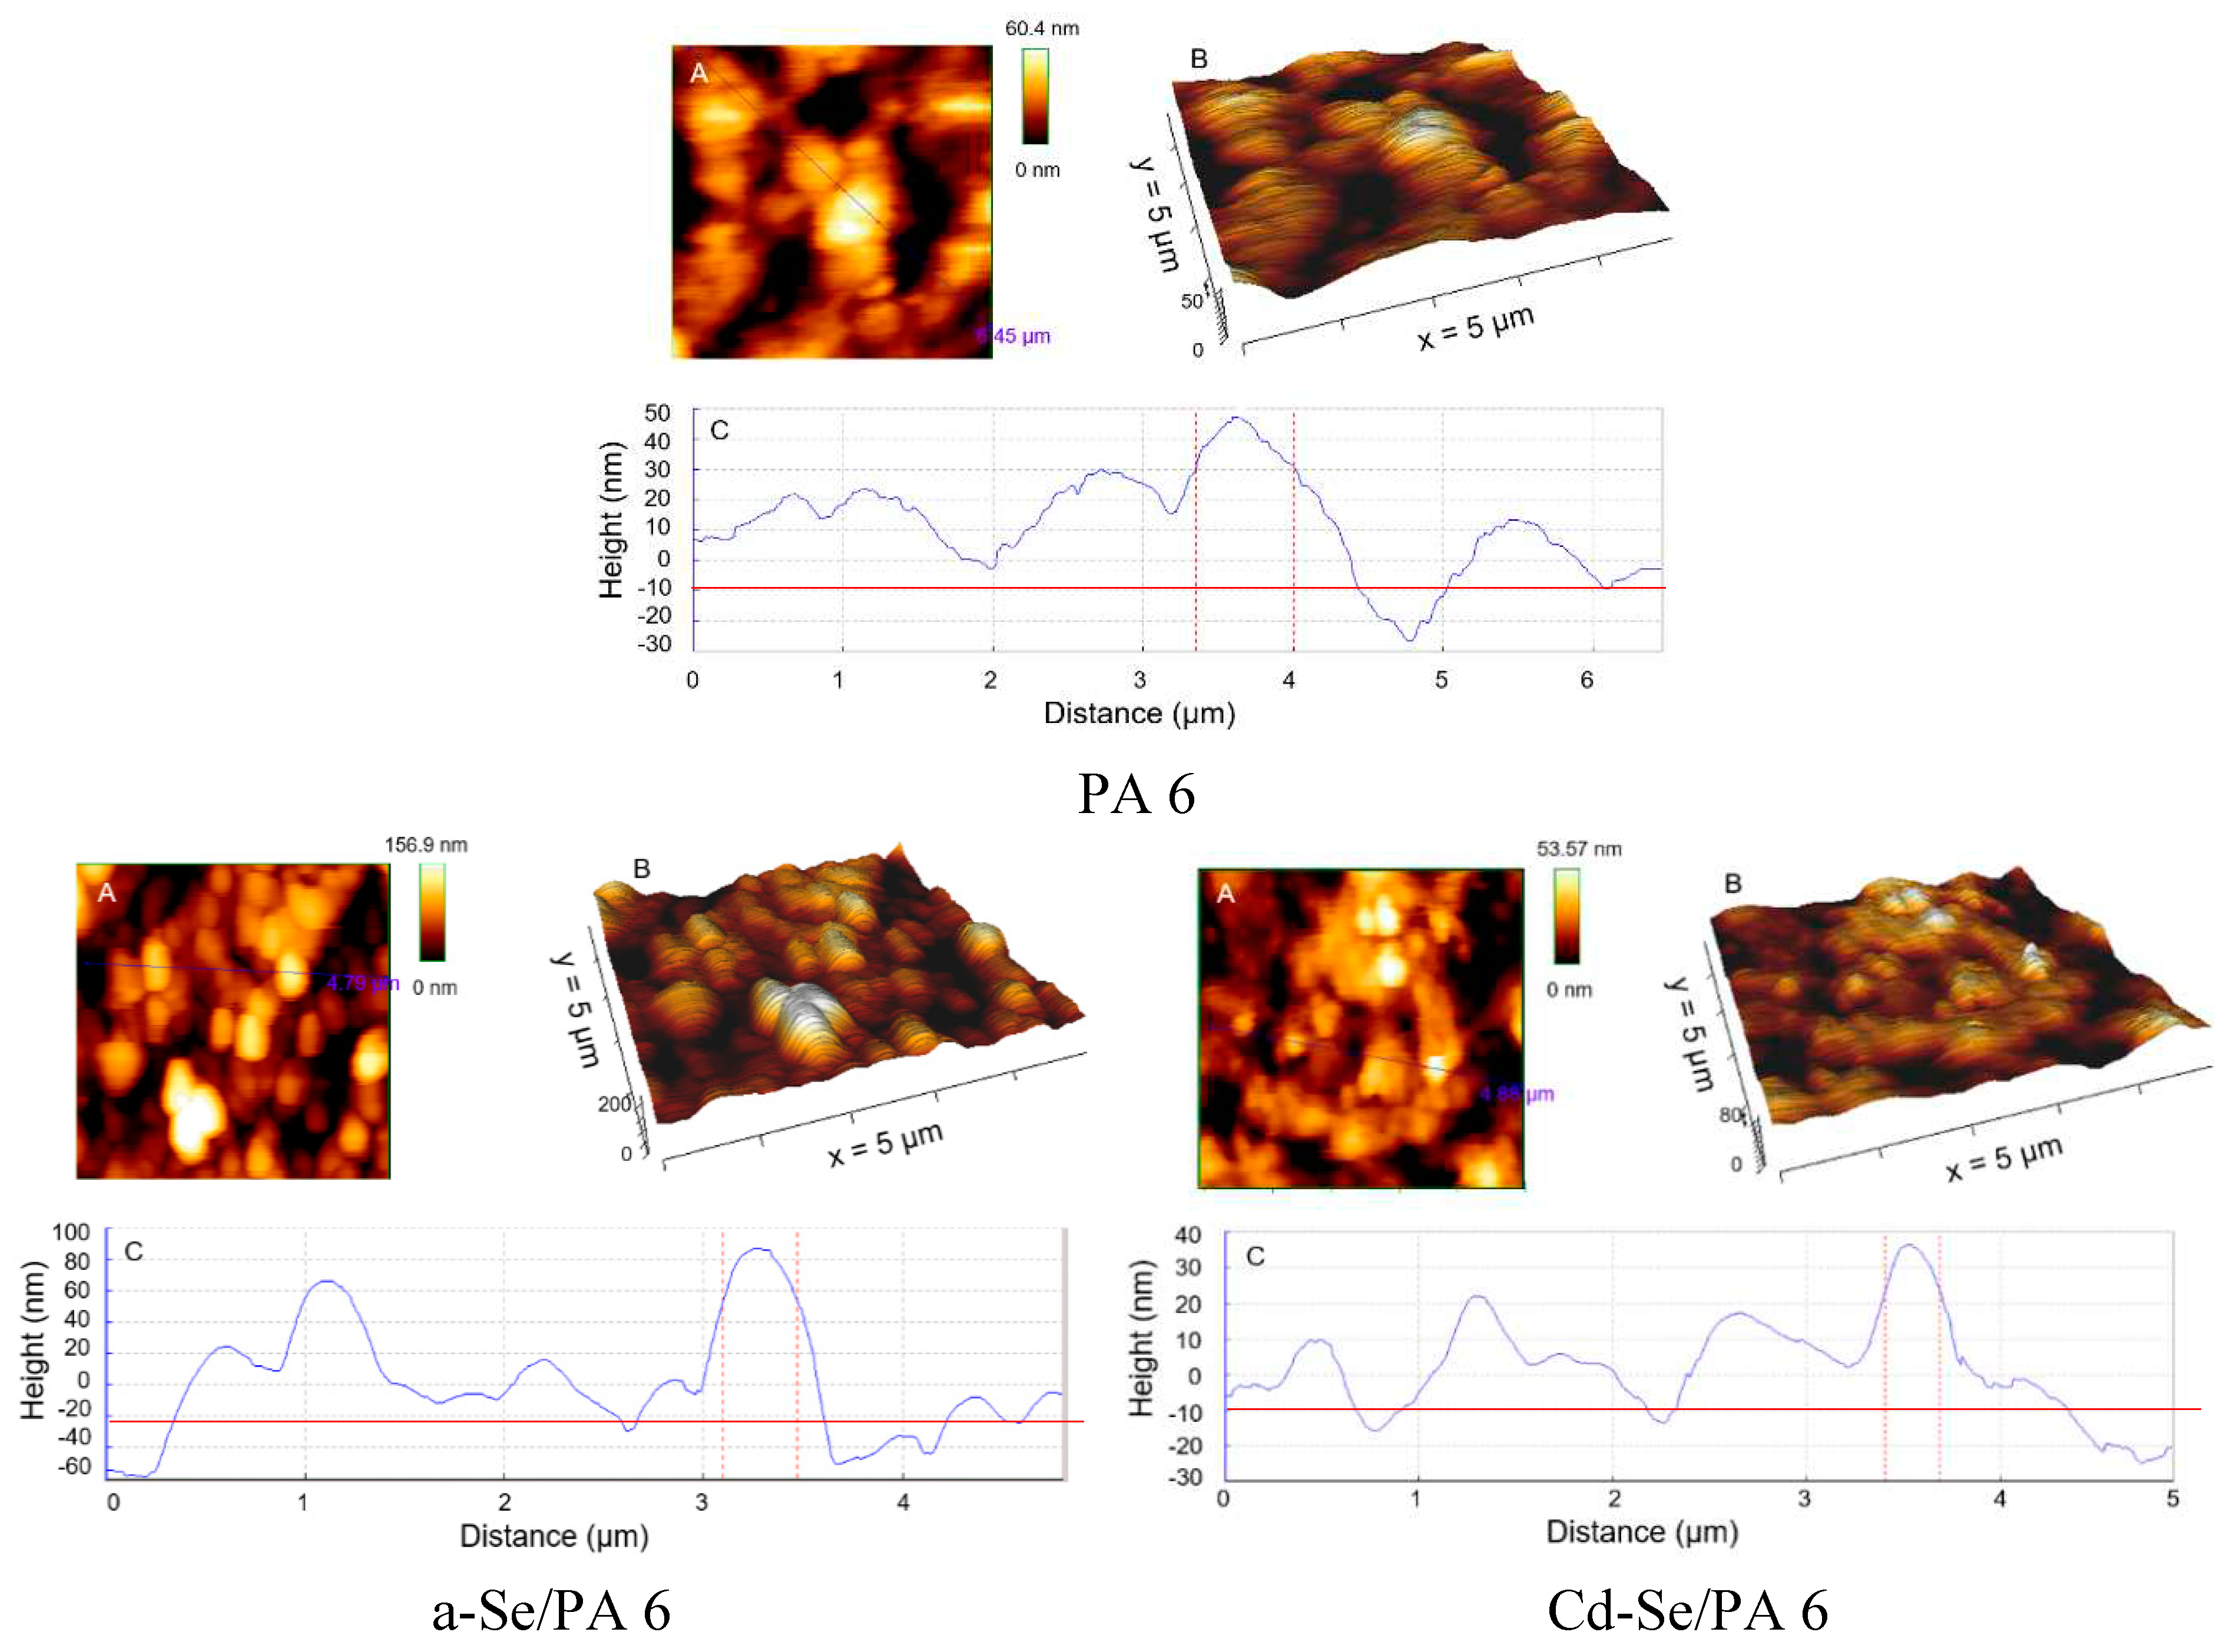
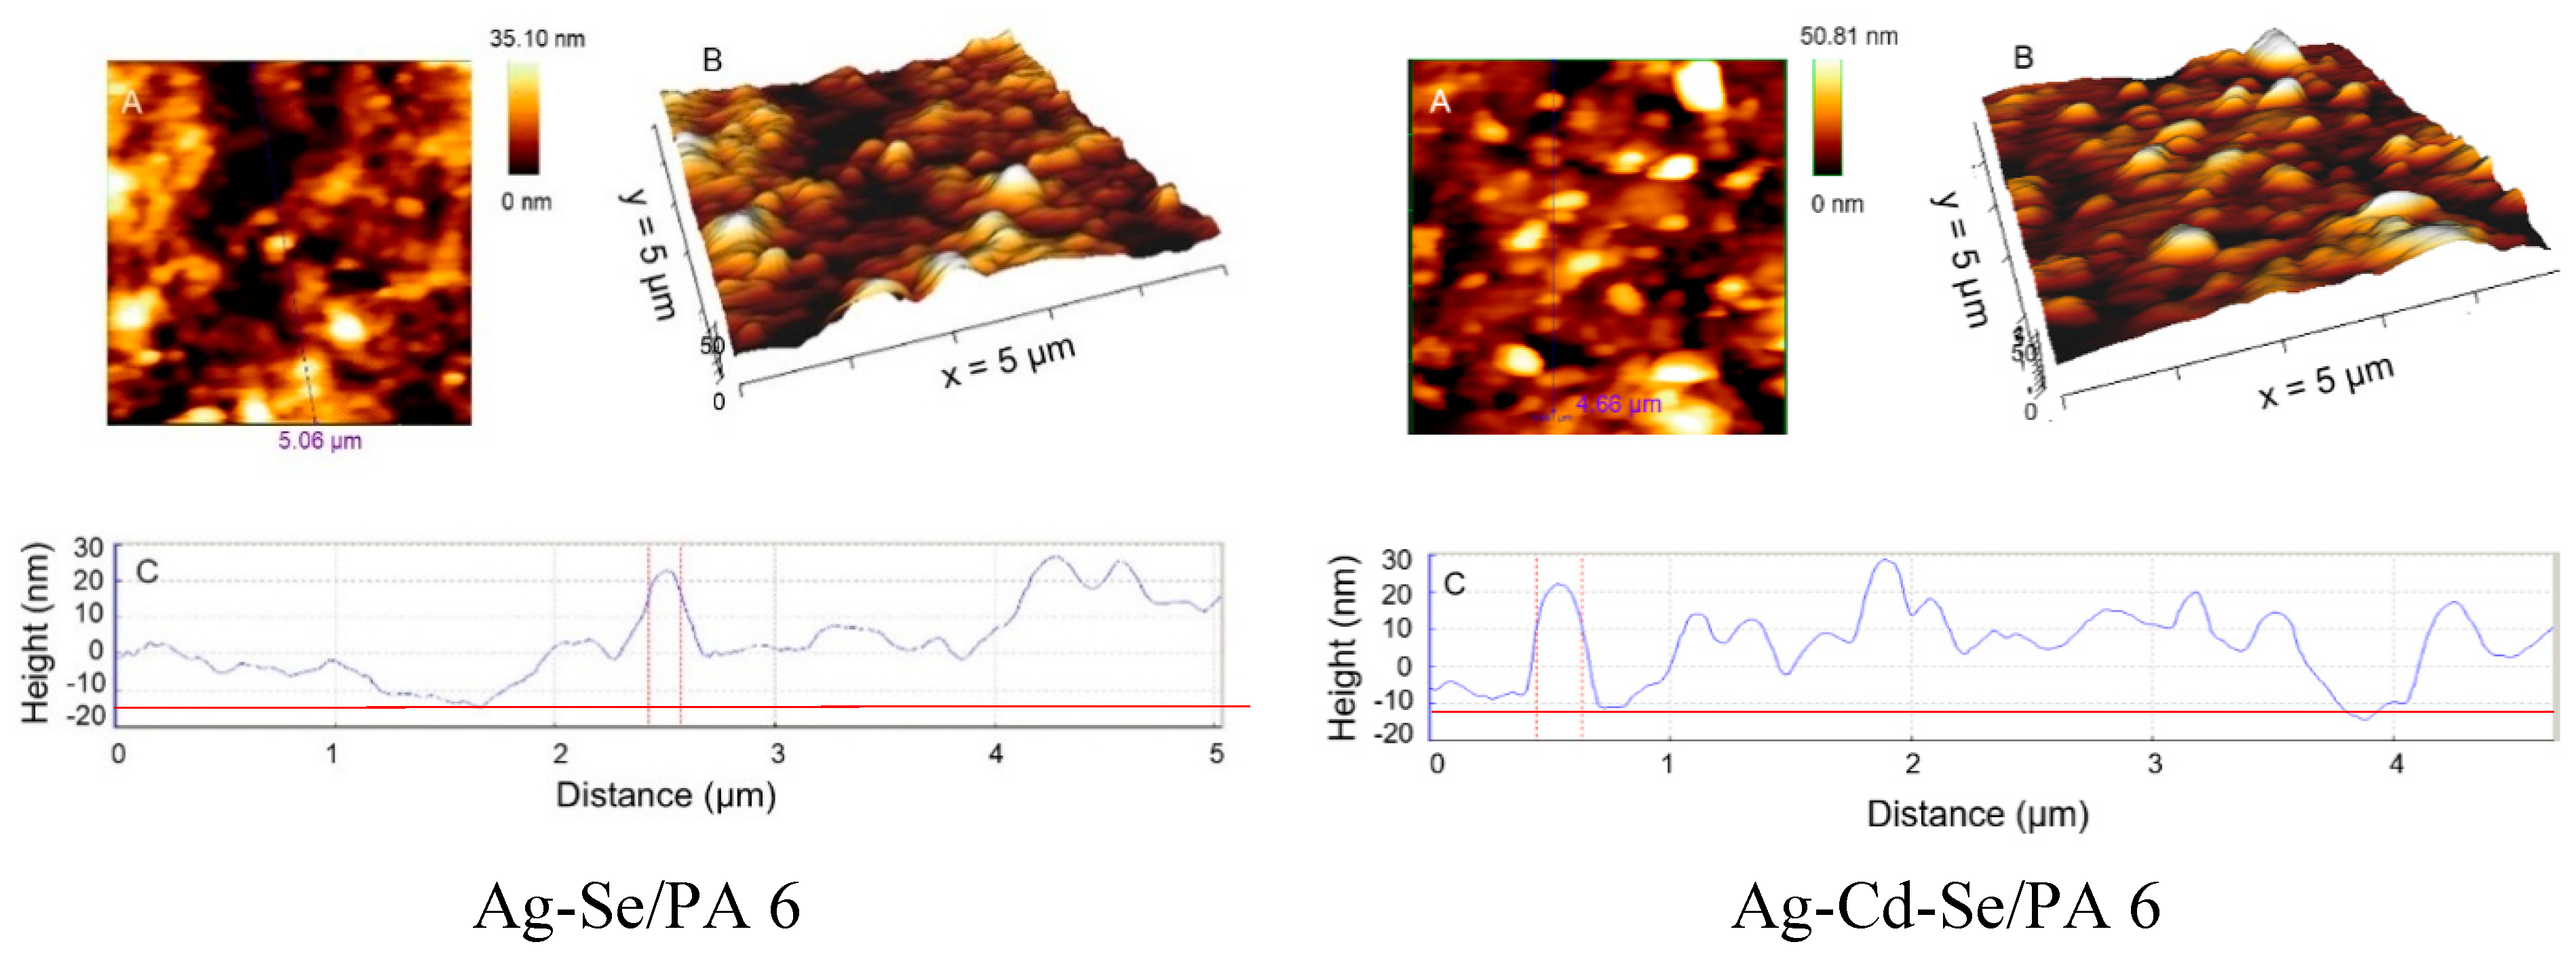
The morphological changes of the PA 6 surface before and after subsequent chemical incorporation of a-Se, and Cd2+ and Ag+ cations were characterized by AFM.
One can see that the surface morphology of all nanocomposites varies depending on the incorporated element. AFM was used to elucidate the formation mechanism and homogeneity of obtained composites. On a selected small scan area of 5 µm × 5 µm, 2D height data (Figure 5A) and 3D topographic (Figure 5B) AFM images of the respective PA 6 membrane, a-Se/PA 6, Cd-Se/PA 6, Ag-Se/PA 6 and Ag-Cd-Se/PA 6 nanocomposites with the corresponding measured topographic parameters are shown in Figure 5. The morphological pattern of PA 6 membrane revealed a wavy surface. a- Se/PA 6, Cd-Se/PA 6, Ag-Se/PA 6 and Ag-Cd-Se/PA 6 composites had a rough surface. The 3D topographic images (Figure 5B) show an irregular pattern resembling a valley of nodules. Since the composites did not have a pronounced texture but were characterized by a complex relief morphology, the roughness parameters were calculated from profilograms obtained for different surface areas (Figure 5C). The length of the scan areas was approximately 4.5–6.5 μm. Surface roughness is an important indicator of the quantitative characteristics of the sample surface. The average height, Zmean (156.9 nm), and the average surface roughness, Ra (27.61 nm), of the a-Se/PA 6 composite are clearly different from those of the unreacted PA 6 membrane (Zmean 60.4 nm, Ra 10.78 nm) (Figure 5A,B). As shown in Figure 5 local areas of the surface of the PA 6 membrane and the a-Se/PA 6 composite have different morphological structures. Simultaneously, isolated solid particles of amorphous Se (Figure 5) functioned as seeds to start the formation of CdSe and Ag2Se. When a-Se/PA 6 composite was exposed to an aqueous Cd(NO3)2 and AgNO3 solutions, a-Se reacts with Cd2+ and Ag+ cations to form insoluble CdSe and Ag2Se nanoparticles that deposit in situ on the a-Se/PA 6 and produce the Cd-Se/PA 6 and Ag-Se/PA 6 composites (according to Equations (12) and (13)). The average height Zmean (53.57 nm) and the average surface roughness Ra (9.82 nm) of the Cd-Se/PA 6 composite significantly decreased compared to the a-Se/PA 6 composite. It implies that CdSe formation proceeded mainly through deposited a-Se layers within the PA 6 surface. The average height Zmean (35.10 nm) and the average surface roughness Ra (8.25 nm) of the Ag-Se/PA 6 composite significantly decreased compared to the a-Se/PA 6 composite. After exposure of the Cd-Se/PA 6 composite in an aqueous solution of AgNO3, submicron pyramidal particles, presumably belonging to Ag2Se (according to Equation 13), are found on the surface of the resulting Ag-Cd-Se/PA 6 composite (Figure 5). Pyramid-like structures with a lateral size of about 150 nm are also visible. Some of these particles aggregate on the composite surface. Small dark spots at the boundaries of grains and agglomerates may be due to depressions in the layers. From the roughness values presented in Figure 5, we can conclude that the quantitative parameters of the surface of the Ag-Se/PA 6 and Ag-Cd-Se/PA 6 composited decreased compared to the Cd-Se/PA 6 composite. For Ag-Cd-Se/PA 6 composite Ra decreased from 9.82 nm to 8.36 nm, and Rq decreased from 12.17 nm to 11.55 nm. In addition, the peak-to-valley roughness Rt of the surface of the Cd-Se/PA 6 and Ag-Cd-Se/PA 6 composites remain virtually unchanged. That confirmed our assumption about the formation of compact films. RMS is defined as the standard deviation of the surface height profile from the average height. The profilograms indicate a slightly asymmetric surface with more peaks than valleys (Figure 5C). It is important to note that the RMS of the deposited films decreased during the formation of CdSe, Ag2Se and mixed CdSe-Ag2Se nanoparticles compared to the a-Se films deposited on the PA 6 surface.

3.3. ATR-FTIR Analysis

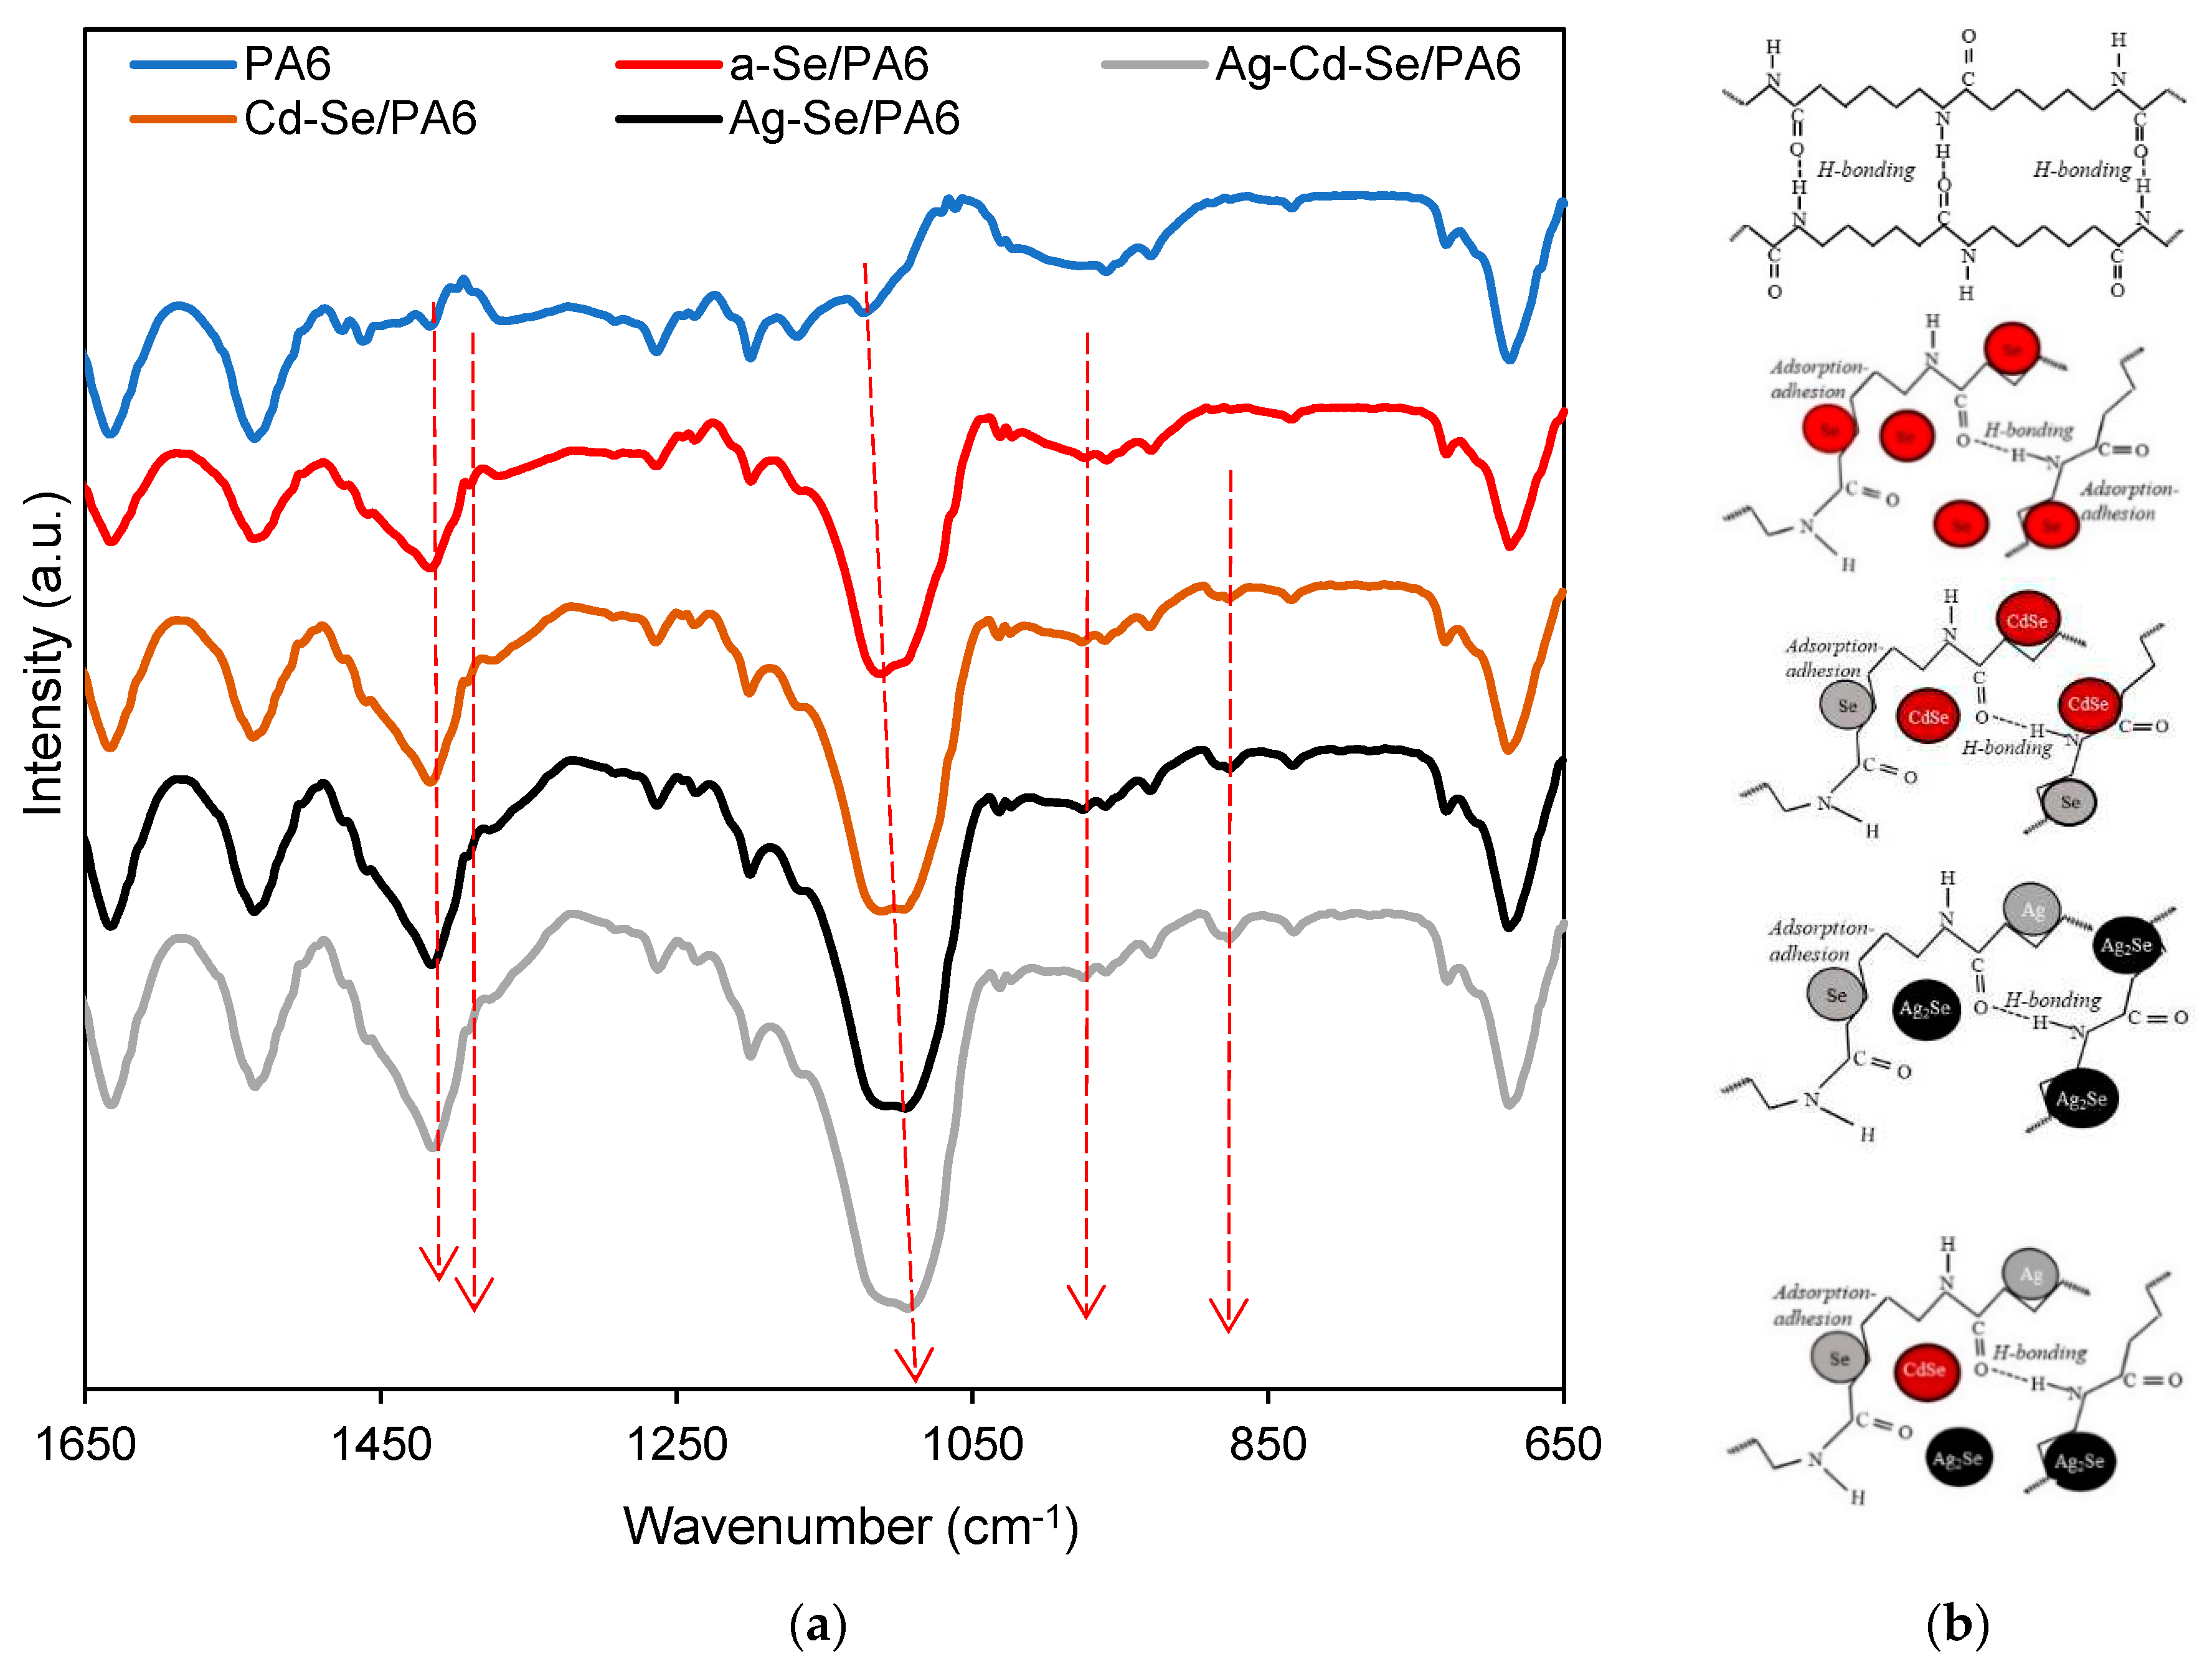
The FTIR study allows to discover the conformational structural changes of polymer chain as well as and the complexation and interaction between the polymeric matrices and inorganic nanoparticles. The ATR-FTIR spectra of the PA 6 and obtained nanocomposites within a wave number range from 650 to 1650 cm−1 are displayed in Figure 6. PA 6 consists of (CH2)5 segments separated by a parallel or antiparallel arrangement of secondary amide groups [60]. The bands related to NH–CO fragments are mainly affected by the mutual arrangement of H–bonds, while the vibrations from CH2 groups reflect the effect of the chain conformation [61]. In PA 6 spectrum the absorption bands at 834 cm‒1, 929 cm‒1, 960 cm‒ 1, 1031 cm‒ 1 and 1200 cm‒ 1 (Table 3), confirm predominantly the α-crystalline phase. The spectral features at 1476 cm−1 and 1417 cm‒1 represent CH2 scissoring vibrations next to −NH and >C=O groups, respectively. The band at 1463 cm−1 corresponds to CH2 scissoring vibrations. Two typical absorption bands at 1633 and 1535 cm‒1 represents the amide I and II group, respectively.
The FTIR vibration bands of Se8 rings are reported at 487.9 cm−1 and 737.7 cm−1 [62]. These peaks are absent in the FTIR spectrum of a-Se/PA 6, which confirms the XRD data that the inserted selenium is amorphous. Incorporation of solid inorganic nanoparticles into flexible polyamide network causes chain stretching. This should cause a conformational change in the chains of the polymer matrix [61,63]. It can be seen that most of the characteristic vibration bands of PA 6 in the wavenumber region from 650 to 1650 cm−1 are retained in the FTIR spectrum of a-Se/PA 6; however the intensity of the peaks changes: some of them become more intense and some of them expand. It can be concluded that as a-Se nanoparticles are introduced between the polymer chains and stretched, the position and intensity of the peaks change. Thus, the peak of neat PA 6 at 1124 cm−1 in a-Se/PA 6 spectrum shifts to 1112 cm−1, and two new small peaks are recorded at 974 cm−1 and 1390 cm−1. The shoulder at 974 cm−1 shows the appearance of a small amount of the γ crystalline form of PA 6, and C–C symmetry vibration causes IR absorption at the 1390 cm1 [64].
CdSe and Ag2Se have no specific vibrations in the spectral region between 650 and 1650 cm– 1, but exhibit absorption in the region of 200–400 cm–1 [65,66,67]. Thus, it is possible to avoid the problem of overlapping of metal selenides and PA 6 characteristic peaks. The IR spectra of the Cd-Se/PA 6, Ag-Se/PA 6 and Ag-Cd-Se/PA 6 composites are very similar to the a-Se/PA 6 spectrum, but show an even greater shift of the peak at 1112 cm−1 to lower frequencies (Table 3) and the appearance of another new peak at 877 cm−1. By analogy with data reported for CdSe [61], those weak vibrations can be attributed to the Cd–Se or Ag–Se bond. Another dimension of the functionality and complexity of inorganic-organic materials is introduced if the selenides are combined with each other. For example, the negative energies of chemical band formation of CdSe and Ag2Se promote the creation of Ag–Cd–Se– interfacial bonds, which leads to non-selective nucleation in Ag2Se/CdSe hetero-nanostructures [68]. Thus, the peak at 1108 cm−1 in the IR spectrum of the Ag-Se/PA 6 composite shifts to 1094 cm−1 in the IR spectrum of the Ag-Cd-Se/PA 6 composite.
The shift and broadening of the C–C stretching vibration peaks, accompanied by the appearance of new small peaks of low intensity, allows us to conclude that we are observing the formation of intermediate structures inside the polyamide chains. Thus, we can be conclude, that the spectral changes after insertion of a-Se and ions of Cd2+ and Ag+ ions with respect to PA 6 sample belong to the bands related to the C–C conformation of the main chain. The peak at 1124 cm−1, arising from the all-trans C–C conformation of the main chain, loses its spectral position. In addition, the peak is broadened, and its intensity noticeably increases in all spectra of the obtained composites (Figure 6).

3.4. UV-Vis Analysis

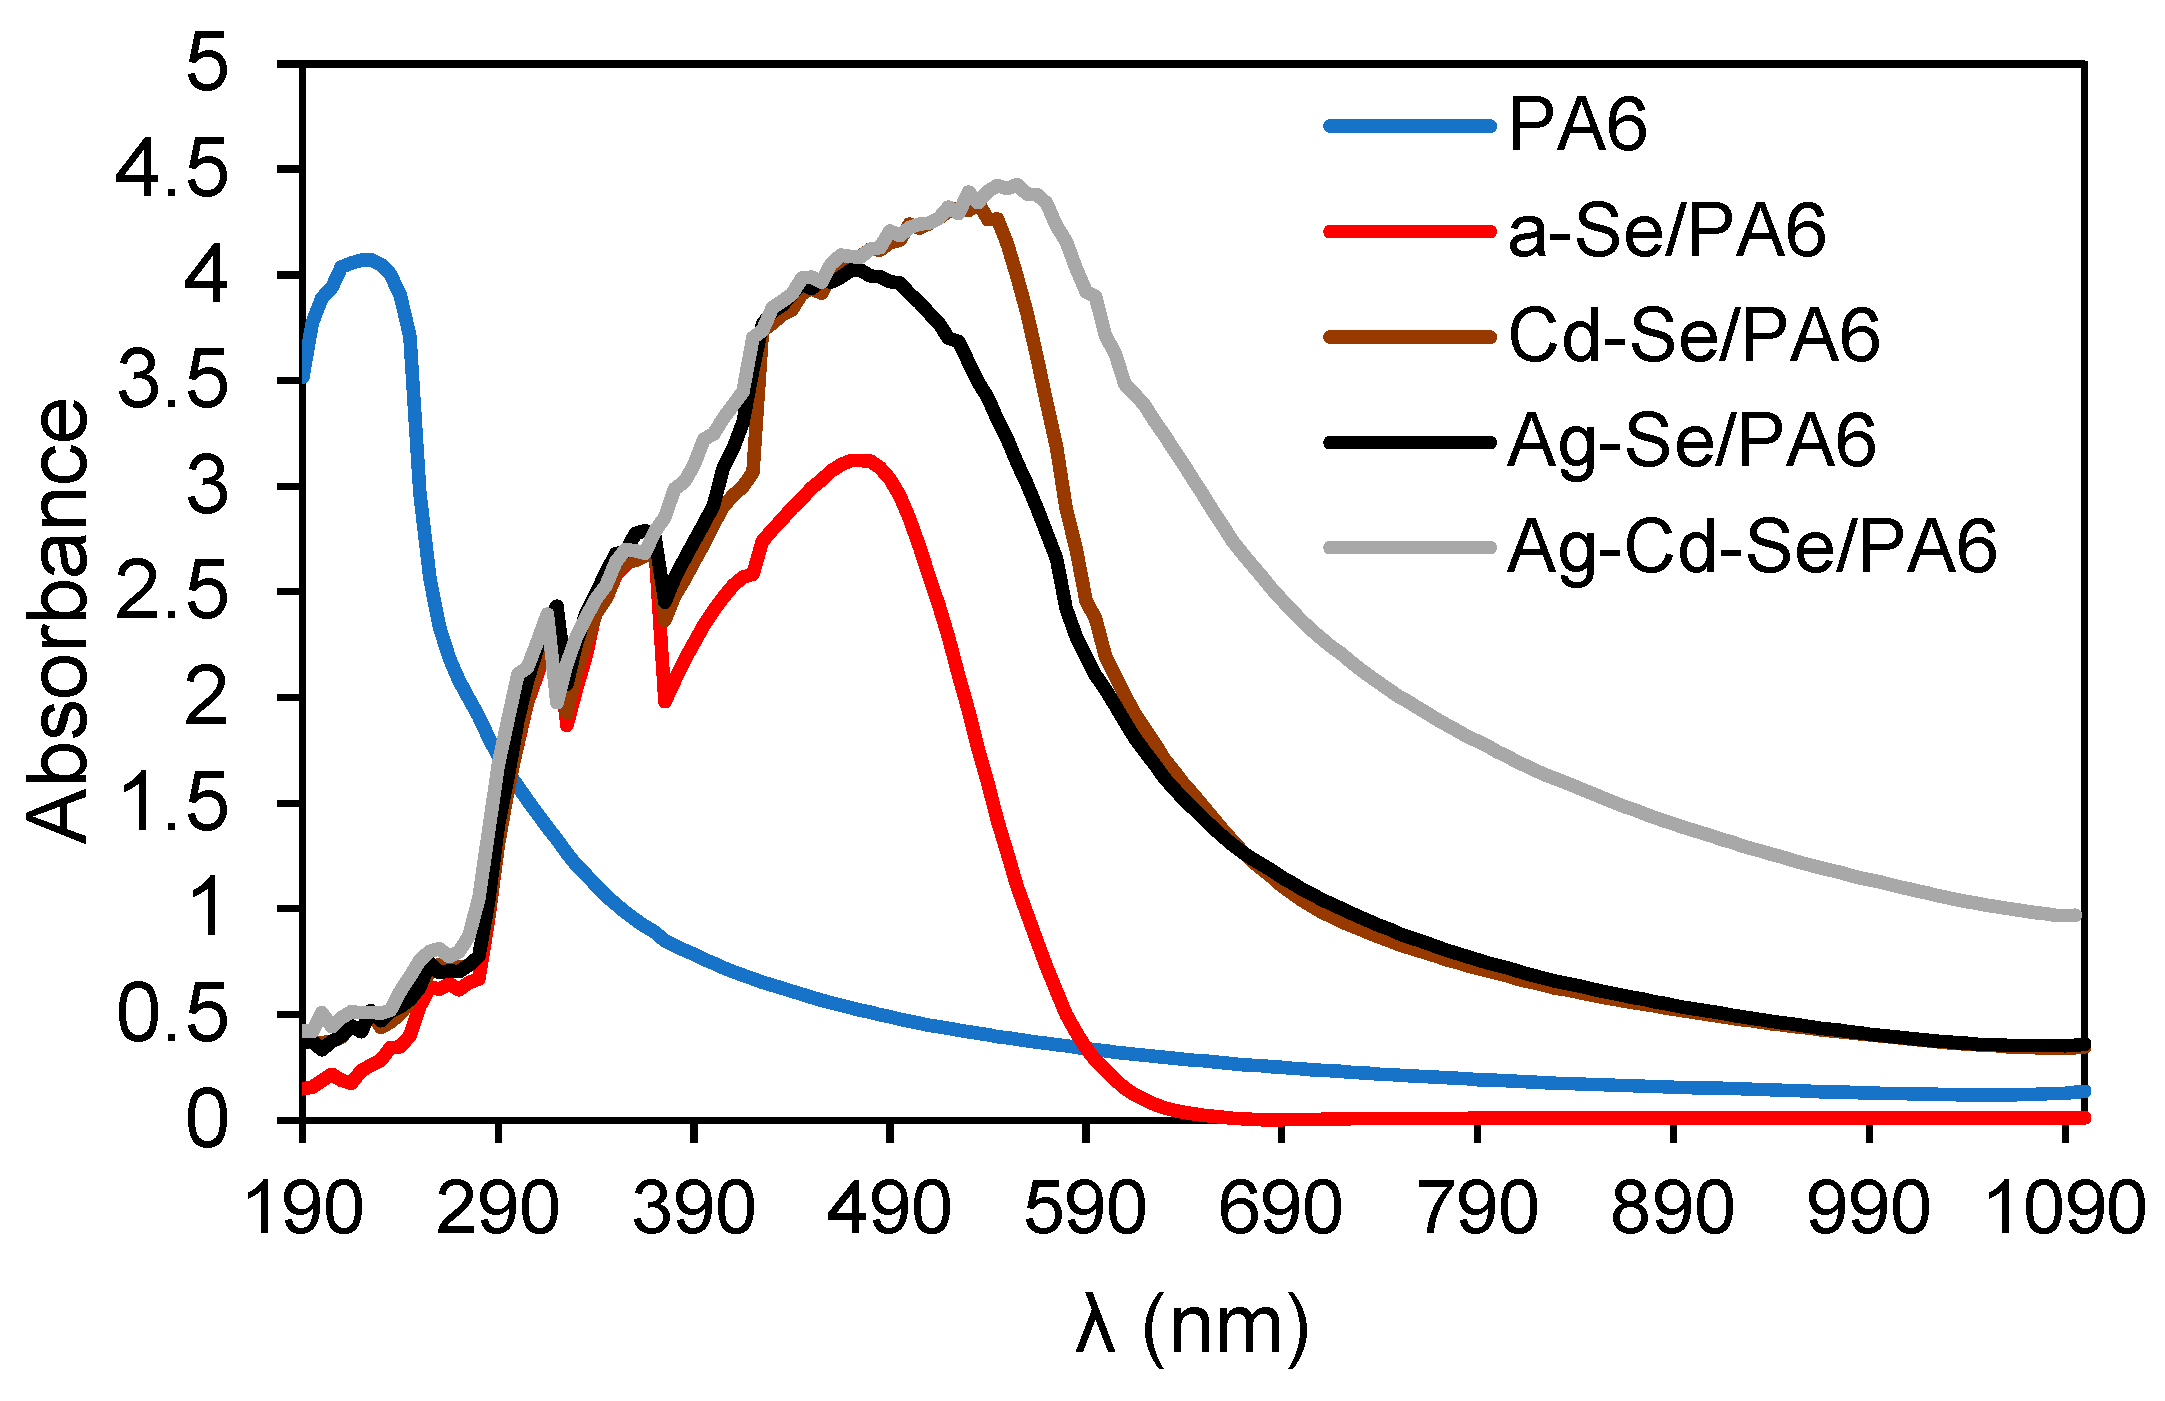
The experimental absorption spectra are presented in Figure 7.
The absorption spectrum of PA6, (Figure 7.) displays absorption peak at 225 nm. The color of the obtained a-Se/PA6 nanocomposite becomes red, suggesting the change of optical properties. In the UV-Vis absorption spectrum of the a-Se/PA6 nanocomposite, a number of peaks appear at 320 nm, 370 nm, and 475 nm, which characterize the formation of a band structure: red a-Se nanoparticles are introduced into the system of PA 6 micropores at the first stage, and then they combine into aggregates and agglomerates. According to the literature data [69,70] bulk a-Se absorbs 475 nm light.
In the UV-Vis spectrum of the Cd-Se/PA6 nanocomposite, peaks appear at the same 320 nm and 370 nm, which are related to Se nanoparticles and agglomerates, and a new peak at 535 nm. According to the literature data, CdSe quantum dots have a wide absorption band in the spectral range of 410–545 nm [71], and the absorption maximum of CdSe nanocrystals, depending on the particle size, is in the range from 492 to 578 nm [72]. Therefore, the peak at 535 nm can be attributed to CdSe.
In Ag-Se/PA6 UV-Vis spectrum the peaks appear at 320 nm, 365 nm and 475 nm. Ag2Se nanoparticles absorb in a wide spectral region from 300 to 600 nm [73], while two sharp peaks are observed in the spectrum of quantum dots at 440 and 607 nm, respectively [74]. Monodisperse silver nanoparticles, depending on the size, shape, and distribution in nanostructures, have two absorption bands; one broad peak in the range 420-430 nm and a shoulder at 580-590 nm [75]. Therefore, a broad peak from 380 to 590 nm with a maximum at 475 nm can be attributed to the Ag2Se phase with a small amount of Ag nanoparticles.
In Ag-Cd-Se/PA6 nanocomposite UV-Vis spectrum the peaks appear at 315 nm and 555 nm. According to the literature data [76,77,78], the introduction of Ag+ ions into CdSe nanocrystals via the CE reaction does not lead to noticeable changes in the absorption spectra of CdSe in the UV-visible region. In contrast, other authors suggested that the formation of the CdSe-Ag2Se core-shell leads to the complete disappearance of the CdSe absorption peak in the UV-Vis spectra [79]. Thus, it can be stated that the absorption spectrum of the Ag-Cd-Se/PA6 composite is a superposition of the individual absorption spectra of the CdSe, Ag2Se, and Ag phases, its absorption edge is shifted to the longer wavelength region, and their absorption increases in the range of 315–555 nm compared to with the region (320–535 nm) of Cd-Se/PA6 and Ag-Se/PA6 composites. This red shift of the λg may be related to the common complex alignment of the valence and conduction bands, as well as to the presence of multiple defects and vacancies. The determination of the phase composition of the obtained composites according to the data of optical studies is in good agreement with the XRD data.
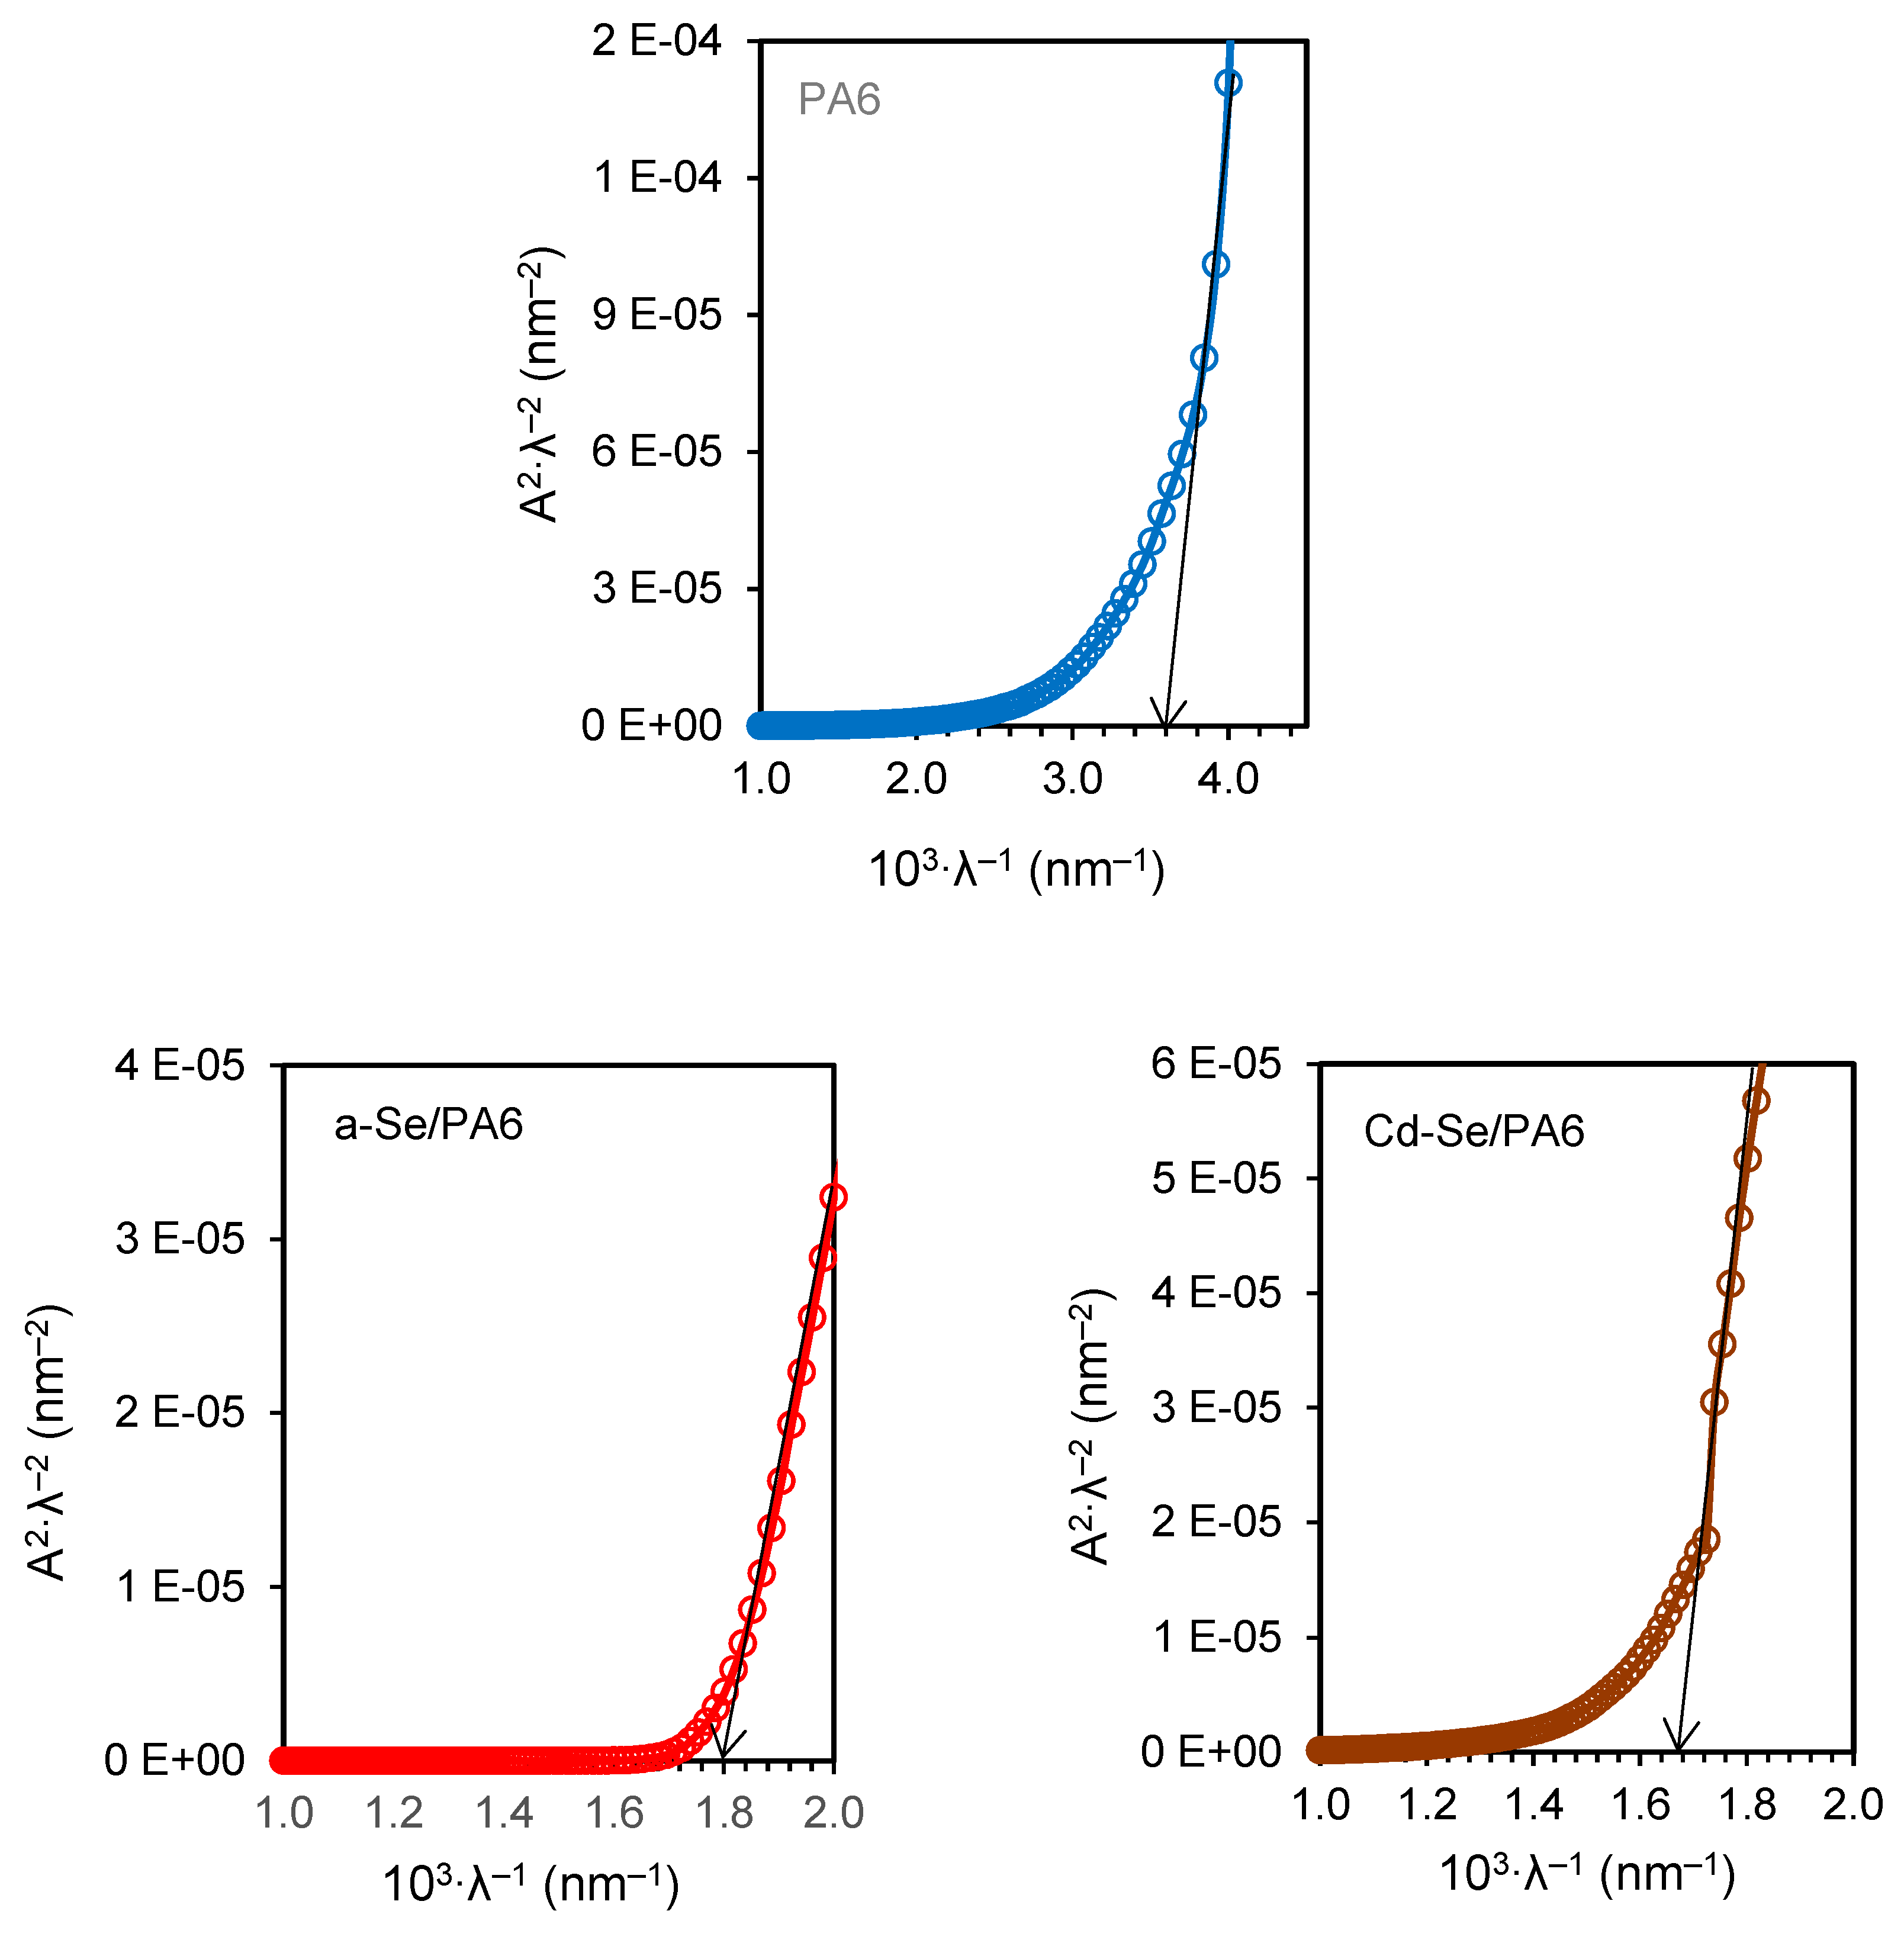
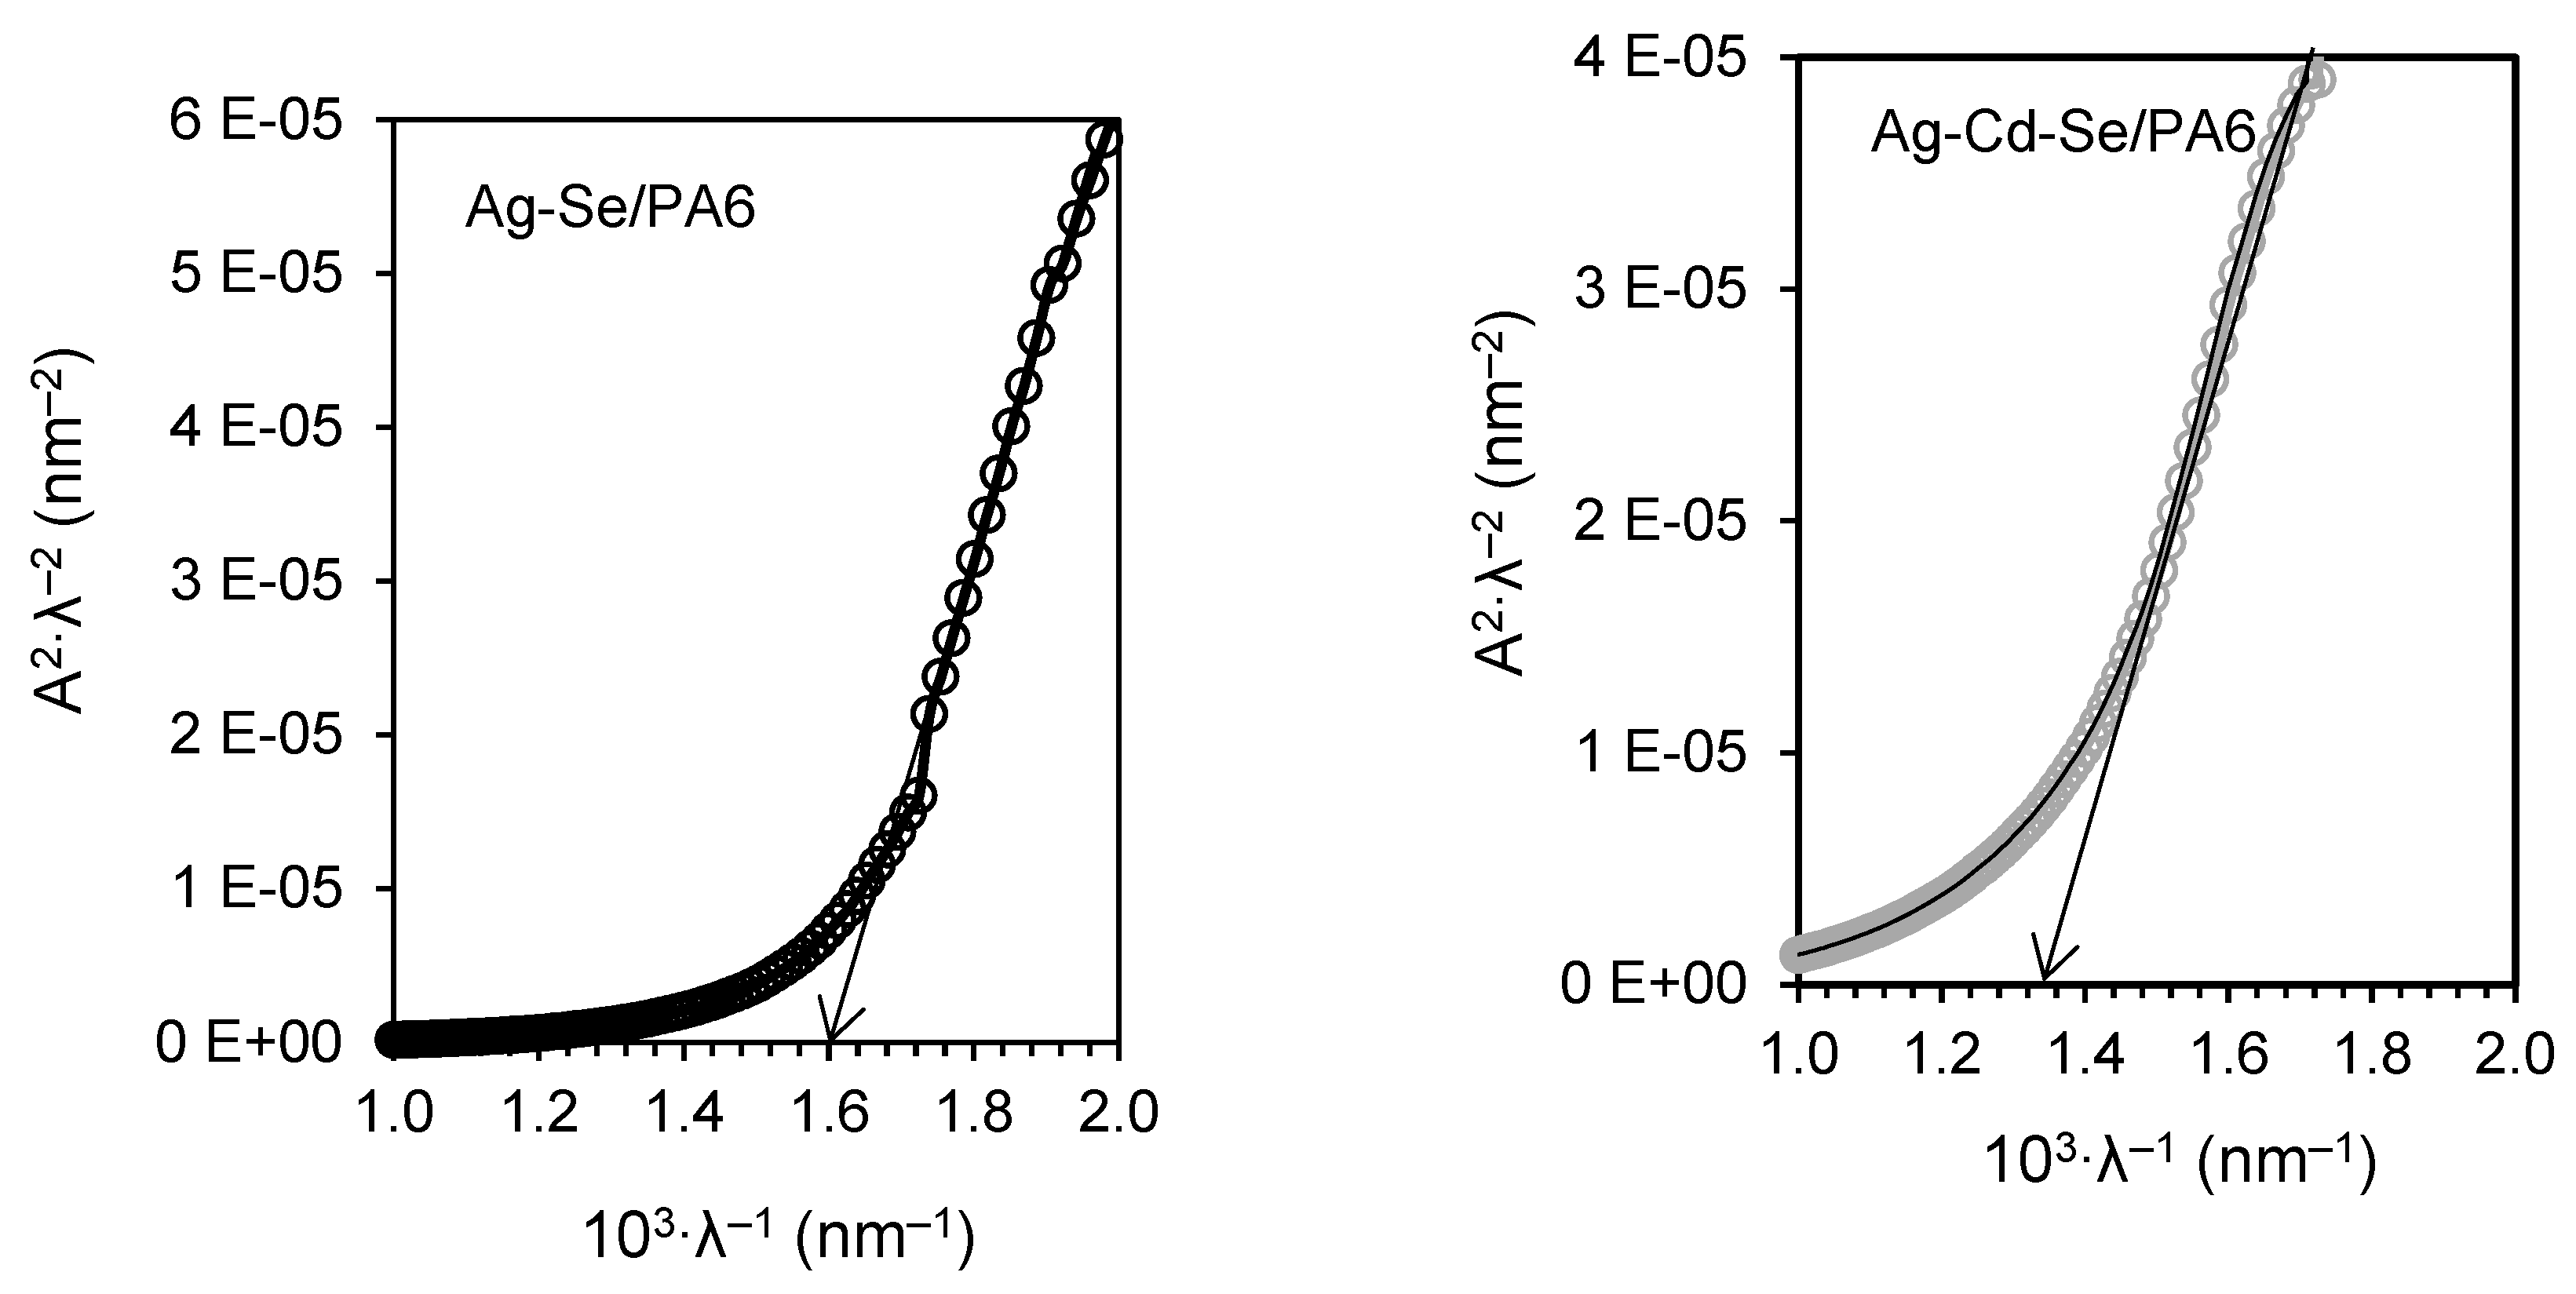
The experimental UV-Vis spectra better correspond to the rectilinear section on the graphs 𝐴2·𝜆–2 = 𝑓(𝜆–1) (Figure 8), which confirms the direct transitions of the obtained nanocomposites.
All the calculated optical parameters are given in Table 4 for comparison.
The decrease in Eg of each subsequent nanocomposite compared to PA 6 is due to a change in the they optical properties. Eg of nanocomposites can be affected many factors, such as composition, particle size and distribution, shape, agglomeration/aggregation state, solubility, surface morphology/topography, structure crystallinity, and many different structural defects or deformations [80,81]. The wavelength at which the signal gets saturated is interpreted as being the value of the absorption edge or the Eg of the semiconductor. For a-Se/PA6 composite Eg is 2.23± 0.02 eV. Eg measured for bulk a-Se is 1.99 ± 0.02 eV [82]. Introduction of Cd2+ ions proseed at 80 oC, and at heat treatment amorphous Se crystallizes. Eg measured for cr-Se is 1.85 ± 0.02 eV [82]. An increase in the crystallinity of the obtained composites (Figure 4) and the carrier concentration is accompanied by a decrease in Eg from 2.05±0.02 eV for the Cd-Se/PA 6 composite to 1.64±0.02 eV for the Ag-Cd-Se/PA 6 composite (Table 4). The obtained values are in good agreement with the literature data: CdSe and Ag2Se have a band gap of 1.9 eV [20] and 1.8 eV [21], respectively.
One of the sources of unfavorable recombination is the subband absorption tail, which is characterized by the Urbach energy. Absorption tails are defined as densities of states that extend from the bands into the band gap of the photoactive layer. Tail states inside the band gap act as traps and recombination centers and trap a charge carrier. The EU is influenced by thermal and structural disturbances in semiconductor materials [83,84,85]. In this work, we analyze structure-dependent EU. The Urbach energy plots were constructed and shown in Figure 9, and the calculated values are given in Table 4. EU reflects the density of states in the band tails and, hence, the local microstructural disorder [86]. As can be seen from the values presented in Table 4, the EU of PA 6 is 1.31 eV, which is higher as compared with obtained nanocomposites. The relatively high value of EU indicates a greater propensity for the transformation of weak structural bonds into defects [87]. The a-Se/PA 6 nanocomposite (amorphous phase) is more structurally disordered. With the stepwise incorporation of Cd2+ and Ag+ ions, EU decreases. This may be due to an increase in the structural ordering of nanocomposites, which is confirmed by an increase in crystallinity detected by XRD analysis. In addition, it was previously reported [88] that thicker selenide films have less structural randomness, since with an increase in the thickness and density of the layers, structural defects are minimized, which minimizes the EU. The formation of compact these films was confirmed by AFM analysis.
The σ characterizes the broadening of the optical absorption edge arising from the electron-phonon interactions [40,89]. The steepness parameter of PA 6 is lower than that of the obtained nanocomposites at the same temperature (Table 4). The lower differences in electronegativity decrease the orbital overlap, and decrease the band gap.

4. Conclusions

To sum up, the amorphous Se films conjugated with PA 6 were successfully obtained by exposing the PA 6 membrane to an acidified aqueous solution of H2SeO3 and Na2SO3. The surface morphology of the a-Se/PA6 consists of granular amorphous Se nanoparticles. This texture ensures optimal deposition of the next phase. The use of prepared a-Se/PA 6 composites opens the way for the stepwise incorporation of Cd2+ and Ag+ ions by a chemical methods. The positions of the diffraction peaks in the Cd-Se/PA 6 composite were mainly indexed as hexagonal CdSe and monoclinic Se8. XRD clearly shows that the Cd-Se/PA 6 and Ag-Se/PA 6 films are polycrystalline and exhibit a phase transformation from a-Se to a Se8 monoclinic structure. The XRD pattern of the Ag-Cd-Se/PA 6 composite obtained by the CE method showed a complex crystalline composition of the film with peaks of monoclinic Se8, hexagonal CdSe, orthorhombic Ag2Se and metallic Ag. The obtained composites have an inhomogeneous surface morphology in the form of nanosized particles. ATR-FTIR spectroscopy revealed the interaction between PA 6 and inorganic components, which causes obvious conformational changes in PA 6 chains. The resulting composites differ in color, which affects and their optical properties. The optical spectra show that the nanostructured films have a high absorption coefficient in the visible region. The studied composites are direct band gap semiconductors, which exhibit a redshift of the band gap from 2.23 eV for the a-Se/PA 6 to 1.64 eV for the Ag-Cd-Se/PA 6 composite due to a change in chemical composition and can be promising in science for implantable microdevices, as well as for solar electronics. EU and σ studies describe the broadening of solar absorption edges around optical band gaps, which correlates with the polycrystalline composition and heterogeneous surface morphology.

Author Contributions

Conceptualization, V.K.; methodology, V.K.; software, V.K.; validation, E.S.. and V.K.; formal analysis, E.S.; investigation, E.S.; resources, V.K.; data curation, V.K.; writing—original draft preparation, E.S.; writing—review and editing, V.K.; visualization, E.S.; supervision, V.K.; funding acquisition, V.K. All authors have read and agreed to the published version of the manuscript.

Funding

This research was funded by the Doctoral Fund of Kaunas University of Technology No. A-410, approved 26th of June, 2019.

Data Availability Statement

Data is contained within the article.

Conflicts of Interest

The authors declare no conflict of interest.

References

  1. Park, Y.; Advincula, R.C. Hybrid semiconductor nanoparticles: π-conjugated ligands and nanostructured films. Chem. Mater. 2011, 23, 4273–4294. [Google Scholar] [CrossRef]
  2. Liu, R. Hybrid organic/inorganic nanocomposites for photovoltaic cells. Materials 2014, 7, 2747–2771. [Google Scholar] [CrossRef] [PubMed]
  3. Soler-Illia, G.J.; Azzaroni, O. Multifunctional hybrids by combining ordered mesoporous materials and macromolecular building blocks. Chem. Soc. Rev. 2011, 40, 1107–1150. [Google Scholar] [CrossRef]
  4. Willner, I.; Willner, B. Functional nanoparticle architectures for sensoric, optoelectronic, and bioelectronic applications. Pure Appl. Chem. 2002, 74, 1773–1783. [Google Scholar] [CrossRef]
  5. Di Luccio, T.; Piscopiello, E.; Laera, A.M.; Antisari, M.V. Structural studies of thin films of semiconducting nanoparticles in polymer matrices. Mater. Sci. Eng. C 2007, 27, 1372–1376. [Google Scholar] [CrossRef]
  6. Gates, B.; Mayers, B.; Cattle, B.; Xia, Y. Synthesis and characterization of uniform nanowires of trigonal selenium. Adv. Funct. Mater. 2002, 12(3), 219–227. [Google Scholar] [CrossRef]
  7. Jiang, F.; Cai, W.; Tan, G. Facile Synthesis and optical properties of small selenium nanocrystals and nanorods, Nanoscale Res. Lett. 2017, 12, 401. [Google Scholar] [CrossRef]
  8. Guha, S.; Munekata, H.; LeGoues, F.K.; Chang, L.L. Growth mode and dislocation distribution in the ZnSe/GaAs (100) system. Appl. Phys. Lett. 1992, 60, 3220. [Google Scholar] [CrossRef]
  9. Bhatnagar, A.K.; Venugopal Reddy, K.; Srivastava, V. Optical energy gap of amorphous selenium: effect of annealing. J. Phys. D: Appl. Phys. 1985, 18, 149–l53. Available online: http://iopscience.iop.org/0022-3727/18/9/001.
  10. Thayer, J.S. A Review of: Selenium. In Synthesis and Reactivity in Inorganic and Metal-Organic Chemistry, Zingaro, R.A., Cooper, W.C. Eds.; Van Nostrand Reinhold, New York, 1974, xvii, 5(2) 159–160. [CrossRef]
  11. Afzaal, M.; O’Brien, P. Recent developments in II–VI and III–VI semiconductors and their applications in solar cells. J. Mater. Chem. 2006, 16, 1597–1602. [Google Scholar] [CrossRef]
  12. Gao, Q.; Wang, W.; Lu, Y.; Cai, K.; Li, Y.; Wang, Z.; Wu, M.; Huang, C.; He, J. High power factor Ag/Ag2Se composite films for flexible thermoelectric generators. ACS Appl. Mater. Interface 2021, 13(12), 14327–14333. [Google Scholar] [CrossRef]
  13. Wu, M.; Cai, K.; Li, X.; Li, Y.; Liu, Y.; Lu, Y.; Wang, Z.; Zhao, W.; Wei, P. Ultraflexible and high-thermoelectric-performance sulfur-doped Ag2Se film on nylon for power generators. ACS Appl. Mater. Interfaces 2022, 14(3), 4307–4315. [Google Scholar] [CrossRef]
  14. Roy, S.; Tuinenga, C.; Fungura, F.; Dagtepe, P.; Chikan, V.; Jasinski, J. Progress toward producing n-type CdSe quantum dots: tin and indium doped CdSe quantum dots. J. Phys. Chem. C, 2009, 113(30), 130008–13015. [CrossRef]
  15. Liu, J.; Zhao, Q.; Liu, J.L.; Wu, Y.S.; Cheng, Y.; Ji, M.W.; Qian, M.H.; Hao, W.C.; Zhang, L.J.; Wei, X.J.; Wang, S.G.; Zhang, J.T.; Du, Y.; Dou, S.X.; Zhu, H.S. Heterovalent-doping-enabled efficient dopant luminescence and controllable electronic impurity via a new strategy of preparing II−VI nanocrystals. Adv. Mater. 2015, 27, 2753–2761. [Google Scholar] [CrossRef] [PubMed]
  16. Wang, F.D.; Dong, A.G.; Buhro, W.E. Solution–liquid–solid synthesis, properties, and applications of one-dimensional colloidal semiconductor nanorods and nanowires. Chem. Rev., 2016, 116(18), 10888–10933. [CrossRef]
  17. Coughlan, C.; Ibanez, M.; Dobrozhan, O.; Singh, A.; Cabot, A.; Ryan, K.M. Compound copper chalcogenide nanocrystals. Chem. Rev. 2017, 117, 5865–6109. [Google Scholar] [CrossRef] [PubMed]
  18. Liu, J.; Zhang, J. Nanointerface chemistry: lattice-mismatch-directed synthesis and application of hybrid nanocrystals. Chem. Rev. 2020, 120, 2123–2170. [Google Scholar] [CrossRef]
  19. Agranovich, V.M.; Gartstein, Y.N.; Litinskaya, M. Hybrid resonant organic–inorganic nanostructures for optoelectronic applications. Chem. Rev. 2011, 111, 5179–5214. [Google Scholar] [CrossRef]
  20. Mehta, C.; Abbas, J.M.; Saini, G.S.S.; Tripathi, S.K. Effect of deposition parameters on the optical and electrical properties of nanocrystalline CdSe. Chalcogenide Letters 2007, 4(11), 133–138. [Google Scholar]
  21. Pejova, B.; Najdoski, M.; Grozdanov, I.; Dey, S.K. Chemical bath deposition of nanocrystalline (111) textured Ag2Se thin films. Mater. Lett. 2000, 43, 269–273. [Google Scholar] [CrossRef]
  22. Gates, B.; Yin, Y.; Xia, Y. A Solution-phase approach to the synthesis of uniform nanowires of crystalline selenium with lateral dimensions in the range of 10-30 nm. J. Am. Chem. Soc. 2000, 122, 12582–12583. [Google Scholar] [CrossRef]
  23. Murty, A.S.R. Thiourea in analysis. I. Estimation of selenium and tellurium. Indian J. Chem. 1965, 3(7), 298–299. [Google Scholar]
  24. Li, Z.; Huang, D.; McDonald, L.M. Heterogeneous selenite reduction by zero valent iron steel wool. Water Sci. Technol. 2017, 75(4), 908–915. [Google Scholar] [CrossRef]
  25. Liang, L.; Yang, W.; Guan, X.; Li, J.; Xu, Z.; Wu, J.; Huang, Y.; Zhang, X. Kinetics and mechanisms of pH-dependent selenite removal by zero valent iron. Water Res. 2013, 47, 5846–5855. [Google Scholar] [CrossRef]
  26. Liang, L.P.; Jiang, X.; Yang, W.J.; Huang, Y.Y.; Guan, X.H.; Li, L.N. Kinetics of selenite reduction by zero-valent iron. Desalin. Water Treat. 2015, 53, 2540–2548. [Google Scholar] [CrossRef]
  27. Jain, R.; Jordan, N.; Schild, D.; van Hullebusch, E.D.; Weiss, S.; Franzen, C.; Farges, F.; Hübner, R.; Lens, P.N.L. Adsorption of zinc by biogenic elemental selenium nanoparticles. Chem. Eng. J. 2015, 260, 855–863. [Google Scholar] [CrossRef]
  28. Misra, G.J.; Tandon, J.P. Gravimetric determination of selenium using copper chloride as reducing agent. Indian J. Chem. 1967, 5(11), 560–562. [Google Scholar]
  29. Kalaparthi, R.; Korapu, S.; Gandam, H.; Kurimella, V.R. Synthesis of selenium nanoparticles using sodium selenite [Se(IV)] as a precursor and titanium(III) chloride as a reducing agent. Int. J. Eng. Res. 2020, 9(4), 359–363. [Google Scholar] [CrossRef]
  30. Geoffroy, N.; Demopoulos, G.P. Stannous chloride—an effective reducing agent for the removal of selenium(IV) from acidic solution. J. Chem. Technol. Biotechnol. 2012, 87, 983–989. [Google Scholar] [CrossRef]
  31. Geoffroy, N.; Demopoulos, G.P. Reductive precipitation of elemental selenium from selenious acidic solutions using sodium dithionite. Ind. Eng. Chem. Res. 2009, 48, 10240–10246. [Google Scholar] [CrossRef]
  32. Vieira, A.P.; Stein, E.M.; Andreguetti, D.X.; Cebrián-Torrejón, G.; Doménech-Carbó, A.; Colepicolod, P.; Ferreira, A.M.D.C. “Sweet Chemistry”: a green way for obtaining selenium nanoparticles active against cancer cells. J. Braz. Chem. Soc. 2017, 28(10), 2021–2027. [Google Scholar] [CrossRef]
  33. Vahdati, M.; Moghadam, T.T. Synthesis and characterization of selenium nanoparticles lysozyme nanohybrid system with synergistic antibacterial properties. Sci. Rep. 2020, 10(1), 510. [Google Scholar] [CrossRef] [PubMed]
  34. Hoffmann, J.E. Recovering selenium and tellurium from copper refinery slimes. JOM 1989, 41(7), 33–37. [Google Scholar] [CrossRef]
  35. Kunita, M.H.; Girotto, E.M.; Radovanovic, E.; Gonçalves, M.C.; Ferreira, O.P.; Muniz, E.C.; Rubira, A.F. Deposition of copper sulfide on modified low-density polyethylene surface: morphology and electrical characterization. Appl. Surf. Sci. 2002, 202(3–4), 223–231. [CrossRef]
  36. Essaidia, H.; Gantassi, A.; Touihria, S.; Ouerfelli, J. Tuning the structural, optical and electrical properties of AgInSe2 thin films prepared by sequentially deposited silver and indium nano-films under vacuum. Optik 2019, 182, 866–875. [Google Scholar] [CrossRef]
  37. Nguyen, H.Q. Synthesis and optical properties of CdSe nanocrystals and CdSe/ZnS core/shell nanostructures in non-coordinating solvents. Adv. Nat. Sci: Nanosci. Nanotechnol. 2010, 1, 25004. [Google Scholar] [CrossRef]
  38. Souri, D.; Tahan, Z.E. A new method for the determination of optical band gap and the nature of optical transitions in semiconductors. Appl. Phys. B: Lasers Opt. 2015, 119, 273–279. [Google Scholar] [CrossRef]
  39. Souri, D.; Shomalian, K. Band gap determination by absorption spectrum fitting method (ASF) and structural properties of different compositions of (60−x) V2O5–40TeO2–xSb2O3 glasses. J. Non Cryst. Solids 2009, 355, 1597–1601. [Google Scholar] [CrossRef]
  40. Solaymani, S.; Talu, S.; Nezafat, N.B.; Dejam, L.; Shafiekhani, A.; Ghaderi, A.; Zelati, A. Optical properties and surface dynamics analyses of homojunction and hetrojunction Q/ITO/ZnO/NZO and Q/ITO/ZnO/NiO thin films. Results Phys. 2021, 29, 104679. [Google Scholar] [CrossRef]
  41. Xu, S.; Ye, L. Synthesis and properties of monomer cast nylon-6-b-polyether amine copolymers with different structures, R. Soc. Chem. Adv. 2015, 5, 32460–32468. [Google Scholar] [CrossRef]
  42. 6—Selenium, Tellurium and Polonium, In Chemistry of the Elements, 2nd ed.; Greenwood, N.N.; Earnshaw, A. Eds.; Elsevier Ltd., Butterworth-Heinemann, 1997; Volume 16, pp. 747–788. [CrossRef]
  43. Mahieu, S.; Ghekiere, P.; Depla, D.; de Gryse, R. Biaxial alignment in sputter deposited thin films. Thin Solid Films 2006, 515(4), 1229–1249. [Google Scholar] [CrossRef]
  44. Park, S.H.; Choi, J.Y.; Lee, Y.H.; Park, J.T.; Song, H. Formation of metal selenide and metal-selenium nanoparticles using distinct reactivity between selenium and noble metals. Chem Asian J. 2015, 10(7), 1452–6. [Google Scholar] [CrossRef]
  45. Yanhui, Z.; Xu, M.; Liu, Y.; Bai, Y.; Deng, Y.; Liu, J.; Chen, L. Green synthesis of Se/Ru alloy nanoparticles using gallic acid and evaluation of their anti-invasive effects in HeLa cells. Colloids Surf. B 2016, 44, 118–124. [Google Scholar] [CrossRef]
  46. Olin, Å.; Noläng, B.; Osadchii, E.G.; Öhman, L.-O.; Rosén, E. Chemical Thermodynamics of Selenium, 1st ed.; Elsevier Science, 2005. 894 p. Available online: https://www.oecd-nea.org/dbtdb/pubs/vol7-selenium.pdf.
  47. Ozin, G.A.; Arsenault, A.C.; Cademartiri, L. Nanochemistry: A Chemical Approach to Nanomaterials, 2nd ed.RSC Publishing: Cambridge, UK, 2009; pp. 335–361. [Google Scholar]
  48. Mayers, B.T.; Liu, K.; Sunderland, D.; Xia, Y. Sonochemical synthesis of trigonal selenium nanowires. Chem. Mater. 2003, 15, 3852–3858. [Google Scholar] [CrossRef]
  49. Jiang, X.; Mayers, B.; Herricks, T.; Xia, Y. Direct synthesis of Se@CdSe nanocables and CdSe nanotubes by reacting cadmium salts with Se nanowires. Adv. Mater. 2003, 15(20), 1740–1743. [Google Scholar] [CrossRef]
  50. Gates, B.; Mayers, B.; Wu, Y.; Sun, Y.; Cattle, B.; Yang, P.; Xia, Y. Synthesis and characterization of crystalline Ag2Se nanowires through a template-engaged reaction at room temperature. Adv. Funct. Mater. 2002, 12, 679–686. [Google Scholar] [CrossRef]
  51. Ayele, D.W. A facile one-pot synthesis and characterization of Ag2Se nanoparticles at low temperature. Egypt. J. Basic Appl. Sci. 2016, 3, 149–154. [Google Scholar] [CrossRef]
  52. Kienle, L.; Duppel, V.; Mogwitz, B.; Janek, J.; Kreutzbruck, M.V.; Leineweber, A.; Simon, A. Synthesis–real structure–property: the showcase of silver-rich Ag2Se. Cryst. Growth Des. 2011, 11, 2412–2421. [Google Scholar] [CrossRef]
  53. Feng, S.; Xu, R. New materials in hydrothermal synthesis. Acc. Chem. Res. 2001, 34(3), 239–247. [Google Scholar] [CrossRef]
  54. Porter, D.A.; Easterling, K.E. Phase transformations in metals and alloys, 2nd. ed.; Chapman and Hall, 1992.
  55. Maskaeva, L.N.; Smirnova, Z.I.; Markov, V.F. Assessment of the ability of metal chalcogenides to enter into ion-exchange reactions in aqueous solutions. Russ. Chem. Bull. 2014, 63(7), 1515–1522. [Google Scholar] [CrossRef]
  56. Luo, Y.R. Comprehensive handbook of chemical bond energies, 1st ed.; CRC press, Boca Raton, 2007.
  57. Beberwyck, B.J.; Surendranath, Y.; Alivisatos, A.P. Cation exchange: a versatile tool for nanomaterials synthesis. J. Phys. Chem. C 2013, 117(39), 19759–19770. [Google Scholar] [CrossRef]
  58. Yokota, I. On the deviation from the Einstein relation observed for diffusion of Ag+ ions in α-Ag2S and others. J. Phys. Soc. Jpn. 1966, 21(3), 420–423. [Google Scholar] [CrossRef]
  59. Stehlik, S.; Shimakawa, K.; Wagner, T.; Frumar, M. Diffusion of Ag ions under random potential barriers in silver-containing chalcogenide glasses. J. Phys. D: Appl. Phys. 2012, 45(20), 205304. [CrossRef]
  60. Wu, Q.; Liu, X.; Berglund, L.A. FT-IR spectroscopic study of hydrogen bonding in PA6/clay nanocomposites. Polymer 2002, 43(8), 2445–2449. [Google Scholar] [CrossRef]
  61. Krylova, V.; Dukštienė, N. The structure of PA-Se-S-Cd composite materials probed with FTIR spectroscopy. Appl. Surf. Sci. 2019, 470, 462–471. [Google Scholar] [CrossRef]
  62. Sun, H.; Zhu, X.; Yang, D.; Wangyang, P.; Gao, X.; Tian, H. An economical method for amorphous selenium thick films preparation: e-beam evaporation. Mater. Lett. 2016, 183, 94–96. [Google Scholar] [CrossRef]
  63. Tüzüner, S.; Demir, M.M. Dispersion of organophilic Ag nanoparticles in PS-PMMA blends. Mater. Chem. Phys. 2015, 162, 692–699. [Google Scholar] [CrossRef]
  64. Ji, Y.; Yang, X.; Ji, Z.; Zhu, L.; Ma, N.; Chen, D.; Jia, X.; Tang, J.; Cao, Y. DFT-calculated IR spectrum amide I, II, and III band contributions of N-methylacetamide fine components. ACS Omega 2020, 5(15), 8572–8578. [Google Scholar] [CrossRef] [PubMed]
  65. Kotkata, M.F.; Masoud, A.E.; Mohamed, M.B.; Mahmoud, E.A. Structural characterization of chemically synthesized CdSe nanoparticles. Phys. E: Low-Dimens. 2009, 41, 640–645.
  66. Sun, Z.B.; Dong, X.Z.; Chen, W.Q.; Shoji, S.; Duan, X.M.; Kawata, S. Two and three dimensional micro/nanostructure pattering of CdS-polymer nanocomposites with a laser interference technique and in situ synthesis. Nanotechnology 2008, 19, 035611–035619. [Google Scholar] [CrossRef] [PubMed]
  67. Helios, K.; Pietraszko, A.; Zierkiewicz, W. Wojtowicz, H.; Michalska, D. The crystal structure, infrared, Raman and density functional studies of bis(2-aminophenyl) diselenide. Polyhedron 2011, 30, 2466–2472. [Google Scholar] [CrossRef]
  68. Sadtler, B.; Demchenko, D.O.; Zheng, H.; Hughes, S.M; . Merkle, M.G.; Dahmen, U.; Wang, L.-W.; Alivisatos, A.P. Selective Facet Reactivity during Cation Exchange in Cadmium Sulfide Nanorods. J. Am. Chem. Soc. 2009, 131, 5285–5293. [Google Scholar] [CrossRef]
  69. Li, Y.C.; Zhong, H.Z.; Li, R.; Zhou, Y.; Yang, C.H.; Li, Y.F. High-yield fabrication and electrochemical characterization of tetrapodal CdSe, CdTe, and CdSexTe1–x nanocrystals. Adv. Funct. Mater. 2006, 16, 1705–1716. [Google Scholar] [CrossRef]
  70. Ingole, A.R.; Thakare, S.R.; Khati, N.T.; Wankhade, A.V.; Burghate, D.K. Green synthesis of selenium nanoparticles under ambient condition. Chalcogenide Lett. 2010, 7(7), 485–489. [Google Scholar]
  71. Surana, K.; Salisu, I.T.; Mehra, R.M.; Bhattacharya, B. A simple synthesis route of low temperature CdSe-CdS core-shell quantum dots and its application in solar cell. Opt. Mater. 2018, 82, 135–140. [Google Scholar] [CrossRef]
  72. Hegazy, M.A.; Abd El-Hameed, A.M. Characterization of CdSe-nanocrystals used in semiconductors for aerospace applications: Production and optical properties, NRIAG. J. Astron. Geophys. 2014, 3(1), 82–87. [Google Scholar] [CrossRef]
  73. Pejova, B.; Najdoski, M.; Grozdanov, I.; Dey, S.K. Chemical bath deposition of nanocrystalline (111) textured Ag2Se thin films. Mater. Lett. 2000, 43, 269–273. [Google Scholar] [CrossRef]
  74. Ramezanloo, B.; Molaei, M.; Karimipour, M. Red emissive Ag2Se quantum dots (QDs) with room-temperature synthesis of both orthorhombic and superionic cubic phases via stirring approach. J. Lumin. 2018, 204, 419–423. [Google Scholar] [CrossRef]
  75. Singh, S.; Bharti, A.; Meena, V.K. Green synthesis of multi-shaped silver nanoparticles: optical, morphological and antibacterial properties. J. Mater. Sci.: Mater. Electron. 2015, 26, 3638–3648. [Google Scholar] [CrossRef]
  76. Xu, X.; Wang, X.; Zhang, Y.; Li, P. Ion-exchange synthesis and improved photovoltaic performance of CdS/Ag2S heterostructures for inorganic-organic hybrid solar cells. Solid State Sci. 2016, 61, 195–200. [Google Scholar] [CrossRef]
  77. Di, T.; Cheng, B.; Ho, W.; Yu, J.; Tang, H. Hierarchically CdS–Ag2S nanocomposites for efficient photocatalytic H2 production. Appl. Surf. Sci. 2019, 470, 196–204. [Google Scholar] [CrossRef]
  78. Bubenov, S.S.; Dorofeev, S.G.; Kotin, P.A.; Znamenkov, K.O.; Kuznetsova, T.A. Oleic capped CdSe nanocrystals silver doped in the course of synthesis. Mendeleev Commun. 2014, 24(4), 250–252. [Google Scholar] [CrossRef]
  79. Asadpour-Zeynali, K.; Mollarasouli, F. A novel and facile synthesis of TGA-capped CdSe@Ag2Se core-shell quantum dots as a new substrate for high sensitive and selective methyldopa sensor. Sens. Actuator B Chem. 2016, 237, 387–399. [Google Scholar] [CrossRef]
  80. Ansari, M.Z.; Khare, N. Effect of intrinsic strain on the optical band gap of single phase nanostructured Cu2ZnSnS4. Mater. Sci. Semicond. Process, 2017, 63, 220–226. [Google Scholar] [CrossRef]
  81. Purushotham, E.; Krishna, N.G. Effect of particle size and lattice strain on Debye-Waller factors of Fe3C nanoparticles. Bull. Mater. Sci. 2014, 37, 773–778. [Google Scholar] [CrossRef]
  82. Bhatnagar, A.K.; Venugopal Reddy, K.; Srivastava, V. Optical energy gap of amorphous selenium: effect of annealing. J. Phys. D: Appl. Phys. 1985, 18, 149–153. [Google Scholar] [CrossRef]
  83. Cody, G.D.; Tiedje, T.; Abeles, B.; Moustakas, T.D.; Brooks, B.; Goldstein, Y. Disorder and the optical-absorption edge of hydrogenated amorphous silicon. J. Phys. Colloques 1981, 42, C4–301. [Google Scholar] [CrossRef]
  84. Kaiser, O.J. Sandberg, N. Zarrabi et al. A universal Urbach rule for disordered organic semiconductors. Nat. Commun. 2021, 12, 3988. [Google Scholar] [CrossRef] [PubMed]
  85. Zhang, C.J.; Mahadevan, S.; Yuan, J.; Ho, J.K.W.; Gao, Y.X.; Liu, W.; Zhong, H.; Yan, H.; Zou, Y.P.; Tsang, S.W.; So, S.K. Unraveling Urbach tail effects in high performance organic. photovoltaics: dynamic vs static disorder, ACS Energy Lett. 2022, 7, 1971–1979. [Google Scholar]
  86. Ambrosone, G.; Basa, D.K.; Coscia, U.; Fathallah, M. Study on the microstructural and overall disorder in hydrogenated amorphous silicon carbon films. J. Appl. Phys. 2008, 104, 123520. [Google Scholar] [CrossRef]
  87. Rani, S.; Sanghi, S.; Agarwal, A.; Seth, V.P. Study of optical band gap and FTIR spectroscopy of Li2O.Bi2O3.P2O5 glasses. Spectrochim. Acta A 2009, 74(3), 673–677. [Google Scholar] [CrossRef]
  88. Ananth Kumar, R.T.; Chithra Lekha, P.; Sanjeeviraja, C.; Pathinettam Padiyan, D. Evolution of structural disorder using Raman spectra and Urbach energy in GeSe0.5S1.5 thin films. J. Non-Cryst. 2014, 405, 21–26. [Google Scholar] [CrossRef]
  89. Kabir, H.; Rahman, M.M.; Uddin, K.M.; Bhuiyand, A.H. Structural, morphological, compositional and optical studies of plasma polymerized 2-furaldehyde amorphous thin films. Appl. Surf. Sci. 2017, 423, 983–994. [Google Scholar] [CrossRef]
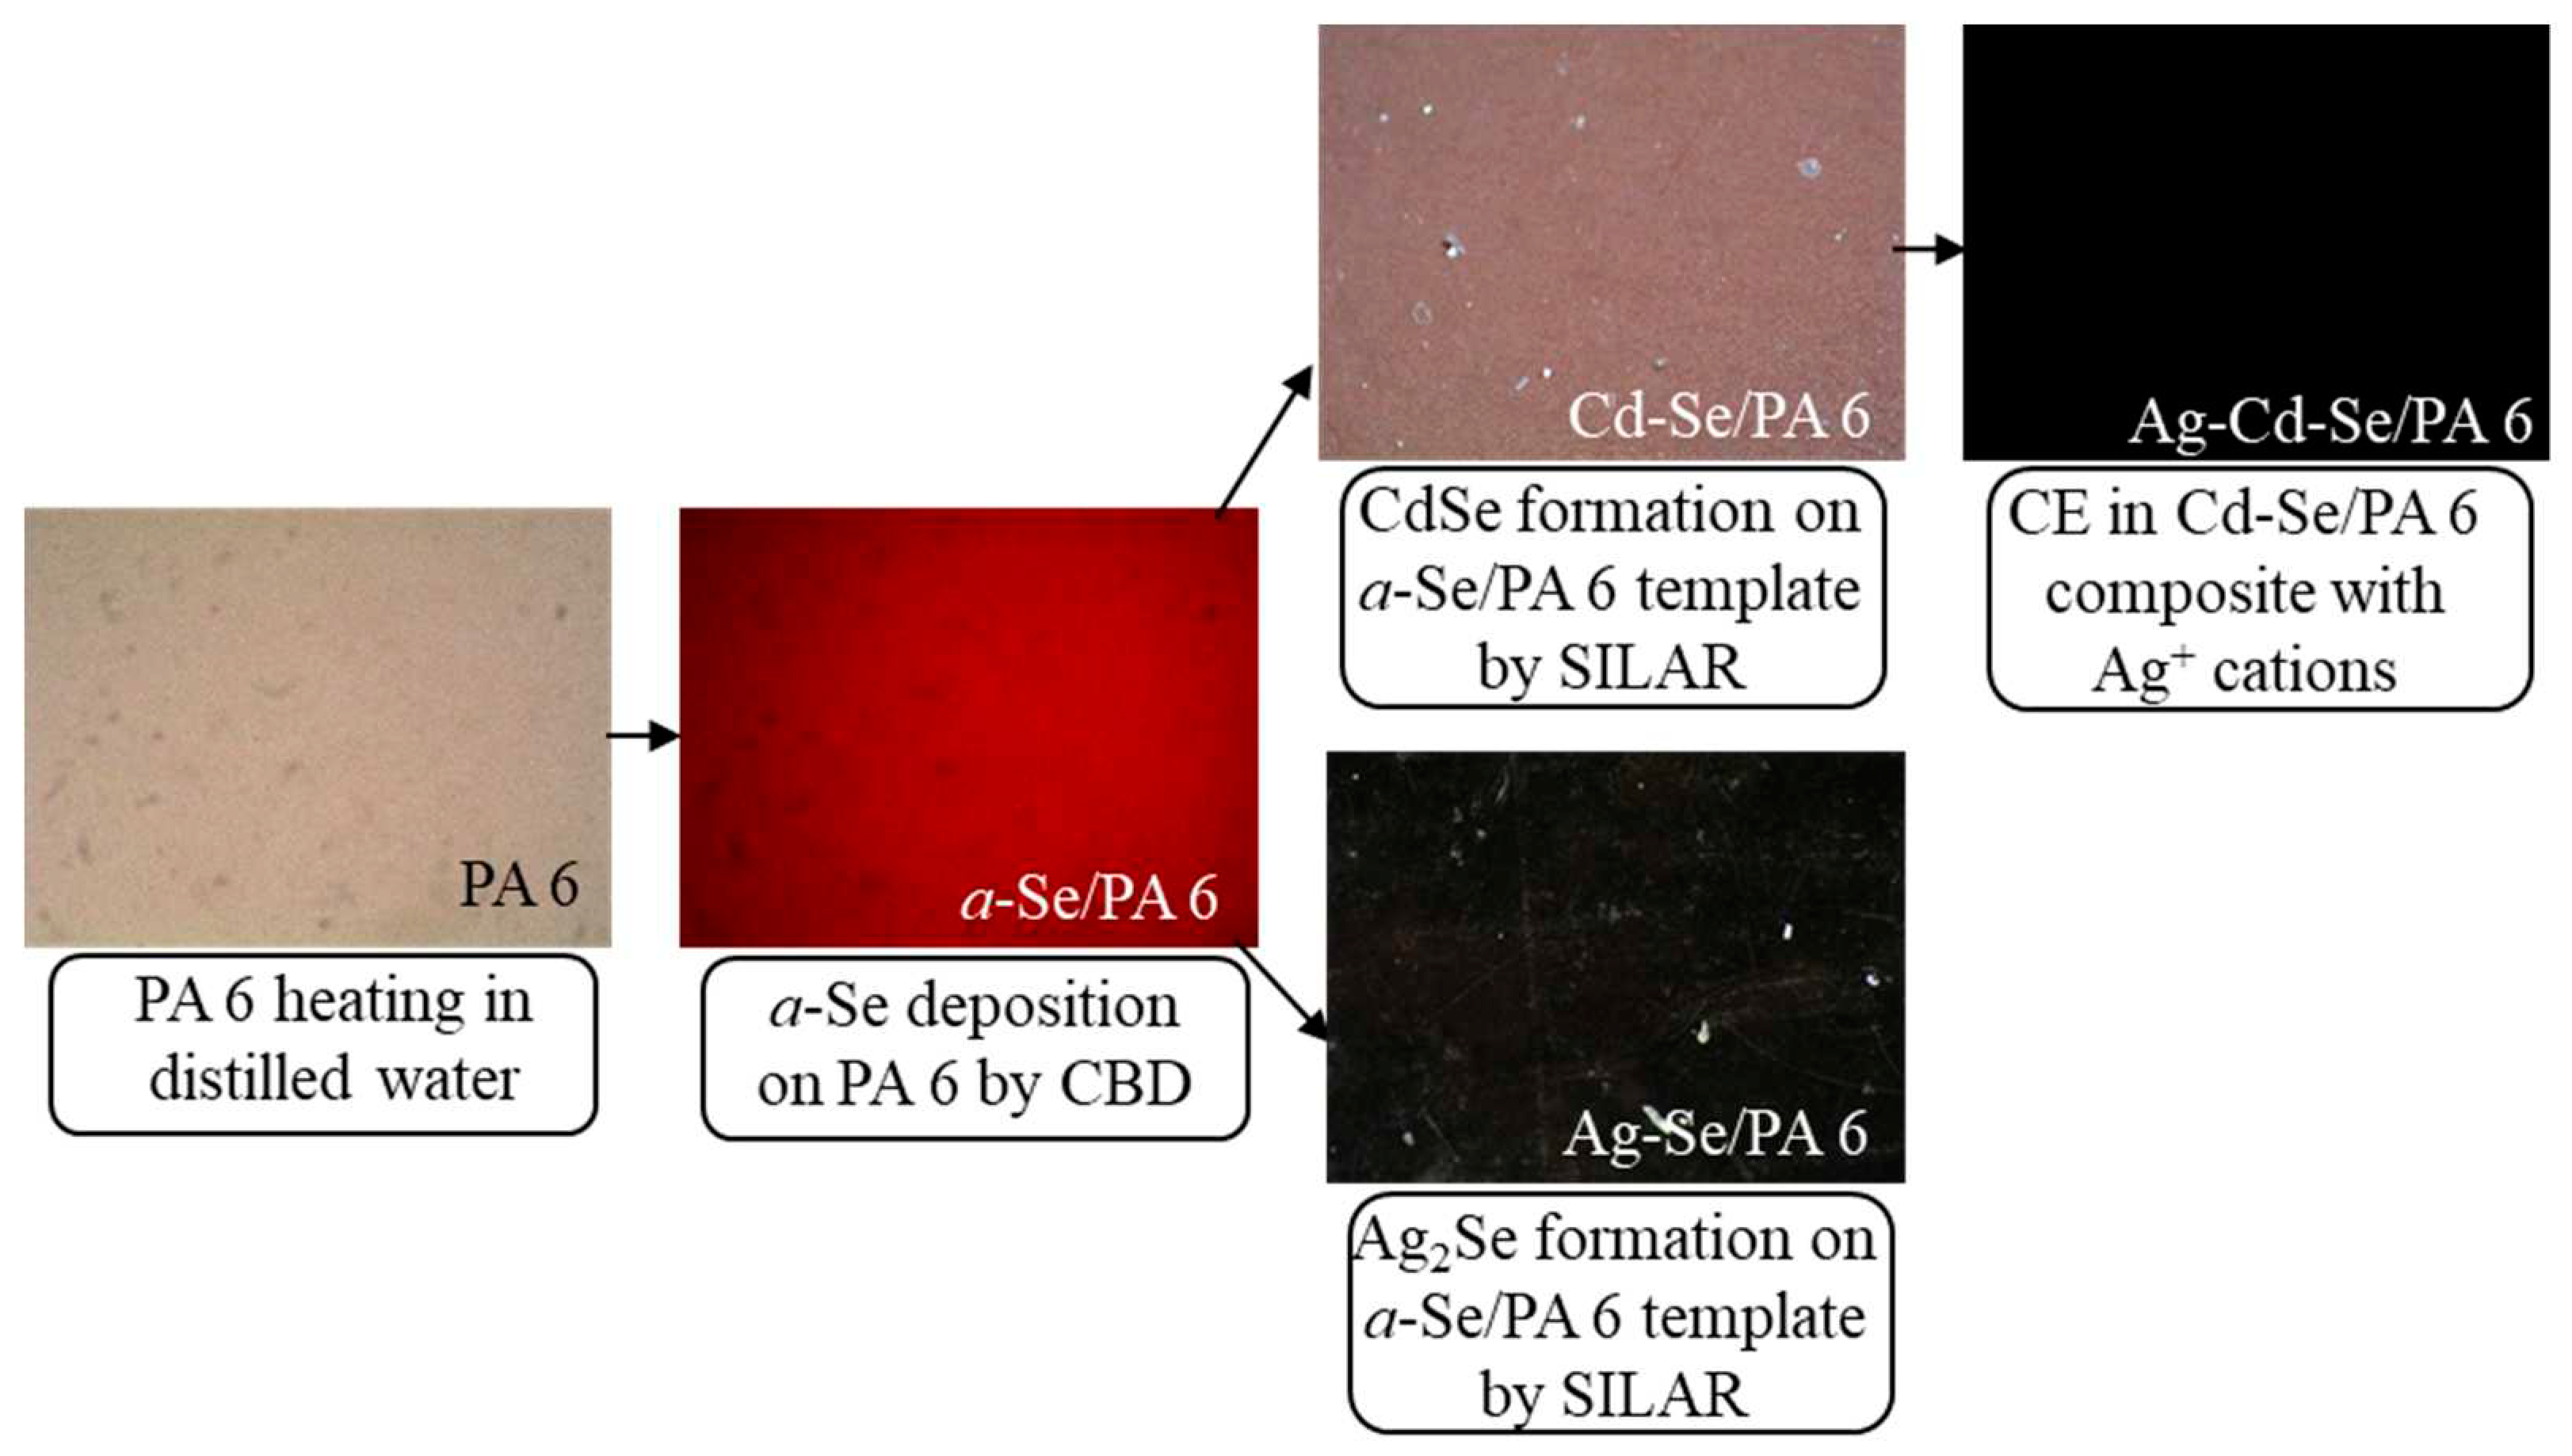
Figure 1. The principal route of combined CBD, SILAR and CE methods for the Se, Cd2+ and Ag+ deposition/insertion in PA 6 membrane. Above optical micrographs image of the PA 6 membrane and obtained composites. Magnification ×100.
Preprints 78558 g001
Figure 2. XRD pattern of the PA 6 sample heated in distilled water.
Preprints 78558 g002
Figure 3. (a) Optical micrograph of the red upper a-Se layer on a PA 6 membrane (×100 magnification); (b) XRD pattern of the a-Se upper layer scrub.
Preprints 78558 g003
Figure 4. XRD diffractograms of boiled PA 6 and obtained composites. PA 6 peaks not shown.
Preprints 78558 g004
Figure 5. Sequential 2D height data (A), 3D AFM topographic images (B) and the height profile (of the blue line in A) (C) of PA 6 and the obtained nanocomposites.
Preprints 78558 g005aPreprints 78558 g005b
Figure 6. (a) FTIR spectra in the region of 1650–650 cm−1 of the PA 6 matrix and the obtained nanocomposites; (b) schematic diagram of the internal amide network in the PA 6 and possible network in the obtained composites.
Preprints 78558 g006
Figure 7. Absorption spectra of PA 6 and obtained composites.
Preprints 78558 g007
Figure 8. Dependence A2∙λ−2 on λ−1 for the PA 6 membrane and obtained nanocomposites.
Preprints 78558 g008aPreprints 78558 g008b
Figure 9. Urbach plots for PA6 membrane and obtained nanocomposites.
Preprints 78558 g009
Table 1. Structural parameters of PA 6 and prepared composites calculated from XRD data.
Sample Phase 2θ, ° D, nm δ×1015, line∙m–2 ε×10–3, line–2∙m–4
PA6 PA6 23.5 16 3.70 2.11
a-Se/PA6 PA6 23.7 17 3.33 2.00
a-Se
Cd-Se/PA6 PA6 23.5 17 3.38 2.01
Se8 33.5 33 0.89 1.04
CdSe 42.7 40 0.63 0.87
Ag-Se/PA6 PA6 23.6 17 3.56 2.06
Se8 31.8 31 0.91 1.07
Ag2Se 33.8 34 0.85 0.98
Ag 43.4 34 0.89 1.02
Ag-Cd-Se/PA6 PA6 23.7 17 3.58 2.08
Se8 31.8 30 1.10 1.15
CdSe 48.7 37 0.74 0.94
Ag2Se 33.6 35 0.84 1.00
Ag 43.5 34 0.88 1.03
Table 2. Standard Gibbs free energy (G) (298.15 K, 1 bar) [54], bond dissociation energies (BDE) [56], solubility product constants (KSP) [38)] and calculated solubility (S) of CdSe and Ag2Se phases.
Phase or ion G, kJ/mol BDE, kJ/mol KSP, (mol/dm3)n S, mol/dm3
a-Se 6.00± 2.2 2.2 10‒8
cr-Se 0.00 332.6 (Se‒Se) 1.5 10‒9
Ag+ 77.11
Cd2+ ‒77.16
CdSe ‒141.60 127.6 ± 25.1 1.0·10‒33 3.16·10‒17
Ag2Se ‒46.90 210.0 ± 14.6 3.1·10‒65 3.14·10‒22
* n = 2 for CdSe, n = 3 for Ag2Se.
Table 3. Band location and assignments of PA 6 and obtained nanocomposites spectra over wavenumber 1650–650 cm–1.
Band location, cm‒1 Assignment
PA6 a-Se/PA6 Cd-Se/PA6 Ag-Se/PA6 Ag-Cd-Se/PA6
687 687 687 687 687 C–C bending
730 730 729 730 729 CH2 waging
834 835 833 833 833 CO–NH in plane
877 877 876 Cd-Se or/and Ag-Se
929 929 930 930 930 CO–NH in plane
960 959 961 960 960 CO–NH in plane (α crystalline)
974 976 975 975 CO–NH in plane (γ crystalline)
1023 1023 1025 1024 1024 trans C–C backbone conformation
1031 1031 1031 1032 1031 CO–NH in plane (α crystalline)
1124 1112 1112 1108 1094 C–C stretching (sym)
1169 1165 1166 1166 1165 N–C–O groups/CH2 twisting
1200 1200 1200 1200 1201 C–CH bending (sym)CH2 twisting
1238 1238 1236 1237 1235
1264 1264 1261 1263 1263 C–N stretching (amide III)
1365 1371 1376 1377 1377 CH2 twisting
1390 1392 1392 1391 C–C stretching (sym)
1417 1417 1417 1416 1415 CH2 scissoring next to >C=O group
1463 1459 1460 1459 1459 CH2 scissoring
1476 1475 1476 1475 1475 CH2 scissoring next to N–H group
1535 1534 1536 1536 1535 C–N stretching and N–H bending of hydrogen-bonded N–H groups (amide II)
1633 1633 1633 1633 1632 C=O stretching (amide I)
Table 4. The optical parameters of PA6 and studied nanocomposites.
Composite λg, nm Eg, eV EU, eV σ Ee-p, eV χ
PA 6 278 4.46± 0.02 1.31 0.020 33.33 11.99
a-Se/PA 6 556 2.23± 0.02 0.95 0.027 24.69 5.99
Cd-Se/PA 6 605 2.05± 0.02 0.39 0.066 10.10 5.51
Ag-Se/PA 6 625 1.98± 0.02 0.55 0.047 14.18 5.32
Ag-Cd-Se/PA 6 756 1.64± 0.02 0.69 0.037 18.02 4.41
Disclaimer/Publisher’s Note: The statements, opinions and data contained in all publications are solely those of the individual author(s) and contributor(s) and not of MDPI and/or the editor(s). MDPI and/or the editor(s) disclaim responsibility for any injury to people or property resulting from any ideas, methods, instructions or products referred to in the content.
Copyright: This open access article is published under a Creative Commons CC BY 4.0 license, which permit the free download, distribution, and reuse, provided that the author and preprint are cited in any reuse.
Prerpints.org logo

Preprints.org is a free preprint server supported by MDPI in Basel, Switzerland.

Subscribe

© 2024 MDPI (Basel, Switzerland) unless otherwise stated