Submitted:
04 July 2023
Posted:
10 July 2023
You are already at the latest version
Abstract
Keywords:
1. Introduction
2. Materials and Methods
2.1. Experimental animals and study design
2.2. Experimental feeds and feeding
2.3. Growth performance
2.4. Gut sampling
2.5. DNA extraction, PCR amplification and sequencing
2.6. Behaviour
2.6.1. Swimming test for assessing response to stress and exploration.
2.6.2. Open-field test for assessing boldness
2.7. Statistical methods
2.7.1. Growth performance
2.7.2. Gut microbiome
2.7.3. Behavioural characteristics
2.7.4. Repeatability of behaviour traits and correlations
3. Results
3.1. Growth performance
3.2. Gut microbiome
3.3. Behavioural characteristics
3.3.1. Swimming test
3.3.2. Exploration trait mean value
3.3.3. Boldness trait mean value
3.3.4. Repeatability and correlation of boldness and exploration traits
4. Discussion
5. Conclusion
Supplementary Materials
Author Contributions
Funding
Institutional Review Board Statement
Data Availability Statement
Acknowledgments
Conflicts of Interest
References
- 1. FAO The State of World Fisheries and Aquaculture. Sustain. action. Rome. 2020. [CrossRef]
- National Research Council (NRC) Nutrient Requirements of Fish. National Academy Press, Washington DC. 2011.
- Naylor, R.L.; Hardy, R.W.; Bureau, D.P.; Chiu, A.; Elliott, M.; Farrell, A.P.; Forster, I.; Gatlin, D.M.; Goldburg, R.J.; Hua, K.; et al. Feeding Aquaculture in an Era of Finite Resources. Proc. Natl. Acad. Sci. U. S. A. 2009, 106, 15103–15110. [Google Scholar] [CrossRef]
- Tacon, A.G.J.; Metian, M. Feed Matters: Satisfying the Feed Demand of Aquaculture. Rev. Fish. Sci. Aquac. 2015, 23, 1–10. [Google Scholar] [CrossRef]
- Gatlin, D.M.; Barrows, F.T.; Brown, P.; Dabrowski, K.; Gaylord, T.G.; Hardy, R.W.; Herman, E.; Hu, G.; Krogdahl, Å.; Nelson, R.; et al. Expanding the Utilization of Sustainable Plant Products in Aquafeeds: A Review. Aquac. Res. 2007, 38, 551–579. [Google Scholar] [CrossRef]
- Ao, Z.; Choct, M. Oligosaccharides Affect Performance and Gut Development of Broiler Chickens. Asian-Australasian J. Anim. Sci. 2013, 26, 116–121. [Google Scholar] [CrossRef] [PubMed]
- Baeverfjord, G.; Krogdahl, Å. Development and Regression of Soybean Meal Induced Enteritis in Atlantic Salmon, Salmo salar L., Distal Intestine: A Comparison with the Intestines of Fasted Fish. J. Fish Dis. 1996, 19, 375–387. [Google Scholar] [CrossRef]
- Hedrera, M.I.; Galdames, J.A.; Jimenez-Reyes, M.F.; Reyes, A.E.; Avendaño-Herrera, R.; Romero, J.; Feijóo, C.G. Soybean Meal Induces Intestinal Inflammation in Zebrafish Larvae. PLoS One 2013, 8, 1–10. [Google Scholar] [CrossRef]
- Hu, H.; Kortner, T.M.; Gajardo, K.; Chikwati, E.; Tinsley, J.; Krogdahl, A. Intestinal Fluid Permeability in Atlantic Salmon (Salmo salar L.) Is Affected by Dietary Protein Source. PLoS One 2016, 11, 1–18. [Google Scholar] [CrossRef]
- Knudsen, D.; Jutfelt, F.; Sundh, H.; Sundell, K.; Koppe, W.; Frøkiær, H. Dietary Soya Saponins Increase Gut Permeability and Play a Key Role in the Onset of Soyabean-Induced Enteritis in Atlantic Salmon (Salmo salar L.). Br. J. Nutr. 2008, 100, 120–129. [Google Scholar] [CrossRef]
- Krogdahl, Å.; Bakke-McKellep, A.M.; Baeverfjord, G. Effects of Graded Levels of Standard Soybean Meal on Intestinal Structure, Mucosal Enzyme Activities, and Pancreatic Response in Atlantic Salmon (Salmo salar L.). Aquac. Nutr. 2003, 9, 361–371. [Google Scholar] [CrossRef]
- Romarheim, O.H.; Øverland, M.; Mydland, L.T.; Skrede, A.; Landsverk, T. Bacteria Grown on Natural Gas Prevent Soybean Meal-Induced Enteritis in Atlantic Salmon1-3. J. Nutr. 2011, 141, 124–130. [Google Scholar] [CrossRef]
- Booman, M.; Forster, I.; Vederas, J.C.; Groman, D.B.; Jones, S.R.M. Soybean Meal-Induced Enteritis in Atlantic Salmon (Salmo salar) and Chinook Salmon (Oncorhynchus tshawytscha) but Not in Pink Salmon (O. gorbuscha). Aquaculture 2018, 483, 238–243. [Google Scholar] [CrossRef]
- Kononova, S. V.; Zinchenko, D. V.; Muranova, T.A.; Belova, N.A.; Miroshnikov, A.I. Intestinal Microbiota of Salmonids and Its Changes upon Introduction of Soy Proteins to Fish Feed. Aquac. Int. 2019, 27, 475–496. [Google Scholar] [CrossRef]
- Sadoul, B.; Foucard, A.; Valotaire, C.; Labbé, L.; Goardon, L.; Lecalvez, J.M.; Médale, F.; Quillet, E.; Dupont-Nivet, M.; Geurden, I.; et al. Adaptive Capacities from Survival to Stress Responses of Two Isogenic Lines of Rainbow Trout Fed a Plant-Based Diet. Sci. Rep. 2016, 6, 1–11. [Google Scholar] [CrossRef] [PubMed]
- Talwar, C.; Nagar, S.; Lal, R.; Negi, R.K. Fish Gut Microbiome: Current Approaches and Future Perspectives. Indian J. Microbiol. 2018, 58, 397–414. [Google Scholar] [CrossRef]
- Desai, A.R.; Links, M.G.; Collins, S.A.; Mansfield, G.S.; Drew, M.D.; Van Kessel, A.G.; Hill, J.E. Effects of Plant-Based Diets on the Distal Gut Microbiome of Rainbow Trout (Oncorhynchus mykiss). Aquaculture 2012, 350–353, 134–142. [Google Scholar] [CrossRef]
- Green, T.J.; Smullen, R.; Barnes, A.C. Dietary Soybean Protein Concentrate-Induced Intestinal Disorder in Marine Farmed Atlantic Salmon, Salmo salar Is Associated with Alterations in Gut Microbiota. Vet. Microbiol. 2013, 166, 286–292. [Google Scholar] [CrossRef]
- Metochis, C.P.; Spanos, I.; Auchinachie, N.; Crampton, V.O.; Bell, J.G.; Adams, A.; Thompson, K.D. The Effects of Increasing Dietary Levels of Soy Protein Concentrate (SPC) on the Immune Responses and Disease Resistance (Furunculosis) of Vaccinated and Non-Vaccinated Atlantic Salmon (Salmo salar L.) Parr. Fish Shellfish Immunol. 2016, 59, 83–94. [Google Scholar] [CrossRef]
- Denstadli, V.; Hillestad, M.; Verlhac, V.; Klausen, M.; Øverland, M. Enzyme Pretreatment of Fibrous Ingredients for Carnivorous Fish: Effects on Nutrient Utilisation and Technical Feed Quality in Rainbow Trout (Oncurhynchus mykiss). Aquaculture 2011, 319, 391–397. [Google Scholar] [CrossRef]
- Perry, W.B.; Lindsay, E.; Payne, C.J.; Brodie, C.; Kazlauskaite, R. The Role of the Gut Microbiome in Sustainable Teleost Aquaculture. Proc. R. Soc. B Biol. Sci. 2020, 287. [Google Scholar] [CrossRef]
- Gajardo, K.; Rodiles, A.; Kortner, T.M.; Krogdahl, Å.; Bakke, A.M.; Merrifield, D.L.; Sørum, H. A High-Resolution Map of the Gut Microbiota in Atlantic Salmon (Salmo salar): A Basis for Comparative Gut Microbial Research. Sci. Rep. 2016, 6, 1–10. [Google Scholar] [CrossRef]
- López Nadal, A.; Ikeda-Ohtsubo, W.; Sipkema, D.; Peggs, D.; McGurk, C.; Forlenza, M.; Wiegertjes, G.F.; Brugman, S. Feed, Microbiota, and Gut Immunity: Using the Zebrafish Model to Understand Fish Health. Front. Immunol. 2020, 11. [Google Scholar] [CrossRef] [PubMed]
- Yukgehnaish, K.; Kumar, P.; Sivachandran, P.; Marimuthu, K.; Arshad, A.; Paray, B.A.; Arockiaraj, J. Gut Microbiota Metagenomics in Aquaculture: Factors Influencing Gut Microbiome and Its Physiological Role in Fish. Rev. Aquac. 2020, 12, 1903–1927. [Google Scholar] [CrossRef]
- Dvergedal, H.; Sandve, S.R.; Angell, I.L.; Klemetsdal, G.; Rudi, K. Association of Gut Microbiota with Metabolism in Juvenile Atlantic Salmon. Microbiome 2020, 8, 1–8. [Google Scholar] [CrossRef]
- Ghanbari, M.; Kneifel, W.; Domig, K.J. A New View of the Fish Gut Microbiome: Advances from next-Generation Sequencing. Aquaculture 2015, 448, 464–475. [Google Scholar] [CrossRef]
- Llewellyn, M.S.; Boutin, S.; Hoseinifar, S.H.; Derome, N. Teleost Microbiomes: The State of the Art in Their Characterization, Manipulation and Importance in Aquaculture and Fisheries. Front. Microbiol. 2014, 5, 1–1. [Google Scholar] [CrossRef]
- Dehler, C.E.; Secombes, C.J.; Martin, S.A.M. Environmental and Physiological Factors Shape the Gut Microbiota of Atlantic Salmon Parr (Salmo salar L.). Aquaculture 2017, 467, 149–157. [Google Scholar] [CrossRef]
- Smith, C.C.R.; Snowberg, L.K.; Gregory Caporaso, J.; Knight, R.; Bolnick, D.I. Dietary Input of Microbes and Host Genetic Variation Shape Among-Population Differences in Stickleback Gut Microbiota. ISME J. 2015, 9, 2515–2526. [Google Scholar] [CrossRef]
- Gajardo, K.; Jaramillo-Torres, A.; Kortner, T.M.; Merrifield, D.L.; Tinsley, J.; Bakke, A.M.; Krogdahl, Å. Alternative Protein Sources in the Diet Modulate Microbiota and Functionality in the Distal Intestine of Atlantic Salmon (Salmo salar). Appl. Environ. Microbiol. 2017, 83. [Google Scholar] [CrossRef]
- Michl, S.C.; Beyer, M.; Ratten, J.M.; Hasler, M.; LaRoche, J.; Schulz, C. A Diet-Change Modulates the Previously Established Bacterial Gut Community in Juvenile Brown Trout (Salmo trutta). Sci. Rep. 2019, 9, 1–12. [Google Scholar] [CrossRef]
- Michl, S.C.; Ratten, J.M.; Beyer, M.; Hasler, M.; La Roche, J.; Schulz, C. The Malleable Gut Microbiome of Juvenile Rainbow Trout (Oncorhynchus mykiss): Dietdependent Shifts of Bacterial Community Structures. PLoS One 2017, 12, 1–21. [Google Scholar] [CrossRef]
- Dehler, C.E.; Secombes, C.J.; Martin, S.A.M. Seawater Transfer Alters the Intestinal Microbiota Profiles of Atlantic Salmon (Salmo salar L.). Sci. Rep. 2017, 7, 1–11. [Google Scholar] [CrossRef] [PubMed]
- Drew, M.D.; Borgeson, T.L.; Thiessen, D.L. A Review of Processing of Feed Ingredients to Enhance Diet Digestibility in Finfish. Anim. Feed Sci. Technol. 2007, 138, 118–136. [Google Scholar] [CrossRef]
- Kirk, O.; Borchert, T.V.; Fuglsang, C.C. Industrial Enzyme Applications. Curr. Opin. Biotechnol. 2002, 13, 345–351. [Google Scholar] [CrossRef]
- Kiron, V. Fish Immune System and Its Nutritional Modulation for Preventive Health Care. Anim. Feed Sci. Technol. 2012, 173, 111–133. [Google Scholar] [CrossRef]
- Li, C.; Zhang, B.; Liu, C.; Zhou, H.; Wang, X.; Mai, K.; He, G. Effects of Dietary Raw or Enterococcus faecium Fermented Soybean Meal on Growth, Antioxidant Status, Intestinal Microbiota, Morphology, and Inflammatory Responses in Turbot (Scophthalmus maximus L.). Fish Shellfish Immunol. 2020, 100, 261–271. [Google Scholar] [CrossRef] [PubMed]
- Ringø, E.; Van Doan, H.; Lee, S.H.; Soltani, M.; Hoseinifar, S.H.; Harikrishnan, R.; Song, S.K. Probiotics, Lactic Acid Bacteria and Bacilli: Interesting Supplementation for Aquaculture. J. Appl. Microbiol. 2020, 129, 116–136. [Google Scholar] [CrossRef]
- Ganguly, S.; Dora, K.C.; Sarkar, S.; Chowdhury, S. Supplementation of Prebiotics in Fish Feed: A Review. Rev. Fish Biol. Fish. 2013, 23, 195–199. [Google Scholar] [CrossRef]
- Ringø, E.; Olsen, R.E.; Gifstad, T.; Dalmo, R.A.; Amlund, H.; Hemre, G.I.; Bakke, A.M. Prebiotics in Aquaculture: A Review. Aquac. Nutr. 2010, 16, 117–136. [Google Scholar] [CrossRef]
- Akrami, R.; Iri, Y.; Khoshbavar Rostami, H.; Razeghi Mansour, M. Effect of Dietary Supplementation of Fructooligosaccharide (FOS) on Growth Performance, Survival, Lactobacillus Bacterial Population and Hemato-Immunological Parameters of Stellate Sturgeon (Acipenser stellatus) Juvenile. Fish Shellfish Immunol. 2013, 35, 1235–1239. [Google Scholar] [CrossRef]
- Grisdale-Helland, B.; Helland, S.J.; Gatlin, D.M. The Effects of Dietary Supplementation with Mannanoligosaccharide, Fructooligosaccharide or Galactooligosaccharide on the Growth and Feed Utilization of Atlantic Salmon (Salmo salar). Aquaculture 2008, 283, 163–167. [Google Scholar] [CrossRef]
- Jacobsen, H.J.; Kousoulaki, K.; Sandberg, A.S.; Carlsson, N.G.; Ahlstrøm, Ø.; Oterhals, Å. Enzyme Pre-Treatment of Soybean Meal: Effects on Non-Starch Carbohydrates, Protein, Phytic Acid, and Saponin Biotransformation and Digestibility in Mink (Neovison vison). Anim. Feed Sci. Technol. 2018, 236, 1–13. [Google Scholar] [CrossRef]
- Bedford, M.R. Future Prospects for Non-Starch Polysaccharide Degrading Enzymes Development in Monogastric Nutrition; Gonzáles-Ortiz, G., Bedford, M.R., Bach Knudsen, K.E., Courtin, C.M., Classen, H.L., Eds.; 2019; ISBN 9789086868933.
- Foster, J.A.; Rinaman, L.; Cryan, J.F. Stress & the Gut-Brain Axis: Regulation by the Microbiome. Neurobiol. Stress 2017, 7, 124–136. [Google Scholar] [CrossRef] [PubMed]
- Martin, C.R.; Mayer, E.A. Gut-Brain Axis and Behavior. Nestle Nutr Inst Work. Ser. 2017, 88, 45–53. [Google Scholar] [CrossRef]
- Borrelli, L.; Aceto, S.; Agnisola, C.; De Paolo, S.; Dipineto, L.; Stilling, R.M.; Dinan, T.G.; Cryan, J.F.; Menna, L.F.; Fioretti, A. Probiotic Modulation of the Microbiota-Gut-Brain Axis and Behaviour in Zebrafish. Sci. Rep. 2016, 6, 1–9. [Google Scholar] [CrossRef] [PubMed]
- Soares, M.C.; Cable, J.; Lima-Maximino, M.G.; Maximino, C.; Xavier, R. Using Fish Models to Investigate the Links between Microbiome and Social Behaviour: The next Step for Translational Microbiome Research? Fish Fish. 2019, 20, 640–652. [Google Scholar] [CrossRef]
- Martins, C.I.M.; Galhardo, L.; Noble, C.; Damsgård, B.; Spedicato, M.T.; Zupa, W.; Beauchaud, M.; Kulczykowska, E.; Massabuau, J.C.; Carter, T.; et al. Behavioural Indicators of Welfare in Farmed Fish. Fish Physiol. Biochem. 2012, 38, 17–41. [Google Scholar] [CrossRef] [PubMed]
- Sneddon, L.U. Fish Behaviour and Welfare. Appl. Anim. Behav. Sci. 2007, 3, 173–175. [Google Scholar] [CrossRef]
- Huntingford, F.A.; Adams, C.; Braithwaite, V.A.; Kadri, S.; Pottinger, T.G.; Sandøe, P.; Turnbull, J.F. Current Issues in Fish Welfare. J. Fish Biol. 2006, 68, 332–372. [Google Scholar] [CrossRef]
- Solgaard, H.S.; Yang, Y. Consumers’ Perception of Farmed Fish and Willingness to Pay for Fish Welfare. Br. Food J. 2011, 113, 997–1010. [Google Scholar] [CrossRef]
- Castanheira, M.F.; Conceição, L.E.C.; Millot, S.; Rey, S.; Bégout, M.L.; Damsgård, B.; Kristiansen, T.; Höglund, E.; Øverli, Ø.; Martins, C.I.M. Coping Styles in Farmed Fish: Consequences for Aquaculture. Rev. Aquac. 2017, 9, 23–41. [Google Scholar] [CrossRef]
- Conrad, J.L.; Weinersmith, K.L.; Brodin, T.; Saltz, J.B.; Sih, A. Behavioural Syndromes in Fishes: A Review with Implications for Ecology and Fisheries Management. J. Fish Biol. 2011, 78, 395–435. [Google Scholar] [CrossRef] [PubMed]
- Koolhaas, J.M.; Korte, S.M.; De Boer, S.F.; Van Der Vegt, B.J.; Van Reenen, C.G.; Hopster, H.; De Jong, I.C.; Ruis, M.A.W.; Blokhuis, H.J. Coping Styles in Animals: Current Status in Behavior and Stress- Physiology. Neurosci. Biobehav. Rev. 1999, 23, 925–935. [Google Scholar] [CrossRef] [PubMed]
- Réale, D.; Reader, S.M.; Sol, D.; McDougall, P.T.; Dingemanse, N.J. Integrating Animal Temperament within Ecology and Evolution. Biol. Rev. Camb. Philos. Soc. 2007, 82, 291–318. [Google Scholar] [CrossRef] [PubMed]
- Benhaïm, D.; Leblanc, C.A.L.; Horri, K.; Mannion, K.; Galloway, M.; Leeper, A.; Knobloch, S.; Sigurgeirsson, Ó.; Thorarensen, H. The Effect of Triploidy on the Performance, Gut Microbiome and Behaviour of Juvenile Atlantic Salmon (Salmo salar) Raised at Low Temperature. Appl. Anim. Behav. Sci. 2020, 229, 105031. [Google Scholar] [CrossRef]
- Sih, A.; Bell, A.; Johnson, J.C. Behavioral Syndromes: An Ecological and Evolutionary Overview. Trends Ecol. Evol. 2004, 19, 372–378. [Google Scholar] [CrossRef]
- MacKenzie, S.; Ribas, L.; Pilarczyk, M.; Capdevila, D.M.; Kadri, S.; Huntingford, F.A. Screening for Coping Style Increases the Power of Gene Expression Studies. PLoS One 2009, 4, 2–6. [Google Scholar] [CrossRef] [PubMed]
- Øverli, Ø.; Korzan, W.J.; Larson, E.T.; Winberg, S.; Lepage, O.; Pottinger, T.G.; Renner, K.J.; Summers, C.H. Behavioral and Neuroendocrine Correlates of Displaced Aggression in Trout. Horm. Behav. 2004, 45, 324–329. [Google Scholar] [CrossRef] [PubMed]
- Castanheira, M.F.; Herrera, M.; Costas, B.; Conceição, L.E.C.; Martins, C.I.M. Can We Predict Personality in Fish? Searching for Consistency over Time and across Contexts. PLoS One 2013, 8, 1–9. [Google Scholar] [CrossRef]
- Ruiz-Gomez, M. de L.; Kittilsen, S.; Höglund, E.; Huntingford, F.A.; Sørensen, C.; Pottinger, T.G.; Bakken, M.; Winberg, S.; Korzan, W.J.; Øverli, Ø. Behavioral Plasticity in Rainbow Trout (Oncorhynchus mykiss) with Divergent Coping Styles: When Doves Become Hawks. Horm. Behav. 2008, 54, 534–538. [Google Scholar] [CrossRef]
- Sneddon, L.U. The Bold and the Shy: Individual Differences in Rainbow Trout. J. Fish Biol. 2003, 62, 971–975. [Google Scholar] [CrossRef]
- Ward, A.J.W.; Thomas, P.; Hart, P.J.B.; Krause, J. Correlates of Boldness in Three-Spined Sticklebacks (Gasterosteus aculeatus). Behav. Ecol. Sociobiol. 2004, 55, 561–568. [Google Scholar] [CrossRef]
- Webster, A.J.F. Farm Animal Welfare: The Five Freedoms and the Free Market. Vet. J. 2001, 161, 229–237. [Google Scholar] [CrossRef]
- Ishizaki, Y.; Masuda, R.; Uematsu, K.; Shimizu, K.; Arimoto, M.; Takeuchi, T. The Effect of Dietary Docosahexaenoic Acid on Schooling Behaviour and Brain Development in Larval Yellowtail. J. Fish Biol. 2001, 58, 1691–1703. [Google Scholar] [CrossRef]
- Ibarra-Zatarain, Z.; Parati, K.; Cenadelli, S.; Duncan, N. Reproductive Success of a Marine Teleost Was Correlated with Proactive and Reactive Stress-Coping Styles. J. Fish Biol. 2019, 94, 402–413. [Google Scholar] [CrossRef]
- Masayuki Yoshida, M.N. and K.U.G. Comparison of Behavioral Responses to a Novel Environment between Three Teleosts, Bluegill. Fish. Sci. 2005, 71, 314–319. [Google Scholar] [CrossRef]
- Budaev, S. V.; Zworykin, D.D.; Mochek, A.D. Individual Differences in Parental Care and Behaviour Profile in the Convict Cichlid: A Correlation Study. Anim. Behav. 1999, 58, 195–202. [Google Scholar] [CrossRef] [PubMed]
- Toms, C.N.; Echevarria, D.J.; Jouandot, D.J. A Methodological Review of Personality-Related Studies in Fish: Focus on the Shy-Bold Axis of Behavior. Int. J. Comp. Psychol. 2010, 23, 0–25. [Google Scholar] [CrossRef]
- Dahlbom, S.J.; Lagman, D.; Lundstedt-Enkel, K.; Sundström, L.F.; Winberg, S. Boldness Predicts Social Status in Zebrafish (Danio rerio). PLoS One 2011, 6, 2–8. [Google Scholar] [CrossRef]
- Bates, D.; Mächler, M.; Bolker, B.M.; Walker, S.C. Fitting Linear Mixed-Effects Models Using Lme4. J. Stat. Softw. 2015, 67. [Google Scholar] [CrossRef]
- Pinheiro, J.; Bates, D.; DebRoy, S.; Sarkar, D. ; R Core Team Nlme: Linear and Nonlinear Mixed Effects Models. R Package Version 3.1-137. Http://CRAN.R-Project.Org/Package=nlme. 2018.
- Callahan, B.J.; McMurdie, P.J.; Rosen, M.J.; Han, A.W.; Johnson, A.J.A.; Holmes, S.P. DADA2: High-Resolution Sample Inference from Illumina Amplicon Data. Nat. Methods 2016, 13, 581–583. [Google Scholar] [CrossRef]
- Quast, C.; Pruesse, E.; Yilmaz, P.; Gerken, J.; Schweer, T.; Yarza, P.; Peplies, J.; Glöckner, F.O. The SILVA Ribosomal RNA Gene Database Project: Improved Data Processing and Web-Based Tools. Nucleic Acids Res. 2013, 41. [Google Scholar] [CrossRef]
- McMurdie, P.J.; Holmes, S. Phyloseq: An R Package for Reproducible Interactive Analysis and Graphics of Microbiome Census Data. PLoS One 2013, 8. [Google Scholar] [CrossRef]
- Lahti, L.; Shetty, S. Microbiome R Package. Bioconductor 2017. [Google Scholar] [CrossRef]
- Oksanen, J.; Simpson, G.; Blanchet, F.; Kindt, R.; Legendre, P.; Minchin, P.; O’Hara, R.; Solymos, P.; Stevens, M.; Szoecs, E.; et al. Vegan: Community Ecology Package. 2022.
- Wickham, H. Ggplot2: Elegant Graphics for Data Analysis. Springer-Verlag New York. ISBN 978-3-319-24277-4. https://ggplot2.tidyverse.org 2016.
- Davis, N.M.; Proctor, Di.M.; Holmes, S.P.; Relman, D.A.; Callahan, B.J. Simple Statistical Identification and Removal of Contaminant Sequences in Marker-Gene and Metagenomics Data. Microbiome 2018, 6, 1–14. [Google Scholar] [CrossRef] [PubMed]
- Fox, J.; Weisberg, S. An R Companion to Applied Regression; Second Edi.; SAGE Publications. 2011. [Google Scholar]
- Beukeboom, R.; Morel, A.; Phillips, J.S.; Ólafsdóttir, G.Á.; Benhaïm, D. Activity vs Exploration: Locomotion in a Known and Unknown Environment Differs in Atlantic Cod Juveniles (Gadus morhua). Behav. Processes 2022, 202, 1–7. [Google Scholar] [CrossRef] [PubMed]
- Zuur, A.F.; Ieno, E.N.; Walker, N.J.; Saveliev, A.A.; Smith, G.M. Zero-Truncated and Zero-Inflated Models for Count Data BT - Mixed Effects Models and Extensions in Ecology with R; 2009; ISBN 978-0-387-87458-6.
- Hothorn, T.; Bretz, F.; Westfall, P. Simultaneous Inference in General Parametric Models. Biometrical J. 2008, 50, 346–363. [Google Scholar] [CrossRef]
- Carpenter, B.; Gelman, A.; Hoffman, M.D.; Lee, D.; Goodrich, B.; Betancourt, M.; Brubaker, M.A.; Guo, J.; Li, P.; Riddell, A. Stan: A Probabilistic Programming Language. J. Stat. Softw. 2017, 76. [Google Scholar] [CrossRef] [PubMed]
- Bürkner, P.C. Brms: An R Package for Bayesian Multilevel Models Using Stan. J. Stat. Softw. 2017, 80. [Google Scholar] [CrossRef]
- Johnson, W.D.; Koch, G.G. Intraclass Correlation Coefficient. Lovric, M. Int. Encycl. Stat. Sci. Springer, Berlin, Heidelberg, 2011. [CrossRef]
- Plummer, M.; Best, N.; Cowles, K.; Vines, K. {CODA}: Convergence Diagnosis and Output Analysis for {MCMC}. R News 2006, 6, 7–11. [Google Scholar]
- Nathanailides, C.; Lopez-Albors, O.; Stickland, N.C. Influence of Prehatch Temperature on the Development of Muscle Cellularity in Posthatch Atlantic Salmon (Salmo salar). Can. J. Fish. Aquat. Sci. 1995, 52, 675–680. [Google Scholar] [CrossRef]
- Sørensen, M.; Gong, Y.; Bjarnason, F.; Vasanth, G.K.; Dahle, D.; Huntley, M.; Kiron, V. Nannochloropsis Oceania-Derived Defatted Meal as an Alternative to Fishmeal in Atlantic Salmon Feeds. PLoS One 2017, 12, 1–20. [Google Scholar] [CrossRef] [PubMed]
- Storebakken, T.; Kvien, I.S.; Shearer, K.D.; Grisdale-Helland, B.; Helland, S.J.; Berge, G.M. The Apparent Digestibility of Diets Containing Fish Meal, Soybean Meal or Bacterial Meal Fed to Atlantic Salmon (Salmo salar): Evaluation of Different Faecal Collection Methods. Aquaculture 1998, 169, 195–210. [Google Scholar] [CrossRef]
- Sahlmann, C.; Gu, J.; Kortner, T.M.; Lein, I.; Krogdahl, Å.; Bakke, A.M. Ontogeny of the Digestive System of Atlantic Salmon (Salmo salar L.) and Effects of Soybean Meal from Start-Feeding. PLoS One 2015, 10, 1–23. [Google Scholar] [CrossRef] [PubMed]
- Øvrum Hansen, J.; Hofossæter, M.; Sahlmann, C.; Ånestad, R.; Reveco-Urzua, F.E.; Press, C.M.L.; Mydland, L.T.; Øverland, M. Effect of Candida utilis on Growth and Intestinal Health of Atlantic Salmon (Salmo salar) Parr. Aquaculture 2019, 511, 734239. [Google Scholar] [CrossRef]
- Olli, J.J.; Krogdahl; Våbenø, A. Dehulled Solvent-extracted Soybean Meal as a Protein Source in Diets for Atlantic Salmon, Salmo salar L. Aquac. Res. 1995, 26, 167–174. [Google Scholar] [CrossRef]
- Refstie, S.; Storebakken, T.; Roem, A. Feed Consumption and Conversion in Atlantic Salmon (Salmo salar) Fed Diets with Fish Meal, Extracted Soybean Meal or Soybean Meal with Reduced Content Of. Aquaculture 1998, 301–312. [Google Scholar] [CrossRef]
- Ai, Q.; Mai, K.; Zhang, W.; Xu, W.; Tan, B.; Zhang, C.; Li, H. Effects of Exogenous Enzymes (Phytase, Non-Starch Polysaccharide Enzyme) in Diets on Growth, Feed Utilization, Nitrogen and Phosphorus Excretion of Japanese Seabass, Lateolabrax japonicus. Comp. Biochem. Physiol. - A Mol. Integr. Physiol. 2007, 147, 502–508. [Google Scholar] [CrossRef]
- Zhu, D.; Wen, X.; Li, S.; Xuan, X.; Li, Y. Effects of Exogenous Non-Starch Polysaccharide-Degrading Enzymes in Diets Containing Gracilaria lemaneiformis on White-Spotted Snapper Lutjanus stellatus Akazaki. Aquac. Int. 2016, 24, 491–502. [Google Scholar] [CrossRef]
- Denstadli, V.; Storebakken, T.; Svihus, B.; Skrede, A. A Comparison of Online Phytase Pre-Treatment of Vegetable Feed Ingredients and Phytase Coating in Diets for Atlantic Salmon (Salmo salar L.) Reared in Cold Water. Aquaculture 2007, 269, 414–426. [Google Scholar] [CrossRef]
- Ortiz, L.T.; Rebolé, A.; Velasco, S.; Rodríguez, M.L.; Treviño, J.; Tejedor, J.L.; Alzueta, C. Effects of Inulin and Fructooligosaccharides on Growth Performance, Body Chemical Composition and Intestinal Microbiota of Farmed Rainbow Trout (Oncorhynchus mykiss). Aquac. Nutr. 2013, 19, 475–482. [Google Scholar] [CrossRef]
- Bruce, T.J.; Neiger, R.D.; Brown, M.L. Gut Histology, Immunology and the Intestinal Microbiota of Rainbow Trout, Oncorhynchus mykiss (Walbaum), Fed Process Variants of Soybean Meal. Aquac. Res. 2018, 49, 492–504. [Google Scholar] [CrossRef]
- Reveco, F.E.; Øverland, M.; Romarheim, O.H.; Mydland, L.T. Intestinal Bacterial Community Structure Differs between Healthy and Inflamed Intestines in Atlantic Salmon (Salmo salar L.). Aquaculture 2014, 420–421, 262–269. [Google Scholar] [CrossRef]
- Guerreiro, I.; Serra, C.R.; Pousão-Ferreira, P.; Oliva-Teles, A.; Enes, P. Prebiotics Effect on Growth Performance, Hepatic Intermediary Metabolism, Gut Microbiota and Digestive Enzymes of White Sea Bream (Diplodus sargus). Aquac. Nutr. 2018, 24, 153–163. [Google Scholar] [CrossRef]
- Liu, W.; Wang, W.; Ran, C.; He, S.; Yang, Y.; Zhou, Z. Effects of Dietary ScFOS and Lactobacilli on Survival, Growth, and Disease Resistance of Hybrid Tilapia. Aquaculture 2017, 470, 50–55. [Google Scholar] [CrossRef]
- Burgos, F.A.; Ray, C.L.; Arias, C.R. Bacterial Diversity and Community Structure of the Intestinal Microbiome of Channel Catfish (Ictalurus punctatus) during Ontogenesis. Syst. Appl. Microbiol. 2018, 41, 494–505. [Google Scholar] [CrossRef] [PubMed]
- Gibson, G.R.; Roberfroid, M.B. Dietary Modulation of the Human Colonic Microbiota: Introducing the Concept of Prebiotics. J. Nutr. 1995, 125, 1401–1412. [Google Scholar] [CrossRef]
- Infante-Villamil, S.; Huerlimann, R.; Jerry, D.R. Microbiome Diversity and Dysbiosis in Aquaculture. Rev. Aquac. 2021, 13, 1077–1096. [Google Scholar] [CrossRef]
- Alshammari, E.; Patel, M.; Sachidanandan, M.; Kumar, P.; Adnan, M. Potential Evaluation and Health Fostering Intrinsic Traits of Novel Probiotic Strain Enterococcus durans F3 Isolated from the Gut of Fresh Water Fish Catla catla. Food Sci. Anim. Resour. 2019, 39, 844–861. [Google Scholar] [CrossRef]
- Momeni-Moghaddam, P.; Keyvanshokooh, S.; Ziaei-Nejad, S.; Parviz Salati, A.; Pasha-Zanoosi, H. Effects of Mannan Oligosaccharide Supplementation on Growth, Some Immune Responses and Gut Lactic Acid Bacteria of Common Carp (Cyprinus carpio) Fingerlings. Vet. Res. forum an Int. Q. J. 2015, 6, 239–244. [Google Scholar]
- De Vuyst, L.; Leroy, F. Bacteriocins from Lactic Acid Bacteria: Production, Purification, and Food Applications. J. Mol. Microbiol. Biotechnol. 2007, 13, 194–199. [Google Scholar] [CrossRef]
- Ringø, E.; Hoseinifar, S.H.; Ghosh, K.; Doan, H. Van; Beck, B.R.; Song, S.K. Lactic Acid Bacteria in Finfish-An Update. Front. Microbiol. 2018, 9, 1–37. [Google Scholar] [CrossRef]
- Chapagain, P.; Arivett, B.; Cleveland, B.M.; Walker, D.M.; Salem, M. Analysis of the Fecal Microbiota of Fast-and Slow-Growing Rainbow Trout (Oncorhynchus mykiss). BMC Genomics 2019, 20, 1–11. [Google Scholar] [CrossRef]
- Neis, E.P.J.G.; Dejong, C.H.C.; Rensen, S.S. The Role of Microbial Amino Acid Metabolism in Host Metabolism. Nutrients 2015, 7, 2930–2946. [Google Scholar] [CrossRef]
- Steiner, K.; Heasman, K.; Laroche, O.; Pochon, X.; Preece, M.; Bowman, J.P.; Walker, S.P.; Symonds, J.E. The Microbiome of Chinook Salmon (Oncorhynchus tshawytscha) in a Recirculation Aquaculture System. Aquaculture 2021, 534, 736227. [Google Scholar] [CrossRef]
- Madaro, A.; Fernö, A.; Kristiansen, T.S.; Olsen, R.E.; Gorissen, M.; Flik, G.; Nilsson, J. Effect of Predictability on the Stress Response to Chasing in Atlantic Salmon (Salmo salar L.) Parr. Physiol. Behav. 2016, 153, 1–6. [Google Scholar] [CrossRef]
- Huntingford, F.; Adams, C. Behavioural Syndromes in Farmed Fish: Implications for Production and Welfare. Behaviour 2005, 142, 1207–1221. [Google Scholar] [CrossRef]
- Ibarra-Zatarain, Z.; Morais, S.; Bonacic, K.; Campoverde, C.; Duncan, N. Dietary Fatty Acid Composition Significantly Influenced the Proactive-Reactive Behaviour of Senegalese Sole (Solea senegalensis) Post-Larvae. Appl. Anim. Behav. Sci. 2015, 171, 233–240. [Google Scholar] [CrossRef]
- Bell, A.M.; Hankison, S.J.; Laskowski, K.L. The Repeatability of Behaviour: A Meta-Analysis Alison. Anim. Behav. 2009, 77, 771–783. [Google Scholar] [CrossRef]
- Damsgard, B.; Evensen, T.H.; Øverli, Ø.; Gorissen, M.; Ebbesson, L.O.E.; Rey, S.; Höglund, E. Proactive Avoidance Behaviour and Pace-of-Life Syndrome in Atlantic Salmon. R. Soc. Open Sci. 2019, 6. [Google Scholar] [CrossRef] [PubMed]
- Øverli, Ø.; Sørensen, C.; Pulman, K.G.T.; Pottinger, T.G.; Korzan, W.; Summers, C.H.; Nilsson, G.E. Evolutionary Background for Stress-Coping Styles: Relationships between Physiological, Behavioral, and Cognitive Traits in Non-Mammalian Vertebrates. Neurosci. Biobehav. Rev. 2007, 31, 396–412. [Google Scholar] [CrossRef]
- Höglund, E.; Gjøen, H.M.; Pottinger, T.G. ; Øverli Parental Stress-Coping Styles Affect the Behaviour of Rainbow Trout Oncorhynchus mykiss at Early Developmental Stages. J. Fish Biol. 2008, 73, 1764–1769. [Google Scholar] [CrossRef]
- Evans, J.; Boudreau, K.; Hyman, J. Behavioural Syndromes in Urban and Rural Populations of Song Sparrows. Ethology 2010, 116, 588–595. [Google Scholar] [CrossRef]
- Baker, M.R.; Goodman, A.C.; Santo, J.B.; Wong, R.Y. Repeatability and Reliability of Exploratory Behavior in Proactive and Reactive Zebrafish, Danio rerio. Sci. Rep. 2018, 8, 1–10. [Google Scholar] [CrossRef] [PubMed]
- Ferrari, S.; Horri, K.; Allal, F.; Vergnet, A.; Benhaim, D.; Vandeputte, M.; Chatain, B.; Bégout, M.L. Heritability of Boldness and Hypoxia Avoidance in European Seabass, Dicentrarchus labrax. PLoS One 2016, 11, 1–16. [Google Scholar] [CrossRef] [PubMed]
- Knobloch, S.; Skírnisdóttir, S.; Dubois, M.; Kolypczuk, L.; Leroi, F.; Leeper, A.; Passerini, D.; Marteinsson, V. Impact of Putative Probiotics on Growth, Behavior, and the Gut Microbiome of Farmed Arctic Char (Salvelinus alpinus). Front. Microbiol. 2022, 13. [Google Scholar] [CrossRef]
- Prentice, P.M.; Houslay, T.M.; Wilson, A.J. Exploiting Animal Personality to Reduce Chronic Stress in Captive Fish Populations. Front. Vet. Sci. 2022, 9. [Google Scholar] [CrossRef]
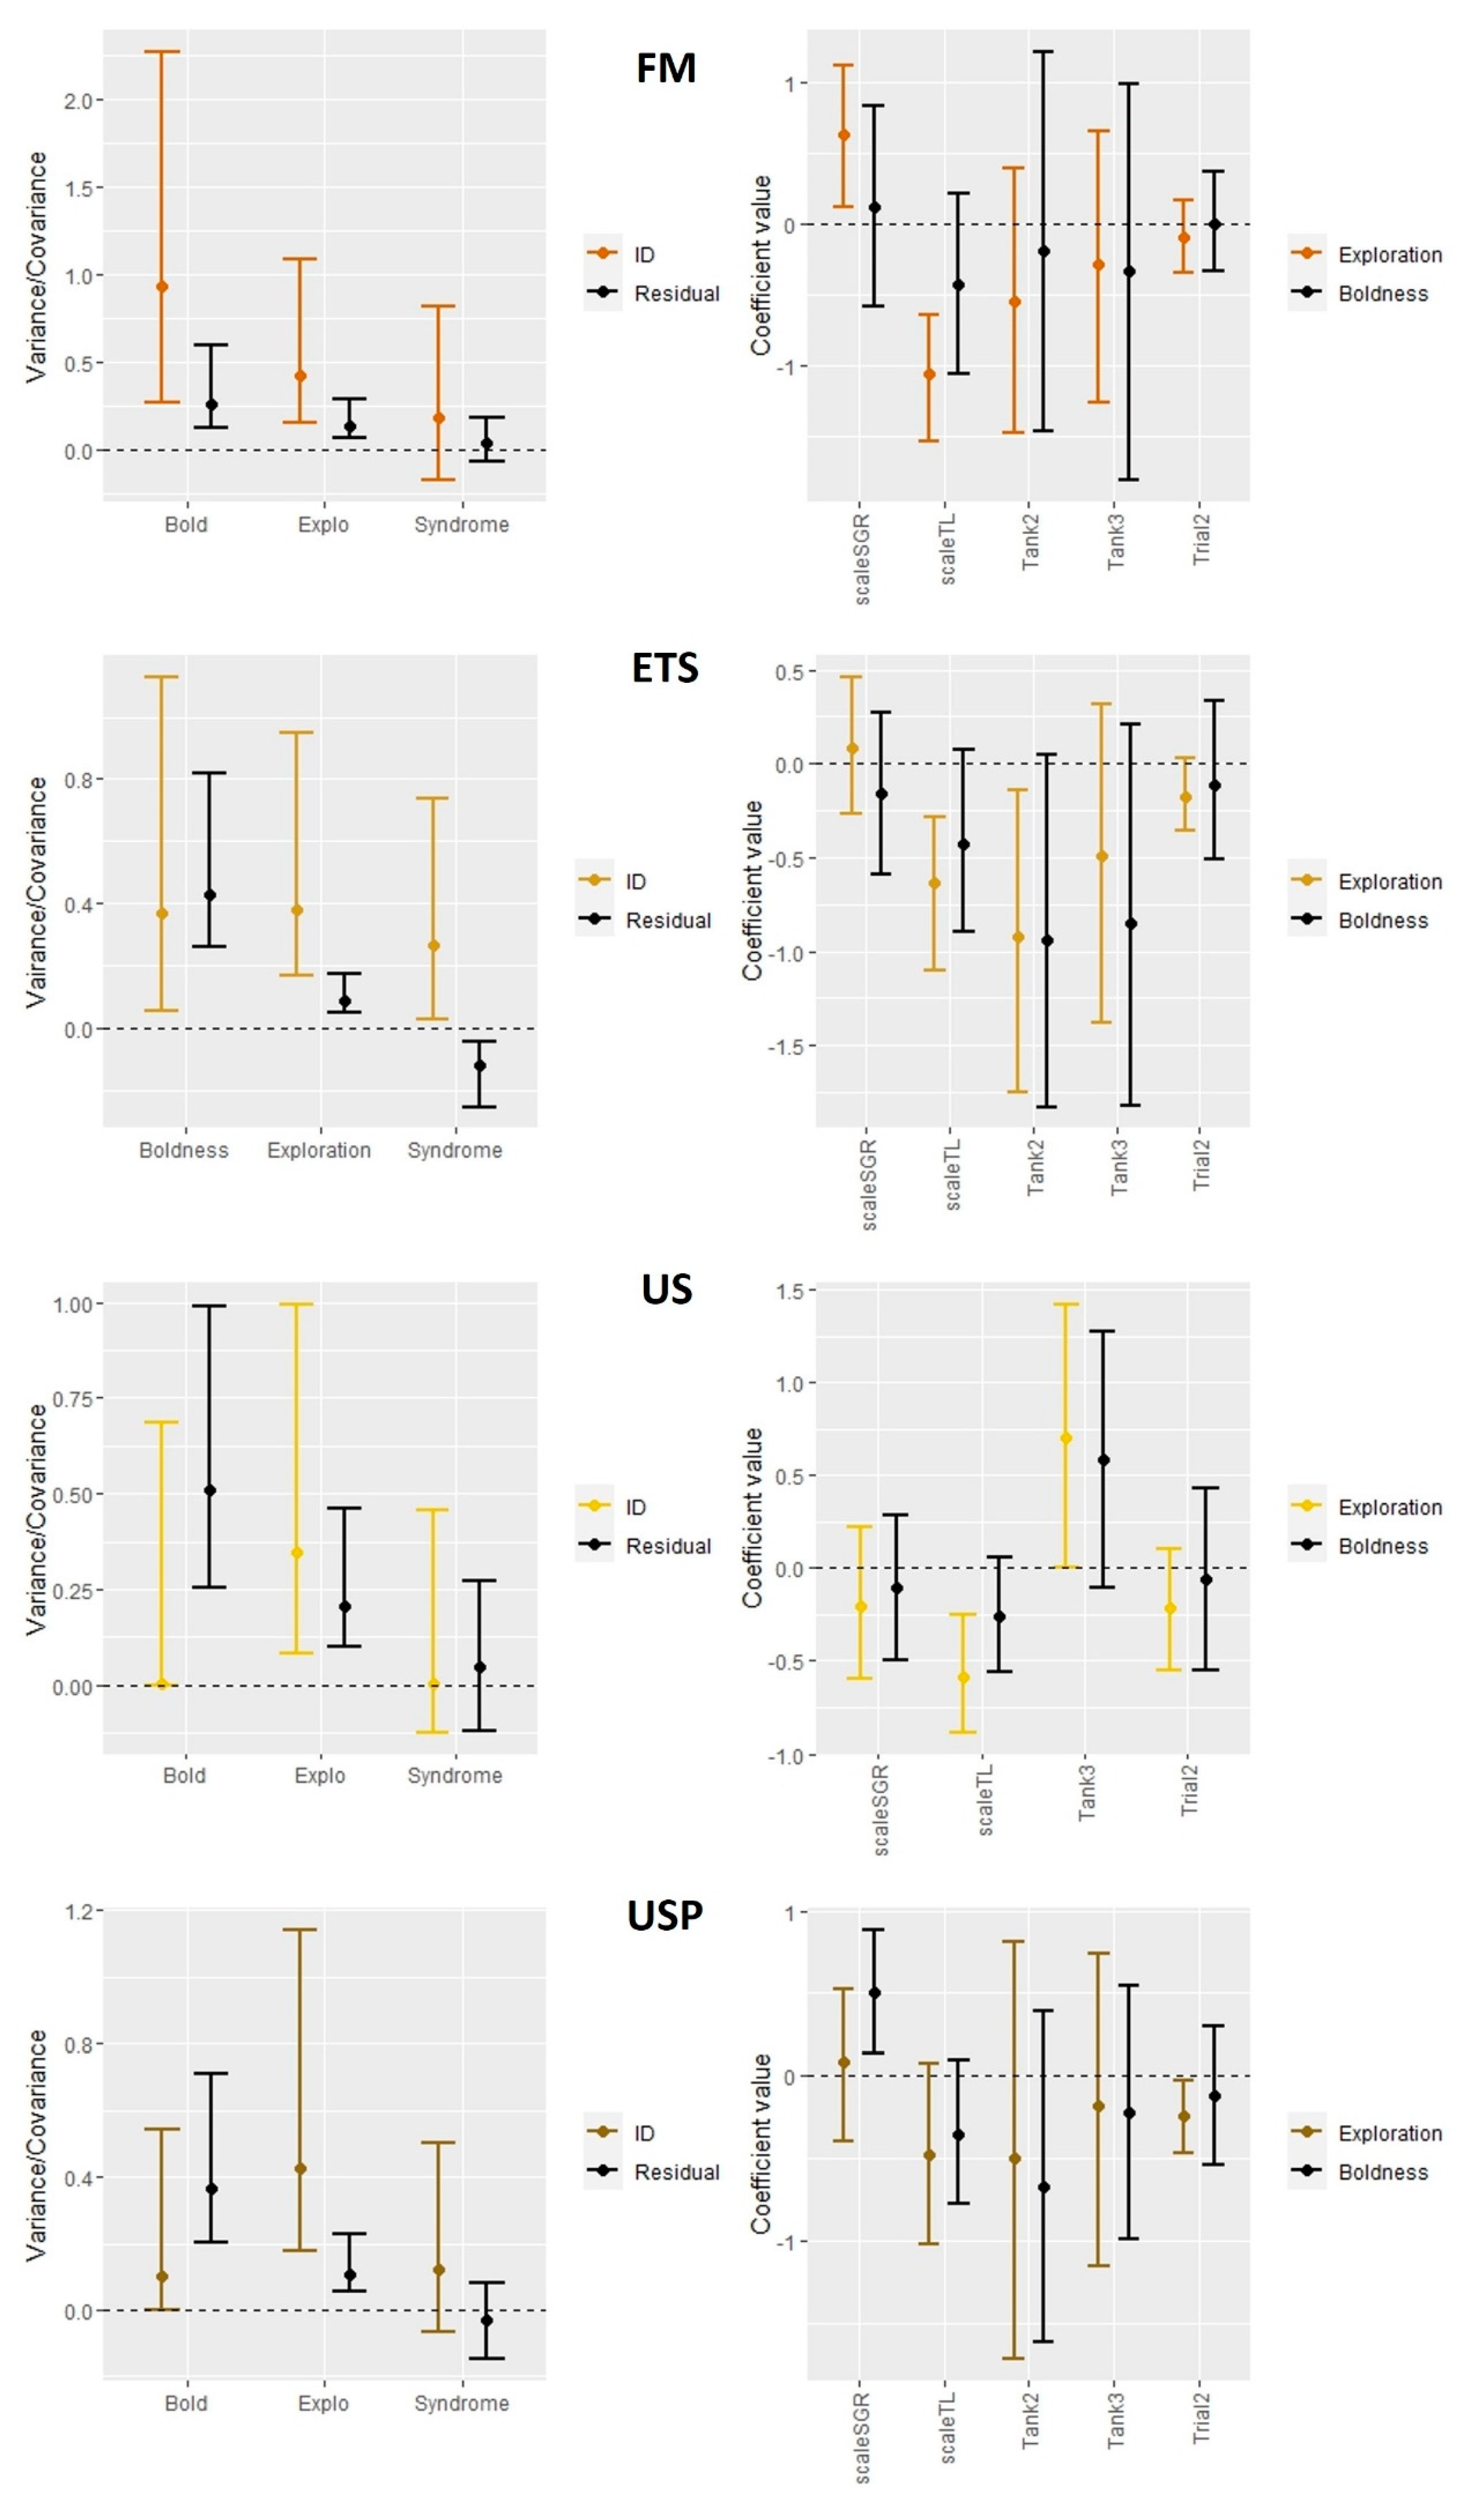
| Diet treatment | R | CI |
|---|---|---|
| FM | ||
| Boldness | 0.84 | [0.49-0.94] |
| Exploration | 0.82 | [0.52-0.94] |
| ETS | ||
| Boldness | 0.49 | [0.16-0.77] |
| Exploration | 0.84 | [0.64-0.94] |
| US | ||
| Boldness | 0.00 | [0.00-0.62] |
| Exploration | 0.72 | [0.30-0.89] |
| USP | ||
| Boldness | 0.30 | [0.00-0.61] |
| Exploration | 0.85 | [0.60-0.94] |
Disclaimer/Publisher’s Note: The statements, opinions and data contained in all publications are solely those of the individual author(s) and contributor(s) and not of MDPI and/or the editor(s). MDPI and/or the editor(s) disclaim responsibility for any injury to people or property resulting from any ideas, methods, instructions or products referred to in the content. |
© 2023 by the authors. Licensee MDPI, Basel, Switzerland. This article is an open access article distributed under the terms and conditions of the Creative Commons Attribution (CC BY) license (http://creativecommons.org/licenses/by/4.0/).


