Submitted:
04 July 2023
Posted:
06 July 2023
You are already at the latest version
Abstract
Keywords:
1. Introduction
2. Materials and Methods
2.1. Study Area
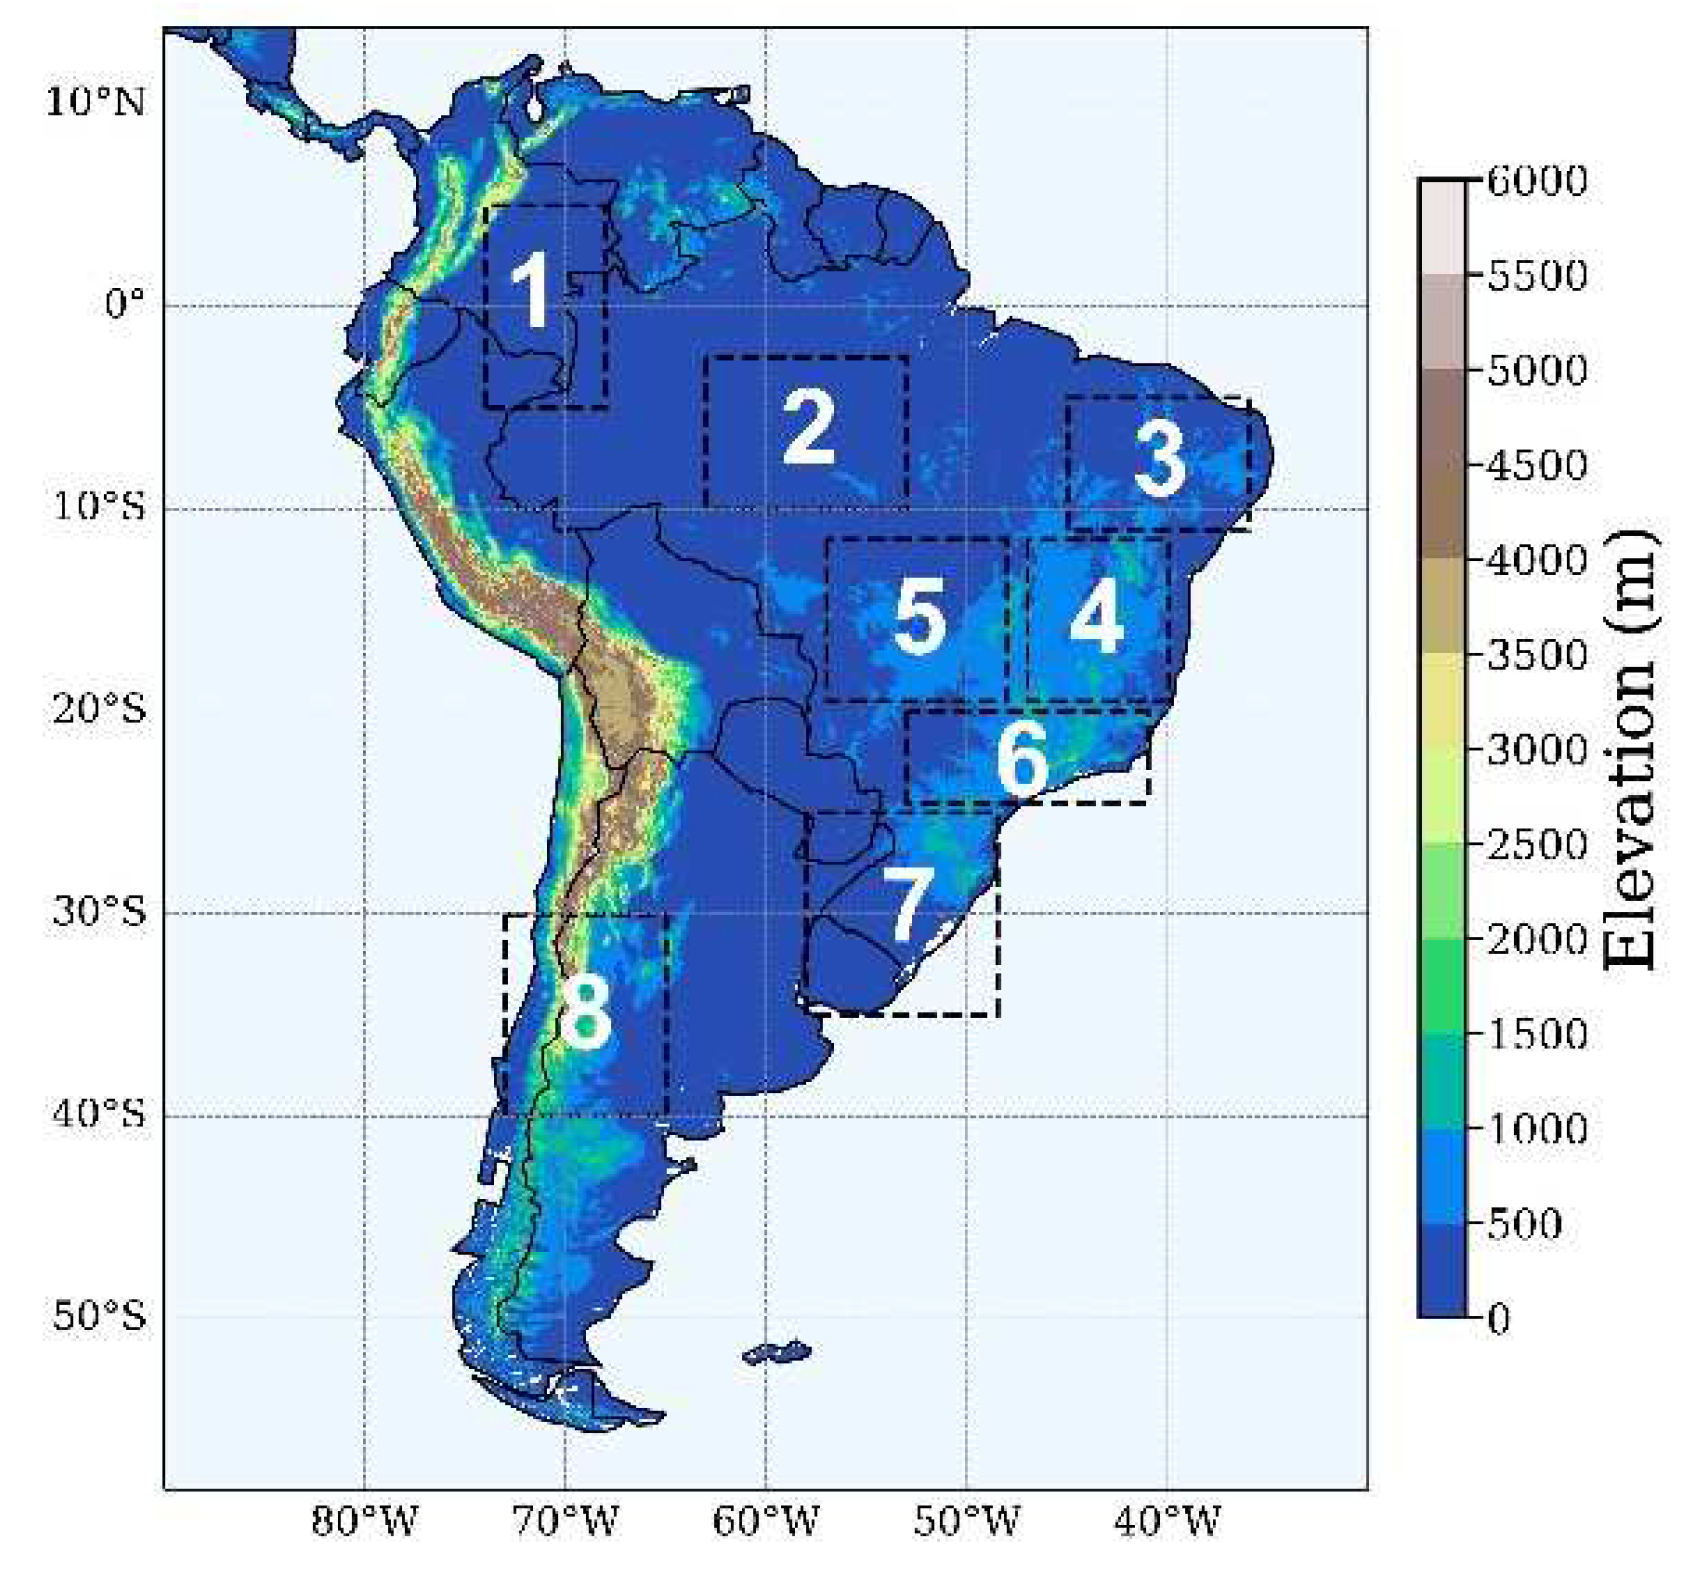
| Subdomain | Area |
|---|---|
| 1 | 5°N–5°S 68°W–74°W |
| 2 | 2.5°S–10°S 53°W–63°W |
| 3 | 4.5°S–11°S 36°W–45°W |
| 4 | 11.5°S–19.5°S 40°W–47°W |
| 5 | 11.5°S–19.5°S 48°W–57°W |
| 6 | 20°S–24.5°S 41°W–53°W |
| 7 | 25°S–35°S 48.5°W–58°W |
| 8 | 30°S–40°S 65°W–73°W |
2.2. CMIP6-GCMs Selection
| Model | Resolution (°Lat × °Lon) | Institute | Reference |
|---|---|---|---|
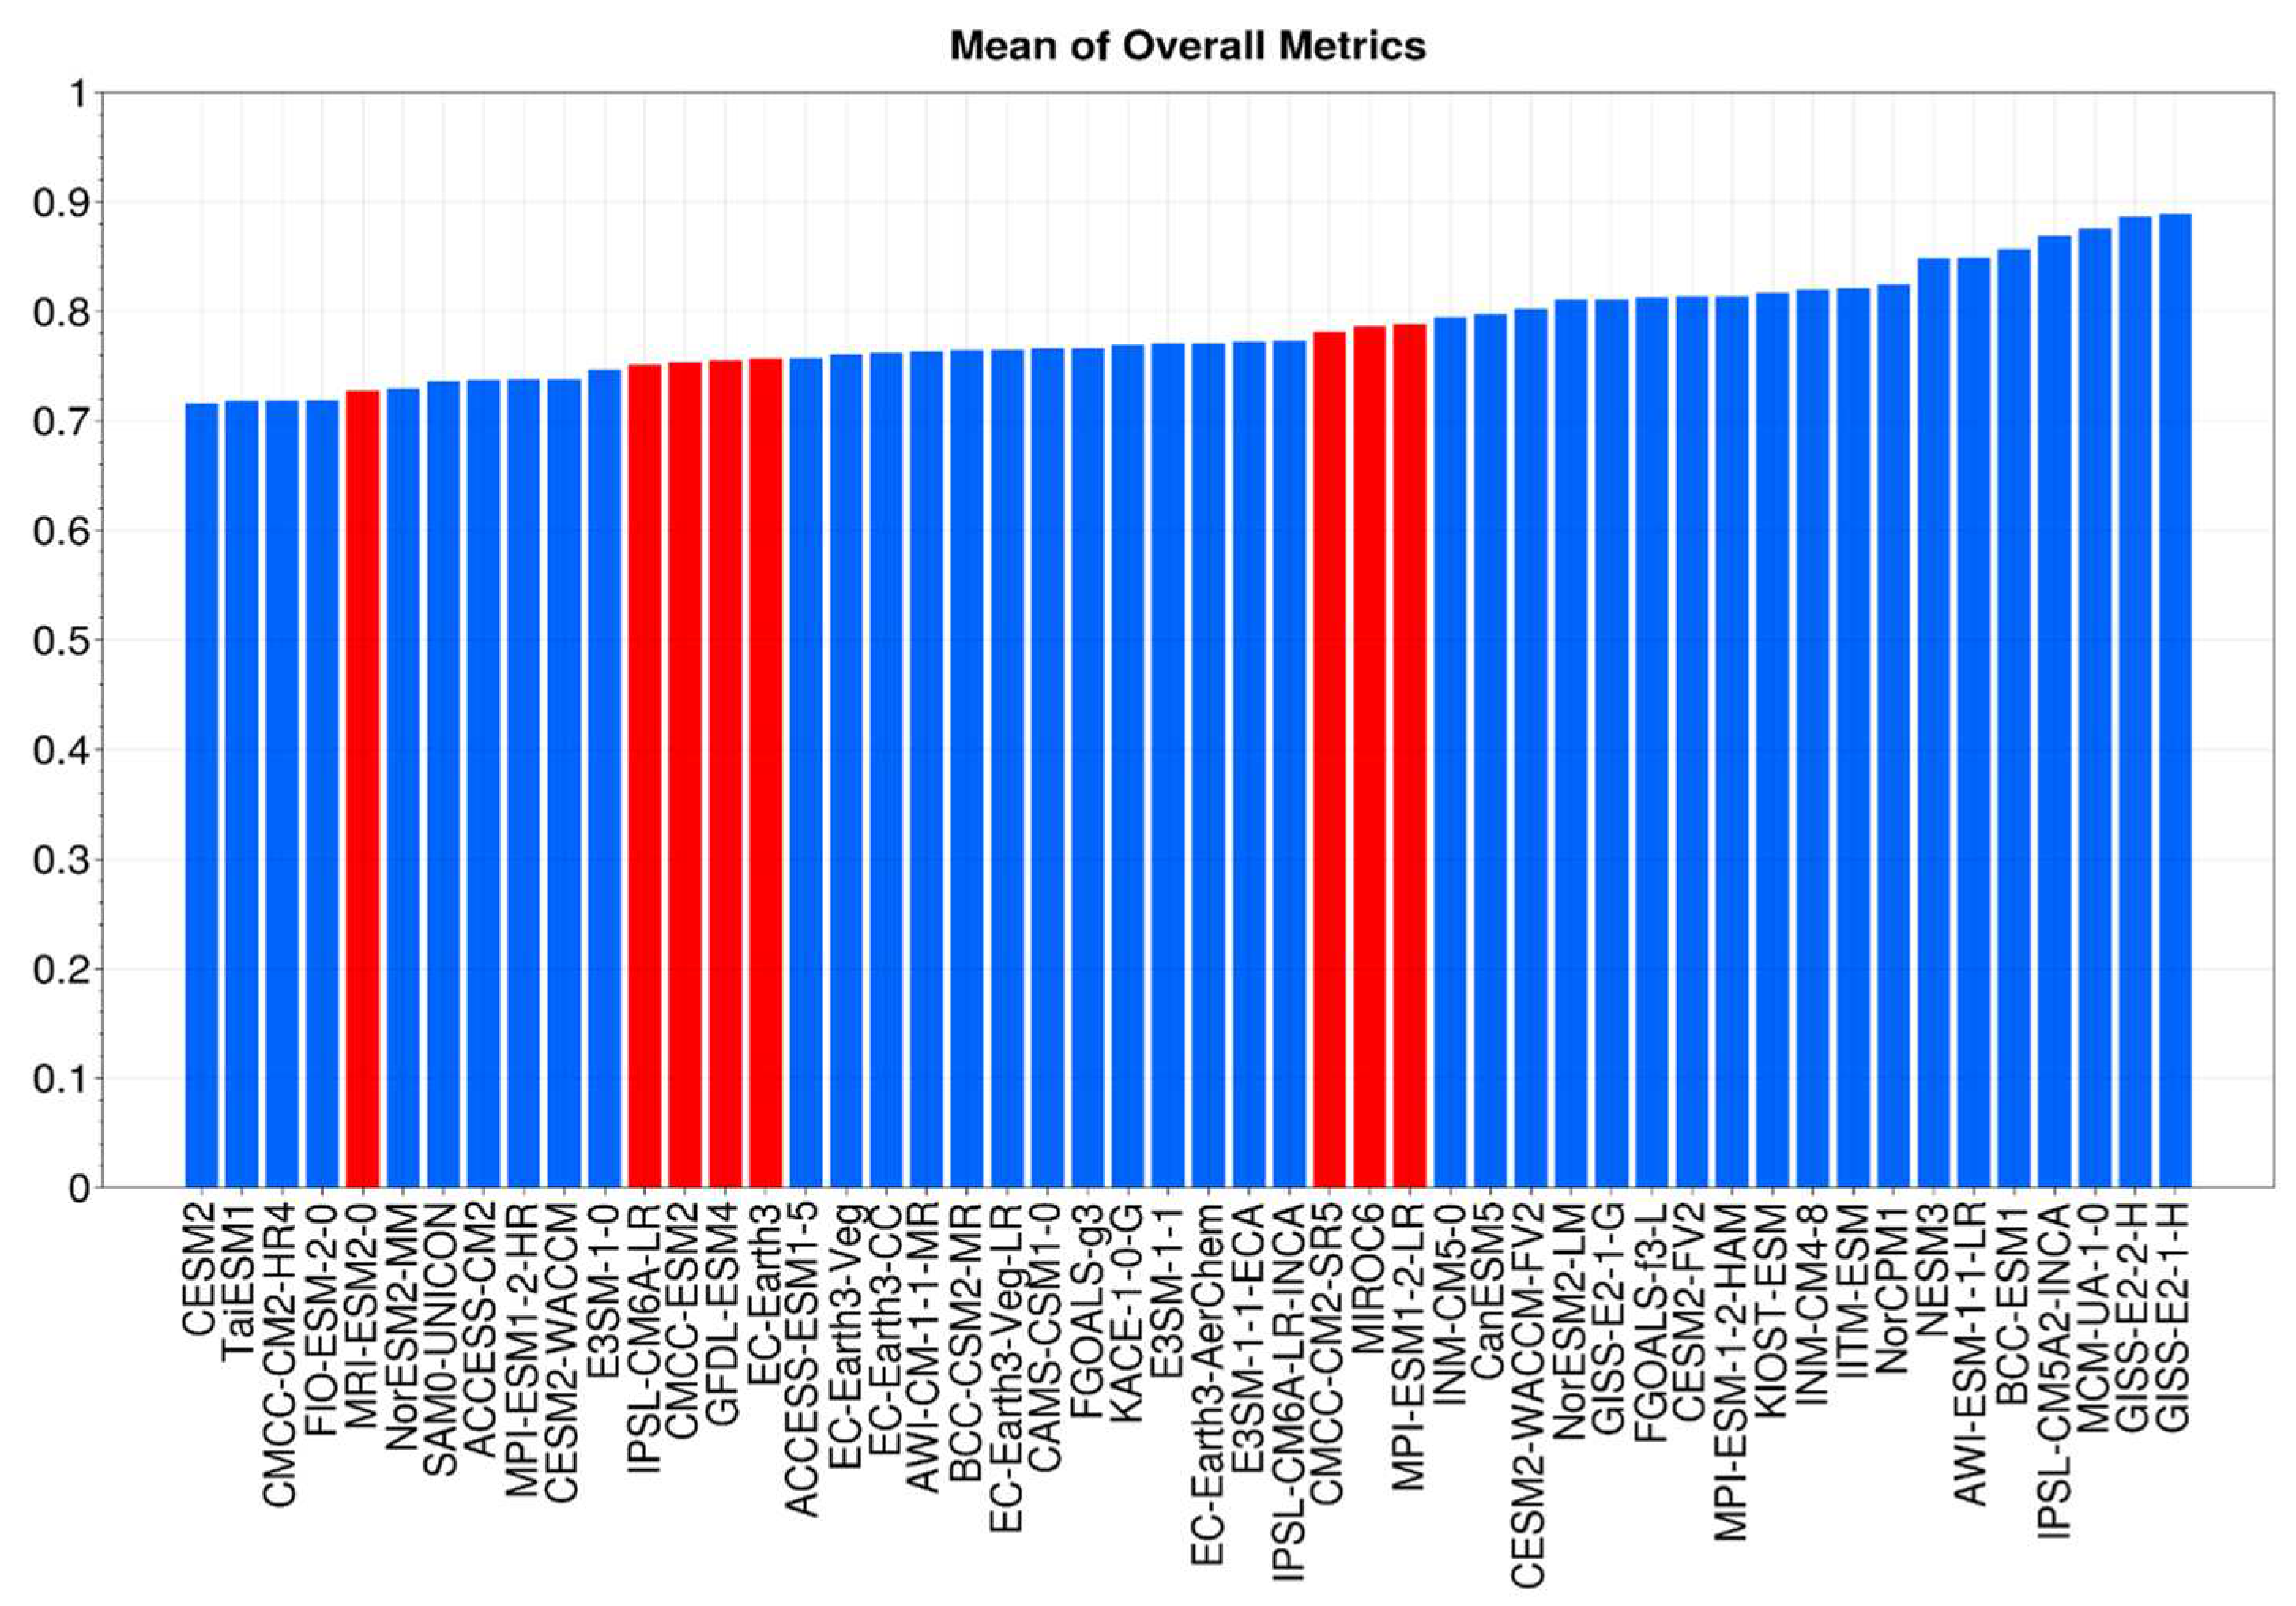
| CMCC-CM2-SR5 | 1.25 × 0.94 | Fondazione Centro Euro-Mediterraneo sui Cambiamenti Climatici | Lovato and Peano [102] |
| CMCC-ESM2 | 1.25 × 0.94 | Fondazione Centro Euro-Mediterraneo sui Cambiamenti Climatici | Lovato et al. [103] |
| EC-Earth3 | 0.70 × 0.70 | EC-Earth Consortium | Döscher et al. [104] |
| GFDL-ESM4 | 1.25 × 1.00 | Geophysical Fluid Dynamics Laboratory | Krasting et al. [105] |
| IPSL-CM6A-LR | 2.50 × 1.26 | Institut Pierre Simon Laplace | Boucher et al. [106] |
| MIROC6 | 1.41 × 1.41 | Japan Agency for Marine-Earth Science and Technology | Tatebe and Watanabe [107] |
| MPI-ESM1-2-LR | 0.94 × 0.94 | Max Planck Institute for Meteorology | Wieners et al. [108] |
| MRI-ESM2-0 | 1.13 × 1.13 | Meteorological Research Institute | Yukimoto et al. [109] |
2.3. Reference Dataset
2.4. Bias Correction and Statistical Downscaling
2.5. Test of Statistical Significance for the Difference in Climatological Mean Values
2.6. Standardized Precipitation Index (SPI)
3. Results and Discussion
3.1. Historical Simulations
3.2. BCSD Ensemble Projections of Precipitation under the SSP2-4.5 and SSP5-8.5 Forcing Scenarios
3.3. Temporal Series of the BCSD Ensemble SPI-12 Index under the SSP5-8.5 Forcing Scenario
3.4. Projections of Drought Parameters by the Bias-Corrected CMIP6-GCMs and BCSD Ensemble
4. Conclusions
Author Contributions
Funding
Institutional Review Board Statement
Informed Consent Statement
Data Availability Statement
Acknowledgments
Conflicts of Interest
References
- Intergovernmental Panel on Climate Change (IPCC). Summary for Policymakers. In: Climate Change 2023: Synthesis Report. A Report of the Intergovernmental Panel on Climate Change. Contribution of Working Groups I, II and III to the Sixth Assessment Report of the Intergovernmental Panel on Climate Change [Core Writing Team, H. Lee and J. Romero (eds.)]. IPCC, Geneva, Switzerland, 2023, 36 pages. Available online: https://www.ipcc.ch/report/ar6/syr/downloads/report/IPCC_AR6_SYR_SPM.pdf.
- United Nations Environment Programme (UNEP). Emissions Gap Report 2022: The Closing Window – Climate crisis calls for rapid transformation of societies. Nairobi. 2022. Available online: https://www.unep.org/emissions-gap-report-2022.
- Tavares, P.S.; Acosta, R.; Nobre, P.; Resende, N.C.; Chou, S.C.; Lyra, A.A. Water balance components and climate extremes over Brazil under 1.5 °C and 2.0 °C of global warming scenarios. Reg Environ Change 2023, 23, 40. [Google Scholar] [CrossRef] [PubMed]
- Panisset, J.S.; Libonati, R.; Gouveia, C.M.P.; Machado-Silva, F.; França, D.A.; França, J.R.A.; Peres, L.F. Contrasting patterns of the extreme drought episodes of 2005, 2010 and 2015 in the Amazon Basin. Int J Climatol 2018, 38, 1096–1104. [Google Scholar] [CrossRef]
- Gozzo, L.F.; Palma, D.S.; Custodio, M.S.; Machado, J.P. Climatology and trend of severe drought events in the state of Sao Paulo, Brazil, during the 20th century. Atmosphere 2019, 10, 190. [Google Scholar] [CrossRef]
- Gozzo, L.F.; Drumond, A.; Pampuch, L.A.; Ambrizzi, T.; Crespo, N.M.; Reboita, M.S.; Bier, A.A.; Carpenedo, C.B.; Bueno, P.G.; Pinheiro, H.R.; Custodio, M.S.; Kuki, C.A.C.; Tomaziello, A.C.N.; Gomes, H.B.; da Rocha, R.P.; Coelho, C.A.S. .; Pimentel, R.M. Intraseasonal drivers of the 2018 drought over São Paulo, Brazil. Front Clim 2022, 4. [Google Scholar] [CrossRef]
- Papalexiou, S.M.; Rajulapati, C.R.; Andreadis, K.M.; Foufoula-Georgiou, E.; Clark, M.P.; Trenberth, K.E. Probabilistic Evaluation of drought in CMIP6 simulations. Earth’s Future 2021, 9, e2021EF002150. [Google Scholar] [CrossRef] [PubMed]
- Medeiros, F.J.; Oliveira, C.P. Assessment of dry and heavy rainfall days and their projected changes over Northeast Brazil in Coupled Model Intercomparison Project Phase 6 models. Int J Climatol 2022, 42, 8665–8686. [Google Scholar] [CrossRef]
- Keellings, D.; Engström, J. The future of drought in the southeastern U.S.: Projections from downscaled CMIP5 models. Water 2019, 11, 259. [Google Scholar] [CrossRef]
- Swain, S.; Hayhoe, K. CMIP5 projected changes in spring and summer drought and wet conditions over North America. Clim Dyn 2015, 44, 2737–2750. [Google Scholar] [CrossRef]
- Cook, B.I.; Mankin, J.S.; Marvel, K.; Williams, A.P.; Smerdon, J.E.; Anchukaitis, K.J. Twenty-first century drought projections in the CMIP6 forcing scenarios. Earth’s Future 2020, 8, e2019EF001461. [Google Scholar] [CrossRef]
- Wu, C.; Yeh, P.J.-F.; Chen, Y.-Y.; Lv, W.; Hu, B.X.; Huang, G. Future precipitation-driven meteorological drought changes in the CMIP5 multimodel ensembles under 1.5 °C and 2 °C global warming. J Hydrometeorol 2020, 21, 2177–2196. [Google Scholar] [CrossRef]
- Wu, C.; Yeh, P.J.-F.; Chen, Y.-Y.; Lv, W.; Hu, B.X.; Huang, G. Copula-based risk evaluation of global meteorological drought in the 21st century based on CMIP5 multi-model ensemble projections. J Hydrol 2021, 598, 126265. [Google Scholar] [CrossRef]
- Wang, T.; Tu, X.; Singh, V.P.; Chen, X.; Lin, K. Global data assessment and analysis of drought characteristics based on CMIP6. J Hydrol 2021, 596, 126091. [Google Scholar] [CrossRef]
- Tam, B.Y.; Szeto, K.; Bonsal, B.; Flato, G.; Cannon, A.J.; Rong, R. CMIP5 drought projections in Canada based on the Standardized Precipitation Evapotranspiration Index. Can Water Resour J 2019, 44, 90–107. [Google Scholar] [CrossRef]
- Javadinejad, S.; Hannah, D.; Ostad-Ali-Askari, K.; Krause, S.; Zalewski, M.; Boogaard, F. The impact of future climate change and human activities on hydro-climatological drought, analysis and projections: Using CMIP5 climate model simulations. Water Conserv Sci Eng 2019, 4, 71–88. [Google Scholar] [CrossRef]
- Nguyen-Ngoc-Bich, P.; Phan-Van, T.; Ngo-Duc, T.; Vu-Minh, T.; Trinh-Tuan, L.; Tangang, F.T.; Juneng, L.; Cruz, F.; Santisirisomboon, J.; Narisma, G.; Aldrian, E. Projected evolution of drought characteristics in Vietnam based on CORDEX-SEA downscaled CMIP5 data. Int J Climatol 2021, 41, 5733–5751. [Google Scholar] [CrossRef]
- Coppola, E.; Raffaele, F.; Giorgi, F.; Giuliani, G.; Xuejie, G.; Ciarlo, J.M.; Sines, T.R.; Torres-Alavez, J.A.; Das, S.; di Sante, F.; Pichelli, E.; Glazer, R.; Müller, S.K.; Omar, S.A.; Ashfaq, M.; Bukovsky, M.; Im, E.-S.; Jacob, D.; Teichmann, C.; Remedio, A.; Remke, T.; Kriegsmann, A.; Bülow, K.; Weber, T.; Buntemeyer, L.; Sieck, K.; Rechid, D. Climate hazard indices projections based on CORDEX-CORE, CMIP5 and CMIP6 ensemble. Clim Dyn 2020, 57, 1293–1383. [Google Scholar] [CrossRef]
- Bouramdane, A.-A. Assessment of CMIP6 multi-model projections worldwide: Which regions are getting warmer and are going through a drought in Africa and Morocco? What changes from CMIP5 to CMIP6? Sustainability 2023, 15, 690. [Google Scholar] [CrossRef]
- Betts, R.A.; Alfieri, L.; Bradshaw, C.; Caesar, J.; Feyen, L.; Friedlingstein, P.; Gohar, L.; Koutroulis, A.; Lewis, K.; Morfopoulos, C.; Papadimitriou, L.; Richardson, K.J.; Tsanis, I.; Wyser, K. Changes in climate extremes, fresh water availability and vulnerability to food insecurity projected at 1.5 °C and 2 °C global warming with a higher-resolution global climate model. Phil Trans R Soc A 2018, 376, 20160452. [Google Scholar] [CrossRef] [PubMed]
- Campozano, L.; Ballari, D.; Montenegro, M.; Avilés, A. Future meteorological droughts in Ecuador: Decreasing trends and associated spatio-temporal features derived from CMIP5 models. Front Earth Sci 2020, 8. [Google Scholar] [CrossRef]
- Marengo, J.A.; Cunha, A.P.M.A.; Nobre, C.A.; Ribeiro Neto, G.G.; Magalhaes, A.R.; Torres, R.R.; Sampaio, G.; Alexandre, F.; Alves, L.M.; Cuartas, L.A.; Deusdará, K.R.L.; Álvala, R.C.S. Assessing drought in the drylands of northeast Brazil under regional warming exceeding 4 °C. Nat Hazards 2020, 103, 2589–2611. [Google Scholar] [CrossRef]
- Reboita, M.S.; Kuki, C.A.C.; Marrafon, V.H.; Souza, C.A.; Ferreira, G.W.S.; Teodoro, T.; Lima, J.W.M. South America climate change revealed through climate indices projected by GCMs and Eta-RCM ensembles. Clim Dyn 2021, 58, 459–485. [Google Scholar] [CrossRef]
- Reboita, M.S.; da Rocha, R.P.; Souza, C.A.; Baldoni, T.C.; Silva, P.L.L.S.; Ferreira, G.W.S. Future projections of extreme precipitation climate indices over South America based on CORDEX-CORE multimodel ensemble. Atmosphere 2022, 13, 1463. [Google Scholar] [CrossRef]
- Gouveia, C.D.; Torres, R.R.; Marengo, J.A.; Avila-Diaz, A. Uncertainties in projections of climate extremes indices in South America via Bayesian inference. Int J Climatol 2022, 42, 7362–7382. [Google Scholar] [CrossRef]
- Marengo, J.A.; Alves, L.M.; Alvala, R.C.S.; Cunha, A.P.; Brito, S.; Moraes, O.L.L. Climatic characteristics of the 2010-2016 drought in the semi-arid Northeast Brazil region. An Acad Bras Ciênc 2018, 90, 1973–1985. [Google Scholar] [CrossRef]
- Marengo, J.A.; Torres, R.R.; Alves, L.M. Drought in Northeast Brazil: Past, present, and future. Theor Appl Climatol 2016, 129, 1189–1200. [Google Scholar] [CrossRef]
- Marengo, J.A.; Galdos, M.V.; Challinor, A.; Cunha, A.P.; Marin, F.R.; Vianna, M.S.; Alvala, R.C.S.; Alves, L.M.; Moraes, O.L.; Bender, F. Drought in Northeast Brazil: A review of agricultural and policy adaptation options for food security. Climate Res Sustain 2022, 1, e17. [Google Scholar] [CrossRef]
- Cavalcanti, I.F.A.; Kousky, V.E. Drought in Brazil during summer and fall 2001 and associated atmospheric circulation features. Revista Climanálise 2001, 1. Available online: http://climanalise.cptec.inpe.br/~rclimanl/revista/pdf/criseing.pdf.
- Seth, A.; Fernandes, K.; Camargo, S.J. Two summers of São Paulo drought: Origins in the western tropical Pacific. Geophys Res Lett 2015, 42, 10816–10823. [Google Scholar] [CrossRef]
- Nobre, C.A.; Marengo, J.A; Seluchi, M.E.; Cuartas, A.; Alves, L.M. Some characteristics and impacts of the drought and water Crisis in southeastern Brazil during 2014 and 2015. J Water Resour Prot 2016, 8, 252–262. [Google Scholar] [CrossRef]
- Coelho, C.A.S.; Oliveira, C.P.; Ambrizzi, T.; Reboita, M.S.; Carpenedo, C.B.; Campos, J.L.P.S.; Tomaziello, A.C.N.; Pampuch, L.A.; Custódio, M.S.; Dutra, L.M.M.; da Rocha, R.P.; Rehbein, A. The 2014 southeast Brazil austral summer drought: regional scale mechanisms and teleconnections. Clim Dyn 2016, 46, 3737–3752. [Google Scholar] [CrossRef]
- Abatan, A.A.; Tett, S.F.B.; Dong, B.; Cunningham, C.; Rudorff, C.M.; Klingaman, N.P.; de Abreu, R.C. Drivers and physical processes of drought events over the state of São Paulo, Brazil. Clim Dyn 2022, 58, 3105–3119. [Google Scholar] [CrossRef]
- Geirinhas, J.L.; Russo, A.C.; Libonati, R.; Miralles, D.G.; Sousa, P.M.; Wouters, H.; Trigo, R.M. The influence of soil dry-out on the record-breaking hot 2013/2014 summer in Southeast Brazil. Sci Reports 2022, 12, 5836. [Google Scholar] [CrossRef]
- Cuartas, L.A.; Cunha, A.P.M.A.; Alves, J.A.; Parra, L.M.P.; Deusdará-Leal, K.; Costa, L.C.O.; Molina, R.D.; Amore, D.; Broedel, E.; Seluchi, M.E.; Cunningham, C.; Alvalá, R.C.S.; Marengo, J.A. Recent hydrological droughts in Brazil and their impact on hydropower generation. Water 2022, 14, 601. [Google Scholar] [CrossRef]
- Coelho, C.A.S.; Cardoso, D.H.F.; Firpo, M.A.F. Precipitation diagnostics of an exceptionally dry event in São Paulo, Brazil. Theor Appl Climatol 2016, 125, 769–784. [Google Scholar] [CrossRef]
- Marengo, J.A.; Espinoza, J.C. Extreme seasonal droughts and floods in Amazonia: Causes, trends and impacts. Int J Climatol 2016, 36, 1033–1050. [Google Scholar] [CrossRef]
- Agudelo, J.; Arias, P.A.; Vieira, S.C.; Martínez, J.A. Influence of longer dry seasons in the Southern Amazon on patterns of water vapor transport over northern South America and the Caribbean. Clim Dyn 2019, 52, 2647–2665. [Google Scholar] [CrossRef]
- Lovejoy, T.E.; Nobre, C. Amazon tipping point: Last chance for action. Sci Adv 2019, 5, eaba2949. [Google Scholar] [CrossRef] [PubMed]
- Jimenez, J.C.; Marengo, J.A.; Alves, L.M.; Sulca, J.C.; Takahashi, K.; Ferrett, S.; Collins, M. The role of ENSO flavours and TNA on recent droughts over Amazon forests and the Northeast Brazil region. Int J Climatol 2021, 41, 3761–3780. [Google Scholar] [CrossRef]
- Guimberteau, M.; Ronchail, J.; Espinoza, J.C.; Lengaigne, M.; Sultan, B.; Polcher, J.; Drapeau, G.; Guyot, J.-L.; Ducharne, A.; Ciais, P. Future changes in precipitation and impacts on extreme streamflow over Amazonian sub-basins. Environ Res Lett 2013, 8, 014035. [Google Scholar] [CrossRef]
- Duffy, P.B.; Brando, P.; Asner, G.P.; Field, C.B. Projections of future meteorological drought and wet periods in the Amazon. Proc Natl Acad Sci USA 2015, 112, 43. [Google Scholar] [CrossRef]
- Boulton, C.A.; Lenton, T.M.; Boers, N. Pronounced loss of Amazon rainforest resilience since the early 2000s. Nat Clim Chang 2022, 12, 271–278. [Google Scholar] [CrossRef]
- Borges, P.A.; Bernhofer, C.; Rodrigues, R. Extreme rainfall indices in Distrito Federal, Brazil: Trends and links with El Niño southern oscillation and Madden–Julian oscillation. Int J Climatol 2018, 38, 4550–4567. [Google Scholar] [CrossRef]
- Thielen, D.; Schuchmann, K.-L.; Ramoni-Perazzi, P.; Marquez, M.; Rojas, W.; Quintero, J.I.; Marques, M.I. Quo vadis Pantanal? Expected precipitation extremes and drought dynamics from changing sea surface temperature. PLoS ONE 2020, 15, e0227437. [Google Scholar] [CrossRef]
- Marengo, J.A.; Cunha, A.P.; Cuartas, L.A.; Deusdará-Leal, K.R.; Broedel, E.; Seluchi, M.E.; Michelin, C.M.; Baião, C.F.P.; Ângulo, E.C.; Almeida, E.K.; Kazmierczak, M.L.; Mateus, N.P.A.; Silva, R.C.; Bender, F. Extreme drought in the Brazilian Pantanal in 2019–2020: Characterization, causes, and impacts. Front Water 2021, 3. [Google Scholar] [CrossRef]
- Cunha, A.P.M.A.; Zeri, M.; Deusdará-Leal, K.; Costa, L.; Cuartas, L.A.; Marengo, J.A.; Tomasella, J.; Vieira, R.M.; Barbosa, A.A.; Cunningham, C.; Garcia, J.V.C.; Broedel, E.; Alvalá, R.; Ribeiro-Neto, R. Extreme drought events over Brazil from 2011 to 2019. Atmosphere 2019, 10, 642. [Google Scholar] [CrossRef]
- Fernandes, V.R.; Cunha, A.P.M.A.; Pineda, L.A.C.; Leal, K.R.D.; Costa, L.C.O.; Broedel, E.; França, D.A.; Alvalá, R.C.S.; Seluchi, M.E.; Marengo, J.A. Secas e os impactos na região sul do Brasil. Rev Bras Climatol 2021, 28, 561–584. [Google Scholar] [CrossRef]
- Müller, O.V.; Berbery, E.H.; Alcaraz-Segura, D.; Ek, M.B. Regional model simulations of the 2008 drought in southern South America using a consistent set of land surface properties. J Clim 2014, 27, 6754–6778. [Google Scholar] [CrossRef]
- Sgroi, L.C.; Lovino, M.A.; Berbery, E.H.; Müller, G.V. Characteristics of droughts in Argentina’s core crop region. Hydrol Earth Syst Sci 2021, 25, 2475–2490. [Google Scholar] [CrossRef]
- Lovino, M.A.; Müller, O.V.; Berbery, E.H.; Müller, G.V. How have daily climate extremes changed in the recent past over northeastern Argentina? Glob Planet Change 2018, 168, 78–97. [Google Scholar] [CrossRef]
- Olmo, M.; Bettolli, M.L.; Rusticucci, M. Atmospheric circulation influence on temperature and precipitation individual and compound daily extreme events: Spatial variability and trends over southern South America. Weather Clim Extremes 2020, 29, 100267. [Google Scholar] [CrossRef]
- Lovino, M.A.; Müller, G.V.; Pierrestegui, M.J.; Espinosa, E.; Rodríguez, L. Extreme precipitation events in the Austral Chaco region of Argentina. Int J Climatol 2022, 42, 5985–6006. [Google Scholar] [CrossRef]
- Collazo, S. Barrucand, M.; Rusticucci, M. Evaluation of CMIP6 models in the representation of observed extreme temperature indices trends in South America. Clim Change 2022, 172, 21. [Google Scholar] [CrossRef]
- Balmaceda-Huarte, R.; Olmo, M.E.; Bettolli, M.L.; Poggi, M.M. Evaluation of multiple reanalyses in reproducing the spatio-temporal variability of temperature and precipitation indices over southern South America. Int J Climatol 2021, 41, 5572–5595. [Google Scholar] [CrossRef]
- Freitas, A.A.; Reboita, M.S.; Carvalho, V.S.B.; Drumond, A.; Ferraz, S.E.T.; Silva, B.C.; da Rocha, R.P. Atmospheric and oceanic patterns associated with extreme drought events over the Paraná Hydrographic Region, Brazil. Climate 2023, 11, 12. [Google Scholar] [CrossRef]
- McKee, T.B.; Doesken, N.J.; Kleist, J. The relationship of drought frequency and duration to time scales. In Proceedings of the 8th Conference on Applied Climatology; 1993; pp. 179–183. Available online: https://climate.colostate.edu/pdfs/relationshipofdroughtfrequency.pdf.
- Freitas, A.A.; Drumond, A.; Carvalho, V.S.B.; Reboita, M.S.; Silva, B.C.; Uvo, C.B. Drought assessment in São Francisco River Basin, Brazil: Characterization through SPI and associated anomalous climate patterns. Atmosphere 2022, 13, 41. [Google Scholar] [CrossRef]
- World Meteorological Organization (WMO). Standardized Precipitation Index user guide. WMO-No. 1090, 2012, Geneva.
- Brito, S.S.B.; Cunha, A.P.M.; Cunningham, C.C.; Alvalá, R.C.; Marengo, J.A.; Carvalho, M.A. Frequency, duration and severity of drought in the Semiarid Northeast Brazil region. Int J Climatol 2017, 38, 517–529. [Google Scholar] [CrossRef]
- Santos, S.R.Q.; Braga, C.C.; Sansigolo, C.A.; Santos, A.P.P. Determinação de regiões homogêneas do índice de precipitação normalizada (SPI) na Amazônia Oriental. Rev Bras Meteorol 2017, 32, 111–122. [Google Scholar] [CrossRef]
- Oliveira-Júnior, J.F.; Gois, G.; Terassi, P.M.B.; Silva Junior, C.A.; Blanco, C.J.C.; Sobral, B.S.; Gasparini, K.A.C. Drought severity based on the SPI index and its relation to the ENSO and PDO climatic variability modes in the regions North and Northwest of the State of Rio de Janeiro-Brazil. Atmos Res 2018, 212, 91–105. [Google Scholar] [CrossRef]
- Pereira, V.R.; Blain, G.C.; Avila, A.M.; Pires, R.C.; Pinto, H.S. Impacts of climate change on drought: Changes to drier conditions at the beginning of the crop growing season in southern Brazil. Bragantia 2018, 77, 201–211. [Google Scholar] [CrossRef]
- Cunha, A.P.M.A.; Zeri, M.; Leal, K.D.; Costa, L.; Cuartas, L.A.; Marengo, J.A.; Tomasella, J.; Vieira, R.M.; Barbosa, A.A.; Cunningham, C.; Garcia, J.V.C.; Broedel, E.; Alvalá, R.; Ribeiro-Neto, G. Extreme drought events over Brazil from 2011 to 2019. Atmosphere 2019, 10, 642. [Google Scholar] [CrossRef]
- Costa, M.D.S.; Oliveira-Júnior, J.F.D.; Santos, P.J.D.; Correia Filho, W.L.F.; Gois, G.D.; Blanco, C.J.C.; Teodoro, P.E.; Silva Junior, C.A.; Santiago, D.B.; Souza, E.O.; Jardim, A.M.R.F. Rainfall extremes and drought in Northeast Brazil and its relationship with El Niño–Southern Oscillation. Int J Climatol 2020, 41, E2111–E2135. [Google Scholar] [CrossRef]
- Silva, D.F.; Lima, M.J.S.; Souza Neto, P.F.; Gomes, H.B.; Silva, F.D.S.; Almeida, H.R.R.C.; Pereira, M.P.S.; Costa, R.L. Caracterização de eventos extremos e de suas causas climáticas com base no índice padronizado de precipitação para o leste do Nordeste. Rev Bras Geogr Fis 2020, 13, 449–464. [Google Scholar] [CrossRef]
- Xavier, L.C.P.; Silva, S.M.O.D.; Carvalho, T.M.N.; Pontes Filho, J.D.; Souza Filho, F.D.A.D. Use of machine learning in evaluation of drought perception in irrigated agriculture: The case of an irrigated perimeter in Brazil. Water 2020, 12, 1546. [Google Scholar] [CrossRef]
- Avila-Diaz, A.; Torres, R.R.; Zuluaga, C.F.; Cerón, W.L.; Oliveira, L.; Benezoli, V.; Rivera, I.A.; Marengo, J.A.; Wilson, A.B.; Medeiros, F. Current and future climate extremes over Latin America and Caribbean: Assessing Earth System Models from High Resolution Model Intercomparison Project (HighResMIP). Earth Syst Environ 2023, 7, 99–130. [Google Scholar] [CrossRef] [PubMed]
- Eyring, V.; Bony, S.; Meehl, G.A.; Senior, C.A.; Stevens, B.; Stouffler, R.J.; Taylor, K.E. Overview of the global coupled model intercomparison project phase 6 (CMIP6) experimental design and organization. Geosci Model Dev 2016, 9, 1937–1958. [Google Scholar] [CrossRef]
- Riahi, K.; van Vuuren, D.P.; Kriegler, E.; Edmonds, J.; O’Neill, B.C.; Fujimori, S.; Bauer, N.; Calvin, K.; Dellink, R.; Fricko, O.; Lutz, W.; Popp, A.; Cuaresma, J.C.; Samir, K.C.; Leimbach, M.; Jiang, L.; Kram, T.; Rao, S.; Emmerling, J.; Ebi, K.; Hasegawa, T.; Havlik, P.; Humpenöder, F.; da Silva, L.A.; Smith, S.; Stehfest, E.; Bosetti, V.; Eom, J.; Gernaat, D.; Masui, T.; Rogelj, J.; Strefler, J.; Drouet, L.; Krey, V.; Luderer, G.; Harmsen, M.; Takahashi, K.; Baumstark, L.; Doelman, J.C.; Kainuma, M.; Klimont, Z.; Marangoni, G.; Lotze-Campen, H.; Obersteiner, M.; Tabeau, A.; Tavoni, M. The Shared Socio-economic Pathways and their energy, land use, and greenhouse gas emissions implications: A review. Glob Environ Change 2017, 42, 153–168. [Google Scholar] [CrossRef]
- Carvalho, D.; Rocha, A.; Costoya, X.; de Castro, M.; Gómez-Gesteira, M. Wind energy resource over Europe under CMIP6 future climate projections: What changes from CMIP5 to CMIP6. Renew Sustain Energy Rev 2021, 151, 111594. [Google Scholar] [CrossRef]
- Fowler, H.J.; Blenkisop, S.; Tebaldi, C. Linking climate change modelling to impacts studies: recent advances in downscaling techniques for hydrological modelling. Int J Climatol 2007, 27, 1547–1578. [Google Scholar] [CrossRef]
- Ambrizzi, T.; Reboita, M.S.; da Rocha, R.P.; Llopart, M. The state of the art and fundamental aspects of regional climate modeling in South America. Ann NY Acad Sci 2019, 1436, 98–120. [Google Scholar] [CrossRef]
- Mutz, S.G.; Scherrer, S.; Muceniece, I.; Ehlers, T.A. Twenty-first century regional temperature response in Chile based on empirical-statistical downscaling. Clim Dyn 2021, 56, 2881–2894. [Google Scholar] [CrossRef]
- da Rocha, R.P.; Morales, C.A.; Cuadra, S.V.; Ambrizzi, T. Precipitation diurnal cycle and summer climatology assessment over South America: An evaluation of Regional Climate Model version 3 simulations. J Geophys Res Atmos 2009, 114, D10. [Google Scholar] [CrossRef]
- Marengo, J.A.; Chou, S.C.; Kay, G.; Alves, L.M.; Pesquero, J.F.; Soares, W.R.; Santos, D.C. , Lyra, A.A.; Sueiro, G.; Betts, R.; Chagas, D.J.; Gomes, J.L.; Bustamante, J.F.; Tavares, P. Development of regional future climate change scenarios in South America using the Eta CPTEC/HadCM3 climate change projections: Climatology and regional analyses for the Amazon, São Francisco and the Paraná River basins. Clim Dyn 2012, 38, 1829–1848. [Google Scholar] [CrossRef]
- Chou, S.C.; Lyra, A.; Mourão, C.; Dereczynski, C.; Pilotto, I.; Gomes, J.; Bustamante, J.; Tavares, P.; Silva, A.; Rodrigues, D.; Campos, D.; Chagas, D.; Sueiro, G.; Siqueira, G.; Nobre, P.; Marengo, J. Evaluation of the Eta simulations nested in three global climate models. Am J Clim Change 2014, 3, 438–454. [Google Scholar] [CrossRef]
- Reboita, M.S.; da Rocha, R.P.; Dias, C.G.; Ynoue, R.Y. Climate projections for South America: RegCM3 driven by HadCM3 and ECHAM5. Adv Meteorol 2014, 2014, 376738. [Google Scholar] [CrossRef]
- Reboita, M.S.; Dutra, L.M.M.; Dias, C.G. Diurnal cycle of precipitation simulated by RegCM4 over South America: Present and future scenarios. Clim Res 2016, 70, 39–55. [Google Scholar] [CrossRef]
- Reboita, M.S.; Amaro, T.R.; de Souza, M.R. Winds: Intensity and power density simulated by RegCM4 over South America in present and future climate. Clim Dyn 2018, 51, 187–205. [Google Scholar] [CrossRef]
- Solman, S.A.; Blázquez, J. Multiscale precipitation variability over South America: Analysis of the added value of CORDEX RCM simulations. Clim Dyn 2019, 53, 1547–1565. [Google Scholar] [CrossRef]
- Dereczynski, C.; Chou, S.C.; Lyra, A.; Sondermann, M.; Regoto, P.; Tavares, P.; Chagas, D.; Gomes, J.L.; Rodrigues, D.C.; Skansi, M.M. Downscaling of climate extremes over South America – Part I: Model evaluation in the reference climate. Weather Clim Extremes 2020, 29, 100273. [Google Scholar] [CrossRef]
- Solman, S.A.; Bettolli, M.L.; Doyle, M.E.; Olmo, M.E.; Feijoo, M.; Martinez, D.; Blázquez, J.; Balmaceda-Huarte, R. Evaluation of multiple downscaling tools for simulating extreme precipitation events over southeastern South America: A case study approach. Clim Dyn 2021, 57, 1241–1264. [Google Scholar] [CrossRef]
- Silva, N.P.; Crespo, N.M.; Kaufmann, C.L.G.; Lima, J.A.M.; Andrioni, M.; Camargo, R.; da Rocha, R.P. Adjustment of extreme wind speed in regional climate downscaling over southwestern South Atlantic. Int J Climatol 2022, 42, 9994–10008. [Google Scholar] [CrossRef]
- Silva, M.L.; Oliveira, C.P.; Silva, C.M.S.; Araújo, J.M. Dynamic downscaling of climate simulations and projected changes in tropical South America using RegCM4.7. Int J Climatol 2023. Early View. [Google Scholar] [CrossRef]
- Bettolli, M.L.; Penalba, O.C. Statistical downscaling of daily precipitation and temperatures in southern La Plata Basin. Int J Climatol 2018, 38, 3705–3722. [Google Scholar] [CrossRef]
- Sulca, J.; Vuille, M.; Timm, O.E.; Dong, B.; Zubieta, R. Empirical–statistical downscaling of austral summer precipitation over South America, with a focus on the Central Peruvian Andes and the Equatorial Amazon Basin. J Appl Meteorol Climatol 2021, 60, 65–85. [Google Scholar] [CrossRef]
- Balmaceda-Huarte, R.; Bettolli, M.L. Assessing statistical downscaling in Argentina: Daily maximum and minimum temperatures. Int J Climatol 2022, 42, 8423–8445. [Google Scholar] [CrossRef]
- Olmo, M.E.; Bettolli, M.L. Statistical downscaling of daily precipitation over southeastern South America: Assessing the performance in extreme events. Int J Climatol 2022, 42, 1283–1302. [Google Scholar] [CrossRef]
- Olmo, M.E.; Balmaceda-Huarte, R.; Bettolli, M.L. Multi-model ensemble of statistically downscaled GCMs over southeastern South America: historical evaluation and future projections of daily precipitation with focus on extremes. Clim Dyn 2022, 59, 3051–3068. [Google Scholar] [CrossRef]
- Ballarin, A.S.; Sone, J.S.; Gesualdo, G.C.; Schwamback, D.; Reis, A.; Almagro, A.; Wendland, E.C. CLIMBra – Climate change dataset for Brazil. Sci Data 2023, 10, 47. [Google Scholar] [CrossRef] [PubMed]
- Cannon, A.J.; Sobie, S.R.; Murdock, T.Q. Bias correction of GCM precipitation by Quantile Mapping: How well do methods preserve changes in quantiles and extremes? J Clim 2015, 28, 6938–6959. [Google Scholar] [CrossRef]
- Reboita, M.S.; Gan, M.A.; da Rocha, R.P.; Ambrizzi, T. Regimes de precipitação na América do Sul: uma revisão bibliográfica. Rev. Bras. Meteorol. 2010, 25, 185–204. [Google Scholar] [CrossRef]
- Ferreira, G.W.S.; Reboita, M.S. A new look into the South American precipitation patterns: Observation and forecast. Atmosphere 2022, 13, 873. [Google Scholar] [CrossRef]
- Zhou, J.; Lau, K.M. Does a monsoon climate exist over South America? J Clim 1998, 11, 1020–1040. [Google Scholar] [CrossRef]
- Hoyos, I.; Cañón-Barriga, J.; Arenas-Suárez, T.; Dominguez, F.; Rodríguez, B.A. Variability of regional atmospheric moisture over Northern South America: patterns and underlying phenomena. Clim Dyn 2019, 52, 893–911. [Google Scholar] [CrossRef]
- Mejía, J.F.; Yepes, J.; Henao, J.J.; Poveda, G.; Zuluaga, M.D.; Raymond, D.J.; Fuchs-Stone, Z. Towards a mechanistic understanding of precipitation over the far eastern tropical Pacific and western Colombia, one of the rainiest spots on Earth. J Geophys Res Atmos 2021, 126, e2020JD033415. [Google Scholar] [CrossRef]
- Lagos-Zúñiga, M.A.; Balmaceda-Huarte, R.; Regoto, P.; Torrez, L.; Olmo, M.; Lyra, A.; Pareja-Quispe, D.; Bettolli, M.L. Extreme indices of temperature and precipitation in South America: Trends and intercomparison of regional climate models. Clim Dyn (Under Review). [CrossRef]
- Rupp, D.E.; Abatzoglou, J.T.; Hegewisch, K.C.; Mote, P.W. Evaluation of CMIP5 20th century climate simulations for the Pacific Northwest USA. J Geophys Res Atmos 2013, 118, 10884–10906. [Google Scholar] [CrossRef]
- Dias, C.G.; Reboita, M.S. Assessment of CMIP6 simulations over tropical South America. Rev Bras Geogr Fis 2021, 14, 1282–1295. [Google Scholar] [CrossRef]
- Zhang, M.Z.; Xu, Z.; Han, Y.; Guo, W. Evaluation of CMIP6 models toward dynamical downscaling over 14 CORDEX domains. Clim Dyn 2022. [Google Scholar] [CrossRef]
- Lovato, T.; Peano, D. CMCC CMCC-CM2-SR5 model output prepared for CMIP6 CMIP historical. Version 20200616. Earth System Grid Federation 2020. [Google Scholar] [CrossRef]
- Lovato, T.; Peano, D.; Butenschön, M.; Materia, S.; Iovino, D.; Scoccimarro, E.; Fogli, P.G.; Cherchi, A.; Bellucci, A.; Gualdi, S.; Masina, S.; Navarra, S. CMIP6 simulations with the CMCC Earth System Model (CMCC1077 ESM2). J Adv Model Earth Syst 2022, 14, e2021MS002814. [Google Scholar] [CrossRef]
- Döscher, R.; Acosta, M.; Alessandri, A.; Anthoni, P.; Arneth, A.; Arsouze, T.; Bergman, T.; Bernardello, R.; Bousetta, S.; Caron, L.P.; Carver, G.; Castrillo, M.; Catalano, F.; Cvijanovic, I.; Davini, P.; Dekker, E.; Doblas-Reyes, F.J.; Docquier, D.; Echevarria, P.; Fladrich, U.; Fuentes-Franco, R.; Gröger, M.; von Hardenberg, J.; Hieronymus, J.; Karami, M.P.; Keskinen, J.P.; Koenigk, T.; Makkonen, R.; Massonet, F.; Ménégoz, M.; Miller, P.A.; Moreno-Chamarro, E.; Nieradzik, L.; van Noije, T.; Nolan, P.; O’Donnell, D.; Ollinaho, P.; van der Oord, G.; Ortega, P.; Prims, O.T.; Ramos, A.; Reerink, T.; Rousset, C.; Ruprich-Robert, Y.; Le Sager, P.; Schmith, T.; Schrödner, R.; Serva, F.; Sicardi, V.; Madsen, M.S.; Smith, B.; Tian, T.; Tourigny, E.; Uotila, P.; Vancoppenolle, M.; Wang, S.; Wårlind, D.; Willén, U.; Wyser, K.; Yang, S.; Yepes-Arbós, X.; Zhang, Q. The EC-Earth3 Earth System Model for the Climate Model Intercomparison Project 6. Geosci Model Dev 2022, 15, 2973–3020. [Google Scholar] [CrossRef]
- Krasting, J.P.; John, J.G.; Blanton, C.; McHugh, C.; Nikonov, S.; Radhakrishnan, A.; Rand, K.; Zadeh, N.T.; Balaji, V.; Durachta, J.; Dupuis, C.; Menzel, R.; Robinson, T.; Underwood, S.; Vahlenkamp, H.; Dunne, K.A.; Gauthier, P.P.G.; Ginoux, P.; Griffies, S.M.; Hallberg, R.; Harrison, M.; Hurlin, W.; Malyshev, S.; Naik, V.; Paulot, F.; Paynter, D.J.; Ploshay, J.; Reichl, B.G.; Schwarzkopf, D.M.; Seman, C.J.; Silvers, L.; Wyman, B.; Zeng, Y.; Adcroft, A.; Dunne, J.P.; Dussin, R.; Guo, H.; He, J.; Held, I.M.; Horowitz, L.W.; Lin, P.; Milly, P.C.D.; Shevliakova, E.; Stock, C.; Winton, M.; Wittenberg, A.T.; Xie, Y.; Zhao, M. NOAA-GFDL GFDL-ESM4 model output prepared for CMIP6 CMIP historical. Version 20190726. Earth System Grid Federation 2018. [Google Scholar] [CrossRef]
- Boucher, O.; Denvil, S.; Levavasseur, G.; Cozic, A.; Caubel, A.; Foujols, M.A.; Meurdesoif, Y.; Cadule, P.; Devilliers, M.; Ghattas, J.; Lebas, N.; Lurton, T.; Mellul, L.; Musat, I.; Mignot, J.; Cheruy, F. IPSL IPSL-CM6A-LR model output prepared for CMIP6 CMIP historical. Version 20180803. Earth System Grid Federation 2018. [Google Scholar] [CrossRef]
- Tatebe, H.; Watanabe, M. MIROC MIROC6 model output prepared for CMIP6 CMIP historical. Version 20181212. Earth System Grid Federation 2018. [Google Scholar] [CrossRef]
- Wieners, K.H.; Giorgetta, M.; Jungclaus, J.; Reick, C.; Esch, M.; Bittner, M.; Legutke, S.; Schupfner, M.; Wachsmann, F.; Gayler, V.; Haak, H.; de Vrese, P.; Raddatz, T.; Mauritsen, T.; von Storch, J.S.; Behrens, J.; Brovkin, V.; Claussen, M.; Crueger, T.; Fast, I.; Fiedler, S.; Hagemann, S.; Hohenegger, C.; Jahns, T.; Kloster, S.; Kinne, S.; Lasslop, G.; Kornblueh, L.; Marotzke, J.; Matei, D.; Meraner, K.; Mikolajewicz, U.; Modali, K.; Müller, W.; Nabel, J.; Notz, D.; Peters-von Gehlen, K.; Pincus, R.; Pohlmann, H.; Pongratz, J.; Rast, S.; Schmidt, H.; Schnur, R.; Schulzweida, U.; Six, K.; Stevens, B.; Voigt, A.; Roeckner, E. MPI-M MPI-ESM1.2-LR model output prepared for CMIP6 CMIP historical. Version 20190710. Earth System Grid Federation 2019. [Google Scholar] [CrossRef]
- Yukimoto, S.; Koshiro, T.; Kawai, H.; Oshima, N.; Yoshida, K.; Urakawa, S.; Tsujino, H.; Deushi, M.; Tanaka, T.; Hosaka, M.; Yoshimura, H.; Shindo, E.; Mizuta, R.; Ishii, M.; Obata, A.; Adachi, Y. MRI MRI-ESM2.0 model output prepared for CMIP6 CMIP historical. Version 20190222. Earth System Grid Federation 2019. [Google Scholar] [CrossRef]
- Chen, M.; Shi, W.; Xie, P.; Silva, V.B.S.; Kousky, V.E.; Higgins, R.W.; Janowiak, J.E. Assessing objective techniques for gauge-based analyses of global daily precipitation. J. Geophys. Res. 2008, 113, D04110. [Google Scholar] [CrossRef]
- Silva, V.C.B.; Kousky, V.E.; Shi, W.; Higgins, W. An improved gridded historical daily precipitation analysis for Brazil. J Hydrometeorol 2007, 8, 847–861. [Google Scholar] [CrossRef]
- Lee, T.; Singh, V.P. Statistical downscaling for hydrological and environmental applications., 1st ed.; Taylor & Francis Group: Boca Raton, Florida, United States of America, 2019. [Google Scholar]
- Mukherjee, S.; Aadhar, S.; Stone, D.; Mishra, V. Increase in extreme precipitation events under anthropogenic warming in India. Weather Clim Extremes 2018, 20, 45–53. [Google Scholar] [CrossRef]
- Lee, M.-H.; Lu, M.; Im, E.-S.; Bae, D.-H. Added value of dynamical downscaling for hydrological projections in the Chungju Basin, Korea. Int J Climatol 2019, 39, 516–531. [Google Scholar] [CrossRef]
- Mishra, V.; Bhatia, U.; Tiwari, A.D. Bias-corrected climate projections for South Asia from Coupled Model Intercomparison Project-6. Sci Data 2020, 7, 338. [Google Scholar] [CrossRef]
- Xu, Z.; Han, Y.; Tam, C.-Y.; Yang, Z.-L.; Fu, C. Bias-corrected CMIP6 global dataset for dynamical downscaling of the historical and future climate (1979–2100). Sci Data 2021, 8, 293. [Google Scholar] [CrossRef]
- Tang, G.; Clark, M.P.; Papalexiou, S.M. EM-Earth: The Ensemble Meteorological dataset for planet Earth. Bull Am Meteorol Soc 2022, 103, E996–E1018. [Google Scholar] [CrossRef]
- Wu, H.; Lei, H.; Lu, W.; Liu, Z. Future changes in precipitation over the upper Yangtze River basin based on bias correction spatial downscaling of models from CMIP6. Environ Res Commun 2022, 4, 045002. [Google Scholar] [CrossRef]
- Admasu, L.M.; Grant, L.; Thiery, W. Exploring global climate model downscaling based on tile-level output. J Appl Meteorol Climatol 2023, 62, 171–190. [Google Scholar] [CrossRef]
- Tram-Anh, Q.; Ngo-Duc, T.; Espagne, E.; Trinh-Tuan, L. A 10-km CMIP6 downscaled dataset of temperature and precipitation for historical and future Vietnam climate. Sci Data 2023, 10, 257. [Google Scholar] [CrossRef] [PubMed]
- Logan, T.; Aoun, A.; Bourgault, P.; Huard, D.; Lavoie, J.; Rondeau-Genesse, G.; Smith, J.T.; Alegre, R.; Barnes, C.; Biner, S.; Caron, D.; Ehbrecht, C.; Fyke, J.; Keel, T.; Labonté, M.-P.; Lierhammer, L.; Low, J.-F.; Quinn, J.; Roy, P.; Whelan, C. Ouranosinc/xclim: v0.37.0 (v0.37.0). Zenodo 2022. [Google Scholar] [CrossRef]
- Wilks, D.S. Statistical methods in the Atmospheric Sciences, 4th ed.; Elsevier: Cambridge, United States of America, 2019. [Google Scholar]
- Almazroui, M.; Ashfaq, M.; Islam, M.N.; Kamil, S.; Abid, M.A.; O’Brien, E.; Ismail, M.; Reboita, M.S.; Sörensson, A.A.; Arias, P.A.; Alves, L.M.; Tippett, M.K.; Saeed, S.; Haarsma, R.; Doblas-Reyes, F.J.; Saeed, F.; Kucharski, F.; Nadeem, I.; Silva-Vidal, Y.; Rivera, J.A.; Ehsan, M.A.; Martínez-Castro, D.; Muñoz, A.G.; Ali, M.A.; Coppola, E.; Sylla, M.B. Assessment of CMIP6 performance and projected temperature and precipitation changes over South America. Earth Syst Environ 2021, 5, 155–183. [Google Scholar] [CrossRef]
- Arias, P.A.; Ortega, G.; Villegas, L.D.; Martínez, J. Colombian climatology in CMIP5/CMIP6 models: Persistent biases and improvements. Rev Fac Ing 2021, 100, 75–96. [Google Scholar] [CrossRef]
- Ortega, G.; Arias, P.A.; Villegas, J.C.; Marquet, P.A.; Nobre, P. Present-day and future climate over Central and South America according to CMIP5/CMIP6 models. Int J Climatol 2021, 41, 6713–6735. [Google Scholar] [CrossRef]
- Huang, F.; Xu, Z.; Guo, W. The linkage between CMIP5 climate models’ abilities to simulate precipitation and vector winds. Clim Dyn 2020, 54, 4953–4970. [Google Scholar] [CrossRef]
- Torres, R.R.; Marengo, J.A. Uncertainty assessments of climate change projections over South America. Theor Appl Climatol 2013, 112, 253–272. [Google Scholar] [CrossRef]
- Rivera, J.A.; Arnould. G. Evaluation of the ability of CMIP6 models to simulate precipitation over Southwestern South America: Climatic features and long-term trends (1901-2014). Atmos Res 2020, 241, 104953. [Google Scholar] [CrossRef]
- Barreiro, M.; Chang, P.; Saravanan, R. Simulated precipitation response to SST forcing and potential predictability in the region of the South Atlantic Convergence Zone. Clim Dyn 2005, 24, 105–114. [Google Scholar] [CrossRef]
- Bombardi, R.J.; Trenary, L.; Pegion, K.; Cash, B.; DelSole, T.; Kinter, J.L. Seasonal predictability of summer rainfall over South America. J Clim 2018, 31, 8181–8195. [Google Scholar] [CrossRef]
- Torres, R.R.; Benassi, R.B.; Martins, F.B.; Lapola, D.M. Projected impacts of 1.5 and 2 °C global warming on temperature and precipitation patterns in South America. Int J Climatol 2021, 42, 1597–1611. [Google Scholar] [CrossRef]
- Ruffato-Ferreira, V.; Barreto, R.C.; Júnior, A.O.; Silva, W.L.; Viana, D.B.; Nascimento, J.A.S.; Freitas, M.A.V. A foundation for the strategic long-term planning of the renewable energy sector in Brazil: Hydroelectricity and wind energy in the face of climate change scenarios. Renew Sustain Energy Rev 2017, 72, 1124–1137. [Google Scholar] [CrossRef]
- de Jong, P.; Barreto, T.B.; Tanajura, C.A.S.; Oliveira-Esquerre, K.P.; Kiperstok, A.; Torres, E.A. The impact of regional climate change on hydroelectric resources in South America. Renew Energy 2021, 173, 76–91. [Google Scholar] [CrossRef]
- Medeiros, F.J.; Oliveira, C.P.; Avila-Diaz, A. Evaluation of extreme precipitation climate indices and their projected changes for Brazil: From CMIP3 to CMIP6. Weather Clim Extrem 2022, 38, 100511. [Google Scholar] [CrossRef]
- Cai, W.; McPhaden, M.J.; Grimm, A.M.; Rodrigues, R.R.; Taschetto, A.S.; Garreaud, R.D.; Dewitte, B.; Poveda, G.; Ham, Y.-G.; Santoso, A.; Ng, B.; Anderson, W.; Wang, G.; Geng, T.; Jo, H.-S.; Marengo, J.A.; Alves, L.M.; Osman, M.; Li, S.; Wu, L.; Karamperidou, C.; Takahashi, K.; Vera, C. Climate impacts of the El Niño-Southern Oscillation on South America. Nat Rev Earth Environ 2020, 1, 215–231. [Google Scholar] [CrossRef]
- Reboita, M.S.; Ambrizzi, T.; Crespo, N.M.; Dutra, L.M.M.; Ferreira, G.W.S.; Rehbein, A.; Drumond, A.; da Rocha, R.P.; Souza, C.A. Impacts of teleconnection patterns on South America climate. Ann NY Acad Sci 2021, 1504, 116–153. [Google Scholar] [CrossRef]
- Jimenez, J.C.; Libonati, R.; Peres, L.F. Drought over Amazonia in 2005, 2010, and 2015: A cloud cover perspective. Front Earth Sci 2018, 6, 227. [Google Scholar] [CrossRef]
- Li, J.; Huo, R.; Chen, H.; Zhao, Y.; Zhao, T. Comparative assessment and future prediction using CMIP6 and CMIP5 for annual precipitation and extreme precipitation simulation. Front Earth Sci 2021, 9. [Google Scholar] [CrossRef]
- Medeiros, F.J.; Oliveira, C.P. Assessment of dry and heavy rainfall days and their projected changes over Northeast Brazil in Coupled Model Intercomparison Project Phase 6 models. Int J Climatol 2022, 42, 8665–8686. [Google Scholar] [CrossRef]
- Costa, M.S.; Oliveira-Júnior, J.F.; Santos, P.J.; Filho, W.L.F.C.; Gois, G.; Blanco, C.J.C.; Teodoro, P.E.; Silva Junior, C.A.; Santiago, D.B.; Souza, E.O.; Jardim, A.M.R.F. Rainfall extremes and drought in Northeast Brazil and its relationship with El Niño–Southern Oscillation. Int J Climatol 2020, E2111–E2135. [Google Scholar] [CrossRef]
- Cavalcanti, I.F.A. The influence of extratropical Atlantic Ocean region on wet and dry years in North-Northeastern Brazil. Front Earth Sci 2015, 3, 34. [Google Scholar] [CrossRef]
- Ruiz-Vásquez, M.; Arias, P.A.; Martínez, J.A.; Espinoza, J.C. Effects of Amazon basin deforestation on regional atmospheric circulation and water vapor transport towards tropical South America. Clim Dyn 2020, 54, 4169–4189. [Google Scholar] [CrossRef]
- Arias, P.A.; Rivera, J.A.; Sörensson, A.A.; Zachariah, M.; Barnes, C.; Philip, S.; Kew, S.; Vautard, R.; Koren, G.; Pinto, I.; Vahlberg, M.; Singh, R.; Raju, E.; Li, S.; Yang, W.; Vecchi, G.A.; Otto, F.E.L. Vulnerability and high temperatures exacerbate impacts of ongoing drought in Central South America. World Weather Attribution, 2023. Available online: https://www.worldweatherattribution.org/wp-content/uploads/WWA-Argentina-Uruguay-drought-Scientific-Report.pdf.
- Rivera, J.A.; Otta, S.; Lauro, C.; Zazulie, N. A decade of hydrological drought in central-western Argentina. Front Water 2021, 3. [Google Scholar] [CrossRef]
- Xu, F.; Bento, V.A.; Qu, Y.; Wang, Q. Projections of global drought and their climate drivers using CMIP6 global climate models. Water 2023, 15, 2272. [Google Scholar] [CrossRef]
| SPI Values | Drought Category |
|---|---|
| 0 to -0.99 | Mild drought |
| -1.00 to -1.49 | Moderate drought |
| -1.50 to -1.99 | Severe drought |
| ≤ -2.00 | Extreme drought |
Disclaimer/Publisher’s Note: The statements, opinions and data contained in all publications are solely those of the individual author(s) and contributor(s) and not of MDPI and/or the editor(s). MDPI and/or the editor(s) disclaim responsibility for any injury to people or property resulting from any ideas, methods, instructions or products referred to in the content. |
© 2023 by the authors. Licensee MDPI, Basel, Switzerland. This article is an open access article distributed under the terms and conditions of the Creative Commons Attribution (CC BY) license (http://creativecommons.org/licenses/by/4.0/).


