Submitted:
06 July 2023
Posted:
07 July 2023
You are already at the latest version
Abstract
Keywords:
1. Introduction
2. Materials and Methods
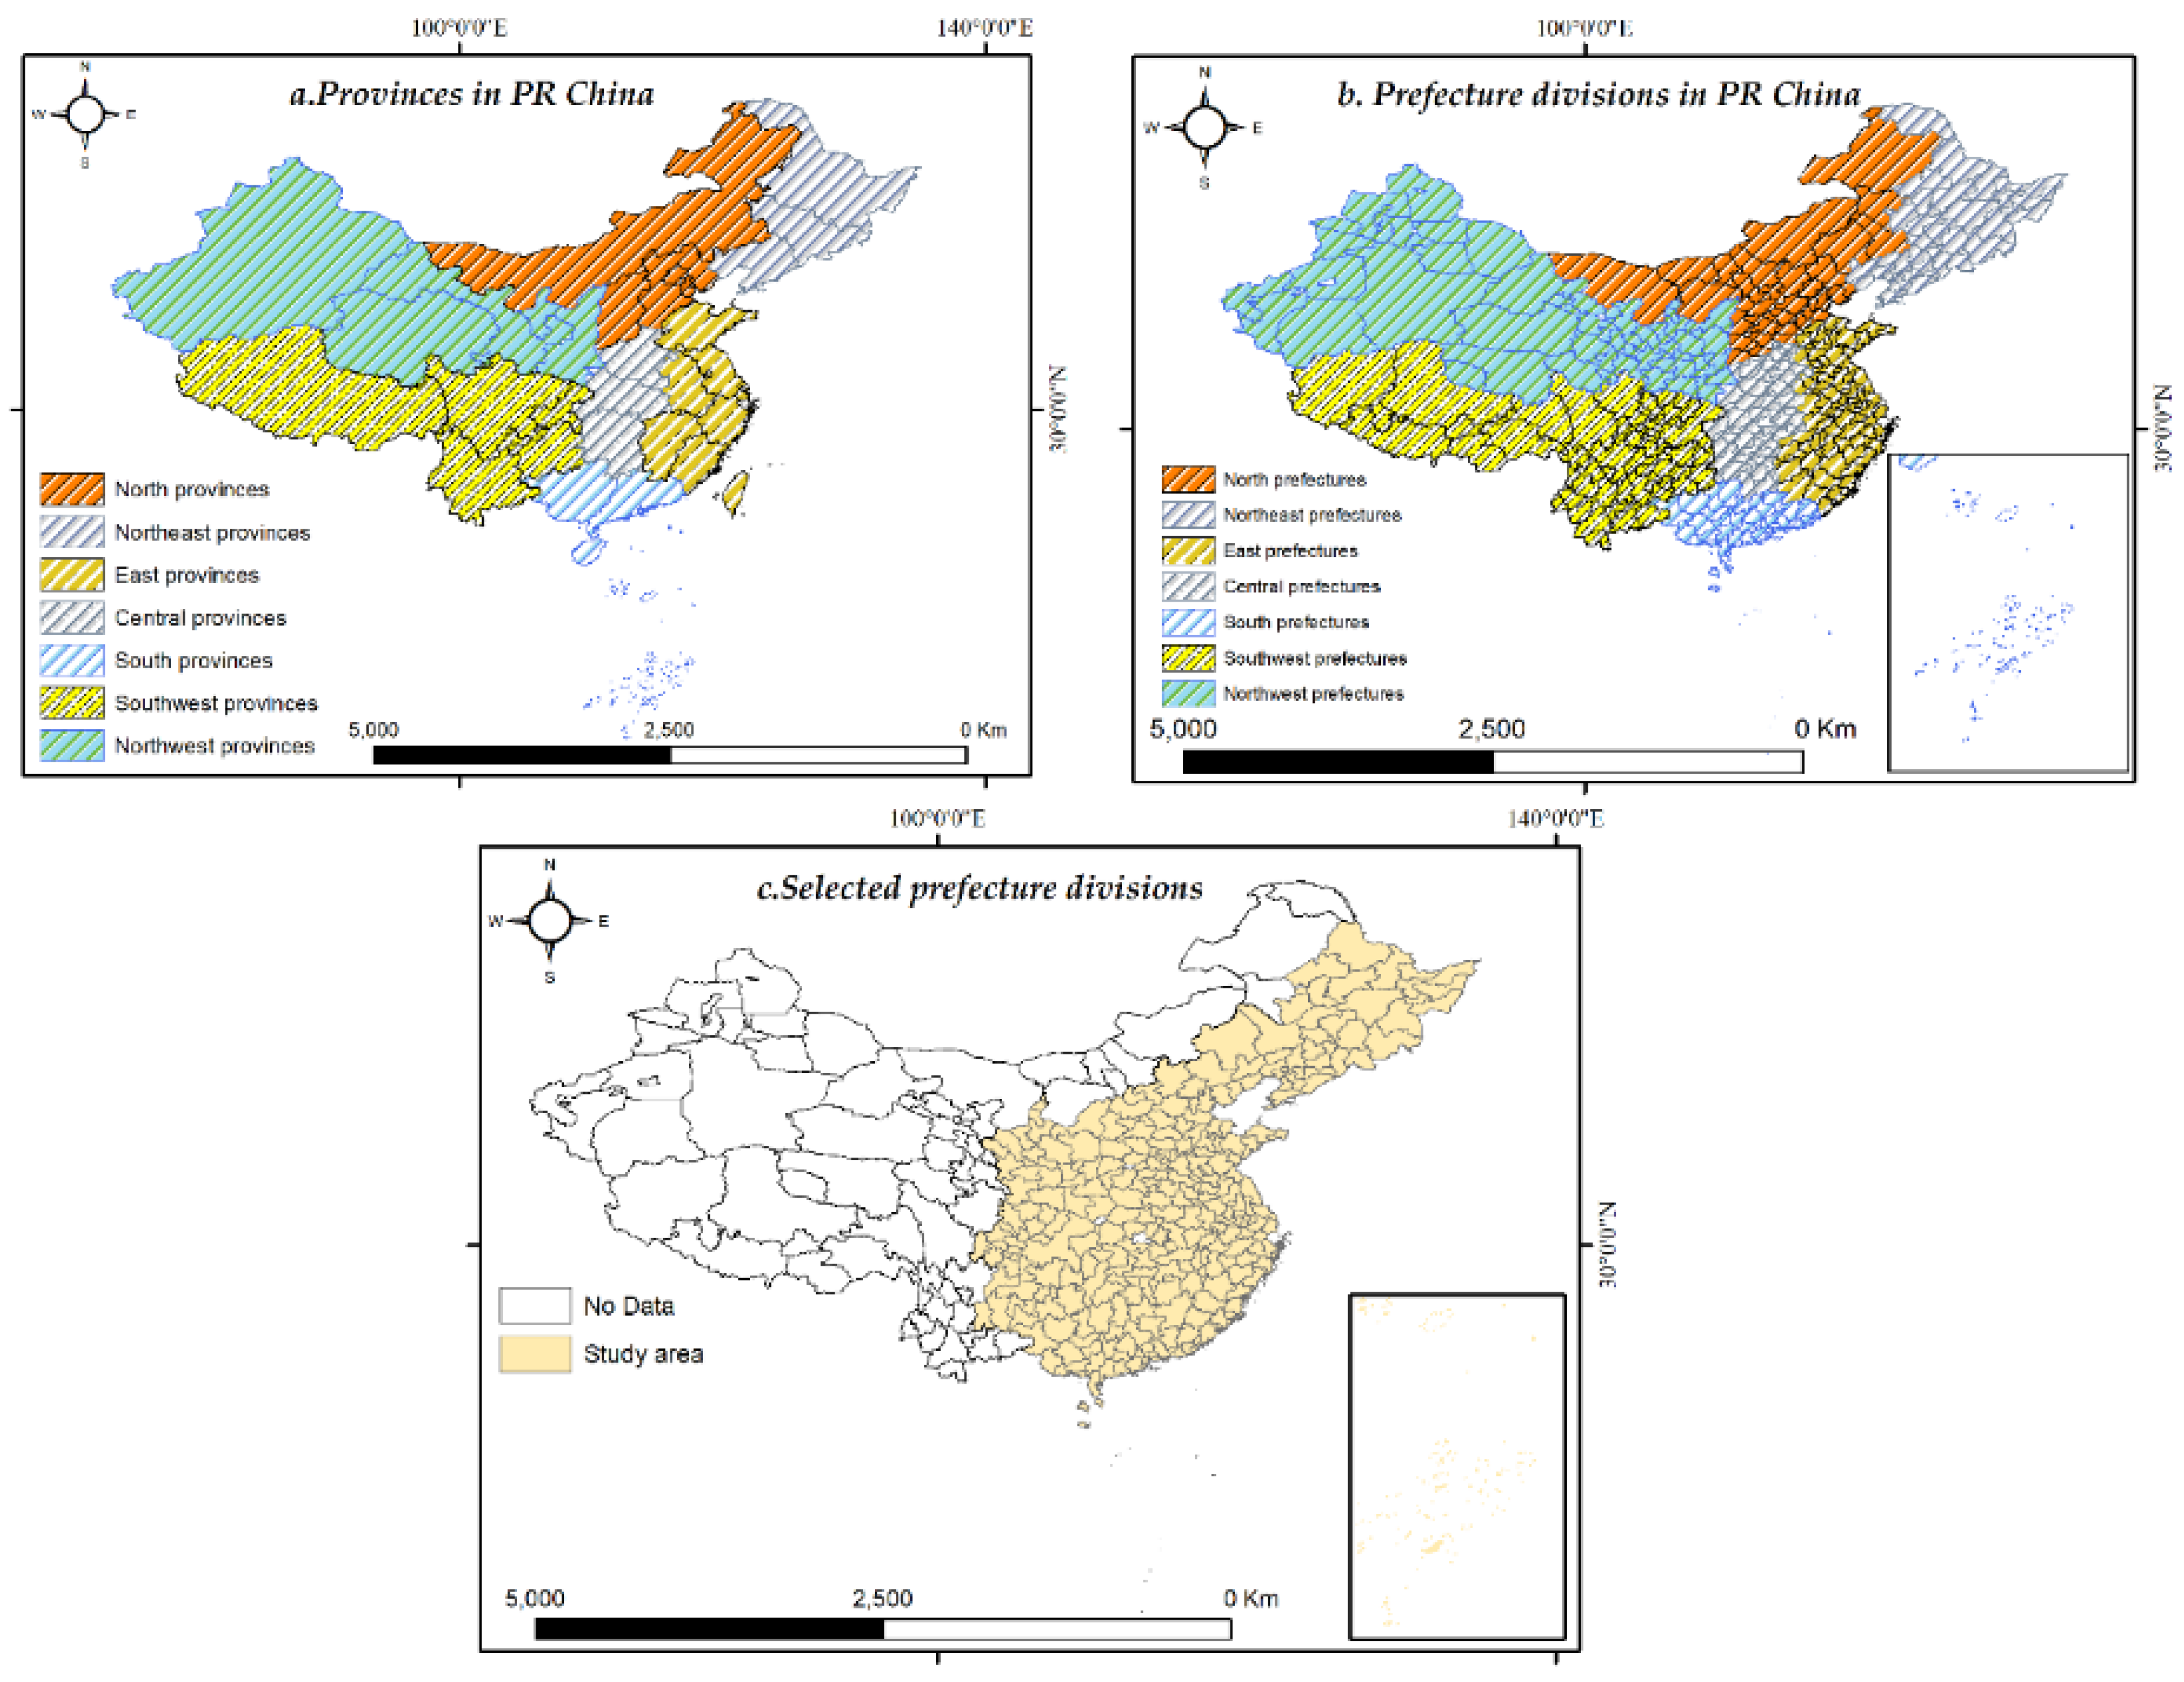
2.1. Study area
2.2. Materials
2.3. Methods
2.3.1. Extracting urban entities using the K-means classification
2.3.2. Post-processing
3. Results
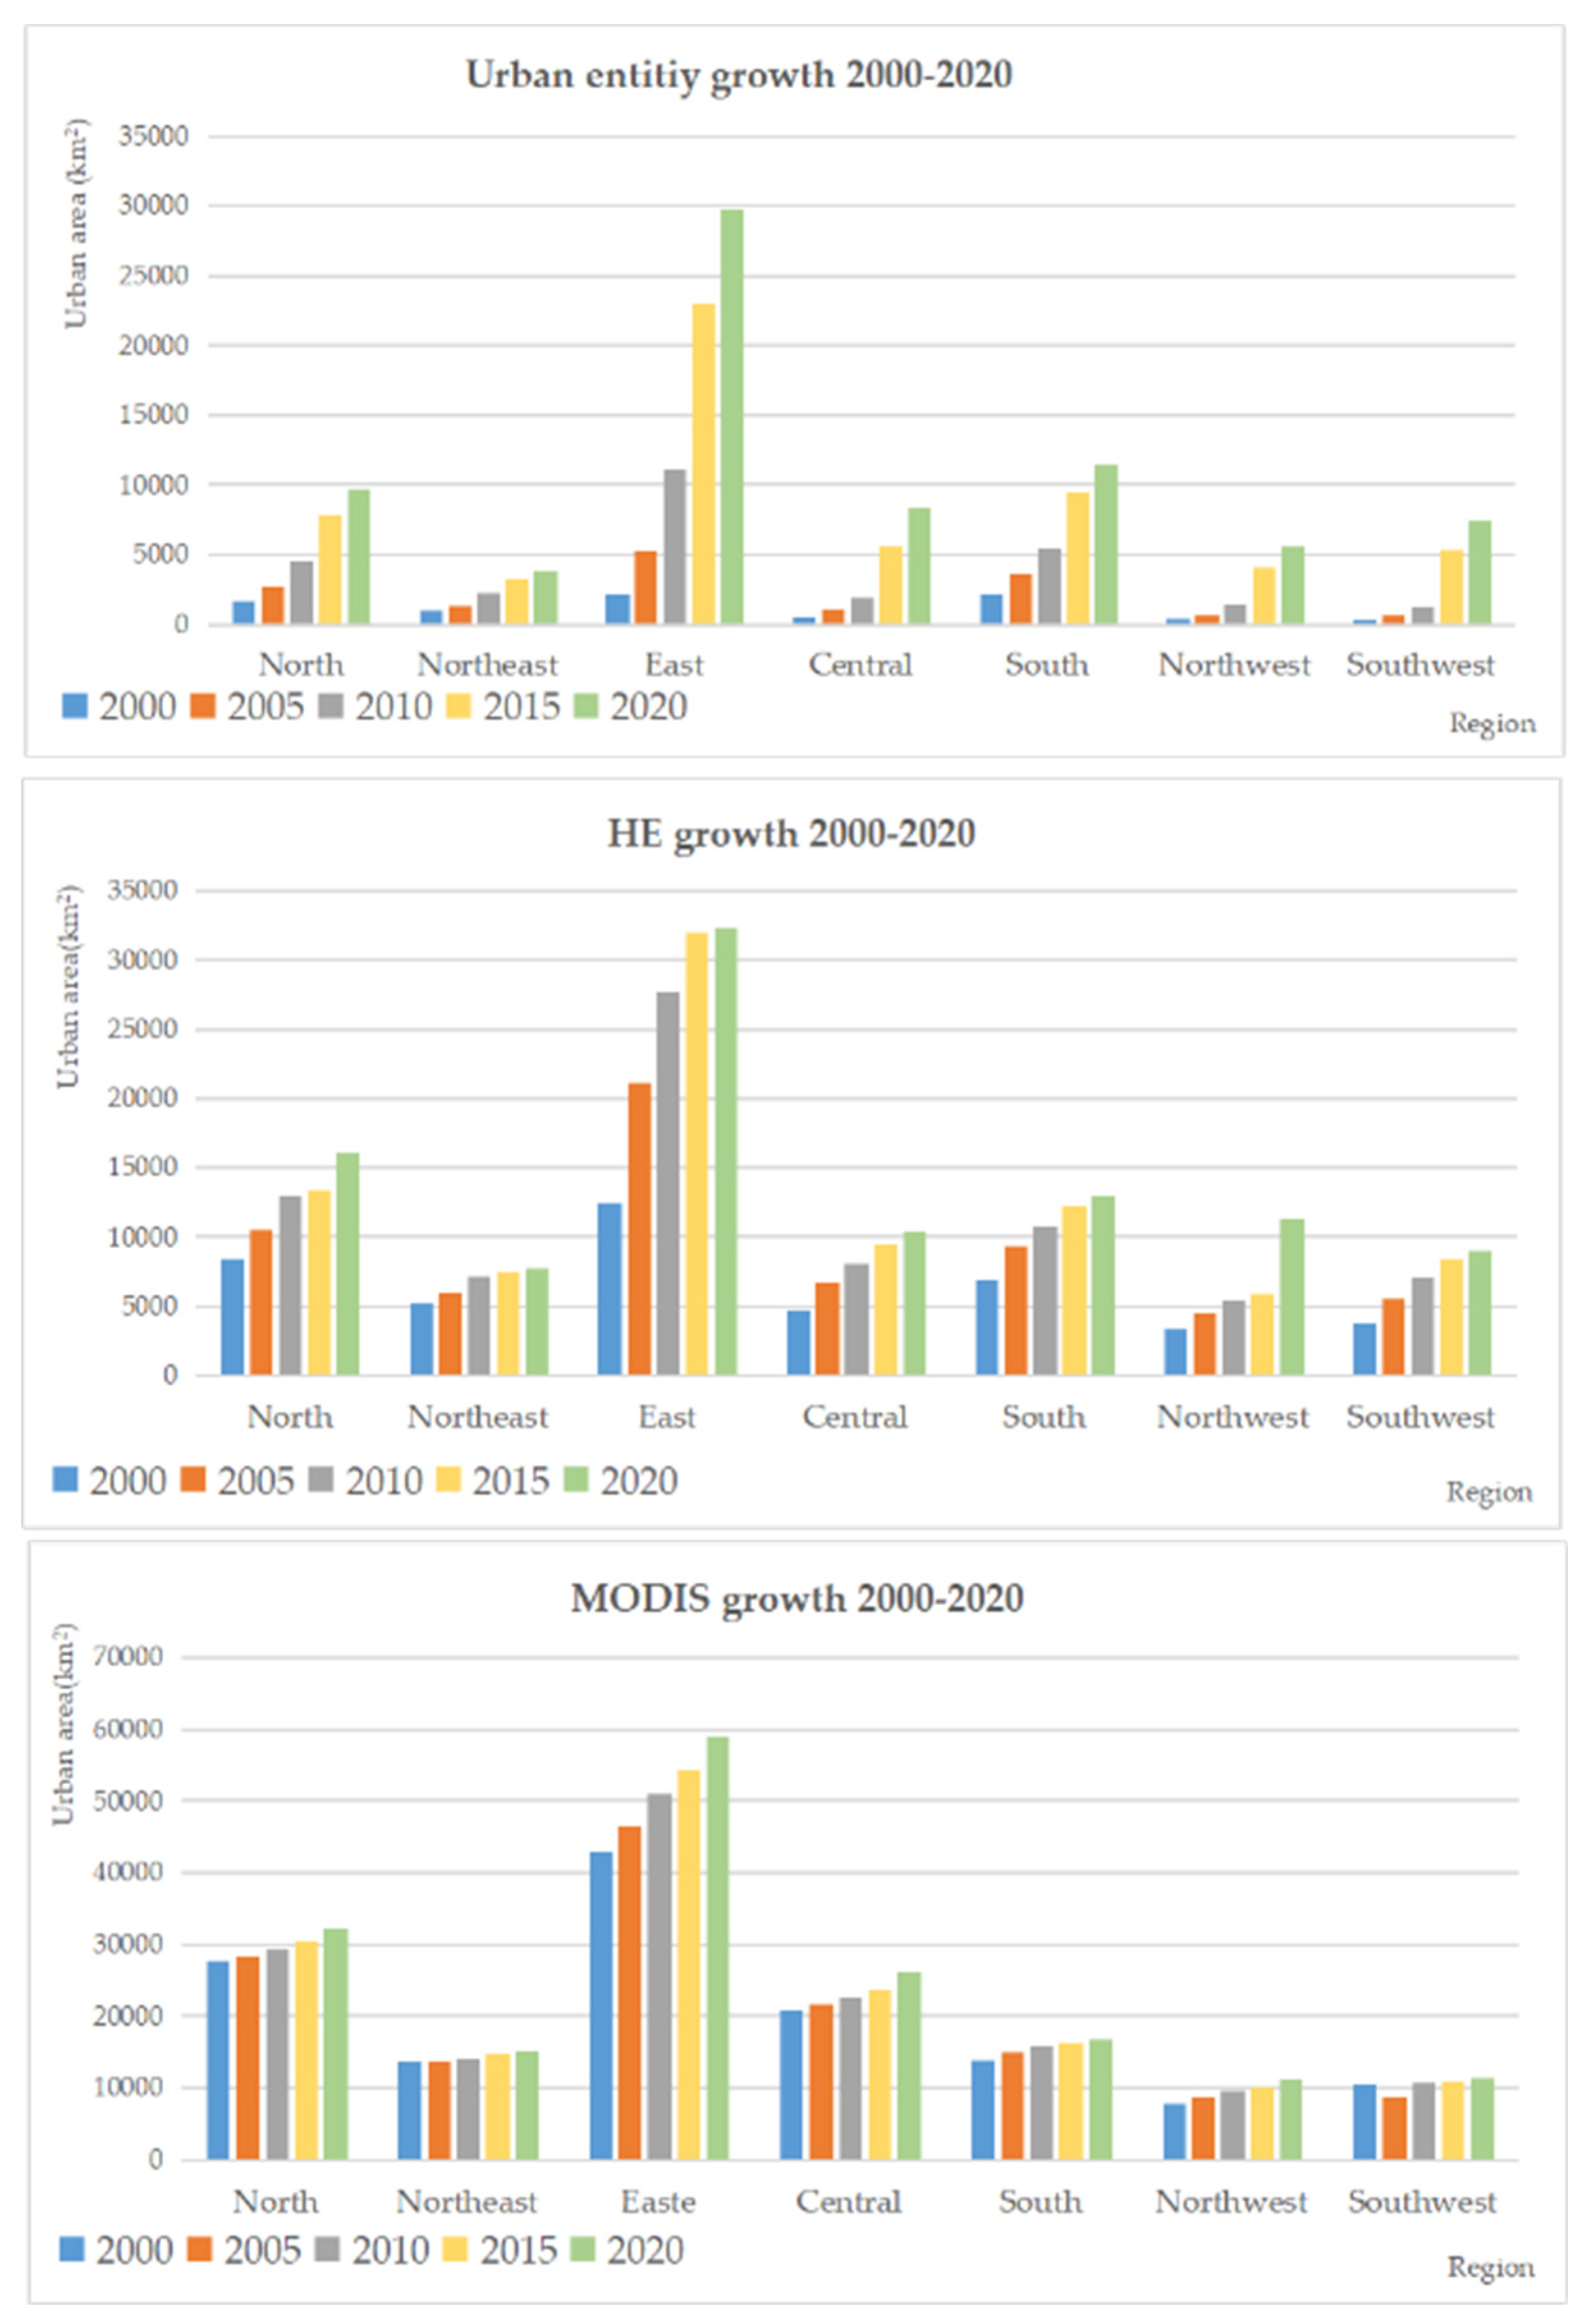
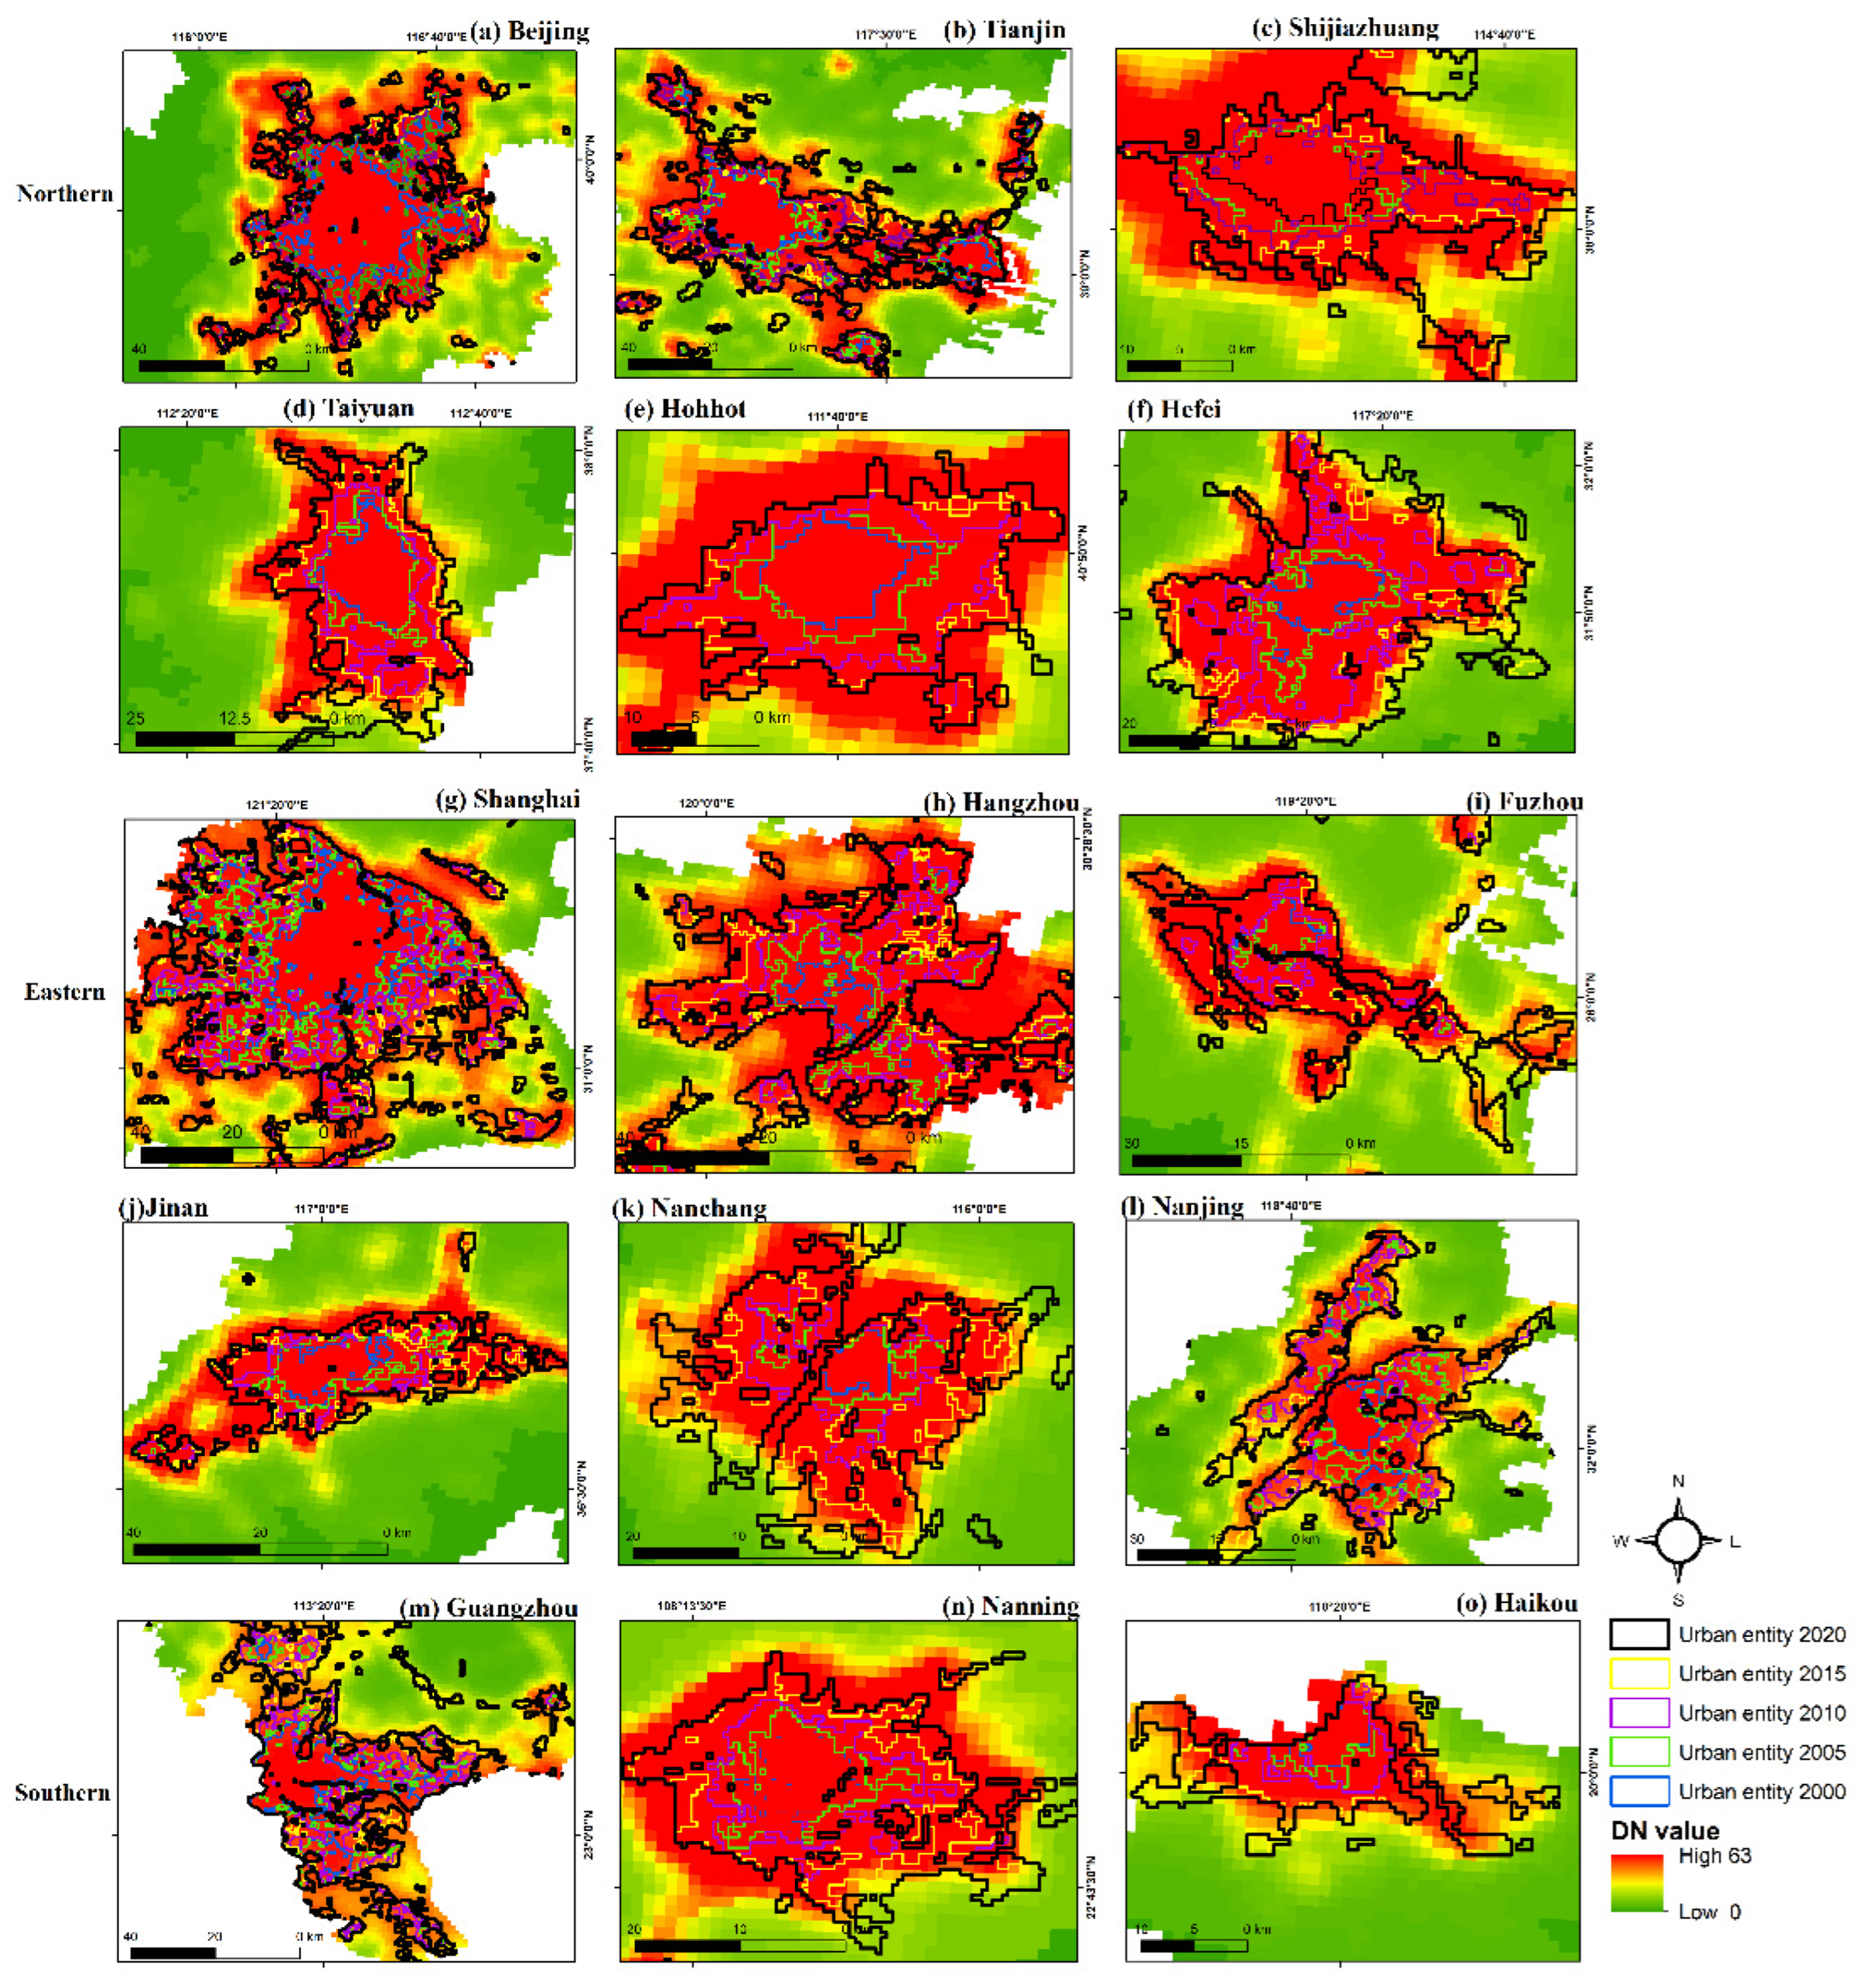
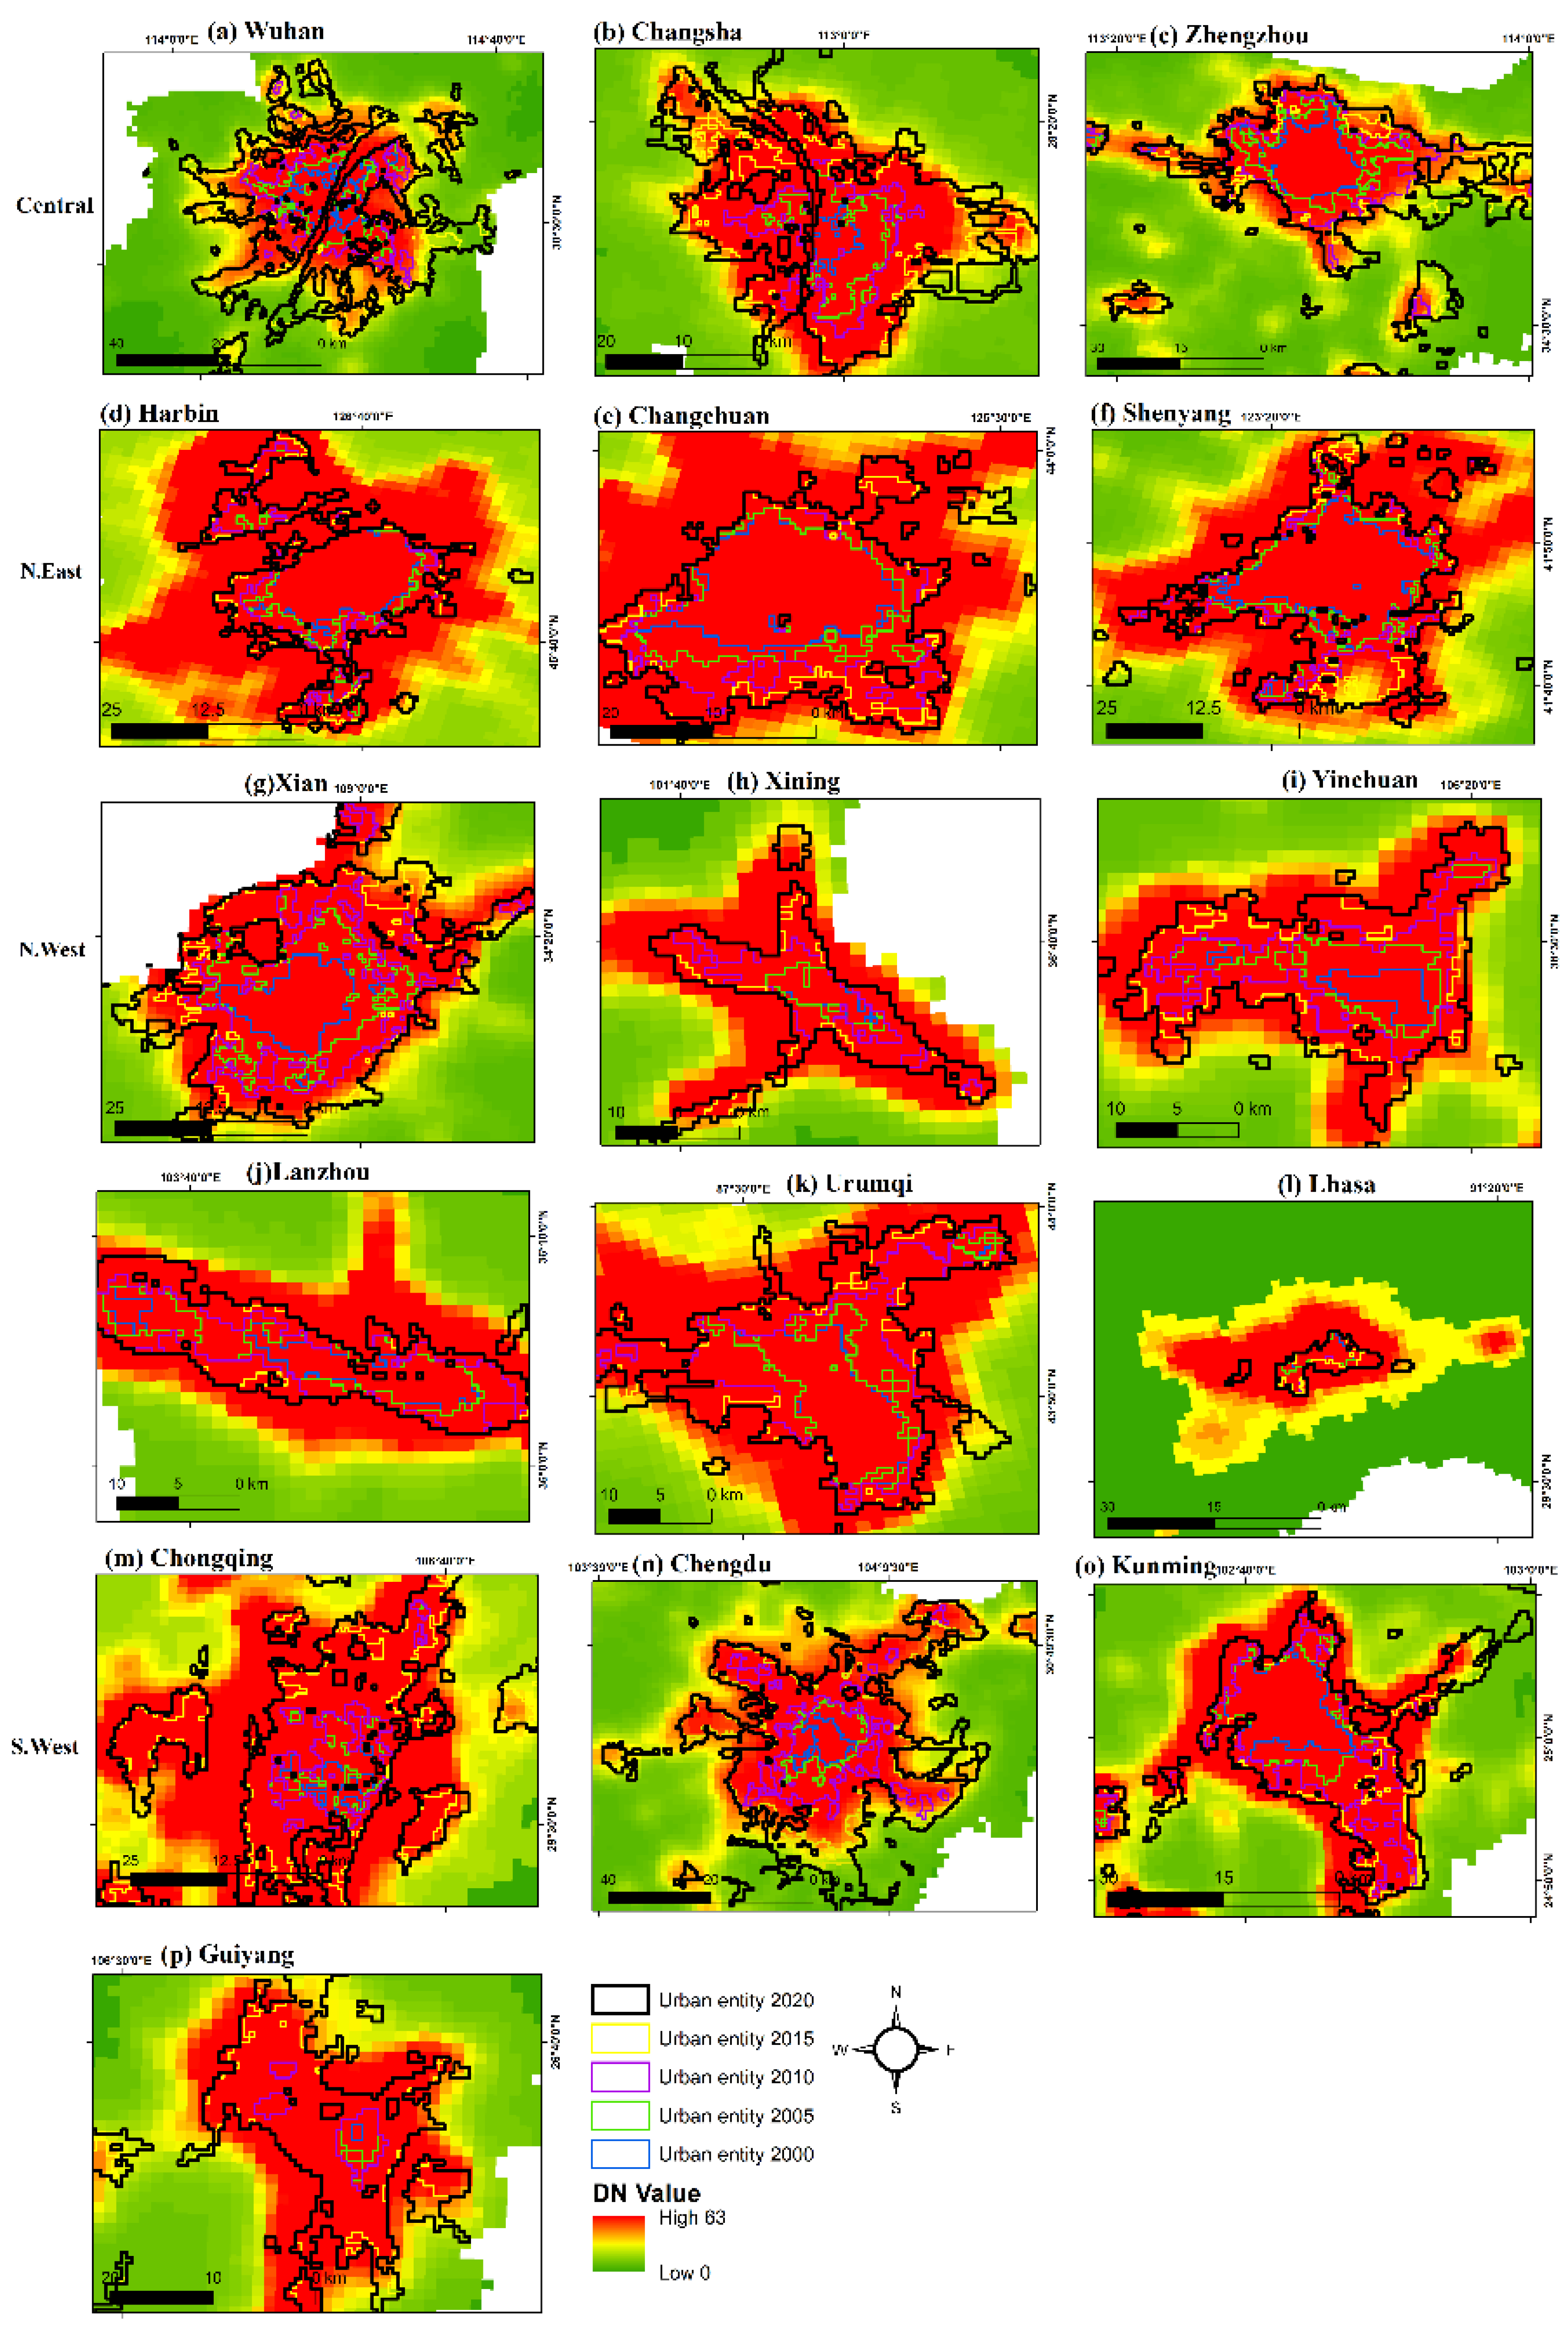
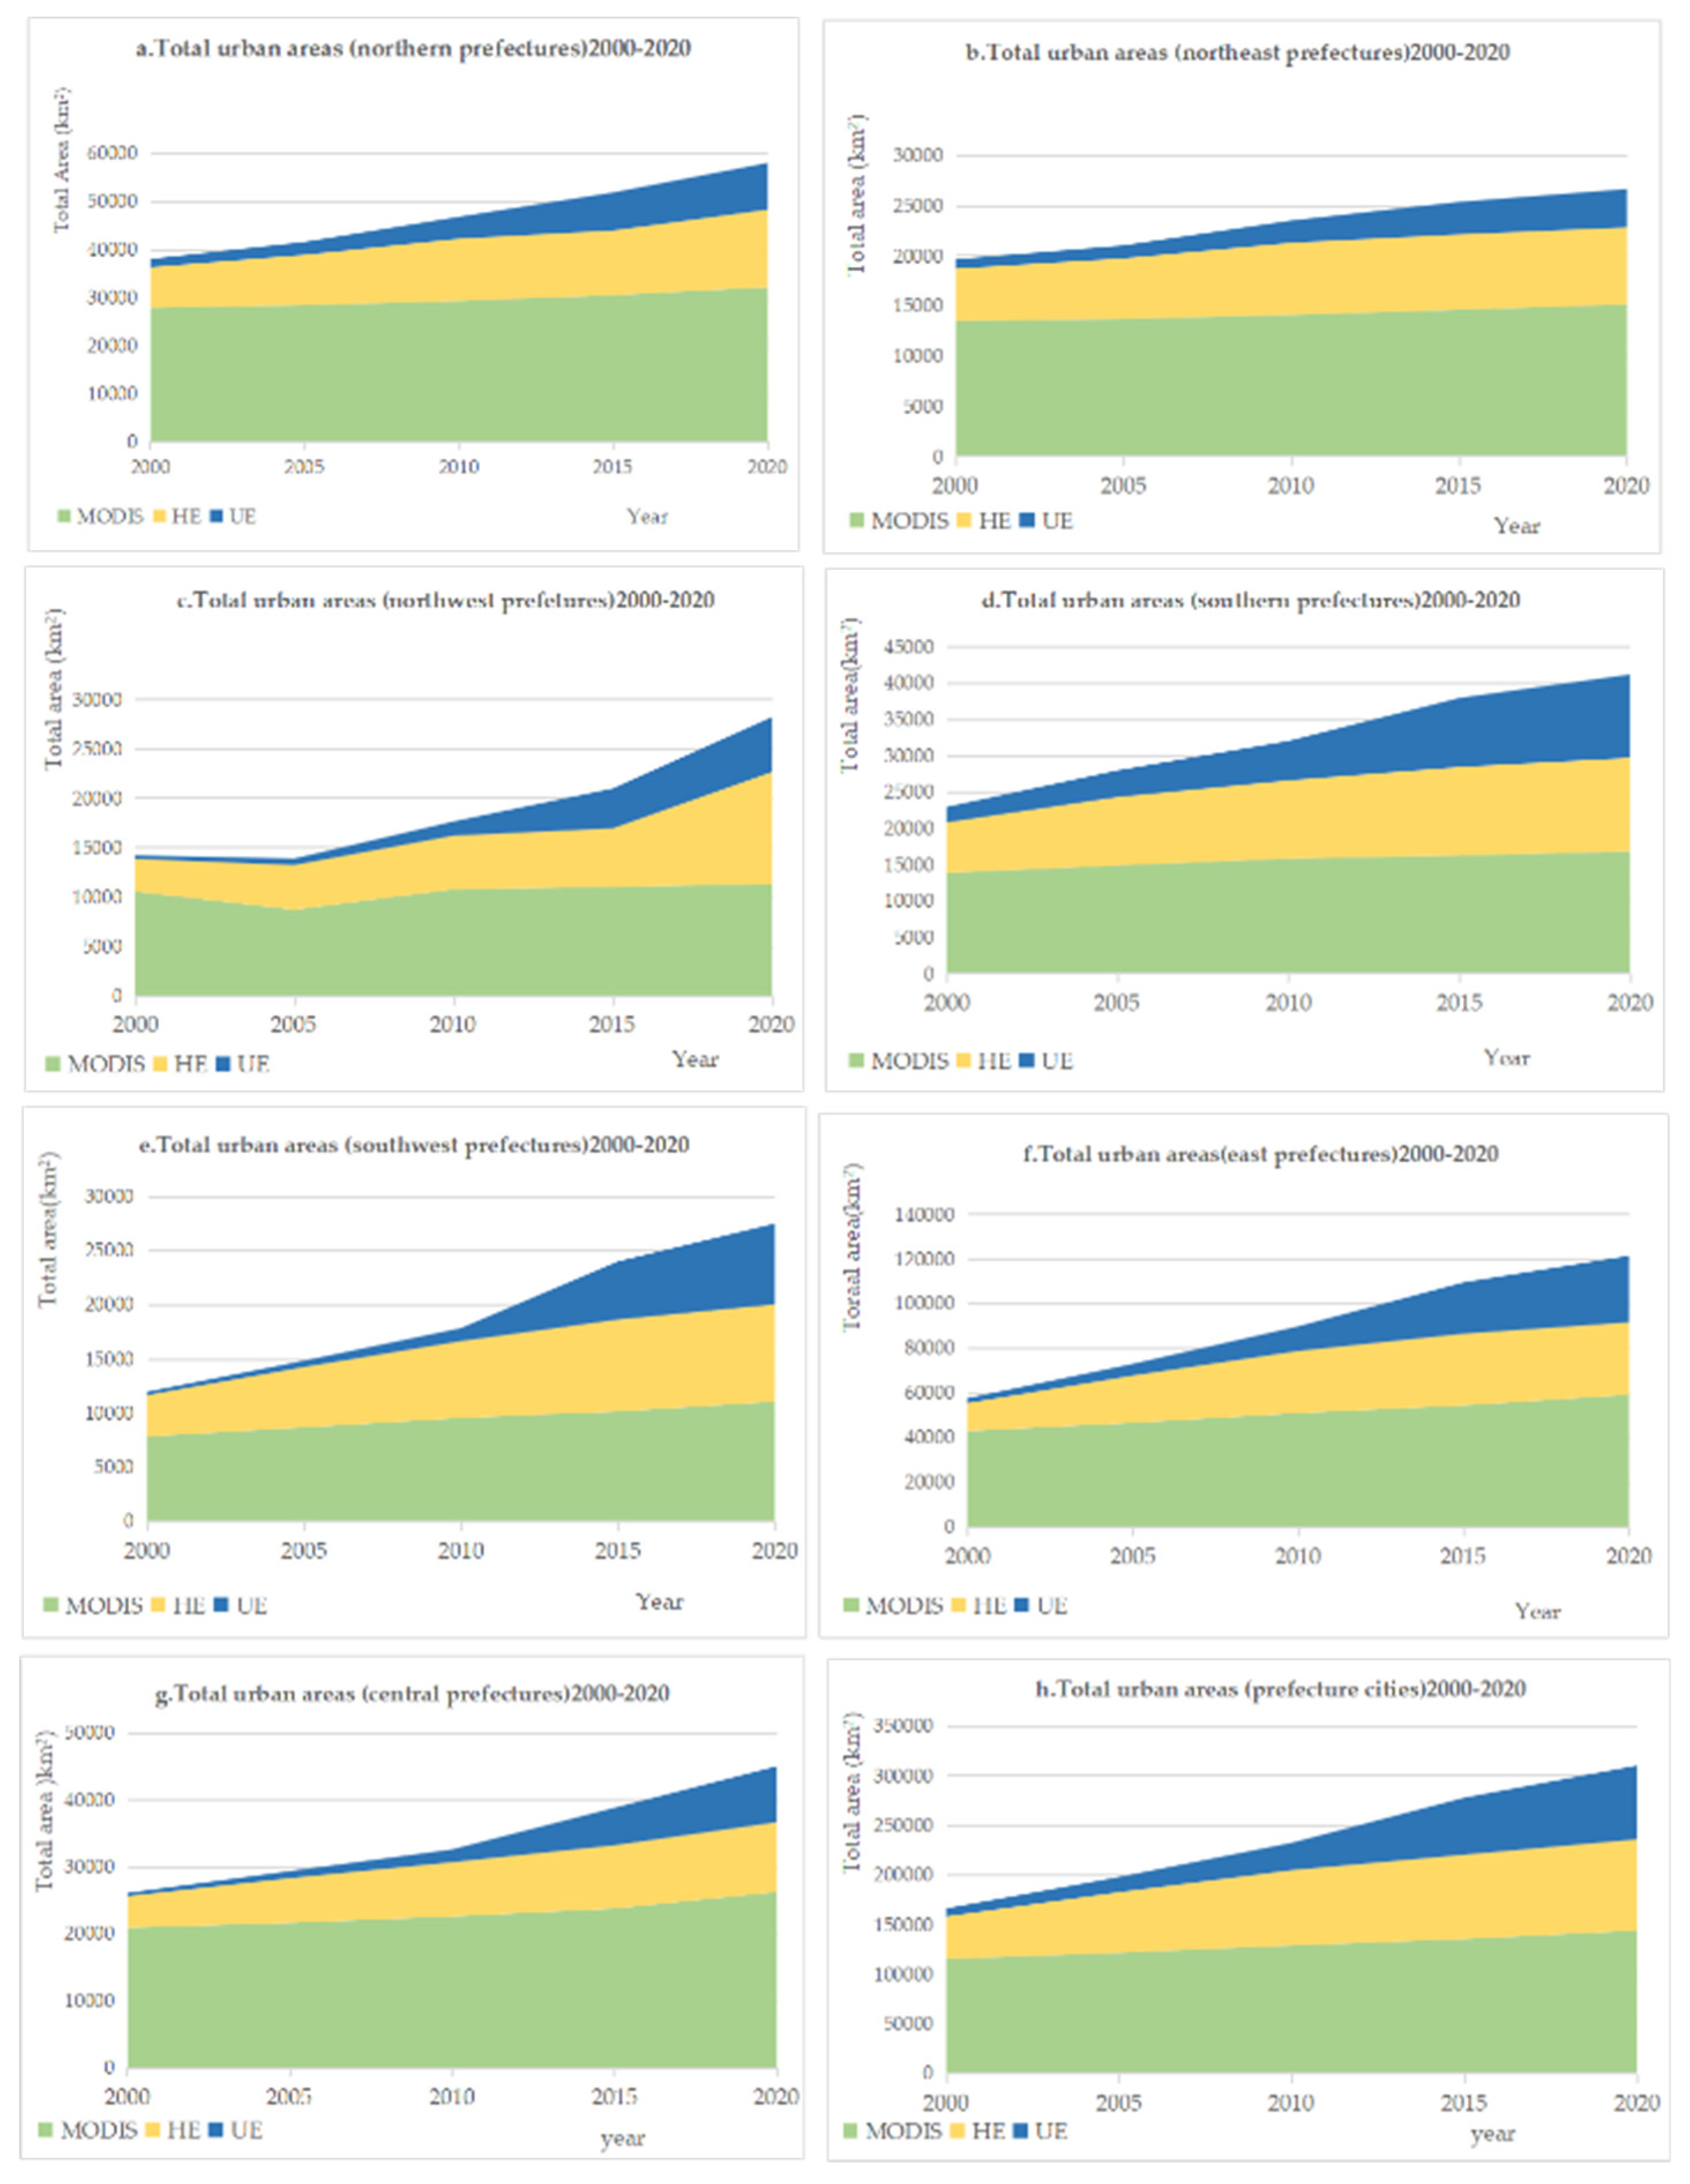
3.1. Evaluating the Expansion of urban entities from 2000-2020
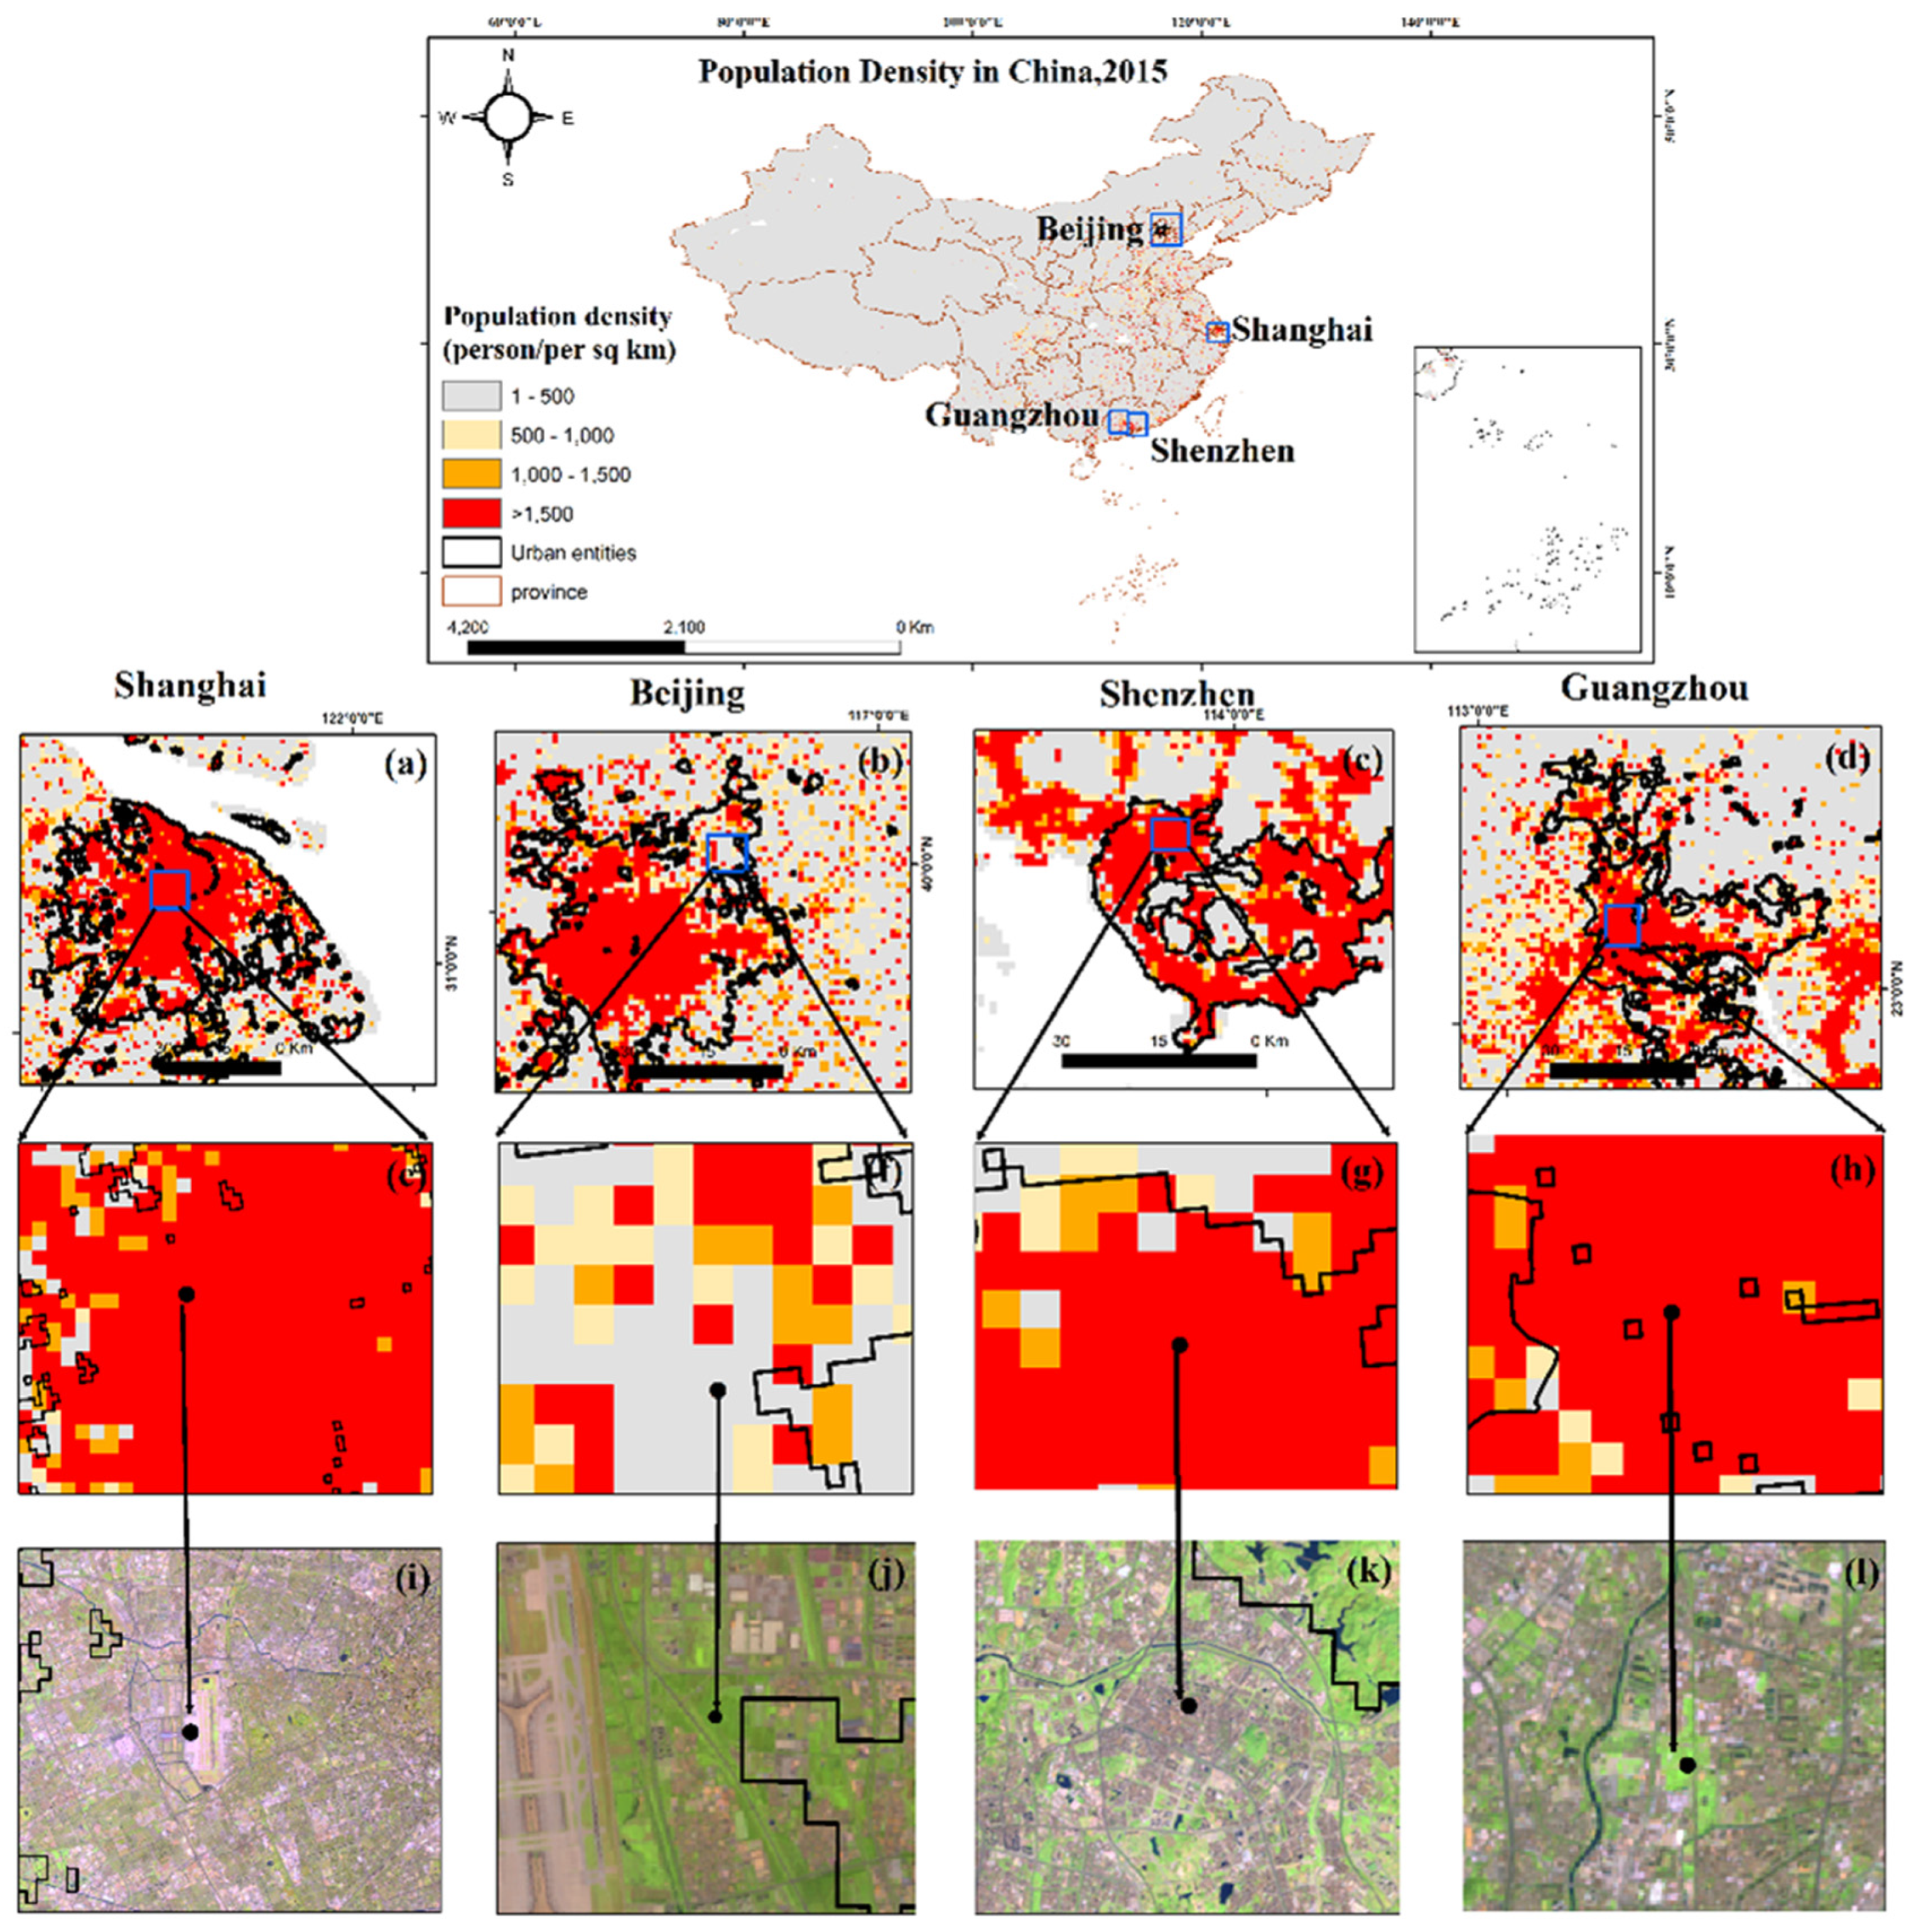
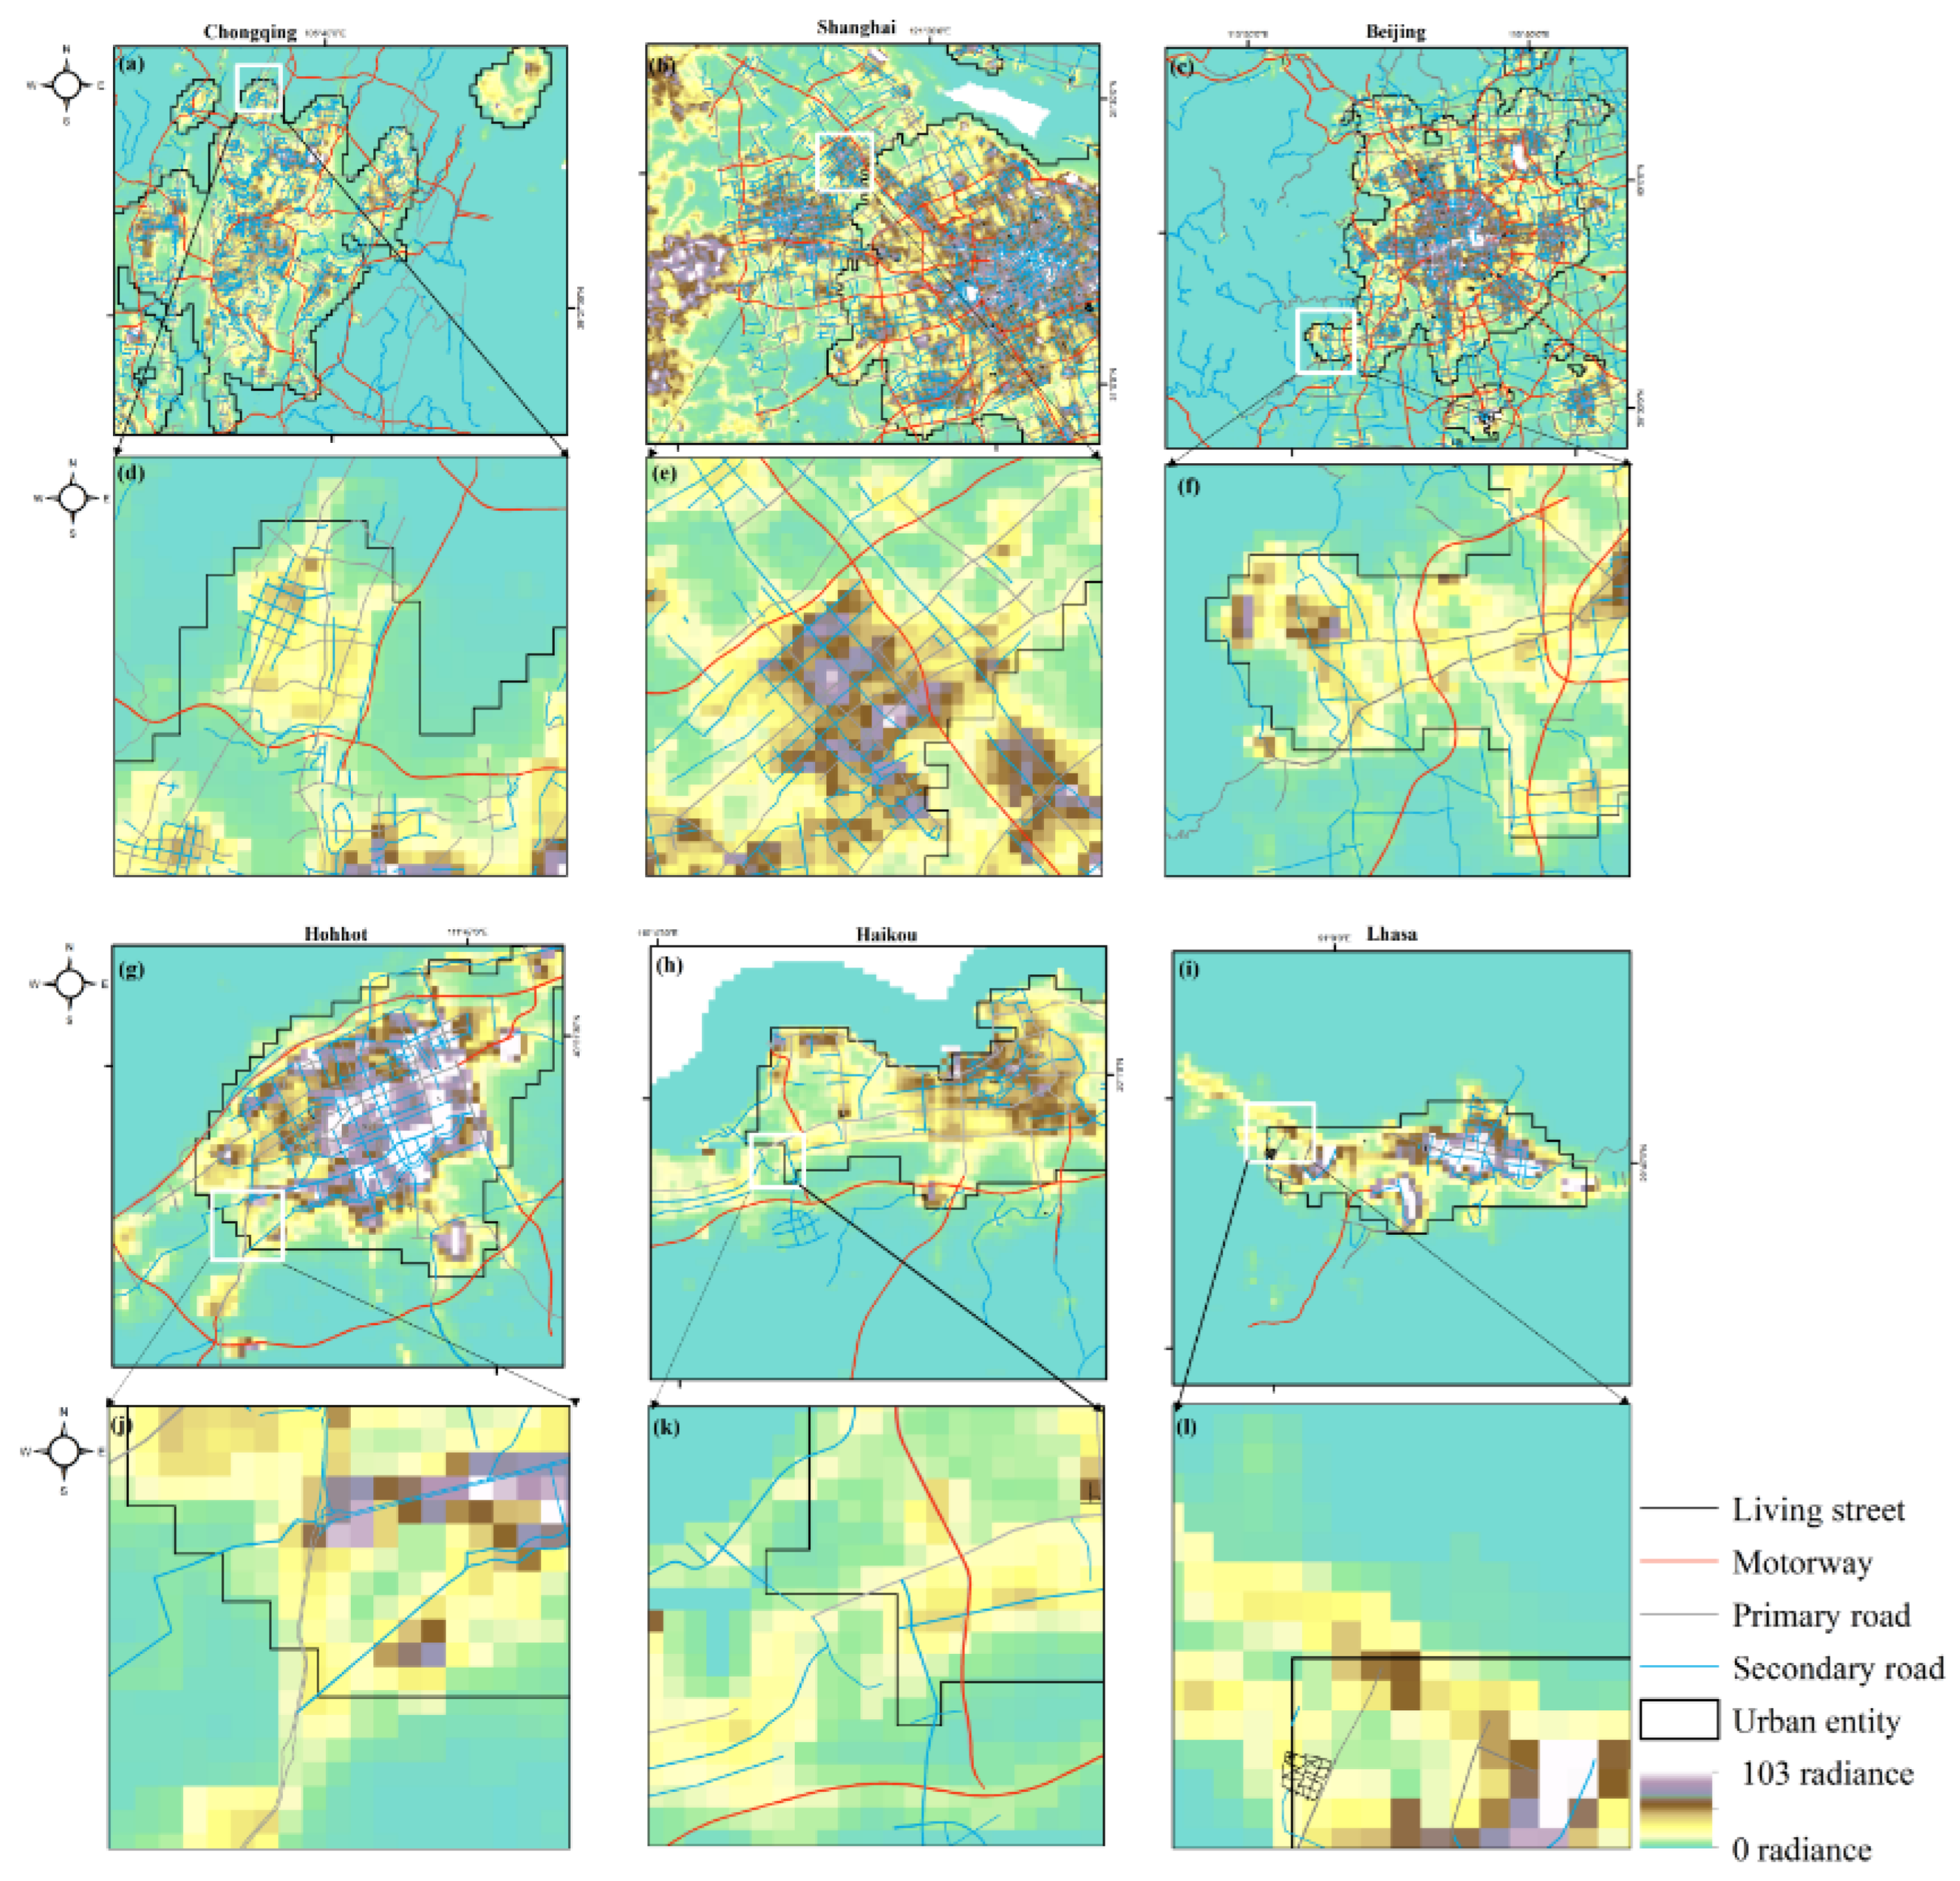
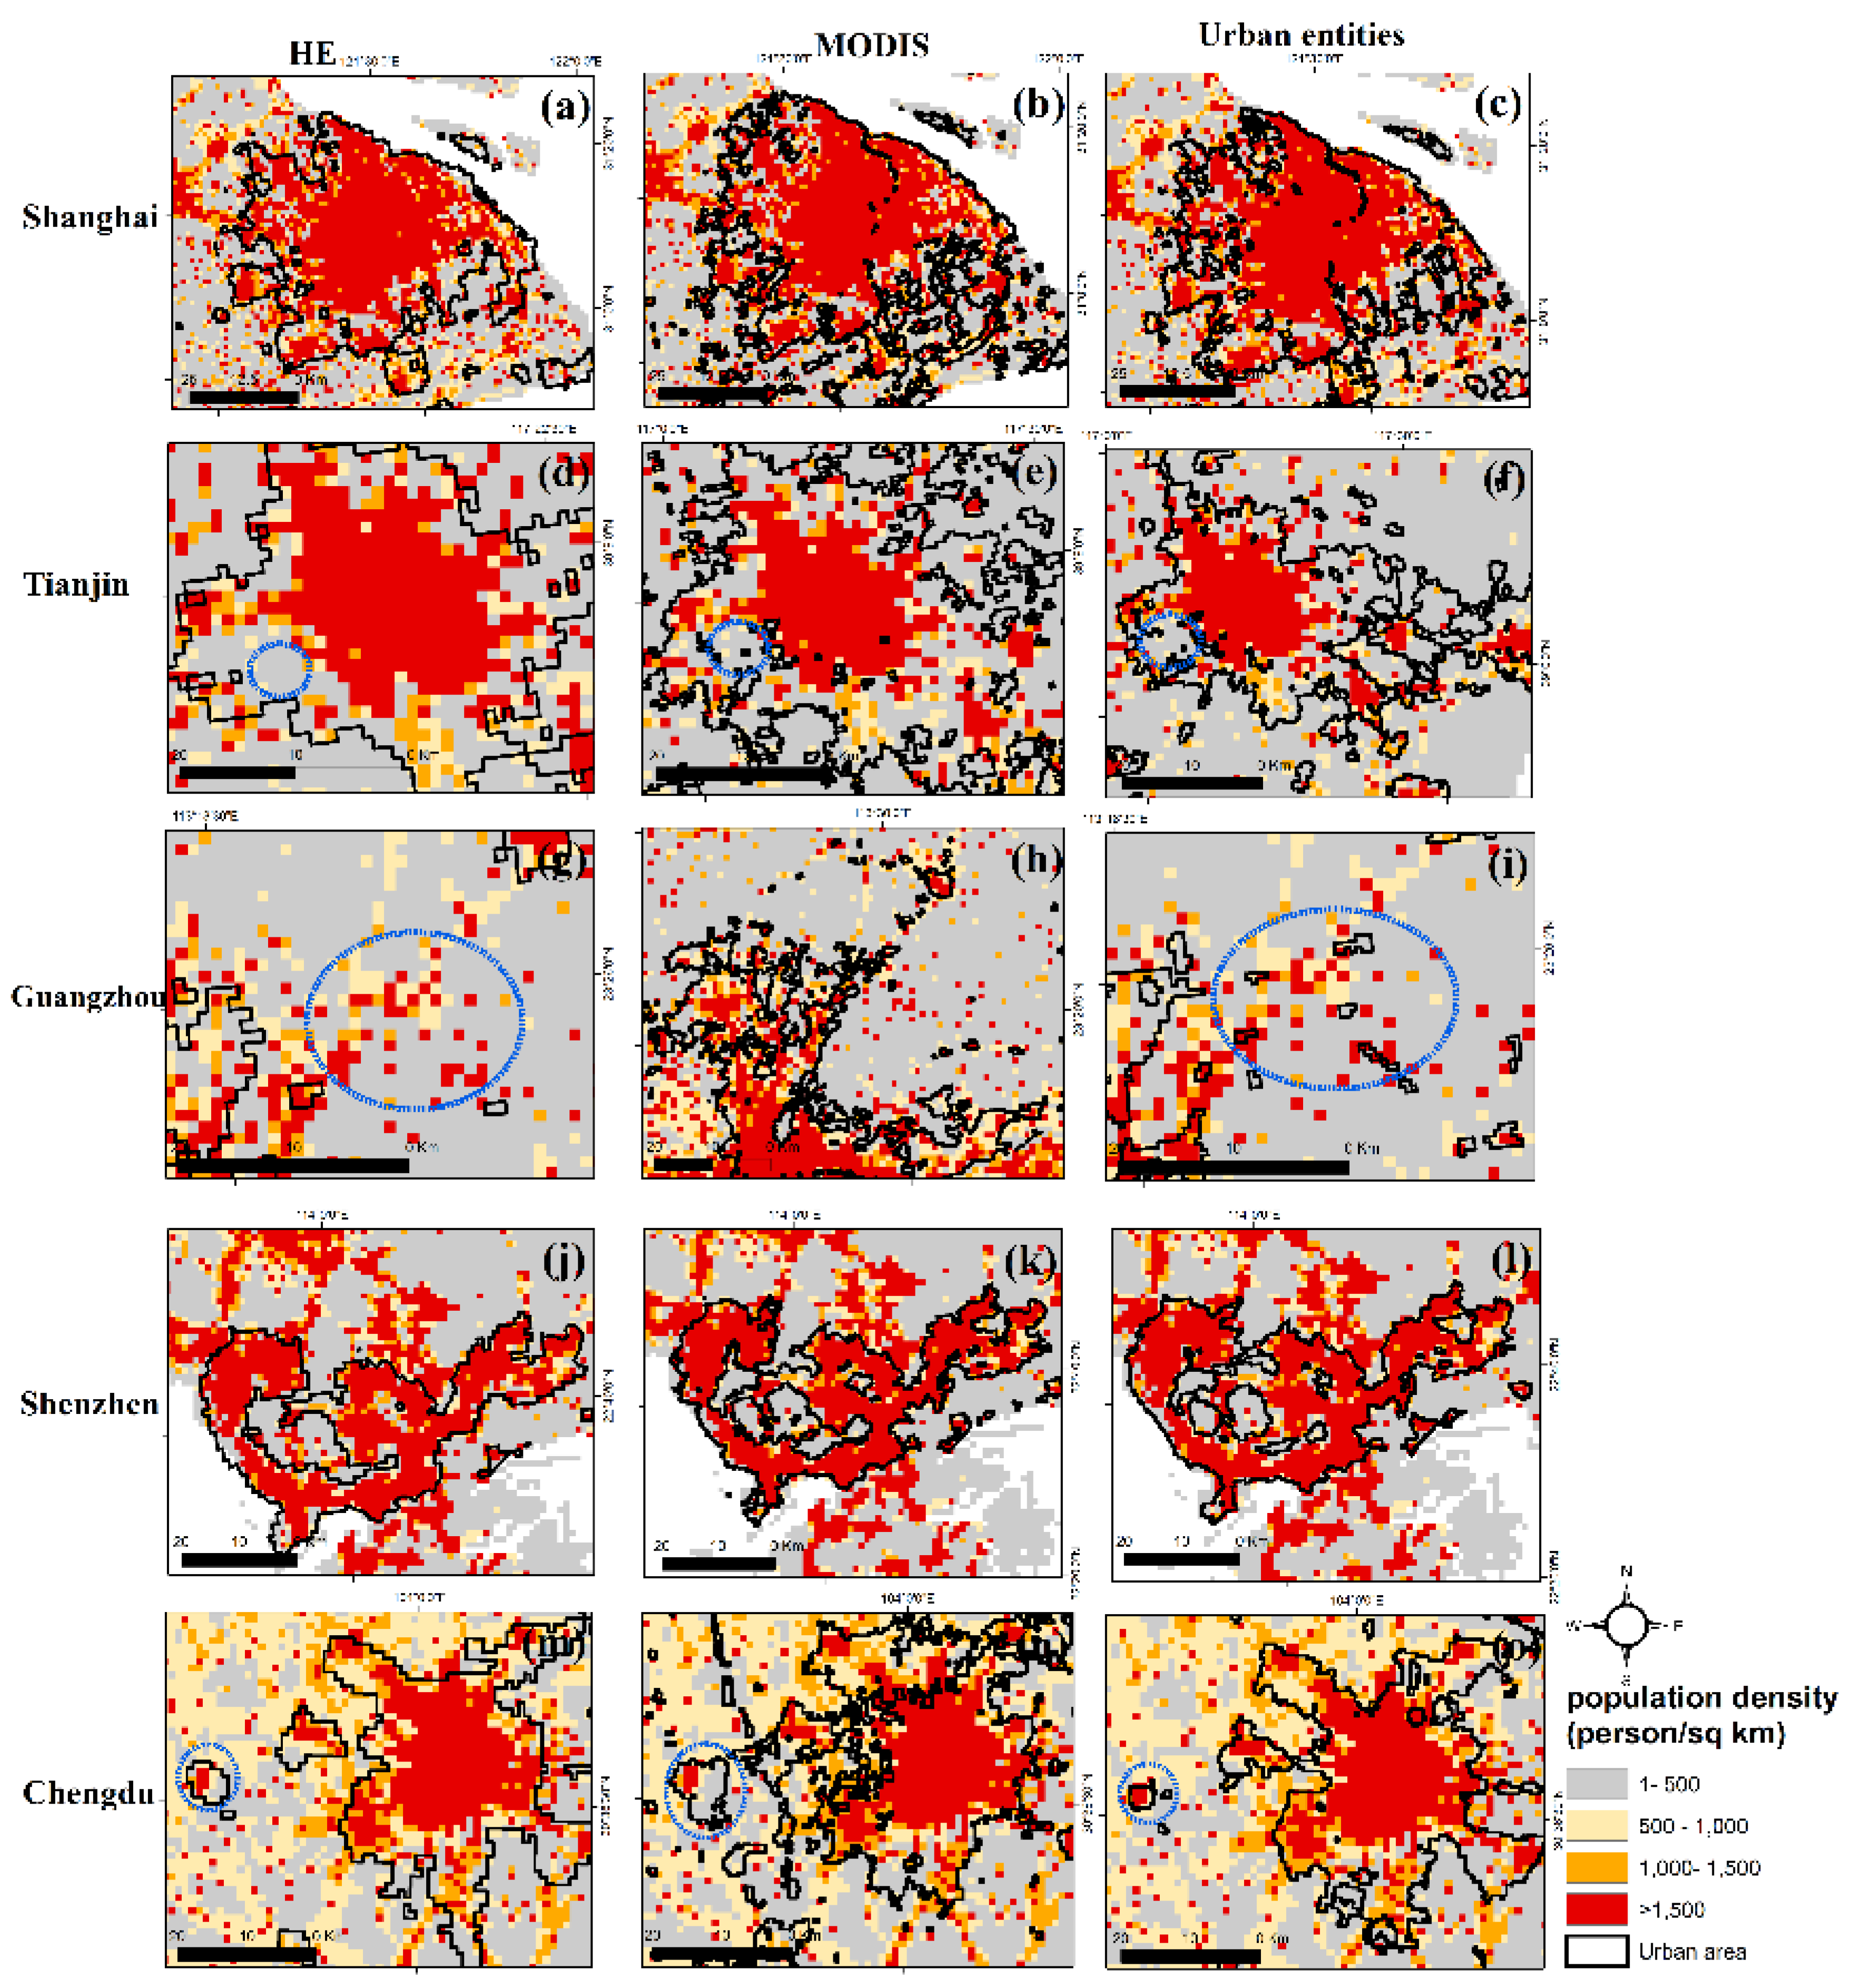
3.2. Compare results with the LandScan population and road networks
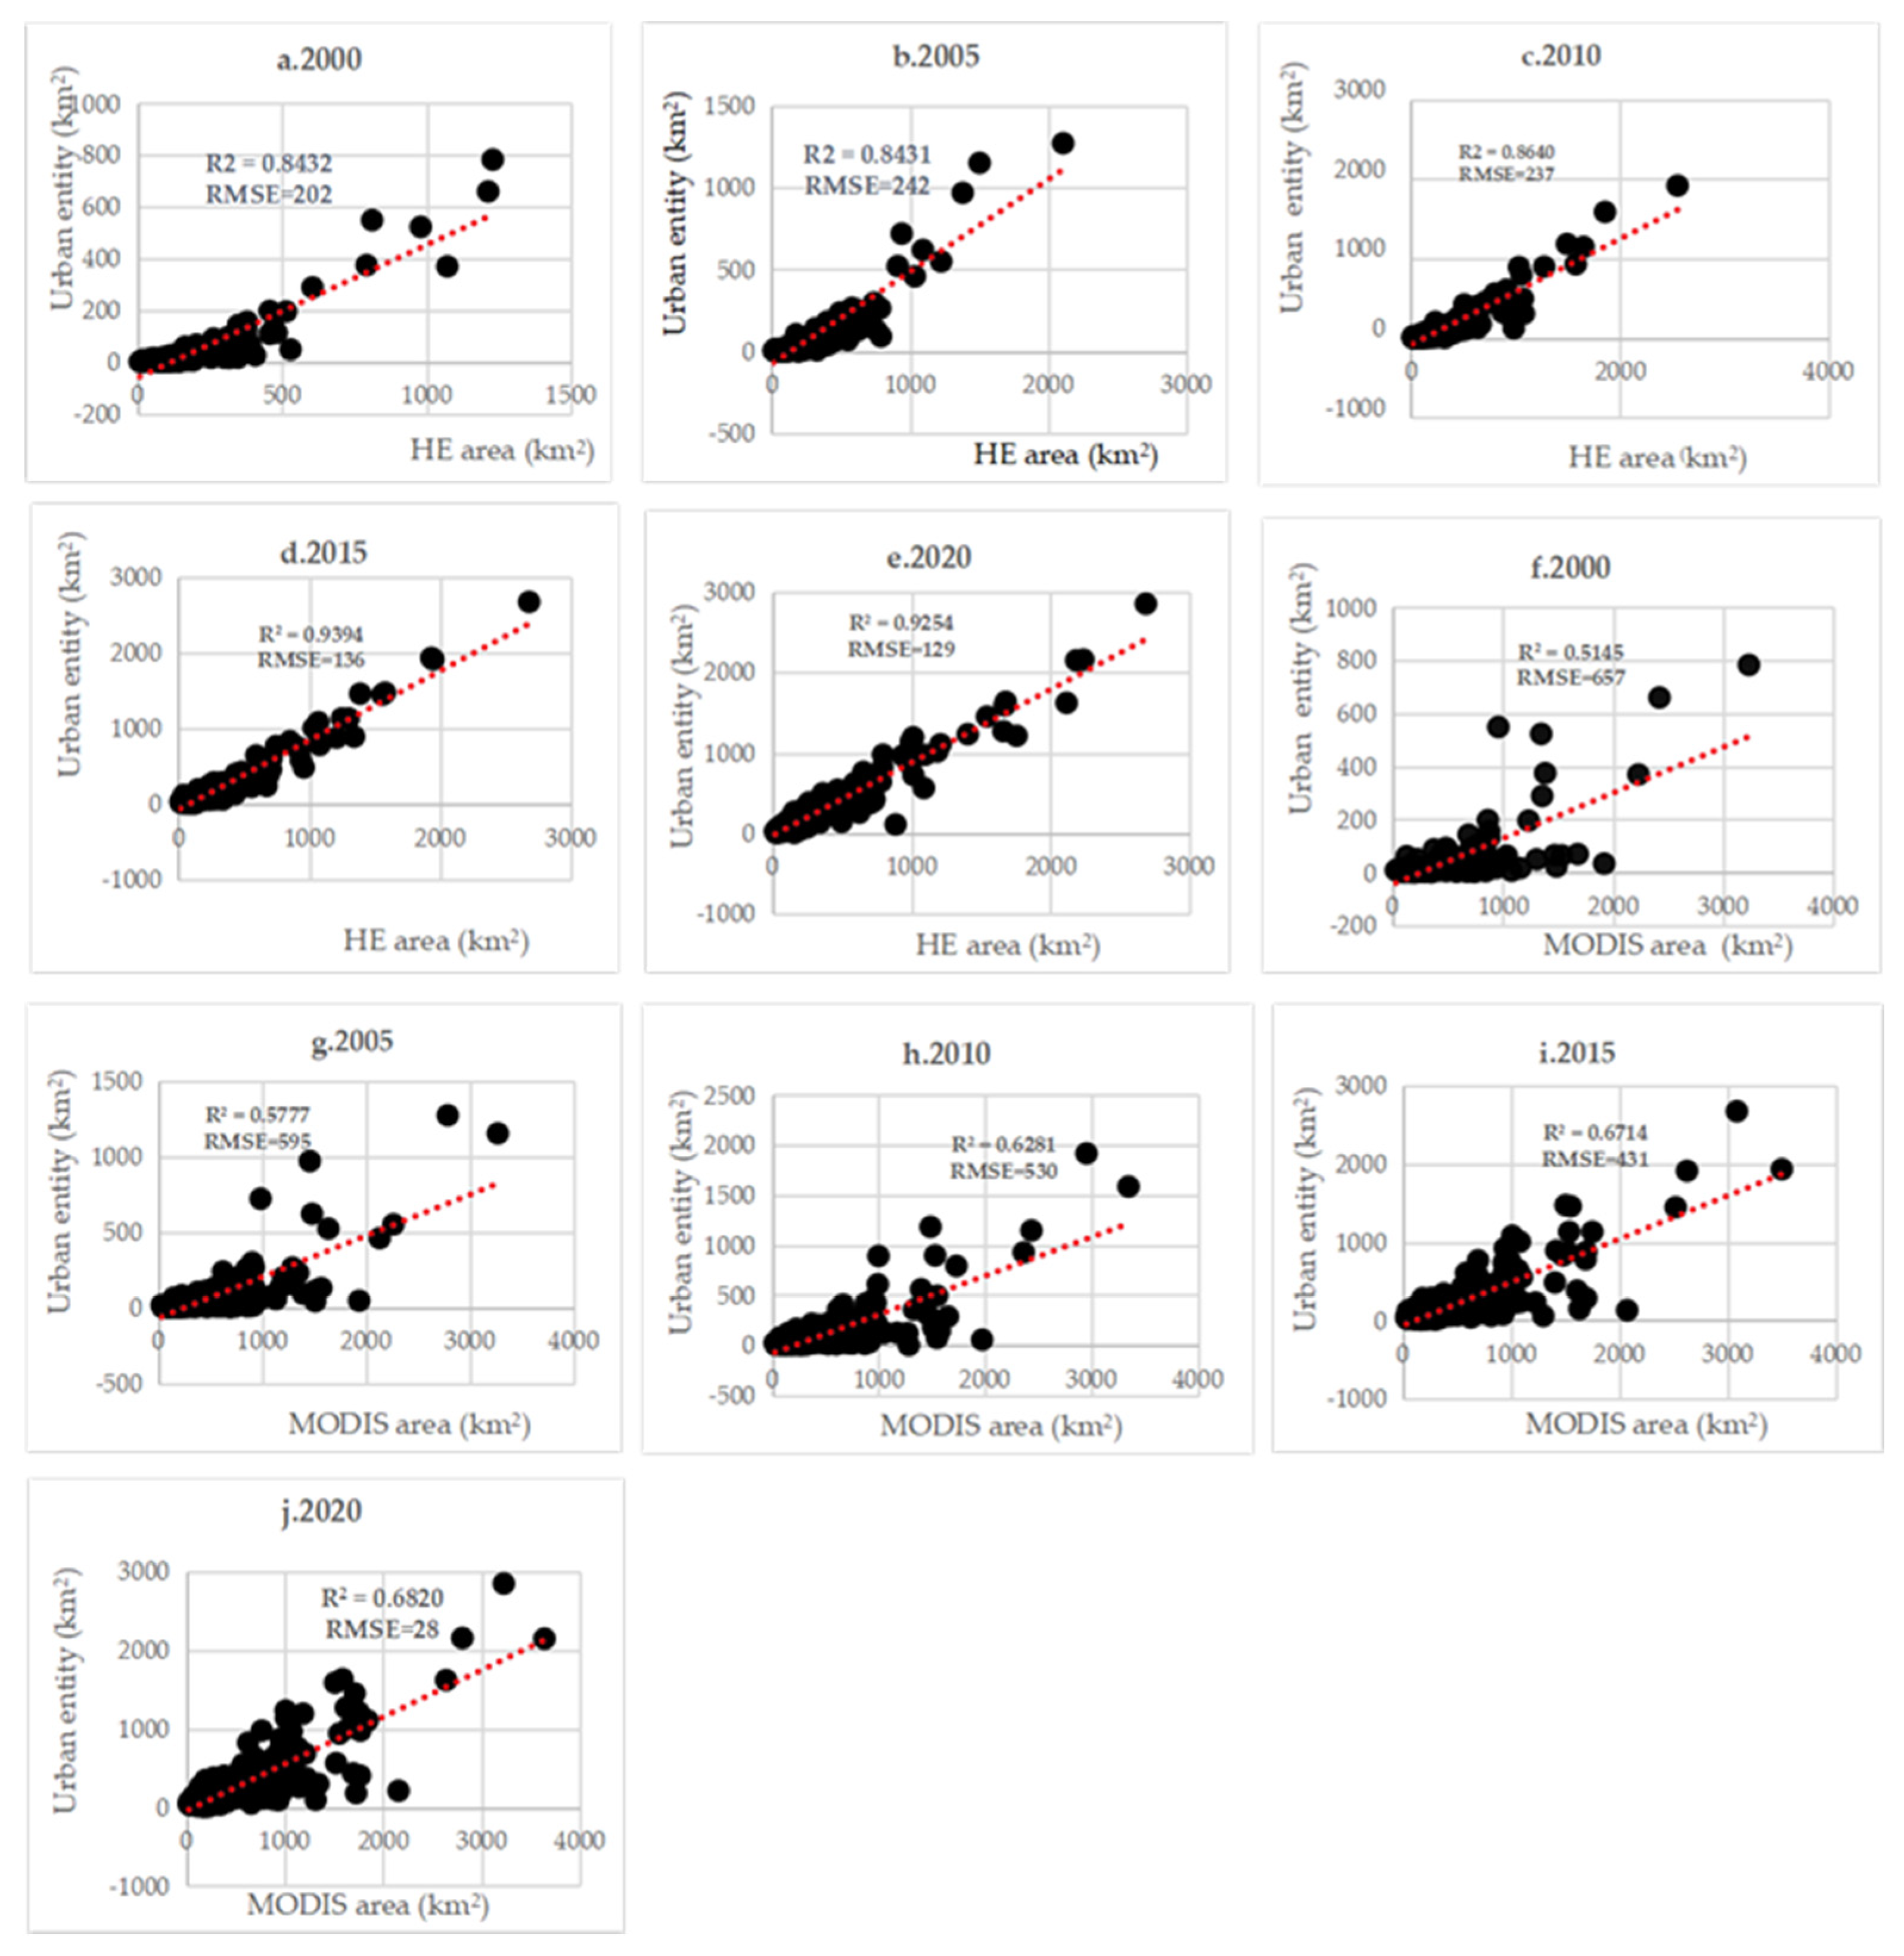
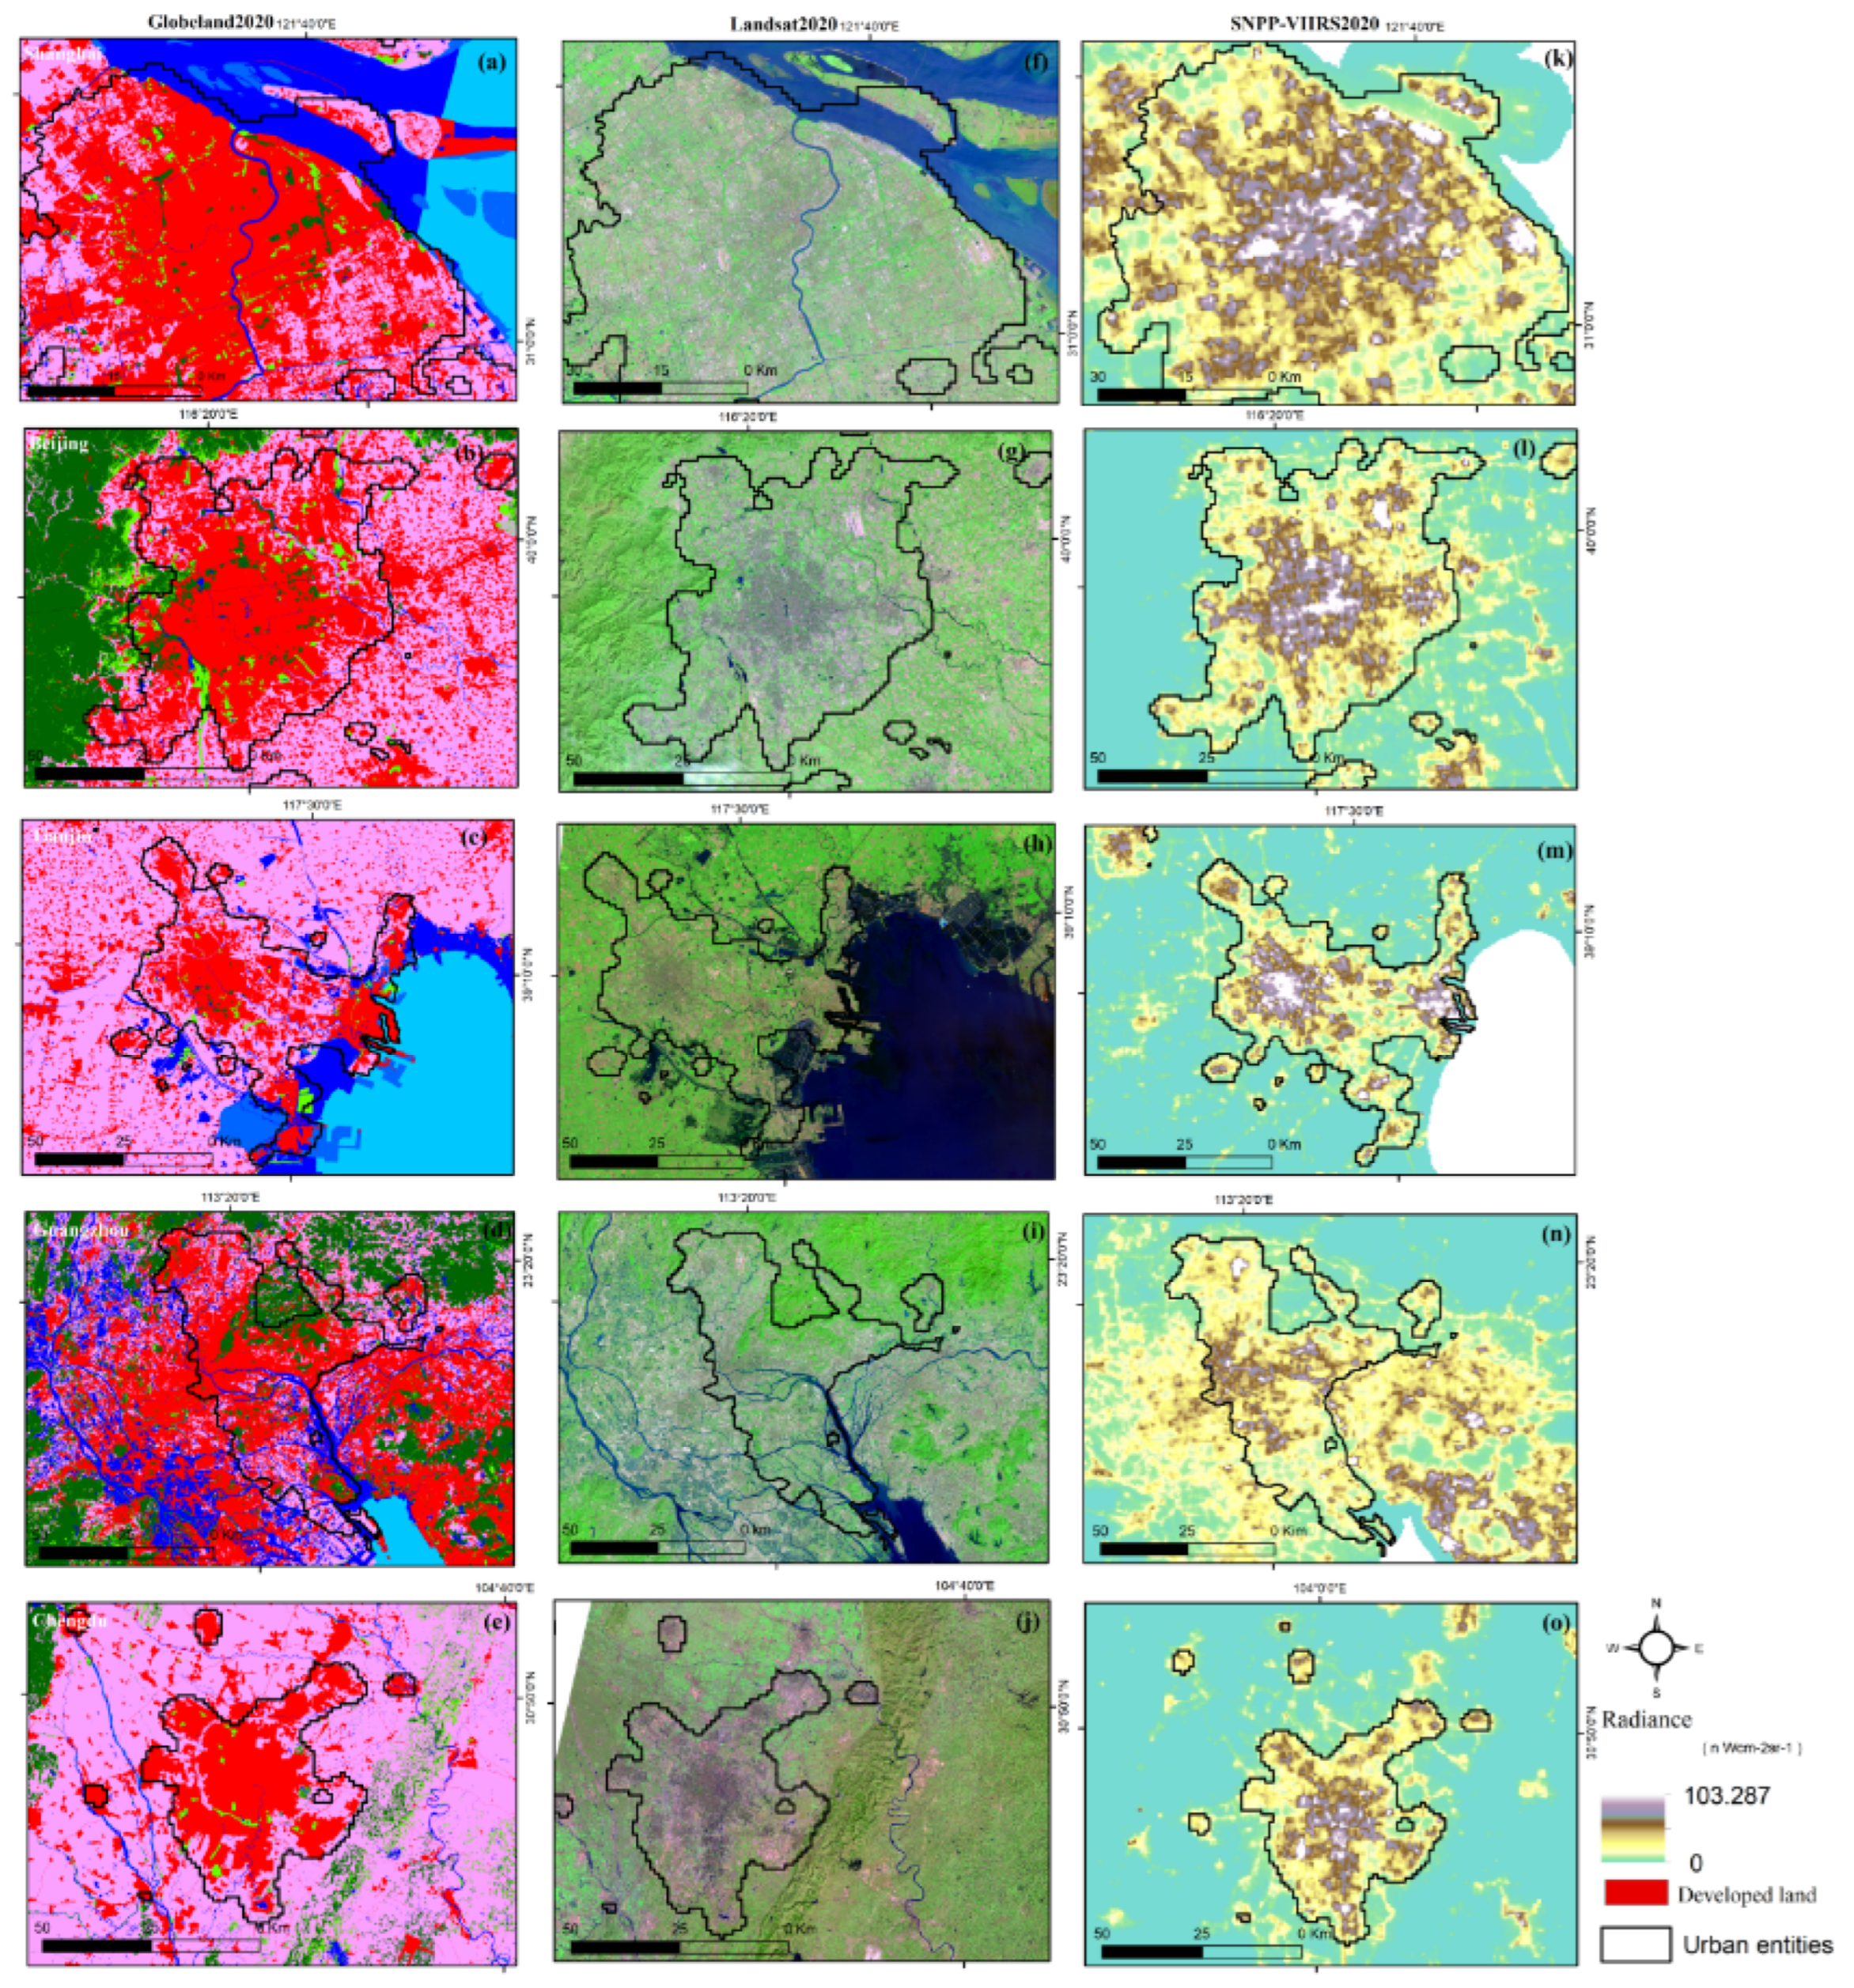
3.3. Compare results with the Global urban products
4. Discussion
4.1. Efficiency of SNPP-VIIRS-like data for urban mapping
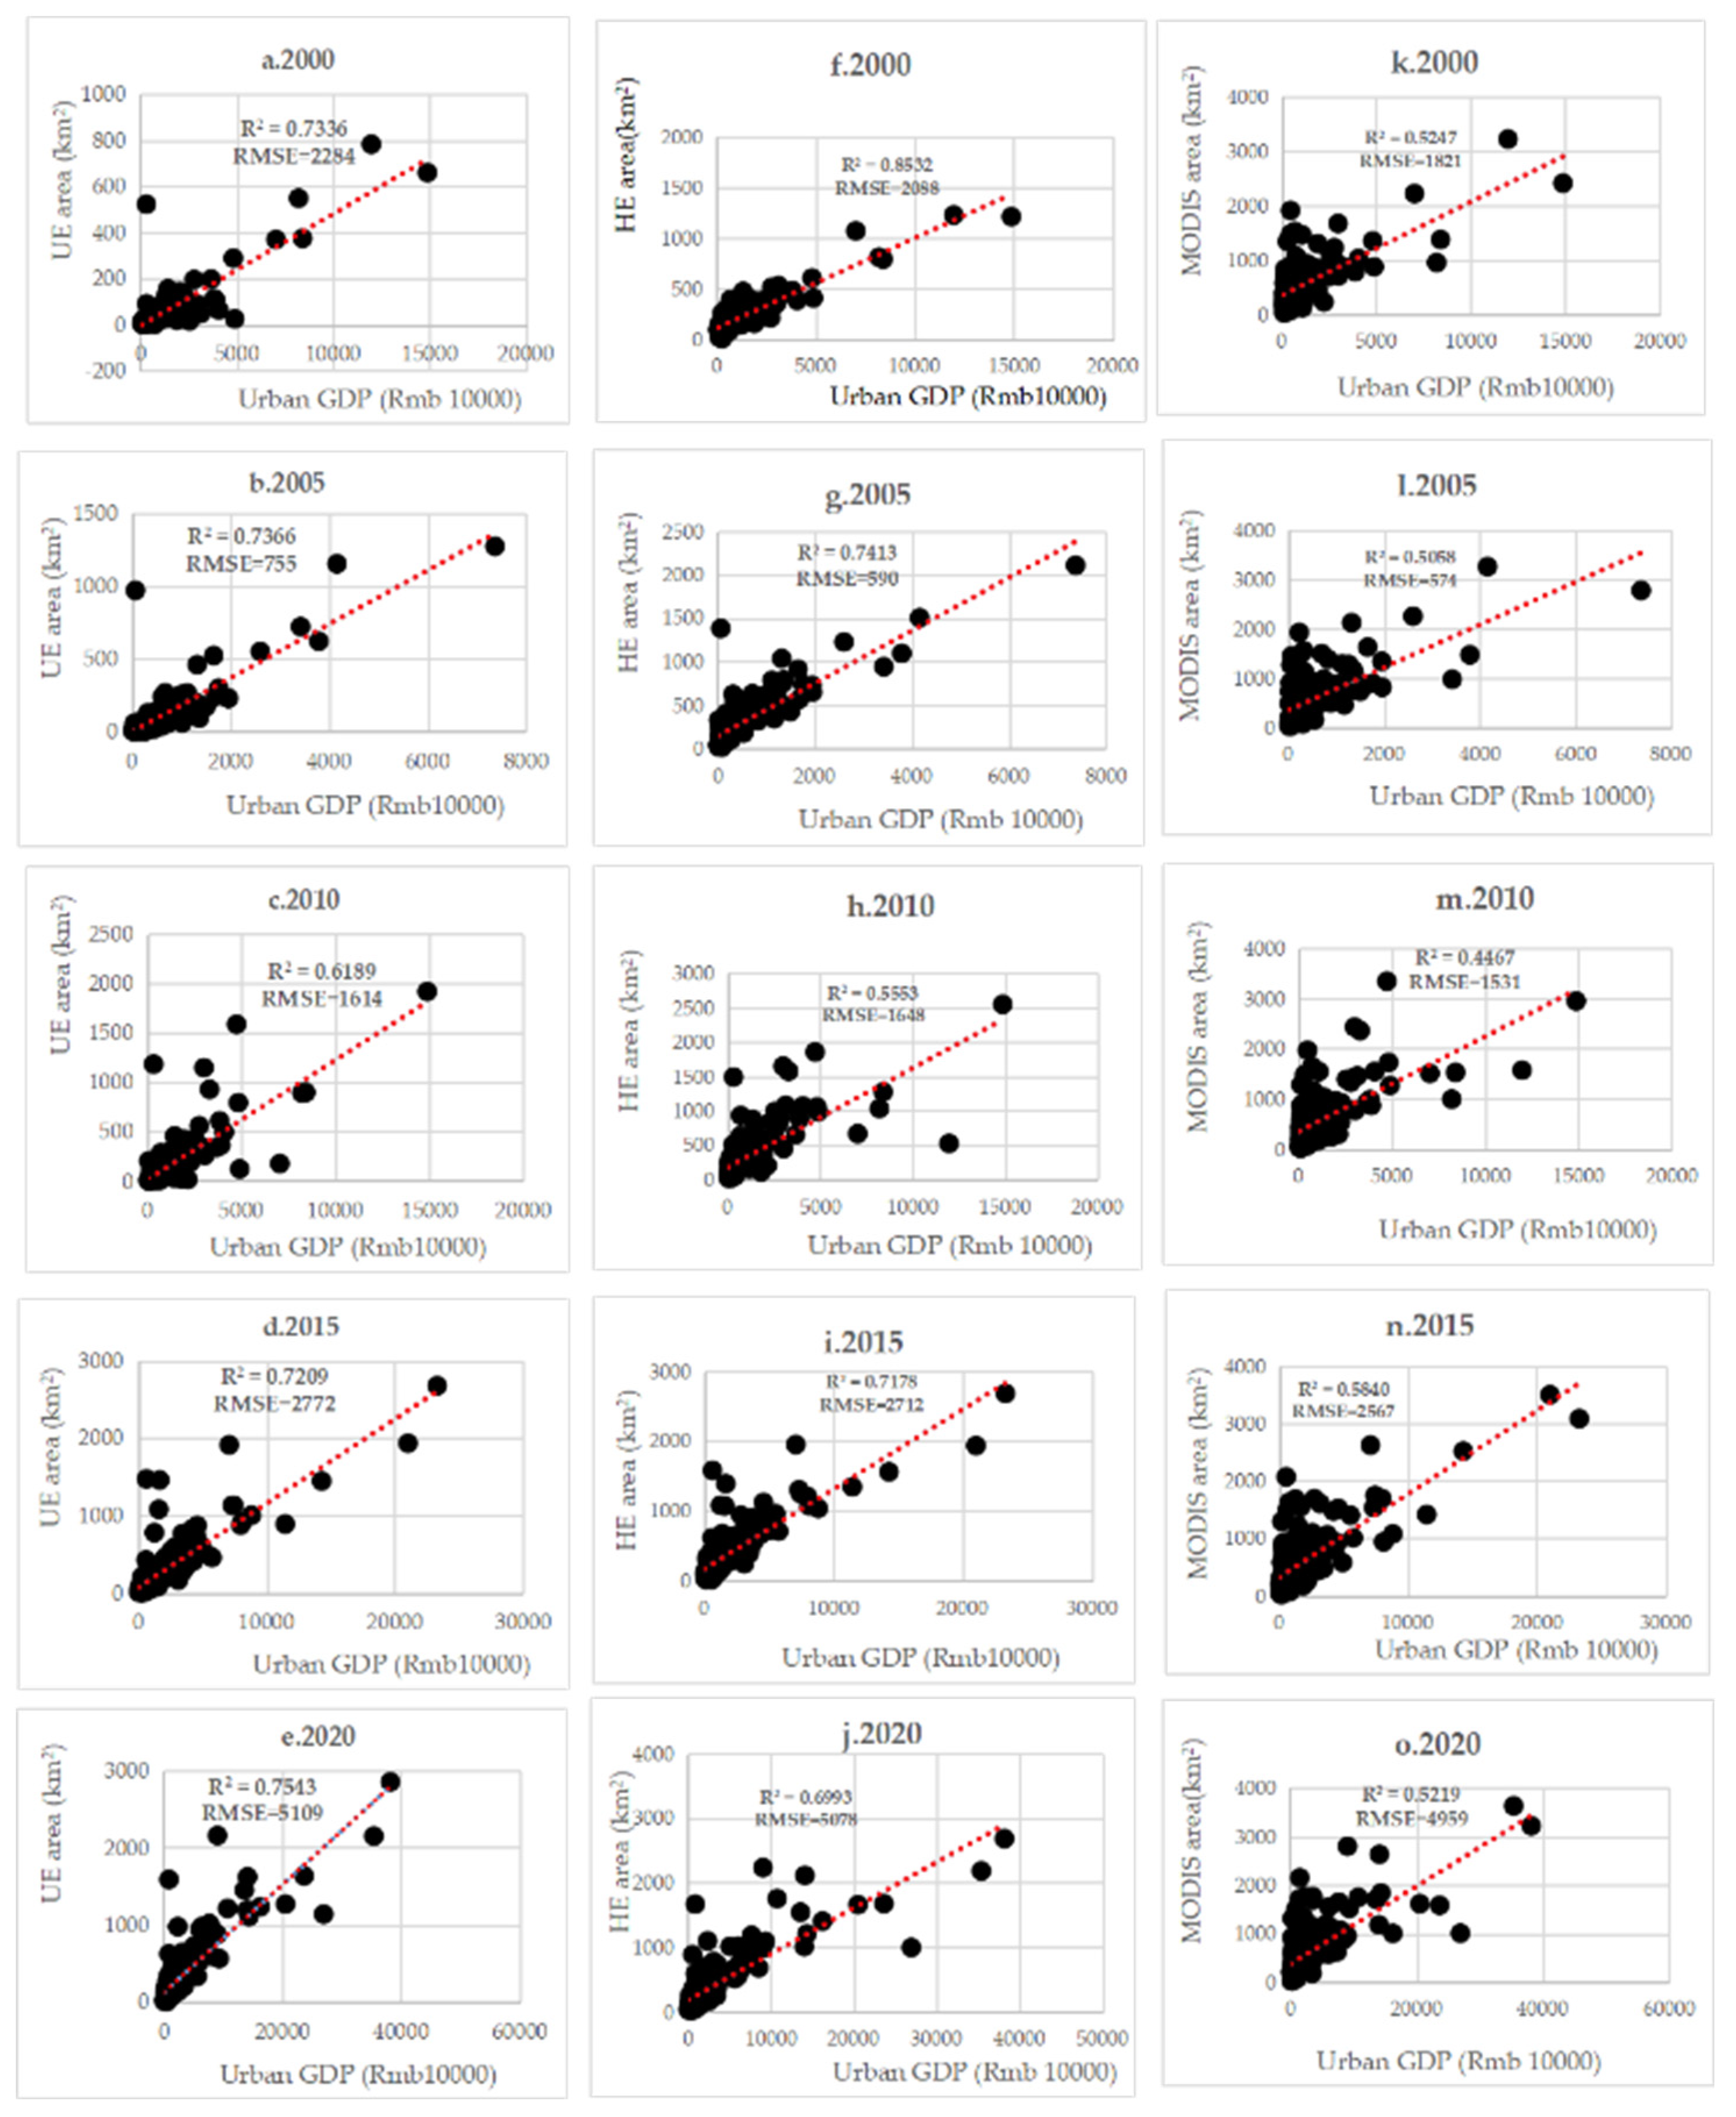
4.2. Relationship between urban growth and urban economic development
4.3. Applicability of K-Means Classification for urban mapping
4.4. Limitation and future research direction
5. Conclusions
Author Contributions
Funding
Acknowledgments
Conflicts of Interest
References
- Habitat, UN. ANNOTATION of the concept of the United Nations Human Settlements Program (UN-HABITAT) project; Russian state scientific research and design institute of Urbanistics: Moscow, Russia, 2006; pp1-14; http://hdl.handle.net/11374/681.
- Thapa, R.B.; Murayama, Y. Examining spatiotemporal urbanization patterns in Katmandu valley, Nepal: remote sensing and spatial metrics approach. Remote sens. 2009, 1, 534–556. [Google Scholar] [CrossRef]
- United Nations, Department of Economic, and Population Division Social Affairs. World urbanization prospects, The 2018 revision; Department of Economic and Social Affairs PD: New York, USA, 2018; pp. 1–126. https://population.un.org/wup/publications/Files/WUP2018-Report.pdf.
- Zhou, Y.; Smith, S. J.; Elvidge, C. D.; Zhao, K.; Thomson, A.; and Imhoff, M.A. Cluster-based method to map urban area from DMSP/OLS nightlights. Remote Sens. Environ. 2014, 147, 173–185. [Google Scholar] [CrossRef]
- Schneider, A.; Mark, A. F.; and Potere. D. Mapping global urban areas using MODIS 500-m data: New methods and datasets based on urban ecoregions. Remote Sens. Environ. 2010, 114(8), 1733–1746. [CrossRef]
- Zhang, Q.; Seto, K.C. Mapping urbanization dynamics at regional and global scales using multi-temporal DMSP/OLS nighttime light data. Remote Sens. Environ. 2011, 115, 2320–2329. [Google Scholar] [CrossRef]
- Fan, J.; Ma, T.; Zhou, C.; Zhou, Y.; Xu, T. Comparative estimation of urban development in China’s cities using socioeconomic and DMSP/OLS night light data. Remote Sens. 2014, 6, 7840–7856. [Google Scholar] [CrossRef]
- Bai, X.; Shi, p.; and Liu, Y. Society: Realizing China’s Urban Dream. Nature 2014, 509 (7499), 158–160. [CrossRef]
- Lu, L.; Zhang, Y.; and Luo, T.T. Difficulties and Strategies in the Process of Population Urbanization: A Case Study in Chongqing of China. The open J. of Soc. Sci. 2014, 2, 90–95. [Google Scholar] [CrossRef]
- Zhang, X.; Liu, L.; Wu, C.; Chen, X.; Gao, Y.; Xie, S.; Zhang, B. Development of a global 30 m impervious surface map using multi-source and multi-temporal remote sensing datasets with the Google Earth Engine platform. Earth Sys. Sci. Data. 2020, 12(3), 1625–48. [Google Scholar] [CrossRef]
- Gong, P.; Li, X.; Wang, J.; Chen, B.; Hu, T.; Liu, X.; Xu, B.; Yang, J.; Wei., Z. Annual maps of global artificial impervious area (GAIA) between 1985 and 2018. Remote Sens. Environ. 2020, 236, 111510. [Google Scholar] [CrossRef]
- Ellison, G.; Edward, L. G.; William, R. K. What causes industry agglomeration? Evidence from coagglomeration patterns. American Eco. Rev. 2010, 100(3), 1195–213. [Google Scholar] [CrossRef]
- Keuschnigg, M. Scaling trajectories of cities. Pro. Nat. Ac. Sci. 2019, 116(28), 13759–13761. [Google Scholar] [CrossRef]
- Lv, Y.; Lin, Z.; Guobiao, Y.; and Xinqi, Z. Detecting the true urban polycentric pattern of Chinese cities in morphological dimensions: A multi-scale analysis based on geospatial big data. Cities. 2021, 116. [Google Scholar] [CrossRef]
- Chen, Z.; Bailang, Y.; Yingjie, H.; Chang, H.; Shi, K.; Jianping, W. Estimating house vacancy rate in metropolitan areas using NPP-VIIRS nighttime light composite data. IEEE J. Sel. Top. Appl. Earth Obs. Remote Sens. 2015, 8(5), 2188–2197. [Google Scholar] [CrossRef]
- Henderson, J.V.; Dzhamilya, N.; and Sebastian, K. Measuring urban economic density. J. Ur. Econ. 2019, 103188. [Google Scholar] [CrossRef]
- Grove, J.; Morgan, M.; Cadenasso, L.; and Steward, T.P. The Baltimore School of urban ecology. Yale University Press. 2015. [Google Scholar]
- Xu, T.; Ma, T.; Zhou, C.; Zhou, Y. Characterizing Spatio-Temporal Dynamics of Urbanization in China Using Time Series of DMSP/OLS Night Light Data. Remote Sens. 2014, 6, 7708–7731. [Google Scholar] [CrossRef]
- Imhoff, M.L.; Lawrence, W. T.; Stutzer, D. C.; and Elvidge, C. D. A technique for using composite DMSP/OLS city lights satellite data to map urban area. Remote Sens. Environ. 1997, 61(3), 361–370. [Google Scholar] [CrossRef]
- Elvidge, C.D.; Baugh, K. E.; Kihn, E. A.; Kroehl, H. W.; and Davis, E. R. Mapping city lights with nighttime data from the DMSP operational line scan system. Photo. Eng. Remote Sens. 1997, 63(6), 727–734. [Google Scholar]
- Small, C.; Francesca, P.; Elvidge, C.D. Spatial analysis of global urban extent from DMSP-OLS night lights. Remote Sens. Environ. 2005, 96(3), 277–291. [Google Scholar] [CrossRef]
- Liu, Z.; He., C.; Zhang, Q.; Huang, Q.; Yang, Y. Extracting the dynamics of urban expansion in China using DMSP-OLS nighttime light data from 1992 to 2008. Landscape Ur. Pl. 2012, 106 (1), 62–72. [CrossRef]
- Ma, T.; Zhou, C.; Tao, P.; Haynie, S.; Fan, J. Quantitative estimation of urbanization dynamics using time series of DMSP/OLS nighttime light data: A comparative case study from China’s cities. Remote Sens. Environ. 2012, 124, 99–107. [Google Scholar] [CrossRef]
- Shi, K.; Huang, C.; Yu, B.; Yin, B.; Huang, Y.; and Wu., J. Evaluation of NPP-VIIRS night-time light composite data for extracting built-up urban areas. Remote Sens. Lett. 2014, 5 (4), 358–366. [Google Scholar] [CrossRef]
- Ma, Q.; He, C.; Wu, J.; Liu, Z.; Zhang, Q.; and Sun, Z. quantifying spatiotemporal patterns of urban impervious surfaces in China: An improved assessment using nighttime light data. Landscape Ur. Pl. 2014, 130, 36–49. [Google Scholar] [CrossRef]
- Xiao, P.; Wang, X.; Feng, X.; Zhang, X.; and Yang, Y. Detecting China’s Urban Expansion over the Past Three Decades Using Nighttime Light Data. IEEE J. Sel. Top. Appl. Earth Obs. remote Sens. 2014, 7(10), 4095–4106. [Google Scholar] [CrossRef]
- Ma, T.; Zhou, Y.; Zhou, C.; Haynie, S.; Pei, T.; Xu, T. Night-time light derived estimation of spatiotemporal characteristics of urbanization dynamics using DMSP/OLS satellite data. Remote Sens. Environ. 2015, 158, 453–464. [Google Scholar] [CrossRef]
- Su, Y et al. A new method for extracting built-up urban areas using DMSP-OLS nighttime stable lights: A case study in the Pearl River Delta, southern China. GI Science Remote Sens. 2015, 52(2), 218–238. [CrossRef]
- Shi, K.; Chen, Y. Shi, K.; Chen, Y.; Yu,B.; Xu,T.; Li, L.; Huang, C.; Liu, R.; Chen, Z.; Wu, J. Urban Expansion and Agricultural Land Loss in China: A Multi-scale Perspective. Sustainability 2016, 8(790), 2–16. [Google Scholar] [CrossRef]
- Ju, Y.; Dronova, I.; Ma, Q.; Zhang, X. Analysis of urbanization dynamics in mainland China using pixel-based night-time light trajectories from 1992 to 2013. Int. J. Remote Sens. 2017, 38(21), 6047–6072. [Google Scholar] [CrossRef]
- Dou, Y.; Zhifeng, L.; He, C.; and Yue, H. Urban Land Extraction Using VIIRS Nighttime Light Data: An Evaluation of Three Popular Methods. Remote Sens. 2017, 9(175), 1–18. [Google Scholar] [CrossRef]
- Liu, Y.; Delahunty, T.; Zhao, N.; and Cao, G. These lit areas are undeveloped: Delimiting China’s urban extents from threshold nighttime light imagery. Int. J. App. Earth Obs. Geoinf. 2016, 50, 39–50. [Google Scholar] [CrossRef]
- Chen, Z.; Yu, B.; Song, W.; Liu, H.; Wu, Q.; Shi, K.; and Wu, J. A New Approach for Detecting Urban Centers and Their Spatial Structure with Nighttime Light Remote Sensing. IEEE Tra. Geosci. Remote Sens. 2017, 55(11), 6305–6319. [Google Scholar] [CrossRef]
- Lin, Z.; Xu, H.S. Monitoring of the Urban Expansion Dynamics in China's East Coast Using DMSP/OLS Nighttime Light Imagery. J. Geo. inf. Sci. 2019, 21(7), 1074–1085. [Google Scholar] [CrossRef]
- Ma, M.; Lang, Q.; Yang, H.; Shi, K.; Ge, W. Identification of Polycentric Cities in China Based on NPP-VIIRS Nighttime Light Data. Remote Sens. 2020, 12(3248), 2–28. [Google Scholar] [CrossRef]
- Zheng, Y.; Zhou, Q.; He, Y.; Wang, C.; Wang, X.; Wang, H. An Optimized Approach for Extracting Urban Land Based on log-Transformed DMSP-OLS Nighttime Light, NDVI, and NDWI. Remote Sens. 2021, 13(766), 1–22. [Google Scholar] [CrossRef]
- Liu, S.; Shi, K.; Wu, Y. Identifying and evaluating suburbs in China from 2012 to 2020 based on SNPP–VIIRS nighttime light remotely sensed data. Int. J. App. Earth Obs. Geo info. 2022, 114(103041), 1–13. [Google Scholar] [CrossRef]
- Zheng, Y.; He, Y.; Zhou, Q.; Wang, H. Quantitative Evaluation of Urban Expansion using NPP-VIIRS Nighttime Light and Landsat Spectral Data. Sus. Cities Soc. 2022, 76(103338), 1–12. [Google Scholar] [CrossRef]
- Shi, K.; Wu, Y.; Liu, S.; Chen, Z.; Huang, C.; and Cui, Y. Mapping and evaluating global urban entities (2000–2020): A novel perspective to delineate urban entities based on consistent nighttime light data. GI Sci. Remote Sens. 2023, 60(1), 1–20. [Google Scholar] [CrossRef]
- Elvidge, C.D.; Baugh, K. E.; Zhizhin, M.; and Hsu, F. Why VIIRS data are superior to DMSP for mapping nighttime lights. Proc. Asia-Pac. Adv. Netw. 2013, 35, 62–69. [Google Scholar] [CrossRef]
- Zheng, Y.; Tang, L.; Wang, H. An improved approach for monitoring urban built-up areas by combining NPP-VIIRS nighttime light, NDVI, NDWI, and NDBI. J. Cleaner Pro. 2021, 328(129488), 1–13. [Google Scholar] [CrossRef]
- Shi, K.; Chang, Z.; Chen, Z.; Wu, J.; Yu, B. Identifying and evaluating poverty using multi-source remote sensing and point of interest (POI) data: A case study of Chongqing, China. J. Cle. Pro 2020, 255(120245). [Google Scholar] [CrossRef]
- Shi, K.; Shen, J.; Wu, Y.; Liu, S.; Li. L. Carbon dioxide (CO2) emissions from the service industry, traffic, and secondary industry as revealed by the remotely sensed nighttime light data. Int. J. Digi. Earth 2021, 14(11), 1514-1527. [CrossRef]
- Elvidge, C. D.; Sutton, P.C.; Ghosh, T.; Tuttle, B.T.; Baugh, K.E.; and Bright, E. A Global Poverty Map Derived from Satellite Data. Com Geo Sci. 2009, 35(8), 1652–1660. [Google Scholar] [CrossRef]
- Hu, X.; Qian, Y.; Pickett, S.T.; and Zhou, W. Urban mapping needs up-to-date approaches to provide diverse perspectives of current urbanization: A novel attempt to map urban areas with nighttime light data. Landscape Ur. Pl 2020, 195(103709). [Google Scholar] [CrossRef]
- Chen, Z.; Yu, B.; Zhou, Y.; Liu, H.; Yang, C.; Shi, K.; and Wu, J. Mapping global urban areas from 2000 to 2012 using time-series nighttime light data and MODIS products. IEEE J. Sel. Top. Appl. Earth Obs. Remote Sens. 2019, 12(4), 1143–1153. [Google Scholar] [CrossRef]
- Zhao, M.; Zhou, Y.; Li, X.; Cao, W.; He, C.; Yu, B.; Li, X.; Elvidge, C.D.; Cheng, W.; Zhou, C. Applications of satellite remote sensing of nighttime light observations: Advances, challenges, and perspectives. Remote Sens. 2019, 11(17), 1971. [Google Scholar] [CrossRef]
- He, C.; Liu, Z.; Gou, S.; Zhang, Q.; Zhang, J.; and Xu, L. Detecting global urban expansion over the last three decades using a fully convolutional network. Environ. Res. Lett. 2019, 14 (3), 034008. [Google Scholar] [CrossRef]
- Zhao, M.; Zhou, Y.; Li, X.; Cheng, W.; Zhou, C.; Ma, T.; Li, M.; and Huang, K. Mapping Urban Dynamics (1992–2018) in Southeast Asia Using Consistent Nighttime Light Data from DMSP and VIIRS. Remote Sens. Environ. 2020, 248. [Google Scholar] [CrossRef]
- National bureau of statistics. China. Statistical year book, China Statistical press: Beijing, China. 2021. http://www.stats.gov.cn/tjsj/ndsj/2021/indexeh.htm.
- Chien, S. S. Prefectures and prefecture-level cities: the political economy of administrative restructuring in China local administration In tradition and changes of sub-national hierarchy, Editor Chung. J.H; and Tao-Chiu L. Routledge. Oxon. UK.2010; pp.127-143.
- Wang, Y.; and Wang, J. (2019). Does industrial agglomeration facilitate environmental performance: New evidence from urban China? J. Environ. Mgt. 2019, 248, 109244. [Google Scholar] [CrossRef]
- Chen, Z.; Yu, B.; Yang, C.; Zhou, Y.; Yao, S.; Qian, X.; Wang, C.; Wu, B.; Wu, J. An extended time series (2000–2018) of global NPP-VIIRS-like nighttime light data from a cross-sensor calibration. Earth Sys. Sci. Data. 2021, 13(3), 889–906. [Google Scholar] [CrossRef]
- Rose, A.N.; and Bright, E. The LandScan Global Population Distribution Project: current state of the art and prospective innovation. In. Technical Report. Oak Ridge National Lab (ORNL), Oak Ridge, TN. USA. 2014.
- Sulla-Menashe, D.; and Friedl, M.A. User Guide to Collection 6 MODIS Land Cover (MCD12Q1 and MCD12C1) Product. USGS. Reston, VA, USA; 2018; pp1-18.
- Li, X.; Gong, P.; and Liang, L.A. 30-year (1984–2013) record of annual urban dynamics of Beijing City derived from Landsat data. Remote Sens. Environ. 2015, 166, 78–90. [Google Scholar] [CrossRef]
- National Bureau of statistics. China. City statistical yearbook. China statistics press; Beijing, China. 2000-2020. https://data.cnki.net/yearBook/single?id=N2022040095.
- Yang, M.; Tan, C.; and Li, W. Spatial Recognition of the Urban-Rural Fringe of Beijing Using DMSP/OLS Nighttime Light Data. Remote Sens. 2017, 9(11), 1141. [Google Scholar] [CrossRef]
- Delmelle, E. C. Five Decades of Neighborhood Classifications and Their Transitions: A Comparison of Four US Cities, 1970–2010. App. Geo. 2015, 57, 1–11. [Google Scholar] [CrossRef]
- Feng, Z.; Peng, J.; and Wu., J. Using DMSP/OLS Nighttime Light Data and K–Means Method to Identify Urban–Rural Fringe of Megacities. Habitat Int. 2020, 103(102227). [Google Scholar] [CrossRef]
- Xie, Y.; Weng, Q.; and Fu, P. Temporal variations of artificial nighttime lights and their implications for urbanization in the conterminous United States, 2013–2017. Remote Sens. Environ. 2019, 225, 160–174. [Google Scholar] [CrossRef]
- Zhou, Y.; Li, X.; Asrar, G.R.; Smith, S.J.; and Imhoff. M. A global record of annual urban dynamics (1992-2013) from nighttime lights. Remote Sens. Environ. 2018, 219, 206-220. [Google Scholar] [CrossRef]
- Levin, N.; Kyba, C.; Zhang, Q.; Miguel, A.S.D.; Román, M.O.; Li, X.; Portnov, B.A.; Molthan, A.L.; Jechow, A.; and Miller, S.D. Remote sensing of night lights: A review and an outlook for the future. Remote Sens. Environ. 2020, 237(111443). [Google Scholar] [CrossRef]
- Xu, Z.; Jiao, L.; Lan, T.; Zhou, Z.; Cui, H.; Li, C.; Xu, G.; and Liu., Y. Mapping Hierarchical Urban Boundaries for Global Urban Settlements. Int. J. App. Earth Obs. Geo info. 2021, 103 (102480). [Google Scholar] [CrossRef]

| Data | Year | Format | Resolution/scale | Source |
|---|---|---|---|---|
| SNPP-VIIRS-like | 2015-2020 | Raster | 500 m | https://dataverse.harvard.edu/dataset.xhtml |
| NPP-VIIRS-like | 2000,2005, 2010 |
Raster | 500 m | https://dataverse.harvard.edu/dataset.xhtml |
| LandScan | 2015 | Raster | 1000 m | https://www.un-spider.org/links-and-resources/data-sources/landscan |
| HE | 2015 | Raster | 1000 m | http://data.tpdc.ac.cn/zh-hans/data/3100de5c-ac8d-4091-9bbf-6a02de100c88/ |
| MODIS | 2015 | Raster | 500 m | https://ladsweb.modaps.eosdis.nasa.gov/search/order/1/MCD12Q1--6 |
| GlobeLand30 | 2020 | Raster | 30 m | http://www.globallandcover.com/defaults_en.html? |
| OSM | 2015 | Vector | 1:5000 | https://www.openstreetmap.org |
| LandSat8 | 2015 | Raster | 30 m | https://earthexplorer.usgs.gov/ |
| Prefecture boundaries | 2019 | Vector | 1:50,000,000 | http://ngcc.sbsm.gov.cn/article/en/ |
Disclaimer/Publisher’s Note: The statements, opinions and data contained in all publications are solely those of the individual author(s) and contributor(s) and not of MDPI and/or the editor(s). MDPI and/or the editor(s) disclaim responsibility for any injury to people or property resulting from any ideas, methods, instructions or products referred to in the content. |
© 2023 by the authors. Licensee MDPI, Basel, Switzerland. This article is an open access article distributed under the terms and conditions of the Creative Commons Attribution (CC BY) license (http://creativecommons.org/licenses/by/4.0/).


