Preprint
Article

Similarities in the Behavior of Transcription Factors in Young Oil Palm (Elaeis guineensis Jacq.) Plants under Salt or Water Stress Provide Strategies to Develop Stress-Tolerant Oil Palm Plants at Once

Altmetrics

Downloads

168

Views

97

Comments

0

Submitted:

07 July 2023

Posted:

10 July 2023

You are already at the latest version

Alerts
Abstract
In recent years, many studies have reported that several distinct families of transcription factor (TF) genes play crucial roles in the response of plants to abiotic stress. Although some of these families got systematically studied in many species, little knowledge exists about these genes in oil palm (Elaeis guineensis Jacq.). In this study, 20 genes differentially expressed in the leaves of oil palm plants subjected to salinity or drought stress and encoding TFs belonging to four families of TFs - MYB, HD-ZIP, NF-Y, and HSFF - got selected for further characterization. The genes underwent a structural and functional annotation, besides having their RNA-Seq expression profile validated by the qPCR technique, and a correlation analysis of their response under both stresses got performed. The annotation analysis of the promoter region showed the presence of seven cis-acting elements, all already reported to be involved in plants' response to abiotic stress. The structural and functional characterization of the proteins encoded by the selected genes showed that some groups present patterns of conserved regions and are orthologs to genes already linked to salinity or drought resistance in other plant species. It was possible to confirm the RNA-Seq expression profile of 19 genes, only gene 4 showed the opposite response when using qPCR. Through correlation analysis, it was possible to observe a high level of similarity in the behavior of the 20 genes in response to drought or salinity stress, a behavior already reported in other species. The results presented here shed light on the role of 20 TFs in the leaves of young oil palm plants under severe levels of soil salinity or water deprivation. The high level of similarity in the molecular response to both stresses allowed the identification of genes that might grant strategies aiming to develop oil palm plants with a tolerance to both salinity and drought at once.
Keywords: 
Subject: Biology and Life Sciences  -   Plant Sciences

1. Introduction

Oil palm (Elaeis guineensis Jacq.) is the number one oilseed crop in the world, considering the amount of vegetal oil consumed yearly. The consumption of palm oil and palm kernel oil in the 2022/23 season was about 85 million metric tons, ahead of soybean oil (60 million metric tons), rapeseed oil (31), and sunflower-seed oil (18.5) [1].
Over 95% of the oil palm plantations in Brazil are in the Legal Amazon Area, specifically in the Northeast region of the Pará State. Although Brazil has millions of hectares with an aptitude for oil palm production, it currently has only about 200,000 hectares destined for this purpose [2]. Any initiative aiming to increase the area cultivated with oil palm in Brazil faces a dilemma, stay in the Amazon Biome, where this crop finds a natural environment of high rainfall throughout the year, or go outside this area. Both options have its pro and cons.
One of the main cons of going somewhere outside the Amazon Biome, more specifically to the Mid-West and Northeast regions in Brazil, is that there oil palm will face long periods of drought throughout the year when it will not receive the physiological water level required to maintain productivity and will demand the use of artificial irrigation. Accordingly to Corley et al. [3], oil palm requires ~2,000 mm/year of water and does not tolerate water deprivation for more than 90 days.
The climate in the Cerrado Biome of the Mid-West region of Brazil has two seasons, rainy summers and dry winters. Some areas in that region experience a period of about four months without rain. The Northeast region is a semi-arid region where precipitation is insufficient to meet the water demand of crops. Water scarcity in places like those leaches mineral salts from the root zone, promoting soil salinization, a global problem due to its negative impact on agricultural productivity and sustainability [4]. About 30% of the world's irrigated agricultural land suffers from secondary salinity. That is a problem experiencing constant growth and expecting to reach more than half of the land by 2050 [5,6,7].
Plant response to drought and salinity stresses is a complex and coordinated process that rapidly and effectively works to restore homeostasis. It consequently enables the plant to adapt to unfavorable conditions [8]. Such a process regulates the expression of several stress-responsive gene groups [9], especially at transcriptional and post-transcriptional levels, with attention given to transcription factors (TFs). There are plenty of studies available showing that transcription factors (TFs) play central roles in the plant's response to different abiotic stimuli, allowing them to respond and adapt promptly to certain conditions, such as heat, drought, salinity, cold, and others [10]. Approximately 7–10% of all plant genes code for TFs at distinct moments, and several TF gene families are known for precisely coordinating the spatial and temporal expression of downstream genes associated with abiotic stress [11,12]. So far, 60 distinct TF families got identified in plants, including heat shock factors (HSPs), which are a class of great importance that play crucial roles in protecting plants against the effects caused by various abiotic stresses through the regulation of heat shock proteins [9,13].
Studies show that overexpression of certain stress-inducible transcription factors, such as NF-Y, MYB, HD-ZIP, and DREB, can increase tolerance to salinity, drought, or extreme temperatures and that they play central roles in plant response to different abiotic stimuli [14,15]. The homeodomain leucine zipper (HD-Zip) family of transcription factors is one of the largest plant-specific superfamilies. The TFs from this family got linked to plant growth modulation and responses to environmental stresses [16,17,18,19], and studies show that their overexpression does promote tolerance to drought [18,20,21], and to drought and salt stresses [22].
In two previous studies, our research group reported comprehensive, large-scale miRNA and RNA-Seq analyses applied to characterize young oil palm responses to a high level of salinity [23] and water deprivation [24]. In those studies, we showed that TFs play a preponderant role in the early response of this oilseed crop to those two abiotic stresses. Here we describe an additional step toward analyzing those datasets, aiming at getting more insights into the TF families and their TF genes commonly affected by those two stresses. To do so, all TF genes differentially expressed got considered, not only those identified as putative miRNA-target genes. A group of 20 TF genes (and their promoter sequences) from four distinct TF families underwent structural and functional annotation, with subsequent qPCR analysis of their behavior in both stress conditions.

2. Results

2.1. Selection of transcription factors responsive to drought and salinity stress

The results from the GhostKOALA annotation tool, specifically the ones from the KO0300 – Transcription Factor group, revealed 19 and 36 groups of different families of transcription factors responsive to salinity and drought stresses, respectively. There were 18 families of differentially expressed TFs present in both sets of results (Supplementary Table 1). Based on information gathered from previous studies [23,24,25,26], 20 differentially expressed genes got selected, and they belong to five of those 18 TFs families. Among them, there were 13 genes from the MYB family, three genes from the homeobox-leucine zipper protein (HD-ZIP) family, two genes from the heat shock transcription factor (HSFF) family, one gene from the nuclear transcription family Y subunit beta (NFY-B), and one of the nuclear transcription factor Y gamma (NFY-C) family (Table 1).
The RNASeq analysis of those 20 genes selected showed that eleven expressed differentially under saline stress, with fold change values ranging from 1.8 to 10.4 times the expression level seen in the non-stressed plants. Among the nine genes negatively regulated under salinity, gene 17 (XP_010936941.1) had a 17.2 times reduction in the expression level found in the non-stressed plants. Under drought stress, nine out of the 20 TFs genes expressed positively; gene 1 (XP_010904805.1) led the rank with a fold change of 50.2. The remaining eleven genes negatively regulated showed reductions ranging from -1.9 to -21.2, compared to the control (Table 1).

2.2. Selection of transcription factors responsive to drought and salinity stress

The phylogenetic tree obtained using the stretch of 1,432 nucleotides upstream of the start codon of each gene separated the 20 TFs genes into four groups; however, when comparing the expression profiles of the genes under the two stress tested, there was no particular pattern at all (Figure 1A, Table 1). The MEME software revealed three conserved promoter motifs in all 20 genes, and, again, no particular pattern appeared within the four groups found in the phylogenetic tree (Figure 1B).
The use of the PlantCare database revealed seven cis-acting elements related to stress response present in the promoter sequences of those 20 genes, which were: ABRE (ABA-responsive element), STRE (activated by heat shock, osmotic stress, low pH and nutrient deprivation), CGTCA-motif (responsive to methyl jasmonate (MeJA)), TGACG-motif (involved in MeJA responsiveness), TATA-box, CAAT-box, and the salicylic acid and auxin-responsive element as-1 (Figure 1C).
The CAAT- and TATA- box elements were present in large amounts in all 20 promoter sequences, being directly related to the initiation of gene transcription and enhancing activity, improving the ability of genes to react to adversity to respond to stress abiotic process more efficiently and quickly [27]. Two genes - 3 and 5 - from the HSFF family presented the elements ABRE, as-1, CAAT-box, CGTCA – motif, TATA-box, TGACG – motif, while genes 2, 6, 7, 8, 9, and 10 showed all seven cis-acting elements (Figure 1C).

2.3. Structural and functional annotation of the coding region

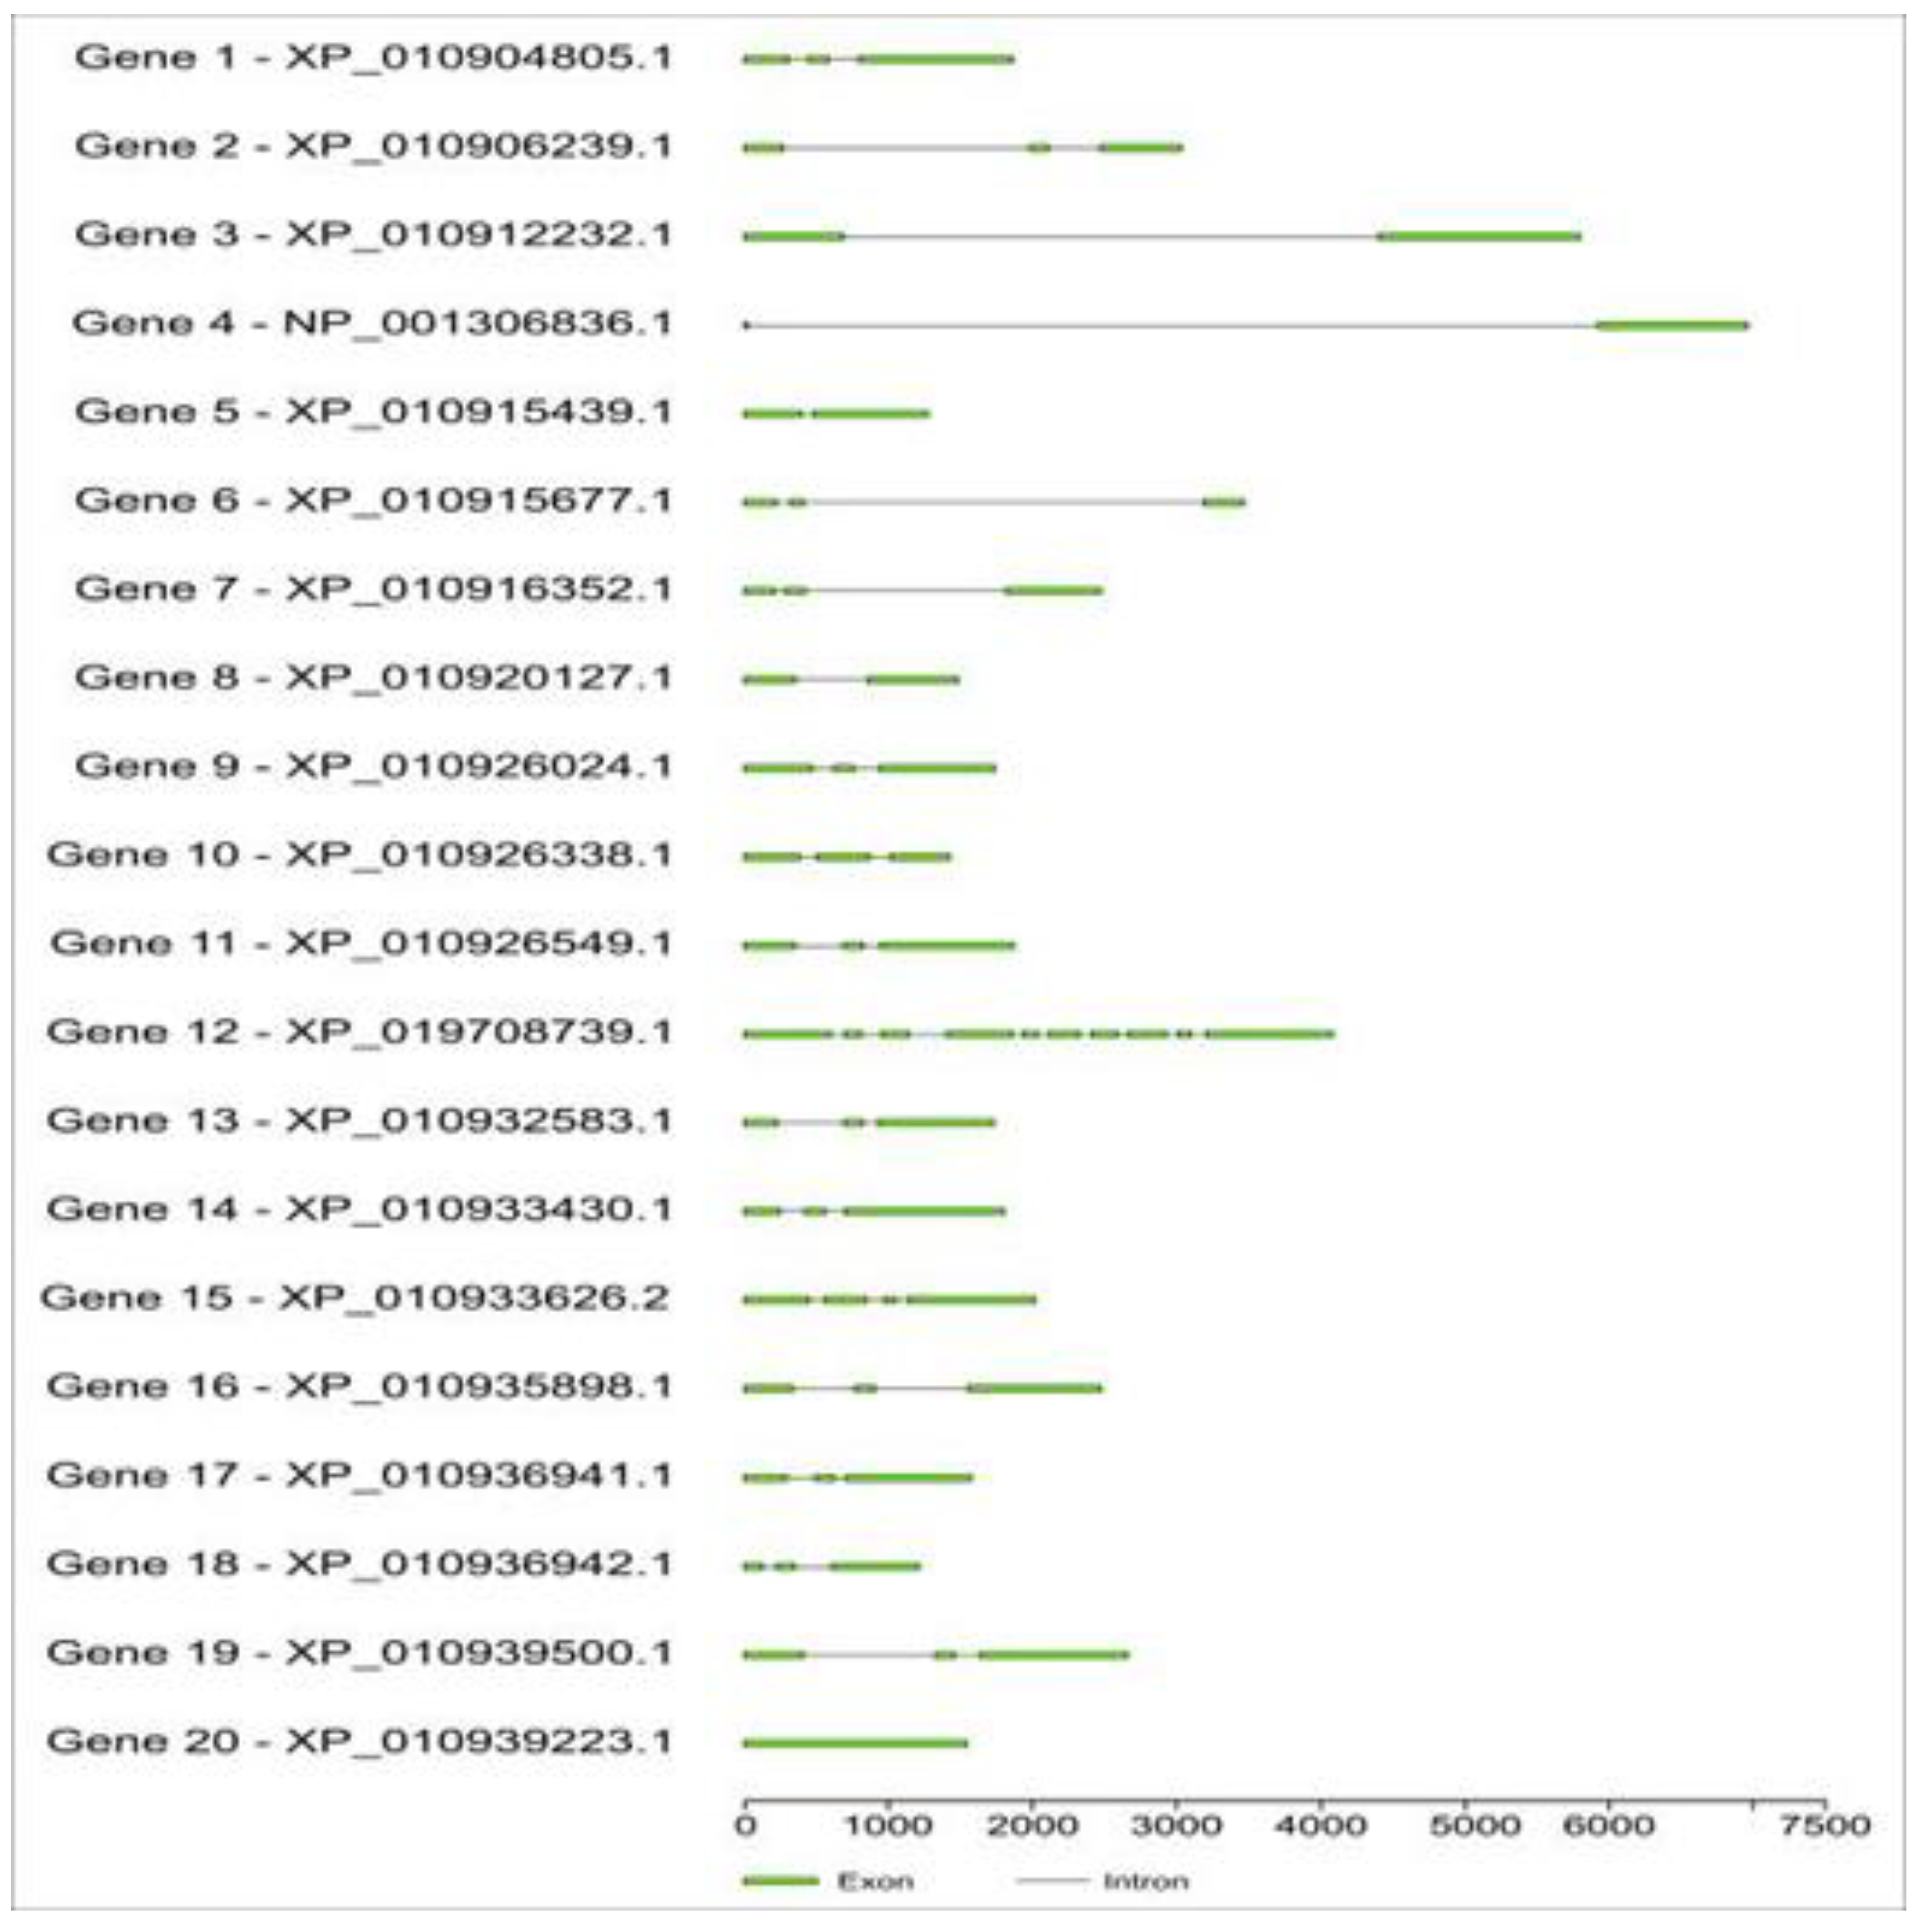
Regarding the size of the genes and the numbers and disposition of introns and exons, there was considerable diversity in the coding sequence of the 20 TFs genes analyzed. The longest gene was gene 4, almost 7,500 nucleotides long. The number of introns varied from zero (gene 20) to nine (gene 12). When analyzed by family, one can observe that egMYB presented two introns in most genes, while egHSFF presented one, egNFY zero or one intron, and in egHD-ZIP ranging from two to nine introns (Figure 2).
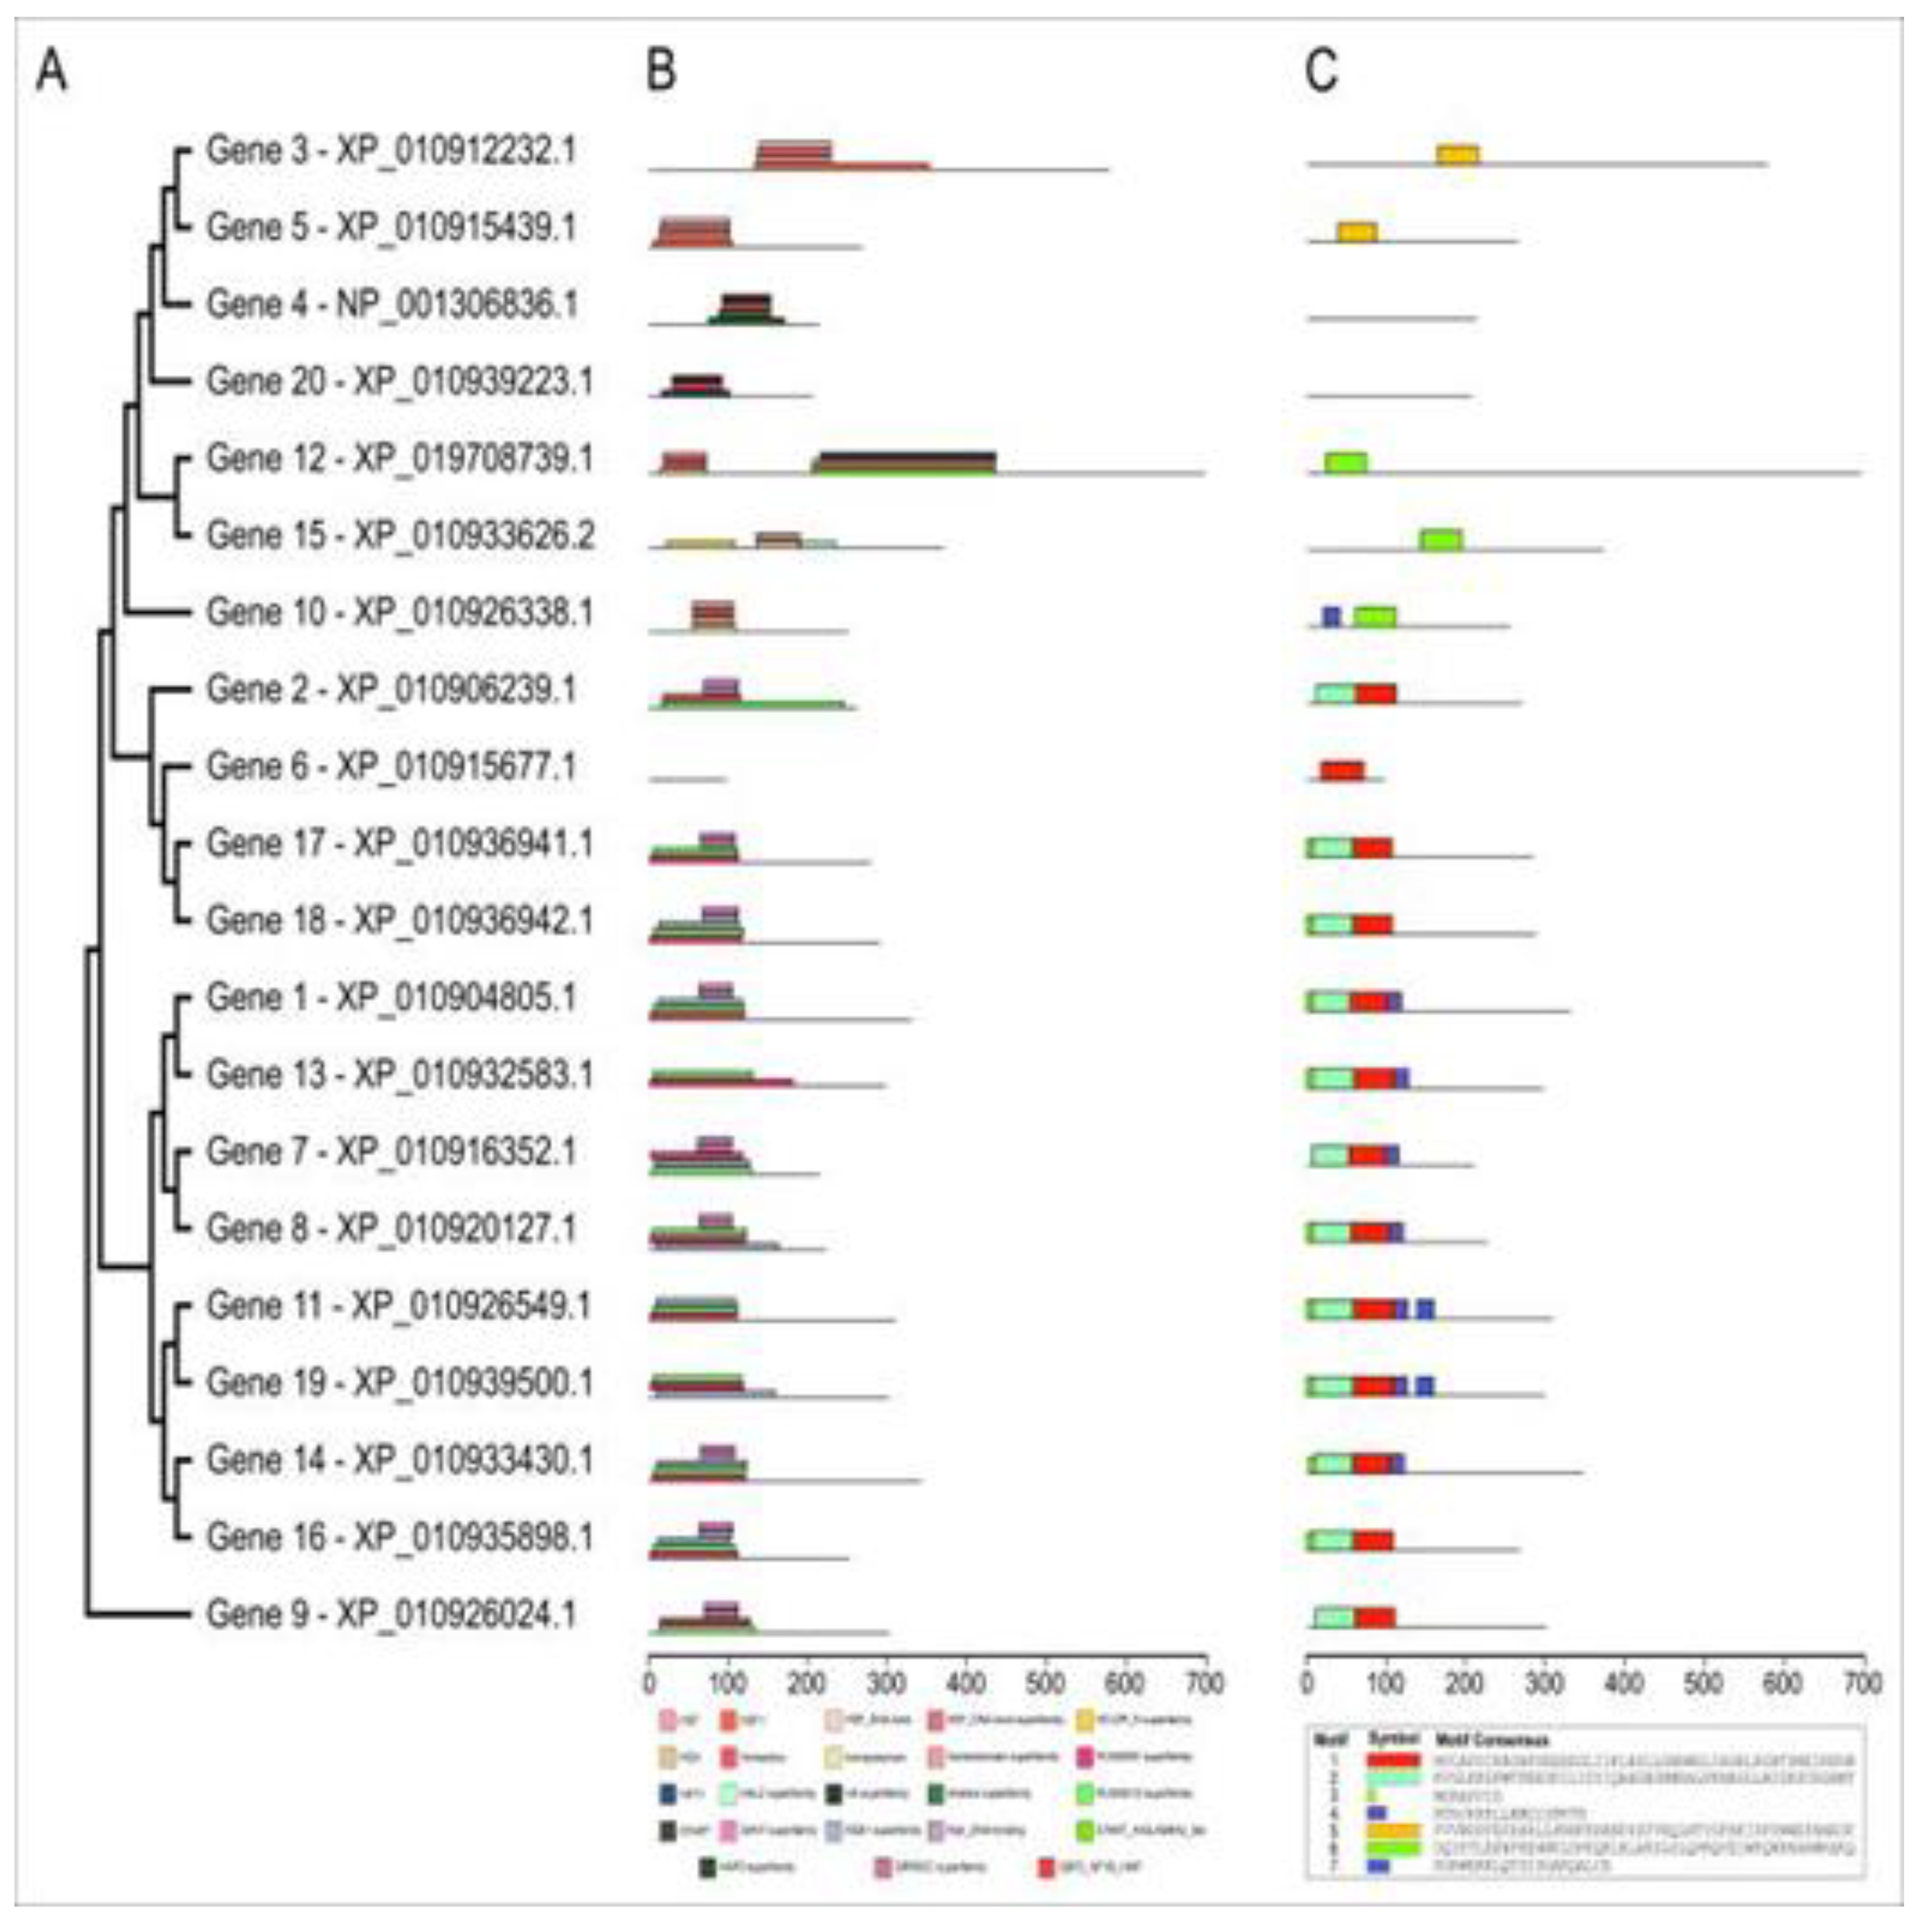
A phylogenetic tree resulted from analyzing the protein sequences of the 20 genes to explore the evolutionary relationship between transcription factor families, besides characterizing the features of conserved motifs and domains (Figure 3). The 20 TFs did group into three clades, where one clade had only the protein from gene 9 - an MYB family individual, and the second one had eight proteins - from genes also belonging to the MYB family. At last, the third clade includes the proteins of the remaining four genes of the MYB family, three genes of the HD-ZIP family, two genes of the HSFF family, and the two genes of the NFY family; both being side by side with their respective groups.
As for the conserved domains, only the protein coded by gene six had no conserved domain. The remaining 19 proteins showed 23 distinct conserved domains. The PLN03091 and PLN03212 domains appeared in the proteins coded by genes 1, 2, 7-9, 11, 13, 14, 16-19. Those proteins belong to the MYB family of transcription factors; and had the REB1, Myb, and SANT domains randomly distributed in them (Figure 3b, Supplementary Table S2).
In the coding regions of genes 3 and 5 (both of the HSFF family), the domains HSF, HSF1, HSF_DNA-bind, and HSF_DNA-bind superfamily were found. While in the protein coded by genes 4, 10, 12, 15, and 20, the domains HOX, homeodomain, homeodomain superfamily, Homeobox, HHT1, HALZ, H4, Histone superfamily, START, HAP5, HD-ZIP_N, START_ArGLABRA2_like, CBFD_NFYB_HMF were also found and SRPBCC (Figure 3b, Supplementary Table S2).
The MEME program predicted seven conserved motifs in 18 of the 20 proteins analyzed (Figure 3c). The numbers of conserved motifs vary from one to five per protein, with the proteins coded by genes 11 and 19 having the highest number of motifs, and the length of the motifs ranged from eight to 50 amino acids. Furthermore, in domains PLN03091 and PLN03212, one can see motifs 1, 2, and 4. Motif 5 was present in the proteins coded by genes 3 and 5, while motif 6 was present in the proteins coded by genes 10, 12, and 15. Motif 3 was present in nine proteins, while motif 7 was in three (genes 10, 11, and 19) (Figure 3c).
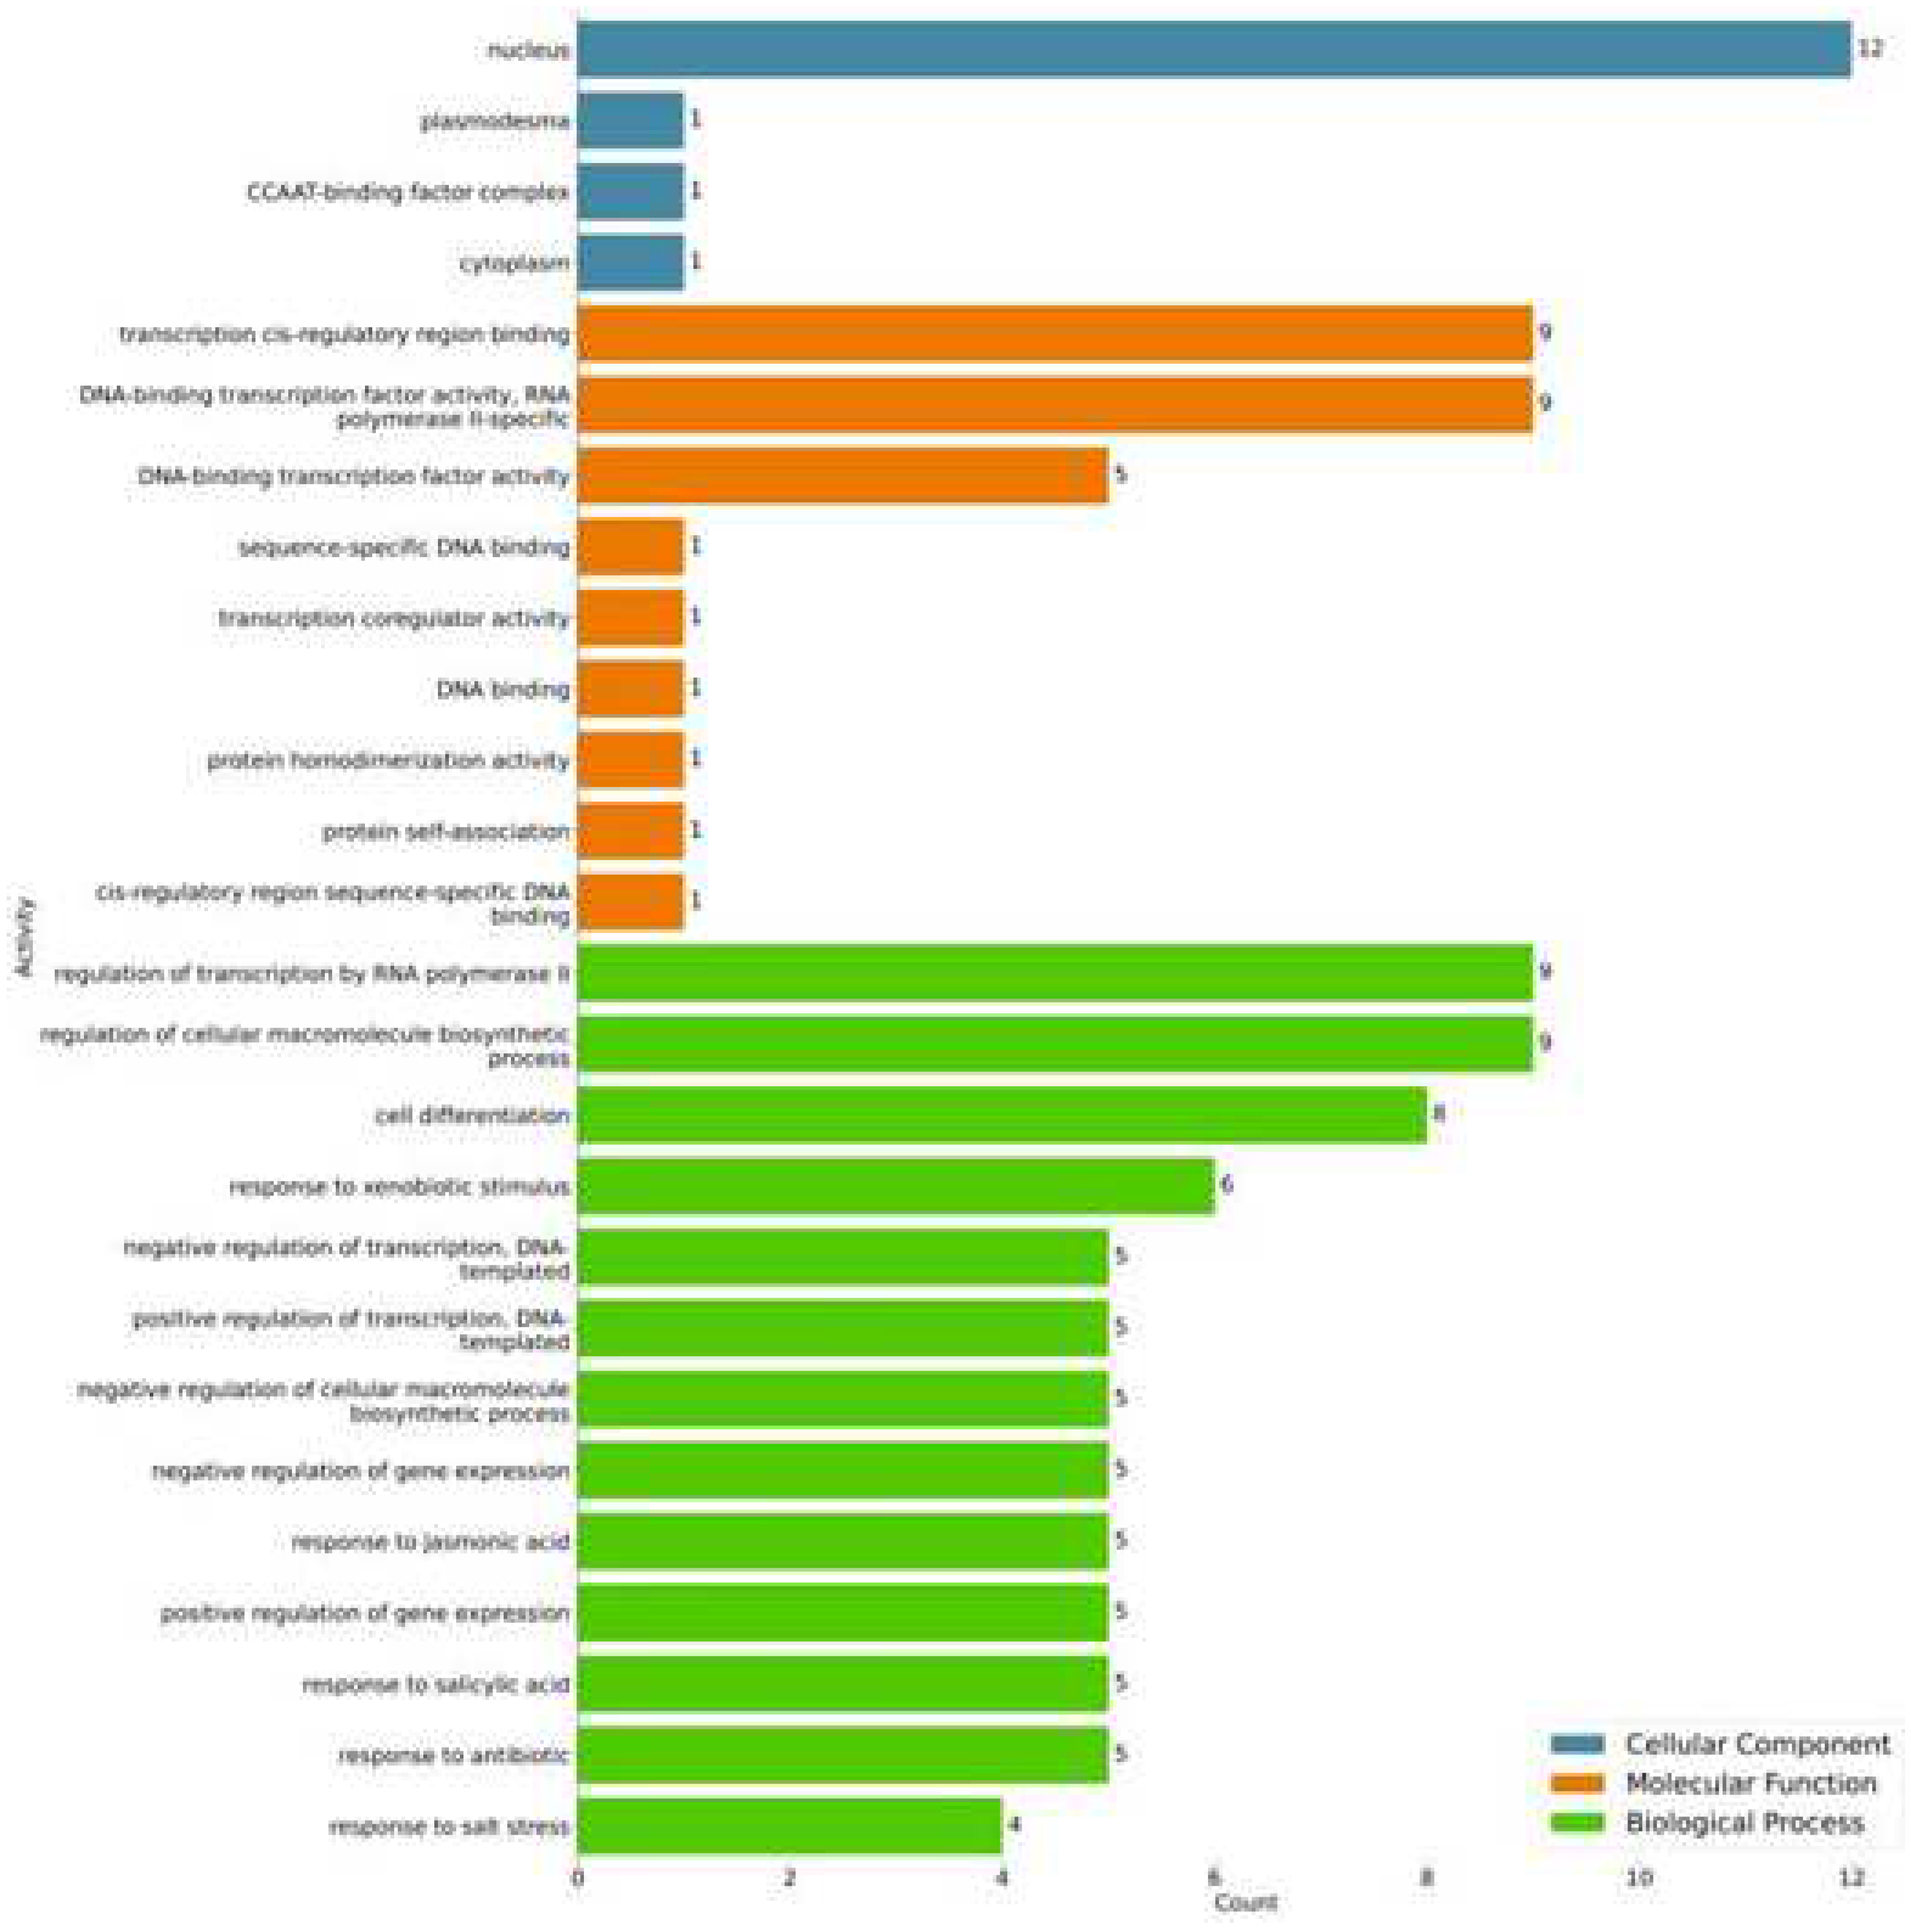
From the functional annotation of the TFs coded by the 20 genes responsive to drought and salinity stress, 87 activities for biological processes, nine for molecular functions, and four for cell components were identified (Figure 4, Supplementary Table S3). One should notice that the protein coded by gene 14 had the highest number of GO terms annotated, with 29 GO terms, followed by those coded by genes 9, 11, and 19, with 23 GO terms for each one (Supplementary Table S3).

2.4. Differential expression and correlation analyses

To further characterize the 20 genes selected, their expression levels got determined using qPCR (Figure 5, Supplementary Table S4). In water deprivation, genes 1, 5, 9, and 11 were significantly positively regulated, while the remaining genes were negatively regulated. Under salt stress, genes 1, 5, 9, 11-16, and 19 were positively regulated, while genes 2-4, 6-8, 10, 17, 18, and 20 were negatively regulated.
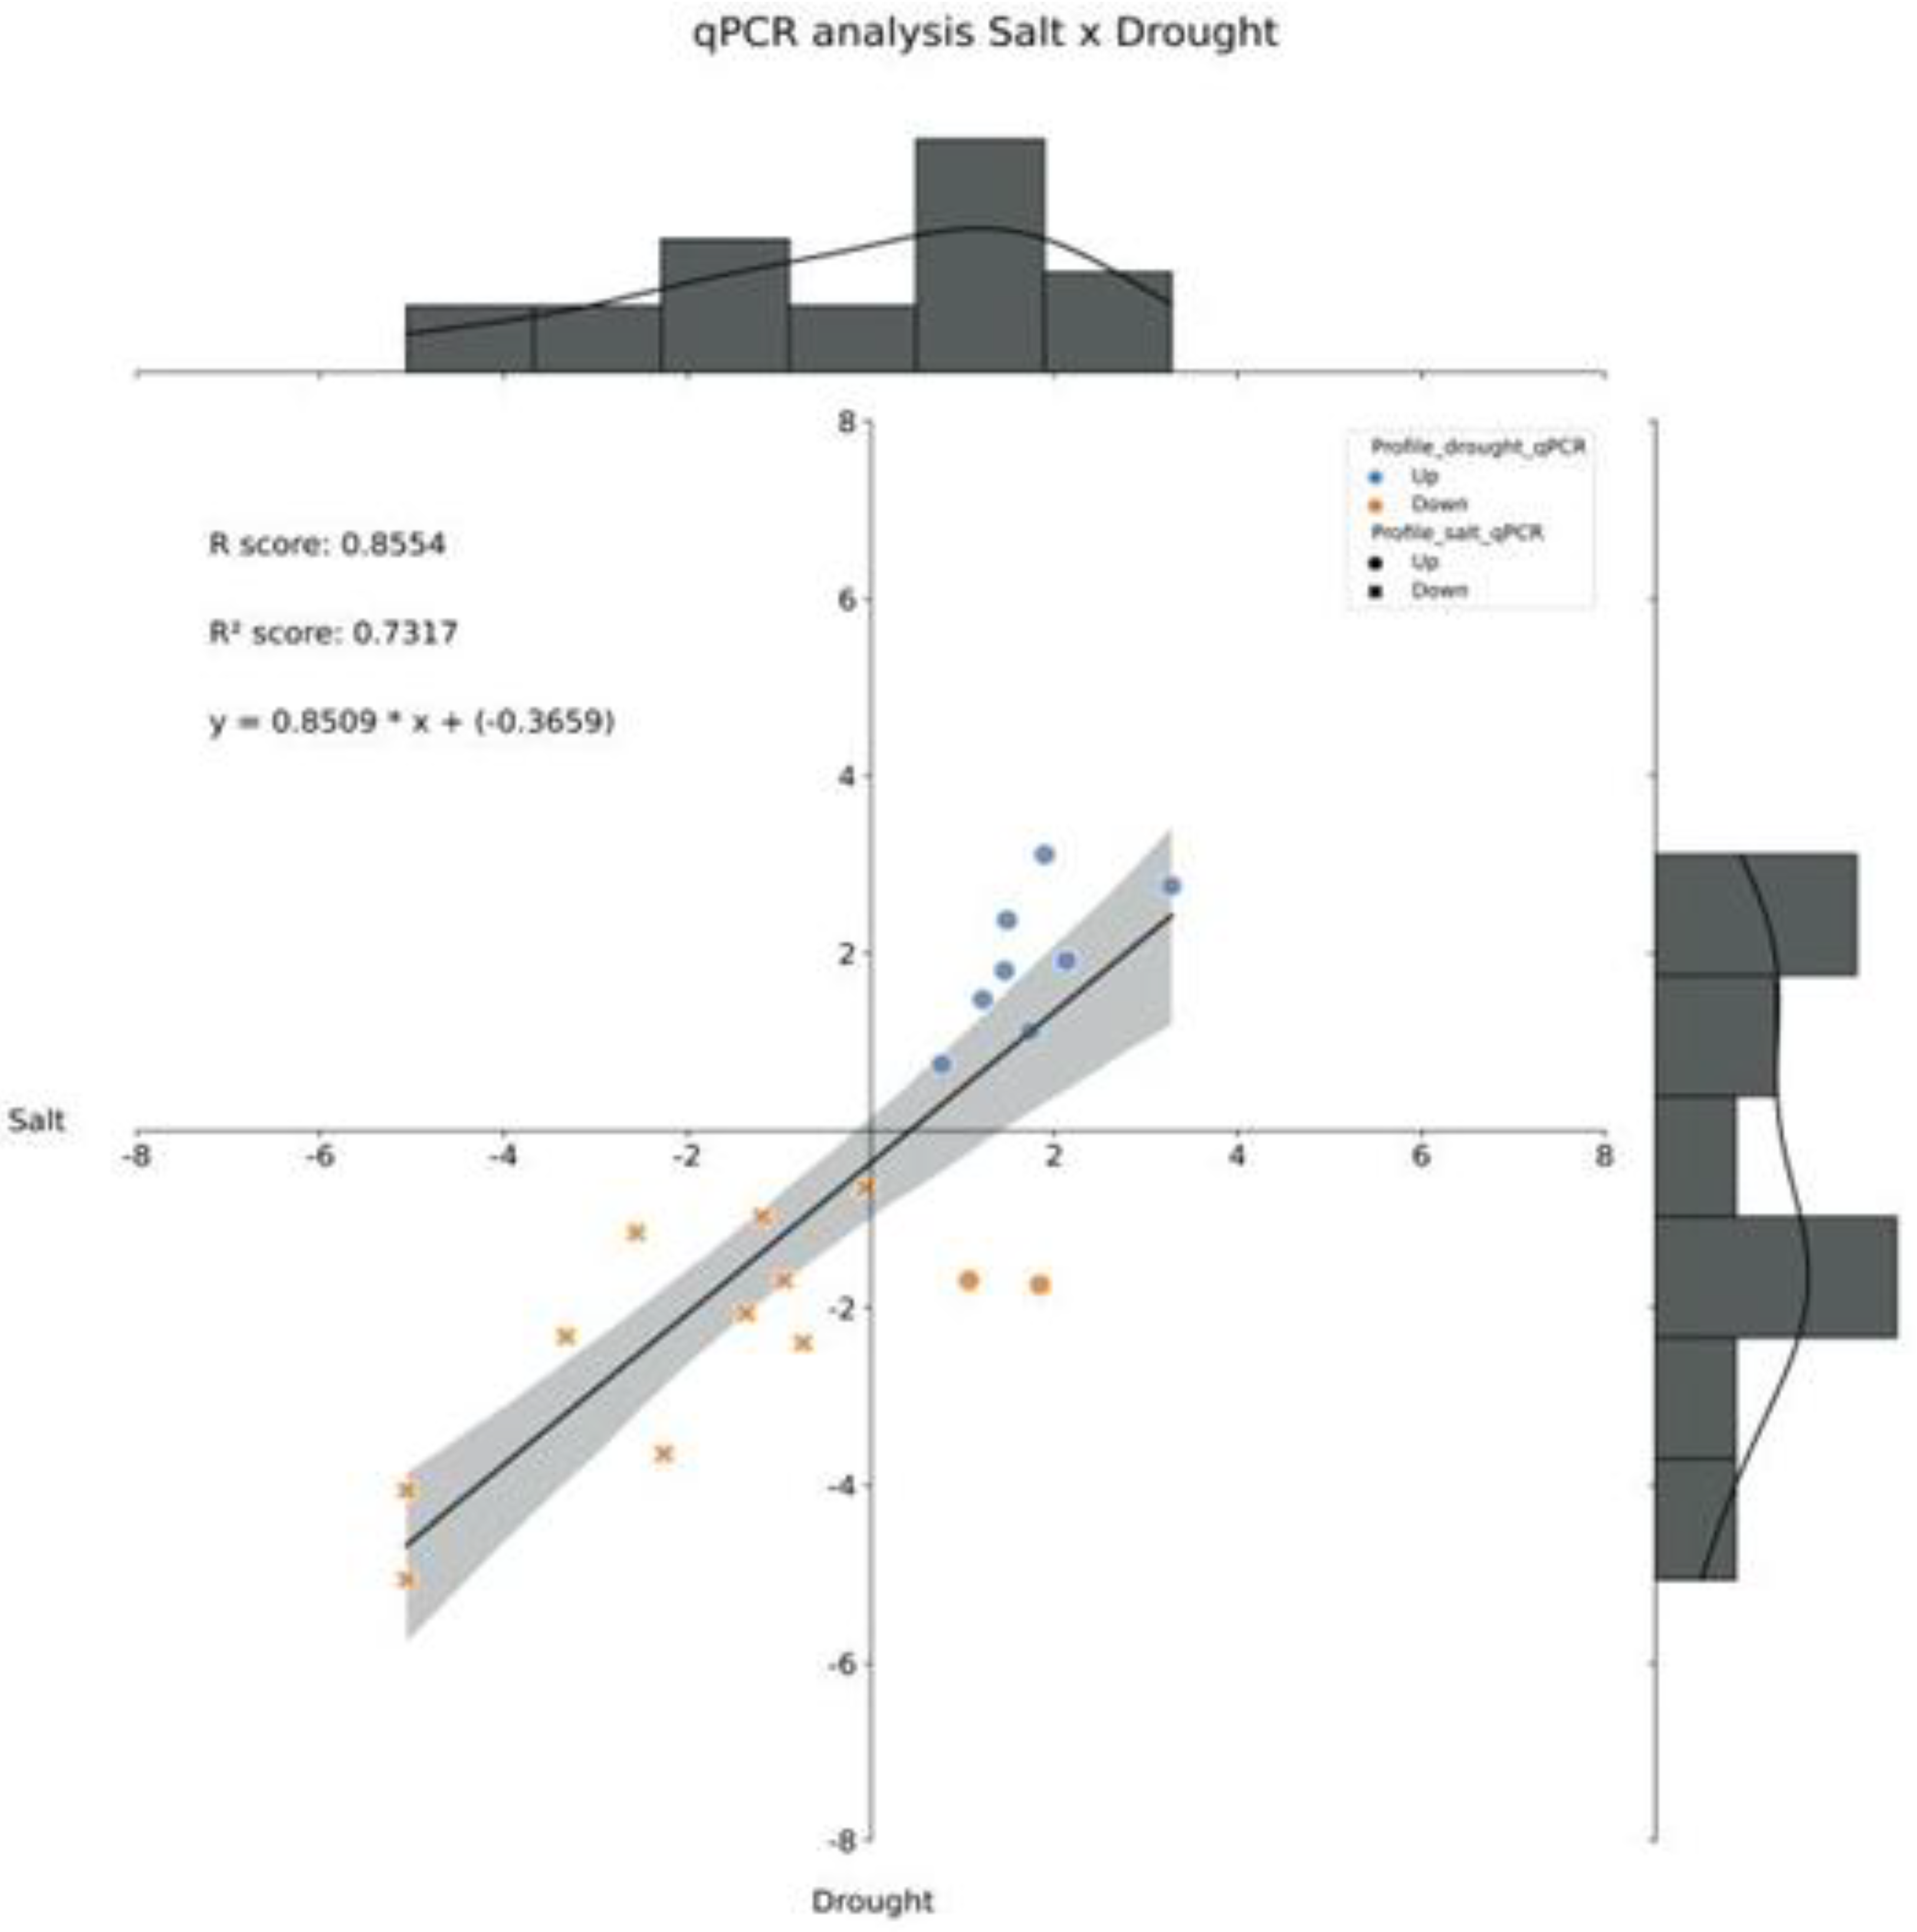
The differential expression of the 20 genes under salt and drought stress underwent a correlation analysis. Interestingly, almost all genes showed the same behavior when analyzed under drought and salinity stress conditions, with an R2 score of 0.7317. Only genes 12 and 13 showed opposite behavior when subjected to different stress conditions, being positively regulated under salt stress and negatively under water deprivation (Figure 6).
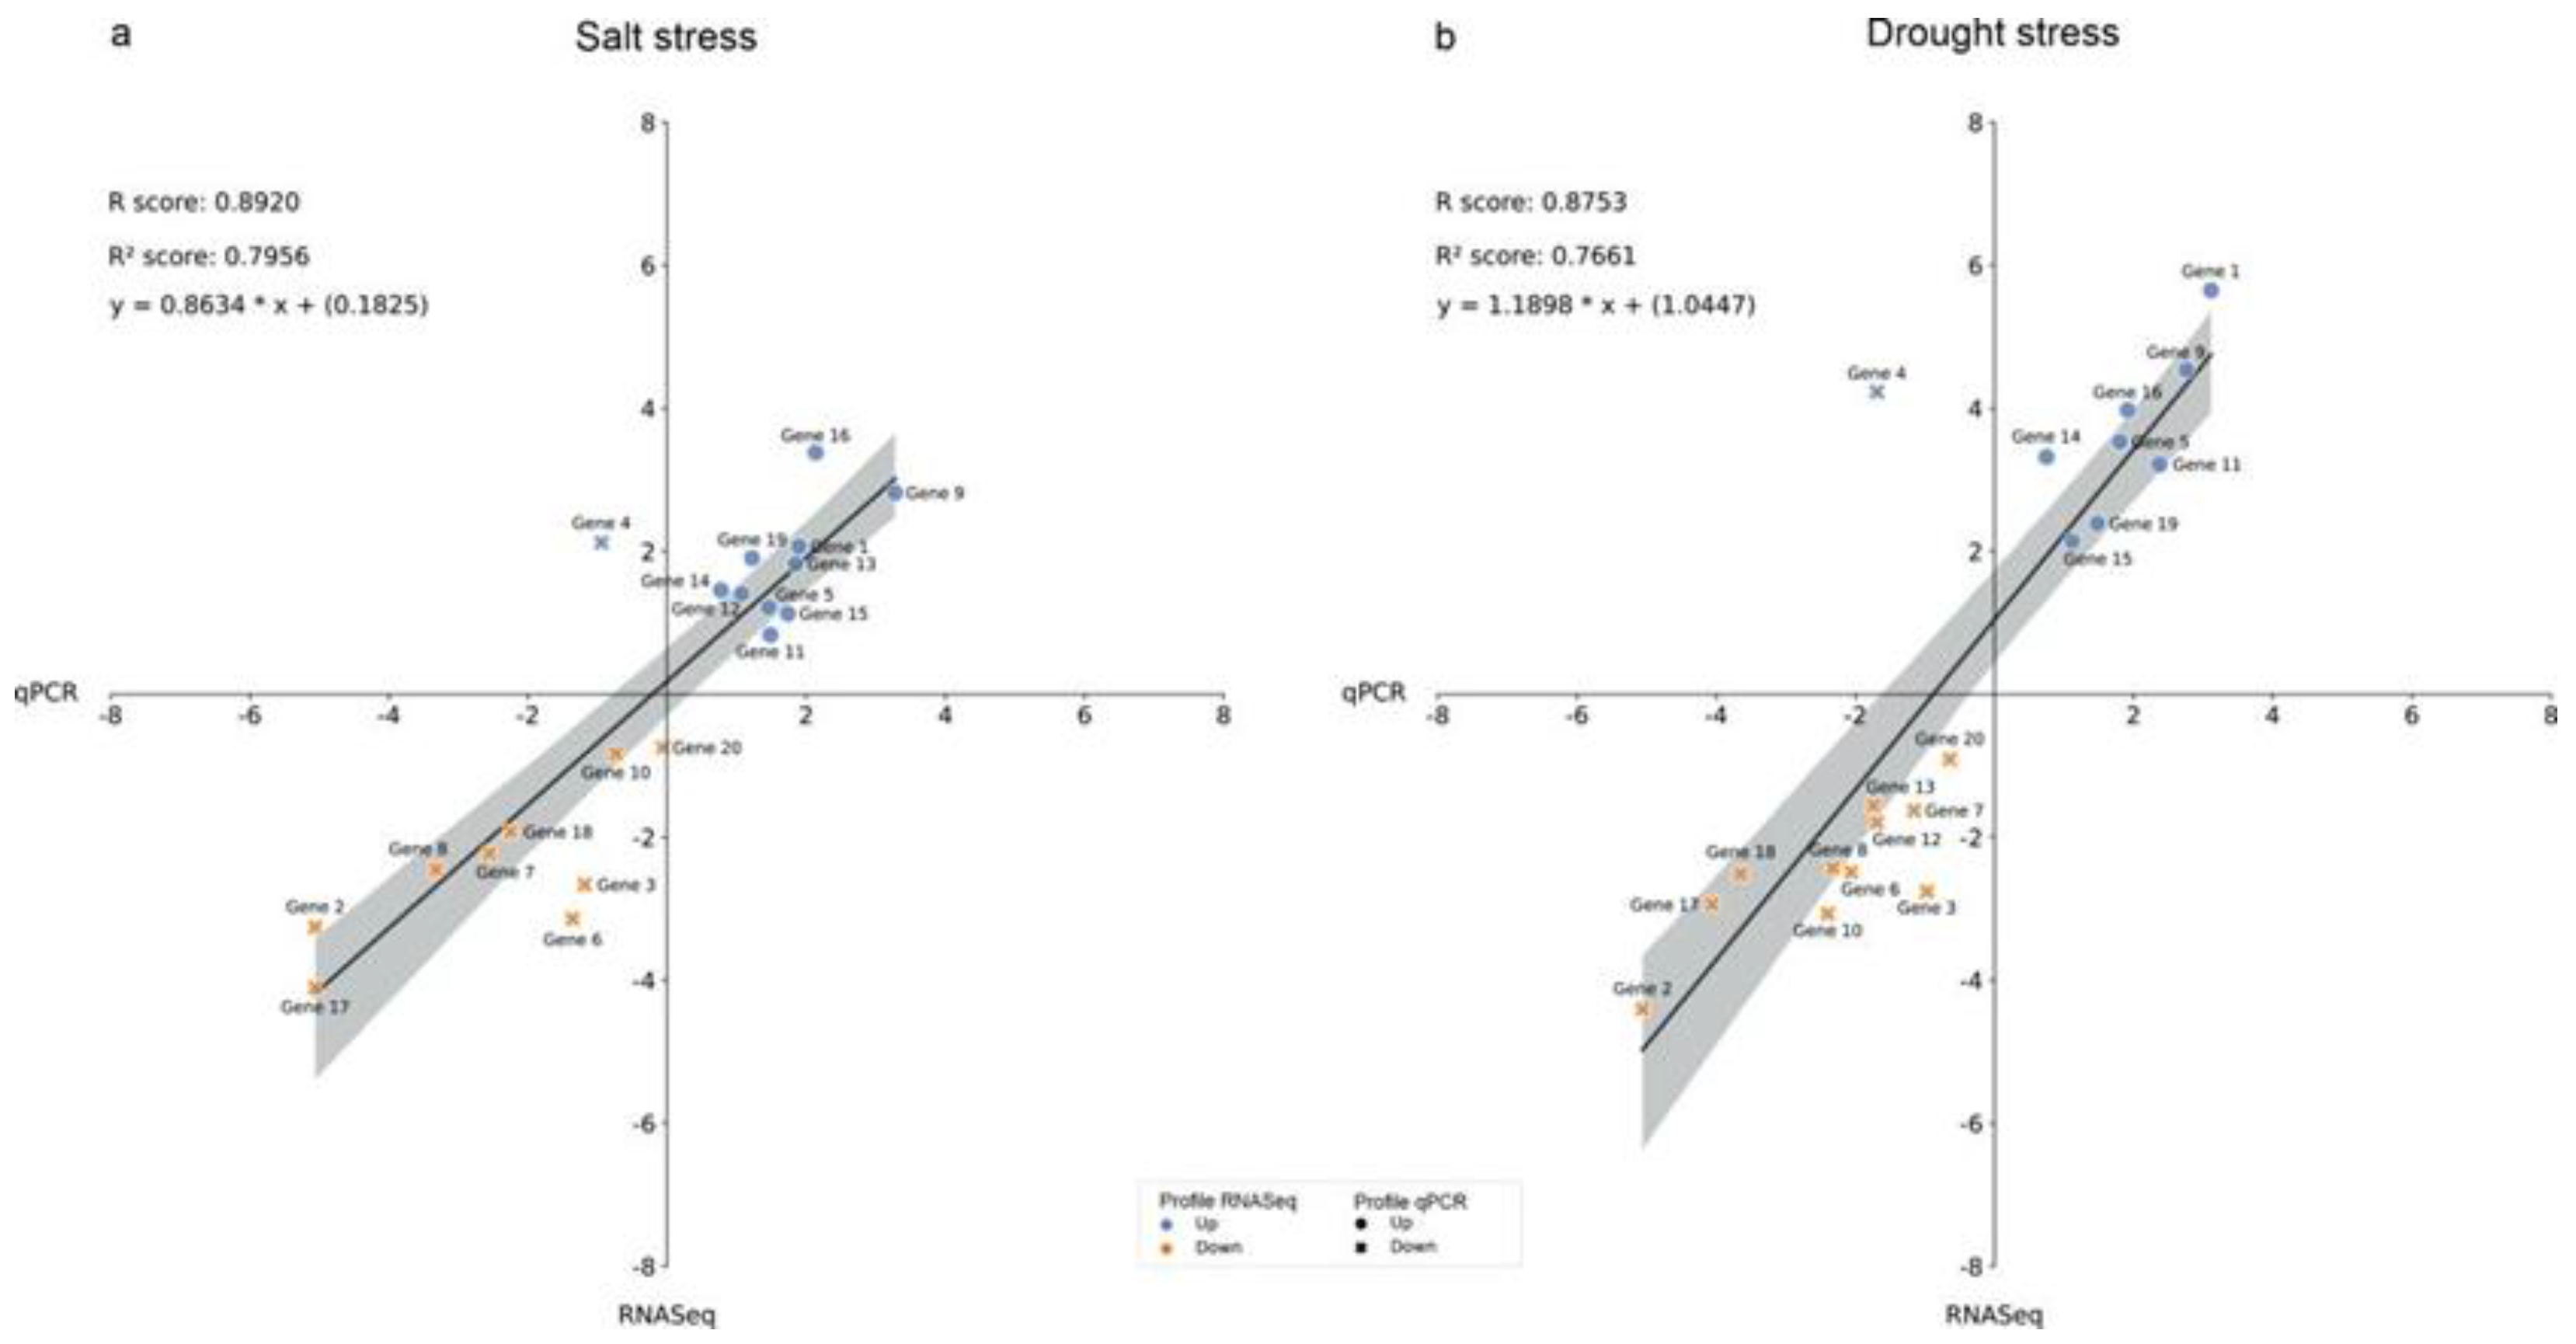
The expression levels of all genes, measured by RNA-Seq and qPCR, were compared under both abiotic stresses (Figure 7). Among the 20 genes tested, only gene 4 showed a different expression pattern, showing a positive regulation response to both conditions when using the RNA-Seq and a negative regulation response when using qPCR.

3. Discussion

Soil salinity and water deficit are two of the most severe abiotic stress factors, restricting the growth and development of many plant species and generating significant losses in crop productivity [28]. Plants respond to unfavorable conditions through two pathways, namely the abscisic acid (ABA)-dependent pathway and the ABA-independent pathway [29]. Transcription factors (TFs) play vital roles in mediating stress tolerance in both of them, stimulating osmotic homeostasis, and ionic balance, among other elements, in an attempt to reduce the damage caused by stress in plants [30,31].
There is a lack of knowledge about the functioning of transcription factors (TFs) in regulating gene expression in oil palm plants under drought and salt stresses. Recently, our group reported several transcription factors been affected by those two stresses in connection with miRNAs [23,24]. The goal of the present study was to characterize TFs' found as responsive to both stresses in young oil palm plants, independently of been or not a miRNA-target gene. To do so, a group of 20 TF genes got selected for further analysis. Those TFs belong to four distinct families - MYB, HD-ZIP, HSFF, and NF-Y - previously reported as directly involved in salt and drought resistance in some plant species.
The first step in the characterization process focused on identifying features commonly found in the promoter sequences of those genes. Gene promoters contain essential regulatory cis-elements for regulating gene expression [32], and, in the present study, as expected, many important cis-elements were present in all 20 promoter regions. Numerous CAAT-box and TATA-box sequences appeared, presenting themselves possibly as the most relevant cis-elements of the ones identified. CAAT-box is a cis-acting element commonly found in promoter sequences with enhancing activity that may contribute to increased activity of promoters in response to salinity and drought stress [32]. Meanwhile, the genomic distribution of the TATA box tends to favor function-specific genes. Such as, TATA-box is rich in promoters of stress-related genes and is absent in promoters of essential genes, in addition to being associated with rapid and variable regulation under stress [27,33].
Besides CAAT – box and TATA – box, other cis-acting elements also reported as having links with response to abiotic stresses appeared, such as ABRE (response to ABA), STRE (activated by heat and osmotic stresses), as-1 (Oxidative Stress-Responsive Element activated by salicylic acid), and CGTCA – motif and TGACG – motif, both responsive to methyl jasmonate (MEJA). Although 18 out of the 20 genes presented similar qualitative profiles in the two scenarios - salt and drought stresses - evaluated, which got validated by RNA-Seq and qPCR analysis, not one specific pattern in terms of the number and position of those above cited cis-acting elements was evident.
The second step in the characterization process focused on identifying features in the sequence of the proteins coded by those genes. As expected, regarding the motifs and domains present in the proteins coded by the selected genes, it was possible to identify equivalent patterns among the representatives of each specific TFs family, corroborating the results from the GhostKOALA annotation tool, specifically the ones from the KO0300 – Transcription Factor group.
Thirteen of the selected genes belong to the MYB transcription factors family. Several studies have shown that MYB proteins perform multiple functions in response to stresses such as salt, drought, and cold [34,35,36]. MYB20 (gene 13) showed a positive regulation in the leaves of young oil palm plants under saline stress and a negative under drought. This gene is known for acting as a negative regulator of ABA-mediated stomatal closure under conditions of water stress, and its overexpression results in higher susceptibility to desiccation [37]. According to Wang et al. [36], it positively regulates plant salt tolerance by repressing key ABA repressor, PP2Cs. MYB30 (gene 16) had its expression increased in the leaves of young oil palm plants in response to both stresses. This FT is known for modulating plants' tolerance to salt through the regulation of mitochondrial alternative oxidase AOX1s; and the AOX1a overexpression rescued salt-sensitive phenotypes [36,38]. On the other hand, MYB30 positively regulates wax synthesis genes that have a direct link with the biosynthesis of the cuticle, one of the most important plant structures protecting plant leaves from desiccation [36,39].
Two of the selected genes belong to the NF-Y transcription factors family. Nuclear factor Y (NF-Y) proteins, also known as CCAAT Binding Factor (CBF) or Heme Activator Protein (HAP), modulate the expression of downstream genes via a heterotrimer – NF-YA-YB-YC – that binds through NF-YA to the CCAAT box present in the promoter region of those genes. Several members of the NF-Y family and their subunits are regulators of abiotic stress responses in plants [40,41,42,43,44]. NF-YA is a target of the miR169 family, and the overexpression of NF-YA in Arabidopsis increases its tolerance to salt stress [42].
Our previous studies have shown that members of the NF-Y family are regulated by microRNAs (miR169 and egu-miR02sds) in the leaves of young oil palm plants under salinity and drought stress [23,24]. Even though the miR169 gene got negatively regulated in oil palm plants under salinity and drought stress, the levels of NF-YA increased only under salt stress [23]. In the present study, NF-YB3 (gene 20) and NF-YC2 (gene 4) got differentially expressed in the leaves of oil palm plants under both abiotic stresses, with the former negatively regulated under salinity and drought stress and the latter positively regulated.
A hypothetical model presented by Leyva-González et al. [41] proposes that in plants exposed to abiotic stress, NF-YA levels increase due to their transcriptional activation and to the reduction in the miR169 levels, corroborating the results from Salgado et al. [23]. The higher amount of NF-YA represses early abiotic stress response genes probably by sequestering NF-YB-YC, creating a regulatory loop to arrest early responses that represent high energy and carbon costs. If that is the case, that might happen in the leaves of young oil palm plants only under salinity stress, considering that the reduction in the levels of miR169 due to drought stress does not show to affect the level of NF-YA, as seen in Salgado et al. [24].
Previous studies have reported that AtNF-YB1 improves plant performance in drought conditions, and its ortholog in maize, ZmNF-YB2, conferred resistance to water stress in the field [40]. That suggests that this would be a starting point for identifying possible markers for genetic improvement. Gene 4, an NF-YC2, was overexpressed in the leaves of oil palm plants under drought and salinity stress; this behavior was reported in conifers (Picea wilsonii) as well, where overexpression of PwHAP5 (Arabidopsis homolog NF-YC2) partially rescued the increased sensitivity of NF-YC2 to salt, drought, and ABA treatments, through its positive regulation [42].
Three of the selected genes belong to the HD-Zip transcription factors family, one positively (gene 15) and one negatively (gene 10) regulated in both scenarios, and one positively regulated under salinity stress and negatively under drought stress (gene 12). The homeodomain leucine zipper (HD-Zip) transcription factor family is one of the largest plant-specific superfamilies and includes genes with roles in modulating plant growth and response to environmental stresses, and categorized into four subfamilies - HD-Zip I, HD-Zip II, HD-Zip III, and HD-Zip IV [16,18,19].
The overexpression in Arabidopsis of HaHB4, a drought/ABA-inducible HD-Zip family I gene from sunflower, upregulated transcript levels of several genes involved in JA biosynthesis and defense-related processes, resulting in plants with shorter stem and internode distances, more round leaves and denser hairs; altogether, such phenotypes made the plants tolerant to drought [18,20]. Overexpression of ATHB-6, a drought-induced HD-Zip I gene from maize, has activated the expression of critical genes in the ABA-dependent and ROS signals pathways and improved tolerance to drought in maize [21]. Overexpression of Zmhdz10, also an HD-Zip I gene from maize, in rice and arabidopsis led to enhanced tolerance to drought and salt stresses [22]. At last, previous research using class I HD-ZIP homeobox genes showed that they get highly regulated under salt stress and that their overexpression in transgenic rice and cotton plants improved salt stress sensitivity [17,45]. The three HD-Zip genes characterized in this present study belong to the HD-Zip I (gene 10), HD-Zip II (gene 15), and HD-Zip IV (gene 12) subfamilies.
The remaining two of the selected genes belong to the HSF family. Heat shock transcription factors (HSF) are a TF class of great importance that play crucial roles in protecting plants against the effects caused by various abiotic stresses [46]. HSFs operate by inducing the accumulation of heat-shock proteins (Hsps) and by mediating the activation of other heat-responsive genes involved in cell protective mechanisms and the homeostasis of reactive oxygen species (ROS) [47]; and are reported as responsive to heat, drought, cold, and salt stresses [48]. There are three classes of HSFs, denominated A, B, and C. The HSFs from class-A have multiple acidic motifs (AHAs) at the C-terminus and function as transcriptional activators, and those from class-B contain a tetrapeptide -LFGV- in the C-terminus, which is assumed to function as a repressor motif by interaction with an unknown co-repressor, while the function of those from class-C is still unknown [47,49].
In Arabidopsis, Pérez-Salamó et al. [50] showed that estradiol-dependent induction of HSFA4A confers enhanced tolerance to salt and oxidative agents, whereas inactivation of that gene results in hypersensitivity to salt stress. The overexpression of LlHsfA3A or LlHsfA3B from lily (Lilium longiflorum) in Arabidopsis showed hypersensitivity to salt stress, and a lack of sucrose exacerbated this salt sensitivity [49]. In the present study, gene 3 - coding for an HSFA3 protein - is negatively regulated in both scenarios, while gene 5 - coding for an HSFC2b protein - was positively regulated.
Regarding the expression profile of the selected genes measured by RNA-Seq and qPCR techniques, 18 out of 20 showed similar (qualitatively) expression profiles in the two scenarios; only genes 12 and 13 differed. Such similarity in behavior in the initial responses of plants to salt stress and drought got reported previously [48,51,52,53], corroborating our results.
Last, and based on the study by McCoy et al. [54], we applied GENIE3 to mine 306 public oil palm transcriptome datasets and to construct a gene regulatory network (GRN) featuring epigenetic regulators and transcription factors from the oil palm genome. Such a study [55] used 1,333 unique regulators and 27,642 target genes from the oil palm reference genome [56]. A closer look at this oil palm GRN, and focusing on the 20 TFs genes characterized in the present study, allowed the identification of the genes regulating the TFs and those under regulation by them. Gene 10 (LOC105048648), a candidate gene concerning its potential capability to promote resistance to both salinity and drought stresses by heterologous overexpression, is a target for 16 epigenetic regulators and transcription factors while targeting 278 genes (Supplementary Table S5). A gene expressing a protein belonging to the Transcription activator GLK1/2-like (IPR044825) family is the one with the highest score among those potentially regulating gene 10, followed by another expressing a protein from the ADP-ribosylation factor GTPase-activating protein AGD11/12/13 (IPR044518) family.

4. Materials & Methods

4.1. RNA-Seq data generation

The RNA-Seq raw sequence data used in this study are available in the Sequence Read Archive (SRA) database of the National Center for Biotechnology Information under Elaeis guineensis Transcriptome_Drought and Salinity Stresses - BioProject PRJNA573093, BioSample SAMN12799239.
All information regarding the plant material, growth conditions, and abiotic (salt and drought) stress conditions used in the studies that generated RNA-Seq data are in Salgado et al. [23,24]. In summary, all plants used in this study were clones regenerated from embryogenic callus obtained from the leaves of an adult plant belonging to the AM33 genotype, and all experiments were carried out in a greenhouse at Embrapa Agroenergia (www.embrapa.br/en/agroenergia), in Brasília, DF, Brazil (S-15.732 °, W-47.900 °), using young oil palm plants in the growth phase known as bifid saplings.
In the salinity stress study, on the 12th day after the imposition of the stress, we collected the apical leaf from three control (0.0 g of NaCl per 100 g of the substrate) and three salt-stressed plants (2.0 g of NaCl per 100 g of the substrate) [23]. In the water deprivation study, apical leaves from control and drought-stressed plants were collected 14 days after the imposition of treatments, with three replicates per treatment [24]. In both studies, the plant tissue was immediately immersed in liquid nitrogen and then stored at -80 °C until RNA extraction, library preparation, and sequencing. Total RNA isolation, and RNA quality and quantity analysis, were performed as described by Salgado et al. [23,24]. The GenOne Company (Rio de Janeiro, RJ, Brazil) performed the RNA-Seq using an Illumina HiSeq platform and the paired-end strategy.

4.2. RNA-Seq data analysis

Details on the RNA-Seq analyses performed using OmicsBox version 1.3 [56] can be found in Salgado et al. [23,24]. The high-quality RNA-Seq data got aligned to the oil palm reference genome [57] - files downloaded from NCBI (BioProject PRJNA192219; BioSample: SAMN02981535) in March and October 2020 - using default parameters from OmicsBox version 1.3 through software STAR [58].
To quantify expression at the gene or transcript level, we used the default parameters of OmicsBox version 1.3 through HTSeq version 0.9.0 [59]. The pairwise differential expression analysis between the experimental conditions used edgeR version 3.28.0 [60], applying a simple design and an exact statistical test; without using a filter for low-count genes [23,24].

4.3. Genes selection and annotation

The differentially expressed genes identified in Salgado et al. [23,24] underwent annotation using the GhostKOALA annotation tool. Based on the results of the KO0300 – Transcription Factor group, we carried out a manual curation using the following conditions: 1°) Selection of the most relevant families according to the literature; 2°) Selection of differentially expressed genes within these previously selected groups; 3°) Genes that are present in both stresses; and 4°) The genes that showed a higher level of differential expression, both Up and Down.
All information regarding intron and exon regions for each gene came from the NCBI (https://www.ncbi.nlm.nih.gov/). To identify the cis-elements in the promoter region, we got a stretch of 1,432 base pairs before the ATG start codon of each gene from the oil palm reference genome [56], and the known elements characterized using the database PlantCARE [61]; the statistical sieve was Score ≤ 5. To analyze the structure of proteins and promoters related to transcription factors, we applied the MEME software (https://meme-suite.org/meme/tools /meme), with a maximum of 10 found motifs. Motifs that did not pass the statistical sieve (E-value ≤ 0.05) got excluded from the analysis.
After obtaining the protein sequences of the selected genes from the oil palm reference genome [56], the proteins domains got characterized through the NCBI Conserved Domain Search (www.ncbi.nlm.nih.gov/Structure/cdd/wrpsb.cgi). Those domains that did not pass the statistical sieve (E-value ≤ 1) got excluded from the analysis. For the functional analysis of proteins, we used the EggNOG platform [62]. For the multiple sequence alignment, we applied the ClustalW program [63]; for both the protein and promoter region data. Subsequently, the phylogenetic trees got built using the maximum likelihood method, using a bootstrap of 1000 replicates, using the MEGA11 software [64].
The figures referring to the results of the cis-element analysis; motifs, protein domains, and intron and exon regions got generated through the Python library “DNA Features Viewer” (https://edinburgh-genome-foundry.github.io/DnaFeaturesViewer/).

4.4. RNA extraction, reverse transcriptase-PCR and quantitative real-time PCR analyses

Total RNA isolation, and RNA quality and quantity analysis, were performed as described by Salgado et al. [23,24]. After quantified, the extracted total RNA served as a template for reverse transcription using the commercial kit SuperScriptR (Invitrogen) following the manufacturer's protocol. The positive control gene was the EgEfMPOB00119 40S mRNA of ribosomal protein S23, a constitutive gene in E. guineensis.
For primer design, fasta files from the selected genes got downloaded from NCBI and exported to PerlPrimer software to design primers (Table 2). qPCRs were performed in 96-well optical plates on a 7500 real-time PCR system (Applied Biosystems, Foster City, CA, USA) with a PowerUpTM SYBRTM Green Master Mix, REF A25741 (Thermo Fisher Scientific), following the manufacturer's instructions. The qPCR reaction conditions were as follows: 50°C for 2 min, 95°C for 2 min, followed by 40 cycles of 95°C for 5 seconds and 60°C for 30 seconds. A melting curve got created to analyze the specificity of the reactions. Then, three biological replicates got performed for each sample. The expression level of the untreated sample got set to 1 for normalization.

4.5. Pair-by-pair comparison and correlation analysis

We performed a pair-by-pair comparison between the different stresses and methods used to analyze and validate the genes; the input data were Log2 (Fold Change). The correlation analysis got carried out using the data set referring to the differential expression of genes (DEGs) common to the two scenarios studied (salinity and drought); obtained by qPCR.

5. Conclusions

To the best of our knowledge, no report shows that oil palm (E. guineensis) has salinity or drought stress tolerance. All transcriptome data collected and analyzed in the present study and in Salgado et al. [23,24] derived from the apical leaf of young oil palm plants submitted to very high salinity levels in the soil or water deprivation. When we collected those leaves, the plants showed severe symptoms (browning, scorched, dying) as a consequence of being for almost two weeks under stress. Consequently, we assume that those plants were not showing any signs of tolerance; on the contrary, they were affected by high salinity in the soil or water deprivation and would die if kept longer under those conditions.
Starting from this premise and remembering that the initial goal of this study was to get more insights on the role of transcription factors in the response of young oil palm plants to those two stresses, it is necessary to state that the development of plants tolerant/resistant to those abiotic stresses was also in the horizon during this study. That is why a search for molecular symptoms that might allow us to set up strategies for genetic engineering/editing got performed.
In conclusion, the results presented here shed light on the role of 20 TFs from four different TF families during the response of young oil palm plants to severe levels of salinity in the soil or water deprivation. The behavior of such a group of TFs made it very clear that there is a high level of similarity in the molecular response to both stresses. That similarity allows the search for genes that might grant strategies aiming to develop oil palm plants with a tolerance to both salinity and drought at once. As an example, and based on the results obtained by our group - as well as on the scientific literature available regarding some of the genes here characterized and the success of some of them in achieving tolerance to those abiotic stresses through overexpression or silencing - we postulate that the overexpression of gene 10, an HD-Zip I gene from oil palm, is a valuable strategy to obtain plants with increased tolerance to drought and salinity. However, one must state that once this gene seems to be regulated by 16 and regulating 278 genes, such behavior might trigger several pleiotropic effects once overexpressed in the oil palm genome or heterologously.

Supplementary Materials

The following supporting information can be downloaded at the website of this paper posted on Preprints.org, Supplementary Table S1a: Annotation of drought stress-responsive transcription factors in oil palm leaves using the Ghostkoala tool. Supplementary Table S1b: Annotation of drought stress-responsive transcription factors in oil palm leaves using the Ghostkoala tool. Supplementary Table S2: Annotation of the domains of the 19 proteins that were positive in the NCBI, description of the type, superfamily and start-end of the domains. Supplementary Table S3: Classification of the gene ontology (GO) of palm oil genes, being F: molecular function, P: biological process, C: cellular component. Supplementary Table S4: Description of the family and differential expression profile of the 20 oil palm genes expressed under salt and water stress using the qPCR technique. Supplementary Table S5: List of regulators and targets of gene 10 (LOC105048648), and respective scores.

Author Contributions

Conceptualization: C.A.F.d.S., P.G. and M.T.S.J. Methodology, investigation, data curation, and formal analysis: R.C.T., A.P.L., F.F.S. and T.L.C.d.S. Funding acquisition and supervision: M.T.S.J. Writing—original draft: F.F.S, C.A.F.d.S.; and P.G. Writing—review and editing: M.T.S.J. All authors have read and agreed to the published version of the manuscript.

Funding

The author(s) disclosed receipt of the following financial support for the research, authorship, and/or publication of this article: The grant (01.13.0315.00 DendêPalm Project) for this study was awarded by the Brazilian Ministry of Science, Technology, and Innovation (MCTI) via the Brazilian Innovation Agency FINEP. The authors confirm that the funder had no influence over the study design, the content of article, or selection of this journal.

Data Availability Statement

The datasets used and/or analyzed in the current study are available from the corresponding author on reasonable request.

Acknowledgments

The authors acknowledge funding to F.F.S. and T.L.C.S. by the Coordination for the Improvement of Higher Education Personnel (CAPES), a Foundation within the Ministry of Education in Brazil, via the Graduate Program in Plant Biotechnology, Federal University of Lavras (UFLA).

Conflicts of Interest

Authors APL, RCT, CAFdS, PB, and MTSJ were employed by company The Brazilian Agricultural Research Corporation. The remaining authors declare that the research was conducted in the absence of any commercial or financial relationships that could be construed as a potential conflict of interest.

References

  1. Statista, 2023. Available online: www.statista.com (accessed on June 30, 2023).
  2. Brasil. Ministério da Agricultura, Pecuária e Abastecimento. 2028. Diagnóstico da Produção Sustentável da Palma de Óleo no Brasil / Ministério da Agricultura, Pecuária e Abastecimento - MAPA. Available online: http://www.abrapalma.org/pt/wp-content/uploads/2014/12/DIAGNOSTICO_PALMA.pdf.
  3. Corley, R.H.V.; Rao, V.; Palat, T.; Praiwan, T. Breeding for drought tolerance in oil palm. J. Oil Palm Res. 2018, 30, 26–35. [Google Scholar]
  4. Zaman, M.; Shahid, S.A.; Heng, L. Guideline for salinity assessment, mitigation and adaptation using nuclear and related techniques. Springer International Publishing 2018. [CrossRef]
  5. Machado, R.; Serralheiro, R. Soil salinity: Effect on vegetable crop growth. Manag. Pract. Prev. Mitigate Soil Salinization. Hortic. 2017, 3, 30. [Google Scholar] [CrossRef]
  6. Shahid, S.A.; Zaman, M.; Heng, L. Soil salinity: Historical perspectives and a world overview of the problem; Guideline for Salinity Assessment, Mitigation and Adaptation Using Nuclear and Related Techniques; Zaman, M., Shahid, S.A., Heng, L., Eds.; Springer International Publishing, 2018; pp. 43–53. [Google Scholar] [CrossRef]
  7. Ivushkin, K.; Bartholomeus, H.; Bregt, A.K.; Pulatov, A.; Kempen, B.; De Sousa, L. Global mapping of soil salinity change. Remote Sens. Environ. 2019, 231, 111260. [Google Scholar] [CrossRef]
  8. Angon, P.B.; Tahjib-Ul-Arif, Md. , Samin, S.I.; Habiba, U.; Hossain, M.A.; Brestic, M. How do plants respond to combined drought and salinity stress?—A systematic review. Plants 2022, 11, 2884. [Google Scholar] [CrossRef]
  9. Wang, W.; Pang, J.; Zhang, F.; Sun, L.; Yang, L.; Fu, T.; Guo, L.; Siddique, K.H. M. Salt-responsive transcriptome analysis of canola roots reveals candidate genes involved in the key metabolic pathway in response to salt stress. Sci. Rep. 2022, 12, 1666. [Google Scholar] [CrossRef]
  10. Zhang, H.; Zhu, J.; Gong, Z.; Zhu, J.-K. Abiotic stress responses in plants. Nat. Rev. Genet. 2022, 23, 104–119. [Google Scholar] [CrossRef]
  11. Wang, J.; Ye, Y.; Xu, M.; Feng, L.; Xu, L. Roles of the SPL gene family and miR156 in the salt stress responses of tamarisk (Tamarix chinensis). BMC Plant Biol. 2019, 19, 370. [Google Scholar] [CrossRef]
  12. Javed, T.; Shabbir, R.; Ali, A.; Afzal, I.; Zaheer, U.; Gao, S.-J. Transcription factors in plant stress responses: Challenges and potential for sugarcane improvement. Plants 2020, 9, 491. [Google Scholar] [CrossRef]
  13. He, M.; He, C.-Q.; Ding, N.-Z. Abiotic stresses: General defenses of land plants and chances for engineering multistress tolerance. Front. Plant Sci. 2018, 9, 1771. [Google Scholar] [CrossRef]
  14. Hajyzadeh, M.; Turktas, M.; Khawar, K.M.; Unver, T. Mir408 overexpression causes increased drought tolerance in chickpea. Gene 2015, 555, 186–193. [Google Scholar] [CrossRef] [PubMed]
  15. Chaudhari, R.S.; Jangale, B.L.; Krishna, B.; Sane, P.V. Improved abiotic stress tolerance in Arabidopsis by constitutive active form of a banana DREB2 type transcription factor, MaDREB20.CA, than its native form, MaDREB20. Protoplasma 2023, 260, 671–690. [Google Scholar] [CrossRef] [PubMed]
  16. Belamkar, V.; Weeks, N.T.; Bharti, A.K.; Farmer, A.D.; Graham, M.A.; Cannon, S.B. Comprehensive characterization and RNA-Seq profiling of the HD-Zip transcription factor family in soybean (Glycine max) during dehydration and salt stress. BMC Genom. 2014, 15, 950. [Google Scholar] [CrossRef]
  17. Bhattacharjee, A.; Khurana, J.P.; Jain, M. Characterization of rice homeobox genes, oshox22 and oshox24, and over-expression of oshox24 in transgenic arabidopsis suggest their role in abiotic stress response. Front. Plant Sci. 2016, 7. [Google Scholar] [CrossRef] [PubMed]
  18. Gong, S.; Ding, Y.; Hu, S.; Ding, L.; Chen, Z.; Zhu, C. The role of HD-Zip class I transcription factors in plant response to abiotic stresses. Physiol. Plant. 2019, 167, 516–525. [Google Scholar] [CrossRef]
  19. Sharif, R.; Raza, A.; Chen, P.; Li, Y.; El-Ballat, E.M.; Rauf, A.; Hano, C.; El-Esawi, M.A. Hd-zip gene family: Potential roles in improving plant growth and regulating stress-responsive mechanisms in plants. Genes 2021, 12, 1256. [Google Scholar] [CrossRef] [PubMed]
  20. Dezar, C.A.; Gago, G.M.; González, D.H.; Chan, R.L. Hahb-4, a sunflower homeobox-leucine zipper gene, is a developmental regulator and confers drought tolerance to Arabidopsis thaliana plants. Transgenic Res. 2005, 14, 429–440. [Google Scholar] [CrossRef]
  21. Jiao, P.; Jiang, Z.; Wei, X.; Liu, S.; Qu, J.; Guan, S.; Ma, Y. Overexpression of the homeobox-leucine zipper protein ATHB-6 improves the drought tolerance of maize (Zea mays L.). Plant Sci. 2022, 316, 111159. [Google Scholar] [CrossRef]
  22. Zhao, Y.; Ma, Q.; Jin, X.; Peng, X.; Liu, J.; Deng, L.; Yan, H.; Sheng, L.; Jiang, H.; Cheng, B. A novel maize homeodomain–leucine zipper (Hd-zip) i gene, zmhdz10, positively regulates drought and salt tolerance in both rice and arabidopsis. Plant Cell Physiol. 2014, 55, 1142–1156. [Google Scholar] [CrossRef]
  23. Salgado, F.F.; Vieira, L.R.; Silva, V.N. B.; Leão, A.P.; Grynberg, P.; Do Carmo Costa, M.M.; Togawa, R.C.; De Sousa, C.A. F.; Júnior, M.T. S. Expression analysis of miRNAs and their putative target genes confirm a preponderant role of transcription factors in the early response of oil palm plants to salinity stress. BMC Plant Biol. 2021, 21, 518. [Google Scholar] [CrossRef]
  24. Salgado, F.F.; Da Silva, T.L. C.; Vieira, L.R.; Silva, V.N. B.; Leão, A.P.; Costa, M.M. D. C.; Togawa, R.C.; De Sousa, C.A. F.; Grynberg, P.; Souza, M.T. The early response of oil palm (Elaeis guineensis Jacq.) plants to water deprivation: Expression analysis of miRNAs and their putative target genes, and similarities with the response to salinity stress. Front. Plant Sci. 2022, 13, 970113. [Google Scholar] [CrossRef] [PubMed]
  25. Chen, X.; Chen, Z.; Zhao, H.; Zhao, Y.; Cheng, B.; Xiang, Y. Genome-wide analysis of soybean hd-zip gene family and expression profiling under salinity and drought treatments. PLoS ONE 2014, 9, e87156. [Google Scholar] [CrossRef] [PubMed]
  26. Stephenson, T.J.; McIntyre, C.L.; Collet, C.; Xue, G.-P. Genome-wide identification and expression analysis of the NF-Y family of transcription factors in Triticum aestivum. Plant Mol. Biol. 2007, 65, 77–92. [Google Scholar] [CrossRef] [PubMed]
  27. Roelofs, D.; Morgan, J.; Stürzenbaum, S. The significance of genome-wide transcriptional regulation in the evolution of stress tolerance. Evol. Ecol. 2010, 24, 527–539. [Google Scholar] [CrossRef]
  28. Qin, F.; Shinozaki, K.; Yamaguchi-Shinozaki, K. Achievements and challenges in understanding plant abiotic stress responses and tolerance. Plant Cell Physiol. 2011, 52, 1569–1582. [Google Scholar] [CrossRef]
  29. Yamaguchi-Shinozaki, K.; Shinozaki, K. (2007). Improving plant drought, salt and freezing tolerance by gene transfer of a single stress-inducible transcription factor. Em J. A. Goode & D. Chadwick (Orgs.), Novartis Foundation Symposia (p. 176–189). John Wiley & Sons, Ltd. [CrossRef]
  30. Ni, Z.; Hu, Z.; Jiang, Q.; Zhang, H. GmNFYA3, a target gene of miR169, is a positive regulator of plant tolerance to drought stress. Plant Mol. Biol. 2013, 82, 113–129. [Google Scholar] [CrossRef]
  31. Xu, Z.; Gongbuzhaxi, *!!! REPLACE !!!*; Wang, C.; Xue, F.; Zhang, H.; Ji, W. Wheat NAC transcription factor TaNAC29 is involved in response to salt stress. Plant Physiol. Biochem. 2015, 96, 356–363. [Google Scholar] [CrossRef]
  32. Song, S.; Xu, Y.; Huang, D.; Miao, H.; Liu, J.; Jia, C.; Hu, W.; Valarezo, A.V.; Xu, B.; Jin, Z. Identification of a novel promoter from banana aquaporin family gene ( MaTIP1;2 ) which responses to drought and salt-stress in transgenic Arabidopsis thaliana. Plant Physiol. Biochem. 2018, 128, 163–169. [Google Scholar] [CrossRef]
  33. Yu, Y.; Xu, W.; Wang, J.; Wang, L.; Yao, W.; Xu, Y.; Ding, J.; Wang, Y. A core functional region of the RFP1 promoter from Chinese wild grapevine is activated by powdery mildew pathogen and heat stress. Planta 2013, 237, 293–303. [Google Scholar] [CrossRef]
  34. Dubos, C.; Stracke, R.; Grotewold, E.; Weisshaar, B.; Martin, C.; Lepiniec, L. MYB transcription factors in Arabidopsis. Trends Plant Sci. 2010, 15, 573–581. [Google Scholar] [CrossRef]
  35. Roy, S. Function of MYB domain transcription factors in abiotic stress and epigenetic control of stress response in plant genome. Plant Signal. Behav. 2016, 11, e1117723. [Google Scholar] [CrossRef]
  36. Wang, X.; Niu, Y.; Zheng, Y. Multiple functions of myb transcription factors in abiotic stress responses. Int. J. Mol. Sci. 2021, 22, 6125. [Google Scholar] [CrossRef]
  37. Gao, S.; Zhang, Y.L.; Yang, L.; Song, J.B.; Yang, Z.M. AtMYB20 is negatively involved in plant adaptive response to drought stress. Plant Soil. 2014, 376, 433–443. [Google Scholar] [CrossRef]
  38. Gong, Q.; Li, S.; Zheng, Y.; Duan, H.; Xiao, F.; Zhuang, Y.; He, J.; Wu, G.; Zhao, S.; Zhou, H.; Lin, H. SUMOylation of MYB30 enhances salt tolerance by elevating alternative respiration via transcriptionally upregulating AOX1a in Arabidopsis. Plant J. 2020, 102, 1157–1171. [Google Scholar] [CrossRef] [PubMed]
  39. Lee, S.B.; Suh, M.C. Advances in the understanding of cuticular waxes in Arabidopsis thaliana and crop species. Plant Cell Rep. 2015, 34, 557–572. [Google Scholar] [CrossRef] [PubMed]
  40. Nelson, D.E.; Repetti, P.P.; Adams, T.R.; Creelman, R.A.; Wu, J.; Warner, D.C.; Anstrom, D.C.; Bensen, R.J.; Castiglioni, P.P.; Donnarummo, M.G.; Hinchey, B.S.; Kumimoto, R.W.; Maszle, D.R.; Canales, R.D.; Krolikowski, K.A.; Dotson, S.B.; Gutterson, N.; Ratcliffe, O.J.; Heard, J.E. Plant nuclear factor Y (Nf-y) B subunits confer drought tolerance and lead to improved corn yields on water-limited acres. Proc. Natl. Acad. Sci. USA 2007, 104, 16450–16455. [Google Scholar] [CrossRef]
  41. Leyva-González, M.A.; Ibarra-Laclette, E.; Cruz-Ramírez, A.; Herrera-Estrella, L. Functional and transcriptome analysis reveals an acclimatization strategy for abiotic stress tolerance mediated by Arabidopsis nf-ya family members. PLoS ONE 2012, 7, e48138. [Google Scholar] [CrossRef]
  42. Li, L.; Yu, Y.; Wei, J.; Huang, G.; Zhang, D.; Liu, Y.; Zhang, L. Homologous HAP5 subunit from Picea wilsonii improved tolerance to salt and decreased sensitivity to ABA in transformed Arabidopsis. Planta 2013, 238, 345–356. [Google Scholar] [CrossRef]
  43. Kumar, R. Role of micrornas in biotic and abiotic stress responses in crop plants. Appl. Biochem. Biotechnol. 2014, 174, 93–115. [Google Scholar] [CrossRef]
  44. Zhao, H.; Wu, D.; Kong, F.; Lin, K.; Zhang, H.; Li, G. The Arabidopsis thaliana nuclear factor y transcription factors. Frontiers in Plant Science 2017, 07. [Google Scholar] [CrossRef]
  45. Li, Y.; Yang, Z.; Zhang, Y.; Guo, J.; Liu, L.; Wang, C.; Wang, B.; Han, G. The roles of HD-ZIP proteins in plant abiotic stress tolerance. Front. Plant Sci. 2022, 13, 1027071. [Google Scholar] [CrossRef] [PubMed]
  46. Guo, M.; Liu, J.-H.; Ma, X.; Luo, D.-X.; Gong, Z.-H.; Lu, M.-H. The plant heat stress transcription factors (Hsfs): Structure, regulation, and function in response to abiotic stresses. Frontiers in Plant Science 2016, 7. [Google Scholar] [CrossRef] [PubMed]
  47. Ohama, N.; Sato, H.; Shinozaki, K.; Yamaguchi-Shinozaki, K. Transcriptional regulatory network of plant heat stress response. Trends Plant Sci. 2017, 22, 53–65. [Google Scholar] [CrossRef] [PubMed]
  48. Li, W.; Wan, X.-L.; Yu, J.-Y.; Wang, K.-L.; Zhang, J. Genome-wide identification, classification, and expression analysis of the hsf gene family in carnation (Dianthus caryophyllus). Int. J. Mol. Sci. 2019, 20, 5233. [Google Scholar] [CrossRef] [PubMed]
  49. Wu, Z.; Liang, J.; Wang, C.; Zhao, X.; Zhong, X.; Cao, X.; Li, G.; He, J.; Yi, M. Overexpression of lily HsfA3s in Arabidopsis confers increased thermotolerance and salt sensitivity via alterations in proline catabolism. J. Exp. Bot. 2018, 69, 2005–2021. [Google Scholar] [CrossRef]
  50. Pérez-Salamó, I.; Papdi, C.; Rigó, G.; Zsigmond, L.; Vilela, B.; Lumbreras, V.; Nagy, I.; Horváth, B.; Domoki, M.; Darula, Z.; Medzihradszky, K.; Bögre, L.; Koncz, C.; Szabados, L. The heat shock factor a4a confers salt tolerance and is regulated by oxidative stress and the mitogen-activated protein kinases mpk3 and mpk6. Plant Physiology 2014, 165, 319–334. [Google Scholar] [CrossRef]
  51. Zhu, J.-K. SALT AND DROUGHT STRESS SIGNAL TRANSDUCTION IN PLANTS. Annu. Rev. Plant Biol. 2002, 53, 247–273. [Google Scholar] [CrossRef]
  52. Rasmussen, S.; Barah, P.; Suarez-Rodriguez, M.C.; Bressendorff, S.; Friis, P.; Costantino, P.; Bones, A.M.; Nielsen, H.B.; Mundy, J. Transcriptome responses to combinations of stresses in arabidopsis. Plant Physiol. 2013, 161, 1783–1794. [Google Scholar] [CrossRef]
  53. Hazzouri, K.M.; Flowers, J.M.; Nelson, D.; Lemansour, A.; Masmoudi, K.; Amiri, K.M. A. Prospects for the study and improvement of abiotic stress tolerance in date palms in the post-genomics era. Front. Plant Sci. 2020, 11, 293. [Google Scholar] [CrossRef]
  54. McCoy, R.M.; Julian, R.; Kumar, S.R.V.; Ranjan, R.; Varala, K.; Li, Y. A Systems Biology Approach to Identify Essential Epigenetic Regulators for Specific Biological Processes in Plants. Plants 2021, 10, 364. [Google Scholar] [CrossRef]
  55. Carvalho da Silva, T.L.; Grynberg, P.; Togawa, R.C.; Souza, M., Jr. T. The Brazilian Agricultural Research Corporation, Embrapa Agroenergy, Brasília, DF, Brazil. 2023, status (manuscript in preparation; to be submitted).
  56. OmicsBox – Bioinformatics Made Easy, BioBam Bioinformatics, 2019. 3 March. Available online: https://www.biobam.com/omicsbox.
  57. Singh, R.; Ong-Abdullah, M.; Low, E.-T. L.; Manaf, M.A. A.; Rosli, R.; Nookiah, R.; Ooi, L.C.-L.; Ooi, S.; Chan, K.-L.; Halim, M.A.; et al. Oil palm genome sequence reveals divergence of interfertile species in Old and New worlds. Nature 2013, 500, 335–339. [Google Scholar] [CrossRef] [PubMed]
  58. Dobin, A.; Davis, C.A.; Schlesinger, F.; Drenkow, J.; Zaleski, C.; Jha, S.; Batut, P.; Chaisson, M.; Gingeras, T.R. STAR: Ultrafast universal RNA-seq aligner. Bioinformatics 2013, 29, 15–21. [Google Scholar] [CrossRef] [PubMed]
  59. Anders, S.; Pyl, P.T.; Huber, W. HTSeq—A Python framework to work with high-throughput sequencing data. Bioinformatics 2015, 31, 166–169. [Google Scholar] [CrossRef] [PubMed]
  60. Robinson, M.D.; McCarthy, D.J.; Smyth, G.K. Edger: A bioconductor package for differential expression analysis of digital gene expression data. Bioinformatics 2010, 26, 139–140. [Google Scholar] [CrossRef]
  61. Lescot, M. PlantCARE, a database of plant cis-acting regulatory elements and a portal to tools for in silico analysis of promoter sequences. Nucleic Acids Res. 2002, 30, 325–327. [Google Scholar] [CrossRef]
  62. Huerta-Cepas, J.; Szklarczyk, D.; Heller, D.; Hernández-Plaza, A.; Forslund, S.K.; Cook, H.; Mende, D.R.; Letunic, I.; Rattei, T.; Jensen, L.J.; von Mering, C.; Bork, P. Eggnog 5. 0: A hierarchical, functionally and phylogenetically annotated orthology resource based on 5090 organisms and 2502 viruses. Nucleic Acids Res. 2019, 47, D309–D314. [Google Scholar] [CrossRef]
  63. Thompson, J.D.; Higgins, D.G.; Gibson, T.J. CLUSTAL W: Improving the sensitivity of progressive multiple sequence alignment through sequence weighting, position-specific gap penalties and weight matrix choice. Nucleic Acids Res. 1994, 22, 4673–4680. [Google Scholar] [CrossRef]
  64. Tamura, K.; Stecher, G.; Kumar, S. Mega11: Molecular evolutionary genetics analysis version 11. Molecular Biology and Evolution 2021, 38, 3022–3027. [Google Scholar] [CrossRef]
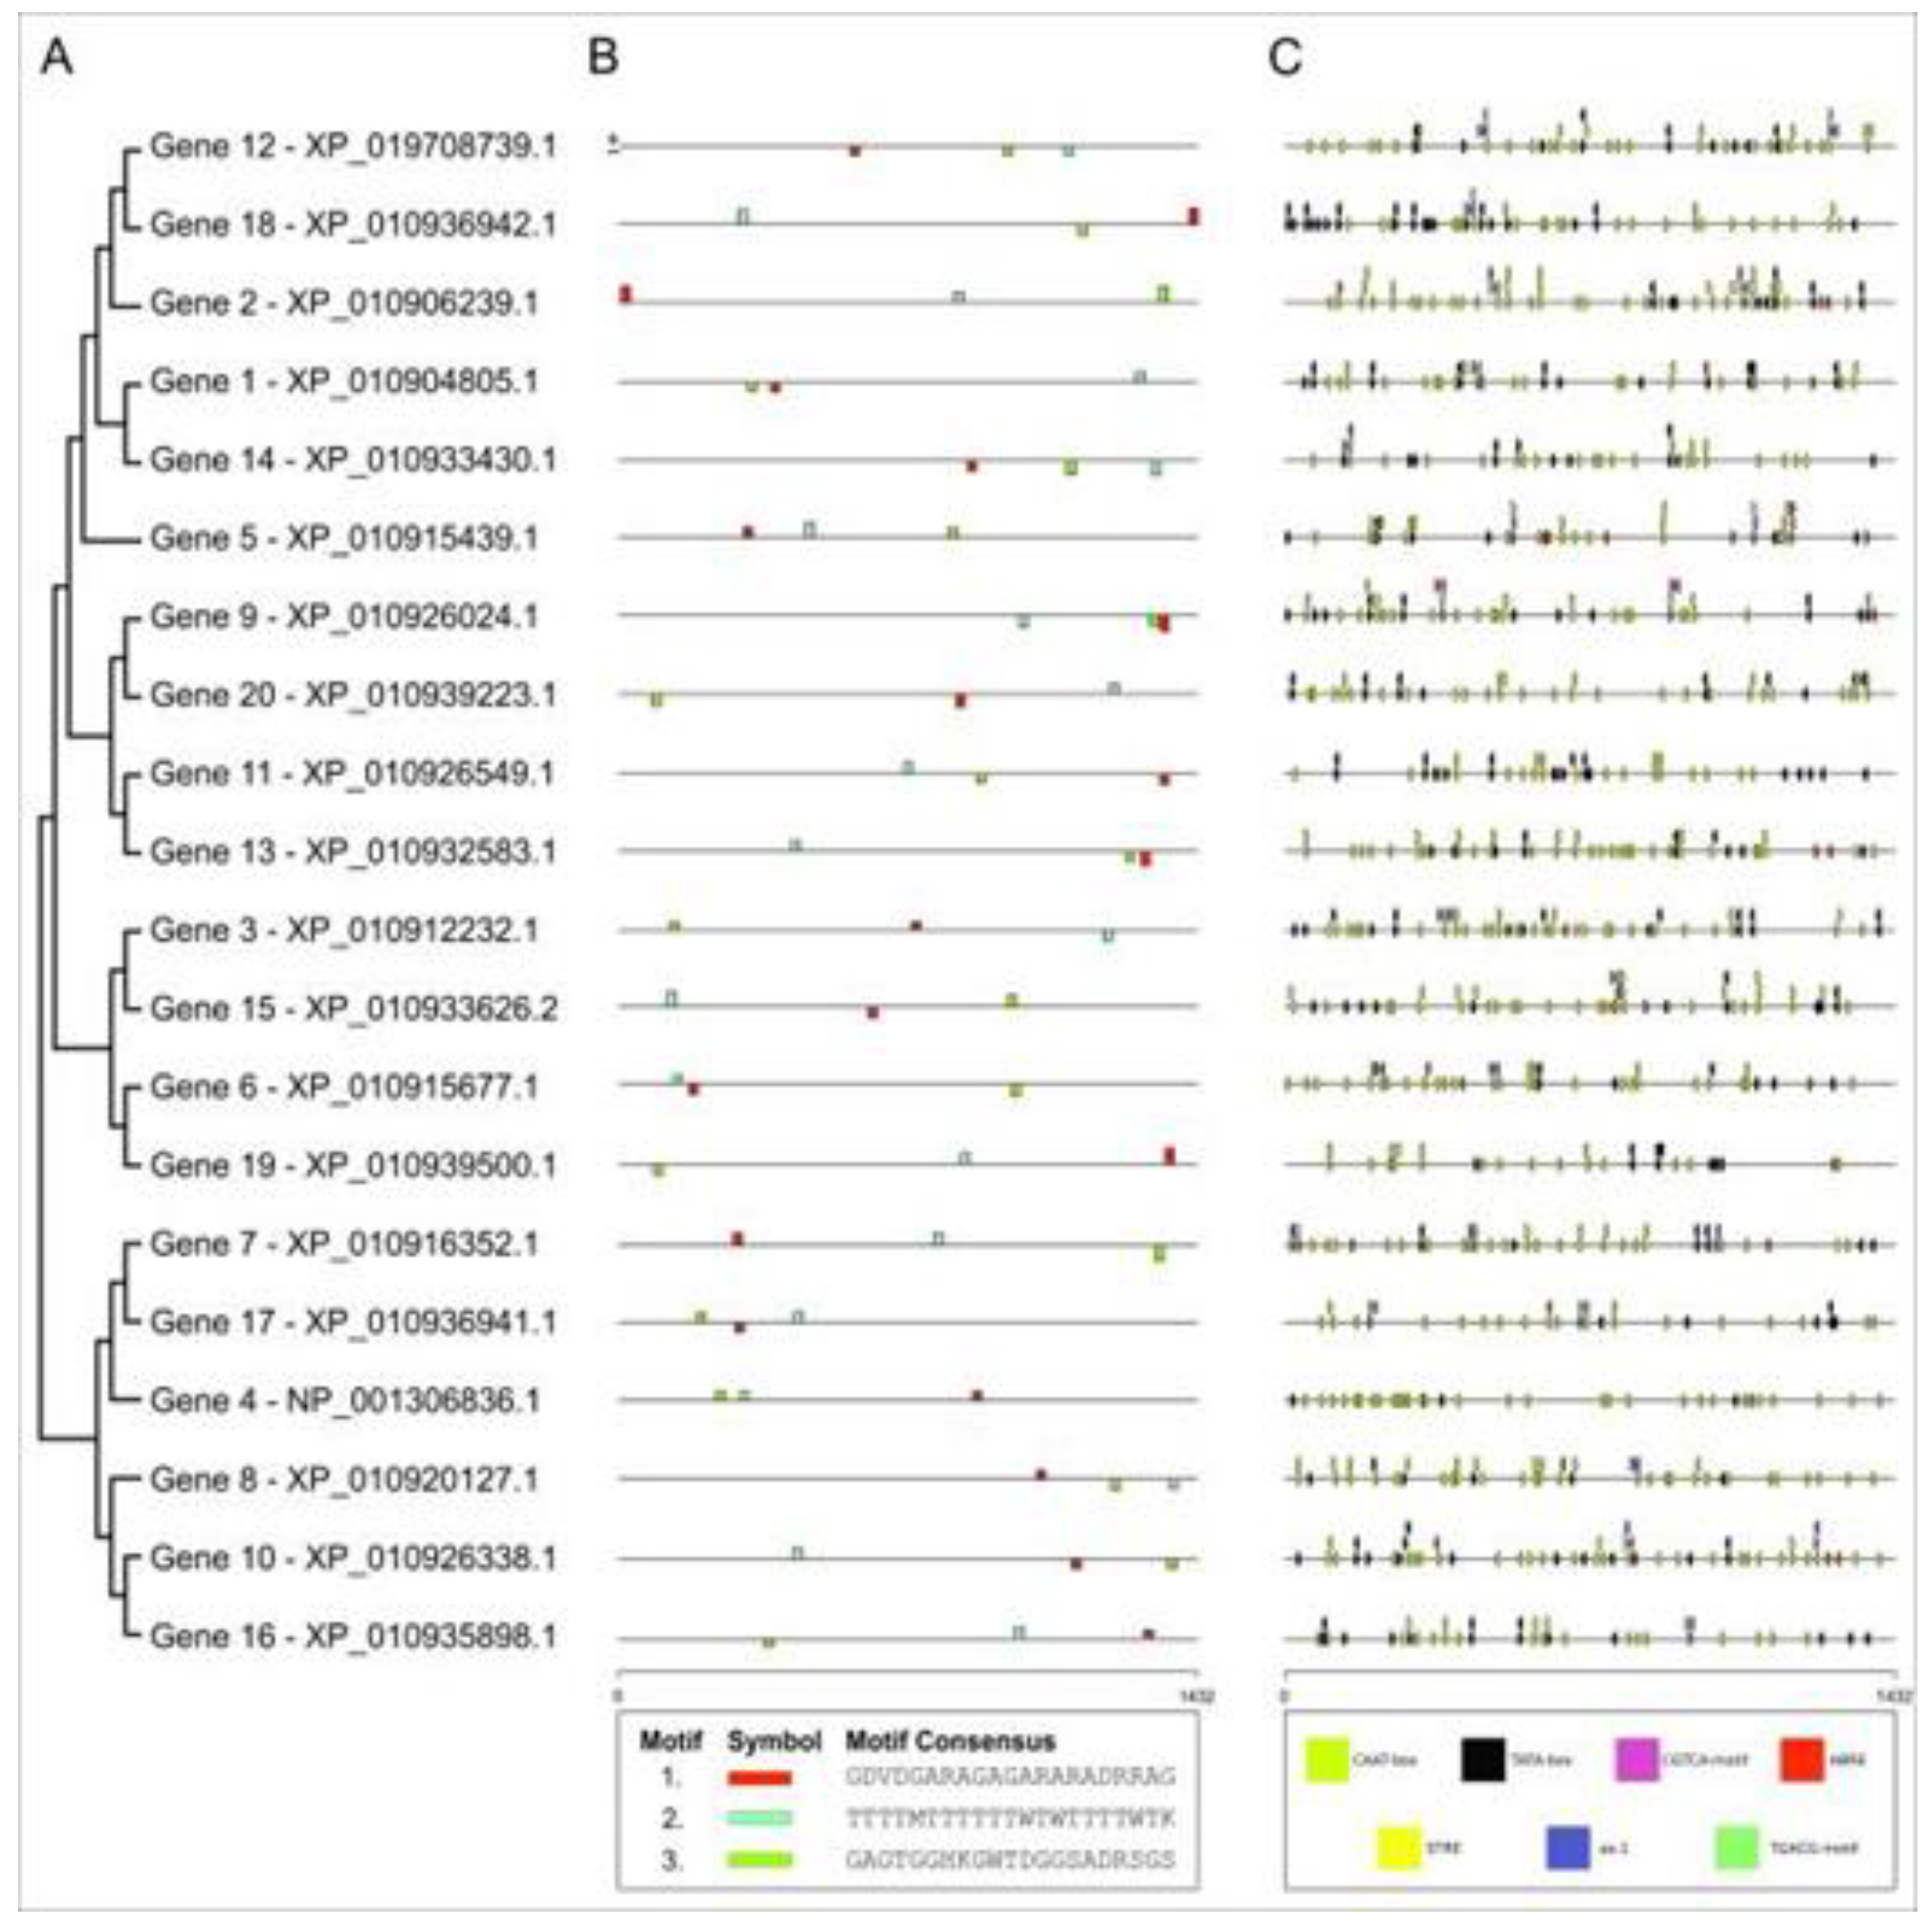
Figure 1. Structural annotation performed on the 1432 bp long sequence upstream of the initiation codon of selected salt and drought stress-responsive genes. A: phylogenetic tree performed using the MEGA11 software. B: Analysis of conserved motifs and their position in the nucleotide sequence. C: Localized cis action elements, their location and frequency.
Preprints 78898 g001
Figure 2. Number and location of intron and exon of selected salt and drought stress-responsive genes in the oil palm genome. The green boxes represent the number of exons and their location in the gene.
Preprints 78898 g002
Figure 3. Structural annotation of the protein sequence of selected salt and drought stress-responsive genes. A: phylogenetic tree performed using the MEGA11 software. B: Domains of the 19 proteins that were positive on the NCBI platform, where each color represents a different domain. C: Conserved motifs of the 18 proteins that were positive and their position in the amino acid sequence, where each color represents a different motif.
Preprints 78898 g003
Figure 4. Gene Ontology (GO) plot of annotation rank statistics of selected salt and drought stress-responsive genes in the oil palm genome; classified according to cellular component (blue), molecular function (orange) and biological process (green). The numbers represent the number of positive hits.
Preprints 78898 g004
Figure 5. Expression profiles in Log2(FC) of the 20 genes selected using qPCR, A: resulting from the submission of young oil palm plants to drought stress, in comparison with the control treatment; and B - resulting from the submission of young oil palm plants to saline stress, in comparison with the control treatment. FC - fold change.
Preprints 78898 g005
Figure 6. Log2(FC) correlation analysis of the 20 selected genes; resulting from the qPCR analysis, by pairwise comparison of two scenarios: saline stress and water stress. FC - fold change.
Preprints 78898 g006
Figure 7. Correlation analysis of the Log2(FC) of the 20 selected genes. A: Differential gene expression under saline stress, pairwise comparison of two scenarios: qPCR and RNASeq; and B: Differential expression of genes under drought stress, pairwise comparison of two scenarios: qPCR and RNASeq. FC - fold change.
Preprints 78898 g007
Table 1. Pair of primers used in the qPCR analysis of the 20 genes prospected.
Gene Forward Primer Reverse Primer
Gene 01 GATAAGAATGGTCTGAAGAAGGG CAATTGCTGACCACTTGTTCC
Gene 02 GGAGGACCAGAAACTTGTAGAC ATTAGAGACCATCTGTTGCCC
Gene 03 TTTTCGCAAGATTGATGCTG TCATGAGATGCTCCTGTTGC
Gene 04 GGTAGACCTCTCTGCATCG CCTACCACCAGCTGAAAATACC
Gene 05 GCTCAACACCTATGGGTTTCG ACCTTCTCTTCGATCTTCCTCTG
Gene 06 CACCACTTAAGATCCGTTGCC GCTATCAAATCCCACCTGTCAC
Gene 07 ACGAGAAGCTCATTAACTACATCC CTATCAATGACCACCGATTGCC
Gene 08 GGACCAAGGAGGAAGATGAC AGAGACCATTTGTTGCCGAG
Gene 09 CTAAGTGCTCAGGCTTGAAGAG GTCCTCCAGTAGTTCTTTATCTCG
Gene 10 TCGAGCGTGGTGTTTAATG CGGAGCAGTACCAAGAGAGG
Gene 11 TTTAGGCAATAGGTGGGCAG TATTGAGCTTCTCCACAGACAG
Gene 12 AGTCACAGTTCACAAGAGCAC CATTCAGAGCACGAAGGAGAG
Gene 13 AGCTAGCAGGATTGCTTAGG CTGGTCAACAGTTTCAGCG
Gene 14 CAAGGGTTCATGGACACCAG TTCGACCATTTGTTTCCAAGC
Gene 15 GACACAAGCCATGATTGAAG TAGCGAGCAACCCTTTTATCTC
Gene 16 CAAGCAAGCTGGTCTATTGAGG CGGCTGGTTTGGATTCACTC
Gene 17 CTTCACTCTAGCGATATCTACCG AACGTTTCAACCCTGCTCTC
Gene 18 CCATGTTGTTCAAAGGAGGG GCAATTAGAGACCATCTGTTTCC
Gene 19 CCTACTAATACTGGGCTGATGAG GGTGTTCCAATAGTTCTTGATGTC
Gene 20 GGTGGGAATTCTTCCTCTTC TAATTCAGAGACCAACCCAACC
Control Gene* CCAGGGTTCAGCTGATTAAG TCGTCCAAATCCAGCAATC
* EgEfMPOB00119.
Table 2. Profile of transcription factor genes from the leaf of oil palm plants differentially expressed under salt and water stress accordingly to RNA-Seq analysis. Expression Profile (EP), Fold Change (FC), Log2 (FC), and False Discovery Rate (FDR).
Gene Family Protein ID Description Salt Stress Drought Stress
EP FC Log2(FC) FDR EP FC Log2(FC) FDR
1 MYBP XP_010904805.1 transcription factor MYB102 Up 4.2 2.1 0 Up 50.2 5.6 0
2 MYBP XP_010906239.1 transcription repressor MYB5-like Down -9.6 -3.3 0 Down -21.2 -4.4 0
3 HSFF XP_010912232.1 heat stress transcription factor A-3 Down -6.3 -2.7 0 Down -6.8 -2.8 0
4 NFYC, HAP5 NP_001306836.1 nuclear transcription factor Y subunit C-2-like Up 4.3 2.1 0 Up 18.7 4.2 0
5 HSFF XP_010915439.1 heat stress transcription factor C-2b Up 2.3 1.2 0 Up 11.6 3.5 0
6 MYBP XP_010915677.1 transcription factor TRY Down -8.8 -3.1 0 Down -5.6 -2.5 0
7 MYBP XP_010916352.1 myb-related protein 308 Down -4.7 -2.2 0 Down -3.1 -1.6 0
8 MYBP XP_010920127.1 myb-related protein 308 Down -5.5 -2.5 0 Down -5.4 -2.4 0
9 MYBP XP_010926024.1 transcription factor MYB62 Up 7 2.8 0 Up 23.2 4.5 0
10 HD-ZIP XP_010926338.1 homeobox-leucine zipper protein HOX8 Down -1.8 -0.8 0.016 Down -8.4 -3.1 0
11 MYBP XP_010926549.1 myb-related protein 306 Up 1.8 0.8 0.029 Up 9.3 3.2 0
12 HD-ZIP XP_019708739.1 homeobox-leucine zipper protein ROC8 Up 2.6 1.4 0.027 Down -3.5 -1.8 0.007
13 MYBP XP_010932583.1 transcription factor MYB20 Up 3.5 1.8 0.001 Down -2.9 -1.6 0.001
14 MYBP XP_010933430.1 myb-related protein Zm1-like Up 2.7 1.5 0.022 Up 10 3.3 0
15 HD-ZIP XP_010933626.2 homeobox-leucine zipper protein HAT4 Up 2.2 1.1 0.024 Up 4.4 2.1 0
16 MYBP XP_010935898.1 transcription factor MYB30 Up 10.4 3.4 0 Up 15.7 4 0
17 MYBP XP_010936941.1 transcription factor MYB4 Down -17.2 -4.1 0 Down -7.7 -2.9 0
18 MYBP XP_010936942.1 anthocyanin regulatory C1 protein-like Down -3.8 -1.9 0.002 Down -5.7 -2.5 0
19 MYBP XP_010939500.1 myb-related protein 306 Up 3.7 1.9 0 Up 5.2 2.4 0
20 NFYB, HAP3 XP_010939223.1 nuclear transcription factor Y subunit B-3 Down -1.7 -0.7 0.002 Down -1.9 -0.9 0
Disclaimer/Publisher’s Note: The statements, opinions and data contained in all publications are solely those of the individual author(s) and contributor(s) and not of MDPI and/or the editor(s). MDPI and/or the editor(s) disclaim responsibility for any injury to people or property resulting from any ideas, methods, instructions or products referred to in the content.
Copyright: This open access article is published under a Creative Commons CC BY 4.0 license, which permit the free download, distribution, and reuse, provided that the author and preprint are cited in any reuse.
Prerpints.org logo

Preprints.org is a free preprint server supported by MDPI in Basel, Switzerland.

Subscribe

© 2024 MDPI (Basel, Switzerland) unless otherwise stated