
Submitted:
07 July 2023
Posted:
10 July 2023
You are already at the latest version
Abstract
Repetitive elements are a major component of DNA sequences due to their ability to propagate through the genome. Characterization of Metazoan repetitive profiles is picking up, however, current pipelines are failing to identify a significant proportion of divergent repeats in non-model organisms. The order Decapoda, for which repeat content analyses are largely lacking, is characterized by extremely variable genome sizes that suggest an important presence of repetitive elements. Here we developed a new standardized pipeline to annotate repetitive elements in non-model organisms, which we applied on 20 Decapoda and 6 other crustacean genomes. With our new tool we identify 10% more repetitive elements than standard pipelines. Repetitive elements were more abundant in Decapoda species than in other crustaceans, with an incredibly large number of highly repeated satDNA families. Moreover, we demonstrated a high correlation between assembly size and transposable elements and a different repeat dynamics between Dendrobranchiata and Reptantia. The patterns of repetitive elements largely reflect the phylogenetic relationships of Decapoda and the distinct evolutionary trajectories within Crustacea. In summary, our results highlight the impact of repetitive elements on genome evolution in Decapoda and the value of our novel annotation pipeline, which will provide a baseline for future comparative analyses.
Keywords:
transposable elements
; satellite DNA
; crustaceans
; annotation
; evolution
; genome size
; library
1. Introduction
With over 15,000 living species, Decapoda is a diverse order of Crustacea that includes lobsters, crayfish, crabs, prawns, and shrimps [1]. They are a crucial component of marine and freshwater ecosystems [2,3]. The order Decapoda originated around 455 million years ago, in the Late Ordovician, and is divided into two suborders: the Dendrobranchiata (commonly known as prawns) and the Pleocyemata. The latter encompasses Caridea (swimming shrimps) and a crawling/walking group called Reptantia that comprises Achelata (spiny lobsters), Astacidea (true lobsters and crayfish), Anomura (hermit crabs) and Brachyura (short-tailed crabs) [4].
Decapoda are characterized by highly variable genome sizes. According to the Animal Genome Size Database (https://www.genomesize.com, 2022-05-17), genome size estimates range from 2.3 Gb for Penaeus duorarum to 5.1 Gb for Aristaeomorpha foliacea in the Dendrobranchiata suborder. In Pleocyemata, particularly in the Caridea infraorder, genome size variations are even more striking with estimates ranging from 3.2 Gb for Antecaridina sp. to 40 Gb for Sclerocrangon ferox. Freshwater crayfish (Astacidea infraorder) also display substantial genome size variations, ranging from 2 to 6 Gb in Cambaridae and Parastacidae families. Recent genome size estimates for the noble crayfish Astacus astacus and the narrow-clawed crayfish Pontastacus leptodactylus, both representatives of the Astacidae family, reach 17 Gb (K. Theissinger, unpublished results) and 18.7 Gb [5], respectively. Decapoda also have a high variation in chromosome numbers. The number of chromosomes in the Dendrobranchiata suborder is mainly at a 2n of 88 (reviewed in [6,7]), while this number can explode in Pleocyemata species to a 2n of 376 for the Astacidea Pacifastacus leniusculus [8,9].
Variations in genome sizes are usually attributed to the presence of repetitive elements (REs), that can represent the major part of the genome in some eukaryotic species [10]. A high proportion of REs can greatly complicate genome sequencing and can lead to fragmented and incomplete assemblies [11,12,13]. This may explain the notorious difficulties encountered in the sequencing of large Decapoda genomes, with only 8 assemblies available at the chromosome level. To date, the relationship between the genome size and repeat content, and the impact of REs on genome evolution remains poorly studied in Crustaceans.
The role of REs can be diverse (reviewed in [14]). They can affect transcription and regulation at transcriptional and post-transcriptional level. Through their ability to act as signals to locate and process information stored in coding sequences, they can influence damage repair, DNA restructuring, chromatin and nuclear organisation and cell division. REs can be classified in two types: tandem repeats (satellite DNA, satDNA) and transposable elements, TEs, also known as interspersed repeats [15].
SatDNAs consist of tandemly repeated patterns of nucleotides called repeat unit (monomer) [16]. Different satDNA families are present in the genome, with usually only one or a few predominant families [17,18,19,20]. SatDNAs can have specific roles in gene and genome regulation such as chromosome organisation, pairing, and segregation formation of the centromere locus [21,22], in epigenetic regulation of heterochromatin establishment and can modulate gene expression in response to stress [23,24]. In crustaceans some SatDNA transcripts can have an impact on the inter-molt stage [25]. Nonetheless, the distribution patterns, percentage, and copy number of satDNAs are not yet fully explored in Crustaceans.
Transposable elements (TEs) are mobile elements known to participate in DNA replication and cause gene rearrangements that can confer new functional properties [26,27,28,29]. Deletions, duplications, and inversions can be caused by recombination events between homologous regions dispersed by related TEs at distant genomic positions. When inserting into genes or coding regions, TEs can alter gene expression and may produce deleterious, such as diseases, or neutral effects on the host [28,30,31,32]. Organisms living under challenging environmental conditions, can have more TEs in their genome, increasing genome plasticity to respond to stress factors [33]. TEs can be distinguished in two classes based on their replication mechanisms: Class I elements transpose with RNA-mediated mechanisms (retrotransposons), while in Class II the transposition mode is DNA-based (DNA transposons) [34,35,36,37]. In class I, LTR retrotransposons and Penelope-like elements are characterized by Long Terminal Repeat (LTR). DIRS are bound by direct or inverted repeats. Finally, LINE and SINE retrotransposons do not have terminal repeats but a polyA tail at the 3’ end. The class II is divided into two subclasses. Subclass 1 includes TIR and Crypton elements, while subclass 2 includes Helitrons and Mavericks. TEs generally encode proteins that are necessary to their transposition in an autonomous way. However, mutation accumulation can lead to incomplete versions of TEs that can no longer encode transposition enzymes. The identification of these truncated alternatives represents a particular challenge for automated annotation pipelines.
Currently, there are several annotation pipelines available for REs. The most commonly used tools are RepeatModeler2 [38] and RepeatMasker [39]. However, there is a wide variety of additional tools that can be used, such as RECON [40], RepeatScout [41] and LtrHarvest/Ltr_retriever [42], REPET [43], RepeatExplorer [44] (based on paired-end reads) and many more. The availability of multiple tools highlights the lack of standardized protocol, making it impossible to compare the RE composition between different genomes based solely on literature. Moreover, current pipeline annotations of REs are failing to identify a significant portion of divergent repeats in non-model organisms. To address these limitations, we designed a standardized protocol for REs annotation that encompasses both TEs and satDNA. This pipeline was used to establish the repetitive landscape of 20 Decapoda and 6 crustaceans non-Decapoda genomes, enabling an objective comparison of the Decapoda repeatomes in terms of abundance, composition, and evolutionary dynamics. This standardised approach allowed us to assess the contribution of REs to the evolution of the enigmatic Decapoda genomes. Furthermore, we explored the possibility of using the REs as reliable phylogenetic markers for Decapoda. Lastly, this study also provides a new library of REs in Decapoda genomes that can extend already known databases and be used for future analyses.
2. Materials and Methods
2.1. Genomic Data Sets
Available assemblies for Decapoda species were downloaded from NCBI GenBank and RefSeq (last accessed 2022-02-16). Only the 20 genomes with a BUSCO score of at least 25% of completeness were selected (Table 1). To have a broader perspective of Decapoda REs landscape compared to Crustaceans, we added 6 other crustacean non-Decapoda (Table 1).
2.2. Identification and Annotation of Repetitive Elements
2.2.1. Identification of Satellite DNA Families
For each species, a set of Illumina paired-end reads were randomly chosen in SRA database (Table 1). Reads that mapped to the mitochondrial genome were discarded, and the remaining reads were sampled to represent 1.6% of estimated genome size. Genome size estimations were retrieved for all genomes, except for Chionoecetes opilio (Table 1). For this genome, all short paired-end reads corresponding to the assembly were downloaded and the genome size was estimated using KmerGenie version 1.7051 [45]. The sets of reads were then analysed using the TAREAN pipeline, Galaxy version 2.3.8.1 [46] (reads trimmed at 100 bp and default parameters) to compile each species-specific library of satellite elements.
2.2.2. Construction of a Common Library of Repetitive Elements
De novo identification of repetitive elements in each genome was performed using RepeatModeler2 version 2.0.1 [38] with LTRStruct option and default parameters. The LTRStruct option is a LTR structural discovery pipeline that allows a better identification of LTR elements by using LTR_Harvest and LTR_retriever.
All species-specific libraries of repetitive elements identified with RepeatModeler2 were renamed according to the RepBase version 26.05 [47] nomenclature, with the repeat family, a unique number for the family to be able to distinguish the different sequences of the repeat, the 3-letter species name, the repeat class and family and finally the complete species name. Similar renaming was applied to species-specific libraries of high confidence satellites identified by the TAREAN pipeline, with the addition of a ‘tarean’ tag after the unique number.

Table 1.
Genomic data sets used in this study.
| Suborder/ Infraorder | Species | Assembly Access ID | Assembly Size (Mb) | BUSCO Completeness (%) | Paired-End Illumina Reads SRA Access ID | Estimate Genome Size (Mb) | Estimate Genome Size Reference |
|---|---|---|---|---|---|---|---|
| Dendrobranchiata | Penaeus chinensis | GCF019202785.1 | 1 466 | 90.7 | SRR13452153 | 2 660 | [48] |
| Penaeus indicus | GCA018983055.1 | 1 936 | 88.5 | SRR12969543 | 2 810 | [49] | |
| Penaeus japonicus | GCF017312705.1 | 1 705 | 96.6 | DRR278744 | 2 170 | [49] | |
| Penaeus monodon | GCF015228065.1 | 2 394 | 83.9 | SRR11278066 | 2 200 | [49] | |
| Penaeus vannamei | GCF003789085.1 | 1 664 | 84.8 | SRR13661692 | 2 270 | [49] | |
| Caridea | Caridina multidentata | GCA002091895.1 | 1 949 | 25.2 | DRR054559 | 3 230 | [50] |
| Macrobrachium nipponense | GCA015104395.1 | 1 985 | 41 | SRR9026393 | 4 600 | [51] | |
| Achelata | Panulirus ornatus | GCA018397875.1 | 1 926 | 70 | SSR13822589 | 3 230 | [52] |
| Astacidea | Procambarus virginalis | GCA020271785.1 | 3 701 | 67 | SRR12901906 | 3 500 | [53] |
| Procambarus clarkii | GCF020424385.1 | 2 735 | 94.3 | SRR14457195 | 8 500 | [54] | |
| Cherax destructor | GCA009830355.1 | 3 337 | 81.7 | SRR10467055 | 4 500 | [55] | |
| Cherax quadricarinatus | GCA009761615.1 | 3 237 | 69.9 | SRR10484712 | 5 000 | [56] | |
| Homarus americanus | GCF018991925.1 | 2 292 | 93 | SRR12699166 | 7 700 | [57] | |
| Anomura | Paralithodes camtschaticus | GCA018397895.1 | 3 810 | 44.2 | SRR13805857 | 7 290 | [52] |
| Paralithodes platypus | GCA013283005.1 | 4 805 | 71.7 | SRR1145749 | 5 490 | [58] | |
| Birgus latro | GCA018397915.1 | 2 959 | 57.7 | SRR13816158 | 6 220 | [52] | |
| Brachyura | Chionoecetes opilio | GCA016584305.1 | 2 003 | 91 | SRR11278230 | 1 655 | |
| Eriocheir sinensis | GCA013436485.1 | 1 272 | 92.6 | SRR11971329 | 2 230 | [59] | |
| Portunus trituberculatus | GCF017591435.1 | 1 005 | 93.5 | SRR9964028 | 2 250 | [59] | |
| Callinectes sapidus | GCA020233015.1 | 998 | 90.4 | SRR15834103 | 2 290 | [60] | |
| Other crustaceans | Amphibalanus Amphitrite (Cirripedia) | GCA019059575.1 | 808 | 93.9 | SRR9595623 | 481 | [61] |
| Armadillidium vulgare (Isopoda) | GCA004104545.1 | 1 725 | 84.5 | SRR8156178 | 1 660 | [62] | |
| Daphnia magna(Phyllopoda) | GCA020631705.2 | 161 | 98.6 | SRR15012074 | 238 | [63] | |
| Darwinula stevensoni (Podocopida) | GCA905338385.1 | 382 | 90.3 | SRR8695251 | 437 | [64] | |
| Eurytemora affinis(Copepoda) | GCA000591075.2 | 389 | 91 | SRR2452640 | 616 | [65] | |
| Hyalella Azteca(Amphipoda) | GCA000764305.4 | 551 | 93.8 | SRR1556043 | 1 050 | [66] |
All species-specific libraries of high confidence satellites and repeats identified by the TAREAN pipeline and RepeatModeler2 were combined with the Arthropoda specific subset of RepBase26.05 to form a single library (Figure 1). This library was then split in 2 sub-libraries. The first one corresponds to the known TEs and the second one represents unknown TEs, satellites and simple repeats.
2.2.3. Identification of Repetitive Elements
In order to annotate repetitive elements that are present in the 26 crustacean genomes, we used RepeatMasker version 4.1.2-p1 [39] following a two-step approach (Figure 1). First, we used RepeatMasker with the library of known TEs using the options -a -gccalc -excln -s -nolow to identify and mask TEs in genomic sequences. We then performed a second run of RepeatMasker (with -a -gccalc -excln –s options) on the previously masked genomes using the second library to identify unclassified TEs, satellite DNA and simple repeats. The ProcessRepeats and buildSummary tools of RepeatMasker were then used to combine all results and produce a detailed summary of annotations.
2.2.3. Statistical Analysis
In order to test for correlation between genome size, assembly size, repeats or TE load (number of copies) or percentage, we used linear regression model and Spearman rank sum method with α=0.005 using R package ggplot2 with lm method. The dendrogram was produced by calculating pairwise distances between repeat profiles (the pattern of presence and absence of repetitive elements) using hclust with Euclidean method and the heatmap was plotted using Orange3 [48]. The sequence divergence distribution was calculated as Kimura distances (rates of transitions and transversions) using the RepeatMasker tools “calcDivergenceFromAlign.pl” and “createRepeatLandscape.pl”.
3. Results and Discussions
3.1. Construction of Repetitive Elements reference
To obtain a comprehensive view of REs in Decapoda and reduce the number of elements classified as “unknown”, we developed a standardized protocol to annotate TEs and satDNAs at the genomic level (see Methods and Figure 1). This pipeline integrates the consensus sequences of the Arthropoda section of the RepBase database and the combination of de novo identification of REs by RepeatModeler2 and the TAREAN pipeline of all species to generate an extensive library of consensus sequences. The TAREAN pipeline was used to specifically identify satDNAs. Due to their structure and high sequence homogeneity, satDNAs are extremely difficult to assemble and are often excluded from the assembly [12]. This is why we search for satDNAs in Illumina raw reads paired-end sequences using the TAREAN pipeline to construct the “Satellite libraries”. By using the TAREAN pipeline, we retrieved between 0 and 43 satDNAs families annotated as “High fidelity” while RepetModeler2 identified only 0 to 4 satDNAs families (Table 2).
Using our new developed pipeline, we identified between 3 643 and 11 431 families of REs in the different assemblies, including between 7.25% and 33.37% of “unknown” sequences (Table 2). Unknown elements are repetitive sequences that couldn’t be further classified. The lowest percentage of unknown elements is observed in Dendrobranchiata species. This can be explained by the presence of the annotated TEs of the Dendrobranchiata Penaeus vannamei in RepBase, allowing a better identification in closely related species.
All detected REs were renamed according to the RepBase nomenclature. In fact, the REs classification by Wicker et al., (2007) [35] is widely used but new TEs have been characterized since the establishment of the classification in 2007, resulting in conflicts in TEs databases. Kojima (2019) brings new clarity to the classification of the RepBase database [40], but TE annotations can differ between RepBase, RepeatModeler2 database, and DFAM due to capital letters or multiple naming of the same element, for example. A manual correction of repeat names was thus applied when needed in order to obtain a clear annotation.
All libraries generated by RepeatModeler2 and the TAREAN pipeline, and RepBase were merged into a single library. This extensive database contains a total of 71 601 sequences including sequences from RepBase. Among these families, known TEs represent 31 579 sequences. With this new merged library, we considerably extended the number of annotated families compared to what exists in RepBase database of Arthropoda REs. Indeed, RepBase provides consensus sequences of 13 906 repetitive elements in Arthropoda, including 109 satDNAs. These elements are distributed in 218 Arthropoda species and in Eukaryota or Metazoa common ancestors. However, only 16 crustacean and 6 Decapoda species are represented, with respectively 1419 and 328 sequences. Moreover, most decapod sequences (320) are from a single species, P. vannamei. This shows the lack of knowledge of REs in Decapoda species in established databases. Our work also extended the number of known satDNAs families in Decapoda species, with 405 consensus sequences compared to the 109 presents in RepBase. The new REs identified in this study are provided in supplementary materials (Supplementary File S1). Well categorized REs have also been submitted to RepBase.
3.2. Annotation of Repetitive Elements in Decapoda Genomes
With our new extensive database, we performed two rounds of annotation using RepeatMasker. In the first round we only used known TEs in order to have a better characterization and reduce the proportion of unknown, and in the second we used all the remaining REs. We identified between 6 805 and 31 798 consensus sequences of REs in the different assemblies (Table 2). This represents an increase of approximately 16 500 families on average in Decapoda compared to previous annotation and 6 500 for the other crustaceans. Moreover, our standardized protocol successfully classified the type of REs previously unclassified for most species (now between 4.40% and 24.15%). This represents a considerable improvement over the results obtained with species-specific databases often used.
Once considering all the satDNAs families annotated in the genome with the merged library, we annotated between 11 and 109 different families (previously 10 to 40 using the species-specific strategy, Table 3). The Astacidea and Anomura infraorders have the higher number of satDNA families, going from 92 to 109, except for H. americanus and B. latro. The last two species have a number of satDNA families more similar to the other Decapoda species, with respectively 61 and 59 satDNA consensus sequences. The high number of satDNA families detected in Astacidea and Anomura is in agreement with the 258 families detected in the crayfish Pontastacus leptodactylus [5]. The diversification of satDNA families in Astacidea and Anomura is remarkable compared to what is observed in other species. Drosophila species have for example in general less than 10 different families within their genomes, and human have 9 [20,49]. However, a large number of satDNA repeats has already been found in Arthropoda such as in Triatoma infestans (42 families, genome size 1.4 Gb) [50], the Locusta migratoria (62 families, genome size 6 Gb) [18], the morabine grasshoppers (129 families, genome size 5 Gb) [51], and in the fish Megaleporinus microcephalus (164 families, assembly size 1.2 Gb) [52]. It is to note that our results may still underestimate the real number of satDNA families due to the fragmentation of available assemblies. In fact, some satDNA families identified by the TAREAN pipeline in Illumina reads weren’t retrieved in the genome assembly. It is likely that the missing satDNAs were contained in reads that were not included in the final assembly.
Interestingly, the number of families of REs is correlated with both estimate genome size and assembly size (Table 1) with a Spearman rank correlation test of ρ=0.83, p-value=8.925E-8 and ρ=0.92, p-value=1.146E-6 respectively. The same can be observed with satDNA families, with respectively Spearman rank correlation test of ρ=0.84, p-value=6.875E-08 and ρ=0.90, p-value=3.83E-10. It reveals the diversification of RE families in larger genomes.
The strategy used in this study increased the knowledge of REs in Decapoda species and provides an extended library that can be used in future studies (Supplementary File S1). Unfortunately, there are still a high number of unknown REs in some of the annotated genomes. A manual curation of the library would be necessary but was beyond the scope of this study. We also want to mention that, due to high presence of REs, genome assemblies are often fragmented, preventing the exhaustive annotation of TEs that can be absent from the assemblies or split and contained by two contigs. The study of Sproul et al., (2022) on more than 600 insect species showed the influence of sequencing technology on repeat detection, with long reads assemblies containing 36% more repeats than short-reads assemblies with huge impact on LTRs detection [53]. This is because assemblies based on long reads are often more contiguous [54,55]. In our case, most of the genomes were assembled using long reads or a combination of long and short reads, and short read assemblies do not stand out concerning repeat content or diversification.
3.3. Proportion of Repetitive Elements in Decapoda Genomes
The RE proportions are variable both between and within phylogenetic clades of the analysed species. The proportion of REs in studied Arthropoda genomes is above 40%. Exceptions are two Decapoda species, Cherax quadricarinatus and Caridina multidentata, with respectively 38.73% and 39.02% of repeat content, and the non-Decapoda Hyallela azteca with 26.12% (Figure 2). Compared to the Decapoda species, which have an average of 59.7% REs in their genomes, the non-Decapoda crustaceans analysed in this study exhibit a lower proportion of REs, averaging at 46.4%. However, it is important to note that Armadillidium vulgare stands out among non-Decapoda studied, as it has a remarkably high percentage of repeats (76.26%). If A. vulgare proportion is excluded, the average of REs in non-Decapoda drops to 40.4% and the difference is significant with Wilcoxon p-value=0.0074. Within Decapoda species, Anomura presented an especially high percentage of REs with on average 73.6%. Indeed, the Anomura specie Paralithodes platypus has the highest proportion of REs among the studied species with 78.89%. On the contrary, the genome with the lowest percentage of repeats was the non-Decapoda Hyallela azteca with 26.12%. So, the REs proportions were highly variable among the phylogenetic clades, as was the content of REs categories.
Indeed, we could also see a variability in the content of REs within suborders. Among Decapoda, Dendrobranchiata exhibited only half the amount of LINEs than Pleocyemata, for which it could go up to 35.3% in the Astacidea C. destructor. Dendrobranchiata was characterized by a high proportion of DNA transposons as for A. vulgare with between 13% and 18% of DNA transposons. Anomura infraorder has the highest percentage of LTRs with more than 16% and the Achelata P. ornatus has the lowest, with 3.24%. SINEs elements were low in all genomes, going from 0.02% in H. Azteca to 2.54% in P. trituberculatus. DIRS elements in general contributes to less than 1% of the repeat content in almost all genomes, major exception was for M. nipponense where DIRS represented 8.84%. This species also has the highest proportion of Penelope elements with 5.18%. The second infraorder that has the highest number of Penelope elements was Astacidea, with a mean of 2.3%. Lowest numbers of unclassified elements were present in the Dendrobranchiata suborder with around 3.5%, probably because of the better characterization of REs in this suborder in the original RepBase database with the almost exclusive presence of annotations derived from P. vannamei. This is why less closely related species present a higher proportion of unclassified elements, such as E. affinis with 24.15%. The content variability shows that the different suborders of studied crustaceans species has specific major REs present in their genomes.
If we refer to REs study of Decapoda species included in assembly publications, the proportion of REs could vary from 8% to 82% [56,57,58,59,60,61,62,63,64,65,66,67,68,69,70,71]. Tan et al., (2020) annotated repeatome of 8 decapod species and estimates repetitive content between 27% and 50% with the majority of the genomes having more LINEs, except for Penaeus vannamei that has more DNA transposons [60]. Compared to these studies, with our pipeline we annotated approximately 10% more repeats in the genomes. For P. virginalis genome, 8.8% of repetitive elements were retrieved in the assembly Pvir0.4 (GenBank accession: GCA_002838885.1) and 27.52% in the study of Tan et al., (2020). However, in the assembly DKFZ_Pvir_1.0 (GenBank accession: GCA_020271785.1), the new assembly version used in this study, we annotated 57.87% of repetitive elements [59,61]. In the assembly of P. clarkii, Xu et al., (2021) annotated 82.42% of repeats, while in our study we annotated only 71.26%. For P. platypus genome, we annotated similar results to Tang et al., (2021) [72]. However, the percentage of LINEs and LTRs increase of almost 10% each, while unknown TEs dropped to 17%. REs percentage in E. sinensis was determined as 40.5% and 61.42% in two different studies [61,73], here we determined that repetitive elements represent 58.93% of the genome. This shows that our method provided greater or equal proportion of REs but with a better characterisation.
The Decapoda species studied here all showed high proportions of REs ranging from 58 % to 79%. They are in the upper range of what is generally observed in Arthropoda. Indeed, comparative studies carried out on arthropods (mainly based on insects) report highly variable proportions of TEs ranging from 1% to 80% [53,74,75]. We can expect even higher proportions of REs with the forthcoming sequencing of giant genomes in Decapoda or other Crustacea. Recently, the assembly of the Antarctic krill (belonging to a sister order of Decapoda) demonstrated that 92% of its genome is constituted of REs, 78 % of them being TEs, indicating that Arthropoda can have incredibly high amount of REs [76]. In terms of TE landscape, Decapoda presented only a few SINE elements as for all Arthropoda. Previous studies in Dendrobranchiata species reported that the most abundant groups of repeats were, disregarding SRR, DNA transposons or LINEs with different results depending on the used bioinformatic tools [53,74,75]. Here we showed that DNA transposons were the major subclass in all Dendrobranchiata species, followed by LINEs. This is similar to what is observed in most insects species, where DNA transposons are generally the major TE group present in genomes [53,74,75]. Interestingly, our results revealed a different situation in the studied Pleocyemata species where LINE and LTRs elements are more abundant. This can be compared to what is observed in some insect orders exhibiting a different TE composition: LTRs are more abundant in Diptera species, and Odonata and Orthoptera species are richer in LINE elements [53,74]. The change in the major type of REs between suborders suggests an altered strategy for genome stability maintenance and regulation of REs between suborders. Sproul et al., (2022) demonstrated that LINE-rich species lineages present many REs that are associated with protein-coding genes. Such associations suggest consequences regarding phenotype evolution. The presence of a TE near a gene can lead to methylation changes, indeed, it already has been showed that LINEs can serve as amplifier for the silencing away from X-chromosome inactivation center, and LINEs and SINEs for gene imprinting [34,77]. The movement of a LINE, or other TE, at a new genomic locus can so have an impact on nearby gene expression and at end reshape networks of gene expression and impact genome evolution.
3.4. Correlation between Genome Size and Repetitive Elements
The 20 Decapoda species analysed in the present study has large differences in genome size estimations (1.6 Gb to 8.5 Gb). This difference was also evident in assembly sizes, although less pronounced (1 Gb to 4.8 Gb). The variability of the genome sizes raised the question of the contribution of REs to their host genome. After masking each genome, we calculated the load of REs, i.e., the number of copies of REs and TEs only, the percentage of REs and TEs only, and we searched for a correlation with both assembly size and estimate genome size. The assembly size was both positively correlated with the load (ρ=0.87, p-value=1.864E-06) and the percentage of TEs (ρ=0.6, p-value=0.0015) (Figure 3A,B). The estimated genome size (Table 2) was positively correlated with the load of TEs (ρ=0.62, p-value=0.0007) while there was no significant correlation with the percentage of TEs (ρ=0.47, p-value=0.014) (Figure 3C,D). Even though the number of satDNA families was correlated with both assembly size and estimated genome size, when including satDNA elements the significance of correlation decreases between load of REs and genome/assembly size (Figure S1). The correlation between percentage of REs with both assembly and estimated genome size were not significant, with α=0.005 (Figure S1).
For the first time in Decapoda species, assembly size and load of TEs are demonstrated to be strongly correlated. This reveals the consequent impact of the number of REs in the size of the assembly. The correlation of percentage of TEs or REs is more often analysed than the load. In our study the proportion of TEs was less significantly correlated than the load of TEs, and REs was not correlated with genome size. Like in our study, Petersen et al., (2019) found a positive correlation between percentage of TEs and assembly size, however, they also found a positive correlation between percentage of TEs and estimate size that was not retrieved in our study. Moreover, Sproul et al., (2022) found a positive correlation between REs proportion and assembly size not confirmed in our study. This can be explained by the fragmentation of the genomes analysed due to the difficulties to assemble REs: REs can either be excluded from the assembly although present in the genome and cannot be annotated, or they can be fragmented indicating that a part of the RE is not included in the assembly and so can contribute to the load of REs in the genome but not to the percentage. This is the case for satDNAs that are often concatenated since the assembler cannot define how much repetitions are present if they are not entirely covered by a long read. This explains the decrease or absence of the significance of the tests when including satDNAs. It is therefore expected that the load is rather correlated with the assembly size than with the estimated size.
3.5. Frequency of satDNA Families Occurrence
In crustacean species, and particularly in Decapoda, we annotated a large number of different satDNA families (Table 2) and evaluated the occurrence of each family in each genome (Figure 4). In each genome, the majority of satDNA families were detected 1 to 9 times. Depending on genomes, between 1 and 34 families appeared between 10 to 99 times. With 9 out of the 97 satDNA families repeated more than 1000 times, P. clarkii was the species with the highest number of highly repeated satDNA families. In contrast, 5 genomes don’t have highly repeated satDNA families (more than 99 occurrences). This showed that even if Decapoda has an extremely high number of satDNA families (Table 3), only a few are predominant in each genome (Figure 4), as seen in several studies [18,19,20]. Decapoda and non-decapoda species studied here are no exception. The Decapoda infraorders Astacidea and Anomura were the groups with the largest genome size estimation and assembly size (Table 1) and presented the largest number of families highly repeated in their genomes (Figure 4). They also tend to be the ones with the highest total number of families (Table 2). This suggests that satDNA is a key factor in explaining the huge variations in genome size observed in decapods.
3.6. Diversity of Repetitive Elements
We determined the number of copies (the load) of each superfamily of REs identified for each genome to see the diversity of REs (Figure 5). With 67 superfamilies of TEs present in at least one species, the majority of the known superfamilies of REs were found in the investigated genomes, as seen in insects [74], and appear highly conserved across all the genomes (Figure 5). Among the Decapoda genomes studied, there was a clear pattern of high and low presence of repeat superfamilies, with only a few distinct variations between species by repeat suborder.
The load of REs of each repeat superfamily was then used as a profile for each genome to construct the dendrogram by clustering of the REs profiles. This dendrogram mainly followed the currently known species phylogeny [4] except for A. vulgare, whose RE proportions and composition were more similar to Decapoda (Figure 2) and two Anomura species that together grouped with the Caridea. The genome of A. vulgare (1.6 Gb) was larger than the other crustaceans analyzed in this study (238 Mb – 1 Gb) with the highest percentage of repeat among the non-decapoda crustaceans species studied. This may explain why A. vulgare is clustered with Decapoda species and not with other crustaceans. Nevertheless, we could see a clear differentiation between Decapoda species and the other Crustaceans that have a lower number and a distinct composition of REs, except for A. vulgare. Similarly, we could clearly distinguish Dendrobranchiata from Pleocyemata infraorders with the presence of LINE ingi and SINE MIR. Within Pleocyemata, Caridea were also separated from the other Reptantia species in agreement with established phylogeny [4]. Many studies, including Petersen et al., (2019), Sproul et al. (2022), Wu and Lu (2019), based their RE analysis on already published phylogenetic tree. In our study, we clustered the repetitive profile of each genome and obtained a phylogenetic signal that respects major classification (Figure 5) [1]. In fact, REs have been recently used as evidence for phylogenetic trees construction in plants, with RE abundance resolving species relationships in a similar manner to DNA sequences from plastid and nuclear ribosomal regions [78,79]. This can be explained by the capacity of some REs to have a high conservation and synteny within species [80,81,82]. This approach could therefore be used in the future to determine the phylogeny of non-model species using low-coverage, low-cost sequencing.
3.7. Sequence Divergence Distribution of Transposable Elements
The genetic distance between each annotated TE copy and the consensus sequence of the respective TE family was calculated using Kimura 2P distance in order to analyse sequence divergence distribution and approximate the age and intensity of duplication events (Figure 6). The peak distribution shows the genomic coverage of TE copies according to their divergence from their family consensus estimated using the Kimura distance. A peak indicates that a group of TE copies has undergone an evolutionary event in the genome leading to the expansion of these elements. This event is more recent if the peak is located at a low Kimura distance. At a high Kimura distance, a wide peak can indicate that TE copies have undergone genetic drift or other processes leading high sequence divergence suggesting ancient expansion event.
In Dendrobranchiata, sequence divergence landscapes were similar for the five species. We could observe two very similar peaks. The first one presented a larger number of LTRs and smaller augmentation of LINEs elements between 10% to 15% of divergence. The peak of LTRs was particularly high in P. japonicus and P. indicus. At the same time point, we could see an increasing amount of DNA transposons with the same distance to the consensus in P. monodon. A longer time ago, an augmentation of DNA transposons and LTR elements around 25% of divergence was shared by all species. This suggests that all the Dendrobranchiata were sharing the same old evolutionary events. The P. monodon genome was one of the few analysed Decapoda genomes showing a recent peak of SINEs elements with the two Procambarus species. We would therefore expect to see a higher proportion of SINEs in P. monodon compared to other genomes. However, SINE elements were only slightly more abundant in this genome due to a higher presence of SINE MIR elements (Figure 2 and Figure 5). Interestingly, the content of repeat showed that DNA transposons are the most widespread among the suborder (Figure 2). However, DNA transposons expansion was older and more spread out over time. On the contrary, the landscape and diversity of repeats showed higher peak of LTRs elements over time in the suborder compared to the other species, with Gypsy being the most abundant (Figure 5 and Figure 6). There were almost no sequences with a low divergence suggesting that TEs are not transcriptionally active in these genomes.
The two Caridea species presented a different sequence divergence landscape. In C. multidentata, there was a recent peak of unknown elements between 5% to 10% of divergence. This peak could be caused by the expansion of one or several families of unknown TEs. We could also see that from high divergence, the fraction of the genome increased as the Kimura distances decreased. This trend could be seen until the event at 5% to 10% of divergence. After this event, and more recently, the number of TEs with really low divergence decreased, with almost no TEs at 0% of divergence. This suggests that despite the peak of recently active unknown elements, TEs are not active anymore for this species. For M. nipponense we could observe two recent peaks at 1-4% and 10% of Kimura divergence corresponding to LINE, Penelope and LTR elements for the first one and DIRS for the second one. We could see integrated virus expansion between 5% and 25% of divergence. This was in accordance with the diversification of repeats (Figure 5), where we could see that M. niponnense genome was the Decapoda with the highest amount of integrated virus. The presence of sequences with little divergence with the consensus sequences suggests that TE are active in this genome.
Within Astacidea, H. americanus has a different TE landscape compared to the other four species belonging to the infraorder. Indeed, the genome has a high peak at a divergence of 15% of unknown elements. Interestingly, we could observe an ancient event concerning integrated viruses at 40% to 45% of Kimura distance. The H. americanus genome was the only Decapoda genome studied here presenting this characteristic. Integrated virus couldn’t be seen in the proportion of repeats because of their low presence in genomes and was included in category other REs (Figure 2). Integrated virus in H. americanus sequences correspond to the white spot syndrome virus [83], suggesting that H. americanus faced this virus long time ago and these sequences were then propagated. In H. americanus genome, there was a clear increase of LINEs, LTRs and DNA transposons coverage with a low percentage of divergence, which leads us to conclude that TEs are still active in this genome. TEs are also active in Procambarus species that has a similar landscape with several elements at a low divergence and especially LINEs. We could also see an augmentation of Penelope and SINE elements at low divergence for both species. In P. clarkii there was also a small peak at 10% of divergence of unknown elements. Contrary to the TEs in C. quadricarinatus, TE seems active in C. destructor, with an increase of LINEs at low divergence. The expansion of LINEs in C. quadricarinatus was, instead, more ancient, at 6% to 10% of divergence.
In Brachyura all genomes seemed to have active TEs, but TEs landscapes across the genomes of this infraorder differ from each other. In P. trituberculatus, the LINEs with no divergence with consensuses were three times more abundant than LINEs at 1% of divergence. These LINEs were in a really active phase in this genome. Penelope elements were also more abundant at 0% of divergence. C. sapidus genome showed an almost constant increased coverage of TEs with lower divergence for all elements. However, we could see an increasing number of LTRs with no Kimura divergence and a decreasing number of LINEs and DNA transposons. The genome of E. sinensis was the only Brachyura genome presenting two peaks. The oldest one was at 15% of Kimura distances and was caused only by unknown elements. The latest event involved LINE, LTR and unknown elements at a divergence between 0% and 7%. C. opilio was the less active genome of Brachyura concerning TEs. We could observe a large peak between 0% to 20% of divergence where LINEs and LTRs increase. The proportion of DNA transposons also increase during this time, but at a lesser coverage.
Concerning the last two infraorders, in Achelata, the P. ornatus genome has a middle age peak at 15% of divergence corresponding to LTRs. There was also a recent and high peak, around 4-8% of divergence, caused by the expansion of LINE elements with 2% of the genome being represented by LINEs that are 6% divergent. This suggests that LINEs were, until recently, highly transcriptionally active in the genome but are now inactive. The high presence of LINE elements was also visible when considering the proportion of repeats in the genome (Figure 2). In Anomura, intragroup with the highest percentage of LTRs within Decapoda (Figure 2), B. latro and the Paralithodes species has very different landscapes. B. latro genome seemed to have inactive TEs, with two peaks of LTRs and LINEs at 3% and 15% of Kimura distance. On the other hand, Paralithodes species has impressively active LINEs and LTRs with 6.8% and 3.6% of LINE elements without divergence to consensuses in respectively P. platypus and P. camtschaticus. Finally, for other crustaceans the amount of unknown elements in their genomes was predominant, making the analysis of the divergence distribution of TEs in their genomes of difficult interpretation (Figure S2).
A clear differentiation between Dendrobranchiata and Pleocyemata species could be observed in sequence divergence distribution such as seen with the proportion and diversity of repeats. Indeed, Dendrobranchiata has more non-transcriptionally active TEs compared to the majority of Pleocyemata. Among all Pleocyemata species studied here, almost all have at least one or more type of active TEs. The expansion of a particular subfamily of RE increases genome plasticity and can indicate periods of rapid evolutionary changes [14,33]. This suggests that Pleocyemata genomes have a rapid evolution on recent timescale. Genomes with recent accumulation of repeats present highly similar repeats or type of repeat that can be long (mostly LTRs and LINEs). These long repetitive regions are more difficult to assemble and so repeats resolution during assembly is even more problematic [84]. Indeed, we could argue that a large number of the genomes studied presented recent accumulation of long REs. These long REs, being difficult to assemble, can be a possible explanation of assembly fragmentation. Moreover, species with larger genomes size tend to have more transcriptionally active TEs but also more REs.
5. Conclusions
In this study, we annotated repetitive elements in 20 Decapoda and 6 other crustacean publicly available genome assemblies, using a new pipeline for repetitive elements annotation. Genomes were first scanned to identify repetitive elements, and then all species-specific libraries were regrouped as one unique library of consensus sequences to annotate repeats by favoring known TEs with two masking steps. Our annotation of REs in the Decapoda genomes provided an overview of their diversity and evolution. We showed here that repetitive elements constitute a large fraction of Decapoda genomes, with a highly variable content of REs both between and within infraorders of Decapoda. Additionally, our analysis indicates that in Decapoda both the load of repetitive elements and the number of RE families are correlated with the assembly size of the genome. Moreover, larger genomes tend to have more active TEs (high proportion of sequences at 0% of divergence from their consensus), confirming the impact of REs in genome size expansion. We also demonstrated that, although the age distribution of TE superfamilies shows intra- and inter-lineage variation, the clustered RE profile reflects the phylogeny of the major groups analysed in this study. Nevertheless, a fraction of repeats remains unclassified, indicating that repeatome is far from being completely characterized. While a time-consuming manual curation is still needed to obtain a complete picture of the repeatome, the new consensus sequences can already be used to improve annotation of TEs in other crustaceans or Arthropoda species by increasing the number of consensuses for homology search. With our study we annotated, on average, 10% more repetitive elements than in previous studies on the same species. With our protocol, we showed that the combination of repeat libraries of all species provides an excellent tool to analyse content and diversification of repetitive elements with on average 8% more categorized elements. We suggest using this two-step pipeline for all repeatome studies on non-model organisms that are often underrepresented in public databases. Our pipeline provides a baseline to future genomic analysis, producing standardized and reproducible analysis that will allow for much more rigorous and complete comparative analysis of repeats in non-model organisms. Such studies would open, for example, new perspectives for DNA fingerprinting using satDNAs or phylogenetic studies.
Supplementary Materials
The following supporting information can be downloaded at the website of this paper posted on Preprints.org., File S1: crustaceans_RE_library.fa; Figure S1: Correlation between genome size and REs.; Figure S2: Sequence divergence distribution of TEs.
Author Contributions
Conceptualization, C.R., K.T. and O.L.; methodology, C.R., D.M., L.L.B. and O.L.; software, C.R. and A.K.; visualization, C.R.; writing—original draft preparation, C.R., K.T. and O.L.; writing—review and editing, C.R., C.F., L.B., L.L.B., K.T. and O.L.; supervision, K.T. and O.L.; project administration, O.L.; funding acquisition, K.T. and O.L. All authors have read and agreed to the published version of the manuscript.
Funding
This work was produced within a framework of the GEODE project from the international collaborative research project co-funded by the Agence Nationale de la Recherche and the Deutsche Forschungsgemeinschaft (ANR-21-CE02-0028; DFG TH 1807/7-1). This work was supported by the French ministry of higher education and research and the doctoral school of Life Science of the University of Strasbourg.
Data Availability Statement
In this study we generated a library of repetitive elements crustacean species. Elements fully categorized were submitted to Repbase. The library of new repetitive elements found during this study is also provided in supplementary materials.
Acknowledgments
We thank the platform of Bioinformatics and Genomics BiGEst-ICube for bioinformatics supports.
Conflicts of Interest
The authors declare no conflict of interest.
References
- De Grave S, Pentcheff ND, Ahyong ST, Chan T-Y, Crandall KA, Dworschak PC, et al. A Classification of Living and Fossil Genera of Decapod Crustaceans. 2009.
- Reynolds J, Souty-Grosset C, Richardson A. Ecological Roles of Crayfish in Freshwater and Terrestrial Habitats. Freshw Crayfish. 2013;19:197–218.
- Souty-Grosset C, Holdich DDM, Noël PY, Reynolds J, Haffner P. Atlas of crayfish in Europe. 2006. /paper/Atlas-of-crayfish-in-Europe.-Souty-Grosset-Holdich/148876f73785f0a4f00c2d17069a618b85250bcf. Accessed 2 Jun 2020.
- Wolfe JM, Breinholt JW, Crandall KA, Lemmon AR, Lemmon EM, Timm LE, et al. A phylogenomic framework, evolutionary timeline and genomic resources for comparative studies of decapod crustaceans. Proc R Soc B Biol Sci. 2019;286:20190079. [CrossRef]
- Boštjančić LL, Bonassin L, Anušić L, Lovrenčić L, Besendorfer V, Maguire I, et al. The Pontastacus leptodactylus (Astacidae) Repeatome Provides Insight Into Genome Evolution and Reveals Remarkable Diversity of Satellite DNA. Front Genet. 2021;11. [CrossRef]
- Lécher P, Defaye D, Noel P. Chromosomes and nuclear DNA of Crustacea. Invertebr Reprod Dev. 1995;27:85–114. [CrossRef]
- González-Tizón AM, Rojo V, Menini E, Torrecilla Z, Martínez-Lage A. Karyological Analysis of the Shrimp Palaemon Serratus (Decapoda: Palaemonidae). J Crustac Biol. 2013;33:843–8. [CrossRef]
- NIIYAMA H. On the Unprecedentedly Large Number of Chromosomes of the Crayfish, Astacus trowbridgii Stimpson. Annot Zool Jpn. 1962.
- Crandall K, De Grave S. An updated classification of the freshwater crayfishes (Decapoda: Astacidea) of the world, with a complete species list. J Crustac Biol. 2017;37.
- Gregory, TR. CHAPTER 1 - Genome Size Evolution in Animals. In: Gregory TR, editor. The Evolution of the Genome. Burlington: Academic Press; 2005. p. 3–87.
- Tørresen OK, Star B, Mier P, Andrade-Navarro MA, Bateman A, Jarnot P, et al. Tandem repeats lead to sequence assembly errors and impose multi-level challenges for genome and protein databases. Nucleic Acids Res. 2019;47:10994–1006. [CrossRef]
- Treangen TJ, Salzberg SL. Repetitive DNA and next-generation sequencing: computational challenges and solutions. Nat Rev Genet. 2012;13:36–46. [CrossRef]
- Pop, M. Genome assembly reborn: recent computational challenges. Brief Bioinform. 2009;10:354–66. [CrossRef]
- Shapiro JA, Sternberg R von. Why repetitive DNA is essential to genome function. Biol Rev. 2005;80:227–50.
- Jurka J, Kapitonov VV, Kohany O, Jurka MV. Repetitive Sequences in Complex Genomes: Structure and Evolution. Annu Rev Genomics Hum Genet. 2007;8:241–59.
- Garrido-Ramos, MA. Satellite DNA: An Evolving Topic. Genes. 2017;8:230. [CrossRef]
- Macas J, Neumann P, Navrátilová A. Repetitive DNA in the pea (Pisum sativum L.) genome: comprehensive characterization using 454 sequencing and comparison to soybean and Medicago truncatula. BMC Genomics. 2007;8:427. [CrossRef]
- Ruiz-Ruano FJ, López-León MD, Cabrero J, Camacho JPM. High-throughput analysis of the satellitome illuminates satellite DNA evolution. Sci Rep. 2016;6:28333. [CrossRef]
- Mravinac B, Plohl M, Ugarković Ð. Preservation and High Sequence Conservation of Satellite DNAs Suggest Functional Constraints. J Mol Evol. 2005;61:542–50. [CrossRef]
- Miga, KH. Completing the human genome: the progress and challenge of satellite DNA assembly. Chromosome Res Int J Mol Supramol Evol Asp Chromosome Biol. 2015;23:421–6. [CrossRef]
- Plohl M, Luchetti A, Meštrović N, Mantovani B. Satellite DNAs between selfishness and functionality: Structure, genomics and evolution of tandem repeats in centromeric (hetero)chromatin. Gene. 2008;409:72–82. [CrossRef]
- Plohl M, Meštrović N, Mravinac B. Satellite DNA Evolution. Repetitive DNA. 2012;7:126–52. [CrossRef]
- Pezer Ž, Brajković J, Feliciello I, Ugarković Đ. Satellite DNA-Mediated Effects on Genome Regulation. In: Genome Dynamics. 2012. p. 153–69. [CrossRef]
- Biscotti MA, Canapa A, Forconi M, Olmo E, Barucca M. Transcription of tandemly repetitive DNA: functional roles. Chromosome Res. 2015;23:463–77. [CrossRef]
- Wang S, BIESIOT P, SKINNER D. Toward an Understanding of Satellite DNA Function in Crustacea. Integr Comp Biol. 1999;39. [CrossRef]
- Bourque G, Burns KH, Gehring M, Gorbunova V, Seluanov A, Hammell M, et al. Ten things you should know about transposable elements. Genome Biol. 2018;19:199. [CrossRef]
- Bennetzen JL, Wang H. The Contributions of Transposable Elements to the Structure, Function, and Evolution of Plant Genomes. Annu Rev Plant Biol. 2014;65:505–30. [CrossRef]
- Deininger PL, Moran JV, Batzer MA, Kazazian HH. Mobile elements and mammalian genome evolution. Curr Opin Genet Dev. 2003;13:651–8. [CrossRef]
- Craig NL, Lambowitz A, Gragie R, Gellert M. Mobile DNA II. ASM Press; 2002.
- Kim Y-J, Lee J, Han K. Transposable Elements: No More “Junk DNA.” Genomics Inform. 2012;10:226–33. [CrossRef]
- Barrón MG, Fiston-Lavier A-S, Petrov DA, González J. Population Genomics of Transposable Elements in Drosophila. Annu Rev Genet. 2014;48:561–81. [CrossRef]
- Burns KH, Boeke JD. Human Transposon Tectonics. Cell. 2012;149:740–52. [CrossRef]
- Lanciano S, Mirouze M. Transposable elements: all mobile, all different, some stress responsive, some adaptive? Curr Opin Genet Dev. 2018;49:106–14. [CrossRef]
- Slotkin RK, Martienssen R. Transposable elements and the epigenetic regulation of the genome. Nat Rev Genet. 2007;8:272–85. [CrossRef]
- Wicker T, Sabot F, Hua-Van A, Bennetzen JL, Capy P, Chalhoub B, et al. A unified classification system for eukaryotic transposable elements. Nat Rev Genet. 2007;8:973–82. [CrossRef]
- Di Stefano, L. All Quiet on the TE Front? The Role of Chromatin in Transposable Element Silencing. Cells. 2022;11:2501. [CrossRef]
- Kojima, KK. Structural and sequence diversity of eukaryotic transposable elements. Genes Genet Syst. 2019;94:233–52. [CrossRef]
- Flynn JM, Hubley R, Goubert C, Rosen J, Clark AG, Feschotte C, et al. RepeatModeler2 for automated genomic discovery of transposable element families. Proc Natl Acad Sci. 2020;117:9451–7. [CrossRef]
- Smit, AFA, Hubley, R & Green, P. RepeatMasker Open-4.0. http://www.repeatmasker.org. 2013-2015.
- Bao Z, Eddy SR. Automated De Novo Identification of Repeat Sequence Families in Sequenced Genomes. Genome Res. 2002;12:1269–76. [CrossRef]
- Price AL, Jones NC, Pevzner PA. De novo identification of repeat families in large genomes. Bioinformatics. 2005;21 suppl_1:i351–8. [CrossRef]
- Ou S, Jiang N. LTR_retriever: A Highly Accurate and Sensitive Program for Identification of Long Terminal Repeat Retrotransposons1[OPEN]. Plant Physiol. 2018;176:1410–22. [CrossRef]
- Flutre T, Duprat E, Feuillet C, Quesneville H. Considering Transposable Element Diversification in De Novo Annotation Approaches. PLoS ONE. 2011;6:e16526. [CrossRef]
- Novák P, Neumann P, Pech J, Steinhaisl J, Macas J. RepeatExplorer: a Galaxy-based web server for genome-wide characterization of eukaryotic repetitive elements from next-generation sequence reads. Bioinformatics. 2013;29:792–3. [CrossRef]
- Chikhi R, Medvedev P. Informed and automated k-mer size selection for genome assembly. Bioinformatics. 2014;30:31–7. [CrossRef]
- Novák P, Ávila Robledillo L, Koblížková A, Vrbová I, Neumann P, Macas J. TAREAN: a computational tool for identification and characterization of satellite DNA from unassembled short reads. Nucleic Acids Res. 2017;45:e111. [CrossRef]
- Bao W, Kojima KK, Kohany O. Repbase Update, a database of repetitive elements in eukaryotic genomes. Mob DNA. 2015;6:11. [CrossRef]
- Demsˇar J, Curk T, Erjavec A, Demsar J, Curk T, Erjave A, et al. Orange: Data Mining Toolbox in Python. :5.
- Silva BSML, Picorelli ACR, Kuhn GCS. In Silico Identification and Characterization of Satellite DNAs in 23 Drosophila Species from the Montium Group. Genes. 2023;14:300. [CrossRef]
- Pita S, Panzera F, Mora P, Vela J, Cuadrado Á, Sánchez A, et al. Comparative repeatome analysis on Triatoma infestans Andean and Non-Andean lineages, main vector of Chagas disease. PLOS ONE. 2017;12:e0181635. [CrossRef]
- Palacios-Gimenez OM, Koelman J, Palmada-Flores M, Bradford TM, Jones KK, Cooper SJB, et al. Comparative analysis of morabine grasshopper genomes reveals highly abundant transposable elements and rapidly proliferating satellite DNA repeats. BMC Biol. 2020;18:199. [CrossRef]
- Utsunomia R, Silva DMZ de A, Ruiz-Ruano FJ, Goes CAG, Melo S, Ramos LP, et al. Satellitome landscape analysis of Megaleporinus macrocephalus (Teleostei, Anostomidae) reveals intense accumulation of satellite sequences on the heteromorphic sex chromosome. Sci Rep. 2019;9:5856. [CrossRef]
- Sproul JS, Hotaling S, Heckenhauer J, Powell A, Larracuente AM, Kelley JL, et al. Repetitive elements in the era of biodiversity genomics: insights from 600+ insect genomes. preprint. Genomics; 2022.
- Logsdon GA, Vollger MR, Eichler EE. Long-read human genome sequencing and its applications. Nat Rev Genet. 2020;21:597–614. [CrossRef]
- Paajanen P, Kettleborough G, López-Girona E, Giolai M, Heavens D, Baker D, et al. A critical comparison of technologies for a plant genome sequencing project. GigaScience. 2019;8:giy163. [CrossRef]
- Kawato S, Nishitsuji K, Arimoto A, Hisata K, Kawamitsu M, Nozaki R, et al. Genome and transcriptome assemblies of the kuruma shrimp, Marsupenaeus japonicus. G3 GenesGenomesGenetics. 2021;11:jkab268. [CrossRef]
- Jin S, Bian C, Jiang S, Han K, Xiong Y, Zhang W, et al. A chromosome-level genome assembly of the oriental river prawn, Macrobrachium nipponense. GigaScience. 2021;10:giaa160. [CrossRef]
- Veldsman WP, Ma KY, Hui JHL, Chan TF, Baeza JA, Qin J, et al. Comparative genomics of the coconut crab and other decapod crustaceans: exploring the molecular basis of terrestrial adaptation. BMC Genomics. 2021;22:1–15. [CrossRef]
- Gutekunst J, Andriantsoa R, Falckenhayn C, Hanna K, Stein W, Rasamy J, et al. Clonal genome evolution and rapid invasive spread of the marbled crayfish. Nat Ecol Evol. 2018;2:567–73. [CrossRef]
- Austin CM, Croft LJ, Grandjean F, Gan HM. The NGS Magic Pudding: A Nanopore-Led Long-Read Genome Assembly for the Commercial Australian Freshwater Crayfish, Cherax destructor. Front Genet. 2022;12. [CrossRef]
- Tan MH, Gan HM, Lee YP, Grandjean F, Croft LJ, Austin CM. A Giant Genome for a Giant Crayfish (Cherax quadricarinatus) With Insights Into cox1 Pseudogenes in Decapod Genomes. Front Genet. 2020;11. [CrossRef]
- Polinski JM, Zimin AV, Clark KF, Kohn AB, Sadowski N, Timp W, et al. The American lobster genome reveals insights on longevity, neural, and immune adaptations. Sci Adv. 2021;7:eabe8290. [CrossRef]
- Xu Z, Gao T, Xu Y, Li X, Li J, Lin H, et al. A chromosome-level reference genome of red swamp crayfish Procambarus clarkii provides insights into the gene families regarding growth or development in crustaceans. Genomics. 2021;113:3274–84. [CrossRef]
- Wang Q, Ren X, Liu P, Li J, Lv J, Wang J, et al. High-quality genome assembly of Chinese shrimp (Fenneropenaeus chinensis) suggests genome contraction and adaptation to the environment. preprint. Preprints; 2021.
- Katneni VK, Shekhar MS, Jangam AK, Krishnan K, Prabhudas SK, Kaikkolante N, et al. A Superior Contiguous Whole Genome Assembly for Shrimp (Penaeus indicus). Front Mar Sci. 2022;8. [CrossRef]
- Uengwetwanit T, Pootakham W, Nookaew I, Sonthirod C, Angthong P, Sittikankaew K, et al. A chromosome-level assembly of the black tiger shrimp (Penaeus monodon) genome facilitates the identification of growth-associated genes. Mol Ecol Resour. 2021;21:1620–40. [CrossRef]
- Yuan J, Zhang X, Li F, Xiang J. Genome Sequencing and Assembly Strategies and a Comparative Analysis of the Genomic Characteristics in Penaeid Shrimp Species. Front Genet. 2021;12. [CrossRef]
- Zhang X, Yuan J, Sun Y, Li S, Gao Y, Yu Y, et al. Penaeid shrimp genome provides insights into benthic adaptation and frequent molting. Nat Commun. 2019;10:356. [CrossRef]
- Liu M, Ge S, Bhandari S, Fan C, Jiao Y, Gai C, et al. Genome characterization and comparative analysis among three swimming crab species. Front Mar Sci. 2022;9. [CrossRef]
- Tang B, Zhang D, Li H, Jiang S, Zhang H, Xuan F, et al. Chromosome-level genome assembly reveals the unique genome evolution of the swimming crab (Portunus trituberculatus). GigaScience. 2020;9:giz161. [CrossRef]
- Bachvaroff TR, McDonald RC, Plough LV, Chung JS. Chromosome-level genome assembly of the blue crab, Callinectes sapidus. G3 GenesGenomesGenetics. 2021;11:jkab212. [CrossRef]
- Tang B, Wang Z, Liu Q, Wang Z, Ren Y, Guo H, et al. Chromosome-level genome assembly of Paralithodes platypus provides insights into evolution and adaptation of king crabs. Mol Ecol Resour. 2021;21:511–25. [CrossRef]
- Tang B, Wang Z, Liu Q, Zhang H, Jiang S, Li X, et al. High-Quality Genome Assembly of Eriocheir japonica sinensis Reveals Its Unique Genome Evolution. Front Genet. 2020;10. [CrossRef]
- Petersen M, Armisén D, Gibbs RA, Hering L, Khila A, Mayer G, et al. Diversity and evolution of the transposable element repertoire in arthropods with particular reference to insects. BMC Ecol Evol. 2019;19:11. [CrossRef]
- Wu C, Lu J. Diversification of Transposable Elements in Arthropods and Its Impact on Genome Evolution. Genes. 2019;10:338. [CrossRef]
- Shao C, Sun S, Liu K, Wang J, Li S, Liu Q, et al. The enormous repetitive Antarctic krill genome reveals environmental adaptations and population insights. Cell. 2023;186:1279-1294.e19. [CrossRef]
- Lyon, MF. Do LINEs have a role in X-chromosome inactivation? J Biomed Biotechnol. 2006;2006:59746.
- Dodsworth S, Chase MW, Kelly LJ, Leitch IJ, Macas J, Novák P, et al. Genomic Repeat Abundances Contain Phylogenetic Signal. Syst Biol. 2015;64:112–26. [CrossRef]
- Dodsworth S, Jang T-S, Struebig M, Chase MW, Weiss-Schneeweiss H, Leitch AR. Genome-wide repeat dynamics reflect phylogenetic distance in closely related allotetraploid Nicotiana (Solanaceae). Plant Syst Evol. 2017;303:1013–20. [CrossRef]
- Zhu L, Swergold GD, Seldin MF. Examination of sequence homology between human chromosome 20 and the mouse genome: intense conservation of many genomic elements. Hum Genet. 2003;113:60–70. [CrossRef]
- Silva JC, Shabalina SA, Harris DG, Spouge JL, Kondrashovi AS. Conserved fragments of transposable elements in intergenic regions: evidence for widespread recruitment of MIR- and L2-derived sequences within the mouse and human genomes. Genet Res. 2003;82:1–18. [CrossRef]
- Vitales D, Garcia S, Dodsworth S. Reconstructing phylogenetic relationships based on repeat sequence similarities. Mol Phylogenet Evol. 2020;147:106766. [CrossRef]
- Bao W, Tang KFJ, Alcivar-Warren A. The Complete Genome of an Endogenous Nimavirus (Nimav-1_LVa) From the Pacific Whiteleg Shrimp Penaeus (Litopenaeus) Vannamei. Genes. 2020;11:94. [CrossRef]
- Sotero-Caio CG, Platt RN II, Suh A, Ray DA. Evolution and Diversity of Transposable Elements in Vertebrate Genomes. Genome Biol Evol. 2017;9:161–77. [CrossRef]
Figure 1.
Standardized annotation protocol for repetitive elements developed in this study.
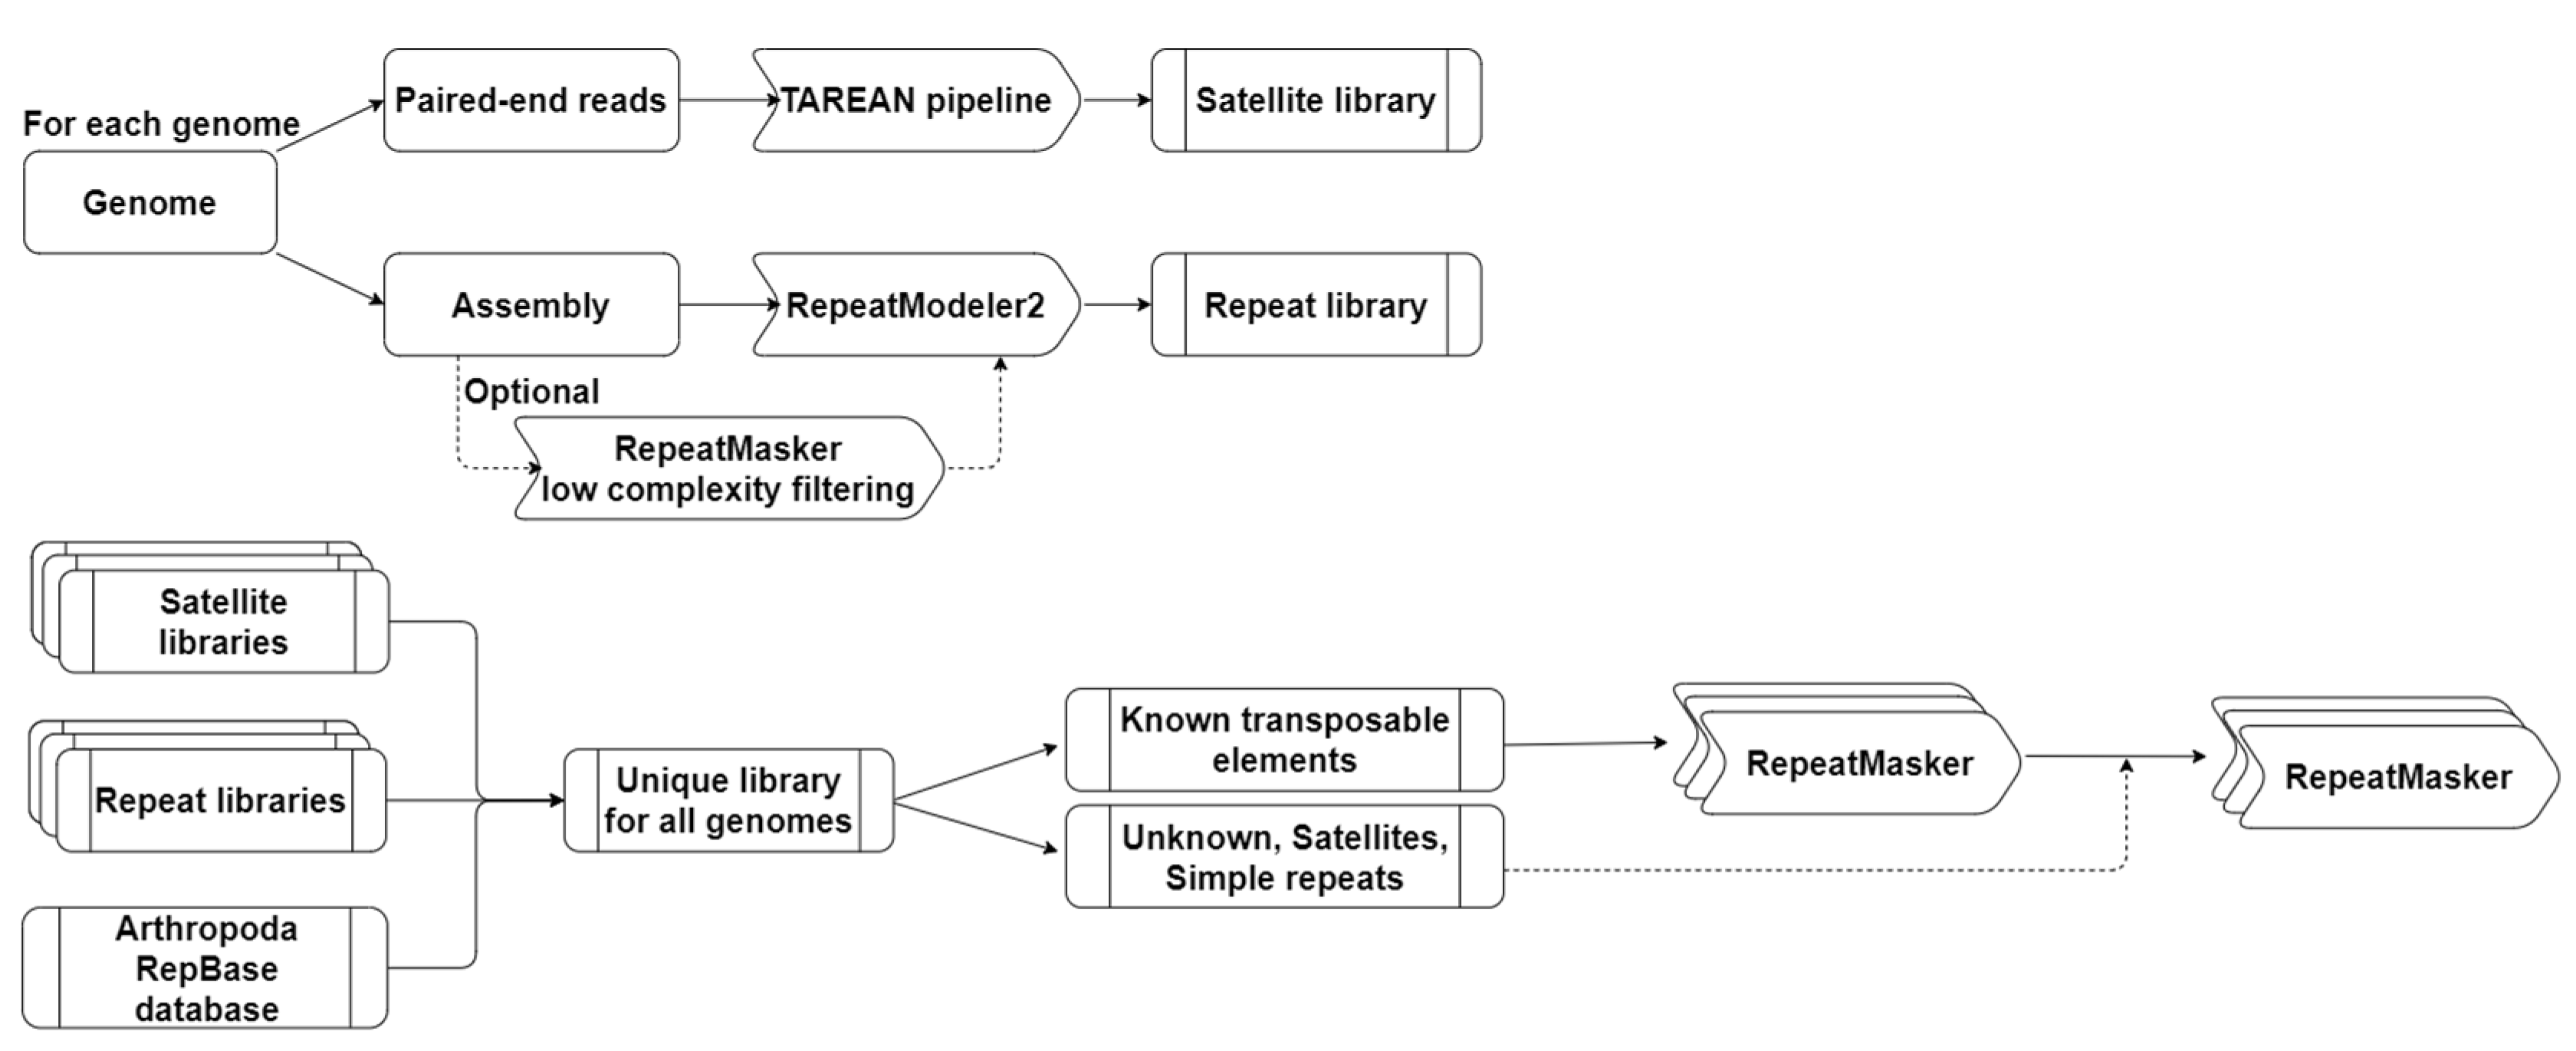
Figure 2.
Proportion and content of repetitive elements in genomes. Percentage of repetitive elements in the genome by class of repetitive elements. De, Dendrobranchiata; Ca, Caridea; Ac, Achelata; As, Astacidea; An, Anomura; Br, Brachyura; Oc, other crustaceans.
Figure 2.
Proportion and content of repetitive elements in genomes. Percentage of repetitive elements in the genome by class of repetitive elements. De, Dendrobranchiata; Ca, Caridea; Ac, Achelata; As, Astacidea; An, Anomura; Br, Brachyura; Oc, other crustaceans.
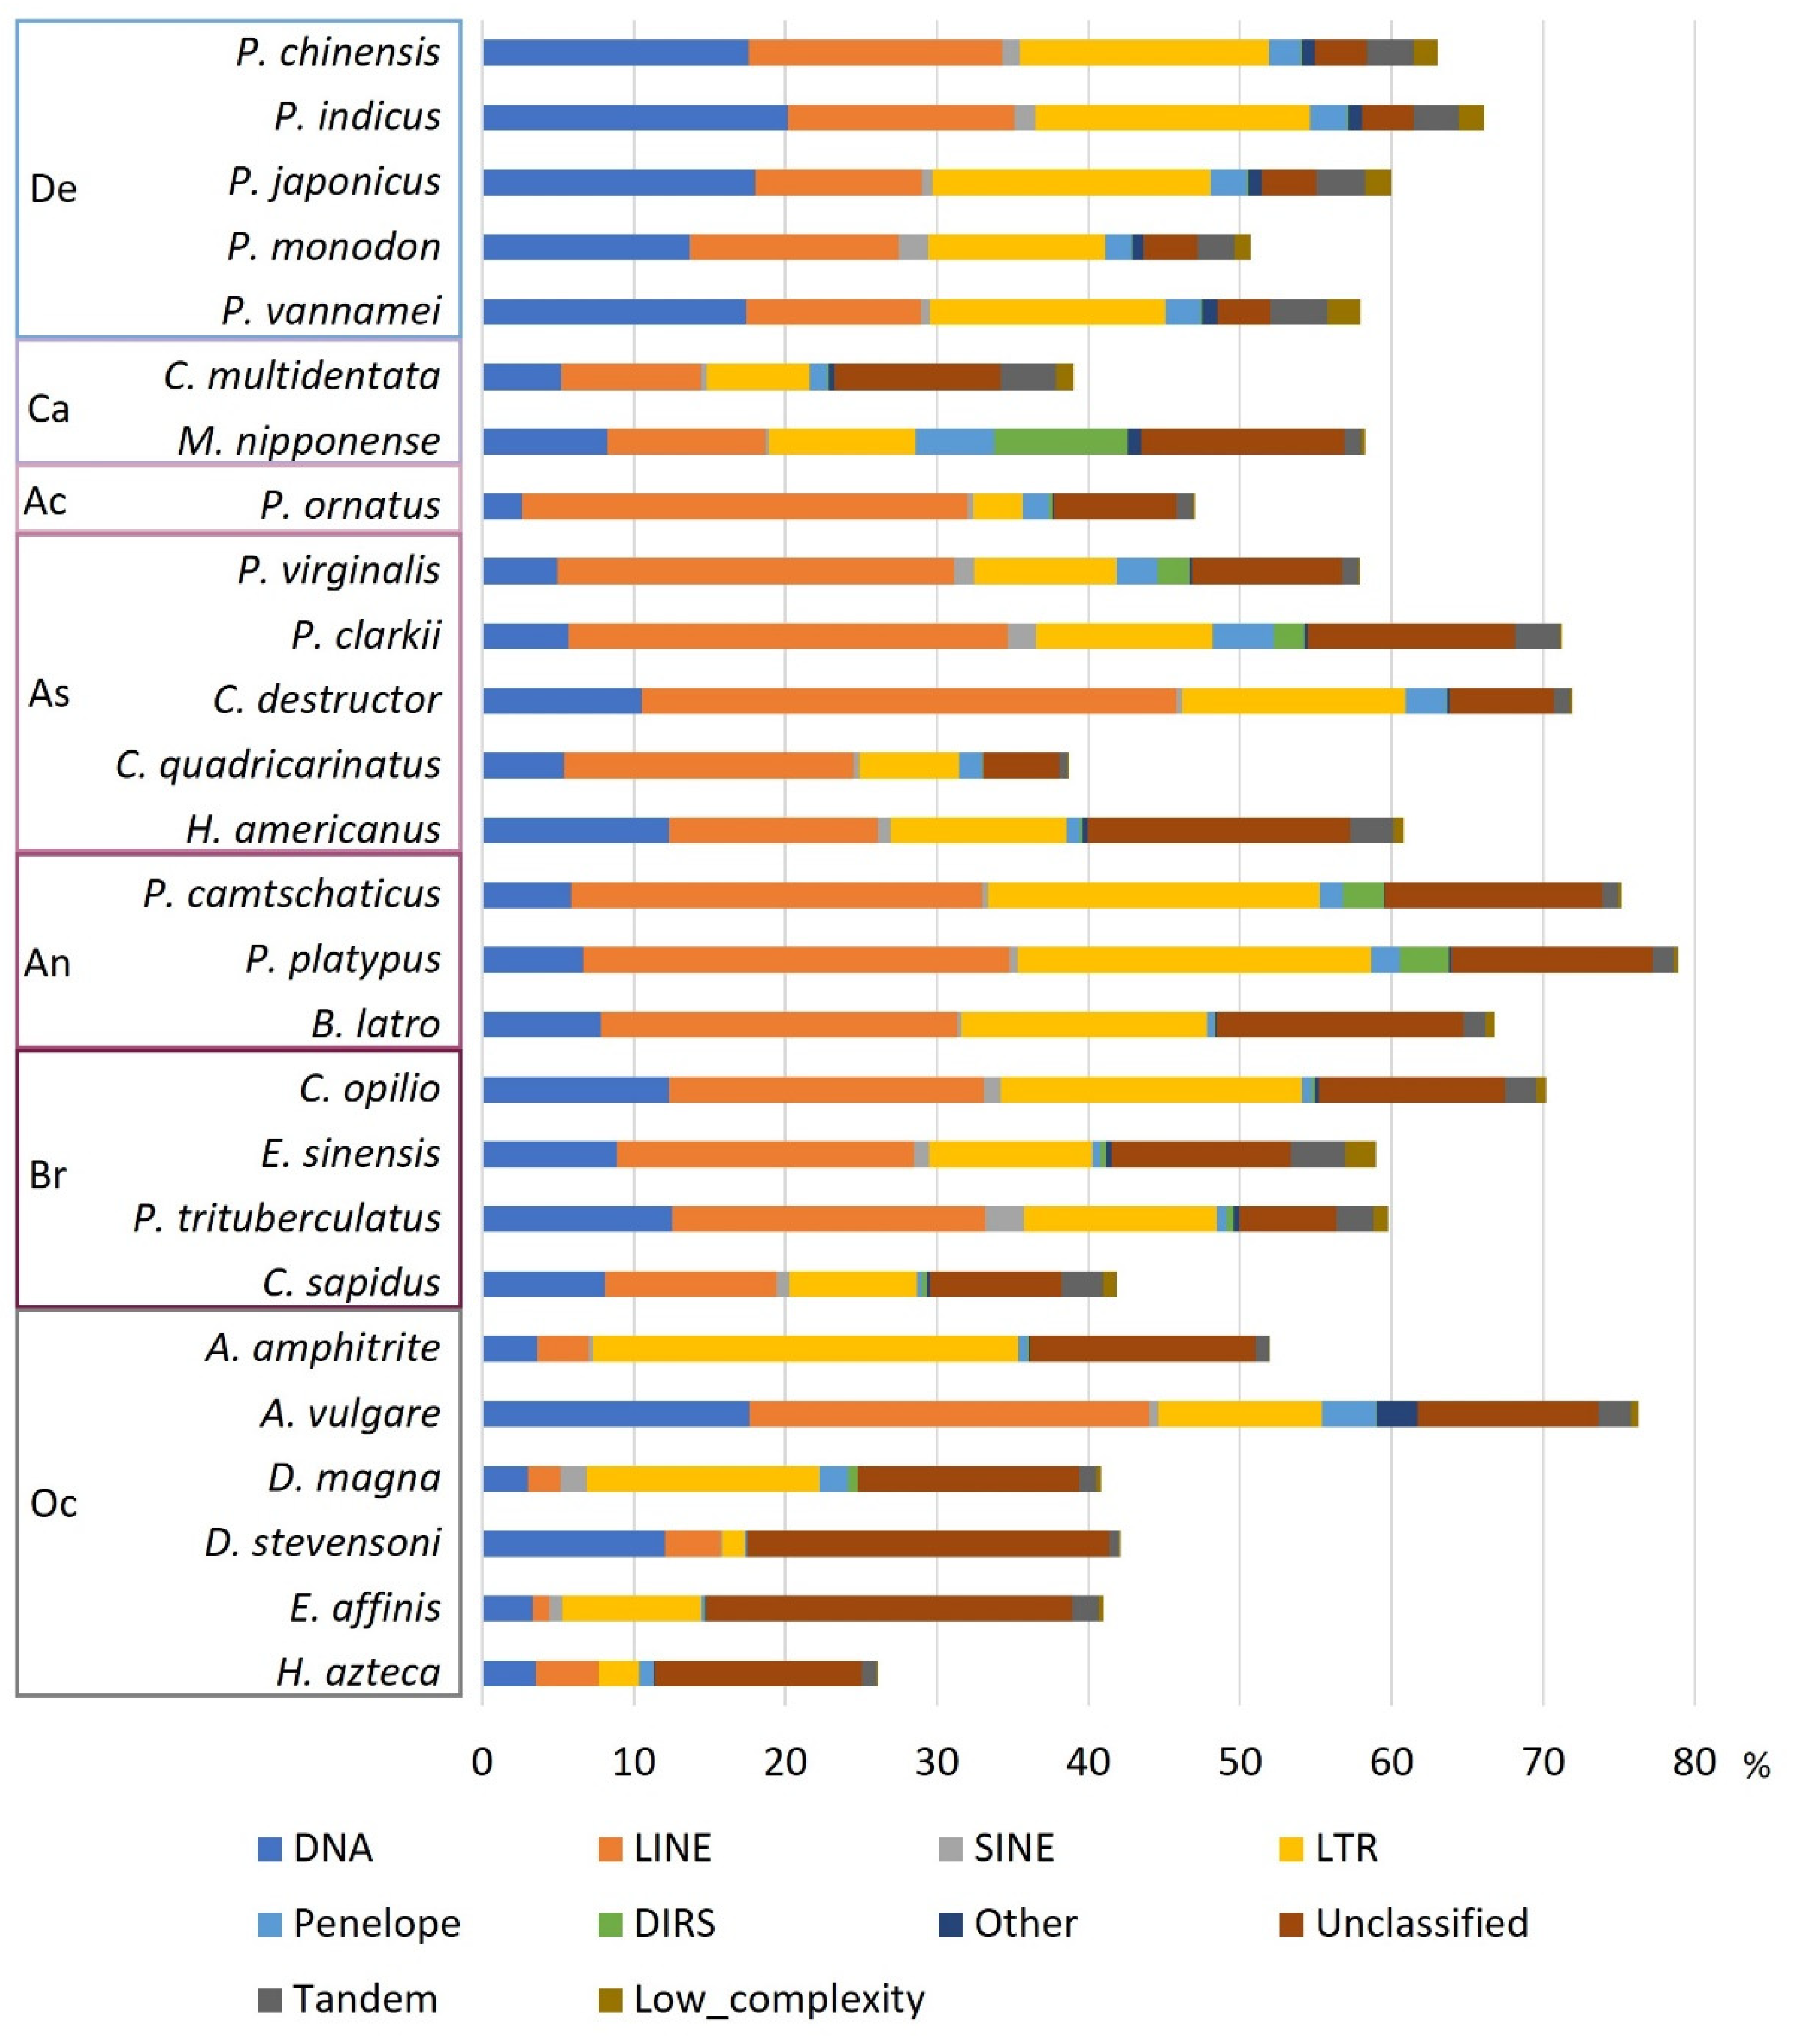
Figure 3.
Correlation between genome size and TE. Correlation plot between assembly or estimate genome size and load or percentage of TEs. Order and suborder are grouped by colours. A. Correlation between assembly size and the load of TEs. Spearman rank correlation test: ρ=0.87, p-value=1.864E-6. B. Correlation between assembly size and the percentage of TEs. Spearman rank correlation test: ρ=0.6, p-value=0.0015. C. Correlation between estimate genome size and the load of TEs. Spearman rank correlation test: ρ=0.62, p-value=0.0007. D. Correlation between estimate genome size and the percentage of TEs. Spearman rank correlation test: ρ=0.47, p-value=0.0142.
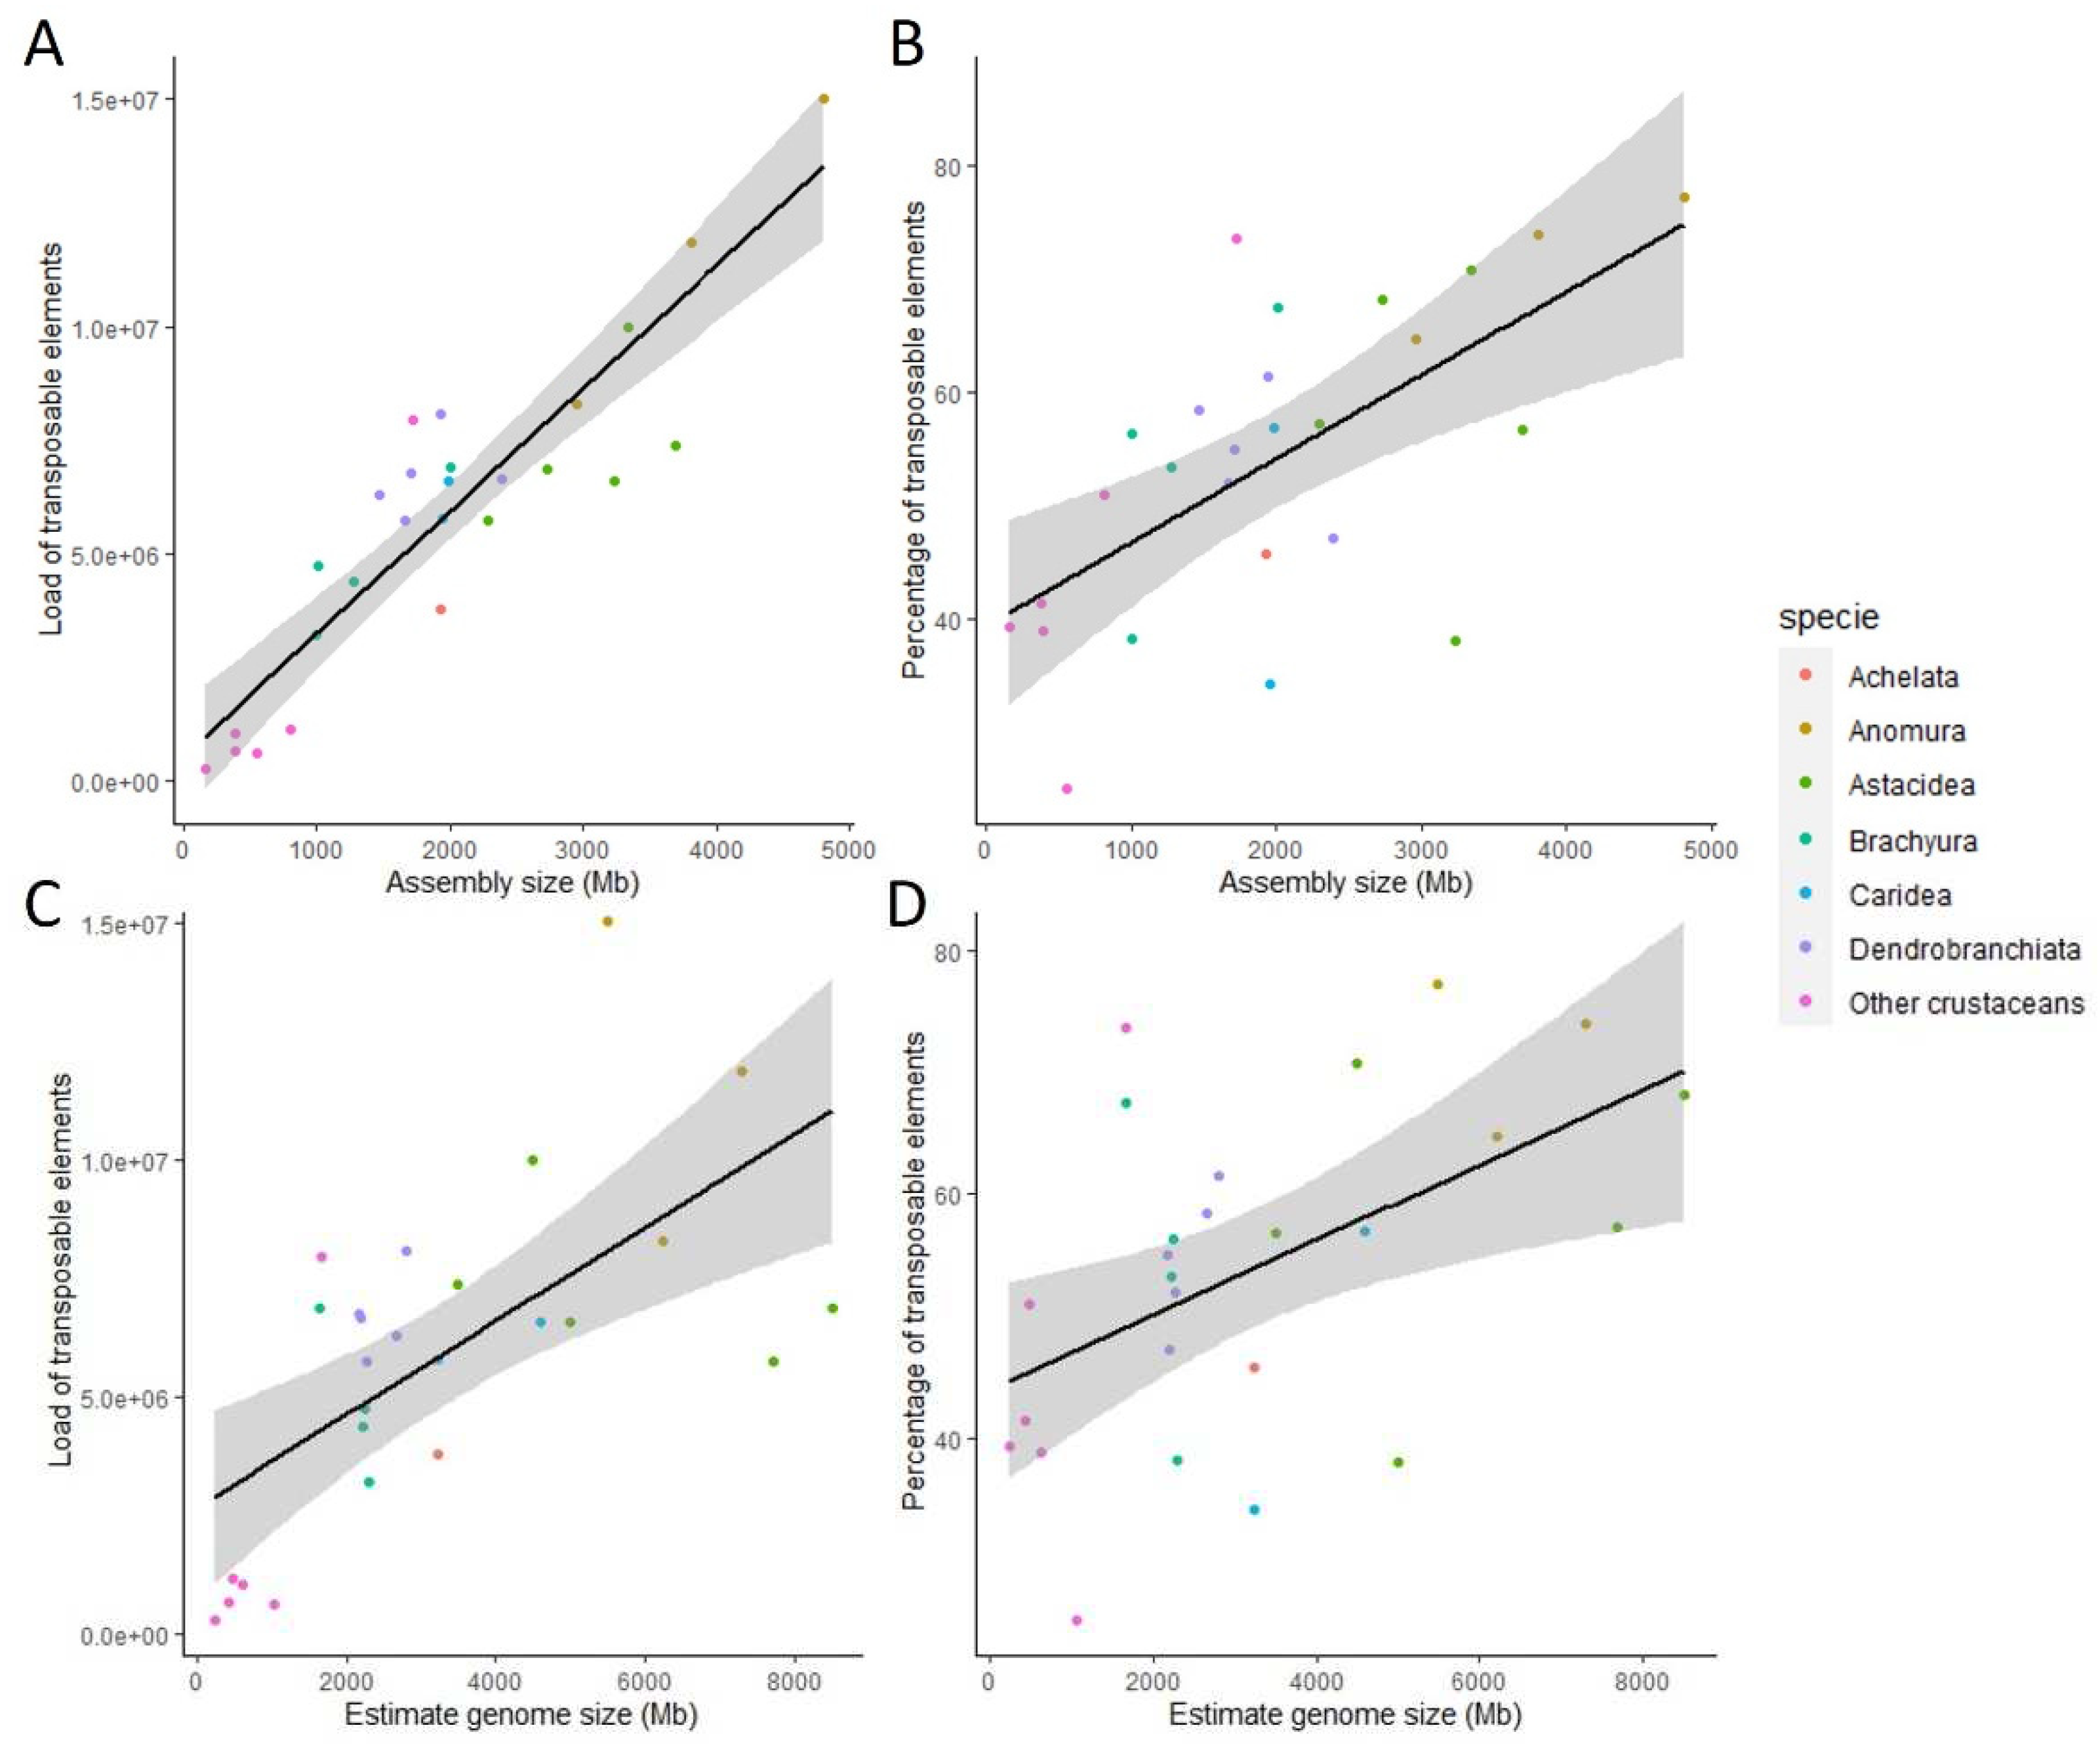
Figure 4.
Distribution of satDNA families according to the number of occurrences in each genome. Low frequency families (less than 10 occurrences) are indicated in dark green while highly abundant families with more than 1000 occurrences are indicated in red. Number indicated for each species is the estimate genome size. De, Dendrobranchiata; Ca, Caridea; Ac, Achelata; As, Astacidea; An, Anomura; Br, Brachyura; Oc, other crustaceans.
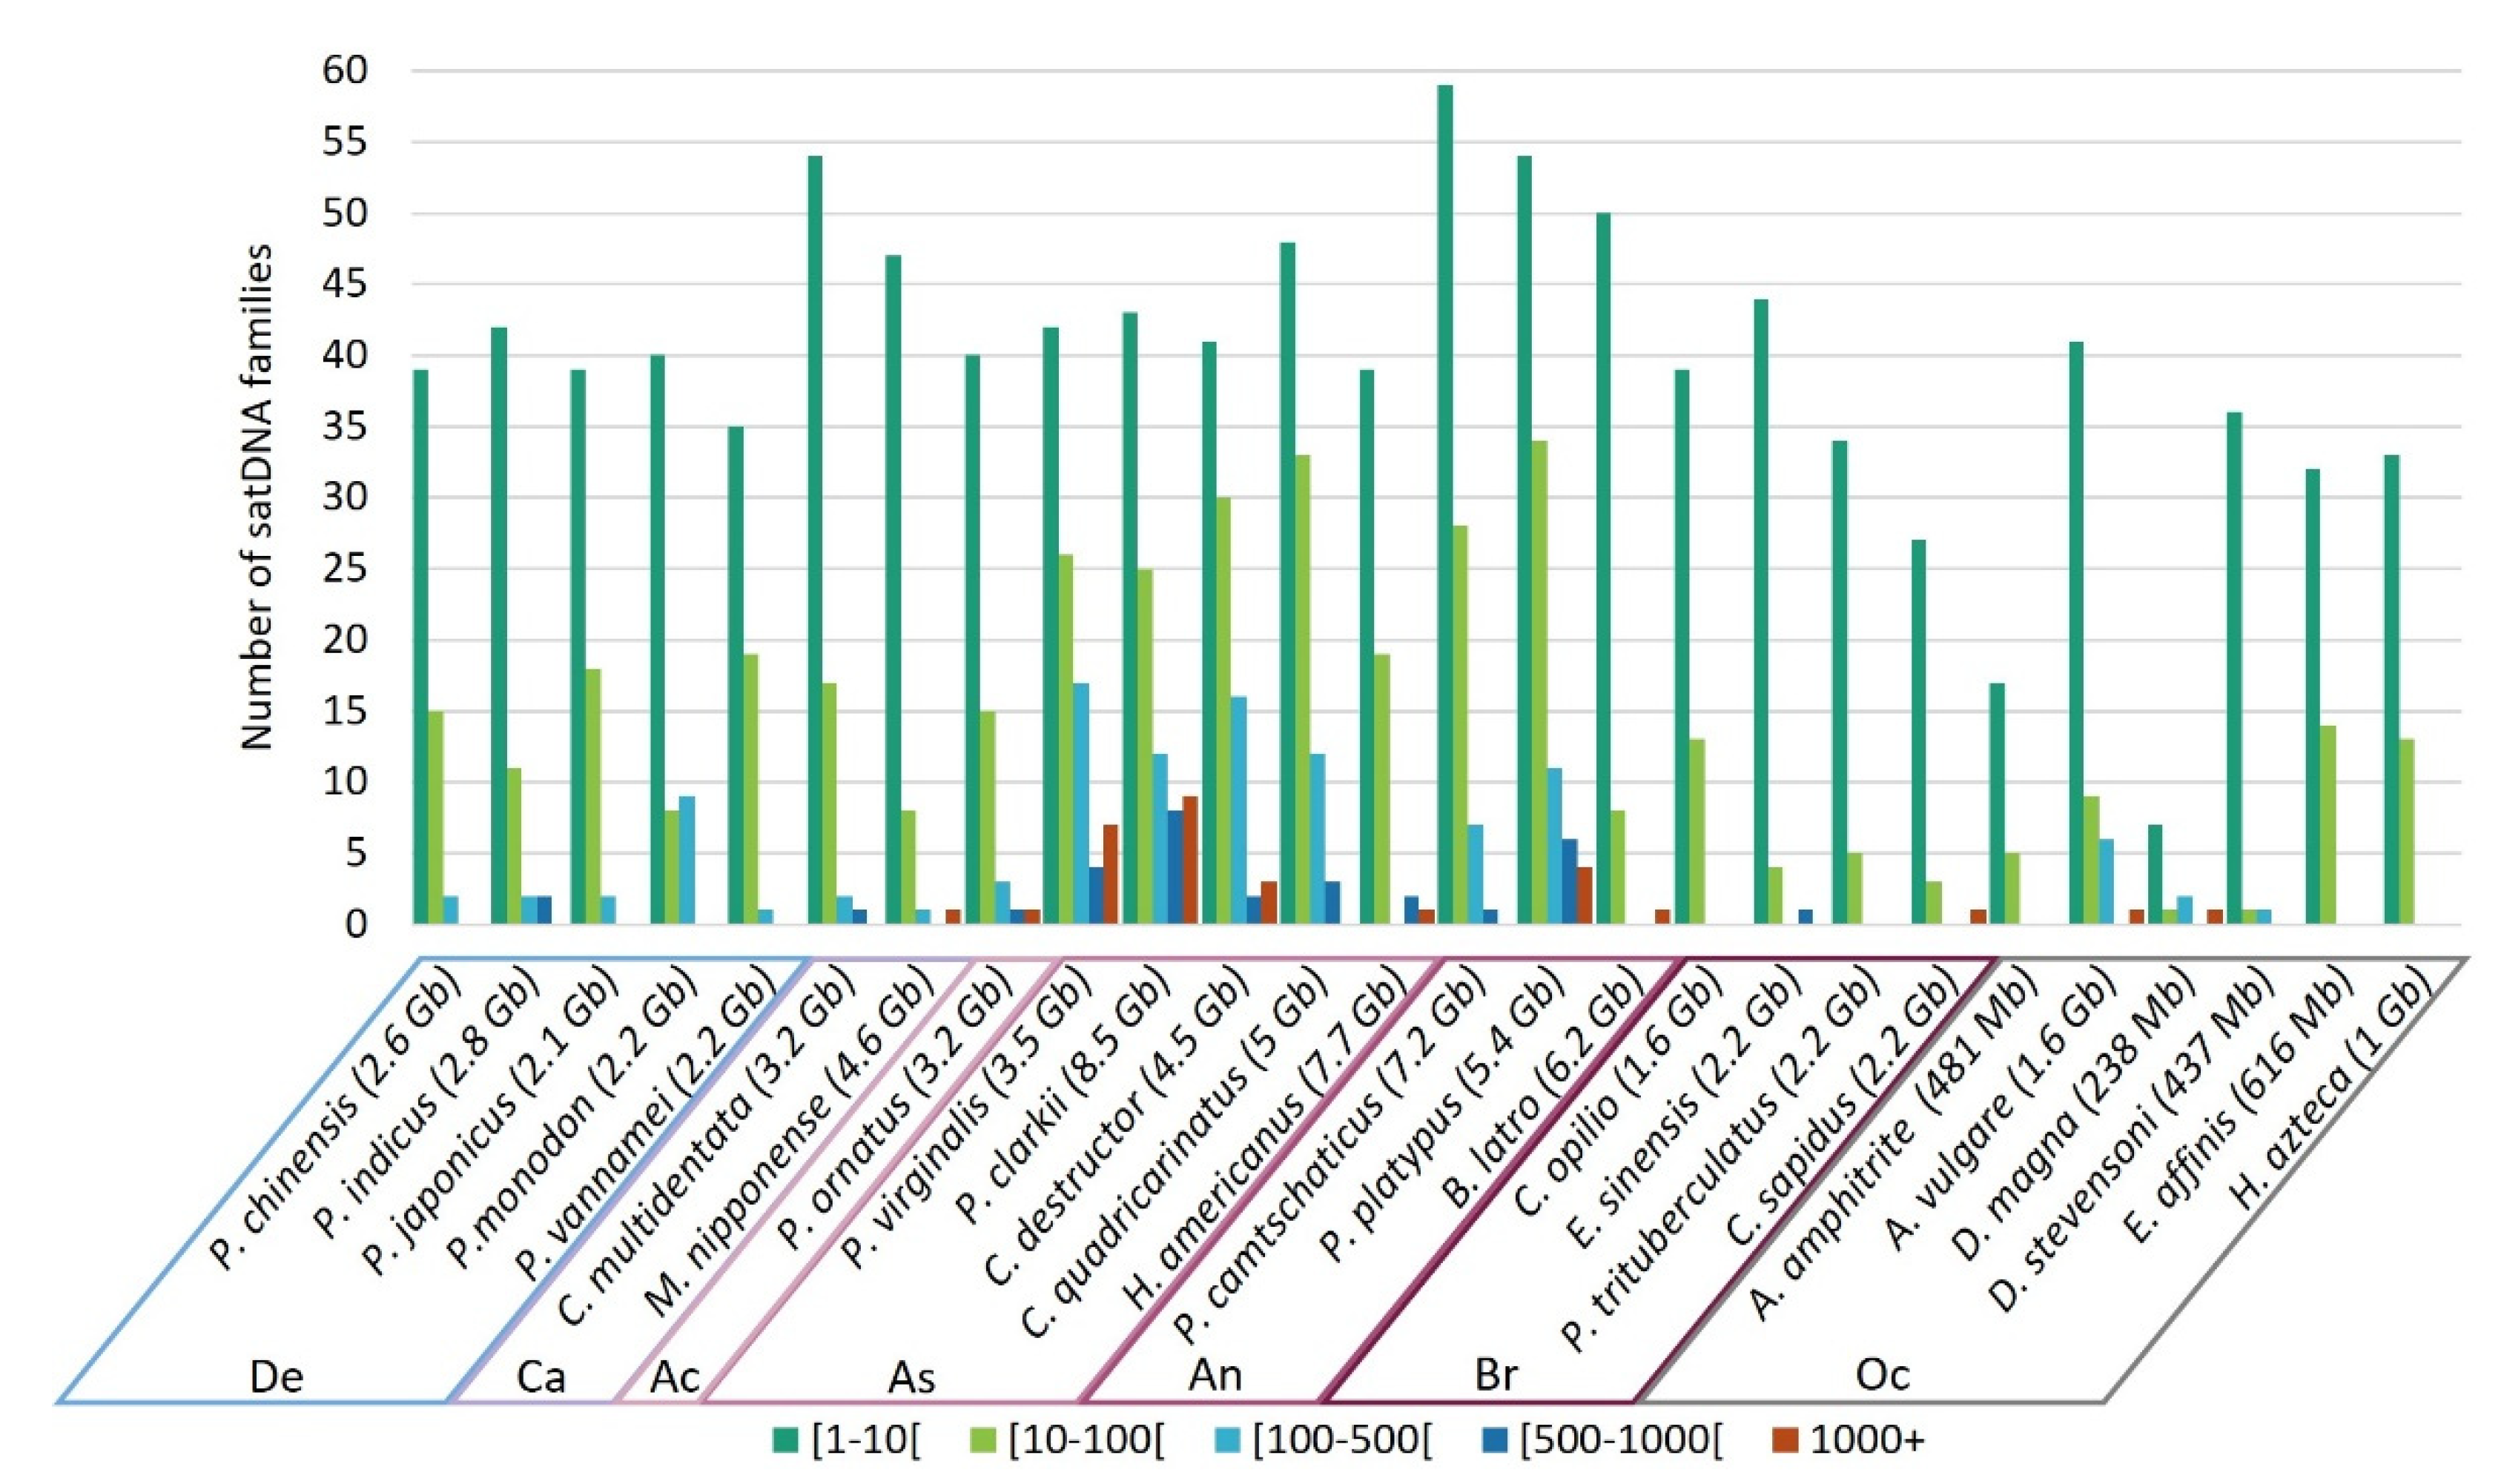
Figure 5.
Diversity of repetitive elements. Log2 of the load of each family of repetitive elements identified for each genome was graduated between 0 (blue) and 21 (red). Gray colour is for true 0, before transforming to log2. The dendrogram was produced according to repeat profile by clustering.
Figure 5.
Diversity of repetitive elements. Log2 of the load of each family of repetitive elements identified for each genome was graduated between 0 (blue) and 21 (red). Gray colour is for true 0, before transforming to log2. The dendrogram was produced according to repeat profile by clustering.
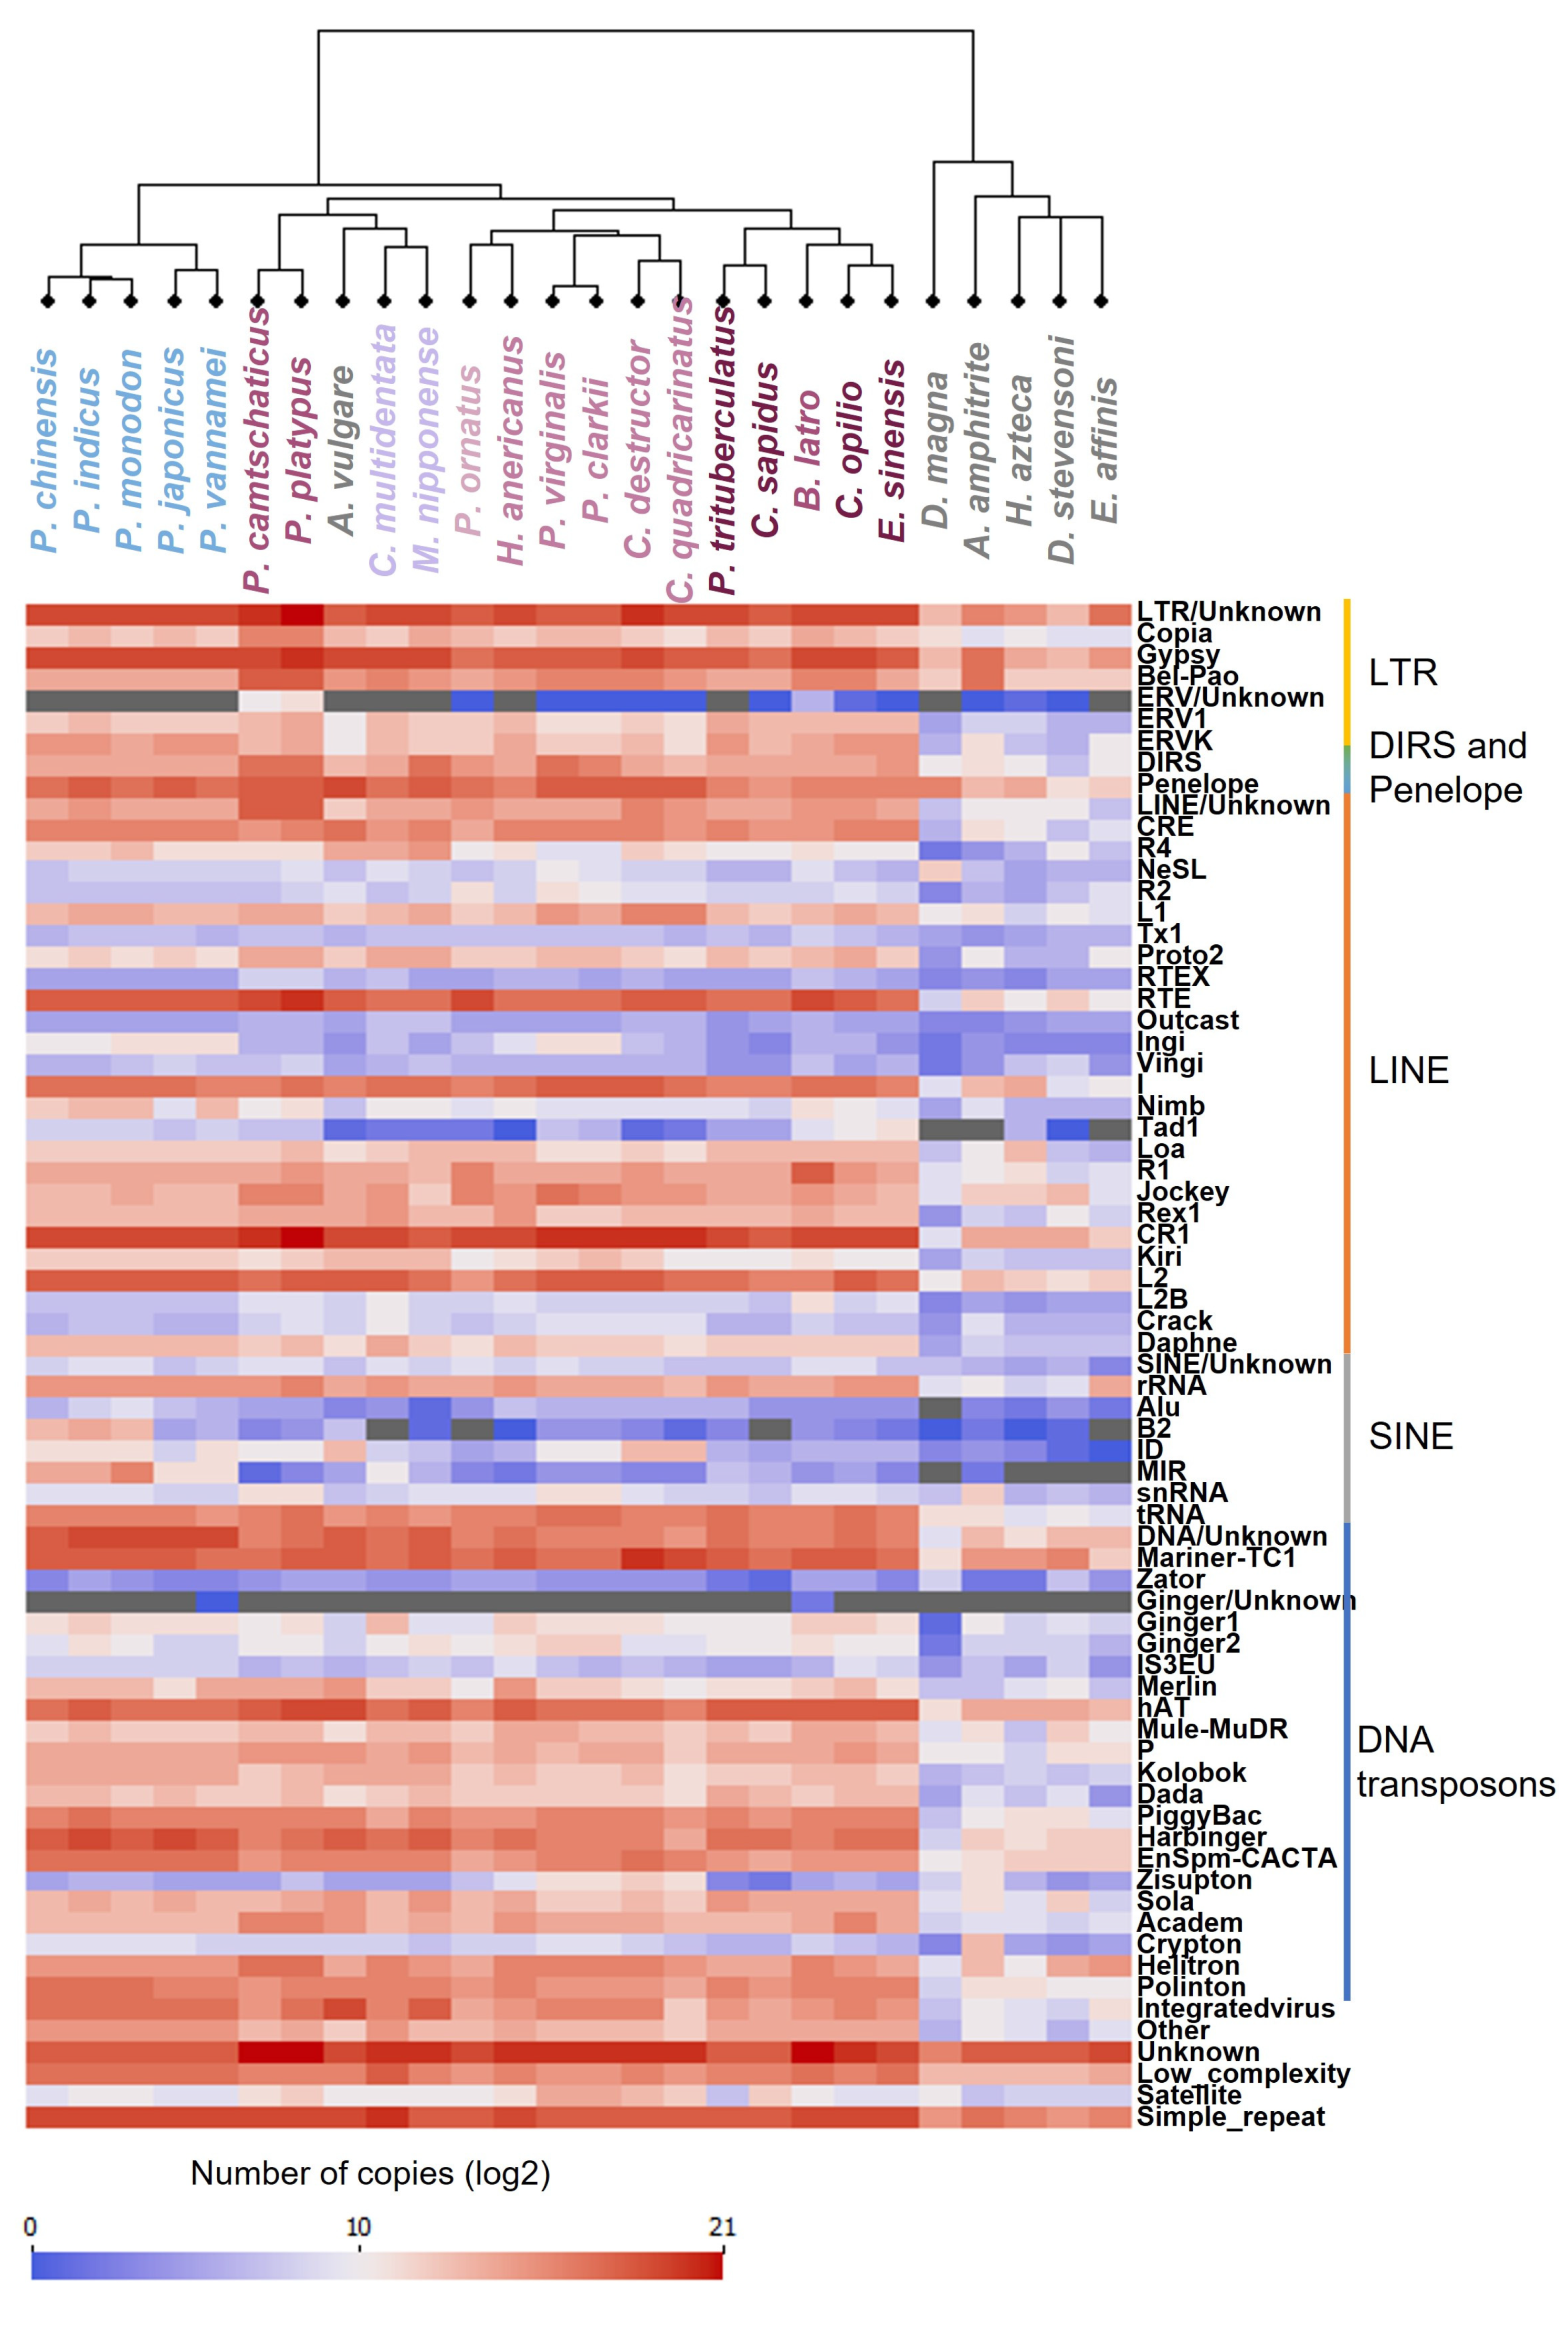
Figure 6.
Sequence divergence distribution of Tes representing TE accumulation history based on Kimura 2P distance. Sequence divergence is indicated by the x-axis. On the y-axis, the percentage of the genome occupied by each TE type, the scale is different for each genome depending on the percentage occupied. The TE type is indicated by the colour chart.
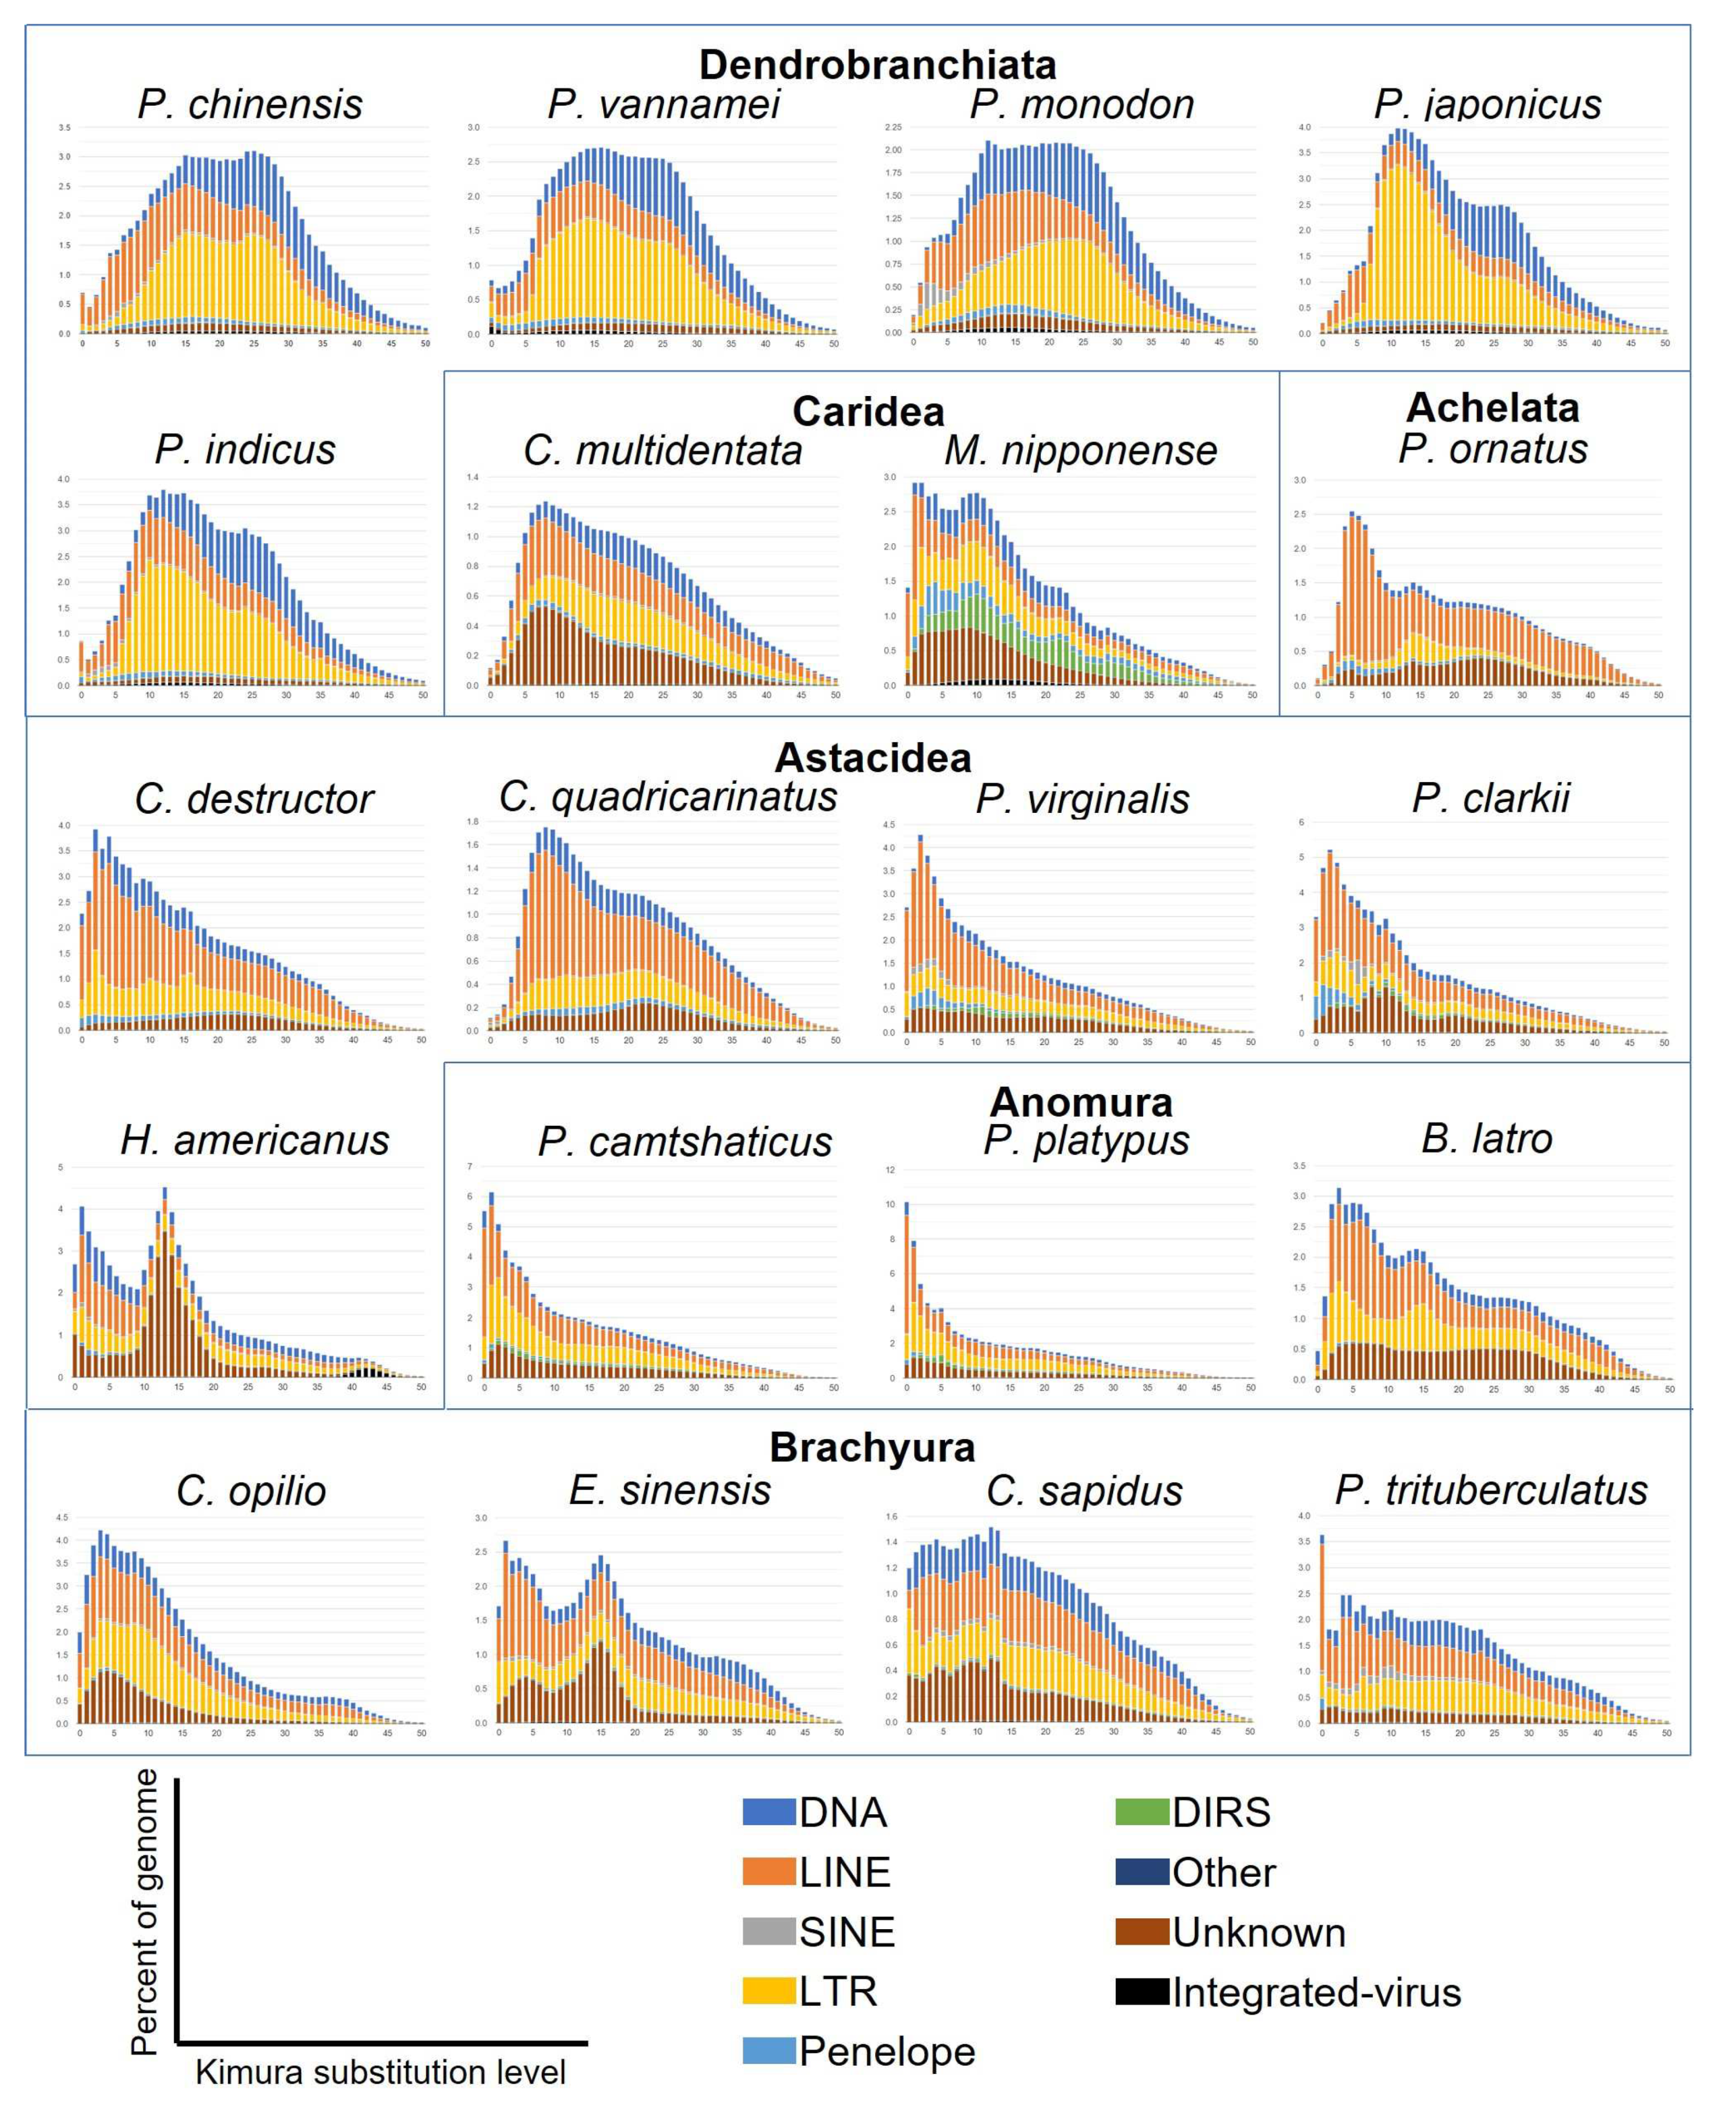
Table 2.
Number of RE libraries identified and annotated using species-specific libraries or a merged library from all species. RMo-RepeatModeler2, Tp- TAREAN pipeline.
Table 2.
Number of RE libraries identified and annotated using species-specific libraries or a merged library from all species. RMo-RepeatModeler2, Tp- TAREAN pipeline.
| Suborder/ infraorder | Species | Ab Initio satDNA Families Identified | Number of Families Annotated Using RMo Species Specific and Repbase as Library for Each Species | Number of Families Annotated Using Merged Libraries of RMo and Tp Libraries for All Species and Repbase | |||||
|---|---|---|---|---|---|---|---|---|---|
| RMo | Tp | All RE Families | Percentage of Unknown | Satdna Only | All RE Families | Percentage of Unknown | satDNA Only | ||
| Dendrobranchiata | Penaeus chinensis | 1 | 7 | 7547 | 12.38% | 24 | 22702 | 3.44% | 56 |
| Penaeus indicus | 1 | 2 | 8252 | 7.72% | 30 | 24237 | 3.40% | 57 | |
| Penaeus japonicus | 3 | 5 | 7693 | 7.25% | 29 | 22611 | 3.61% | 59 | |
| Penaeus monodon | 0 | 4 | 8647 | 9.28% | 28 | 25183 | 3.57% | 57 | |
| Penaeus vannamei | 0 | 3 | 7621 | 8.85% | 30 | 23240 | 3.49% | 55 | |
| Caridea | Caridina multidentata | 1 | 6 | 11104 | 11.93% | 38 | 28065 | 11% | 74 |
| Macrobrachium nipponense | 2 | 0 | 10455 | 19.68% | 38 | 26021 | 13.42% | 57 | |
| Achelata | Panulirus ornatus | 1 | 6 | 8850 | 21.13% | 35 | 25995 | 8.12% | 60 |
| Astacidea | Procambarus virginalis | 1 | 31 | 9213 | 28.26% | 33 | 26483 | 9.95% | 96 |
| Procambarus clarkii | 2 | 39 | 8838 | 22.52% | 34 | 26051 | 13.67% | 97 | |
| Cherax destructor | 4 | 24 | 10391 | 14.10% | 40 | 29970 | 6.88% | 92 | |
| Cherax quadricarinatus | 1 | 43 | 10411 | 14.33% | 35 | 26966 | 4.99% | 96 | |
| Homarus americanus | 1 | 2 | 9557 | 24.16% | 35 | 27873 | 17.29% | 61 | |
| Anomura | Paralithodes camtschaticus | 2 | 19 | 11431 | 24.95% | 33 | 30169 | 14.36% | 95 |
| Paralithodes platypus | 0 | 36 | 11332 | 32.76% | 34 | 31798 | 13.27% | 109 | |
| Birgus latro | 1 | 2 | 11053 | 25.48% | 37 | 31207 | 16.30% | 59 | |
| Brachyura | Chionoecetes opilio | 0 | 0 | 10400 | 22.89% | 29 | 26561 | 12.26% | 52 |
| Eriocheir sinensis | 1 | 0 | 8486 | 20.74% | 29 | 23937 | 11.82% | 49 | |
| Portunus trituberculatus | 0 | 0 | 7399 | 12.28% | 20 | 21070 | 6.42% | 39 | |
| Callinectes sapidus | 0 | 2 | 6911 | 13.68% | 188 | 19041 | 8.68% | 31 | |
| Other crustaceans | Amphibalanus Amphitrite (Cirripedia) | 1 | 1 | 6717 | 27.06% | 14 | 11969 | 14.90% | 22 |
| Armadillidium vulgare (Isopoda) | 0 | 13 | 9431 | 17.40% | 27 | 19098 | 11.91% | 47 | |
| Daphnia magna(Phyllopoda) | 2 | 3 | 3643 | 17.90% | 10 | 6805 | 14.63% | 11 | |
| Darwinula stevensoni (Podocopida) | 1 | 2 | 9762 | 25.59% | 22 | 17339 | 23.89% | 38 | |
| Eurytemora affinis(Copepoda) | 1 | 8 | 6069 | 33.37% | 32 | 13334 | 24.15% | 46 | |
| Hyalella Azteca(Amphipoda) | 1 | 10 | 6851 | 16.21% | 28 | 14424 | 13.69% | 46 | |
Disclaimer/Publisher’s Note: The statements, opinions and data contained in all publications are solely those of the individual author(s) and contributor(s) and not of MDPI and/or the editor(s). MDPI and/or the editor(s) disclaim responsibility for any injury to people or property resulting from any ideas, methods, instructions or products referred to in the content. |
© 2023 by the authors. Licensee MDPI, Basel, Switzerland. This article is an open access article distributed under the terms and conditions of the Creative Commons Attribution (CC BY) license (http://creativecommons.org/licenses/by/4.0/).
Copyright: This open access article is published under a Creative Commons CC BY 4.0 license, which permit the free download, distribution, and reuse, provided that the author and preprint are cited in any reuse.


