
Submitted:
04 July 2023
Posted:
10 July 2023
You are already at the latest version
Abstract
Feature selection is a crucial step in machine learning, aiming to identify the most relevant features in high-dimensional data, in order to reduce the computational complexity of model development and improve its generalization performance. Ensemble feature ranking methods combine the results of several feature selection techniques to identify a subset of the most relevant features for a given task. In many cases, they produce a more comprehensive ranking of features than the individual methods used in them. This paper presents a novel approach to ensemble feature ranking, which uses a weighted average of the individual ranking scores calculated by the individual methods. The optimal weights are determined using a Taguchi-type design of experiments. The proposed methodology significantly improves classification performance on the CSE-CIC-IDS2018 dataset, particularly for attack types where traditional average-based feature ranking score combinations resulted in low classification metrics.
Keywords:
feature selection
; taguchi-method
; weighted average
; classificaton
; ensemble
1. Introduction
Feature ranking plays a key role in the data preprocessing workflow of the development and training of a network intrusion detection system owing to the high dimensionality of the training data. Feature selection can contribute to faster training, better performance, reduced overfitting, and better interpretability [1]. In several cases, ensemble feature selection methods can outperform individual feature ranking methods when developing a classifier [2]. By the combination of multiple feature ranking algorithms, one can improve the robustness of the overall feature ranking. Thus the final set of selected features is less likely to be influenced by outliers or biases in any single ranking method. Additionally, ensemble feature selection methods can also contribute to better coverage of the feature space and a more comprehensive evaluation of the different attributes, which could improve the performance of the classifier. Another benefit of the combination of different feature selection methods is that they can improve the discriminative ability of the selected attributes by identifying features that would be neglected otherwise by some ranking methods. Furthermore, by reducing the sensitivity of the selected features to the given training data, ensemble feature selection methods can help improve the capability of the generated model to classify previously unseen data accurately. This is especially important in network intrusion detection systems, where the model needs to identify new and emerging threats accurately.
The above presented ideas led us to the development of a novel ensemble feature selection approach, where the final scoring of the features is calculated by a weighted average of the individual scores obtained by the application of six feature selection techniques, and the optimal values of the weights are determined using Taguchi’s design of experiments approach. The new method was used in the course of the development of network intrusion detection modules trained with different attack types available in the CSE-CIC-IDS2018 dataset. The primary contribution of this paper is the utilization of weighting techniques for calculating the feature score and the determination of the weights.
The rest of this paper s organized as follows. Section 2 gives a short overview of some ensemble feature selection methods. Section 3 presents the proposed ensemble feature selection method and the incorporated feature selection techniques. Section 4 describes the results obtained with the CSE-CIC-IDS2018 dataset. The conclusions are drawn in Section 5.
2. Related works
Ensemble Feature Selection (EFS) is an approach that combines the results of multiple individual feature ranking techniques to improve the selection of relevant attributes and enhance model performance. This technique offers several advantages, including better classification accuracy, increased efficiency on large data sets, and the ability to address data overfitting. Utilizing ensemble feature selection involves leveraging the strengths of various feature selection algorithms to identify significant features in a dataset. By doing so, it enhances classification accuracy, reduces overfitting, and ensures greater stability in the selected features. This approach proves particularly beneficial in machine learning-driven applications like intrusion detection systems, where feature diversity significantly impacts model accuracy and training duration. However, there are some drawbacks to using EFS as well. Running all models requires significant computational resources, and finding the right balance between model accuracy and computation time can be challenging [2].
In their research, M. Manonmani and S. Balakrishnan utilized the density-based feature selection (DFS) method as a filtering approach to rank the features of a dataset. The DFS results were then given to an envelopment-based optimization technique called Improved Teacher Learner Based Optimization (ITLBO) algorithm to find the optimal feature set containing the most important features for high-accuracy prediction. The results of the ensemble feature selection method were evaluated using (Support Vector Machine) SVM, Gradient Boosting (GB), and Convolutional Neural Network (CNN) classification algorithms. SVM achieved a high classification accuracy of 93%, Gradient Boosting achieved a high classification accuracy of 97%, and CNN achieved a high classification accuracy of 97.75% for the derived optimal feature set. The proposed work achieved a feature reduction of 62.5% for the 8 features selected using SVM and CNN classification algorithms and 66.6% for the 9 features selected using GB classification algorithm [3].
A. Hashemi, M. B. Dowlatshahi, and H. Nezamabadi modeled joint feature selection as a multi-criteria decision-making process (MCDM) for 10 real datasets with varying numbers of features. They utilized the VIKOR method to rank the features based on the evaluation of several feature selection methods as different decision criteria. The proposed method first obtains a decision matrix by ranking each feature according to different ranking criteria. Next, a score is assigned to each feature. Finally, the output is a ranking vector of features from which the user can select the desired number of features. The results of their approach demonstrate its superiority over other similar methods in terms of accuracy, F-score, and algorithm runtime. Their approach also performs quickly and efficiently.[4].
N. Hoque et al. present a method called Ensemble Feature Selection using Mutual Information (EFS-MI), which combines subsets of the results of different feature selection methods, including InfoGain, GainRatio, ReliefF, Chi-square, and SymmetricUncertainty, to obtain the optimal subset of features[5].
A.S. Sumant and D. Patil processed high-dimensional datasets (HDD) using multi-step methods, specifically, Chi-square integrated with RReliefF (ChS-R) and Symmetric Uncertainty integrated with RReliefF. The results were then validated using Random Forest (RF), k-nearest neighbors (KNN), and SVM classifiers.The proposed ChS-R system achieved an accuracy improvement of 13.28%, while SU-R achieved an accuracy improvement of 9.47% [6].
Chih-Fong Tsaiand Ya-Ting Sung in their research describe several feature selection methods, including Principal Component Analysis (PCA), Genetic Algorithm (GA), and C4.5 decision tree, specifically for high-dimensional, low sample size (HDLSS) data. We also explore their nine parallel and nine row combinatorial approaches to the results, including union, intersection, and intersection. Our test results indicate that the row-based ensemble feature selection approach is particularly suitable for processing very high-dimensional datasets [7].
In their study, J. Wang et al. used the UCI machine learning dataset to propose SA-EFS based on sort aggregation. The feature selection methods employed included Chi-square, maximum information coefficient, and XGBoost. The performance of the method was evaluated using KNN, Random Forest, and XGBoost classifiers [8].
3. Methodology
The following section of the article presents the feature selection methods utilized in the study. Subsequently, the results obtained are utilized to rank the characteristics by means of the ensemble feature selection method, whereby the weighted average of the method results is calculated.
3.1. Feature Selection Methods
The process of selecting features involves identifying the most relevant attributes that can be effectively used for classification or prediction [9,10,11]. This contributes to reducing the dimensionality of the problem, and therefore reduces resource requirements such as storage and computation. Additionally, it can improve the performance of machine learning algorithms [12] by enabling faster training, reducing overfitting, and sometimes leading to better prediction power. The following subsections provide a brief description of the feature selection methods used.
3.1.1. Information Gain
One of the most commonly used univariate methods for evaluating attributes is the Information Gain (IG) filter. It assesses features based on their information gain and examines each feature individually. The Information Gain filter employs a symmetrical measure. It sorts all features in a methodical manner and necessitates the establishment of a threshold for selecting a specific number of features based on the obtained order. A drawback of the Information Gain criterion is that it tends to favor features with more values, even when they do not provide more informative data [13].
3.1.2. Gain Ratio
Gain Ratio (GR) is a variant of IG that mitigates its partiality. Unlike the standard Information Gain, the GR accounts for the number and size of branches when selecting an attribute. It addresses the Information Gain’s bias by incorporating the intrinsic information of a split. The intrinsic information refers to the entropy of the distribution of instances across branches, which represents the amount of information required to determine which branch an instance belongs to. As the intrinsic information increases, the value of the attribute decreases [14].
3.1.3. Chi2
The chi-squared test for feature selection is a statistical technique used to identify the most relevant features for a given set of data for a target variable. It works by comparing the observed distribution of the values of a characteristic with the expected distribution under the assumption of independence between the characteristic and the target variable and selecting those characteristics for which the difference between the observed and expected distributions is the largest [15].
3.1.4. Symmetric Uncertainty
Symmetric uncertainty is a means of determining the fitness of features for feature selection. It involves computing the relationship between the feature and the target class. Features that exhibit a high value of SU are considered to be of greater importance [16].
3.1.5. Relief
Relief is a feature selection method that serves as an individual evaluation filter. It computes a proxy statistic for each feature, which can estimate its quality or relevance to the target concept (i.e., predicting endpoint value). These statistics are known as feature weights, or informally, feature scores, ranging from -1 (worst) to +1 (best) [17].
3.1.6. ANOVA
ANOVA is a widely recognized statistical method used for comparing multiple independent means. This technique evaluates features by computing the ratio of variances between and within groups and then ranks them accordingly [18].
3.2. Weighted Ensemble Ranking
Weighted ensemble ranking is a widely used approach for assessing samples, allowing for differential evaluation of each component based on its significance, importance, strength, or any other criterion referred to as its weight. By considering the contributions of multiple feature ranking methods, the weighted average of the feature scores is computed using Equation (1). This equation provides an overall evaluation score, reflecting the combined assessment of the ensemble.
where is the score of the feature calculated by the ensemble method, , , , , , are the normalized feature scores obtained by the individual feature ranking methods included into the ensemble, while represent the weights associated to these methods.
By incorporating multiple feature ranking methods and assigning appropriate weights to each method, the ensemble approach effectively leverages the strengths of individual techniques while mitigating their weaknesses.
3.3. Weight Optimization using Taguchi’s DoE Approach
The arithmetic mean of individual feature scores is the simplest method for aggregating different scores, where each weight is identical. However, employing different weights can sometimes lead to feature scores that contribute more significantly to the selection of an improved feature subset. Such a subset enables better classification results to be achieved. Determining the optimal combination of weights is a challenging task due to the substantial time required for evaluating the various feature collections resulting from score calculations. Therefore, weight optimization with a minimal number of trials becomes necessary.
This recognition has led to the utilization of a well-known design of experiments (DoE) technique known as the Taguchi method. Developed by Genichi Taguchi in the 1950s, this approach originally aimed at quality management and design in the manufacturing industry [19]. The Taguchi method sought to identify and optimize the effects of different production parameters on product quality. By identifying optimal parameter settings during production, the Taguchi method reduces sensitivity to variations and enhances overall product quality.
To identify the optimal parameter setting, the Taguchi method employs the concept of "parameter design." This involves assigning process variables to predefined value ranges, conducting tests, and optimizing them. In the course of this research, six independent variables have to be tried, each of them at two levels. Therefore the orthogonal design plan was adopted. In the case of each factor, two levels were used, coded by 1 and 2 (see Table 1).
3.4. Classification Methods
In the course of the current research, three classification methods were employed to evaluate the selected feature subsets. A brief description of each method is provided in the following subsections.
3.4.1. Decision Tree
The decision tree method is a well-known algorithm in machine learning that is used for both classification and regression tasks. It works by creating a tree-shaped model that represents decisions and their potential outcomes. Each node in the tree represents a decision based on a specific feature, while the branches represent the different possible values or outcomes of that feature. The end nodes, or leaves, correspond to the final predicted class or numerical value. The goal of the decision tree algorithm is to identify the best points to split the data, which either maximizes the information gained or minimizes the uncertainty, leading to effective decision-making. Decision trees are easy to interpret, comprehend, and can handle both categorical and numerical features. They have found wide applications in various fields such as finance, healthcare, and marketing, primarily due to their simplicity, versatility, and ability to capture complex relationships [20].
3.4.2. Random Forest
The random forest method is a powerful technique in machine learning that is commonly used for classifying and predicting outcomes. It works by creating many decision trees and combining their predictions to achieve accurate and reliable results. Each decision tree is built using a random selection of features and training data, which helps prevent overfitting and increases the diversity of the trees. When making predictions, the random forest combines the outputs of all the trees, either by taking the majority vote (for classification tasks) or by averaging (for regression tasks). This approach improves overall prediction performance, effectively handles noisy data, and is capable of handling high-dimensional feature spaces [21].
3.4.3. SVM
A support vector machine (SVM) is an effective supervised machine learning algorithm utilized for classification and regression tasks. Its main objective is to construct an optimal hyperplane that effectively separates different classes within a feature space of high dimensionality. By maximizing the margin between data points of distinct classes and minimizing classification errors, SVMs can handle both linearly separable and non-linearly separable data. This is achieved through the use of kernel functions, which map the data into higher-dimensional spaces [22].
4. Experimental Results
In the course of this research, we utilized the CSE-CIC-IDS2018 dataset [23]. The dataset was created by the Canadian Institute for Cybersecurity Laboratory and was chosen because it fulfilled all the research requirements, providing information on total traffic, labeled data, and multiple attack types. It encompasses various attack types, while our study specifically focused on FTP, SSH, SQL, XSS, and Web attacks. Each record in the dataset contains 80 attributes extracted from the recorded traffic using CICFlowMeter-V3 [24].
In our previous work [25], we successfully reduced the dimensionality of the problem by excluding certain features. These features either had single-valued columns or contained irrelevant information. Thus, we narrowed down to 69 the number of features to be considered and further investigated. Subsequently, various feature selection methods (see Section 3.1) were employed to evaluate the individual features. The resulting score values were later normalized and aggregated using the arithmetic mean, yielding a single-value evaluation. Based on these feature scores and ranking thresholds, we selected feature subsets and tested them with different classification methods. Finally, each classifier’s performance was evaluated using accuracy, precision, recall, and F1 measures on both the training and test datasets. In cases where the trained classifiers exhibited poor performance, it motivated us to explore further the weighted average approach.
To facilitate a better exploration of the weight search space with minimal experiments, we assigned the weight values of 0.0233 and 0.2336 to the two levels of the weight variables (called factors in DoE) included in the selected DoE design. The rationale behind this choice was to use values that are significantly distant from each other. Due to the considerable time required for experiments, conducting an exhaustive search was not feasible. For each feature, we determined eight sets of weights based on Table 1. The resulting scores after applying these weights can be found in the five tables provided in the Appendix A During the experiments the same datasets were used as in [25].
Primarily, we directed our attention toward cases where the previous investigation using the arithmetic mean did not yield satisfactory results. Our aim here was twofold: either identifying feature sets with fewer features while maintaining the original classification performance, or finding feature sets that could enhance classification performance using accuracy, precision, recall, and F1 scores as performance measures. The steps of the process are outlined in Figure 1.
5. Discussion
Feature selection plays a critical role in training classifiers with large datasets, as it enables the identification of relevant and informative features, thereby improving performance and efficiency. This paper investigated the incorporation of a weighting mechanism to enhance the ensemble feature selection approach. Our hypothesis was that using a weighting mechanism can enhance our previous approach, which involved utilizing multiple individual feature scoring methods and calculating the arithmetic mean of their normalized scores.
During the investigation, the classification algorithms were trained and tested using a visual programming technique with Orange. The workflows were created by linking predefined widgets and parameterizing them.
For the FTP dataset, the number of features considered could be reduced from 8 to 5, while maintaining excellent performance across all three classification methods. Similarly, for the SSH dataset, we observed a comparable pattern. In this case, the number of features could be reduced from 7 to 6, while achieving the same or potentially enhanced performance.
Parallel to the improvement of SVM classification measures in the case of the SQL dataset, the number of necessary features could be reduced from 26 to 7. Similarly, for the XSS dataset, the number of necessary features could be reduced from 10 to 2. In the case of the Web dataset, the number of necessary features could be reduced from 44 to 13. Furthermore, while the simple average-based solution provided poor results with the SVM classifier for both the train and test datasets in the case of the SQL and Web datasets, the new approach resulted in a significant improvement in performance measures.
Evaluation of the resulting classification performance measures clearly demonstrates that weighting the scores provided by different feature scoring methods can lead to a better ensemble method. Future research will investigate the applicability of different fuzzy techniques (e.g., [26,27,28]) in the ensemble feature ranking method.
Author Contributions
Conceptualisation, L.G. and Z.C. J.; formal analysis, L.G. and Z.C. J.; Funding acquisition, L.G. and Z.C. J.; investigation, L.G. and Z.C. J.; methodology, L.G. and Z.C. J.; Writing—review & editing, L.G. and Z.C. J.; supervision, L.G. and Z.C. J. All authors have read and agreed to the published version of the manuscript.
Funding
This research was supported by 2020-1.1.2-PIACI-KFI-2020-00062 ”Development of an industrial 4.0 modular industrial packaging machine with integrated data analysis and optimization based on artificial intelligence. error analysis”. The Hungarian Government supports the Project and is co-financed by the European Social Fund. The APC was funded by John von Neumann University
Institutional Review Board Statement
Not applicable
Informed Consent Statement
Not applicable
Data Availability Statement
The CSE-CIC-IDS2018 dataset used in the research is available at the link below: https://registry.opendata.aws/cse-cic-ids2018/.
Acknowledgments
In this section you can acknowledge any support given which is not covered by the author contribution or funding sections. This may include administrative and technical support, or donations in kind (e.g., materials used for experiments).
Conflicts of Interest
The authors declare no conflict of interest.
Appendix A
The following tables are included in the Appendix-tables.pdf file:
- Table A1. - Weighted average calculation results for the FTP dataset
- Table A2. - Weighted average calculation results for the SSH dataset
- Table A3. - Weighted average calculation results for the SQL dataset
- Table A4. - Weighted average calculation results for the XSS dataset
- Table A5. - Weighted average calculation results for the WEB dataset
References
- Honest, N. A survey on Feature Selection Techniques. GIS Sci. J 2020, 7, 353–358. [Google Scholar]
- Bolón-Canedo, V.; Alonso-Betanzos, A. Ensembles for feature selection: A review and future trends. Information Fusion 2019, 52, 1–12. [Google Scholar] [CrossRef]
- Manonmani, M.; Balakrishnan, S. An ensemble feature selection method for prediction of CKD. 2020 International Conference on Computer Communication and Informatics (ICCCI). IEEE, 2020, pp. 1–6.
- Hashemi, A.; Dowlatshahi, M.B.; Nezamabadi-pour, H. Ensemble of feature selection algorithms: a multi-criteria decision-making approach. International Journal of Machine Learning and Cybernetics 2022, 13, 49–69. [Google Scholar] [CrossRef]
- Hoque, N.; Singh, M.; Bhattacharyya, D.K. EFS-MI: an ensemble feature selection method for classification: An ensemble feature selection method. Complex & Intelligent Systems 2018, 4, 105–118. [Google Scholar]
- Sumant, A.S.; Patil, D. Ensemble feature subset selection: integration of symmetric uncertainty and chi-square techniques with RReliefF. Journal of The Institution of Engineers (India): Series B 2022, 103, 831–844. [Google Scholar] [CrossRef]
- Tsai, C.F.; Sung, Y.T. Ensemble feature selection in high dimension, low sample size datasets: Parallel and serial combination approaches. Knowledge-Based Systems 2020, 203, 106097. [Google Scholar] [CrossRef]
- Wang, J.; Xu, J.; Zhao, C.; Peng, Y.; Wang, H. An ensemble feature selection method for high-dimensional data based on sort aggregation. Systems Science & Control Engineering 2019, 7, 32–39. [Google Scholar]
- Muhi, K.; Johanyák, Z.C. Dimensionality reduction methods used in Machine Learning. Muszaki Tudományos Közlemények 2020, 13, 148–151. [Google Scholar] [CrossRef]
- Viharos, Z.J.; Kis, K.B.; Fodor, Á.; Büki, M.I. Adaptive, hybrid feature selection (AHFS). Pattern Recognition 2021, 116, 107932. [Google Scholar] [CrossRef]
- Dobján, T.; Antal, E.D. Modern feature extraction methods and learning algorithms in the field of industrial acoustic signal processing. 2017 IEEE 15th International Symposium on Intelligent Systems and Informatics (SISY). IEEE, 2017, pp. 000065–000070. [CrossRef]
- Chauhan, N.S. Decision Tree Algorithm—Explained. https://www.kdnuggets.com/2020/01/decision-tree-algorithm-explained.html/, 2020. KDnuggets,[Online]. Available: [Accessed ]. 16 April.
- Bolón-Canedo, V.; Sánchez-Maroño, N.; Alonso-Betanzos, A. Feature selection for high-dimensional data; Springer, 2015.
- Priyadarsini, R.P.; Valarmathi, M.; Sivakumari, S. Gain ratio based feature selection method for privacy preservation. ICTACT Journal on soft computing 2011, 1, 201–205. [Google Scholar]
- Liu, H.; Setiono, R. Chi2: Feature selection and discretization of numeric attributes. Proceedings of 7th IEEE international conference on tools with artificial intelligence. IEEE, 1995, pp. 388–391.
- Singh, B.; Kushwaha, N.; Vyas, O.P.; others. A feature subset selection technique for high dimensional data using symmetric uncertainty. Journal of Data Analysis and Information Processing 2014, 2, 95. [Google Scholar] [CrossRef]
- Urbanowicz, R.J.; Meeker, M.; La Cava, W.; Olson, R.S.; Moore, J.H. Relief-based feature selection: Introduction and review. Journal of biomedical informatics 2018, 85, 189–203. [Google Scholar] [CrossRef] [PubMed]
- Nasiri, H.; Alavi, S.A.; others. A novel framework based on deep learning and ANOVA feature selection method for diagnosis of COVID-19 cases from chest X-ray images. Computational intelligence and neuroscience 2022, 2022. [Google Scholar] [CrossRef] [PubMed]
- Freddi, A.; Salmon, M.; Freddi, A.; Salmon, M. Introduction to the Taguchi method. Design principles and methodologies: from conceptualization to first prototyping with examples and case studies, 2019; 159–180. [Google Scholar]
- Charbuty, B.; Abdulazeez, A. Classification based on decision tree algorithm for machine learning. Journal of Applied Science and Technology Trends 2021, 2, 20–28. [Google Scholar] [CrossRef]
- Breiman, L. Random forests. Machine learning 2001, 45, 5–32. [Google Scholar] [CrossRef]
- Steinwart, I.; Christmann, A. Support vector machines, 1st ed ed.; Information science and statistics, Springer: New York, 2008. [Google Scholar]
- Basnet, R.B.; Shash, R.; Johnson, C.; Walgren, L.; Doleck, T. Towards Detecting and Classifying Network Intrusion Traffic Using Deep Learning Frameworks. J. Internet Serv. Inf. Secur. 2019, 9, 1–17. [Google Scholar]
- Lashkari, A.H.; Draper-Gil, G.; Mamun, M.S.I.; Ghorbani, A.A. ; others. Characterization of tor traffic using time based features. ICISSP 2017. [CrossRef]
- L. Göcs, Johanyák, Z.C. Feature selection and classification of the CSE-CIC-IDS2018 dataset for the development of a Network Intrusion Detection System. IOS Press - Intelligent Data Analysis, 2023.
- Borlea, I.D.; Precup, R.E.; Borlea, A.B.; Iercan, D. A unified form of fuzzy C-means and K-means algorithms and its partitional implementation. Knowledge-Based Systems 2021, 214, 106731. [Google Scholar] [CrossRef]
- Blažič, S.; Škrjanc, I. Incremental fuzzy c-regression clustering from streaming data for local-model-network identification. IEEE transactions on fuzzy systems 2019, 28, 758–767. [Google Scholar] [CrossRef]
- Hvizdoš, J.; Vaščák, J.; Brezina, A. Object identification and localization by smart floors. 2015 IEEE 19th International Conference on Intelligent Engineering Systems (INES). IEEE, 2015, pp. 113–117. [CrossRef]
Figure 1.
The steps of the experimental.
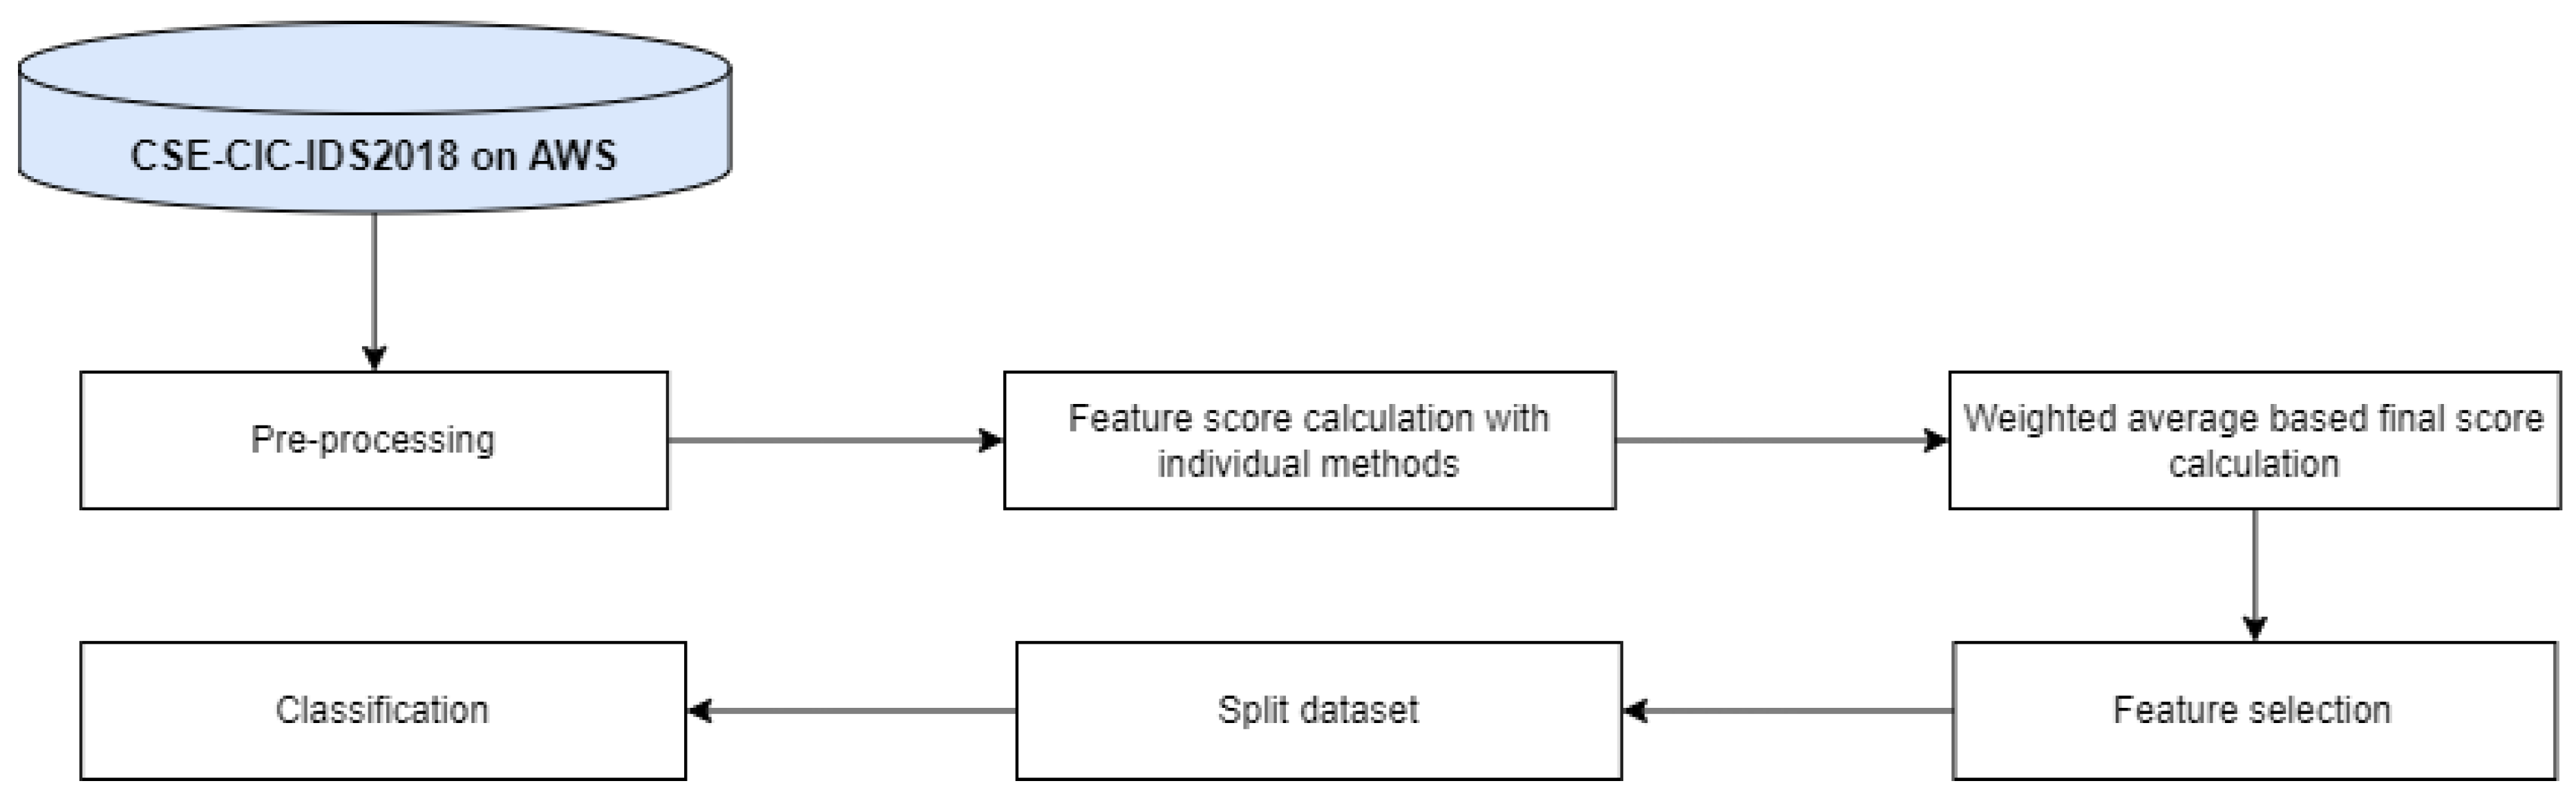

Table 1.
design with coded units
| 1 | 1 | 1 | 1 | 1 | 1 | 1 |
| 2 | 1 | 1 | 1 | 2 | 2 | 2 |
| 3 | 1 | 2 | 2 | 1 | 1 | 2 |
| 4 | 1 | 2 | 2 | 2 | 2 | 1 |
| 5 | 2 | 1 | 2 | 1 | 2 | 1 |
| 6 | 2 | 1 | 2 | 2 | 1 | 2 |
| 7 | 2 | 2 | 1 | 1 | 2 | 2 |
| 8 | 2 | 2 | 1 | 2 | 1 | 1 |
Table 2.
Results for the FTP dataset
| Dataset | Average Type | Features | Classifier | Accuracy | Precision | Recall | F1 |
|---|---|---|---|---|---|---|---|
| ]6*train | simple | 8 | Decision Tree | 1.00000 | 1.00000 | 1.00000 | 1.00000 |
| weighted | 5 | Decision Tree | 0.99999 | 0.99997 | 1.00000 | 0.99999 | |
| simple | 8 | Random Forest | 1.00000 | 1.00000 | 1.00000 | 1.00000 | |
| weighted | 5 | Random Forest | 1.00000 | 1.00000 | 1.00000 | 1.00000 | |
| simple | 8 | SVM | 0.99973 | 0.99881 | 1.00000 | 0.99941 | |
| weighted | 5 | SVM | 0.99990 | 0.99956 | 1.00000 | 0.99978 | |
| test | simple | 8 | Decision Tree | 0.99999 | 0.99995 | 1.00000 | 0.99997 |
| weighted | 5 | Decision Tree | 0.99997 | 0.99995 | 0.99990 | 0.99992 | |
| simple | 8 | Random Forest | 1.00000 | 1.00000 | 1.00000 | 1.00000 | |
| weighted | 5 | Random Forest | 1.00000 | 1.00000 | 1.00000 | 1.00000 | |
| simple | 8 | SVM | 0.99973 | 0.99881 | 1.00000 | 0.99941 | |
| weighted | 5 | SVM | 0.99988 | 0.99948 | 1.00000 | 0.99974 |
Table 3.
Results for the SSH dataset
| Dataset | Average Type | Features | Classifier | Accuracy | Precision | Recall | F1 |
|---|---|---|---|---|---|---|---|
| ]6*train | simple | 7 | Decision Tree | 0.99999 | 0.99997 | 1.00000 | 0.99999 |
| weighted | 6 | Decision Tree | 0.99999 | 0.99997 | 1.00000 | 0.99999 | |
| simple | 7 | Random Forest | 0.99999 | 0.99997 | 1.00000 | 0.99999 | |
| weighted | 6 | Random Forest | 1.00000 | 1.00000 | 1.00000 | 1.00000 | |
| simple | 7 | SVM | 0.99979 | 0.99928 | 0.99979 | 0.99953 | |
| weighted | 6 | SVM | 0.99993 | 0.99989 | 0.99979 | 0.99984 | |
| test | simple | 7 | Decision Tree | 1.00000 | 1.00000 | 1.00000 | 1.00000 |
| weighted | 6 | Decision Tree | 0.99996 | 0.99984 | 1.00000 | 0.99992 | |
| simple | 7 | Random Forest | 0.99999 | 0.99995 | 1.00000 | 0.99997 | |
| weighted | 6 | Random Forest | 0.99996 | 0.99984 | 1.00000 | 0.99992 | |
| simple | 7 | SVM | 0.99985 | 0.99947 | 0.99984 | 0.99965 | |
| weighted | 6 | SVM | 0.99996 | 1.00000 | 0.99984 | 0.99992 |
Table 4.
Results for the SQL dataset
| Dataset | Average Type | Features | Classifier | Accuracy | Precision | Recall | F1 |
|---|---|---|---|---|---|---|---|
| ]6*train | simple | 26 | Decision Tree | 0.99999 | 1.00000 | 0.95402 | 0.97647 |
| weighted | 7 | Decision Tree | 0.99999 | 1.00000 | 0.95402 | 0.97647 | |
| simple | 26 | Random Forest | 0.99998 | 1.00000 | 0.91954 | 0.95808 | |
| weighted | 7 | Random Forest | 0.99999 | 1.00000 | 0.96552 | 0.98246 | |
| simple | 26 | SVM | 0.99987 | 1.00000 | 0.37931 | 0.55000 | |
| weighted | 7 | SVM | 0.99988 | 0.99988 | 0.99988 | 0.99986 | |
| test | simple | 26 | Decision Tree | 0.99998 | 1.00000 | 0.95402 | 0.97647 |
| weighted | 7 | Decision Tree | 0.99999 | 0.98824 | 0.96552 | 0.97674 | |
| simple | 26 | Random Forest | 0.99997 | 1.00000 | 0.91954 | 0.95808 | |
| weighted | 7 | Random Forest | 1.00000 | 1.00000 | 0.97701 | 0.98837 | |
| simple | 26 | SVM | 0.99974 | 1.00000 | 0.37931 | 0.55000 | |
| weighted | 7 | SVM | 0.99977 | 0.99977 | 0.99977 | 0.99972 |
Table 5.
Results for the XSS dataset
| Dataset | Average Type | Features | Classifier | Accuracy | Precision | Recall | F1 |
|---|---|---|---|---|---|---|---|
| ]6*train | simple | 10 | Decision Tree | 0.99998 | 1.00000 | 0.96957 | 0.98455 |
| weighted | 2 | Decision Tree | 0.99994 | 0.93966 | 0.94783 | 0.94372 | |
| simple | 10 | Random Forest | 0.99999 | 1.00000 | 0.97391 | 0.98678 | |
| weighted | 2 | Random Forest | 0.99995 | 0.95217 | 0.95217 | 0.95217 | |
| simple | 10 | SVM | 0.37911 | 0.00046 | 0.51304 | 0.00091 | |
| weighted | 2 | SVM | 0.99945 | 0.99890 | 0.99945 | 0.99917 | |
| test | simple | 10 | Decision Tree | 0.99996 | 0.99554 | 0.96957 | 0.98238 |
| weighted | 2 | Decision Tree | 0.99992 | 0.98198 | 0.94783 | 0.96460 | |
| simple | 10 | Random Forest | 0.99997 | 0.99556 | 0.97391 | 0.98462 | |
| weighted | 2 | Random Forest | 0.99993 | 0.98206 | 0.95217 | 0.96689 | |
| simple | 10 | SVM | 0.37972 | 0.00091 | 0.51304 | 0.00182 | |
| weighted | 2 | SVM | 0.99890 | 0.99780 | 0.99890 | 0.99835 |
Table 6.
Results for the WEB dataset
| Dataset | Average Type | Features | Classifier | Accuracy | Precision | Recall | F1 |
|---|---|---|---|---|---|---|---|
| ]6*train | simple | 44 | Decision Tree | 0.99994 | 0.98997 | 0.96890 | 0.97932 |
| weighted | 13 | Decision Tree | 0.99978 | 0.97967 | 0.86743 | 0.92014 | |
| simple | 44 | Random Forest | 0.99963 | 0.99142 | 0.75614 | 0.85794 | |
| weighted | 13 | Random Forest | 0.99963 | 1.00000 | 0.74468 | 0.85366 | |
| simple | 44 | SVM | 0.32725 | 0.00077 | 0.35516 | 0.00154 | |
| weighted | 13 | SVM | 0.99886 | 0.99886 | 0.99886 | 0.99849 | |
| test | simple | 44 | Decision Tree | 0.99972 | 0.93819 | 0.96890 | 0.95330 |
| weighted | 13 | Decision Tree | 0.99948 | 0.94982 | 0.86743 | 0.90676 | |
| simple | 44 | Random Forest | 0.99928 | 0.99784 | 0.75614 | 0.86034 | |
| weighted | 13 | Random Forest | 0.99925 | 1.00000 | 0.74468 | 0.85366 | |
| simple | 44 | SVM | 0.32654 | 0.00154 | 0.35516 | 0.00307 | |
| weighted | 13 | SVM | 0.99771 | 0.99772 | 0.99771 | 0.99698 |
Disclaimer/Publisher’s Note: The statements, opinions and data contained in all publications are solely those of the individual author(s) and contributor(s) and not of MDPI and/or the editor(s). MDPI and/or the editor(s) disclaim responsibility for any injury to people or property resulting from any ideas, methods, instructions or products referred to in the content. |
© 2020 by the authors. Licensee MDPI, Basel, Switzerland. This article is an open access article distributed under the terms and conditions of the Creative Commons Attribution (CC BY) license (https://creativecommons.org/licenses/by/4.0/).
Copyright: This open access article is published under a Creative Commons CC BY 4.0 license, which permit the free download, distribution, and reuse, provided that the author and preprint are cited in any reuse.


