Submitted:
10 July 2023
Posted:
10 July 2023
You are already at the latest version
Abstract
Keywords:
1. Introduction
2. Materials and Methods
2.1. Study Design and Sources of Samples
2.2. Isolation, Identification of L. innocua, and Determination of AMR
2.3. Whole-Genome Sequencing, Genomic Analysis, Assembly, and Annotation
2.4. In Silico MLST
2.5. Resistance, and Virulence Profiles
2.6. Construction of the Phylogenetic Tree for L. innocua Isolates and Correlation with Source and Type of Samples
2.7. Data Analysis
3. Results
3.1. Frequency of STs of L. innocua
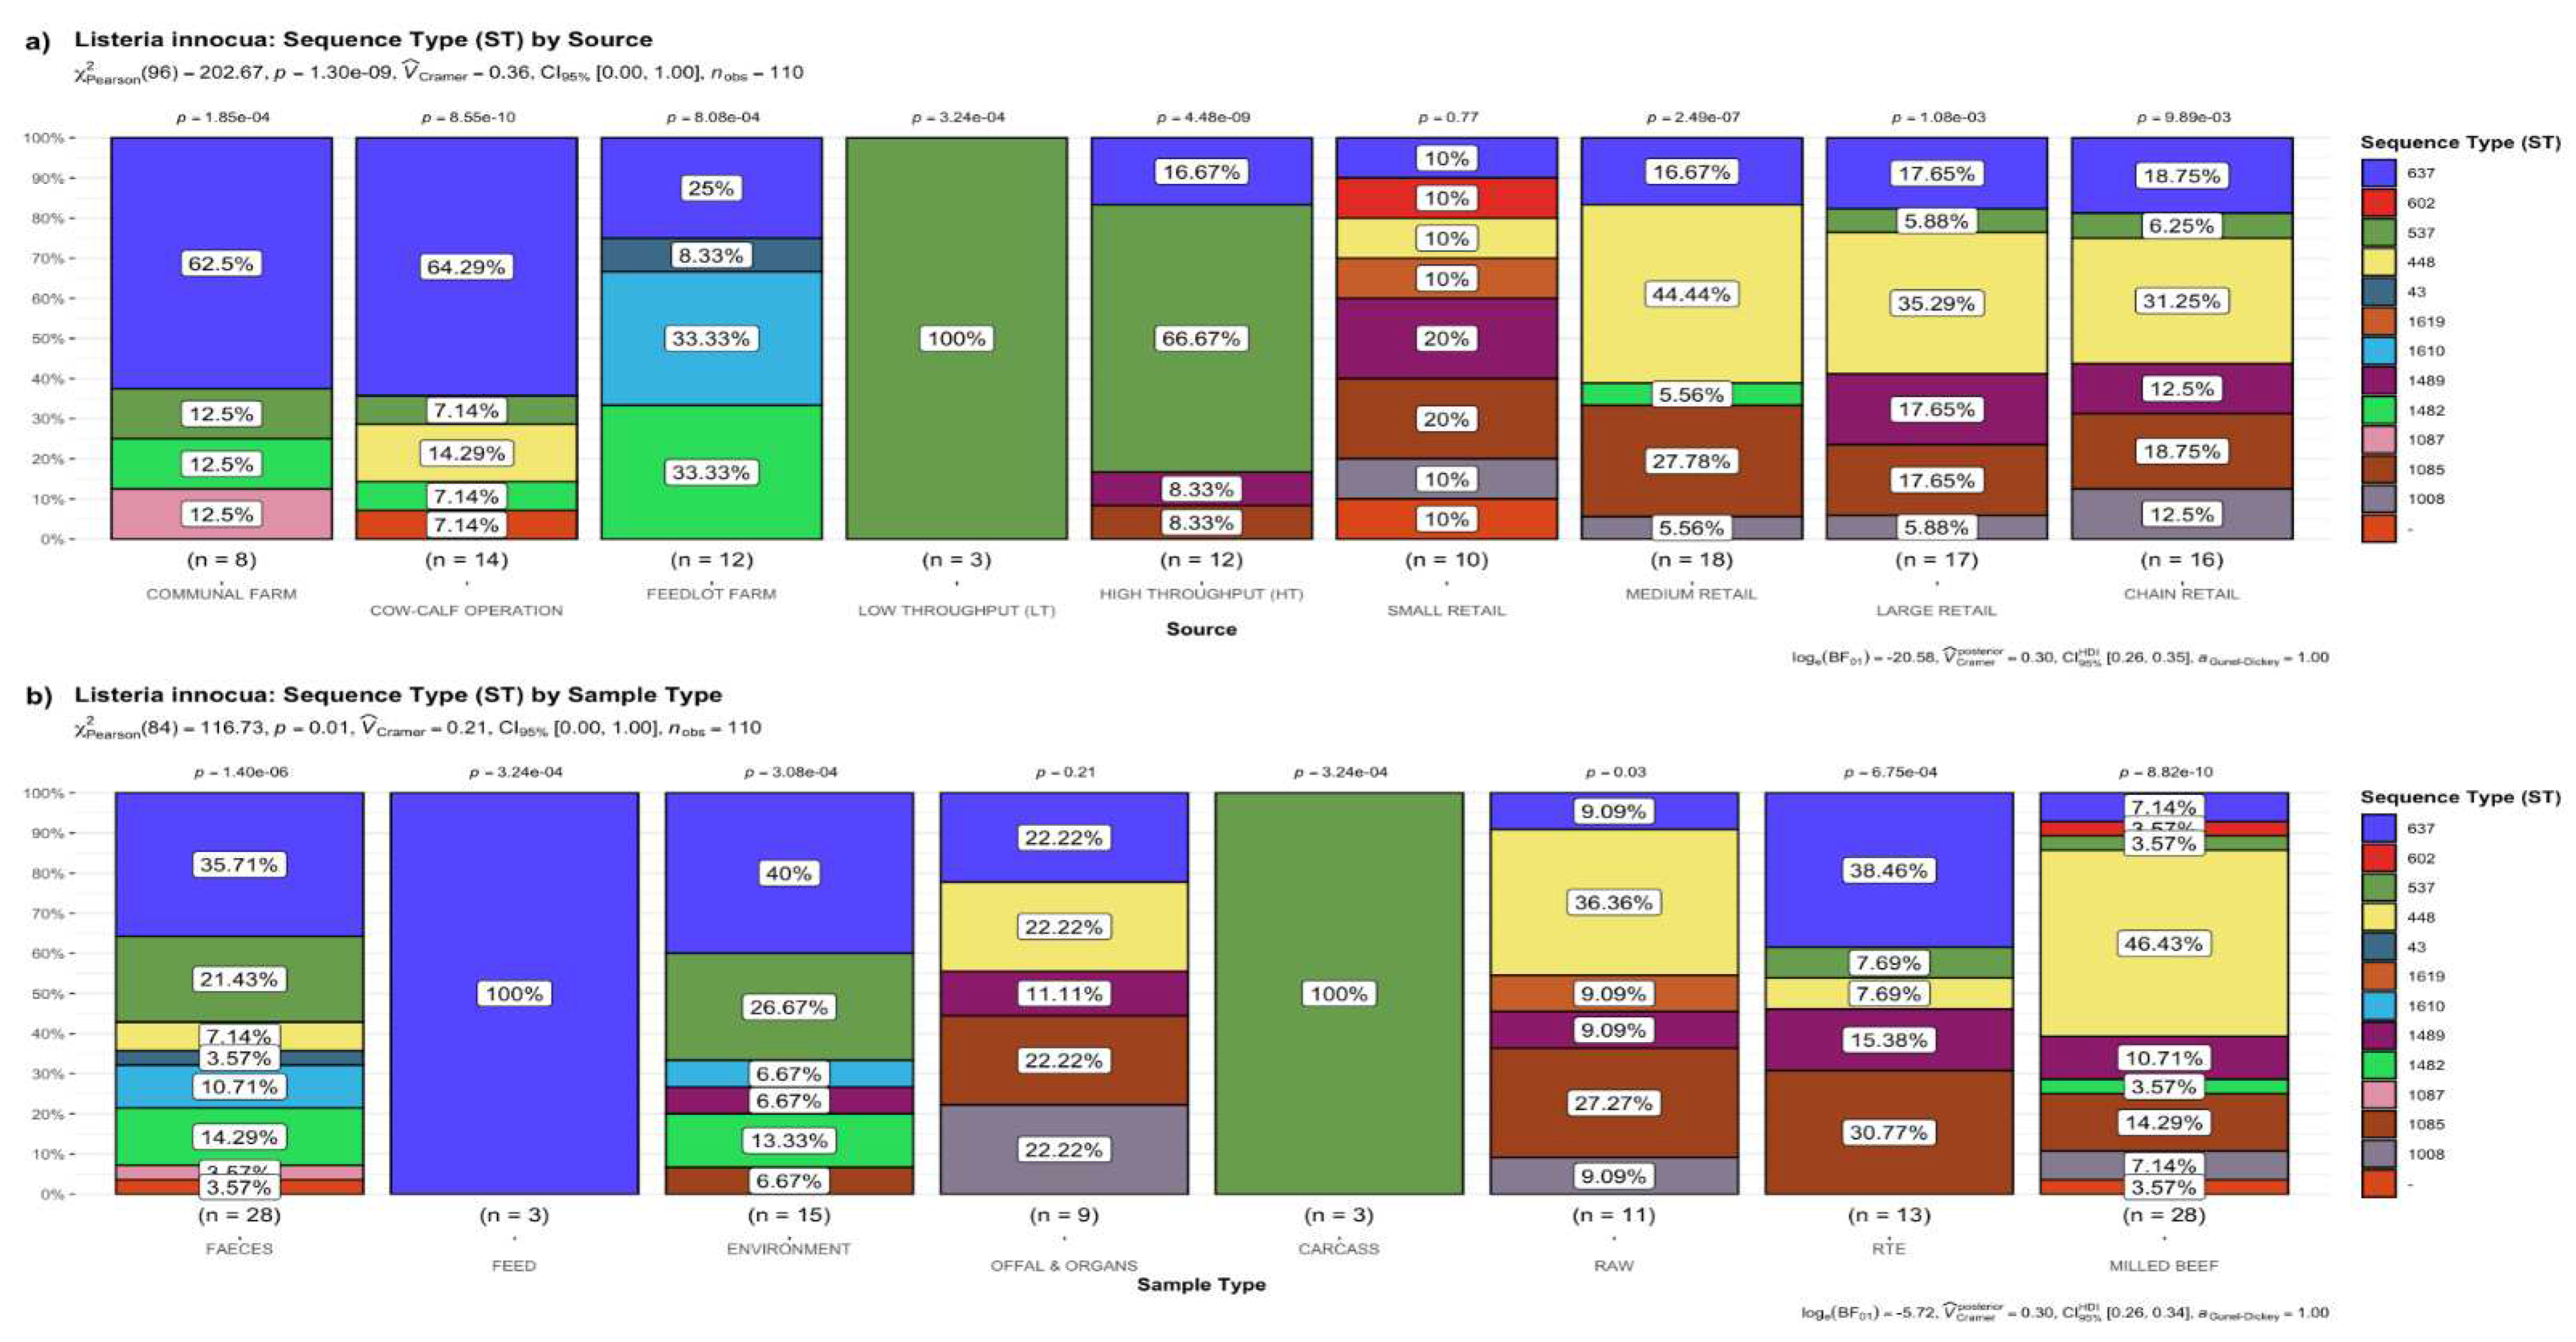
3.1.1. Distribution of STs by the Source of Samples
3.1.2. Distribution of STs by the Type of Sample
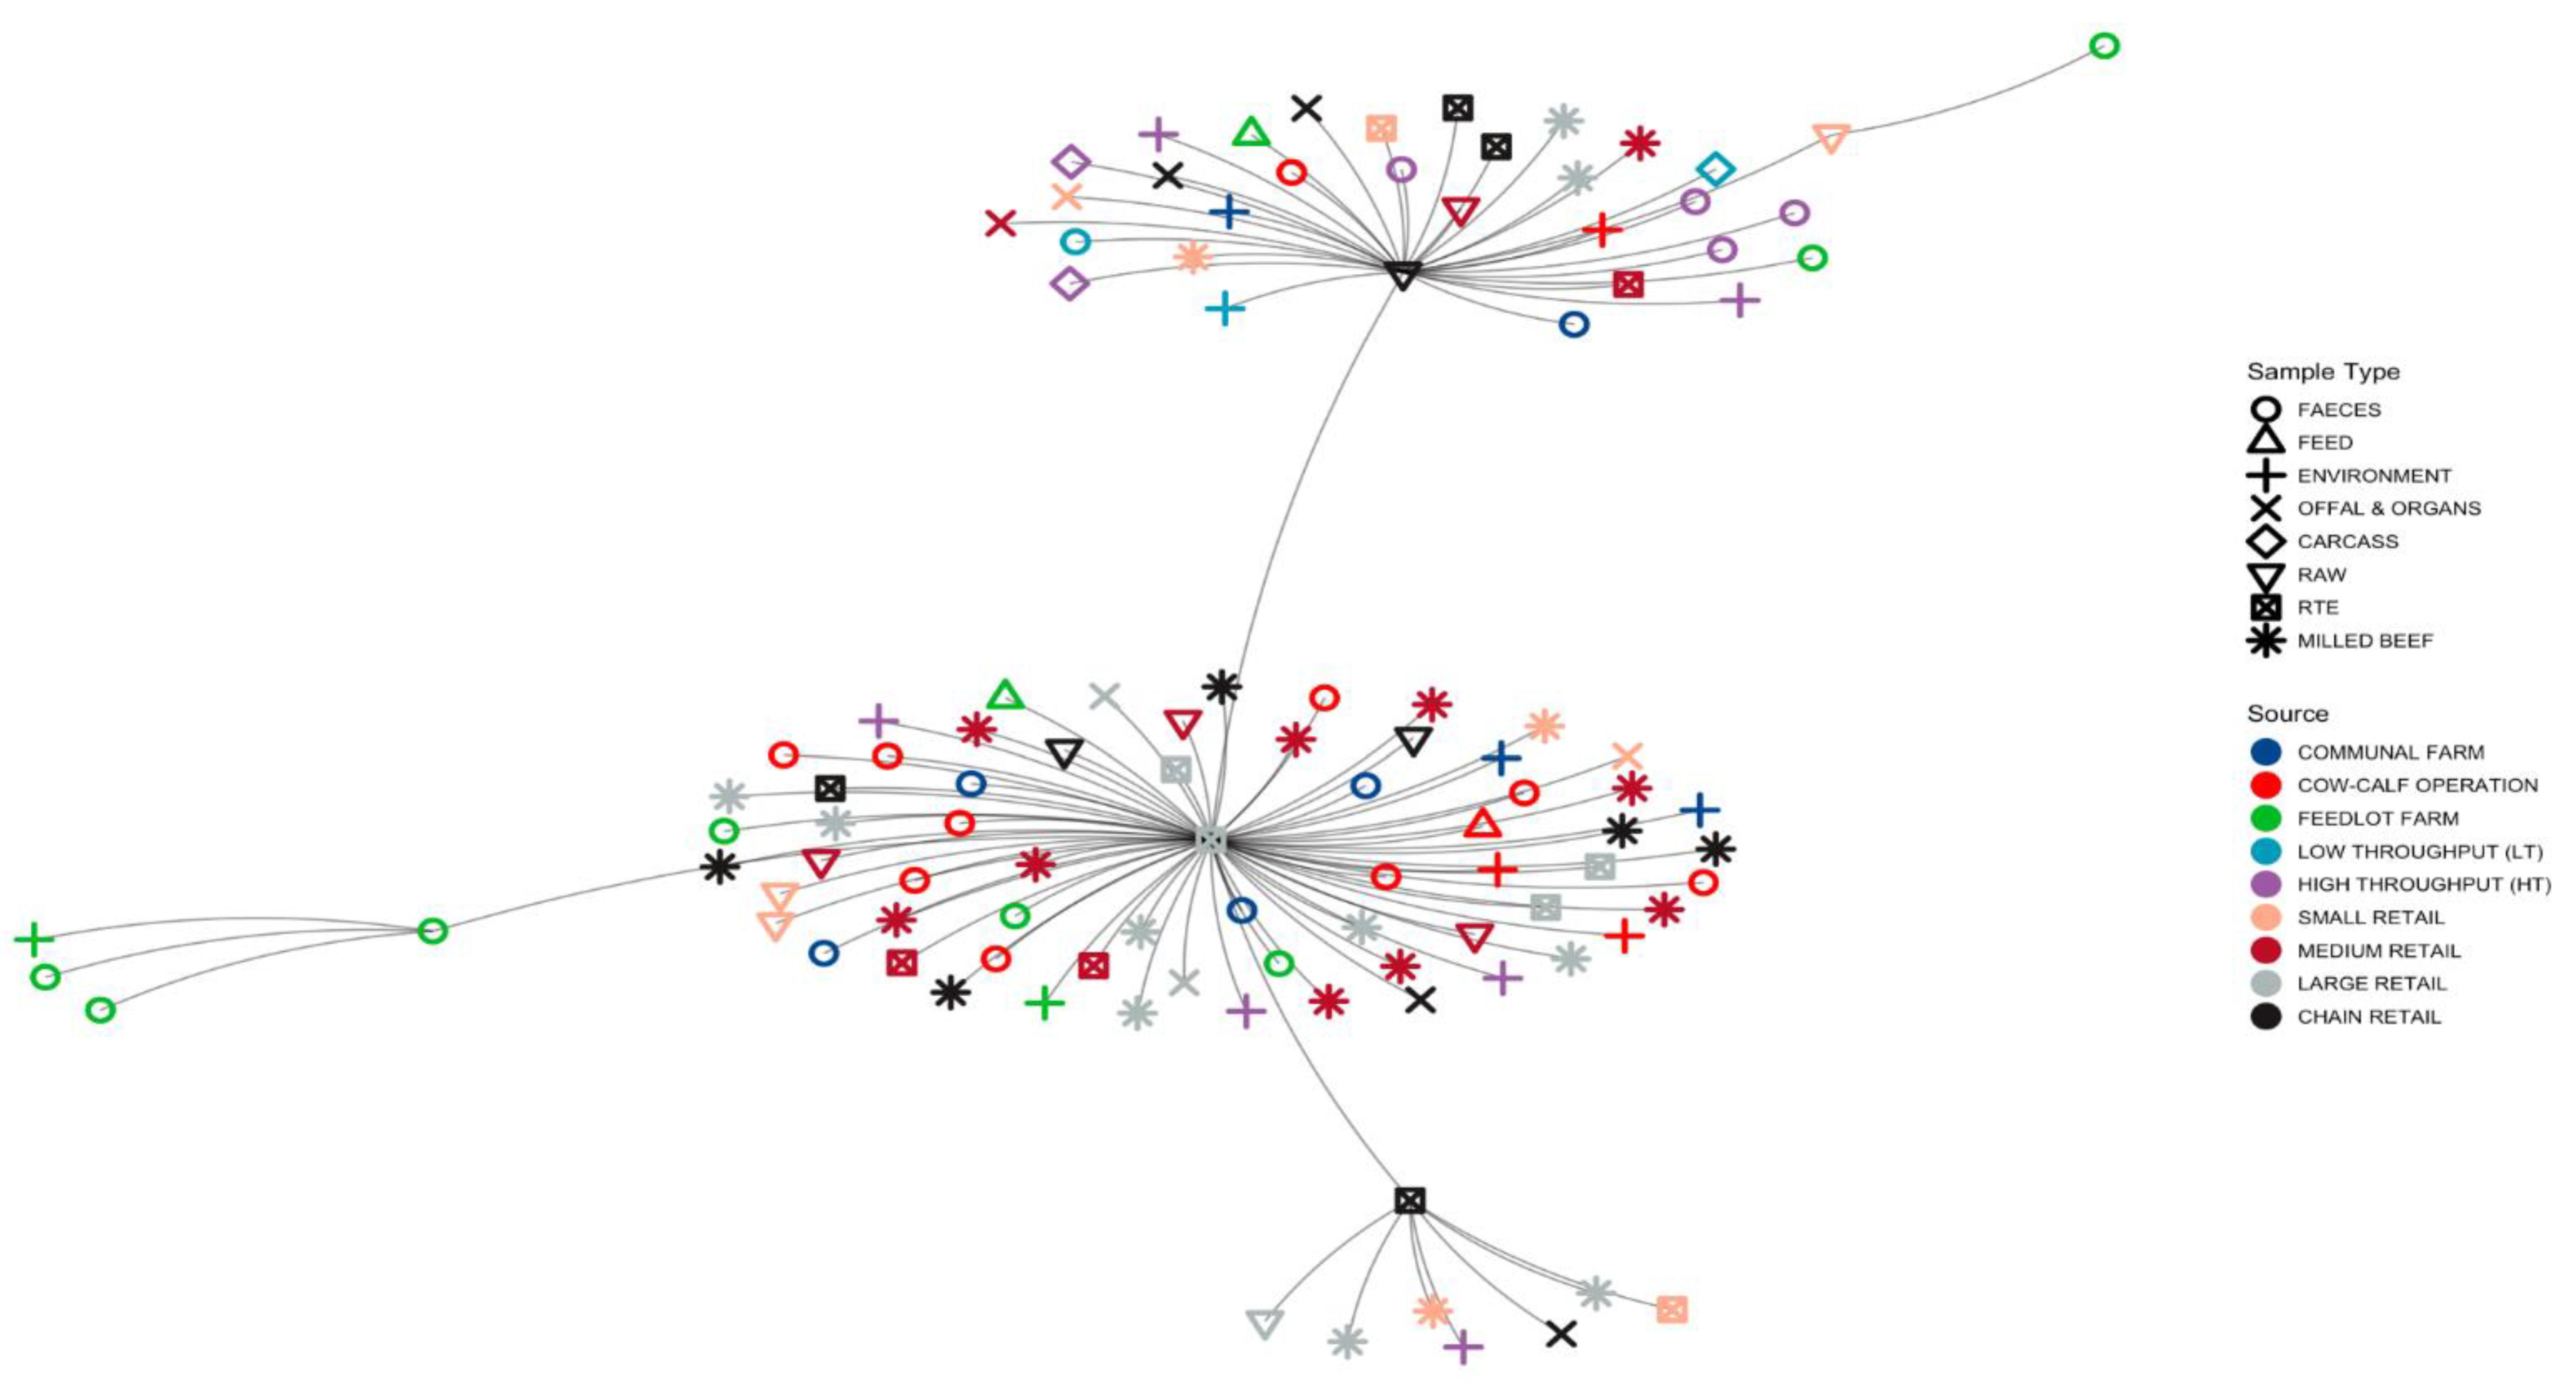
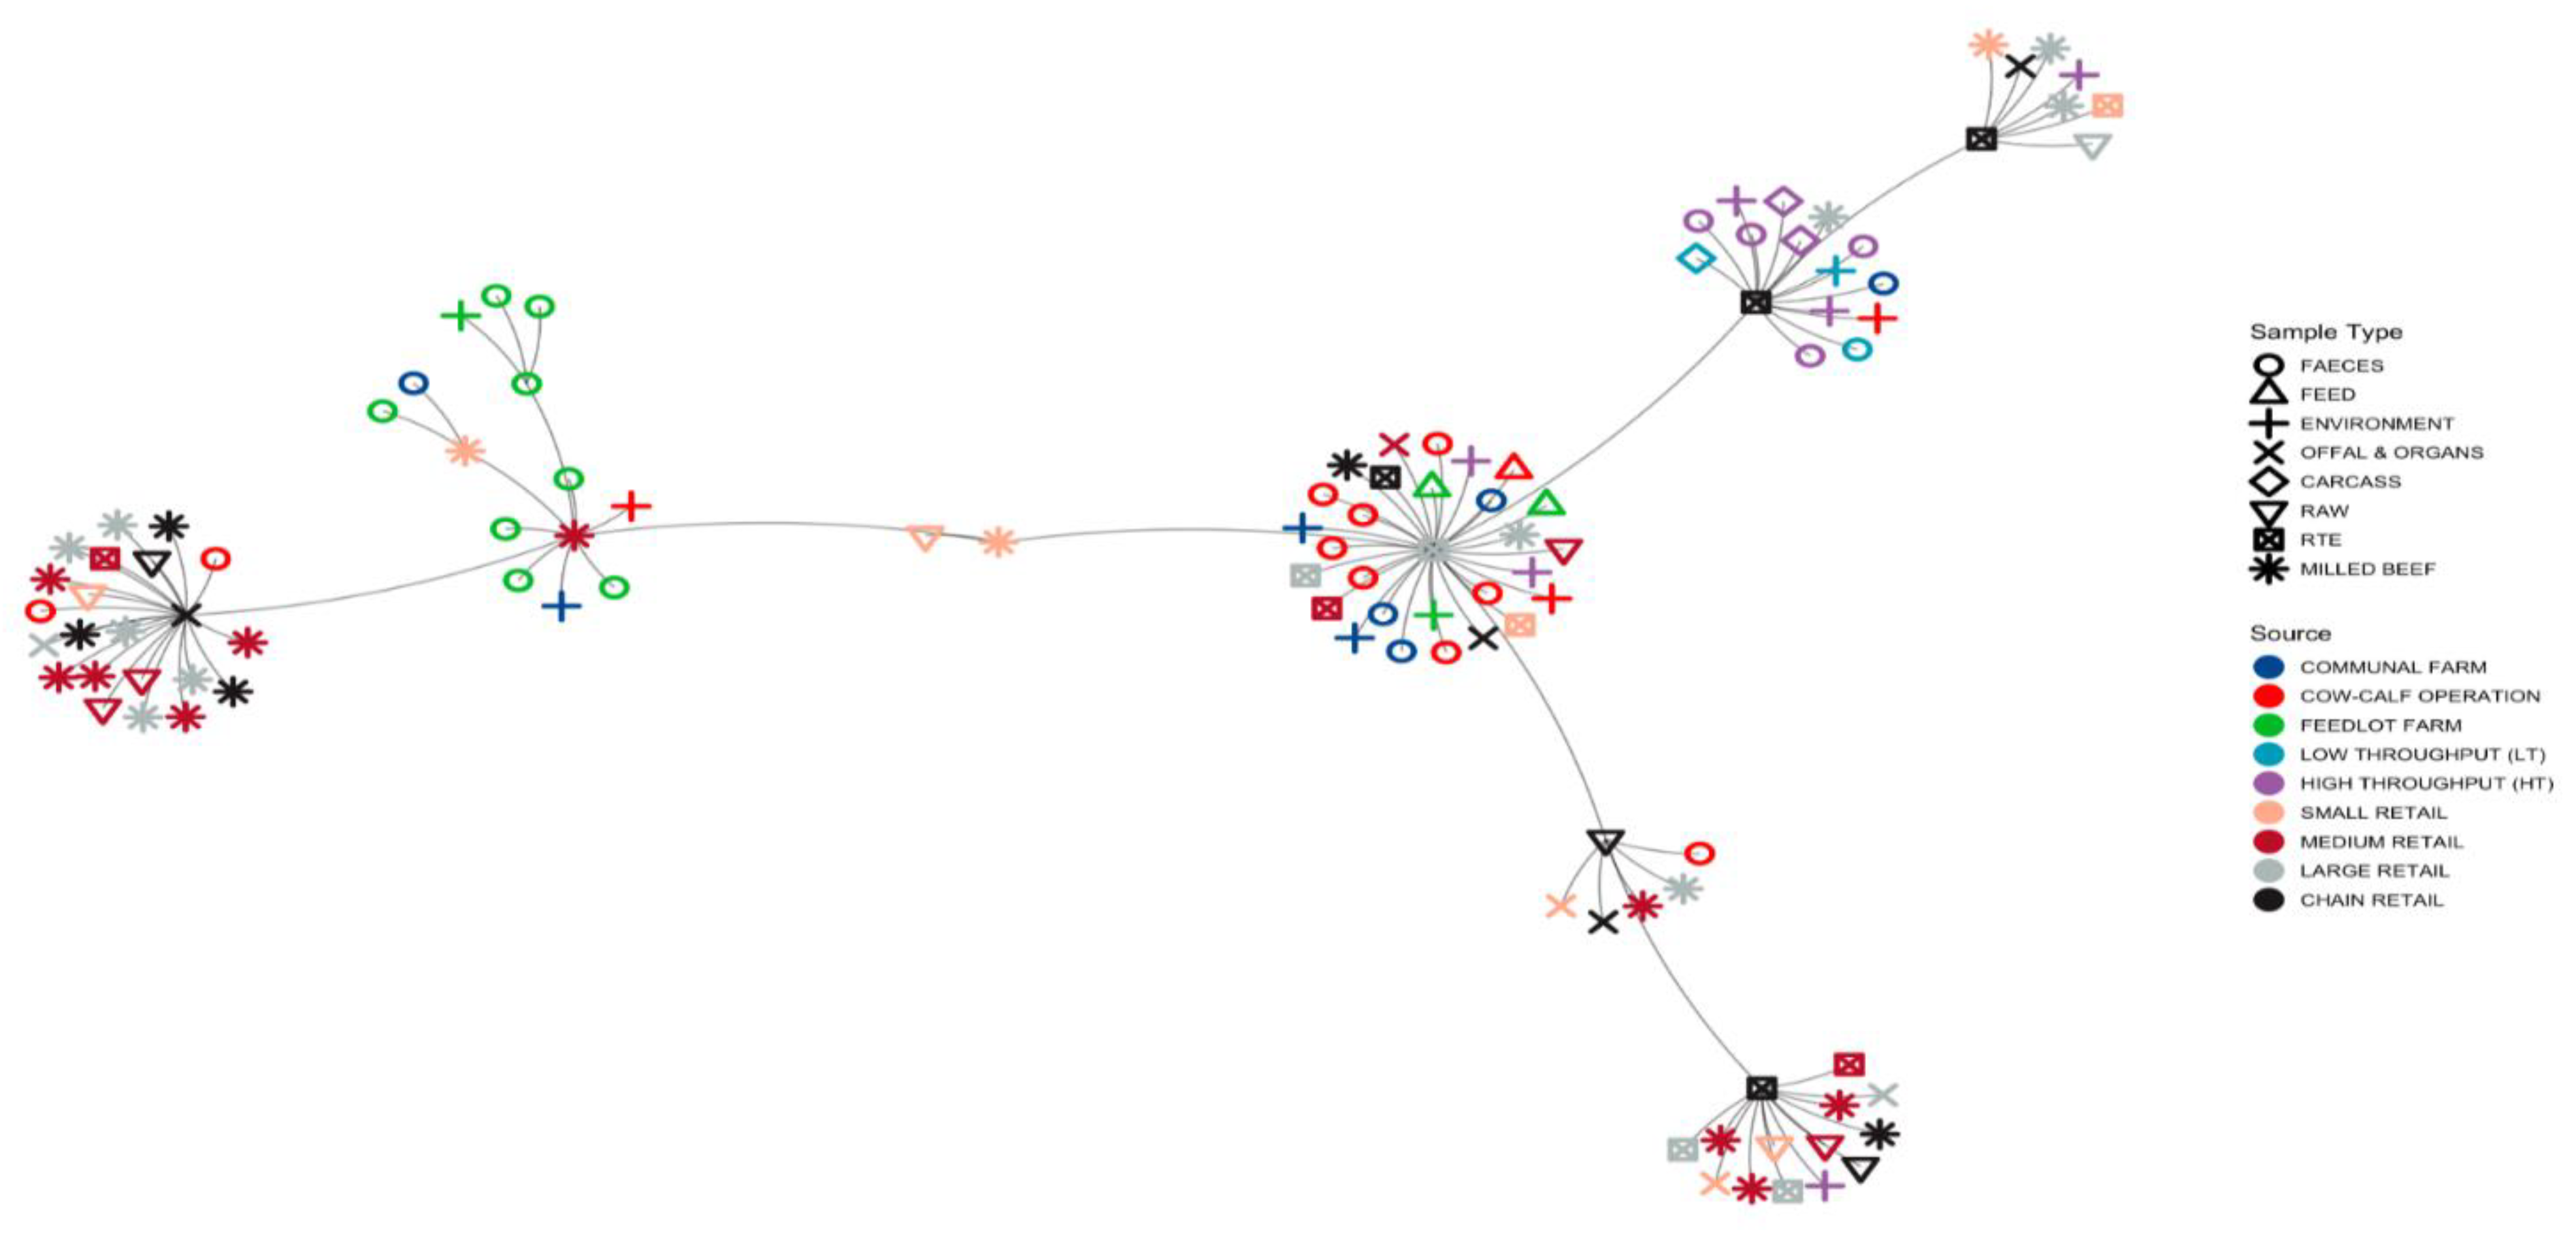
3.1.3. Minimum Spanning Tree (MST) Based on ST Profiles
3.2. Detection of Antimicrobial Resistance Genes in L. innocua
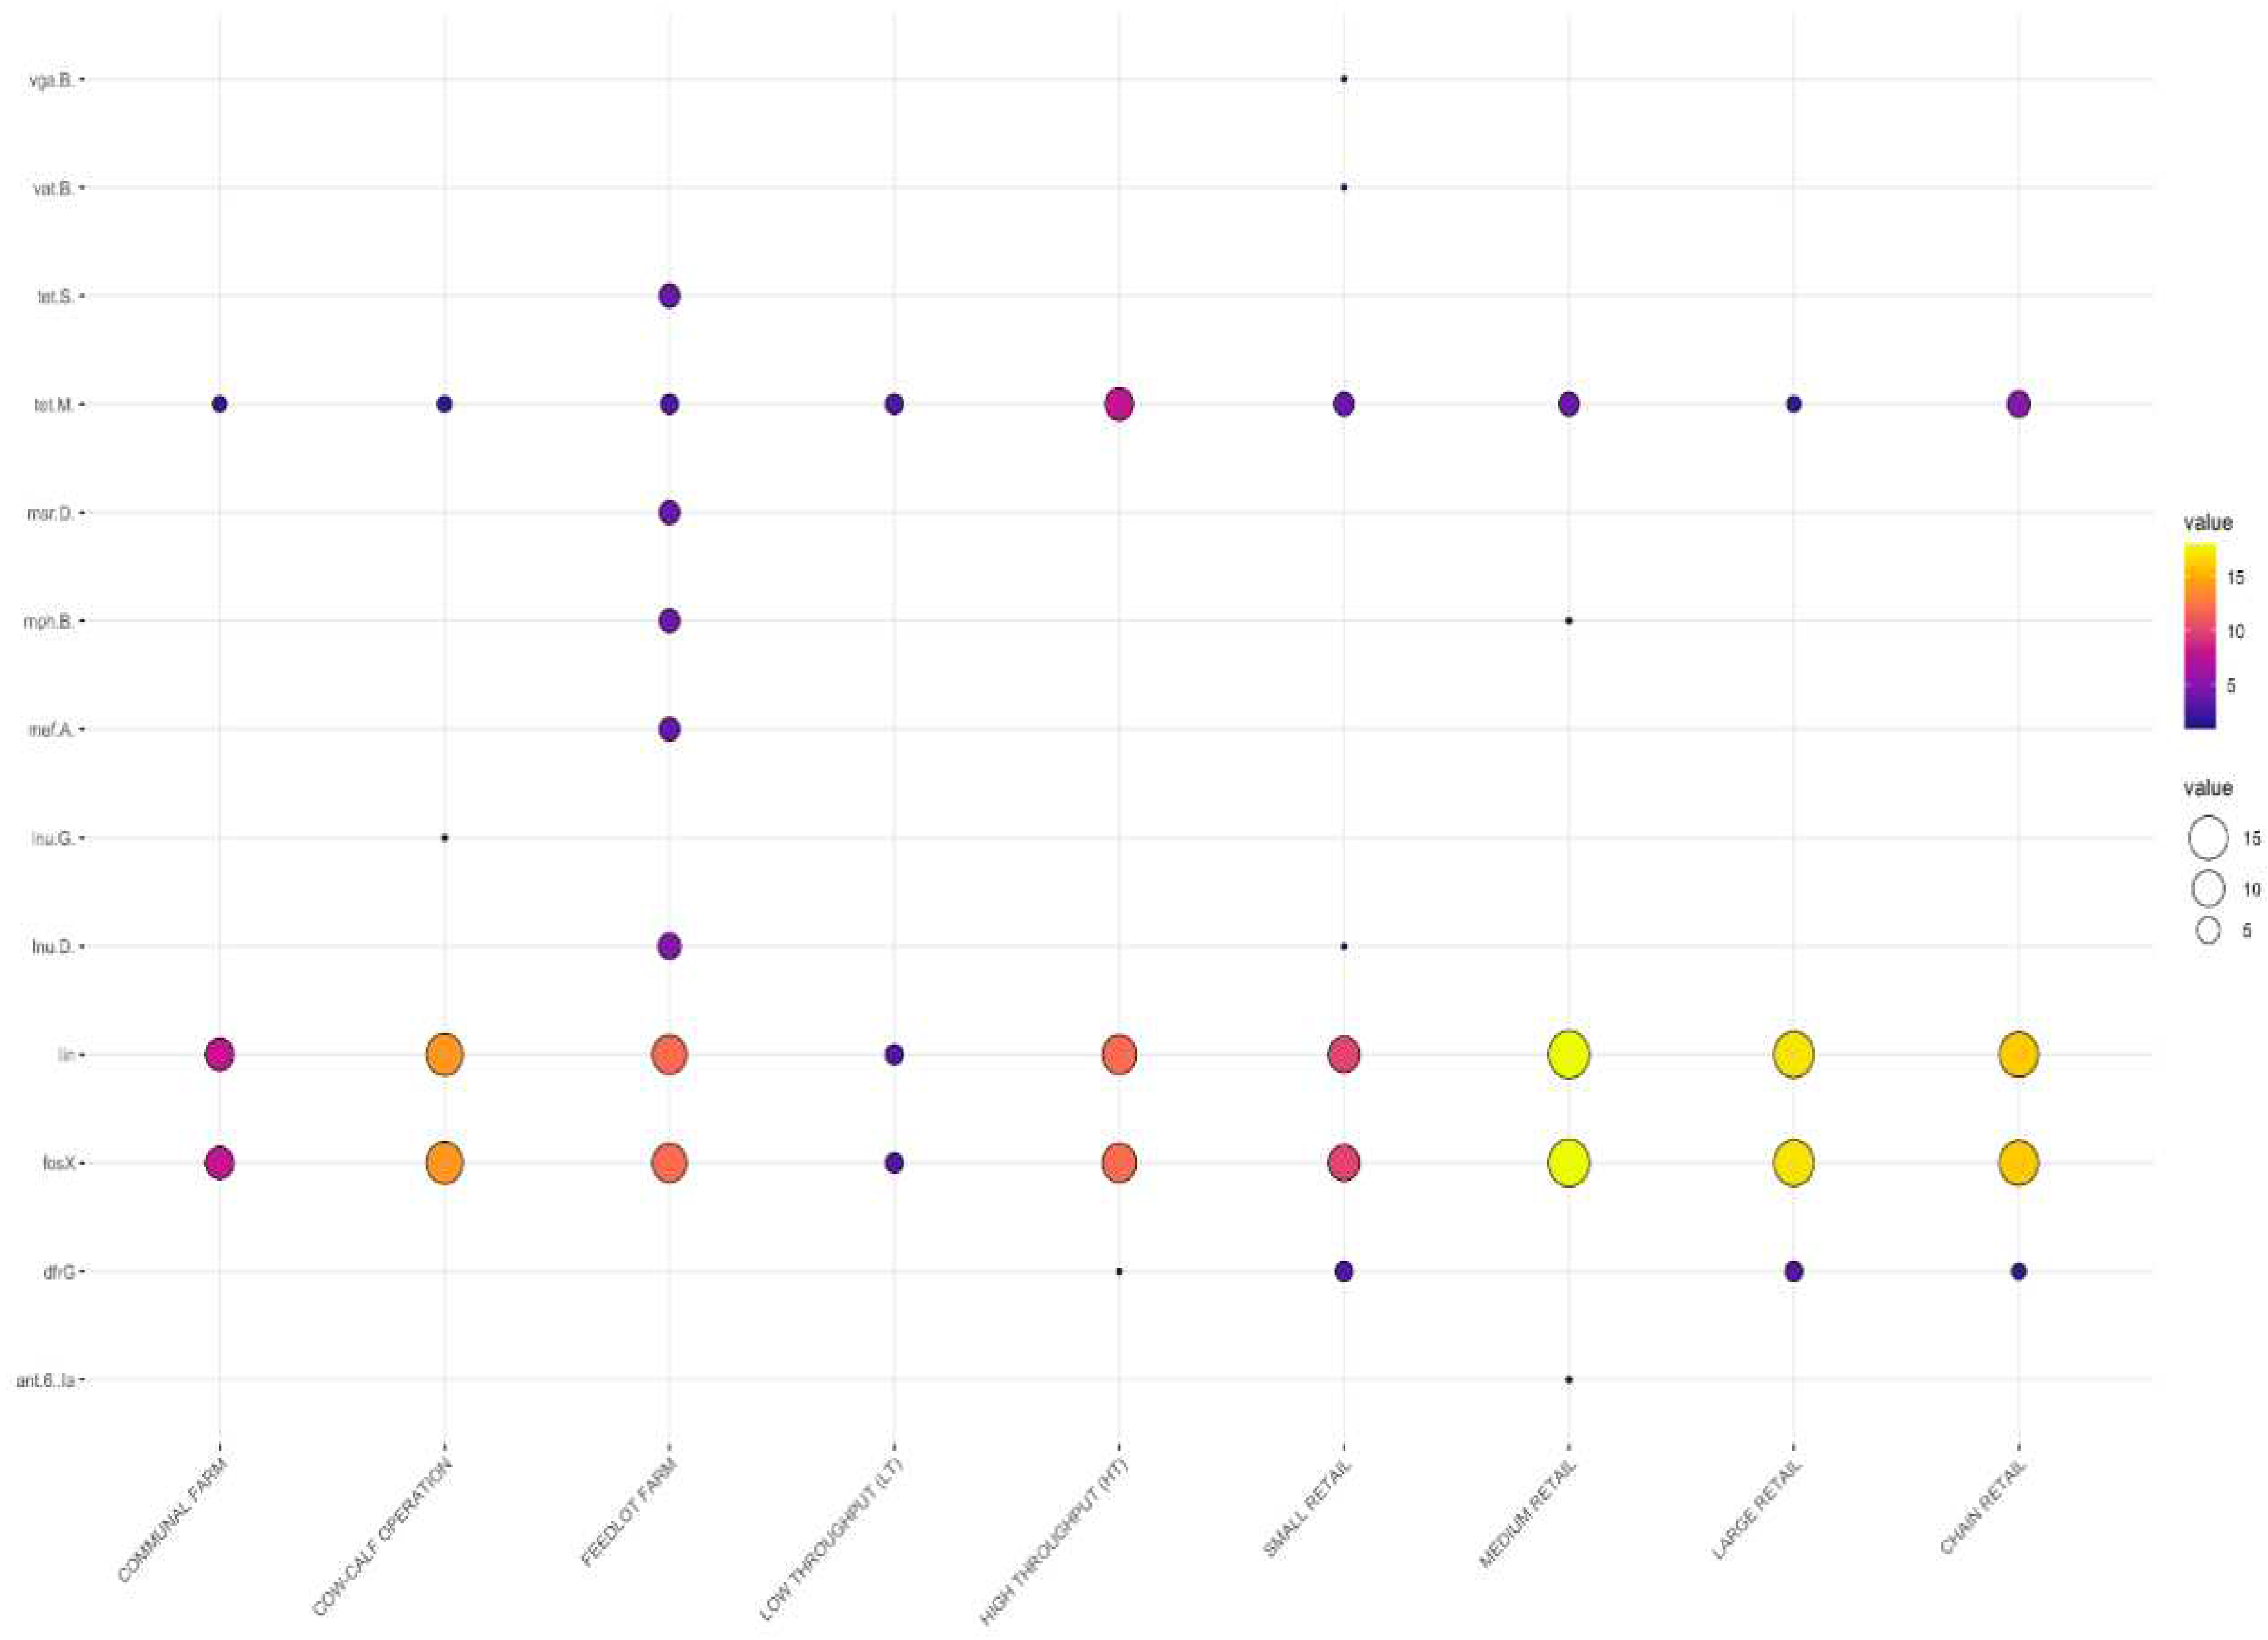
3.2.1. Distribution Frequency of Antimicrobial Resistance Genes by Source
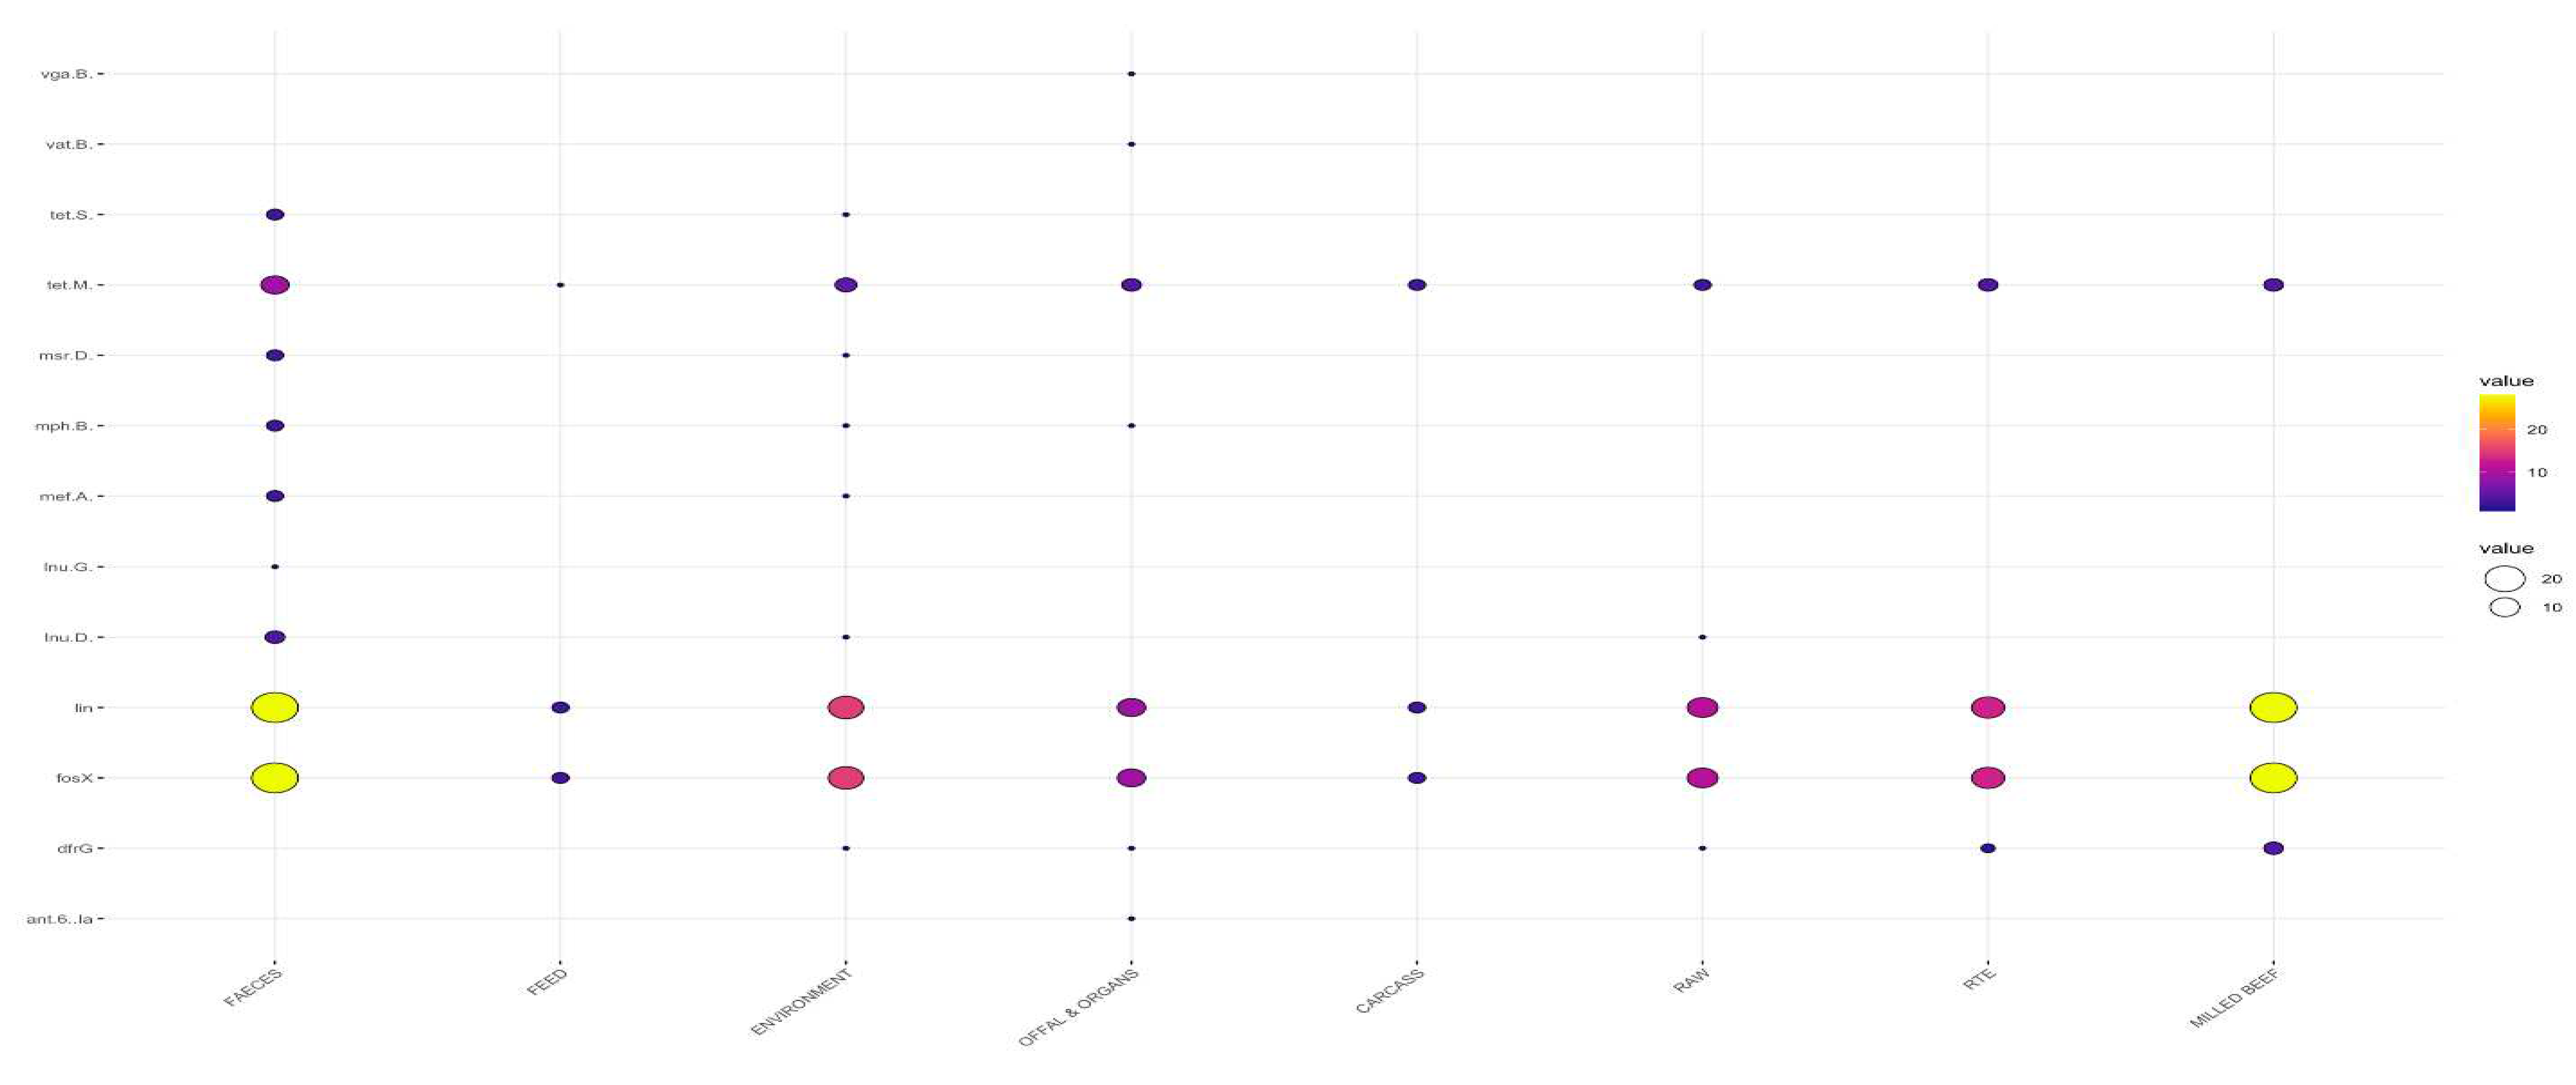
3.2.2. Distribution Frequency of Antimicrobial Resistance Genes by Type of Sample
3.2.3. Patterns of Multiple Antimicrobial Resistance Genes
3.2.4. MST for AMR
3.2.5. Putative Resistance Phenotypes
3.3. Detection of Putative Virulence Genes
3.3.2. Virulence Genes by Sample Type
3.3.3. MST Based on Virulence Gene Profiles
3.4. Distribution of Virulence Genes by Sequence Type
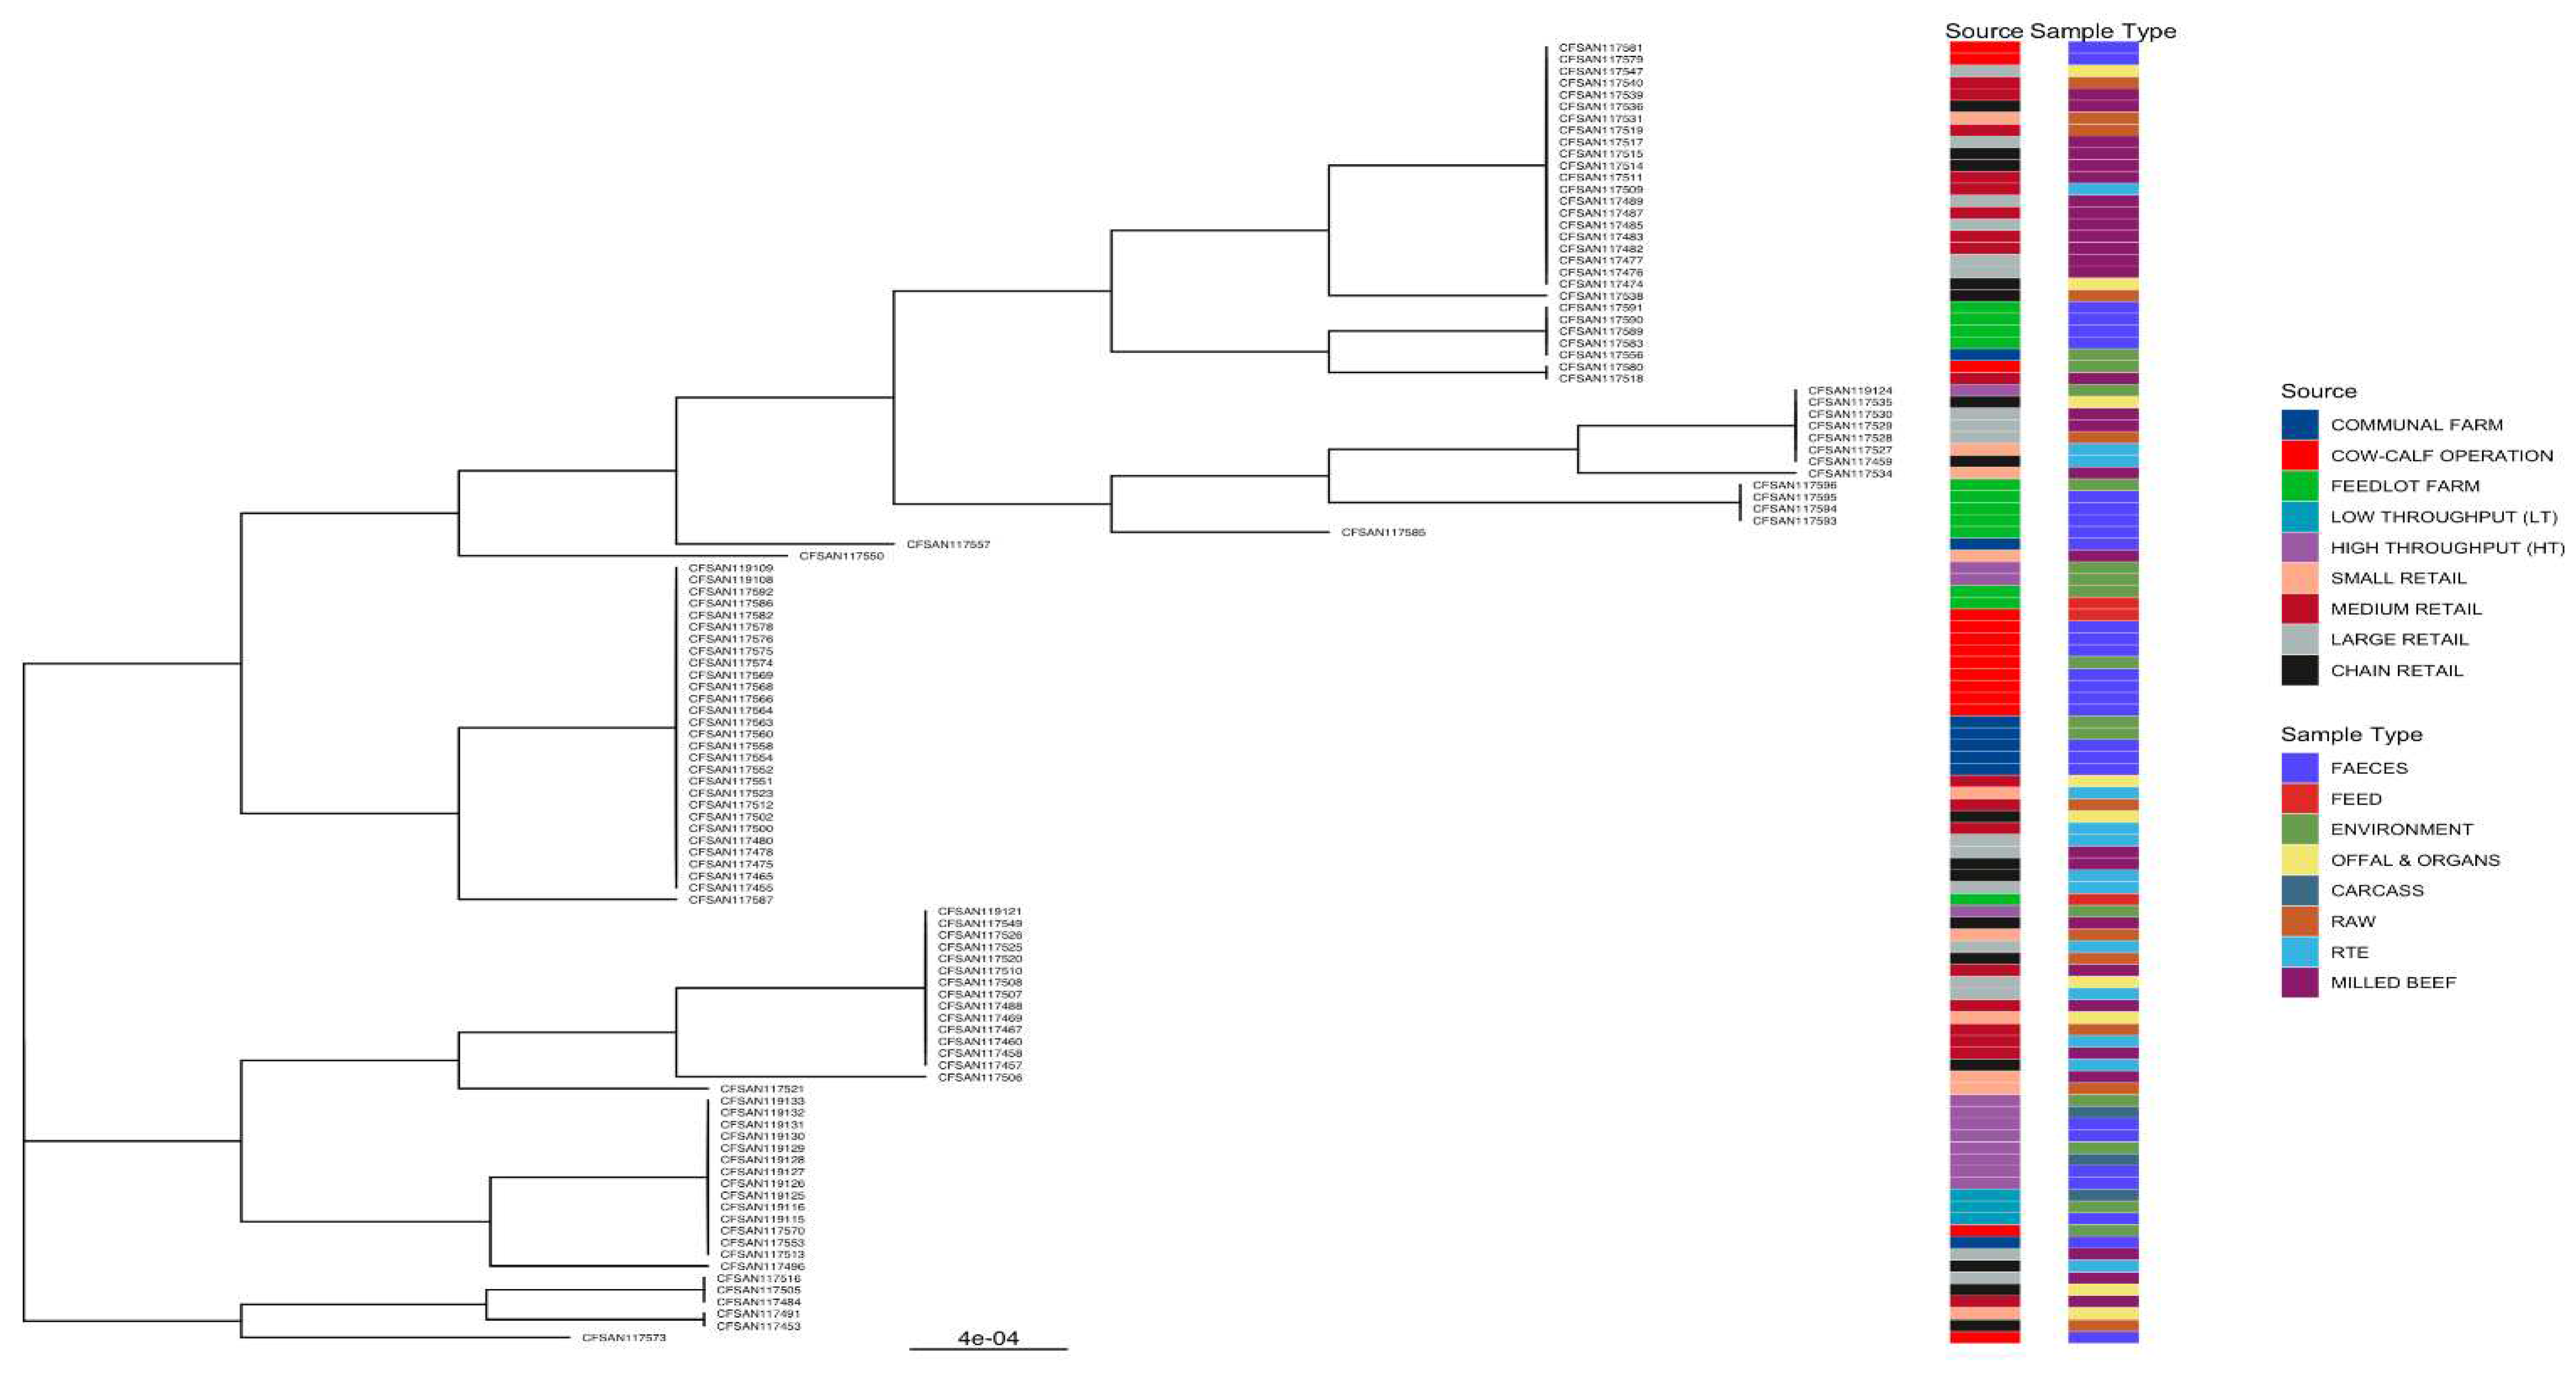
3.5. Phylogenies of L. innocua Isolates According to the STs

4. Discussion
5. Conclusions
Supplementary Materials
Author Contributions
Funding
Institutional Review Board Statement
Data Availability Statement
Acknowledgments
Disclaimer
Conflicts of Interest
References
- Gebretsadik, S., Kassa, T., Alemayehu, H., Huruy, K., and Kebede, N. . Isolation and characterization of Listeria monocytogenes and other Listeria species in foods of animal origin in Addis Ababa, Ethiopia. J Infect Publ Health, 2011 4, 22-29. [CrossRef]
- Carlin, C.R., Liao, J., Weller, D., Guo, X., Orsi, R. and Wiedmann, M. . Listeria cossartiae sp. nov., Listeria immobilis sp. nov., Listeria portnoyi sp. nov. and Listeria rustica sp. nov., isolated from agricultural water and natural environments. Inter J Syst Evolu Microbiol, 2021, 71, 004795.
- Castro, H., Jaakkonen, A., Hakkinen, M., Korkeala, H. and Lindström, M. Occurrence, persistence, and contamination routes of Listeria monocytogenes genotypes on three Finnish dairy cattle farms: a longitudinal study. Appl Environ Microbiol 2018, 84, e02000-17. [CrossRef]
- Murray, E.G.D., Webb, R.A. and Swann, M.B.R. A disease of rabbits characterised by a large mononuclear leucocytosis, caused by a hitherto undescribed bacillus Bacterium monocytogenes (n. sp.). J Patho Bacteriol 1926, 29, 407-439. [CrossRef]
- Molla, B., Yilma, R. and Alemayehu, D. Listeria monocytogenes and other Listeria species in retail meat and milk products in Addis Ababa, Ethiopia. Ethiopia J Hlth Dev 2004, 18, 208-212. [CrossRef]
- Zoellner, C., Wiedmann, M. and Ivanek, R., An Assessment of Listeriosis Risk Associated with a Contaminated Production Lot of Frozen Vegetables Consumed under Alternative Consumer Handling Scenarios. J Food Prot 2019, 82, 2174-2193. [CrossRef]
- Di Pinto, A., Novello, L., Montemurro, F., Bonerba, E. and Tantillo, G. Occurrence of Listeria monocytogenes in ready-to-eat foods from supermarkets in Southern Italy. New Microbiol 2010, 33, 249-252.
- Acciari, V., Iannetti, L., Schirone, M., Neri, D., Visciano, P., Acciari, V.A., Centorotola, G., Mangieri, M.S., Torresi, M., Santarelli, G.A. and Di Marzio, V. Listeria monocytogenes in poultry: Detection and strain characterization along an integrated production chain in Italy. 2020, pubag.nal.usda.gov.
- Kureljušić, J., Rokvić, N., Jezdimirović, N., Kureljušić, B., Pisinov, B. and Karabasil, N. Isolation and detection of Listeria monocytogenes in poultry meat by standard culture methods and PCR. In IOP Conference Series: Earth Environ Sci 2017, 85, 012069. IOP Publishing. iopscience.iop.org.
- Rocha, C.E., Mol, J.P., Garcia, L.N., Costa, L.F., Santos, R.L. and Paixão, T.A. Comparative experimental infection of Listeria monocytogenes and Listeria ivanovii in bovine trophoblasts. PLoS One, 2017, 12, p.e0176911. [CrossRef]
- Perrin, M., Bemer, M. and Delamare, C. Fatal case of Listeria innocua bacteremia. J Clin Microbiol 2003, 41, 5308-5309. [CrossRef]
- Favaro, M., Sarmati, L., Sancesario, G. and Fontana, C. First case of Listeria innocua meningitis in a patient on steroids and eternecept. JMM Case Rep 2014, 1. e003103. [CrossRef]
- Gradovska, S., Šteingolde, Ž., Ķibilds, J., Meistere, I., Avsejenko, J., Streikiša, M., Alksne, L., Terentjeva, M. and Bērziņš, A. Genetic diversity and known virulence genes in Listeria innocua strains isolated from cattle abortions and farm environment. Veter Anim Sci, 2023, 19, .100276.
- Seçil, A.B.A.Y., Aydin, F. and Sumerkan, A.B. Molecular typing of Listeria spp. isolated from different sources. Ankara Üniversitesi Veteriner Fakültesi Dergisi, 2012, 59, 183-190.
- Chen, J., Chen, Q., Jiang, L., Cheng, C., Bai, F., Wang, J., Mo, F. and Fang, W. Internalin profiling and multilocus sequence typing suggest four Listeria innocua subgroups with different evolutionary distances from Listeria monocytogenes. BMC Microbiol, 2010, 10, 1-16. [CrossRef]
- Disson, O., Moura, A. and Lecuit, M.. Making sense of the biodiversity and virulence of Listeria monocytogenes. Trends Microbiol, 2021 29, 811-822. [CrossRef]
- Clayton, E.M., Daly, K.M., Guinane, C.M., Hill, C., Cotter, P.D. and Ross, P.R. Atypical Listeria innocua strains possess an intact LIPI-3. BMC Microbiol, 2014, 14.1-9. [CrossRef]
- Moura, A., Disson, O., Lavina, M., Thouvenot, P., Huang, L., Leclercq, A., Fredriksson-Ahomaa, M., Eshwar, A.K., Stephan, R. and Lecuit, M. Atypical hemolytic Listeria innocua isolates are virulent, albeit less than Listeria monocytogenes. Infection and immunity, 2019, 87, e00758-18. [CrossRef]
- Johnson, J., Jinneman, K., Stelma, G., Smith, B.G., Lye, D., Messer, J., Ulaszek, J., Evsen, L., Gendel, S., Bennett, R.W. and Swaminathan, B. Natural atypical Listeria innocua strains with Listeria monocytogenes pathogenicity island 1 Genes. Appl Envirol Microbial.. 2004, 70, 4256-66. [CrossRef]
- Chen, Y., Gonzalez-Escalona, N., Hammack, T.S., Allard, M.W., Strain, E.A. and Brown, E.W. Core genome multilocus sequence typing for identification of globally distributed clonal groups and differentiation of outbreak strains of Listeria monocytogenes. Appl Environ Microbiol, 2016, 82, 6258-6272. [CrossRef]
- Kaszoni-Rückerl, I., Mustedanagic, A., Muri-Klinger, S., Brugger, K., Wagner, K.H., Wagner, M. and Stessl, B. Predominance of distinct Listeria innocua and Listeria monocytogenes in recurrent contamination events at dairy processing facilities. Microorganisms, 2020 10; 234. [CrossRef]
- Oswaldi, V., Lüth, S., Dzierzon, J., Meemken, D., Schwarz, S., Feßler, A.T., Félix, B. and Langforth, S. Distribution and characteristics of Listeria spp. in pigs and pork production chains in Germany. Microorganisms. 2022, 26,:512.
- Tomáštíková, Z., Gelbíčová, T. and Karpíšková, R. Population structure of Listeria monocytogenes isolated from human listeriosis cases and from ready-to-eat foods in the Czech Republic. J. Food Nutri Res. 2019 1, 58.
- Olanya, O.M., Hoshide, A.K., Ijabadeniyi, O.A., Ukuku, D.O., Mukhopadhyay, S., Niemira, B.A. and Ayeni O. Cost estimation of listeriosis (Listeria monocytogenes) occurrence in South Africa in 2017 and its food safety implications. Food Contr. 2019 1, 231-9. [CrossRef]
- Hyden, P., Pietzka, A., Lennkh, A., Murer, A., Springer, B., Blaschitz, M., Indra, A., Huhulescu, S., Allerberger, F., Ruppitsch, W. and Sensen, C.W. Whole genome sequence-based serogrouping of Listeria monocytogenes isolates. J. Biotech ,2016, 235, 181-186. [CrossRef]
- Schmid, D., Allerberger, F., Huhulescu, S., Pietzka, A., Amar, C., Kleta, S., Prager, R., Preussel, K., Aichinger, E. and Mellmann, A. Whole genome sequencing as a tool to investigate a cluster of seven cases of listeriosis in Austria and Germany, 2011–2013. Clin Microbiol Infect, 2014, 20, 431-436. 20. [CrossRef]
- Kwong, J.C., McCallum, N., Sintchenko, V. and Howden, B.P., 2015. Whole genome sequencing in clinical and public health microbiology. Path, 2015, 47, 199-210. [CrossRef]
- Segerman, B. The most frequently used sequencing technologies and assembly methods in different time segments of the bacterial surveillance and RefSeq genome databases. Front Cellu Iinfect microbiol, 2020, 10, .527102. [CrossRef]
- Reygaert, W.C. An overview of the antimicrobial resistance mechanisms of bacteria. AIMS Microbiol. 2018, 4, 482. [CrossRef]
- Chowdhury, A.S., Call, D.R., Broschat S.L., PARGT: a software tool for predicting antimicrobial resistance in bacteria. Scientific Reports. 2020 1,11033. [CrossRef]
- Pfeffer, K., Matsuyama, T., Kündig, T.M., Wakeham, A., Kishihara, K., Shahinian, A., Wiegmann, K., Ohashi, P.S., Krönke, M. and Mak, T.W. Mice deficient for the 55 kd tumor necrosis factor receptor are resistant to endotoxic shock, yet succumb to Listeria. monocytogenes infection. Cell. 1993, 7, 457-67. [CrossRef]
- Shamloo, E., Hosseini, H., Moghadam, Z.A., Larsen, M.H., Haslberger, A and Alebouyeh,M. Importance of Listeria monocytogenes in food safety: a review of its prevalence, detection, and antibiotic resistance. Iran J. Vet Res. 2019;20, 241.
- Wu, L., Bao, H., Yang, Z., He, T., Tian, Y., Zhou, Y., Pang, M., Wang, R. and Zhang, H. Antimicrobial susceptibility, multilocus sequence typing, and virulence of Listeria isolated from a slaughterhouse in Jiangsu, China. BMC Microbiol. 2021 21, 1-3. [CrossRef]
- Hosain, M.Z., Kabir, S.L. and Kamal, M.M. Antimicrobial uses for livestock production in developing countries. Vet World. 2021,;14, 210. [CrossRef]
- Allam, M., Tau, N., Smouse, S.L., Mtshali, P.S., Mnyameni, F., Khumalo, Z.T., Ismail, A., Govender, N., Thomas, J., and Smith, A.M. Whole-genome sequences of Listeria monocytogenes sequence type 6 isolates associated with a large foodborne outbreak in South Africa, 2017 to 2018. Geno Annon, 2018, 6, e00538-18. [CrossRef]
- Matle, I., Mbatha, K.R., Lentsoane, O., Magwedere, K., Morey, L. and Madoroba, E. Occurrence, serotypes, and characteristics of Listeria monocytogenes in meat and meat products in South Africa between 2014 and 2016. J F00d Safe, 2019, 39, e12629. [CrossRef]
- Gana, J., Gcebe, N., Pierneef, R., Moerane, R. and Adesiyun, A.A. Multiple-Locus Variable-Number Tandem Repeat Analysis Genotypes of Listeria monocytogenes Isolated from Farms, Abattoirs, and Retail in Gauteng Province, South Africa. J. Food Prot. 2022,, 85,1249-57. [CrossRef]
- Manqele, A., Gcebe, N., Pierneef, R.E., Moerane, R. and Adesiyun, A.A. Identification of Listeria species and Multilocus Variable-Number Tandem Repeat Analysis (MLVA) Typing of Listeria innocua and Listeria monocytogenes Isolates from Cattle Farms and Beef and Beef-Based Products from Retail Outlets in Mpumalanga and North West Provinces, South Africa. Pathogens 2023, 12, 147. [CrossRef]
- Mafuna, T., Matle, I., Magwedere, K., Pierneef, R.E. and Reva, O.N. Comparative Genomics of Listeria Species Recovered from Meat and Food Processing Facilities. Microbiol Spect, 2022, 10, e01189-22. [CrossRef]
- ElZowalaty, M.E., Hickman, R.A., Moura, A., Lecuit, M., Zishiri, O.T., Noyes, N. and Järhult, J.D. Genome sequence of Listeria innocua strain MEZLIS26, isolated from a goat in South Africa. Microbiol Res Anno. 2019, 8, e00991-19. [CrossRef]
- Thrusfield, M. Sample size determination. Veterinary Epidemiology 2007, 3, 185-189.
- Gana, J. Prevalence, risk factors and molecular characterization of Listeria species from cattle farms, beef abattoir and retail outlets in Gauteng, South Africa. Ph.D. Thesis, University of Pretoria, 2022 .
- Doumith, M., Buchrieser, C., Glaser, P., Jacquet, C. and Martin, P. Differentiation of the major Listeria monocytogenes serovars by multiplex PCR. J Clin Microbiol 2004, 42, 3819-3822. [CrossRef]
- Soumet, C., Ermel, G., Fach, P. and Colin, P. Evaluation of different DNA extraction procedures for the detection of Salmonella from chicken products by polymerase chain reaction. Letters Appl Microbiol 1994, 19, 294-298. [CrossRef]
- Jamali, H., Chai, L.C. and Thong, K.L. Detection and isolation of Listeria spp. and Listeria monocytogenes in ready-to-eat foods with various selective culture media. Food Contr 2013, 32, 19-24. [CrossRef]
- Bankevich, A., Nurk, S., Antipov, D., Gurevich, A.A., Dvorkin, M., Kulikov, A.S., Lesin, V.M., Nikolenko, S.I., Pham, S., Prjibelski, A.D. and Pyshkin, A.V. SPAdes: a new genome assembly algorithm and its applications to single-cell sequencing. J Comp Bio, 2012, 19, 455-477.
- Parks, D.H., Imelfort, M., Skennerton, C.T., Hugenholtz, P. and Tyson, G.W. CheckM: assessing the quality of microbial genomes recovered from isolates, single cells, and metagenomes. Genome research, 2015, 25, 1043-1055. [CrossRef]
- Chaumeil, P.A., Mussig, A.J., Hugenholtz, P. and Parks, D.H. GTDB-Tk: a toolkit to classify genomes with the Genome Taxonomy Database. 2020, 1925-1927. [CrossRef]
- Seemann T, mlst Github https://github.com/tseemann/mlst.
- Seemann T, Abricate, Github https://github.com/tseemann/abricate.
- Yu, G. Using ggtree to visualize data on tree-like structures. Current protocols in bioinformatics,2020, 69 .e96. [CrossRef]
- R Core Team. R: A language and environment for statistical computing. R Foundation for Statistical Computing, Vienna, Austria.,2021. https://www.R-project.org/.
- RStudio Team. RStudio: Integrated Development Environment for R. RStudio, PBC, Boston, MA.,2022 http://www.rstudio.
- Maechler, M. Finding groups in data: Cluster analysis extended Rousseeuw et al. R package version, 2019, 2, .242-248.
- Paradis, E. and Schliep, K.. ape 5.0: an environment for modern phylogenetics and evolutionary analyses in R. Bioinformatics, 2019, 35, 526-528. [CrossRef]
- Csardi, G. and Nepusz, T. The igraph software package for complex network research. InterJournal, complex systems, 2006, 1695, 1-9.
- Briatte, F., Bojanowski, M., Canouil, M., Charlop-Powers, Z., Fisher, J., Johnson, K. and Rinker, T. 2020. ggnetwork.
- Patil, I. Visualizations with statistical details: The'ggstatsplot'approach. J Open Sou Soft, 2021, 61, 3167. [CrossRef]
- Xiao, N. ggsci: scientific journal and Sci-Fi themed color palettes for'ggplot2'. R package version, 2018, 2, 9.
- Kassambara, A. and Kassambara, M.A.. Package ‘ggpubr’. R package version 0.1, 2020, 6, 0.
- Kaptchouang Tchatchouang, C.D., Fri, J., De Santi, M., Brandi, G., Schiavano, G.F., Amagliani, G. and Ateba, C.N. Listeriosis outbreak in South Africa: a comparative analysis with previously reported cases worldwide. Microorganisms. 2020, 8, 135. [CrossRef]
- Escolar, C., Gómez, D., del Carmen Rota García, M., Conchello, P. and Herrera, A. Antimicrobial resistance profiles of Listeria monocytogenes and Listeria innocua isolated from ready-to-eat products of animal origin in Spain. Foodborn Path Dis, 2017, 14, 357-363.
- Nayak, D.N., Savalia, C.V., Kalyani, I.H., Kumar, R. and Kshirsagar, D.P. Isolation, identification, and characterization of Listeria spp. from various animal origin foods. Veter World, 2015, 8, 695. [CrossRef]
- Hanes, R.M. and Huang, Z. Investigation of Antimicrobial Resistance Genes in Listeria monocytogenes from 2010 through to 2021. Inter J Environ Res Pub Health, 2022, 19, 5506. [CrossRef]
- Jorgensen, J., Bland, R., Waite-Cusic, J. and Kovacevic, J.. Diversity and antimicrobial resistance of Listeria spp. and Listeria monocytogenes clones from produce handling and processing facilities in the Pacific Northwest. Food Contr, 2021, 123, 107665.
- Palaiodimou, L., Fanning, S. and Fox, E.M. Genomic insights into persistence of Listeria species in the food processing environment. J Appl Microbiol, 2021, 131, 082-2094. [CrossRef]
- Mpondo, L., Ebomah, K.E. and Okoh, A.I., 2021. Multidrug-resistant Listeria species shows abundance in environmental waters of a key district municipality in South Africa. Inter J Envirol Res Publ Health, 2021, 18, 481. [CrossRef]
- Henton, M.M., Eagar, H.A., Swan, G.E. and Van Vuuren, M.. Part VI. Antibiotic management and resistance in livestock production. SAMJ: South Afri Med J, 2011, 101, 583-586.
- Mupfunya, C.R., Qekwana, D.N. and Naidoo, V. Antimicrobial use practices and resistance in indicator bacteria in communal cattle in the Mnisi community, Mpumalanga, South Africa. Vetr Med Sci, 2021, 7, 112-121. [CrossRef]
- Adesiyun, A.A., Nkuna, C., Mokgoatlheng-Mamogobo, M., Malepe, K. and Simanda, L. Food safety risk posed to consumers of table eggs from layer farms in Gauteng Province, South Africa: Prevalence of Salmonella species and Escherichia coli, antimicrobial residues, and antimicrobial resistant bacteria. J Food Safe, 2020, 40, e12783. [CrossRef]
- Van, T.T.H., Yidana, Z., Smooker, P.M. and Coloe, P.J. Antibiotic use in food animals worldwide, with a focus on Africa: Pluses and minuses. J Glob Antimicrob Resist 2020, 20, 170–177. [CrossRef]
- Assisi, C., Forauer, E., Oliver, H.F. and Etter, A.J. Genomic and transcriptomic analysis of biofilm formation in persistent and transient Listeria monocytogenes isolates from the retail deli environment does not yield insight into persistence mechanisms. Foodborn Path Dis, 2021,18, 179-188. [CrossRef]
- Wilson, A., Gray, J., Chandry, P.S. and Fox, E.M. Phenotypic and genotypic analysis of antimicrobial resistance among Listeria monocytogenes isolated from Australian food production chains. Genes, 2018,9, 80. [CrossRef]
- Salyers, A.A. and Amabile-Cuevas, C.F. Why are antibiotic resistance genes so resistant to elimination?. Antimicrob age chemo,1997, 41, 2321-2325. [CrossRef]
- Hummel, A.S., Hertel, C., Holzapfel, W.H. and Franz, C.M.. Antibiotic resistances of starter and probiotic strains of lactic acid bacteria. Appl Environ Microbiol, 2007, 73.730-739. [CrossRef]
- Maury, M.M., Chenal-Francisque, V., Bracq-Dieye H., Han L., Leclercq, A., Vales, G., Moura, A., Gouin, E., Scortti, M., Disson, O., Vázquez-Boland, J.A., Lecuit, M. Spontaneous loss of virulence in natural populations of Listeria monocytogenes. Infect Immun, 2017, 85(11): e00541-17. /. [CrossRef]
- Liu, D., Lawrence, M.L., Austin, F.W. and Ainsworth, A.J. A multiplex PCR for species-and virulence-specific determination of Listeria monocytogenes. J Microbiol Meth, 2007, 71, 133-140. [CrossRef]
- Rabinovich, L., Sigal, N., Borovok, I., Nir-Paz, R. and Herskovits, A.A. Prophage excision activates Listeria competence genes that promote phagosomal escape and virulence. Cell, 2012, 150, .792-802. [CrossRef]
- Gilmour, M.W., Graham, M., Van Domselaar, G., Tyler, S., Kent, H., Trout-Yakel, K.M., Larios, O., Allen, V., Lee, B. and Nadon, C.. High-throughput genome sequencing of two Listeria monocytogenes clinical isolates during a large foodborne outbreak. BMC Genomics, 2010, 11, 1-15. [CrossRef]
- Wurtzel, O., Sesto, N., Mellin, J.R., Karunker, I., Edelheit, S., Bécavin, C., Archambaud, C., Cossart, P. and Sorek, R.. Comparative transcriptomics of pathogenic and non-pathogenic Listeria species. Mol sys bio, 2012, 8.583.
- Gradovska, S., Šteingolde, Ž., Ķibilds, J., Meistere, I., Avsejenko, J., Streikiša, M., Alksne, L., Terentjeva, M., Bērziņš, A. Genetic diversity and known virulence genes in Listeria innocua strains isolated from cattle abortions and farm environment. Vet Anim Sci, 2022, 19:100276. [CrossRef]
- Nielsen, E.M., Björkman, J.T., Kiil, K., Grant, K., Dallman, T., Painset, A., Amar, C., Roussel, S., Guillier, L., Félix, B., Rotariu, O., Perez-Reche, F., Forbes, K., Strachan, N.. Closing gaps for performing a risk assessment on Listeria monocytogenes in ready-to-eat (RTE) foods: activity 3, the comparison of isolates from different compartments along the food chain and from humans using whole genome sequencing (WGS) analysis. EFSA Supporting Publications 2017, 14, 1151E https://efsa.onlinelibrary.wiley.com/doi/abs/10.2903/sp.efsa.2017.EN-1151).
Disclaimer/Publisher’s Note: The statements, opinions and data contained in all publications are solely those of the individual author(s) and contributor(s) and not of MDPI and/or the editor(s). MDPI and/or the editor(s) disclaim responsibility for any injury to people or property resulting from any ideas, methods, instructions or products referred to in the content. |
© 2023 by the authors. Licensee MDPI, Basel, Switzerland. This article is an open access article distributed under the terms and conditions of the Creative Commons Attribution (CC BY) license (http://creativecommons.org/licenses/by/4.0/).


