Submitted:
10 July 2023
Posted:
10 July 2023
You are already at the latest version
Abstract

Keywords:
1. Introduction
2. Materials and Methods
2.1. P.tricornutum and S.platensis Cultures
2.2. Chemicals
2.3. Extraction of P. tricornutum and S. platensis
2.4. Antioxidant Capacity Analysis
2.5. Total Phenolic Compounds (TPC) Analysis
2.6. Analysis of the Phenolic Compounds by LC-ESI-MS/MS
2.7. Detection of the Bioaccessibility of the Bioactive Compounds by In Vitro Digestion
2.8. Microbiological Analyzes
2.9. Statistical Data Analysis
3. Results and Discussions
3.1. Antioxidant Capacity Analysis Results
3.1.1. DPPH Method Results
3.1.2. ABTS Method Results
3.1.3. CUPRAC Method Results
3.2. Total Phenolic Compounds (TPC) Analysis Results
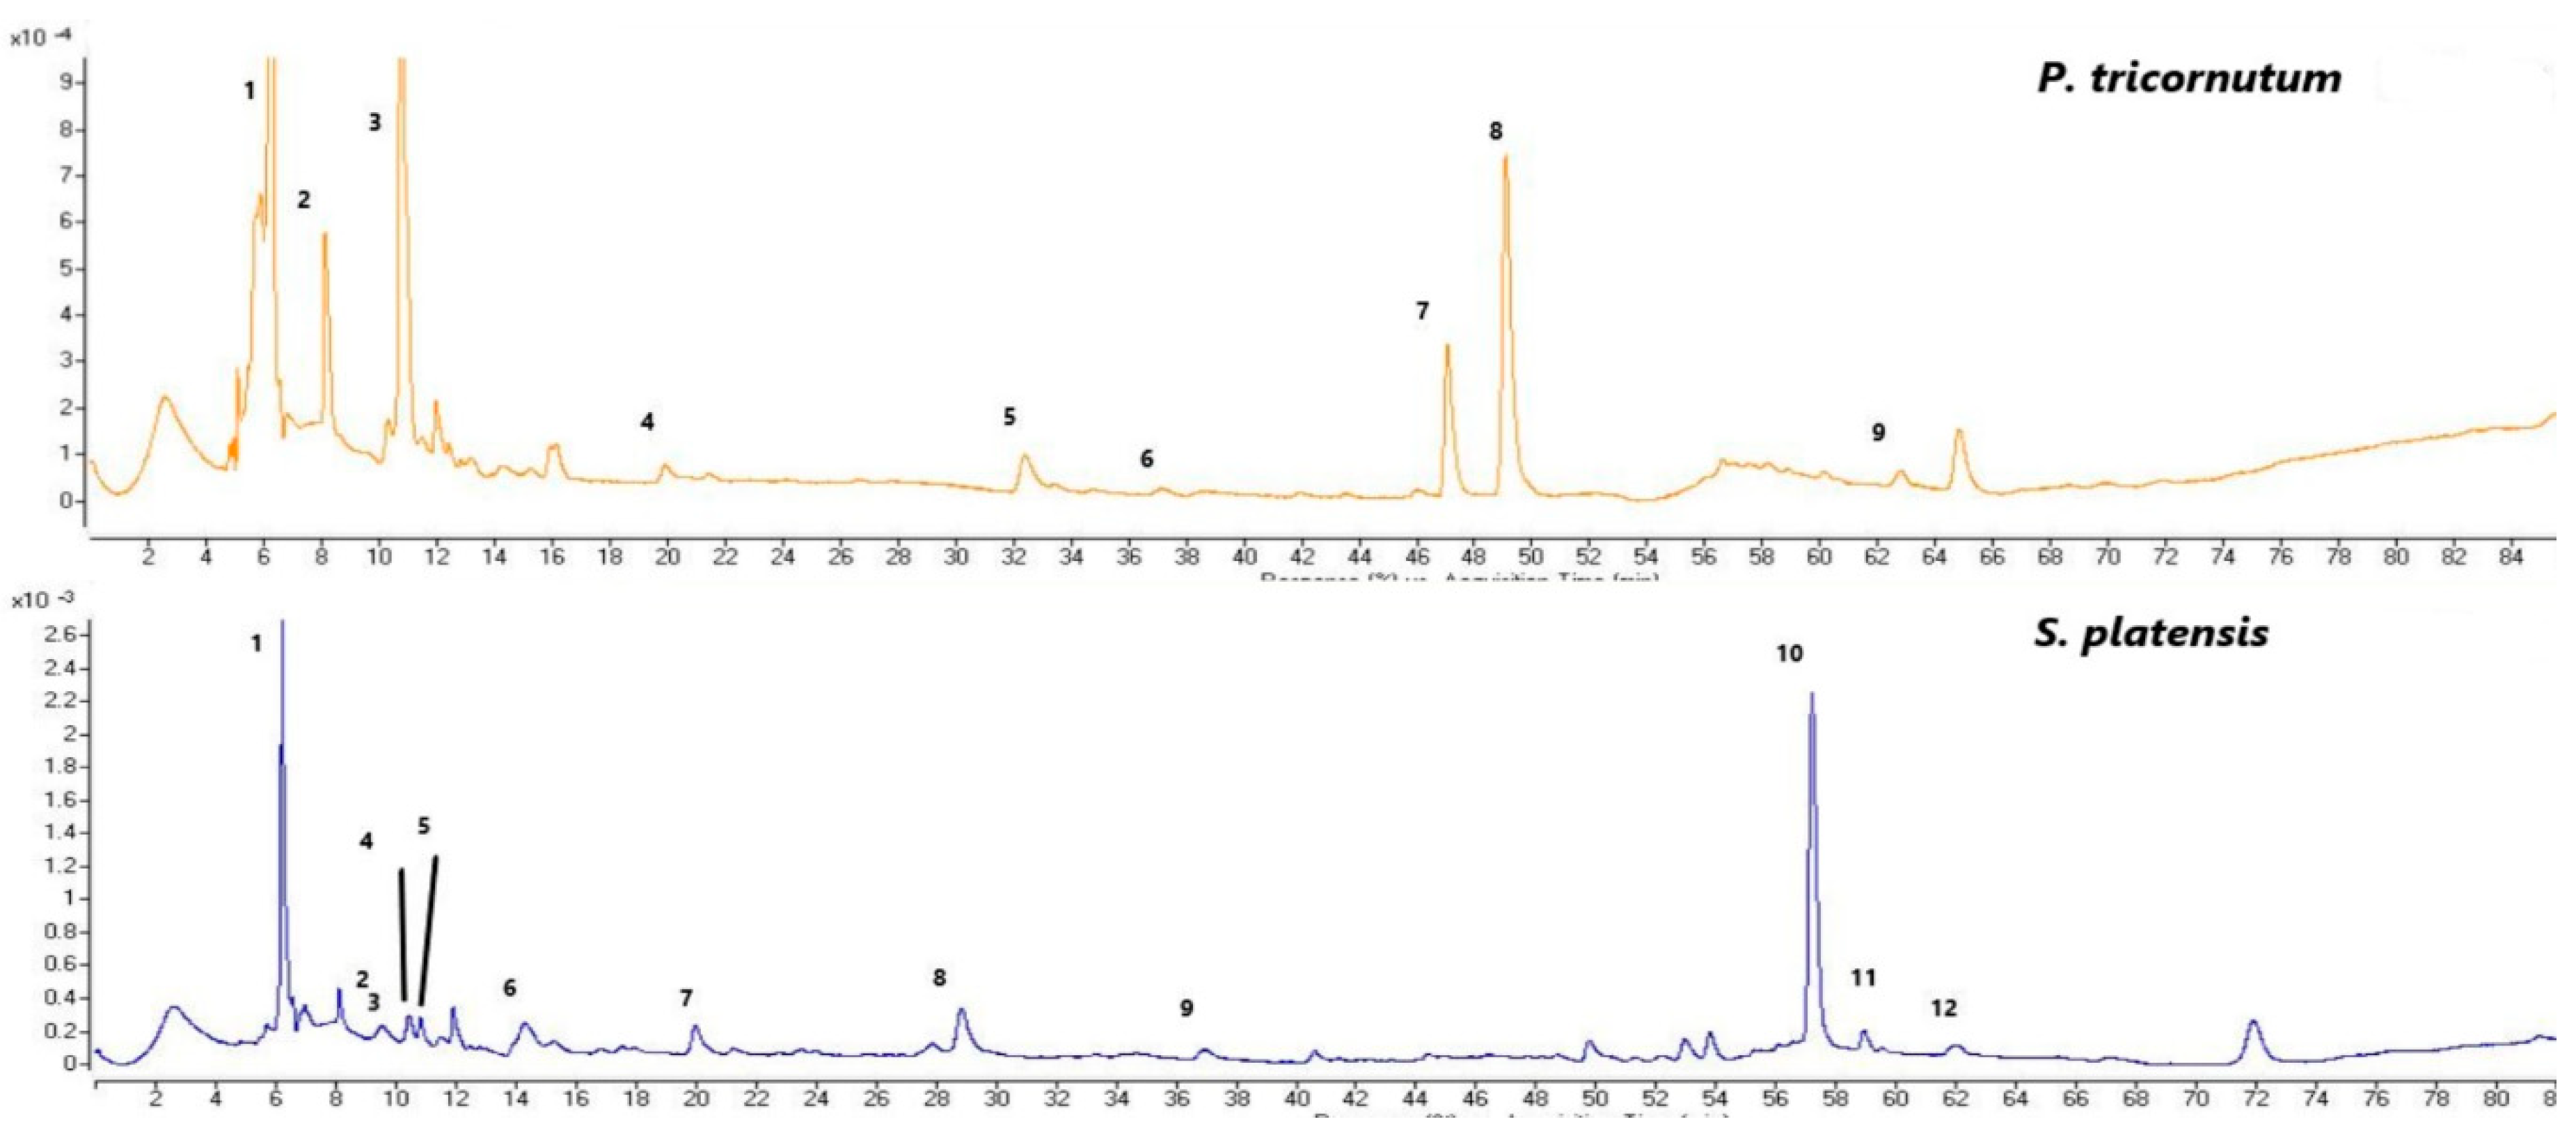
3.3. LC-ESI-MS/MS Phenolic Compounds Analysis Results
3.4. Results of the Bioaccessibility of the Bioactive Compounds by the In Vitro Digestion
3.5. Microbiological Analysis Results
4. Conclusions
Author Contributions
Acknowledgements
Conflicts of Interest
References
- Pereira, L.; Magalhaes, J. Neto, marine algae, biodiversity, taxonomy, environmental assessment, and biotechnology. CRC Press, 2014.
- De Martino, A.; Bartual, A.; Willis, A.; Meichenin, A.; Villazan, B. Physiological and molecular evidence that environmental changes elicit morphological interconversion in the model diatom Phaeodactylum tricornutum. Protist, 2011, 162, 462–481. [CrossRef]
- Mahari, W.A.W.; Razali, W.A.W.; Manan, H.; Hersi, M.A.; Ishak, S.D.; Cheah, W., & Lam, S. S. Recent advances on microalgae cultivation for simultaneous biomass production and removal of wastewater pollutants to achieve circular economy. Bioresour. Technol., 2022, 128085. [CrossRef]
- Klejdus, B.; Kopecký, J.; Benešová, L.; Vacek, J. Solid-phase/supercritical-fluid extraction for liquid chromatography of phenolic compounds in freshwater microalgae and selected cyanobacterial species. J. Chromatogr. A. 2009,1216 (5), 763–771. [CrossRef]
- Goiris, K.; Muylaert, K.; Fraeye, I.; Foubert, I.; De Brabanter, J.; De Cooman, L. Antioxidant potential of microalgae in relation to their phenolic and carotenoid content. J. Appl. Phycol. 2012, 24, 1477–1486. [CrossRef]
- Seghiri, R.; Kharbach, M.; Essamri, A. Functional composition, nutritional properties, and biological activities of Moroccan Spirulina Microalga. J. Food Qual. 2019, 1–11. [CrossRef]
- Rico, M.; López, A.; Santana-Casiano, J.M., Gonzàlez, A. G.; Gonzàlez-Dàvila, M. Variability of the phenolic profile in the diatom Phaeodactylum tricornutum growing under copper and iron stress. Limnol. Oceanogr. 2012, 58(1), 144–152. [CrossRef]
- Wojtunik-Kulesza, K.; Oniszczuk, A.; Oniszczuk, T.; Combrzyński, M.; Nowakowska, D.; Matwijczuk, A. Influence of In vitro digestion on composition, bioaccessibility and antioxidant activity of food polyphenols—A non-systematic review. Nutrients, 2020, 12, 1401. [CrossRef]
- German-Báez, L.; Valdez-Flores, M.; Félix-Medina, J.; Norzagaray-Valenzuela, C.; Santos-Ballardo, D.; Reyes-Moreno, C.; Valdez-Ortiz, A. Chemical composition and physicochemical properties of Phaeodactylum tricornutum microalgal residual biomass. Int. J. Food Sci. Technol. 2017, 23(8), 681–689. [CrossRef]
- Drira, M.; Ben Mohamed, J.; Ben Hlima, H.; Hentati, F.; Michaud, P.; Abdelkafi, S.; Fendri, I. Improvement of Arabidopsis thaliana salt tolerance using a polysaccharidic extract from the brown algae Padina pavonica. Algal Research, 2021, 56, 102324. [CrossRef]
- Aiba, S.; Ogawa, T. Assessment of growth yield of a blue-green alga: Spirulina platensis in axenic and continuous culture. The Journal of General Microbiology, 1977, 102, 179–82. [CrossRef]
- Walne, P. R. Studies on food value of nineteen genera of algae to juvenile bivalves of the genera Ostrea, Crassostrea, Mercenaria and Mytilus, Fish. Invest. Lond. Se.r, 1970, 2, 26(5): 1–62.
- Keskin, M.; Guclu, G.; Sekerli, Y.E.; Soysal, Y.; Selli, S.; Kelebek, H. Comparative assessment of volatile and phenolic profiles of fresh black carrot (Daucus carota L.) and powders prepared by three drying methods, Sci. Hortic. 2021, 287, 110256. [CrossRef]
- Kelebek, H.; Jourdes, M.; Selli, S.; Teissedre, P.L. Comparative evaluation of the phenolic content and antioxidant capacity of sun-dried raisins. J. Sci. Food Agric. 2013, 93(12), 2963–2972. [CrossRef]
- Brand-Williams, W.; Cuvelier, M.E.; Berset, C.L.W.T. Use of a free radical method to evaluate antioxidant activity. LWT-Food Science and Technology, 1995, 28,25-30. [CrossRef]
- Saafi, E.B.; El Arem, A.; Issaoui, M.; Hammami, M.; Achour, L. Phenolic content and antioxidant activity of four date palm (Phoenix dactylifera L.) fruit varieties grown in Tunisia. International J. Food Sci. Technol. 2009, 44(11), 2314–2319. [CrossRef]
- Apak, R.; Güçlü, K.; Özyürek, M.; Karademir, S.E. Novel total antioxidant capacity index for dietary polyphenols and vitamins C and E, using their cupric ion reducing capability in the presence of neocuproine: CUPRAC Method. J. Agric. Food Chem. 2004, 52, 7970-7981. [CrossRef]
- Shahidi, F. Antioxidants. Handbook of antioxidants for food preservation, 1st ed.; Fereidoon Shahidi, Eds., Publisher: Woodhead Publishing Series in Food Science, Technology and Nutrition, Cambridge, 2015, 1–14.
- Tanrıseven, D.; Kadiroglu, P.; Selli, S.; Kelebek, H. LC-DAD-ESI-MS/MS-assisted elucidation of the phenolic compounds in shalgams: Comparison of traditional and direct methods. Food Chem. 2020, 305, 1555, doi.org/10.1016/j.foodchem.2019.125505.
- Sonmezdag, A.S.; Kelebek, H.; Selli, S. Effect of hulling methods and roasting treatment on phenolic compounds and physicochemical properties of cultivars ‘Ohadi’ and ‘Uzun’ pistachios (Pistacia vera L.). Food Chem. 2019, 272, 418 426. [CrossRef]
- Brodkorb, A.; Egger, L.; Alminger, M.; Alvito, P.; Assunção, R.; Ballance, S.; … Recio, I. INFOGEST static in vitro simulation of gastrointestinal food digestion. Nature Protocols, 2019, 14, 991–1014. [CrossRef]
- Amsasekar, A.; Mor, R.S.; Kishore, A.; Singh, A.; Sid, S. Impact of high pressure processing on microbiological, nutritional and sensory properties of food: a review. Nutr. Food Sci. 2022, 52 (6), 996-1017. [CrossRef]
- Kuatrakul, I.; Kuarthongsri, P.; Yabuuchi, C.; Somsai, K.; Utama-ang N. Sensory descriptive analysis and physicochemical properties of Spirulina platensis from different drying processes: hot air drying and microwave vacuum drying. Curr. Appl. Sci. Technol. 2017, 17 (2). [CrossRef]
- Yuan, G.; Wang, X.; Guo R.; Wang, Q. Effect of salt stress on phenolic compounds, glucosinolates, myrosinase and antioxidant activity in radish sprouts. Food Chem. 2010, 121, 1014-1019. [CrossRef]
- Bourgou, S.; Ksouri, R.; Bellila, A.; Skandrani, I.; Falleh, H.; Marzouk, B. Phenolic composition and biological activities of Tunisian Nigella sativa L., shoots and roots. C. R. Biol. 2008, 331, 48-55. [CrossRef]
- Khawli, F.A.; Martí-Quijal, F.J.; Pallarés, N.; Barba, F.J.; Ferrer, E. Ultrasound Extraction Mediated Recovery of Nutrients and Antioxidant Bioactive Compounds from Phaeodactylum tricornutum Microalgae. Appl. Sci. 2021, 11, 1701. [CrossRef]
- Golmakani, M.-T.; Moosavi-Nasab, M.; Keramat, M.; Mohammadi, M.A. Arthrospira platensis extract as a natural antioxidant for improving oxidative stability of common Kilka (Clupeonella cultriventris caspia) Oil. Turkish J. Fish. Aquat. Sci. 2018. 18(11). [CrossRef]
- Bolanho, B.C.; Egea, M.B.; Jacome, A.L.M.; Campos, I.; Carvalho, J.C.M.; Danesi, E.D.G. Antioxidant and nutritional potential of cookies enriched with Spirulina platensis and sources of fibre. J. Food Nutr. Res. 2014, 53 (2): 171-179.
- Esquivel-Hernández, D.A.; Rodríguez-Rodríguez, J.; Rostro-Alanis, M.; Cuéllar-Bermúdez, S.P.; Mancera-Andrade, E. I.; Núñez-Echevarría, J.E., Parra-Saldívar, R. Advancement of green process through microwave-assisted extraction of bioactive metabolites from Arthrospira platensis and bioactivity evaluation. Bioresour. Technol. 2017, 224, 618–629. [CrossRef]
- Martelli, F.; Cirlini, M.; Lazzi, C.; Neviani, E.; Bernini, V. Edible seaweeds and Spirulina extracts for food application: In vitro and in situ evaluation of antimicrobial activity towards foodborne pathogenic bacteria. Foods, 2020, 9(10), 1442. [CrossRef]
- Elloumi, W.; Jebali, A.; Maalej, A.; Chamkha, M.; Sayadi, S. Effect of Mild Salinity Stress on the Growth, Fatty Acid and Carotenoid Compositions, and Biological Activities of the Thermal Freshwater Microalgae Scenedesmus sp. Biomolecules 2020, 10, 1515. [CrossRef]
- BenMoussa-Dahmen, I.; Chtourou, H.; Rezgui, F.; Sayadi, S.; Dhouib, A. Salinity Stress Increases Lipid, Secondary Metabolites and Enzyme Activity in Amphora subtropica and Dunaliella Sp. for Biodiesel Production. Bioresour. Technol. 2016, 218, 816–825. [CrossRef]
- Ugya, A. Y.; Imam, T. S.; Li, A.; Ma, J.; Hua, X. Antioxidant response mechanism of freshwater microalgae species to reactive oxygen species production: a mini review. Chemistry and Ecology, 2020, 36 (2), 174-193. [CrossRef]
- Parniakov, O.; Apicella, E.; Koubaa, M.; Barba, F.J.; Grimi, N.; Lebovka, N.; Pataro, G.; Ferrari, G.; Vorobiev, E. Ultra-sound-assisted green solvent extraction of high-added value compounds from microalgae Nannochloropsis spp. Bioresour. Technol. 2015, 198, 262–267. [CrossRef]
- Min, J.; Shen, H.; Xi, W.; Wang, Q.; Yin, L.; Zhang, Y.; Wang, Z. N. Synergistic anticancer activity of combined use of caffeic acid with paclitaxel enhances apoptosis of non-small-cell lung cancer H1299 cells in vivo and in vitro. Cell. Physiol. Biochem. 2018, 48(4), 1433-1442. [CrossRef]
- Ochoa Becerra, M.; Mojica Contreras, L.; Hsieh Lo, M.; Mateos Díaz, J.; Castillo Herrera, G. Lutein as a functional food ingredient: Stability and bioavailability. J. Funct. Foods., 2020, 66, 103771. [CrossRef]
- Fernández-Sevilla, J.M.; Acién Fernández, F.G.; Molina Grima, E. Biotechnological production of lutein and its applications. Appl. Microbiol. Biotechnol., 2010, 86 (1), 27-40. [CrossRef]
- Salvamani, S.; Gunasekaran, B.; Shaharuddin, N.A.; Ahmad, S.A.; Shukor, M.Y. Antiartherosclerotic effects of plant flavonoids. Biomed Res. Int. 2014, 480258. [CrossRef]
- Choubey, S.; Varughese, L.R.; Kumar, V.; Beniwal, V. Medicinal importance of gallic acid and its ester derivatives: a patent review. Pharm. Pat. Anal. 2015, 4(4), 305-15. [CrossRef]
- Alminger, M.; Aura, A.M.; Bohn, T.; Dufour, C.; El, S.N.; Gomes, A.; Karakaya, S.; Martίnez-Cuesta, M.C.; McDougall, G.J.; Requena, T. In vitro models for studying secondary plant metabolite digestion and bioaccessibility. Compr. Rev. Food Sci. Food Saf. 2014, 13, 413–436. [CrossRef]
- Nunes, M.; Graca, C.; Vlaisavljevic, S.; Tenreiro, A.; Sousa, I.; Raymundo, A. Microalgal cell disruption: Effect on the bioactivity and rheology of wheat bread. Algal Research, 2020, 45, 101749. [CrossRef]
- Cian, R.E.; Drago, S.R.; De Medina, F.S.; Martínez-Augustin, O. Proteins and carbohydrates from red seaweeds: evidence for beneficial effects on gut function and microbiota. Marine Drugs, 2015, 13 (8), 5358-5383. [CrossRef]
- Dudley, E.G. Food Microbiology: Fundamentals and Frontiers, 5th Edition. Emerging Infectious Diseases, 2022, 28, 267–267. [CrossRef]
- Jay, J.M.; Loessner, M.J.; Golden, D.A. (Eds.). Modern Food Microbiology: 7th Edition. Springer, 2022.
- Turkish Food Codex. Communiqué on Microbiological Criteria (Communique No: 2009/68). https://www.resmigazete.gov.tr/eskiler/2010/01/20100108-10.htm.


| Analysis* | |||||
|---|---|---|---|---|---|
| Species | Salt concentration |
DPPH | ABTS+ | CUPRAC | TPC |
| P. tricornutum | P15 | 27.47±0.83Aa | 97.65±3.21Aa | 32.12±0.27Aa | 63.51±0.43Aa |
| P25 | 56.80±2.09Bb | 123.18±0.40BCbc | 32.02±0.45Aa | 75.95±1.37Bb | |
| P30-C | 79.40±1.71Cc | 141.89±2.85Cc | 44.00±0.69Bb | 82.46±1.07Cc | |
| P35 | 29.76±0.50Aa | 119.05±2.61Bb | 31.14±0.09Aa | 72.63±0.30Bb | |
| S. platensis | S20-C | 172.67±3.21Fc | 655.59±12.05Gd | 104.96±2.27Fd | 204.80±0.66Fc |
| S25 | 151.65±2.65Eb | 425.43±12.59Fc | 48.32±0.04Ca | 171.18±0.96Eb | |
| S30 | 140.66±0.96Da | 404.30±1.39Eb | 77.03±1.61Ec | 166.00±0.49Da | |
| S35 | 137.18±0.50Da | 373.78±3.11Da | 70.77±1.76Db | 163.96±2.84Da | |
| No | RT (min) | Phenolic compounds | x[M-H]-/y[M+H]+ | MS2 | P15 | P25 | P30-C | P35 |
|---|---|---|---|---|---|---|---|---|
| 1 | 6.08 | Catechin isomer | 289x | 267/245/172.9/154.9 | 7.19±0.17b | 10.48±0.35d | 8.09±0.07c | 5.54±0.43a |
| 2 | 6.31 | Dimethoxyflavone | 281x | 267 | 29.90±0.49b | 31.36±0.22c | 31.49±0.23c | 20.40±0.28a |
| 3 | 8.10 | Quinic acid | 190.9x | 85 | 7.75±0.12c | 5.95±0.07b | 5.38±0.08a | 5.22±0.14a |
| 4 | 10.61 | Trans-cinnamic acid | 147x | 103 | 3.15±0.13c | 1.72±0.05a | 4.31±0.10d | 2.33±0.07b |
| 5 | 10.64 | 4-hydroxycinnamic acid | 163x | 145/141/119 | 5.00±0.02c | 3.72±0.17b | 5.56±0.05d | 2.90±0.07a |
| 6 | 10.72 | Cinnamic acid | 147x | 103 | 8.44±0.26c | 6.51±0a | 8.83±0.14c | 7.76±0.29b |
| 7 | 11.88 | Quercetin-3-O-rutinoside | 609x | 300 | 1.27±0a | 2.10±0.10c | 1.70±0.03b | 1.51±0.09b |
| 8 | 19.26 | Phloroglucinol | 127y | 108* | 0.42±0b | 0.34±0a | 0.58±0.03c | 0.31±0.01a |
| 9 | 20.03 | Protocatechuic acid | 153x | 109 | 0.52±0.02a | 0.70±0b | 0.91±0.05c | 0.47±0.01a |
| 10 | 26.78 | p-hydroxybenzoic acid | 137.1x | 109/93 | 1.12±0.03c | 0.54±0.02b | 0.51±0.05b | 0.20±0.02a |
| 11 | 27.99 | Catechin | 289x | 245 | 0.20±0.02a | 0.27±0.04ab | 0.53±0c | 0.30±0.04b |
| 12 | 28.50 | Dihydroxy-dimethoxyflavone derivative | 607x | 315 | 6.36±0a | 8.15±0.14c | 9.92±0.02d | 7.09±0.14b |
| 13 | 33.59 | Vanillic acid | 167x | 122 | 0.30±0.05b | 0.27±0.01ab | 0.40±0.02c | 0.20±0.02a |
| 14 | 34.71 | Caffeic acid | 179x | 135 | 0.29±0.01b | 0.17±0.05a | 0.34±0b | 0.17±0.01a |
| 15 | 37.16 | Epicatechin | 289.2x | 245/2 | 1.11±0.03c | 0.72±0b | 1.72±0.01d | 0.59±0.01a |
| 16 | 43.95 | Caffeyl alcohol | 164x | 145/121/103 | 2.16±0a | 2.36±0.05b | 3.24±0.05d | 2.62±0.08c |
| 17 | 45.01 | Caffeyl alcohol derivative | 164x | 103 | 0.24±0.02a | 0.58±0.07c | 0.86±0.01d | 0.35±0.03b |
| 18 | 47.17 | Lutein | 569y | 551/533/578/495/119/145/121 | 4.03±0.05a | 4.39±0.23ab | 5.21±0.15c | 4.52±0.02b |
| 19 | 50.19 | Diatoxanthin | 566y | 331/341/360 | 4.92±0.14b | 4.43±0.14a | 6.19±0.07d | 5.40±0.08c |
| 20 | 62.89 | Kaempferol | 285x | 257/229/216 | 0.56±0b | 1.49±0.20c | 0.43±0a | 0.40±0.02a |
| Total | 84.93±1.32b | 86.25±1.91c | 96.99±1.16d | 68.28±1.54a |
| No | RT (min) | Compounds | x[M-H]-/y[M+H]+ | MS2 | S20-C | S25 | S30 | S35 |
|---|---|---|---|---|---|---|---|---|
| 1 | 5.53 | Catechin derivative | 289x | 245 | 8.07±0.06b | 7.22±0.20a | 7.17±0.03a | 9.16±0.17c |
| 2 | 7.97 | 5,7-Dihydroxy-3',4'-dimethoxyflavanone | 315x | 283/245/215/195 | 1.34±0.07c | 0.84±0.02b | 0.57±0.08a | 0.42±0.06a |
| 3 | 9.56 | Isoferulic acid | 195x | 178/133/121 | 9.33±0.08d | 4.90±0.04b | 8.28±0.02c | 3.67±0.12a |
| 4 | 10.53 | o-coumaric acid | 165y | 147/ 123 | 5.67±0.03c | 1.17±0.03b | 0.69±0.15a | 0.60±0.12a |
| 5 | 10.64 | 4-Hydroxycinnamic acid | 163x | 145/ 141/ 119 | 3.33±0.02c | 2.21±0.08b | 2.99±0.25c | 1.57±0.17a |
| 6 | 10.88 | Caffeic acid derivative | 179x | 135 | 4.12±0.30b | 1.74±0.62a | 1.95±0.04a | 1.70±0.02a |
| 7 | 11.49 | Ferulic acid | 195y | 177/145 | 2.35±0.06c | 0.65±0.06a | 0.84±0.11ab | 0.92±0.02b |
| 8 | 11.93 | 7/8-Dihydroxycoumarin | 178y | 117/109 | 6.47±0.16d | 2.23±0c | 0.50±0a | 0.86±0b |
| 9 | 14.09 | Gallic acid | 169x | 125 | 11.13±0.11c | 9.95±0.12b | 8.44±0.03a | 9.80±0.30b |
| 10 | 15.2 | 6-Methox-7-hydroxycoumarin | 191x | 177/ 162/ 103 | 4.05±0.53b | 2.14±0.14a | 1.76±0.11a | 3.33±0.22b |
| 11 | 19.96 | Phloroglucinol | 127y | 108 | 2.40±0.01b | 2.22±0.07ab | 1.96±0.05a | 2.02±0.20a |
| 12 | 20.09 | Protocatechuic acid | 153x | 109 | 3.44±0.10c | 2.66±0.10b | 2.68±0.14b | 2.00±0.03a |
| 13 | 23.36 | Catechin gallate | 441x | 291/ 245/ 220/ 195/ 160 | 4.59±0.72b | 6.57±0.21c | 1.74±0.26a | 2.00±0.35a |
| 14 | 26.78 | p-hydroxybenzoic acid | 137.1x | 109/93 | 5.97±0.07b | 1.80±0.41a | 2.96±0.86a | 2.68±0.12a |
| 15 | 27.88 | Catechin | 289x | 245 | 6.29±0.03c | 3.97±0b | 3.39±0.41b | 2.59±0.16a |
| 16 | 28.00 | Chlorogenic acid | 353x | 191 | 2.99±0.04b | 1.23±0.02a | 1.10±0.03a | 1.06±0.13a |
| 17 | 34.60 | Vanillic acid | 167x | 122 | 7.43±0.13c | 6.19±0.40b | 5.47±0.11b | 3.03±0.68a |
| 18 | 34.70 | Caffeic acid | 179x | 135 | 1.48±0.05c | 0.92±0.03a | 1.31±0b | 1.23±0.05b |
| 19 | 36.00 | Epicatechin | 289x | 245 | 8.73±0.90b | 3.22±0.94ab | 2.53±0.47a | 5.55±0.83ab |
| 20 | 47.17 | Lutein | 569y | 551/533/578/495/119/145/121 | 2.18±0.05c | 0.54±0.05a | 0.63±0.06a | 1.02±0.04b |
| 21 | 47.38 | Carotenoid derivative | 566y | 109 | 1.46±0.02c | 1.23±0.03b | 0.87±0.02a | 0.84±0a |
| 22 | 57.18 | Quercetin derivative | 303y | 257/ 285 | 16.19±0.13b | 18.08±0.18c | 18.08±0.35c | 13.38±0.07a |
| 23 | 61.00 | Quercetin | 549x | 463/ 301/ 161 | 5.11±0.05d | 2.79±0a | 3.32±0.03b | 4.06±0.14c |
| 24 | 62.89 | Kaempferol | 285x | 257/ 229/ 216 | 0.75±0.04c | 0.33±0b | 0.66±0.04c | 0.17±0a |
| Total | 124.87±3.64d | 84.8±3.75c | 79.89±3.65b | 73.63±4.00a |
| Oral Phase | Gastric Phase | Intestinal Phase | |||||||||||
|---|---|---|---|---|---|---|---|---|---|---|---|---|---|
| Species | Salt concentration |
DPPH | ABTS+ | CUPRAC | TPC | DPPH | ABTS+ | CUPRAC | TPC | DPPH | ABTS+ | CUPRAC | TPC |
| P.tricornutum | P15 | 0.03±0.00Aa | 0.27±0.01Aa | 42.39±1.97Bb | 58.13±0.80Aa | 0.21±0.01Bb | 0.73±0.01Aa | 50.74±0.79Bb | 130.07±3.30Aa | 0.31±0.00Bb | 14.77±0.24Bb | 698.23±10.25Aa | 497.82±4.02Bb |
| P25 | 0.03±0.00Aa | 0.28±0.00Aa | 47.22±0.60Cc | 53.93±3.58Aa | 0.24±0.01Bb | 0.72±0.07Aa | 56.85±0.21Cc | 151.94±4.29Aa | 0.36±0.00Cc | 15.27±0.19Cc | 714.82±14.67Bb | 519.28±1.31Bb | |
| P30-C | 0.05±0.00Bb | 0.35±0.01Aa | 64.23±0.77Dd | 69.22±0.58Bb | 0.31±0.00Cc | 0.74±0.01Aa | 62.90±1.19Dd | 517.98±1.57Bb | 0.45±0.00Dd | 16.96±0.11Dd | 1151.18±15.20Cc | 557.97±0.90Cc | |
| P35 | 0.03±0.00Aa | 0.29±0.01Aa | 32.20±2.10Aa | 64.78±1.09Aa | 0.15±0.00Aa | 0.63±0.01Aa | 43.50±1.10Aa | 161.94±3.21Aa | 0.18±0.00Aa | 13.89±0.19Aa | 649.06±4.90Aa | 491.14±7.78Aa | |
| S. platensis | S20-C | 0.09±0.00Cb | 5.26±0.05Dc | 78.58±1.34Eb | 717.38±4.08Fd | 0.40±0.00Db | 5.79±0.11Cb | 86.83±0.52Eb | 1325.05±25.79Fd | 0.87±0.00Fb | 37.26±0.38Gc | 7078.48±25.24Fc | 1641.55±17.65Fc |
| S25 | 0.05±0.00Ba | 3.98±0.03Ba | 64.90±0.44Da | 554.70±10.27Ca | 0.23±0.00Ba | 4.66±0.08Ba | 71.72±0.40Da | 904.60±9.43Ca | 0.68±0.01Ea | 22.95±0.38Ea | 4695.91±20.58Eb | 1139.18±7.40Da | |
| S30 | 0.05±0.00Ba | 4.09±0.06Cb | 63.69±0.09Da | 611.4±11.95Db | 0.23±0.00Ba | 4.72±0.17Ba | 70.71±0.32Da | 957.50±11.65Db | 0.68±0.01Ea | 24.09±0.65Fb | 4425.67±16.25Da | 1197.15±3.50Da | |
| S35 | 0.05±0.00Ba | 4.21±0.09Cb | 62.49±1.36Da | 668.10±13.48Ec | 0.23±0.00Ba | 4.79±0.26Ba | 69.70±0.23Da | 1010.41±14.56Ec | 0.68±0.01Ea | 25.24±0.86Fb | 4155.43±11.77Da | 1255.12±4.88Eb | |
| Species | Salt concentration | Yeast/mold count (cfu/g) | Total aerobic mesophilic bacteria count (cfu/g) |
|---|---|---|---|
| P.tricornutum | P15 | < 10 | 2.24x10⁴ |
| P25 | 1.15x10⁴ | 1.88x10⁴ | |
| P30-C | 1.25x10⁴ | >300 | |
| P35 | 1.35x10⁴ | 2.78x10⁴ | |
| S. platensis | S20-C | < 10 | >300 |
| S25 | 1x10⁴ | 1.7x10⁴ | |
| S30 | < 10 | 1.9x10⁴ | |
| S35 | < 10 | 1.21x10⁴ |
Disclaimer/Publisher’s Note: The statements, opinions and data contained in all publications are solely those of the individual author(s) and contributor(s) and not of MDPI and/or the editor(s). MDPI and/or the editor(s) disclaim responsibility for any injury to people or property resulting from any ideas, methods, instructions or products referred to in the content. |
© 2023 by the authors. Licensee MDPI, Basel, Switzerland. This article is an open access article distributed under the terms and conditions of the Creative Commons Attribution (CC BY) license (http://creativecommons.org/licenses/by/4.0/).


