Preprint
Article

Double Negative B lymphocytes are increased in patients with Systemic Lupus Erythematosus and they are correlated with early differentiated T lymphocyte subpopulations

Altmetrics

Downloads

118

Views

56

Comments

0

A peer-reviewed article of this preprint also exists.

Submitted:

07 July 2023

Posted:

10 July 2023

You are already at the latest version

Alerts
Abstract
B and T lymphocytes demonstrate important alterations in patients with Systemic Lupus Erythematous (SLE), with significant up-regulation of Double Negative (DN) B cells. Aim of this study was to evaluate correlation of T cell immunity changes with the distinct B cell-pattern SLE. In the present study, Flow cytometry was performed in 30 patients with SLE, on remission, and 31 healthy controls, to detect DN B cells (CD19+IgD-CD27-) and a wide range of T lymphocyte subpopulations, based on the presence of CD45RA, CCR7, CD31, CD28, CD57, defined as naive, memory and advanced differentiated/senescent T cells. Both B and T lymphocytes were significantly reduced in SLE patients. However, the percentage of DN B cells were increased, compared to HC, 12.9(2.3-74.2) vs. 8(1.7-35), p=0.04. Distribution of CD4 and CD8 lymphocytes demonstrated a shift to advanced differentiated subsets. The population of DN B cells had significant positive correlation with most of early differentiated T lymphocytes, CD4CD31+, CD4CD45RA+CD28+, CD4CD45RA+CD57-, CD4CD45RA-CD57-, CD4CD28+CD57-, CD4CD28+CD57+, CD4 CM, CD8 CD31+, CD8 NAÏVE, CD8CD45RA-CD57-, CD8CD28+CD57-, CD8CD28+CD57+. Multiple Regression analysis revealed CD4CD31+, CD8CD45RA-CD57- and CD8CD28+CD57- cells as independent parameters contributing to DN B cells, adjusted R2=0.534, p<0.0001. The predominance of DN B cells in patients with SLE is closely associated with early differentiated T lymphocyte subsets, indicating a potential causality role of DN B cells in T lymphocyte activation.
Keywords: 
Subject: Medicine and Pharmacology  -   Urology and Nephrology

1. Introduction

B lymphocytes represent about 10-20% of total circulating lymphocytes. They can be divided in four major subpopulations, based on the presence of IgD and CD27 surface molecules [1]. IgD, which is expressed by naïve B cells, progressively diminishes and eliminates after isotype-switching. Instead, CD27, a receptor molecule belonging to tumor necrosis factor (TNF) superfamily, is not expressed by naïve B lymphocytes, yet it appears at later differentiation stages, and its presence signifies memory B cells [2,3]. Therefore, IgD+CD27- cells are described as naïve, IgD+CD27+ cells as non-switched memory and IgD-CD27+ as switched memory B cells. Although the above 3 subtypes are clearly defined in terms of origin, differentiation and function, the fourth one, Double Negative (DN) B cells, IgD-CD27- is still an enigmatic subpopulation. The absence of IgD indicates isotype switching, while absence of CD27 specifies less differentiated cells [4,5]. For many years these cells were characterized as a naïve B cell population and they were under-recognized, yet only recently, their origin has caused major interest. Hypothetical models of their derivation have been described, based on their phenotypic and functional characteristics. Therefore, based on the increased expression of B cell lymphoma protein, similar to that of CD27+ cells, DN B cells are anticipated to originate after a defective reactions in germinal centers or derive from memory B cells following displacement or down-regulation of the CD27 molecule, during immune-senescent or immune-exhaustion process [6,7,8].
DN B cells, described as DN1 and DN2, according to the presence or absence of CD24, CD38 and CXCR5 proteins, respectively, are increased during ageing and also, in chronic inflammatory or systemic diseases, as a result of chronic stimulation [4] Systemic Lupus Erythematosus is characterized by increased expression of DN2 B cells, probably as a result of a hyper-responsiveness to Toll-like receptor-7 signaling [9]. Recent studies have shown that DN2 B cells were mainly increased in active SLE and in the presence of lupus nephritis and they were positively correlated with anti-RNA, anti-Sm and anti-RNP autoantibodies [9,10,11]. Although many efforts have been made to assess the correlation of DN B cells with markers of SLE activity, only poor literature exists in the estimation of their origin [5,6]. B cells are activated by pathogens, antigen presenting cells and, also, by T lymphocytes. We have previously described the predominance of DN B cells in SLE patients, followed by relatively increased expression of switched memory B cells (CD19+IgD-CD27+), even within patients being on remission. Moreover, DN B cells in lupus nephritis patients were significantly increased compared to end stage renal disease patients on hemodialysis [11]. Although patients on hemodialysis were selected as a representative group of patients with senescent adaptive immunity, our results proved a clear predominance of more differentiated B cell subtypes in lupus nephritis patients compared to hemodialysis [8,11]. The same was not confirmed with T lymphocyte subpopulations, in which, senescent phenotypic changes were prominent in dialysis patients [12,13].
Based on these previous findings, namely, significant increase of DN B lymphocytes in SLE patients, and important alterations in the T lymphocytes and their subsets, we decided to evaluated possible correlations between the two lymphocyte compartments in patients with lupus nephritis. T lymphocytes were divided in subpopulations, according to their differential status, and the potential correlation with DN B cells was estimated.

2. Materials and Methods

In this is a cross sectional study, we included patients with SLE in remission. After analyzing the phenotype of peripheral B and T lymphocytes, we estimated frequencies of DN B lymphocytes, and assessed potential correlation between them and T lymphocyte subsets.

2.1. Patients

The study population involved of 30 Caucasian patients with SLE, and 31 healthy controls (HC), with similar age, sex and ethnicity. Diagnosis of SLE was based on SLICC/ACR 2012 criteria[14]. Diagnosis of Lupus Nephritis in 20/30 patients was based on kidney biopsy findings.
Inclusion criteria: All participants were adults, aged 18-67years. Patients should be under regular follow-up, with available clinical, biochemical and immunological data. SLE should be stable with no flare up for at least 2 years, and their immunosuppression, at time of evaluation, could include prednisolone, hydroxychloroquine, calcineurin inhibitors and azathioprine or mycophenolate mofetil.
Exclusion criteria: Comorbidities, such as diabetes mellitus, malignancy, hematological disorder, impaired renal function, defined as eGFR<60ml/min/m2, or presence of chronic active or recent (< 6months) infection. Additionally, patients who had received monoclonal antibodies in the past, or cyclophosphamide during the last 24 months, were also excluded.
Information regarding previous historical data, medication, comorbid conditions, and disease flares were retrieved from patients’ records. At time of assessment, patients’ biochemical and immune profile were recorded and the SLEDAI score was used to estimate activity of SLE [15].
The study was approved by the Institutional Review Board of the Medical School of Aristotle University of Thessaloniki, Greece. All participants were informed prior to enrollment, and signed the written consent.

2.2. Flow cytometry

Heparinized venous blood from SLE patients and healthy control individuals was drown under sterile conditions and collected in EDTA tubes. Within 12hours following collection, samples proceeded for the evaluation, of total white cell count, total lymphocytes, B and T lymphocytes, and further analysis for CD4 and CD8 subtypes.
The expression of IgD and CD27 on B lymphocytes and of CD45RA, CCR7, CD28, CD31, CD57, on both CD4 and CD8 T lymphocytes was assessed using a cytometer (Navios Flow Cytometer, Beckman Coulter) as described before [8]. The expression of the above certain surface molecules examined, determined divergent subpopulations. Proportions and counts of all lymphocyte subsets were estimated.

2.3. Flow cytometry reagents

The monoclonal antibodies used in flow cytometry to identify lymphocyte surface receptors, were CD45 PC7, CD19 PC5, IgD FITC and CD27 ECD for B lymphocytes and CD45 PC7, CD3 FITC, CD4 Pacific Blue, CD8 PC5, CD45RA APC, CCR7 PE, CD28 ECD, CD57 FITC, CD31 ECD for CD4 and CD8 lymphocytes.
We used three different tubes (for B, CD4 and CD8 lymphocytes) and combination of estimated receptors resulted in the definition of the following subpopulations.

2.4. Definition of lymphocyte subpopulations

B lymphocyte subpopulation definition was based on the expression of CD27 and IgD surface molecules, and described as naïve (CD19+IgD+CD27-), non-switched and switched memory (CD19+IgD+CD27+ and CD19+IgD+CD27-, respectively), and double negative (DN) B cells (CD19+IgD-CD27-).
Classification of CD4 and CD lymphocytes was based on the presence of the above described surface receptors and described as early differentiated, memory and senescent/advanced differentiated cells..
A. Early differentiated CD4 or CD8 lymphocytes which expressed
1. CD31, CD4+CD31+ and CD8+CD31+, defined as Recent Thymic Emigrants (RTE),
2. CD45RA together with CCR7, CD4+CD45RA+CCR7+ and CD8+CD45RA+CCR7+, defined as Naïve CD4 or CD8 lymphocytes,
3. CD28 and not CD57, CD4CD28+CD57- and CD8CD28+CD57-
4. CD45RA and not CD57, CD4CD45RA+CD57- and CD8CD45RA+CD57-
5. neither CD45RA nor CD57, CD4CD45RA-CD57- and CD8CD45RA-CD57-
B. In the group of memory cells, CD4 or CD8 lymphocytes which expressed
1. CCR7 and not CD45RA, CD4+CD45RA-CCR7+ and CD8+CD45RA-CCR7+, defined as Central memory (CM),
2. neither CCR7 nor CD45RA, CD4+CD45RA-CCR7- and CD8+CD45RA-CCR7-, defined as Effector memory (EM),
C. In the group of Senescent/Advanced differentiated cells,
1. T cells expressing CD45RA and not CCR7, CD4+CD45RA+CCR7- and CD8+CD45RA+CCR7-, defined as EMRA,
2. T cells lacking CD28 molecule, CD4CD28- and CD8CD28-, and their subtypes according to the presence of CD57, CD4+CD28-CD57-, CD4+CD28-CD57+ and CD8+CD28-CD57-, CD8+CD28-CD57+
3. T cells expressing both CD45RA and CD57, CD4CD45RA+CD57+ and CD8CD45RA+CD57+
Gating strategies for B and T lymphocyte subpopulations are described on the supplement file, Figure 1 and Figure 2.

2.5. Statistical analysis

Statistical analysis was performed using the Statistical Package for Social Sciences (SPSS Inc., Chicago, IL, USA) version 27.0, for windows. All continues variables were initially tested for normality of distribution, by using the Shapiro-Wilk and/or the Kolmogorov-Smirnov test.
Normally distributed variables were expressed as Mean±Standard Deviation, and Student’s t test for independent samples was performed to compare differences between two groups. Data from Non–parametric variables were expressed as Median and Range, or interquartile range, and Mann Whitney U test was used to assess differences between two groups. Pearson’s and Spearman’s correlation tests were applied to compare variables with normal or non-normal distribution, respectively. Multiple regression analysis was performed to estimate independent factors correlated with DN B lymphocytes, as the dependent variable.
Values of p<0.05 (two-tailed) were considered as statistically significant.

3. Results

3.1. Characteristics of SLE patients

Thirty patients with SLE (29 female) and 31 healthy individuals (17 female), of similar age, sex and ethnicity, were included in the study.
According to inclusion criteria, all SLE patients were in complete or partial remission, under stable treatment for the last 24 months, which included hydroxychloroquine in 30/30 (100%), steroids in 24/30 (80%), MMF in 18/30 (60%) and CNIs in 9/30 (30%) or combination of MMF+CNIs in 5/30 (16.7%). Time since patients were on the above regimes were 84(45-125)months for hydroxychloroquin, 78(45-92)months for steroids, 53(37-65)months for MMF and 42(28-56)months for CNIs.
Twenty patients (67%) had been given cyclophosphamide in the past, more than 2 years ago, while no-one had received monoclonal antibodies in the past.
Clinical and laboratory findings of patients are depicted on Table 1.
Median time since the initial diagnosis of SLE was 84(45-125)months. SLEDAI score was estimated to 10(2-18) at time of diagnosis and 2(1-5) at time of evaluation. Twenty patients had LN, diagnosed with renal biopsy, performed not more than 5 years prior to evaluation. Mean SCr at time of assessment was 0.89±0.17mg/dl, eGFR 81±19ml/min/1.73m2, Uprot 680±5.600mg/24hr, C3 and C4 levels at time of evaluation were 74.65(29.9-127)mg/dl and 15.7(3.86-27.2)mg/dl, respectively.

3.2. Phenotypic analysis of B lymphocytes in patients with SLE and in HC
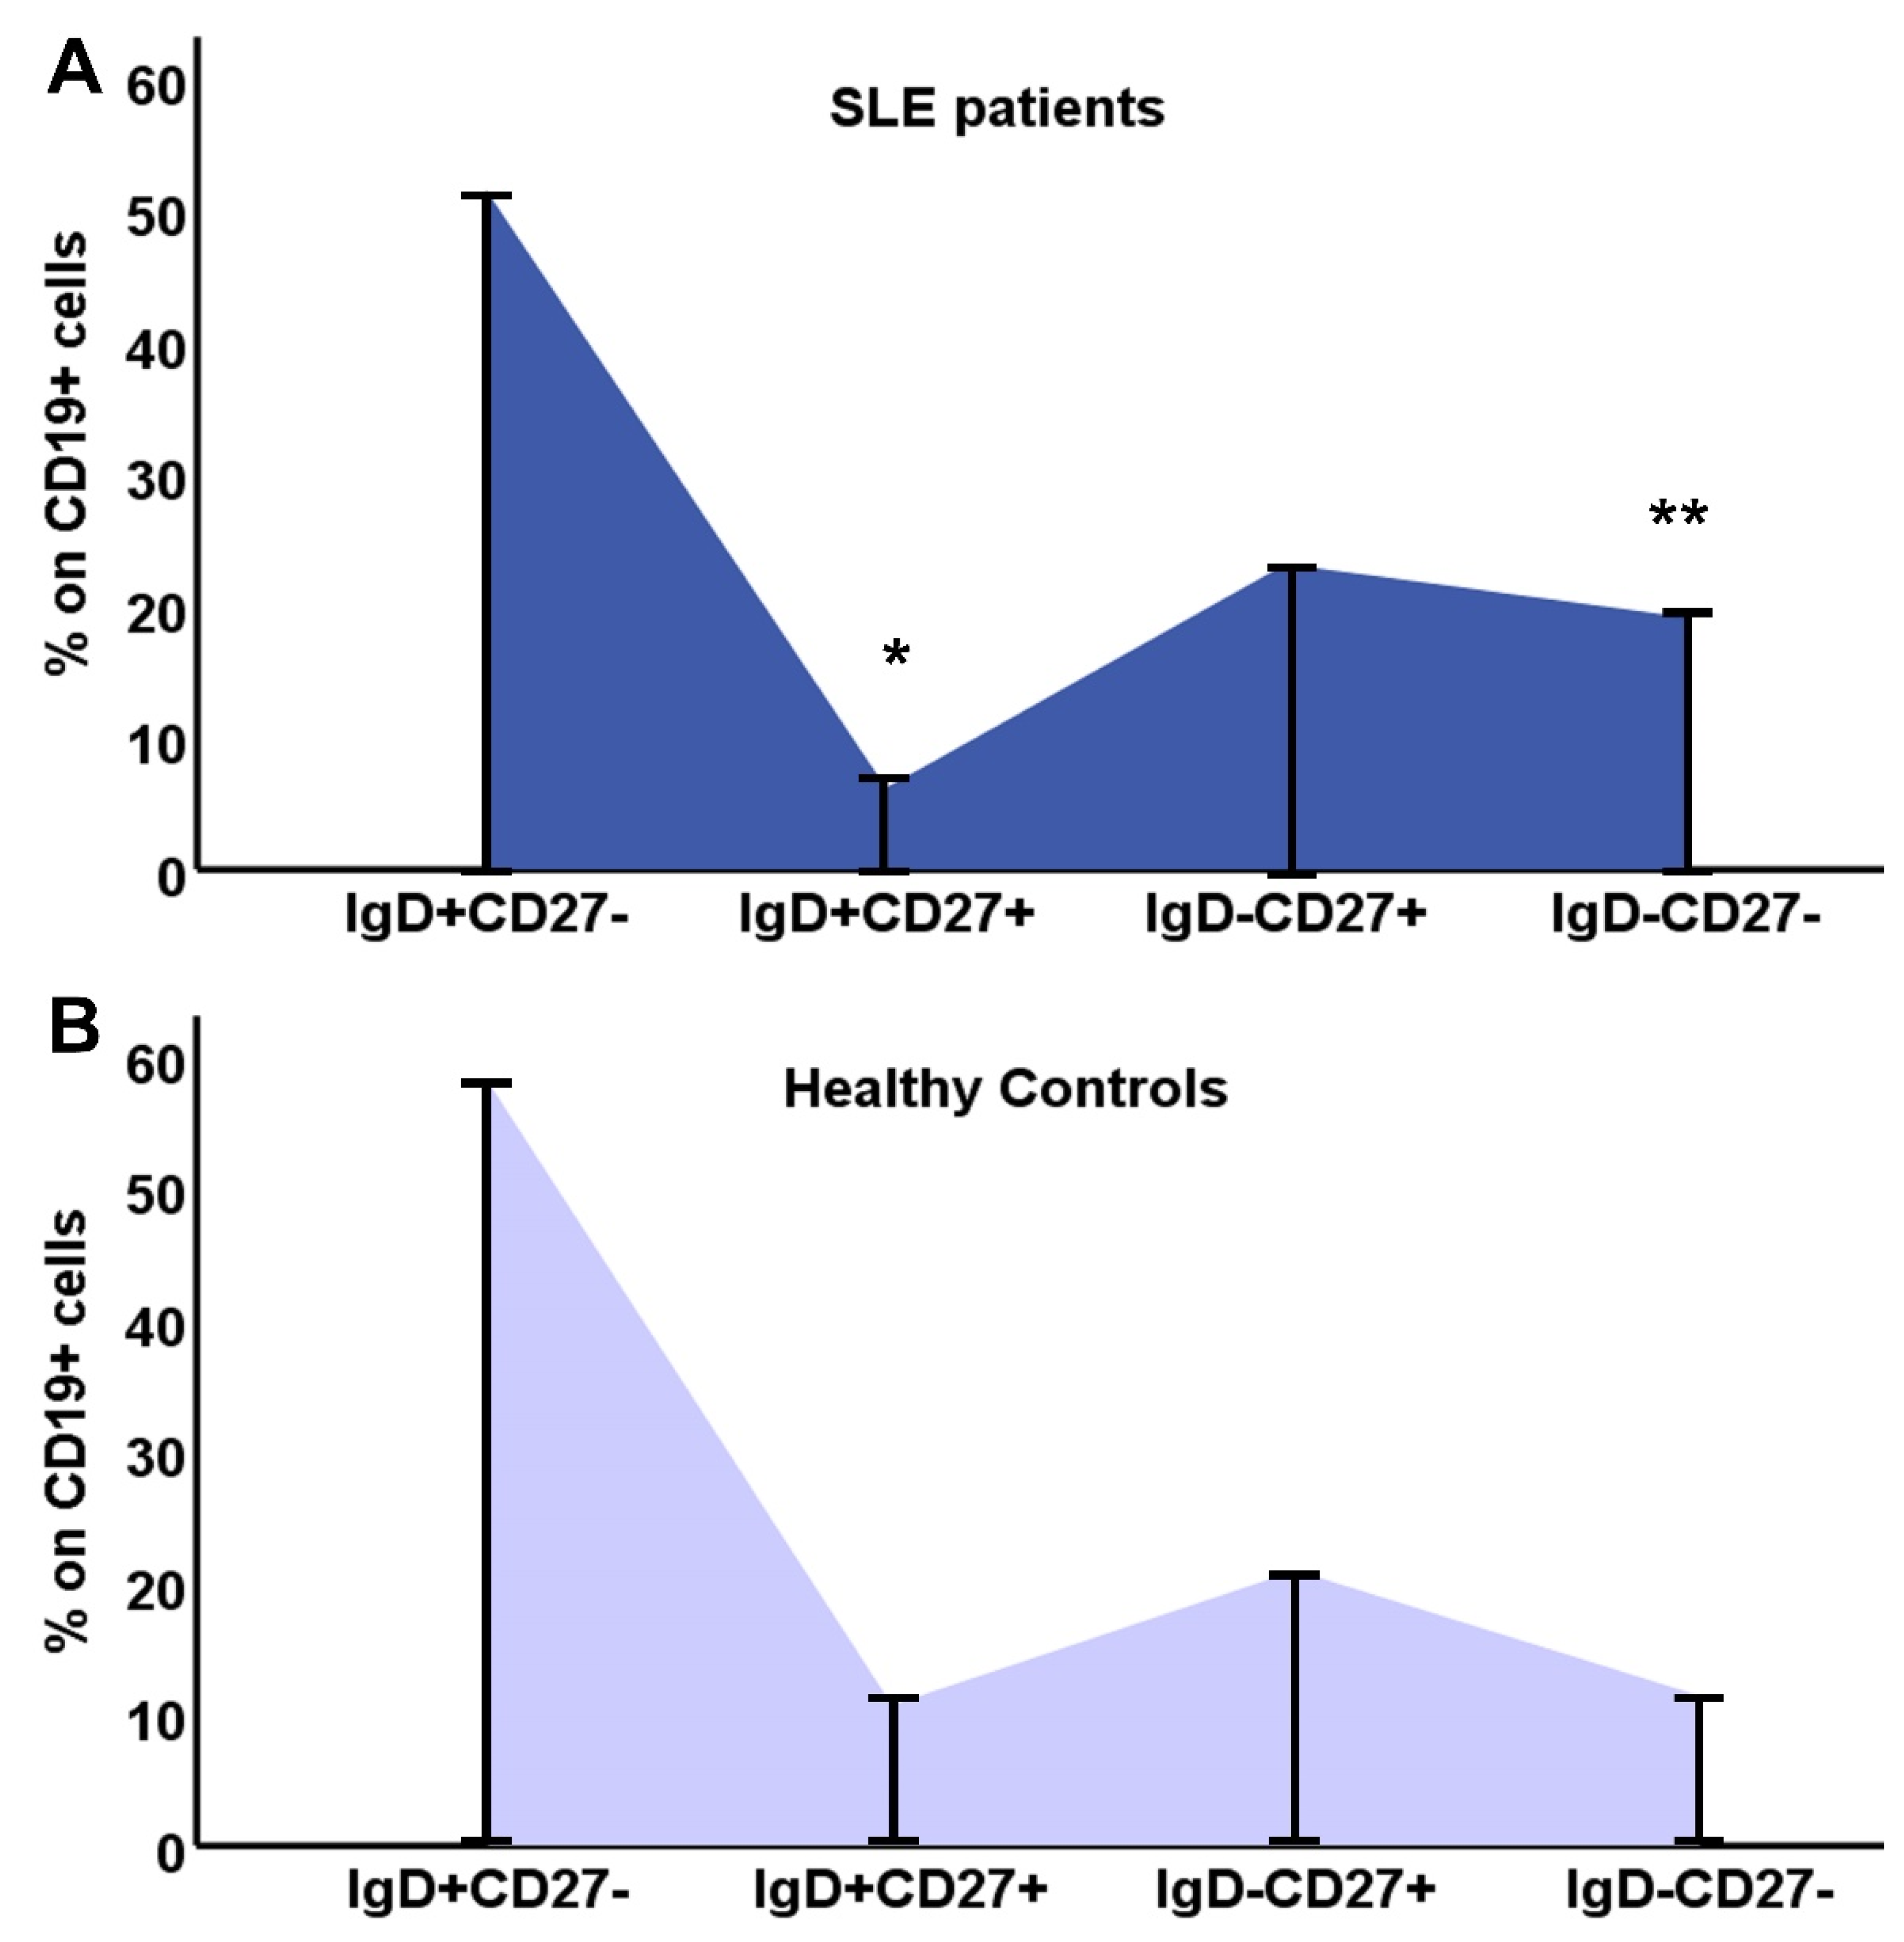
Differences in B lymphocytes and their subpopulations are shown on Table 2. SLE patients had significantly reduced percentage of B cells, and also, reduced proportions of CD19+IgD+CD27+ and CD19+IgD-CD27+ cells, with a clear shift to CD19+IgD-CD27- (DN) B cells. Population of B lymphocytes was significantly reduced compared to controls, almost 1/3 of the HC group, and this reduction affected CD19+IgD+CD27- and CD19+IgD+CD27+ cells (Table 2).
As the DN B cell population was the only one with an increased percentage within B lymphocytes, we calculated the ratio of (IgD-CD27-)/[(IgD+CD27-)+(IgD-CD27+)+ (IgD+CD27+)] in SLE patients and controls, and found a significant difference 0.14(0.02-2.9) vs. 0.08(0.02-0.54), respectively, p=0.04
The distribution of B lymphocyte subtypes and the differences between SLE patients and controls are depicted in Figure 1.
Figure 1. Distribution of B lymphocyte subtypes, IgD+CD27-, IgD+CD27+, IgD-CD27+, IgD-CD27-, in SLE patients (A) and HC (B).
Preprints 78875 g001

3.3. Phenotypic analysis of T lymphocytes in SLE patients and HC

CD4 and CD8 lymphocyte subpopulations were classified as early differentiated, memory and advanced differentiated/senescent cells. Classification was based on their phenotypic characteristics, namely the presence of specific surface receptors.
In SLE patients, there was a significant reduction of the whole cohort CD4 but not of the CD8 lymphocytes. More specifically, almost all early differentiated and memory CD4 subtypes were significantly reduced in SLE patients, as were the CD4 EMRA cells. The expression of CD28 molecule on CD4 lymphocytes was reduced but not statistically significant (Table 3).
Regarding CD8 lymphocytes, CD8EMRA (CD8CD45RA+CCR7-) and CD8EMRACD28- (CD8CD45RA+CCR7-CD28-) cells showed a statistically significant reduction in SLE patients, compared to controls, which proved a lessening in the senescent phenotype, together with a shift to CM and early differentiated CD8 subtypes (Table 4).

3.4. Distribution of CD4 and CD8 subtypes according to their differentiation status
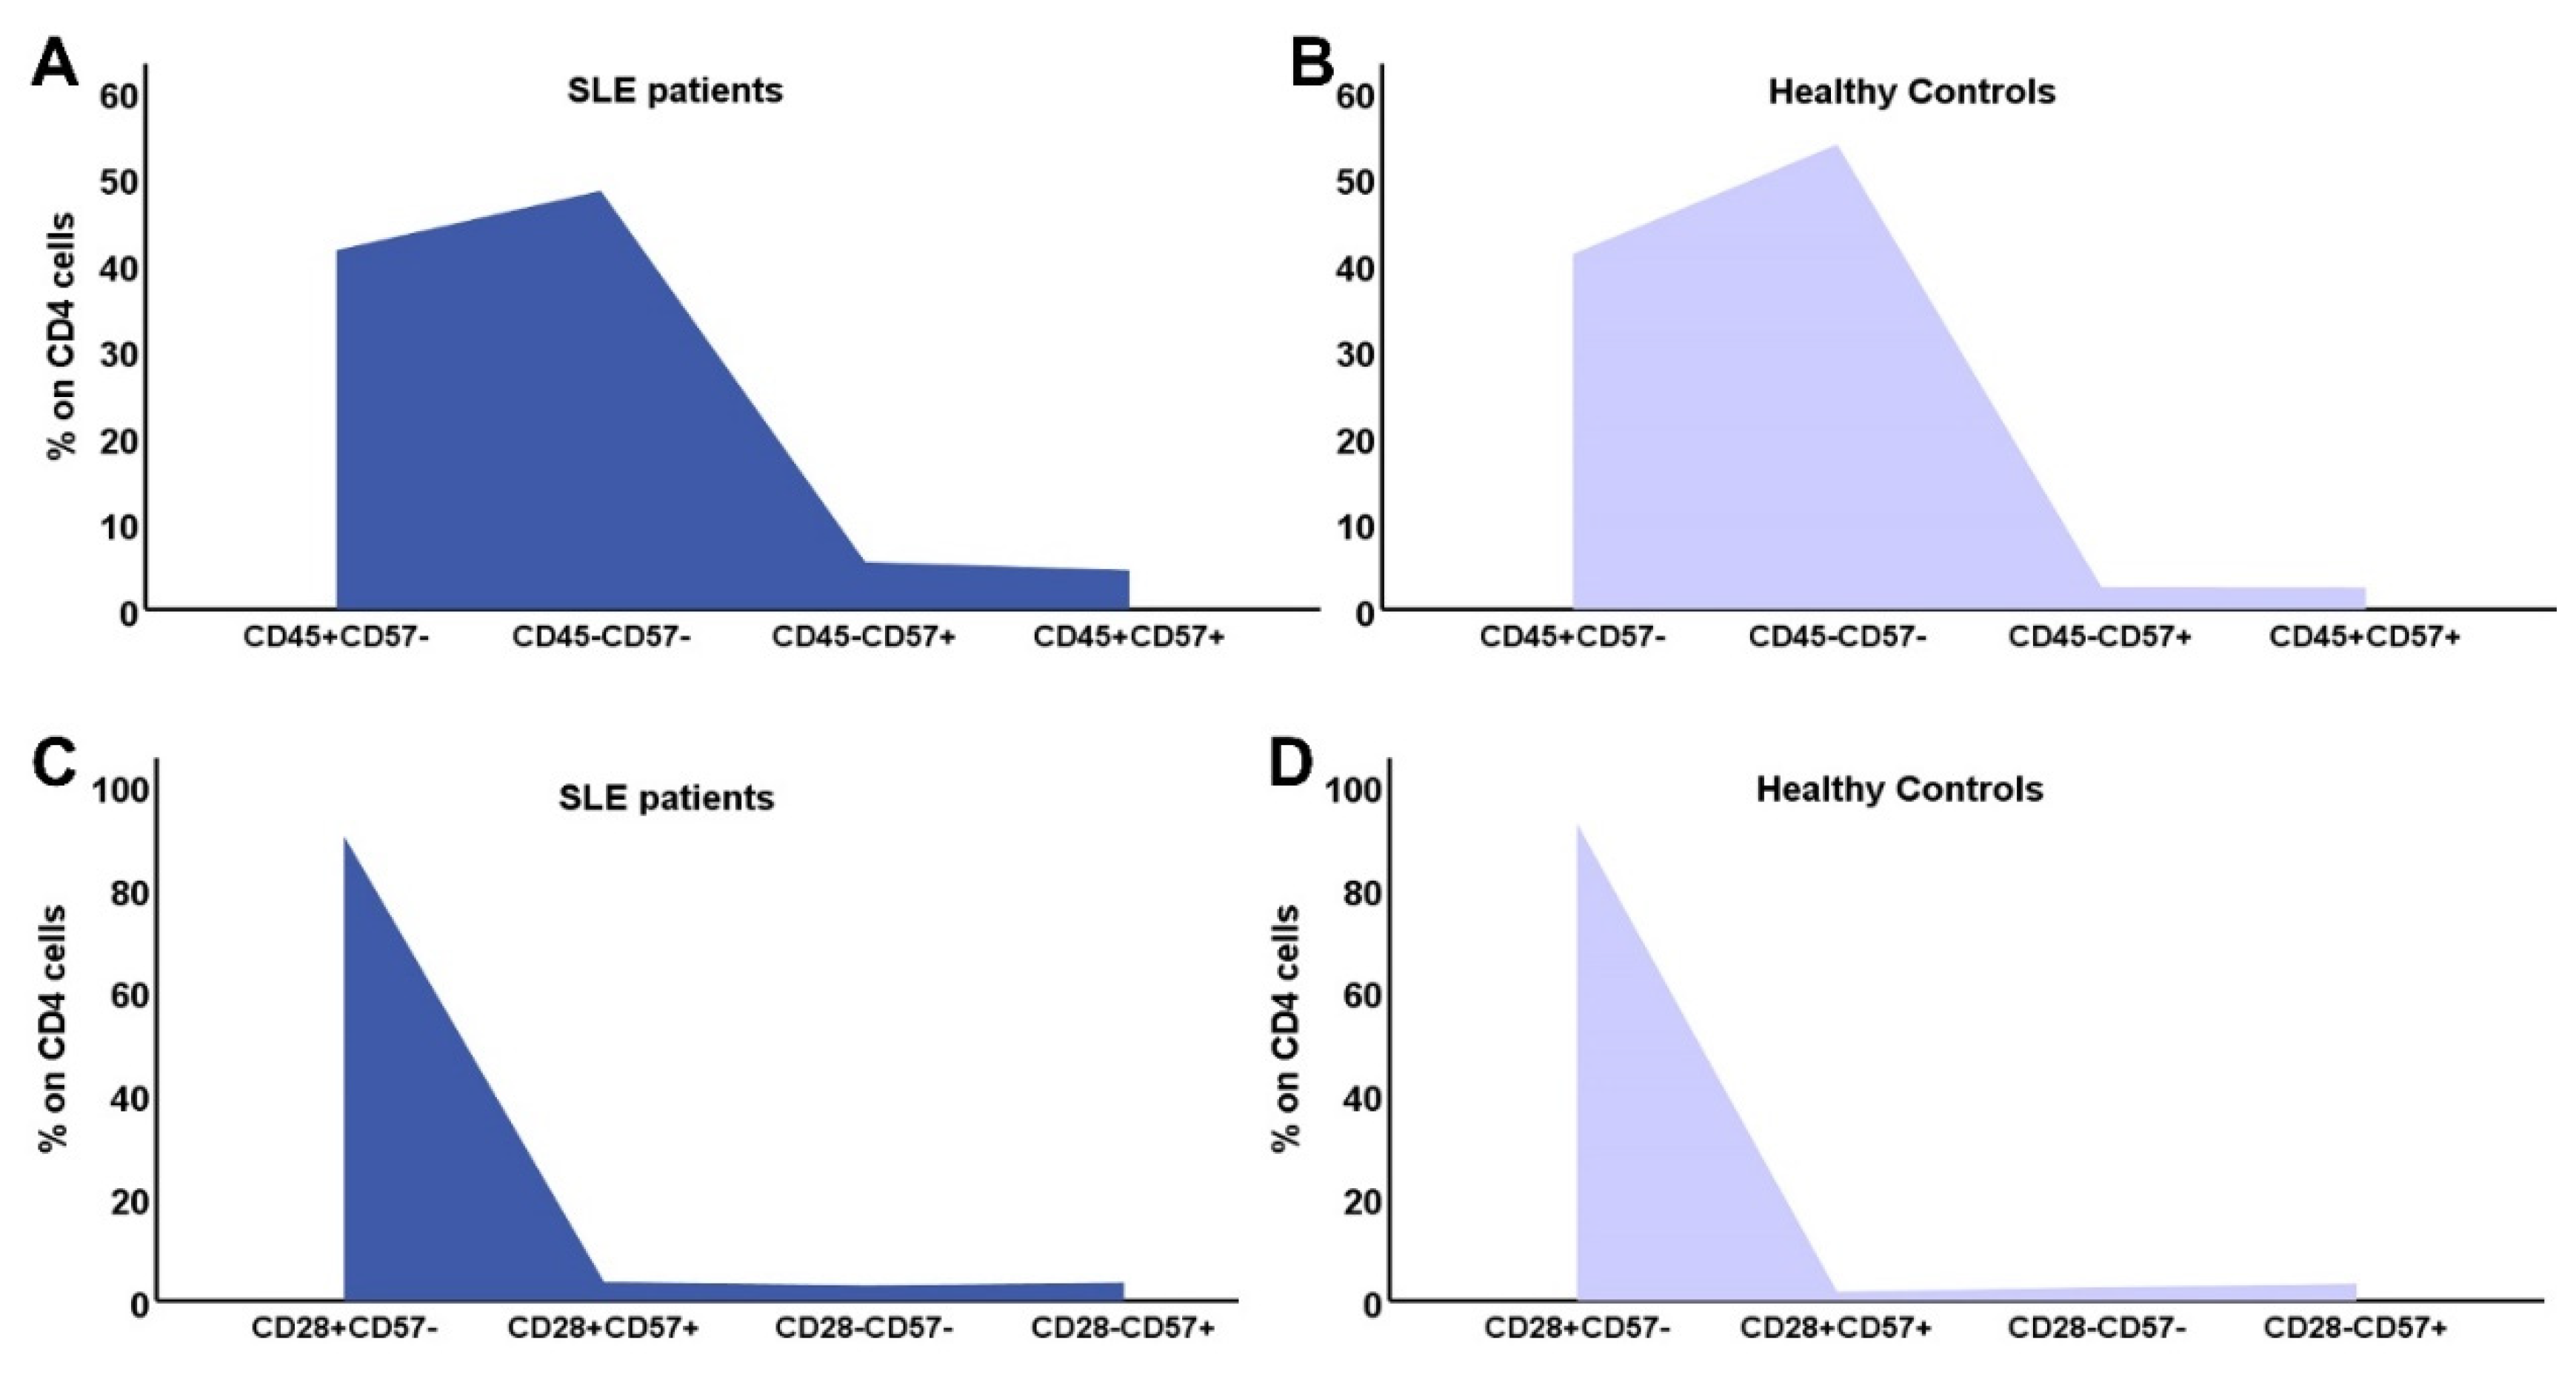
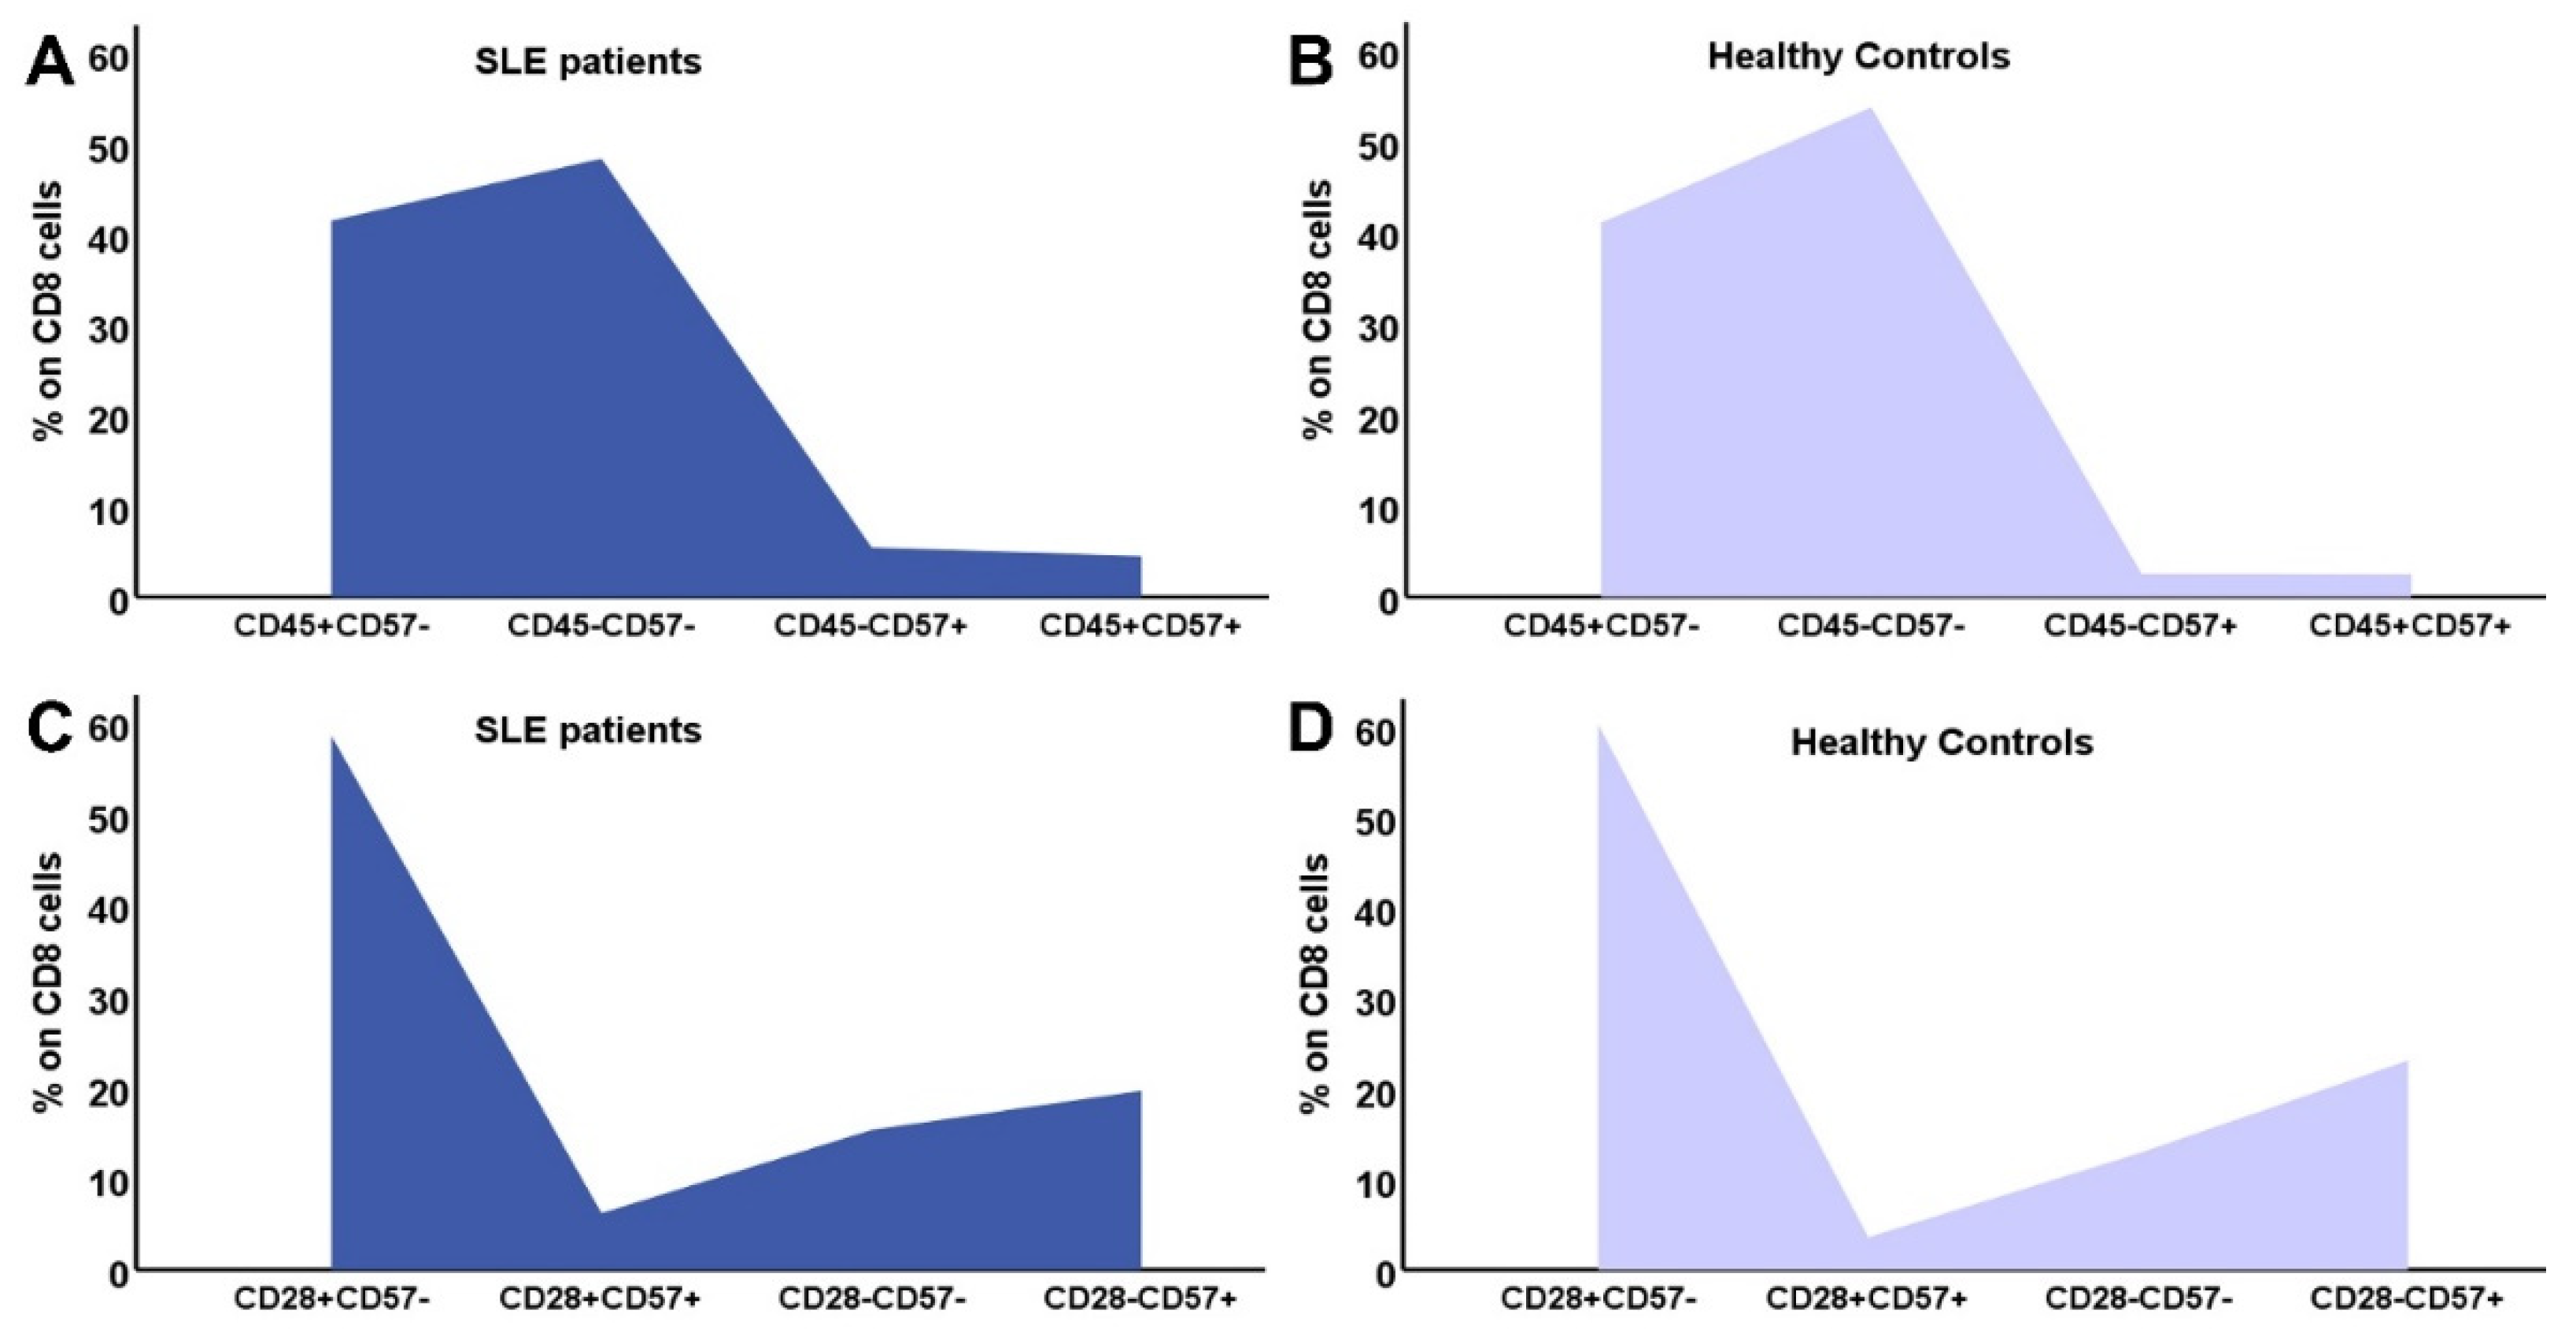
In Figure 2 and Figure 3 the differences in CD4 and CD8 subpopulations are depicted. According to the presence or absence of CD45RA, CD28 and CD57 molecule, T lymphocytes where divided in subgroups, and their percentages were calculated in SLE patients and HC.
Figure 2. Distribution of CD4 subtypes: the combination of CD45RA expression and CD57 in SLE patients (A) and controls (B), CD28 and CD57 in SLE patients (C) and HC (D).
Preprints 78875 g002
Figure 3. Distribution of CD8 subtypes: the combination of CD45RA expression and CD57 in SLE patients (A) and controls (B), CD28 and CD57 in SLE patients (C) and HC (D).
Preprints 78875 g003

3.5. Correlation of DN B cells with B lymphocyte subpopulations

Table 5 describes correlation of DN B cells with the rest B cell subpopulations, in SLE and HC. Multiple regression analysis, with DN cells as dependent and the rest of B cell populations as independent factors showed that in both patients and controls CD19+IgD-CD27+ was the only independent parameter correlated to DN B cells, R2=0.68, p=0.001 for patients and R2=0.7, p<0.0001, for HC.

3.6. Correlation of DN B cells with T lymphocyte subpopulations

3.6.1. Correlation with CD4 cells

Both in patients and controls, DN B cells showed a significant positive correlation with the number of CD4 cells. In HC DN B cells showed a positive correlation with few of the early differentiated CD4 subsets, namely CD4CD45RA+CD57- and CD4CD28+CD57-, while in SLE patients, almost all early differentiated CD4 subtypes had a significant positive correlation with DN B cells, RTEs, and all subtypes lucking CD57 and expressing CD28 on their membrane. CM CD4 cells also correlated to DN B cells.

3.6.2. Correlation with CD8 cells

Regarding CD8 lymphocytes, DN B cells in HC had no significant correlation neither with CD8 cells, nor with their subpopulations. On the other hand, in SLE patients DN B cells showed major association with RTEs, Naïve CD8 cells, CD8CD45RA-CD57-, CD8CD28+CD57- and CD8CD28+CD57+. No correlation was evident with memory or senescent CD8 cells.
Correlations of DN B cells with CD4 and CD8 lymphocyte counts and their susets are depicted on Table 6, demonstrating the significant association with early differentiated T lymphocytes.
Multiple Regression analysis, including DN B cells as dependent and CD4, CD8 as independent variables showed that, for SLE patients, CD8 cells was the independent parameter associated with DN B cells, R2=0.277, p=0.01, b coefficient=0.032, CI=0.01-0.05, p=0.006
Therefore, CD8 subpopulations were included in a new multiple regression analysis, which revealed a model including CD8CD45RA-CD57- and CD8CD28+CD57- as the only independent factors related to DN B cells, with adjusted R2=0.464, p<0.0001.
The above model remained stable after adding the rest of CD8 and CD4 subtypes, but was benefited by adding CD4CD31+ cells. Therefore, the model including CD8CD45RA-CD57-, CD8CD28+CD57- and CD4CD31+ cells had an adjusted R2=0.534, p<0.0001.

4. Discussion

The present study was performed in an attempt to estimate possible correlation between T cell immunity with DN B lymphocytes in patients with SLE. DN B cells consist certain subpopulation, which is significantly increased in elderly, but also in several chronic inflammatory diseases, including SLE [7,11,16,17,18]. Their origin, function and differential status is still unclear, as they carry characteristics of both naïve, switched memory and immune-exhausted cells [6,7]. They may originate from early termination of the GC reaction, from switched memory B cells or from naïve resting B cells [6].
We have previously described the significant elevation, up to three-fold, of DN B cells in SLE patients compared to healthy controls [11]. Here we describe a close association of this subtype with certain, less differentiated CD4 and CD8 lymphocyte subpopulations, namely, CD4CD31+, CD4CD45RA+CD28+, CD4CD45RA+CD57-, CD4CD45RA-CD57-, CD4CD28+CD57-, CD4CD28+CD57+, CD8CD31+, Naïve CD8, CD8CD45RA+CD28+, CD8CD45RA-CD57-, CD8CD28+CD57-, and CD8CD28+CD57+ and also, CM CD4 cells. Very interestingly, almost all naïve or at early differentiated T lymphocyte subsets studied showed positive correlation with DN B cells, while no such association was evident for advanced differentiated T cells. Similar correlations were not evident in the healthy control population.
SLE, as well as other systemic autoimmune diseases, is associated with significant increase of DN B lymphocytes, both DN1 and DN2. From those DN2 B cells, are most important, as they act as antigen presenting cells and stimulate T cell response, differentiate into antibody secreting cells, secrete cytokines and modulate immune response, sustained autoimmunity and inflammation [16,17,18,19]. DN2 B lymphocytes share similar characteristics with naïve B lymphocytes, such as the absence of CXCR5, CD24 and CD38 surface molecules, which are common in the rest of peripheral B lymphocyte subsets, but also retain a unique phenotype, expressing CD69, HLA-DR, CD86 and the regulatory receptors CD32b and CD22, and lacking the lymph node homing receptor L-selectin (CD62L) [7,9,20]
Both DN2 and naïve B lymphocytes express a T-bet transcriptional network, with upregulation of Toll-like receptor-7 (TLR7) and simultaneous reduction of its negative regulators, such as TRAF5 [9]. As a result, DN2 and naïve B cells are hyper-responsive to TLR7. Stimulation with TLR7 induces phosphorylation of ERK and MAPKp38 pathways, resulting in their continuing activation, production of autoantibodies and generation of peripheral plasmablasts [21]. Most studies described the above changes in active SLE and active lupus nephritis [22]. Our patients displayed increased DN B lymphocytes while being in remission, indicating that despite clinical repression, B cell compartment still demonstrates abnormal distribution. However, in the present study, we did not estimate expression of CXRC5, the receptor which distinguishes DN1 (CXCR5+) from DN2 (CXCR5-) B lymphocytes. Previous studies have shown that DN2 cells are increased during disease flares and their levels correlate with autoantibody production [9,22].
Although there are several studies confirming predominance and expansion of DN B lymphocytes in SLE patients, and significant correlation with disease pathogenesis, there is only scarcely evidence regarding factors that may stimulate their production [23,24]. Correlation between DN B lymphocytes and recent thymic emigrant cells, almost all naïve CD4 and CD8 and central memory CD4 lymphocytes, described in our study, is a completely novel finding which indicates, but cannot prove, causality. Previous studies have shown increased expression of DN B lymphocytes in the cerebrovascular fluid of patients with Multiple Sclerosis, and revealed a T cell stimulatory and proinflamatory function [25]. Similarly, in Rheumatoid arthritis, DN B lymphocytes seemed to actively influence disease activity and were dowregulated by anti-TNFa treatment [26]. However, in other studies, the significantly increased levels of DN B lymphocytes were characterized by low expression of HLA-DR, CD40 and CD80 surface molecules, indicating their incapacity to act as antigen presenting cells or interact with T lymphocytes [26]. In elderly patients DN B cells seemed to behave more as senescent or exhausted cells rather than naïve B cells [27,28]. Senescent phenomena were not found to predominate in SLE [11,12] although they are prominent findings in chronic inflammatory diseases [29,30].
Activation of T lymphocytes and upregulation of DN B lymphocytes seem to happen simultaneously, and it remains unclear whether a common pathogenic mechanism orchestrates the whole reaction, or DN B lymphocytes are themselves implicated in the stimulation of naïve, early differentiated and memory peripheral T lymphocytes. Our findings of close association between DN B cells and early differentiated T lymphocytes in patients with SLE, raise the possibility that DN B lymphocytes are characterized by unique and important characteristics and play a major role in the alterations of adaptive immunity.

Author Contributions

Conceptualization, E.M. and M.S.; methodology, E.M.; software, D-I.B. and S.B.; validation, A.X., G.L. and M.C.; formal analysis, D-I.B.; investigation, M.C. and S.S.; resources, A.I. and M.I.; data curation, D.I.; writing—original draft preparation, E.M.; writing—review and editing, A.F. and M.S.; supervision, A.F. and M.S.; funding acquisition, M.S. All authors have read and agreed to the published version of the manuscript.

Funding

This research received no external funding.

Institutional Review Board Statement

The Institutional Review Board of the. The study was conducted in accordance with the Declaration of Helsinki, and approved by the Institutional Review Board of the Medical School of Aristotle University of Thessaloniki, Greece. Protocol code 254, date of approval 15/3/2020.

Informed Consent Statement

Informed consent was obtained from all subjects involved in the study.

Data Availability Statement

All data are available upon request from the authors.

Conflicts of Interest

The authors declare no conflict of interest.

References

  1. Klein U, Rajewsky K, Küppers R. Human immunoglobulin (Ig)M+IgD+ peripheral blood B cells expressing the CD27 cell surface antigen carry somatically mutated variable region genes: CD27 as a general marker for somatically mutated (memory) B cells. J Exp Med 1998;188:1679–89. [CrossRef]
  2. Shi Y, Agematsu K, Ochs HD, Sugane K. Functional analysis of human memory B-cell subpopulations: IgD+CD27+ B cells are crucial in secondary immune response by producing high affinity IgM. Clin Immunol 2003;108(2):128-37. [CrossRef]
  3. Borst J, Hendriks J, Xiao Y. CD27 and CD70 in T cell and B cell activation. Curr Opin Immunol 2005;17(3):275-81. [CrossRef]
  4. Beckers L, Somers V, Fraussen J. IgD-CD27- double negative (DN) B cells: Origins and functions in health and disease. Immunol Lett 2023;255:67-76. [CrossRef]
  5. Li Y, Li Z, Hu F. Double-negative (DN) B cells: An under-recognized effector memory B cell subset in autoimmunity. Clin Exp Immunol 2021;205(2):119-127. [CrossRef]
  6. Beckers L, Somers V, Fraussen J. IgD-CD27- double negative (DN) B cells: Origins and functions in health and disease. Immunol Lett 2023;255:67-76. [CrossRef]
  7. Li Y, Li Z, Hu F. Double-negative (DN) B cells: An under-recognized effector memory B cell subset in autoimmunity. Clin Exp Immunol 2021;205(2):119-127. [CrossRef]
  8. Lioulios G, Fylaktou A, Xochelli A, Sampani E, Tsouchnikas I, Giamalis P, Daikidou DV, Nikolaidou V, Papagianni A, Theodorou I, Stangou M. Clustering of End Stage Renal Disease Patients by Dimensionality Reduction Algorithms According to Lymphocyte Senescence Markers. Front Immunol 2022;13:841031. [CrossRef]
  9. Jenks SA, Cashman KS, Zumaquero E, Marigorta UM, Patel AV, Wang X, Tomar D, Woodruff MC, Simon Z, Bugrovsky R, Blalock EL, Scharer CD, Tipton CM, Wei C, Lim SS, Petri M, Niewold TB, Anolik JH, Gibson G, Lee FE, Boss JM, Lund FE, Sanz I. Distinct Effector B Cells Induced by Unregulated Toll-like Receptor 7 Contribute to Pathogenic Responses in Systemic Lupus Erythematosus. Immunity 2018;49(4):725-739.e6. [CrossRef]
  10. Szelinski F, Lino AC, Dörner T. B cells in systemic lupus erythematosus. Curr Opin Rheumatol 2022;34(2):125-132. PMID: 34939607. [CrossRef]
  11. Moysidou E, Lioulios G, Xochelli A, Nikolaidou V, Christodoulou M, Mitsoglou Z, Stai S, Fylaktou A, Papagianni A, Stangou M. Different Types of Chronic Inflammation Engender Distinctive Immunosenescent Profiles in Affected Patients. Int J Mol Sci. 2022;23(23):14688. [CrossRef]
  12. Lioulios G, Mitsoglou Z, Fylaktou A, Xochelli A, Christodoulou M, Stai S, Moysidou E, Konstantouli A, Nikolaidou V, Papagianni A, Stangou M.Exhausted but Not Senescent T Lymphocytes Predominate in Lupus Nephritis Patients. Int J Mol Sci 2022;23(22):13928. [CrossRef]
  13. Sampani E, Vagiotas L, Daikidou DV, Nikolaidou V, Xochelli A, Kasimatis E, Lioulios G, Dimitriadis C, Fylaktou A, Papagianni A, Stangou M. End stage renal disease has an early and continuous detrimental effect on regulatory T cells. Nephrology (Carlton) 2022;27(3):281-287. [CrossRef]
  14. Shang Q, Yip GW, Tam LS, Zhang Q, Sanderson JE, Lam YY, Li CM, Wang T, Li EK, Yu CM.SLICC/ACR damage index independently associated with left ventricular diastolic dysfunction in patients with systemic lupus erythematosus. Lupus. 2012;21(10):1057-62. [CrossRef]
  15. Gladman DD, Ibañez D, Urowitz MB.Systemic lupus erythematosus disease activity index 2000. J Rheumatol 2002;29(2):288-91.
  16. Zheng J, Zhu L, Ju B, Zhang J, Luo J, Wang Y, Lv X, Pu D, He L, Wang Peripheral immunophenotypes associated with the flare in the systemic lupus erythematosus patients with low disease activity state. J. Clin Immunol 2022;245:109166. [CrossRef]
  17. Liossis SC, Staveri C. The Role of B Cells in Scleroderma Lung Disease Pathogenesis. Front Med (Lausanne) 2022;9:936182. [CrossRef]
  18. Wang Y, Lloyd KA, Melas I, Zhou D, Thyagarajan R, Lindqvist J, Hansson M, Svärd A, Mathsson-Alm L, Kastbom A, Lundberg K, Klareskog L, Catrina AI, Rapecki S, Malmström V, Grönwall C.Rheumatoid arthritis patients display B-cell dysregulation already in the naïve repertoire consistent with defects in B-cell tolerance. Sci Rep 2019;9(1):19995. [CrossRef]
  19. Claes N, Fraussen J, Vanheusden M, Hellings N, Stinissen P, Van Wijmeersch B, Hupperts R, Somers V. Age-Associated B Cells with Proinflammatory Characteristics Are Expanded in a Proportion of Multiple Sclerosis Patients. J Immunol 2016;197(12):4576-4583. [CrossRef]
  20. Ehrhardt GR, Hijikata A, Kitamura H, Ohara O, Wang JY, Cooper MD. Discriminating gene expression profiles of memory B cell subpopulations. J. Exp. Med 2008;205, 1807–1817. [CrossRef]
  21. Buchta C, Bishop G. TRAF5 negatively regulates TLR signaling in B lymphocytes. J Immunol 2014;192, 145–150. [CrossRef]
  22. You X, Zhang R, Shao M, He J, Chen J, Liu J, Zhang X, Liu X, Jia R, Sun X, Li Z. Double Negative B Cell Is Associated With Renal Impairment in Systemic Lupus Erythematosus and Acts as a Marker for Nephritis Remission. Front Med (Lausanne). 2020;7:85. [CrossRef]
  23. Agematsu K, Hokibara S, Nagumo H, Shinozaki K, Yamada S, Komiyama A. Plasma cell generation from B-lymphocytes via CD27/CD70 interaction. Leuk Lymphoma 1999;35(3-4):219-25. [CrossRef]
  24. CD70-mediated CD27 expression downregulation contributed to the regulatory B10 cell impairment in rheumatoid arthritis. Shi L, Hu F, Zhu L, Xu C, Zhu H, Li Y, Liu H, Li C, Liu N, Xu L, Mu R, Li Z. Mol Immunol 2020;119:92-100. [CrossRef]
  25. Claes N, Dhaeze T, Fraussen J, Broux B, Van Wijmeersch B, Stinissen P, Hupperts R, Hellings N, Somers V. Compositional changes of B and T cell subtypes during fingolimod treatment in multiple sclerosis patients: A 12-month follow-up study. PLoS ONE. 2014 Oct 31;9(10):e111115. [CrossRef]
  26. Moura RA, Quaresma C, Vieira AR, Gonçalves MJ, Polido-Pereira J, Romão VC, Martins N, Canhão H, Fonseca JE.B-cell phenotype and IgD-CD27- memory B cells are affected by TNF-inhibitors and tocilizumab treatment in rheumatoid arthritis. PLoS ONE. 2017;12(9):e0182927. [CrossRef]
  27. Colonna-Romano G, Bulati M, Aquino A, Pellicanò M, Vitello S, Lio D, Candore G, Caruso C.A double-negative (IgD-CD27-) B cell population is increased in the peripheral blood of elderly people. Mech Ageing Dev. 2009;130(10):681-90. [CrossRef]
  28. Bulati M, Buffa S, Candore G, Caruso C, Dunn-Walters DK, Pellicanò M, Wu YC, Colonna Romano G.B cells and immunosenescence: A focus on IgG+IgD-CD27- (DN) B cells in aged humans. Ageing Res Rev. 2011;10(2):274-84. [CrossRef]
  29. Liu Z, Liang Q, Ren Y, Guo C, Ge X, Wang L, Cheng Q, Luo P, Zhang Y, Han X Immunosenescence: Molecular mechanisms and diseases. Signal Transduct Target Ther 2023;8(1):200. [CrossRef]
  30. Shen CY, Lu CH, Wu CH, Li KJ, Kuo YM, Hsieh SC, Yu CL. Molecular Basis of Accelerated Aging with Immune Dysfunction-Mediated Inflammation (Inflamm-Aging) in Patients with Systemic Sclerosis. Cells. 2021;10(12):3402. [CrossRef]
Table 1. Clinical and laboratory characteristics of SLE patients and healthy controls at time of assessment.
SLE HC p
n 30 31 SLE vs. HC
Age (yrs) 43±14 49±13 NS
Time since diagnosis (mo) 84(45-125) - -
SLEDAI score 2(1-5)
Laboratory results
WCC (cells/μL) 7200(3350) 6400(1800) NS
Neutrophils (%) 69.6(20.7) 58.1(10.35) <0.0001
Neutrophils (cells/μL) 4600(3500) 3500(1200) 0.03
Lymphocytes (%) 23.1(16.1) 25.6(9) 0.03
Lymphocytes (cells/μL) 1400(900) 2100(900) 0.005
NLR 3(4) 1.8(0.85) <0.0001
Table 2. CD19+ lymphocytes and their subpopulations. Differences in the percentage and populations between SLE patients and HC.
SLE HC p
n 30 31 SLE vs. HC
CD19 (%) 7.9(2.1-28.6) 11.8(5.4-24) 0.012
CD19 cells/μL 75.4(14.4-520.8) 214(84-576) <0.001
IgD+CD27- (%) 51.5(0.4-94) 58.7(4.5-86.9) 0.34
IgD+CD27- cells/μL 37.71(0.26-434.84) 117(5-364) <0.001
IgD+CD27+ (%) 3.9(0.2-22) 8.4(1.5-44) 0.014
IgD+CD27+ cells/μL 5.12(0.13-17.55) 23(2-700) <0.001
IgD-CD27+ (%) 19.1(2.2-78) 17.9(7.1-71.9) 0.7
IgD-CD27+ cells/μL 18.58(0.47-89.58) 38(11-258) 0.001
IgD-CD27- (%) 12.9(2.3-74.2) 8(1.7-35) 0.04
IgD-CD27- cells/μL 10.84(0.93-122.91) 21(3-202) 0.007
Ratio DN/[(IgD+CD27-)+ (IgD-CD27+)+ (IgD+CD27+)] 0.14(0.02-2.9) 0.08(0.02-0.54) p=0.04
Table 3. Differences in CD4 lymphocytes and their subpopulations between SLE patients and HC.
SLE HC p
n 30 31 p
CD4 (cells/μL) 651.2(71.1-1478.2) 986(344-1591) 0.004
Early differentiated cells
CD4+CD31+ 216.38(16.3-904.7) 250(69-967) 0.14
CD4CD45RA+CD28+ 267.97 (20.62-1030.31) 388 (139-1402) 0.02
CD4CD45RA+CD57- 254.03 (21.05-1077.61) 401 (160-1373) 0.035
CD4CD45RA-CD57- 290.67 (38.96-884.43) 539 (173-991) <0.001
CD4CD28+CD57- 610.7 (54.68-1461.94) 958 (332-1569) 0.004
CD4CD28+CD57+ 4.7(0-806) 7(0-245) 0.21
Memory cells
CD4CD45RA-CCR7+ 402.35(38.7-972.4) 563(40-1001) 0.046
CD4CD45RA-CCR7- 1.62(0-73.49) 11(0-590) 0.002
Advanced differentiated/Senescent cells
CD45RA+CCR7- 7.29(0-180.62) 23(0-487) 0.027
CD4CD28- 20.12 (1.27 -139.06) 38 (3-299) 0.04
CD4CD28-CD57+ 9.90 (0.46-73.8) 23 (0-274) 0.1
CD45RA+CCR7-CD28- 1.2(0-82) 2.5(0-106) 0.21
Table 4. Differences in CD8 lymphocytes and their subpopulations between SLE patients and HC.
SLE HC p
n 30 31 p
CD8 (cells/μL) 414.8 (60.6-2017.8) 454.5 (154-1310) 0.26
Early differentiated cells
CD8+CD31+ 88.19 (8.2-1047) 187.5 (8-541) 0.26
CD8CD45RA+CD28+ 113.56 (1.81-753.7) 212.5 (7-1257) 0.17
CD8CD45RA+CD57- 63.65 (3.83-889.8) 133 (8-552) 0.17
CD8CD45RA-CD57- 194.52 (1.8-945.1) 179 (28-555) 0.99
CD8CD28+CD57- 249.45 (5.49-1362) 298 (95-646) 0.1
CD8CD28+CD57+ 12(0.4-132) 8.5(0-424) 0.58
Memory cells
CD8CD45RA-CCR7+ 171.52 (2.5-1417) 123 (1-941) 0.14
CD8CD45RA-CCR7- 13.94 (0.59-92.37) 25 (0-355) 0.53
Advanced differentiated/Senescent cells
CD8CD45RA+CCR7- 11.13 (0-279.6) 49.5 (0-534) 0.02
CD8CD28- 87.83 (4.56-1361.2) 135 (36-633) 0.14
CD8CD28-CD57+ 53.17 (0.83-571.04) 71 (0-470) 0.17
CD45RA+CCR7-CD28- 37.3(2.1-263) 197(9-783) <0.0001
Table 5. Correlation of the number of DN B cells with the whole cohort of CD19+ cells, naïve, non-switched and switched memory B cells in SLE patients and HC.
DN B Lymphocytes
SLE HC
CD19+ cells r 0.696 0.554
p <0.001 0.001
Naïve cells (CD19+IgD+CD27-) r 0.446 0.282
p 0.013 0.123
Non-switched memory B cells (CD19+IgD-CD27+) r 0.671 0.540
p <0.001 0.001
Switched memory B cells (CD19+IgD+CD27+) r 0.424 0.094
p 0.019 0.614
Table 6. Correlation of the number of DN B cells with the whole cohort of CD4 and CD8 lymphocytes and their subpopulations.
CD19 IgD- CD27- CD19 IgD-CD27-
SLE HC SLE HC
CD4 r 0.548 0.412 CD8 r 0.425 -0.239
p 0.002 0.021 p 0.019 0.196
Early Differentiated cells
CD4 CD31+ r 0.587 0.243 CD8 CD31+ r 0.366 -0.286
p <0.001 0.188 p 0.047 0,119
CD4 NAÏVE (CD45RA+ CCR7+) r 0.325 0.189 CD8 NAÏVE (CD45RA+ CCR7+) r 0.432 -0,308
p 0.079 0.316 p 0.017 0,091
CD4CD45RA+CD28+ r 0.504 0.265 CD8CD45RA+CD28+ r 0.234 -0.086
p 0.005 0.15 p 0.214 0,646
CD4CD45RA+CD57- r 0.419 0.42 CD8CD45RA+CD57- r 0.201 -0.251
p 0.021 0.021 p 0.287 0.173
CD4CD45RA-CD57- r 0.397 0.24 CD8CD45RA-CD57- r 0.444 0.166
p 0.03 0.201 p 0.014 0.371
CD4CD28+CD57- r 0.487 0.439 CD8CD28+CD57- r 0.363 -0,088
p 0.006 0.013 p 0.048 0.638
CD4CD28+CD57+ r 0.491 0.156 CD8CD28+CD57+ r 0.483 -0.092
p 0.006 0.402 p 0.007 0.624
Memory cells
CD4 CM (CD45RA- CCR7+) r 0.381 0.188 CD8 CM (CD45RA- CCR7+) r 0.33 0.138
p 0.038 0.32 p 0.075 0.459
CD4 EM (CD45RA- CCR7-) r -0.075 0.008 CD8 EM (CD45RA-CCR7-) r 0.099 0.088
p 0.695 0.965 p 0.601 0.637
Senescent/Advanced differentiated cells
CD4 EMRA (CD45RA+ CCR7-) r 0.104 0.168 CD8 EMRA (CD45RA+CCR7-) r 0.242 0.04
p 0.583 0.376 p 0.189 0.182
CD4CD28null r 0.066 -0.154 CD8CD28null r 0.271 -0.248
p 0.73 0.408 p 0.147 0.179
CD4CD28-CD57+ r - 0.068 -0.243 CD8CD28-CD57+ r 0.291 -0.254
p 0.722 0.187 p 0.119 0.169
CD4 EMRA (CD45RA+ CCR7-) 28- r 0.042 0.198 CD8 EMRA (CD45RA+ CCR7-) 28- r 0.191 -0.032
p 0.825 0.294 p 0.312 0.862
Disclaimer/Publisher’s Note: The statements, opinions and data contained in all publications are solely those of the individual author(s) and contributor(s) and not of MDPI and/or the editor(s). MDPI and/or the editor(s) disclaim responsibility for any injury to people or property resulting from any ideas, methods, instructions or products referred to in the content.
Copyright: This open access article is published under a Creative Commons CC BY 4.0 license, which permit the free download, distribution, and reuse, provided that the author and preprint are cited in any reuse.
Prerpints.org logo

Preprints.org is a free preprint server supported by MDPI in Basel, Switzerland.

Subscribe

© 2024 MDPI (Basel, Switzerland) unless otherwise stated