Submitted:
10 July 2023
Posted:
11 July 2023
You are already at the latest version
Abstract
Keywords:
1. Introduction
2. Materials and Methods
2.1. Raw material
2.2. Sample preparation
2.3. Proximal composition
2.4. Colorimetric analysis
2.5. Extract preparation
2.6. Total phenol (TP) content
2.7. Oxygen radical absorbance capacity (ORAC)
2.8. Ferric reducing antioxidant power (FRAP)
2.9. Statistical analysis and mathematical modelling
3. Results and Discussion
3.1. Compositional characteristics of the native flours
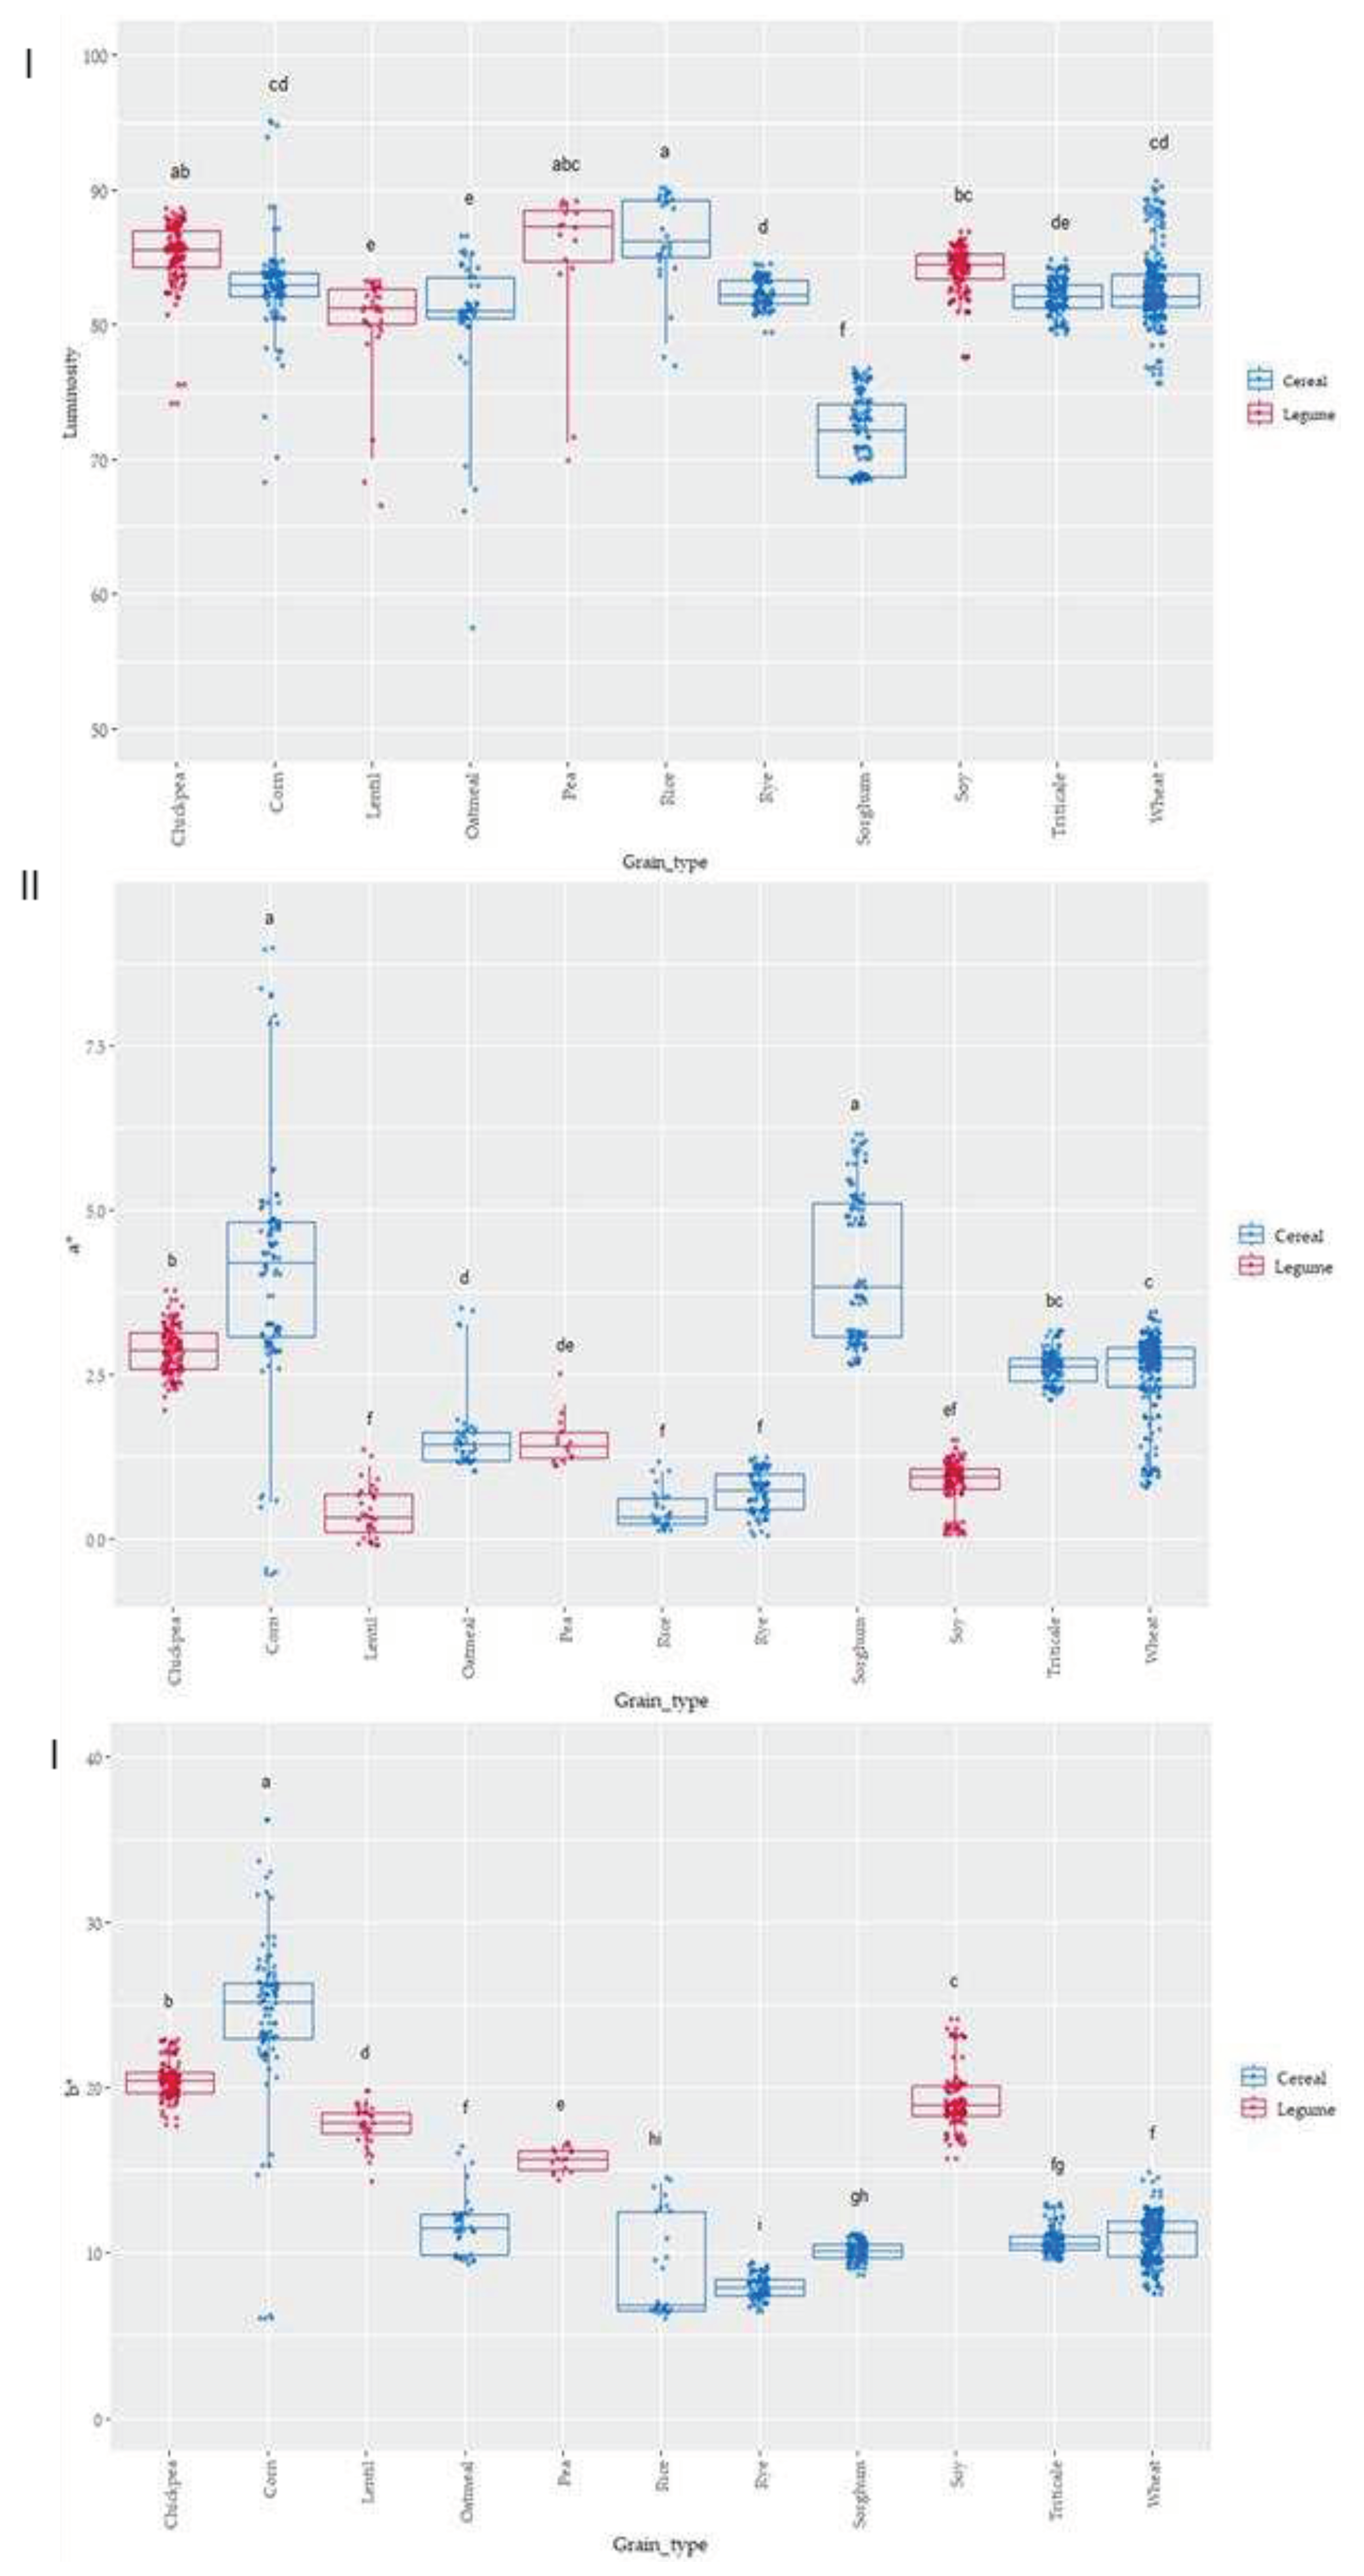
3.2. Colorimeter analysis characteristics of the native flours
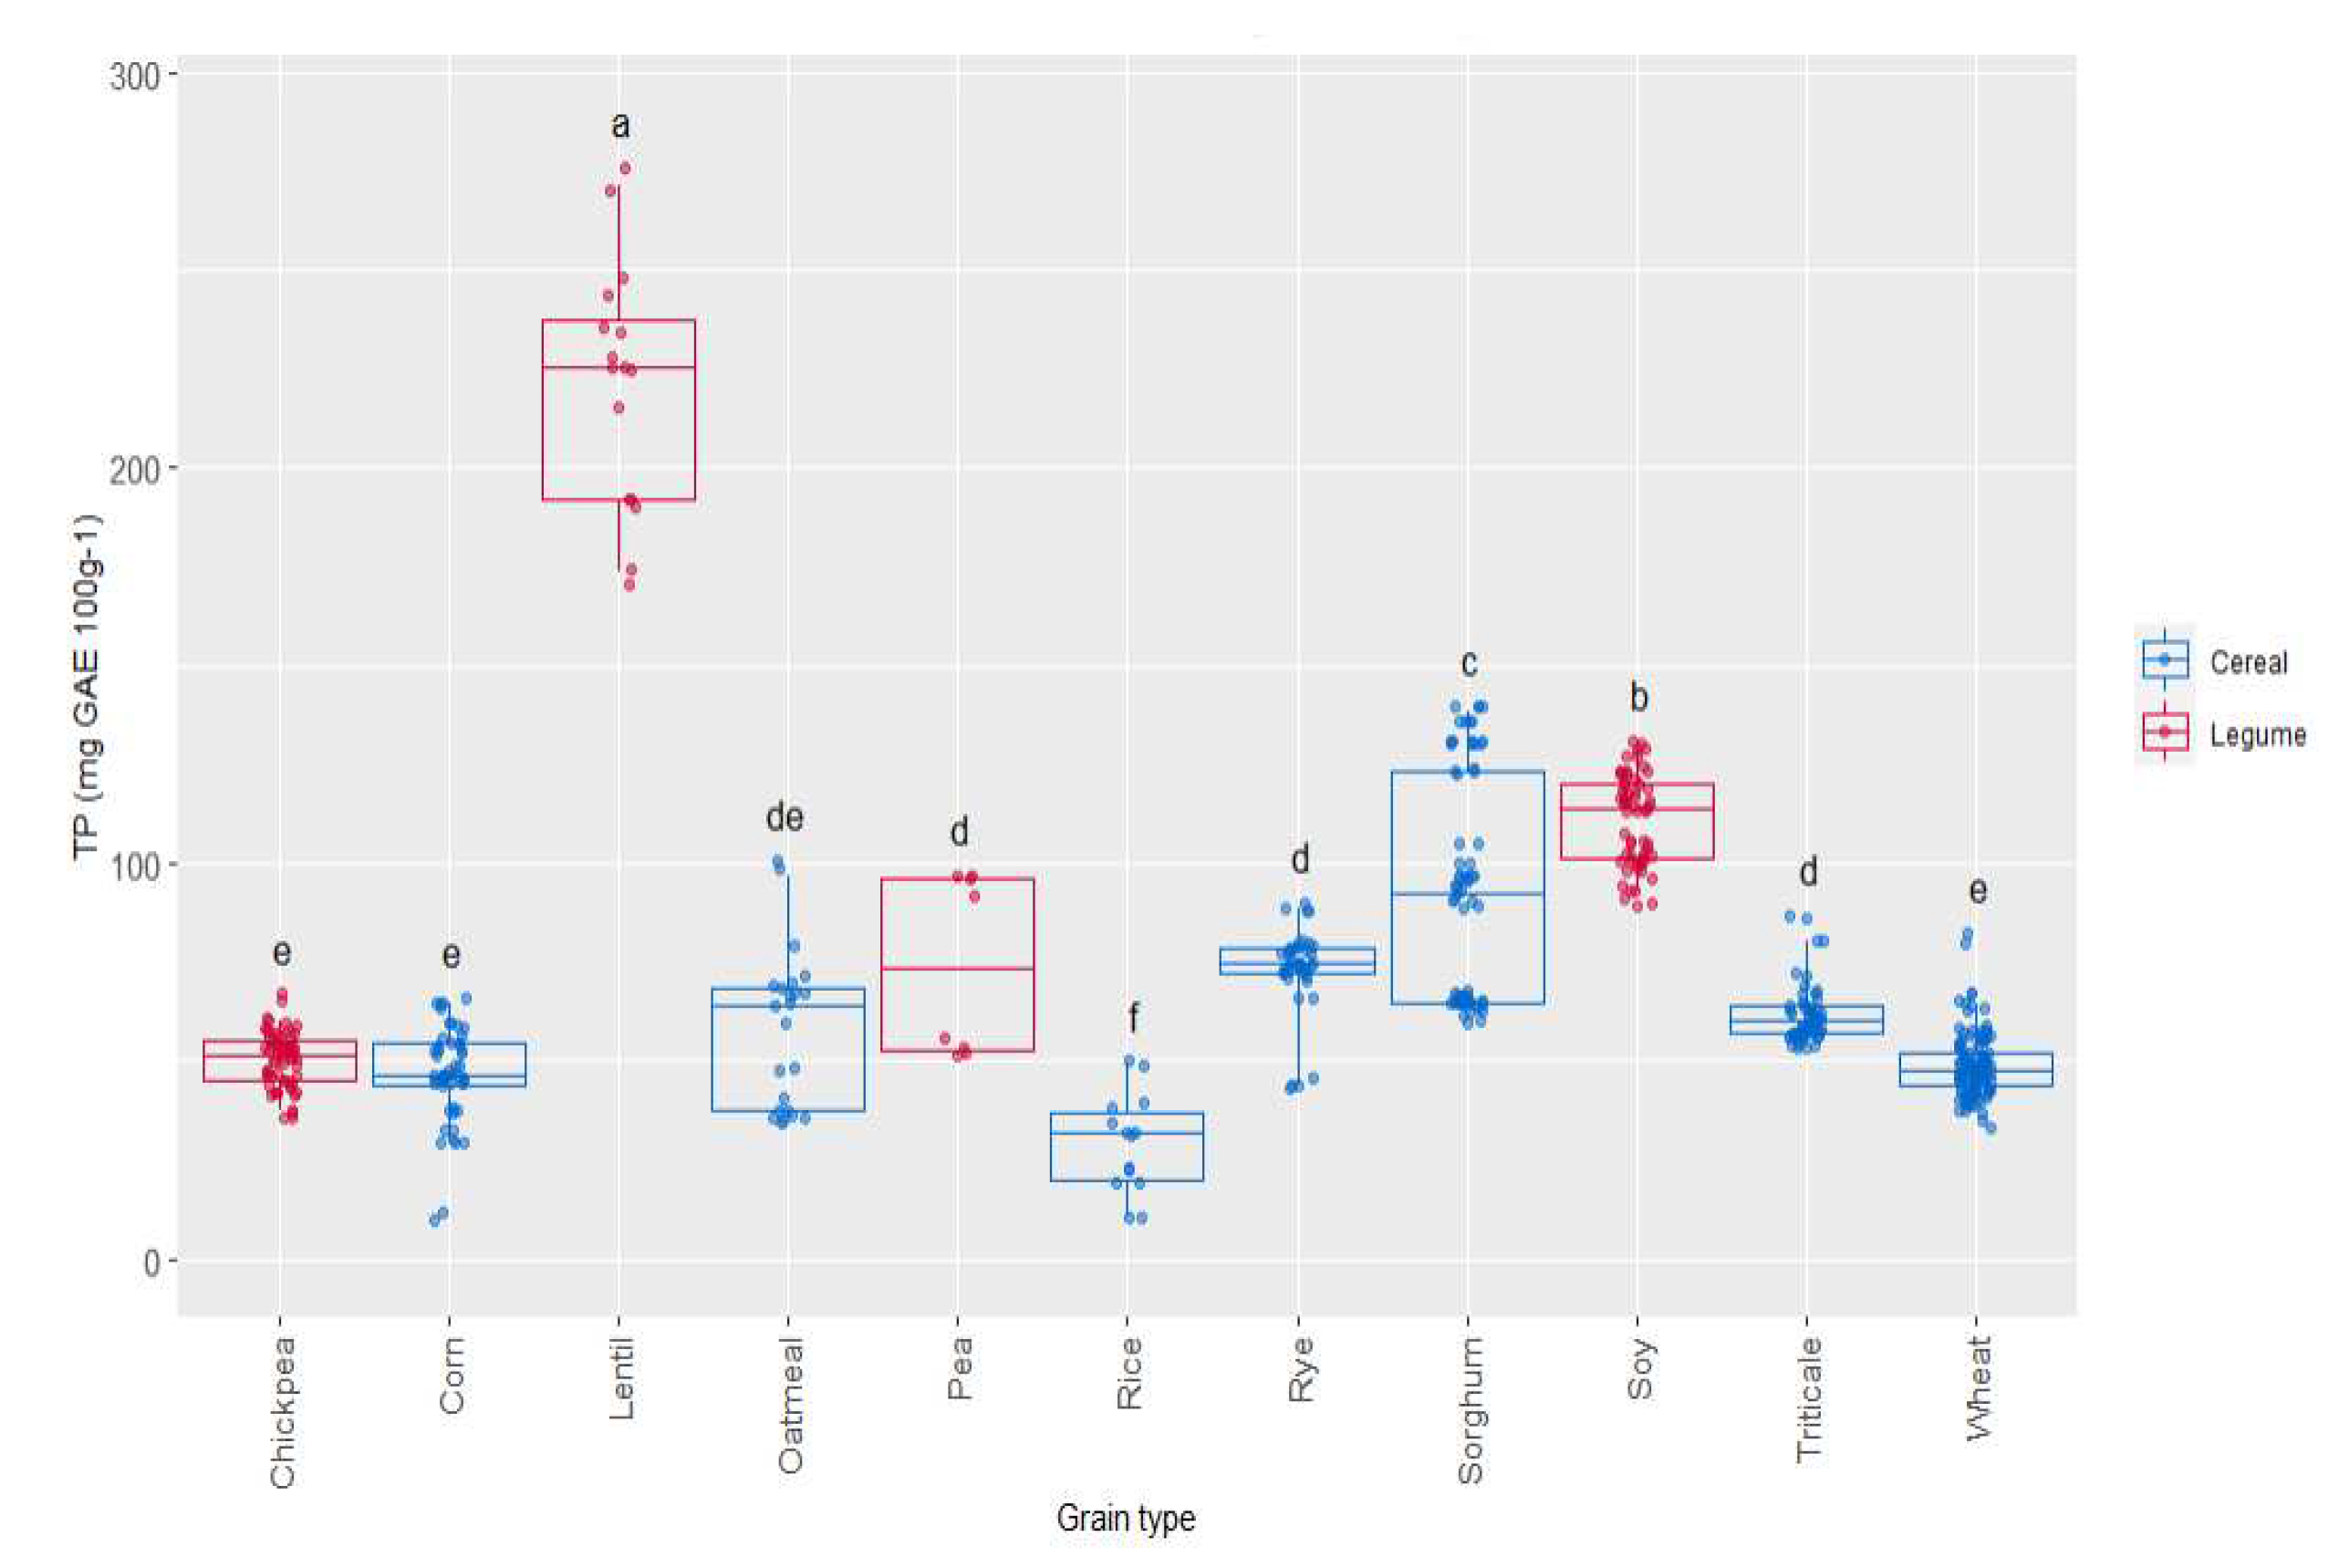
3.3. Total phenol (TP) content of the native flours
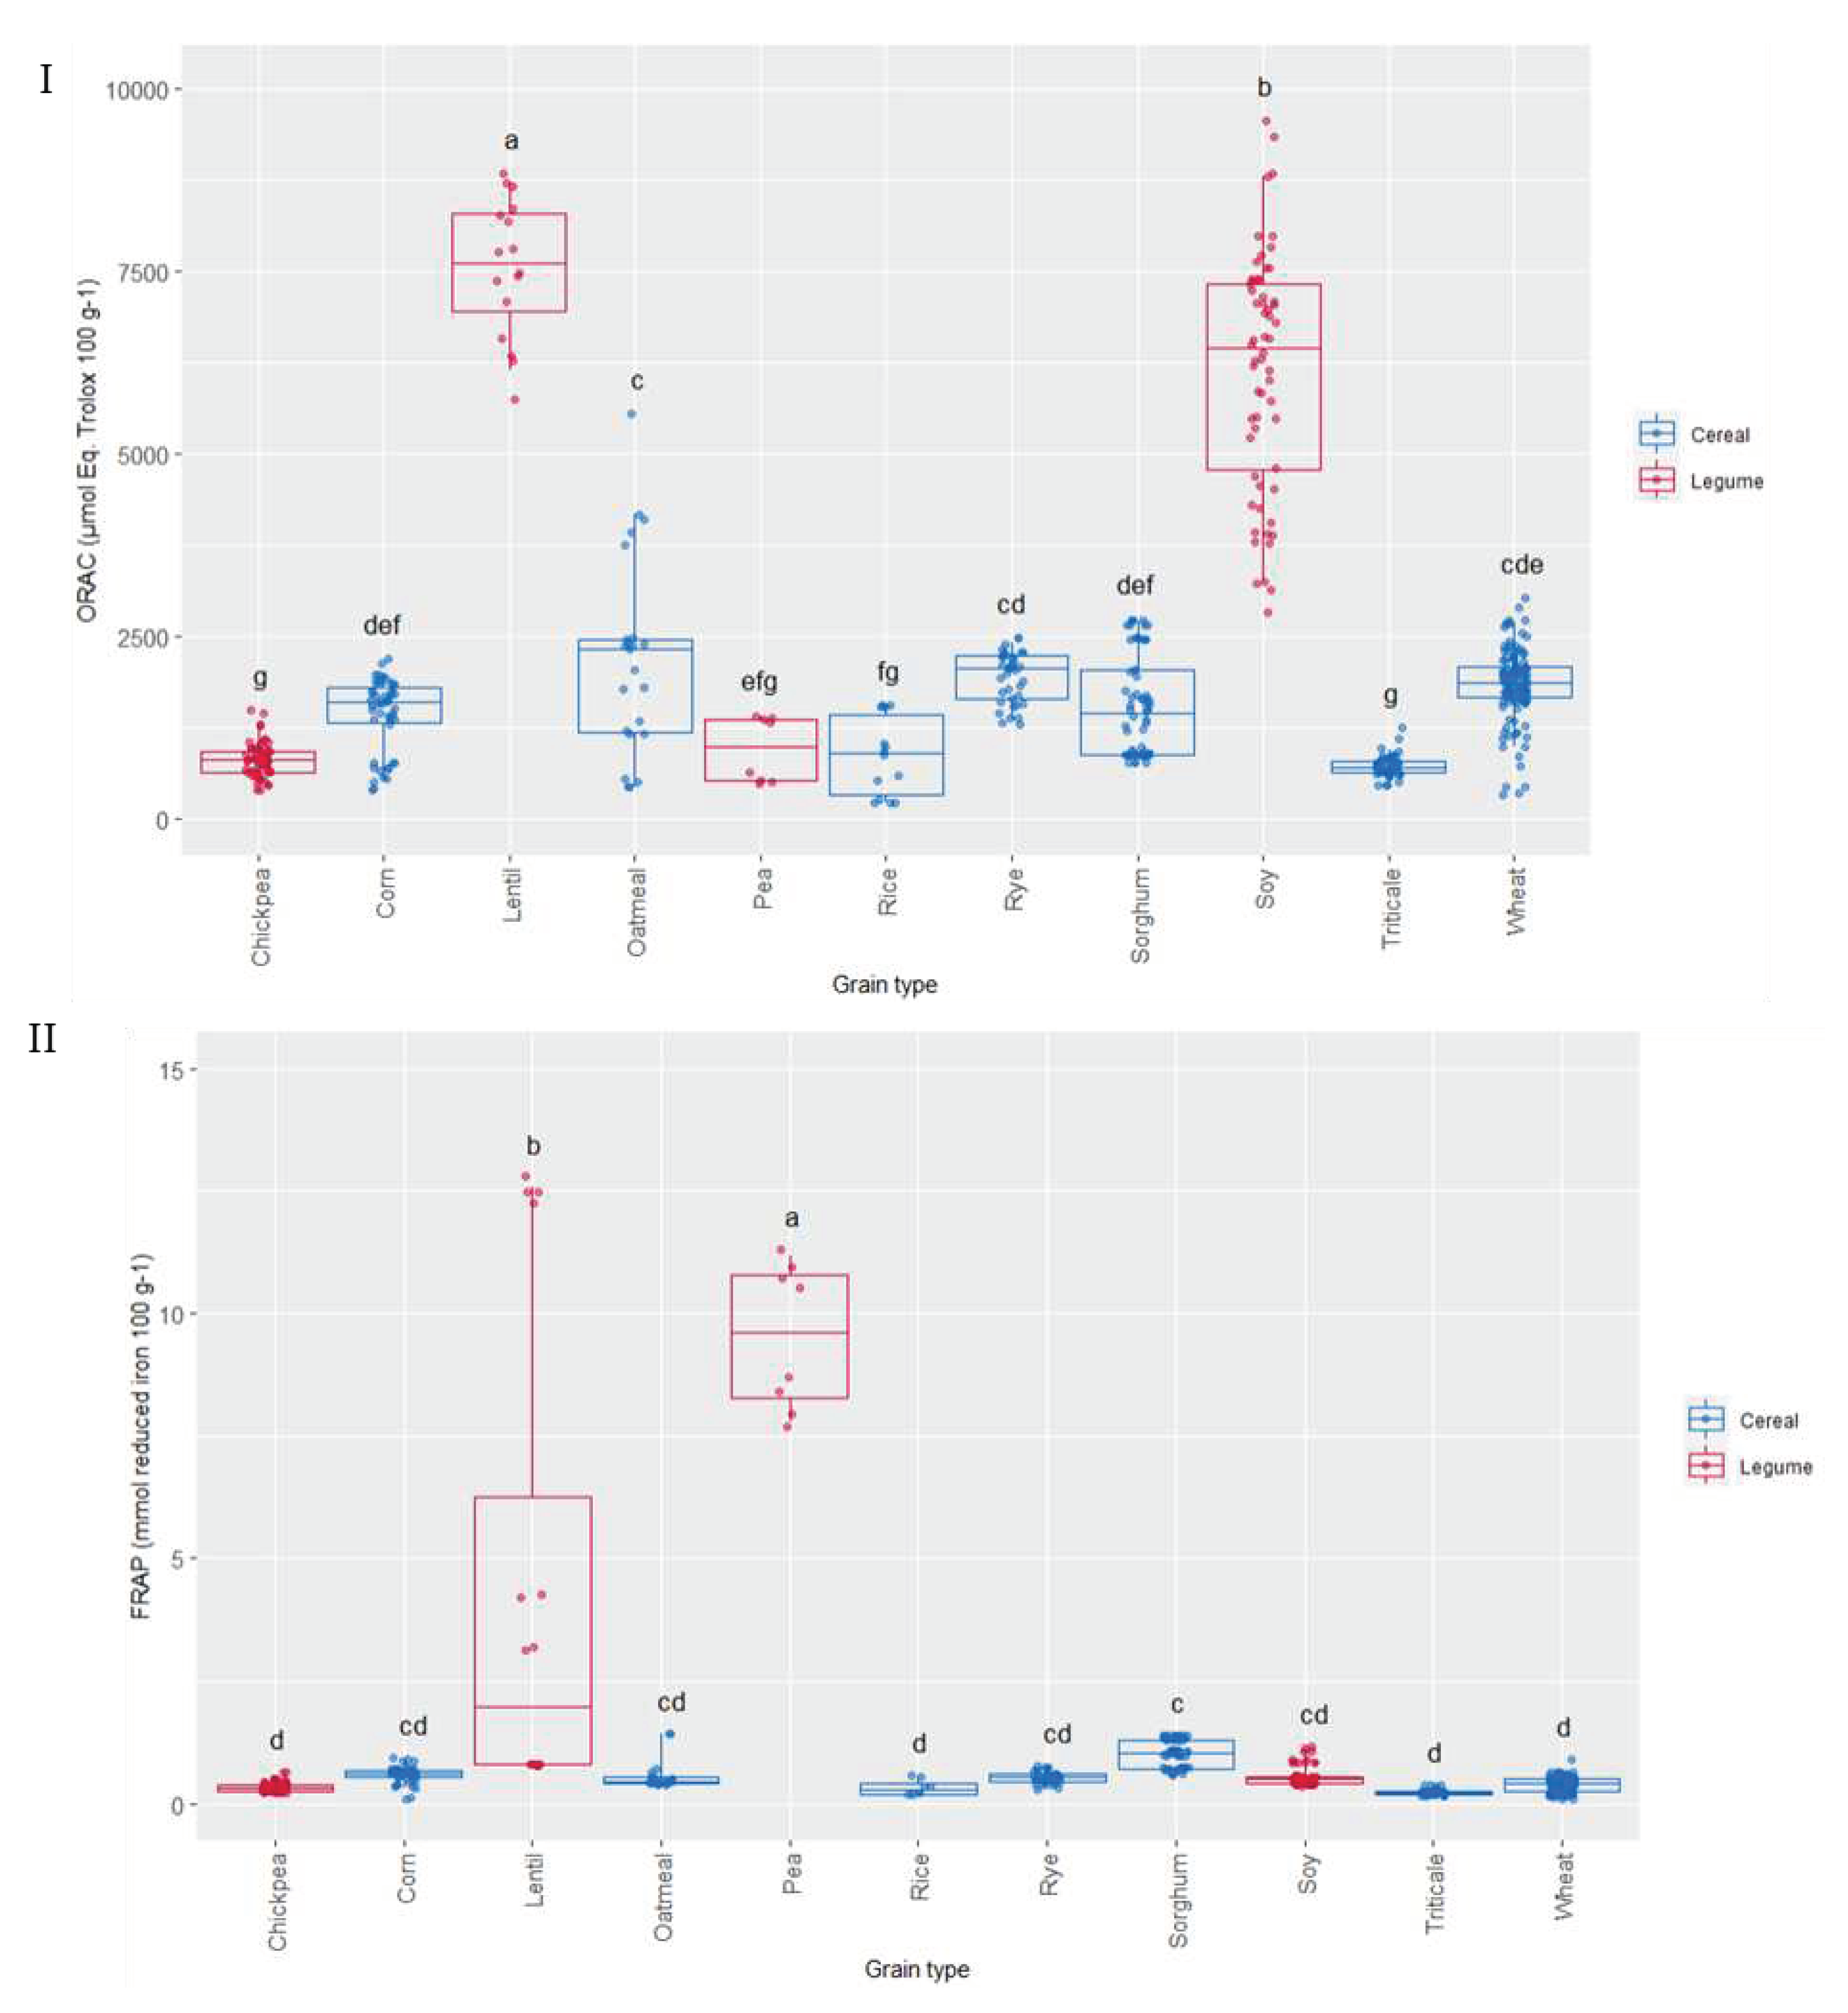
3.4. Oxygen radical absorbance capacity (ORAC) of the native flours
3.5. Ferric reducing antioxidant power assay (FRAP) of the native flours
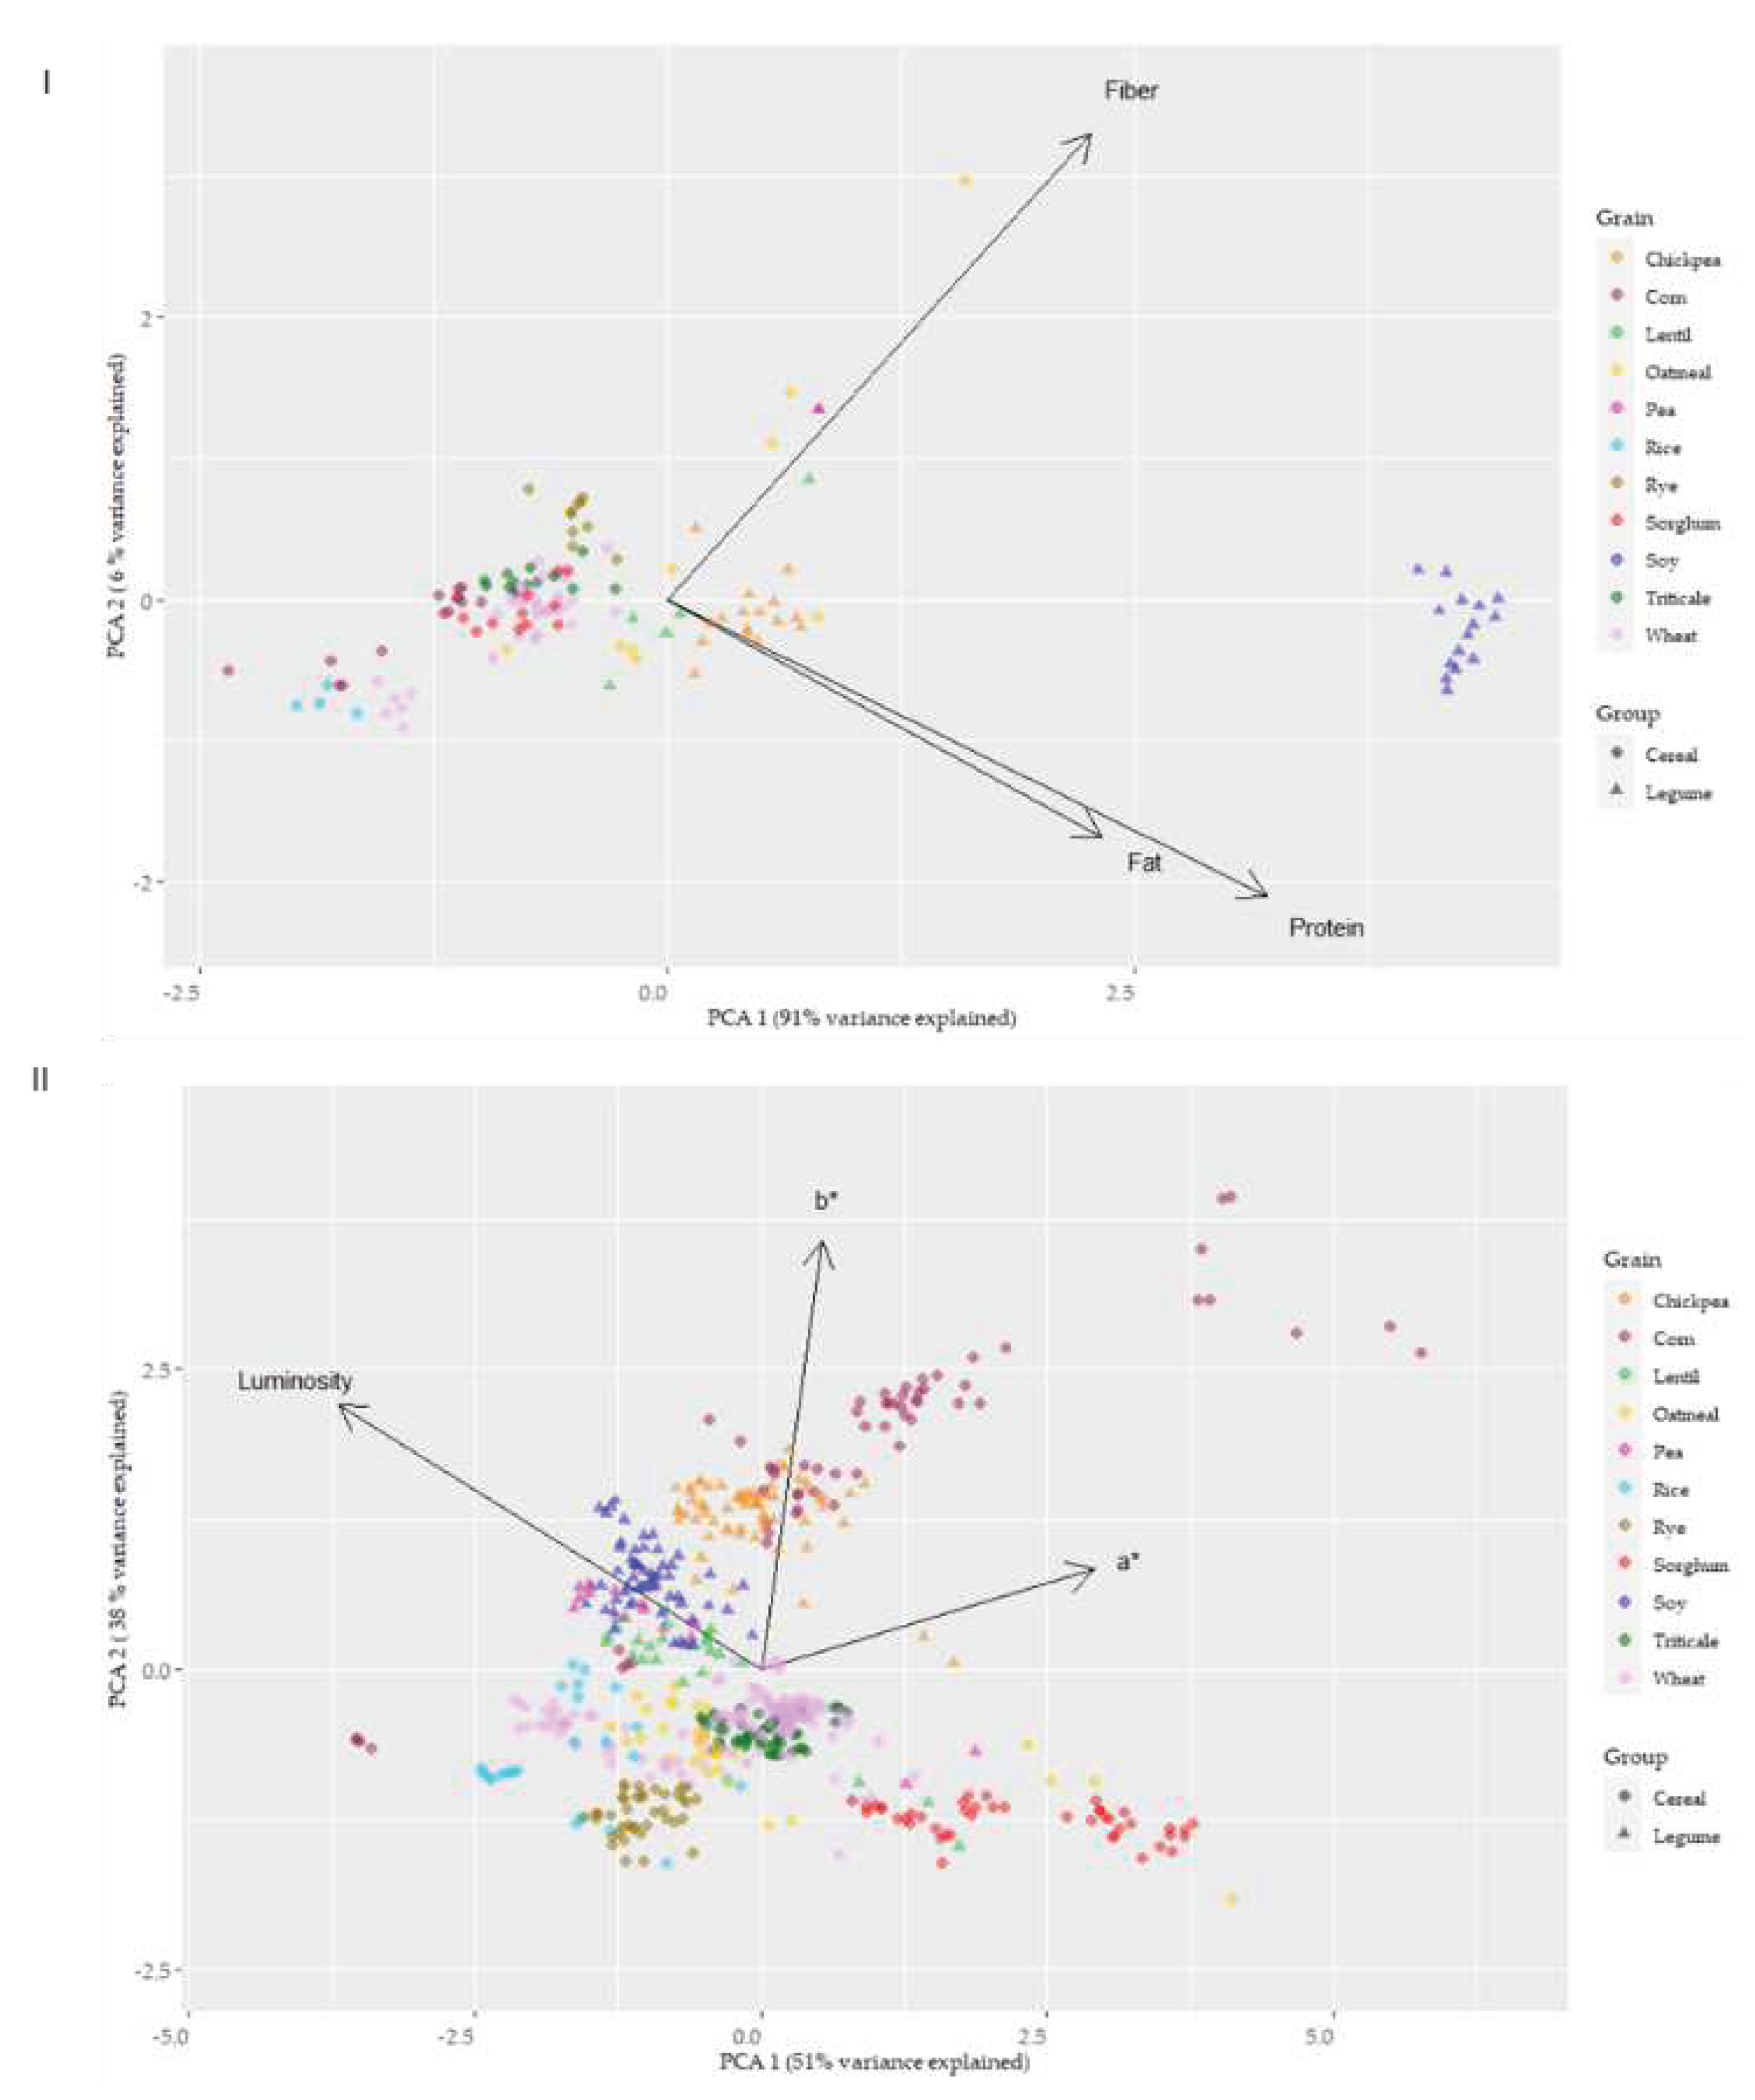
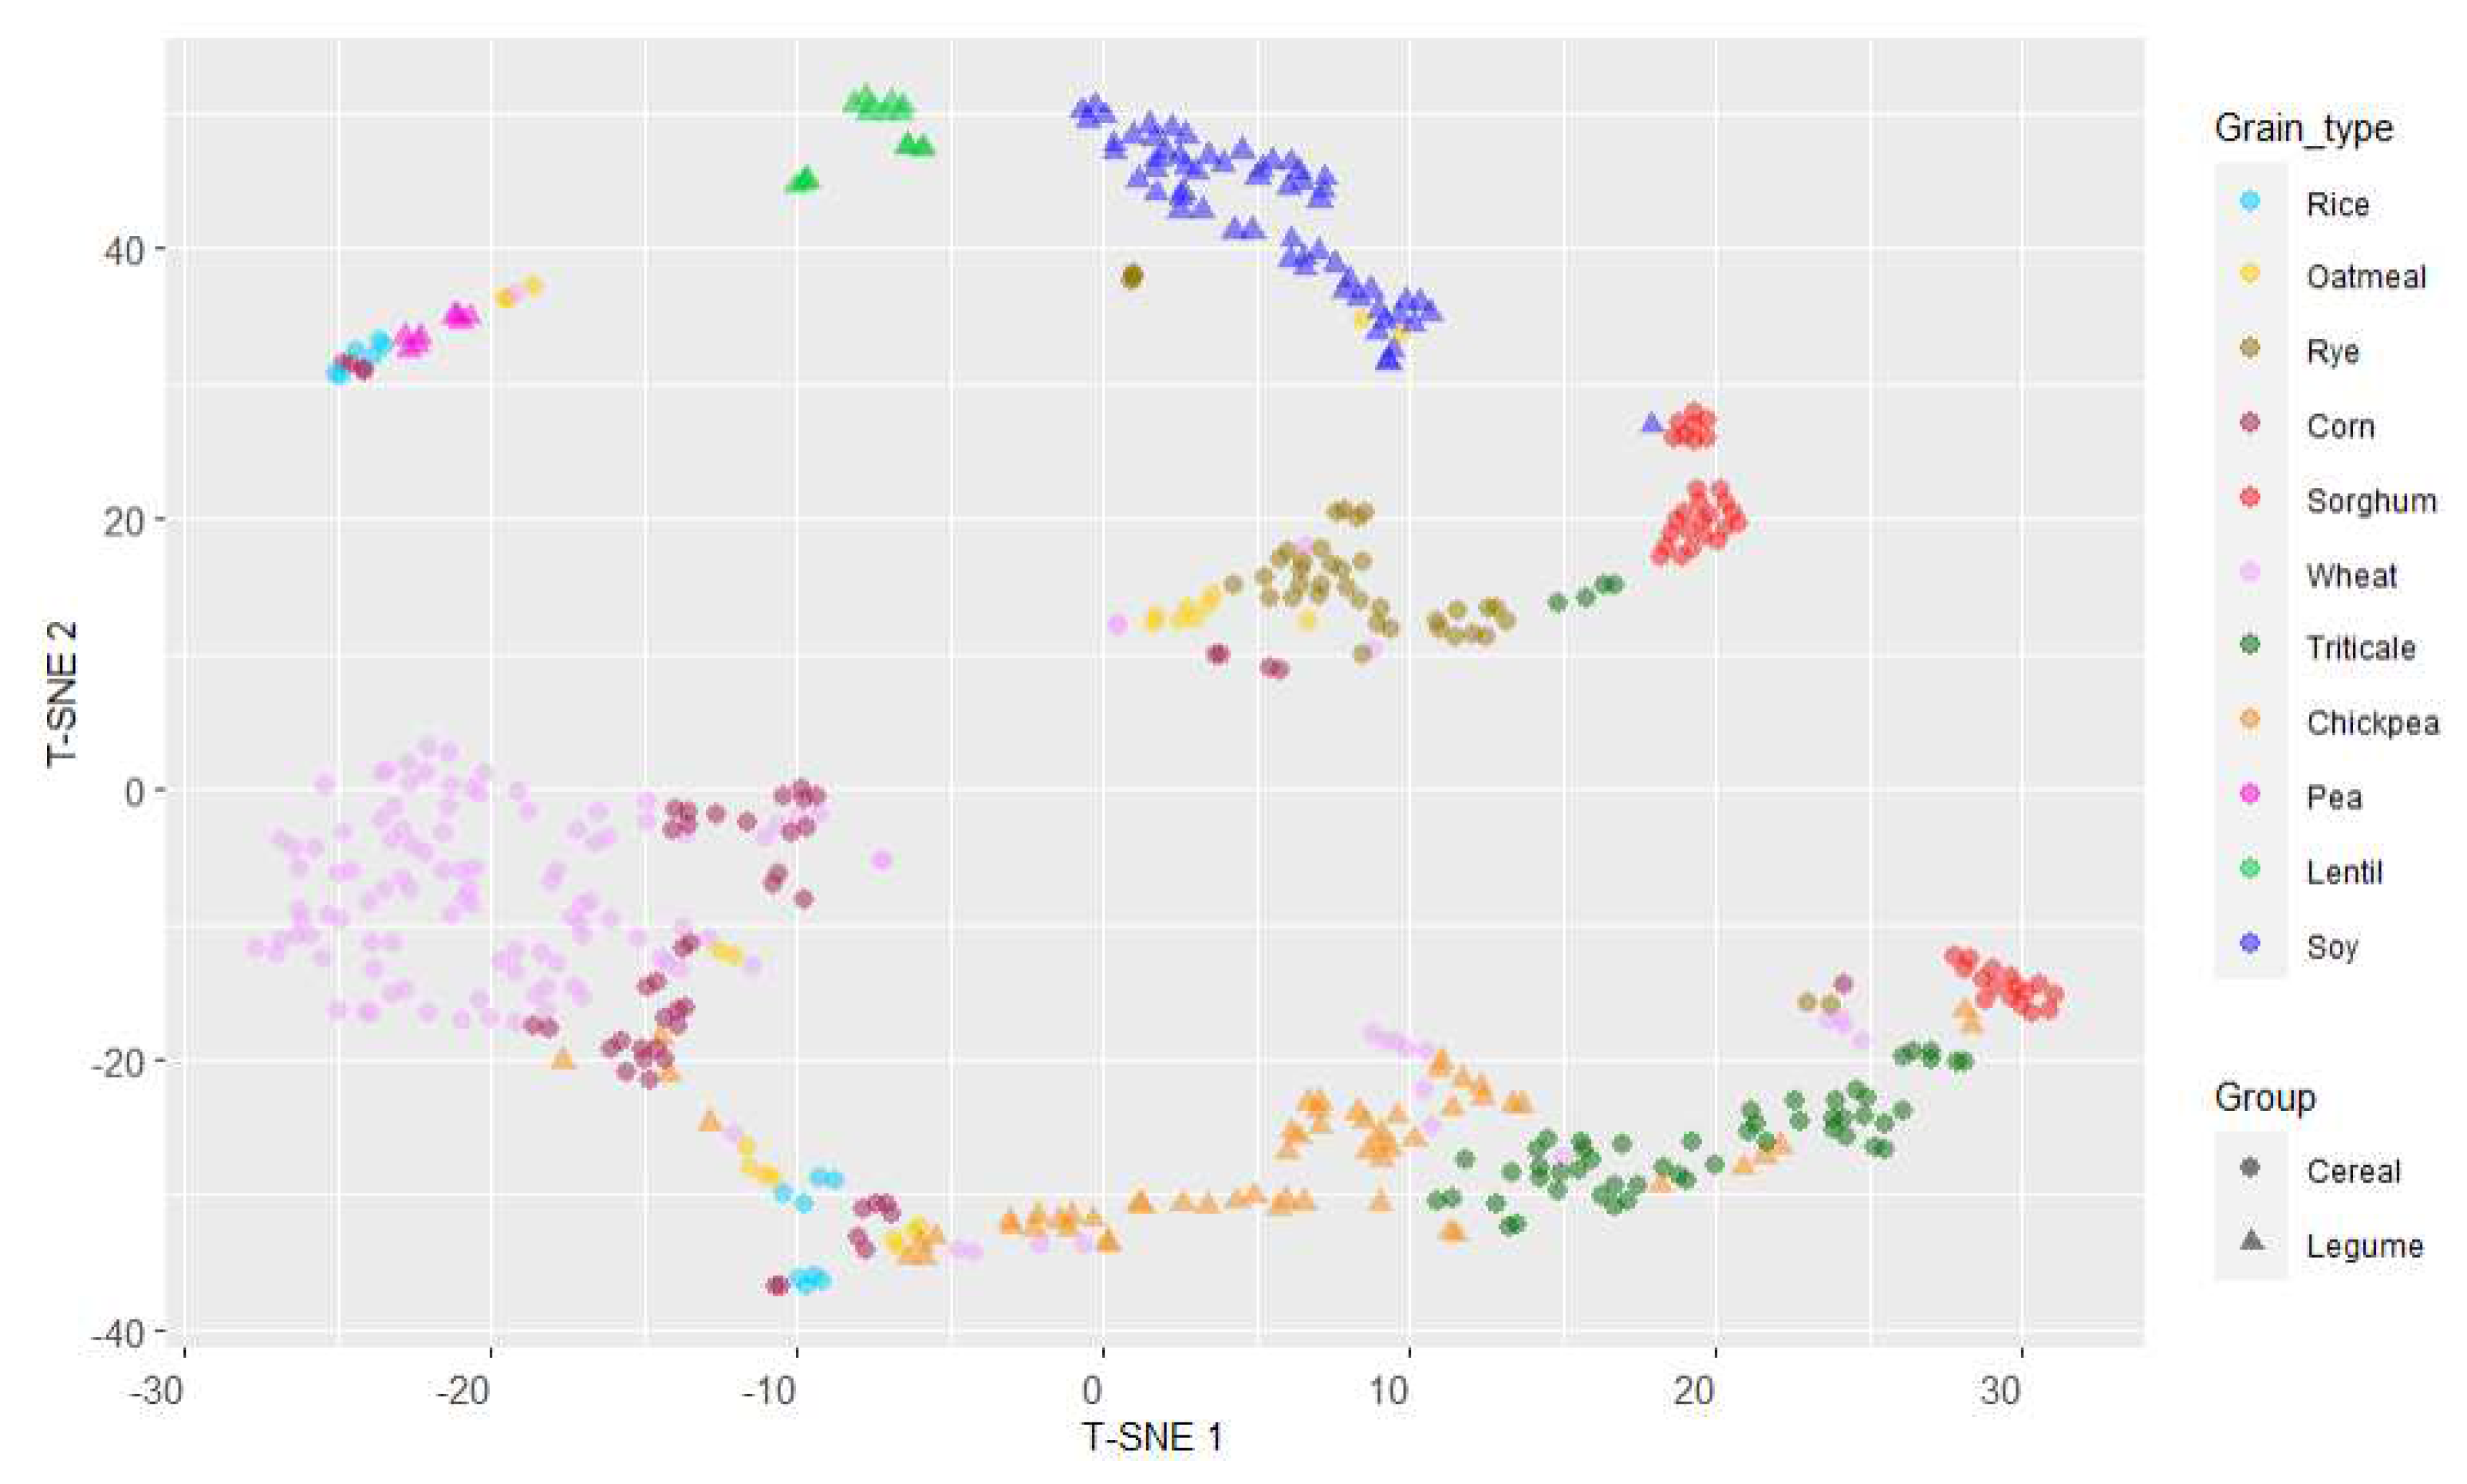
3.6. Parameter correlations and distribution of parameters based on principal components analysis (PCA) and T-distributed Stochastic Neighbour Embedding (T-SNE) of native flours
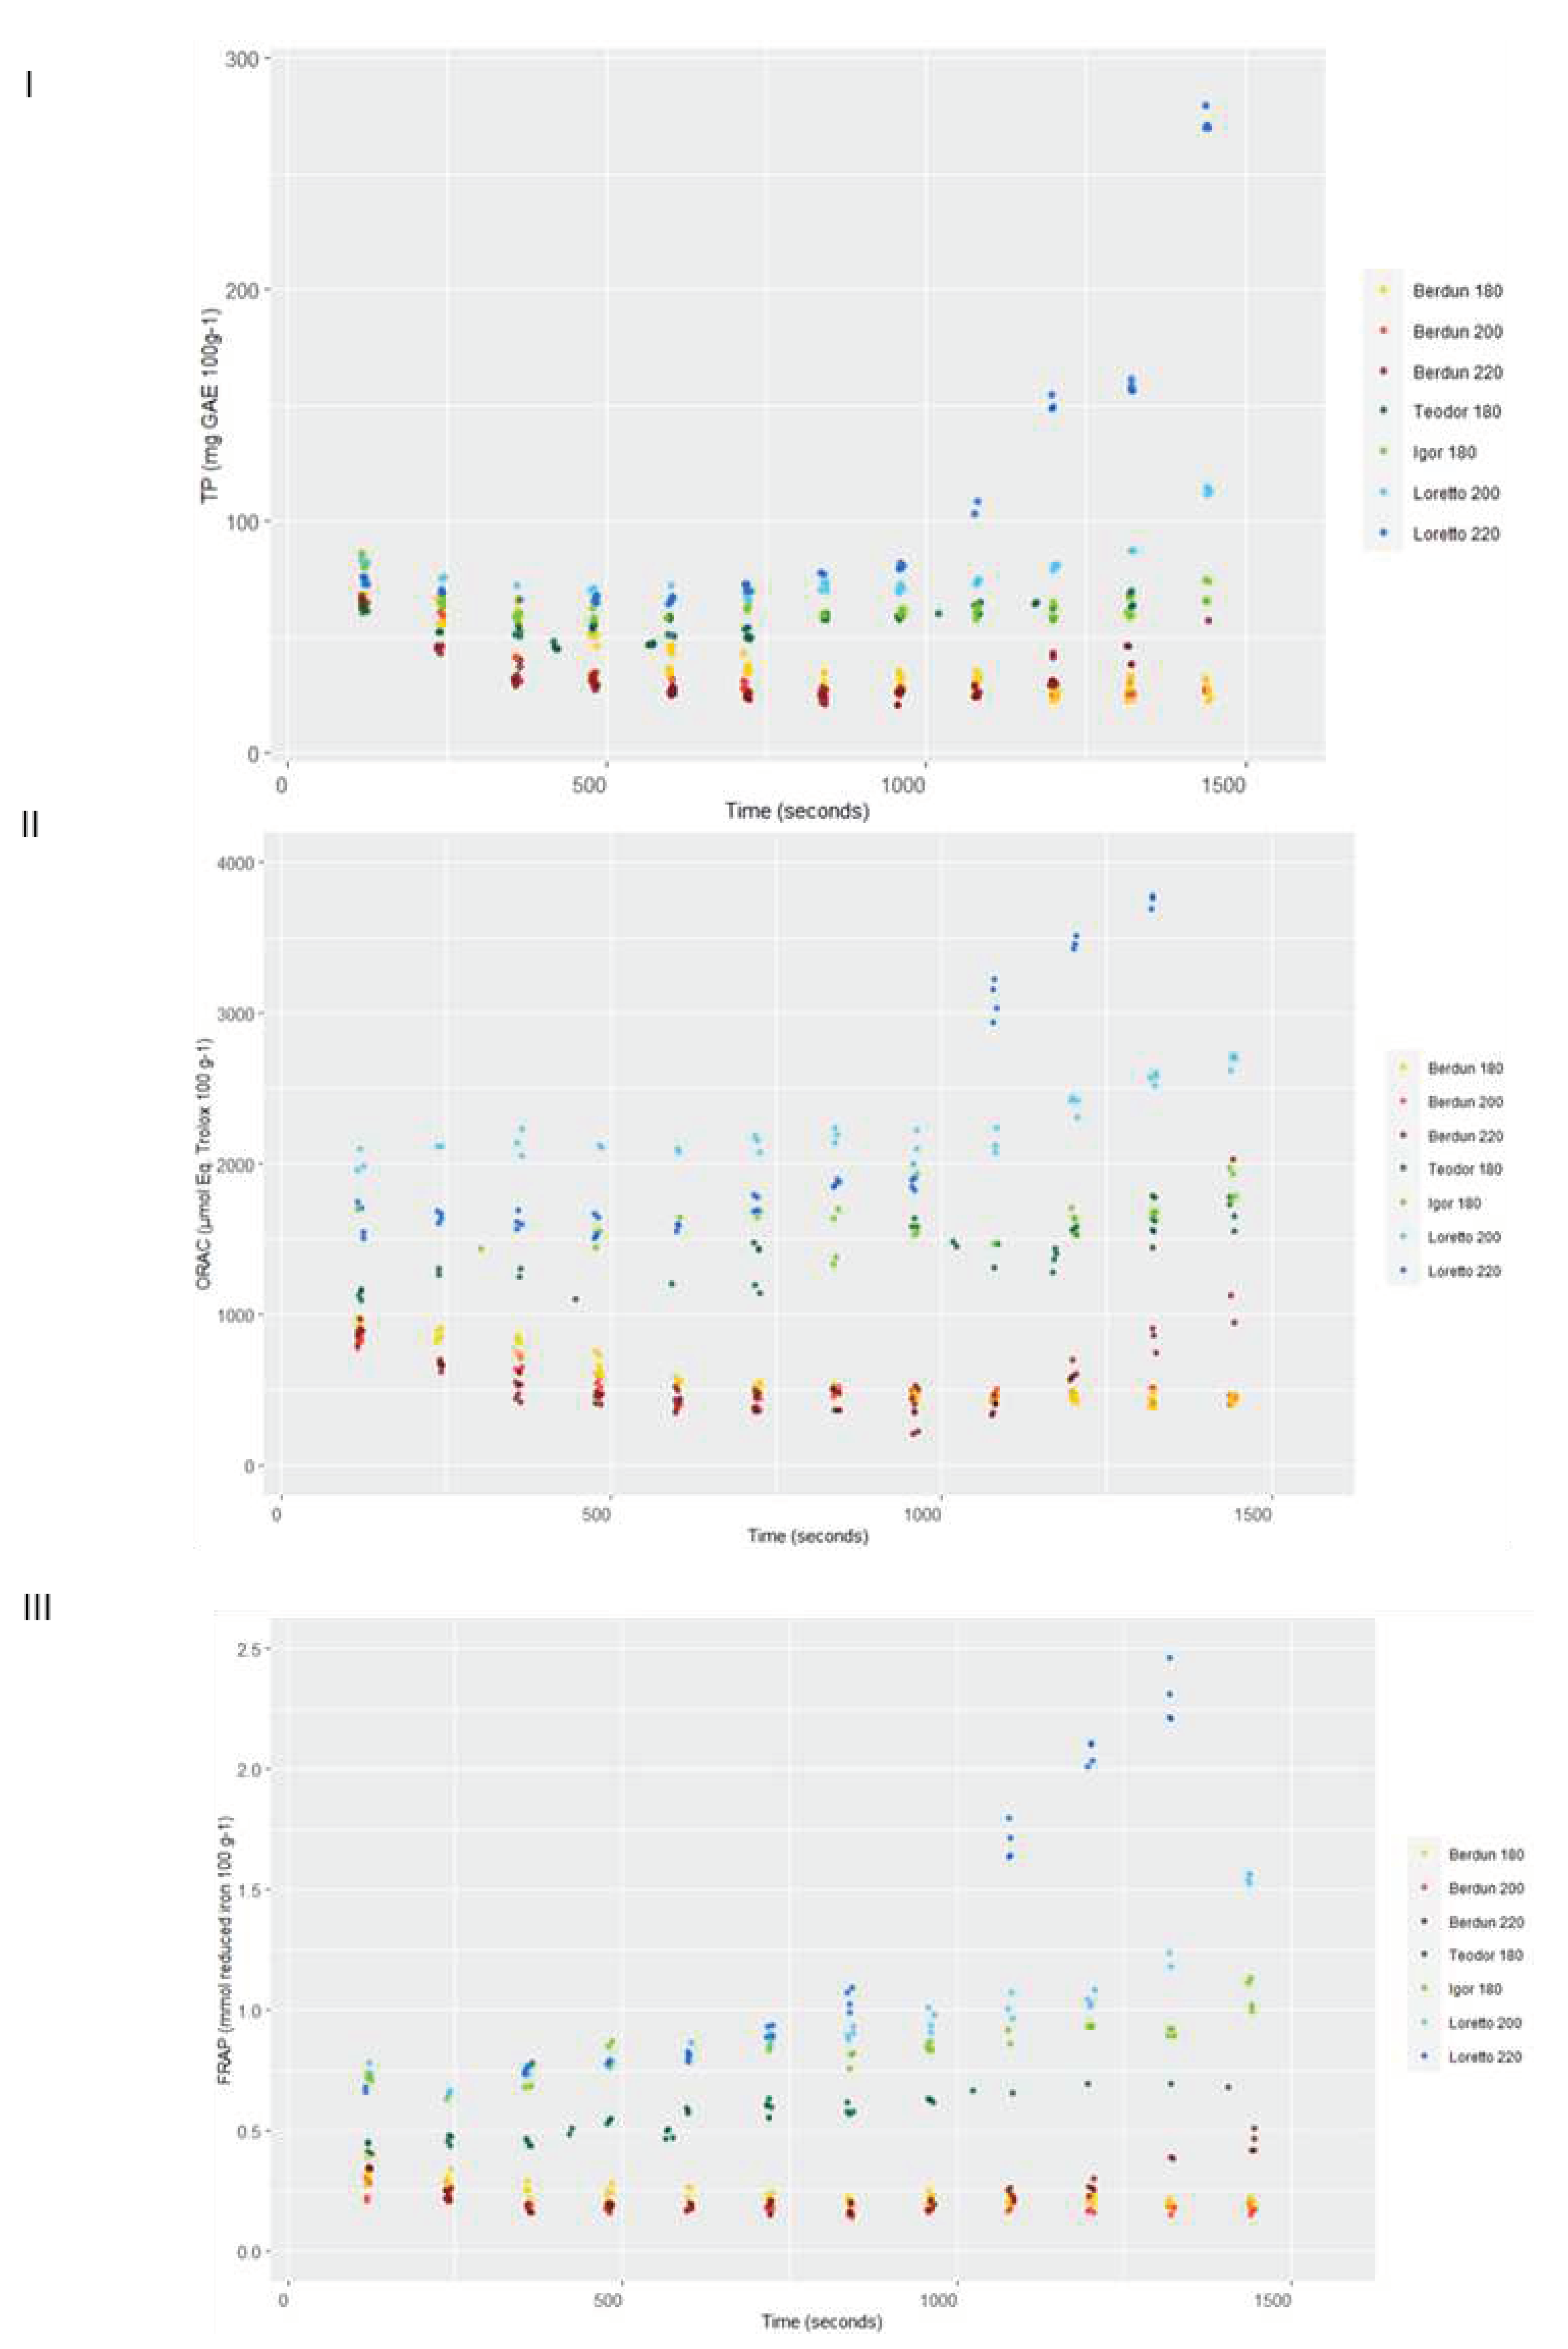
3.7. Effect of thermal treatment on total antioxidant capacity (TAC)
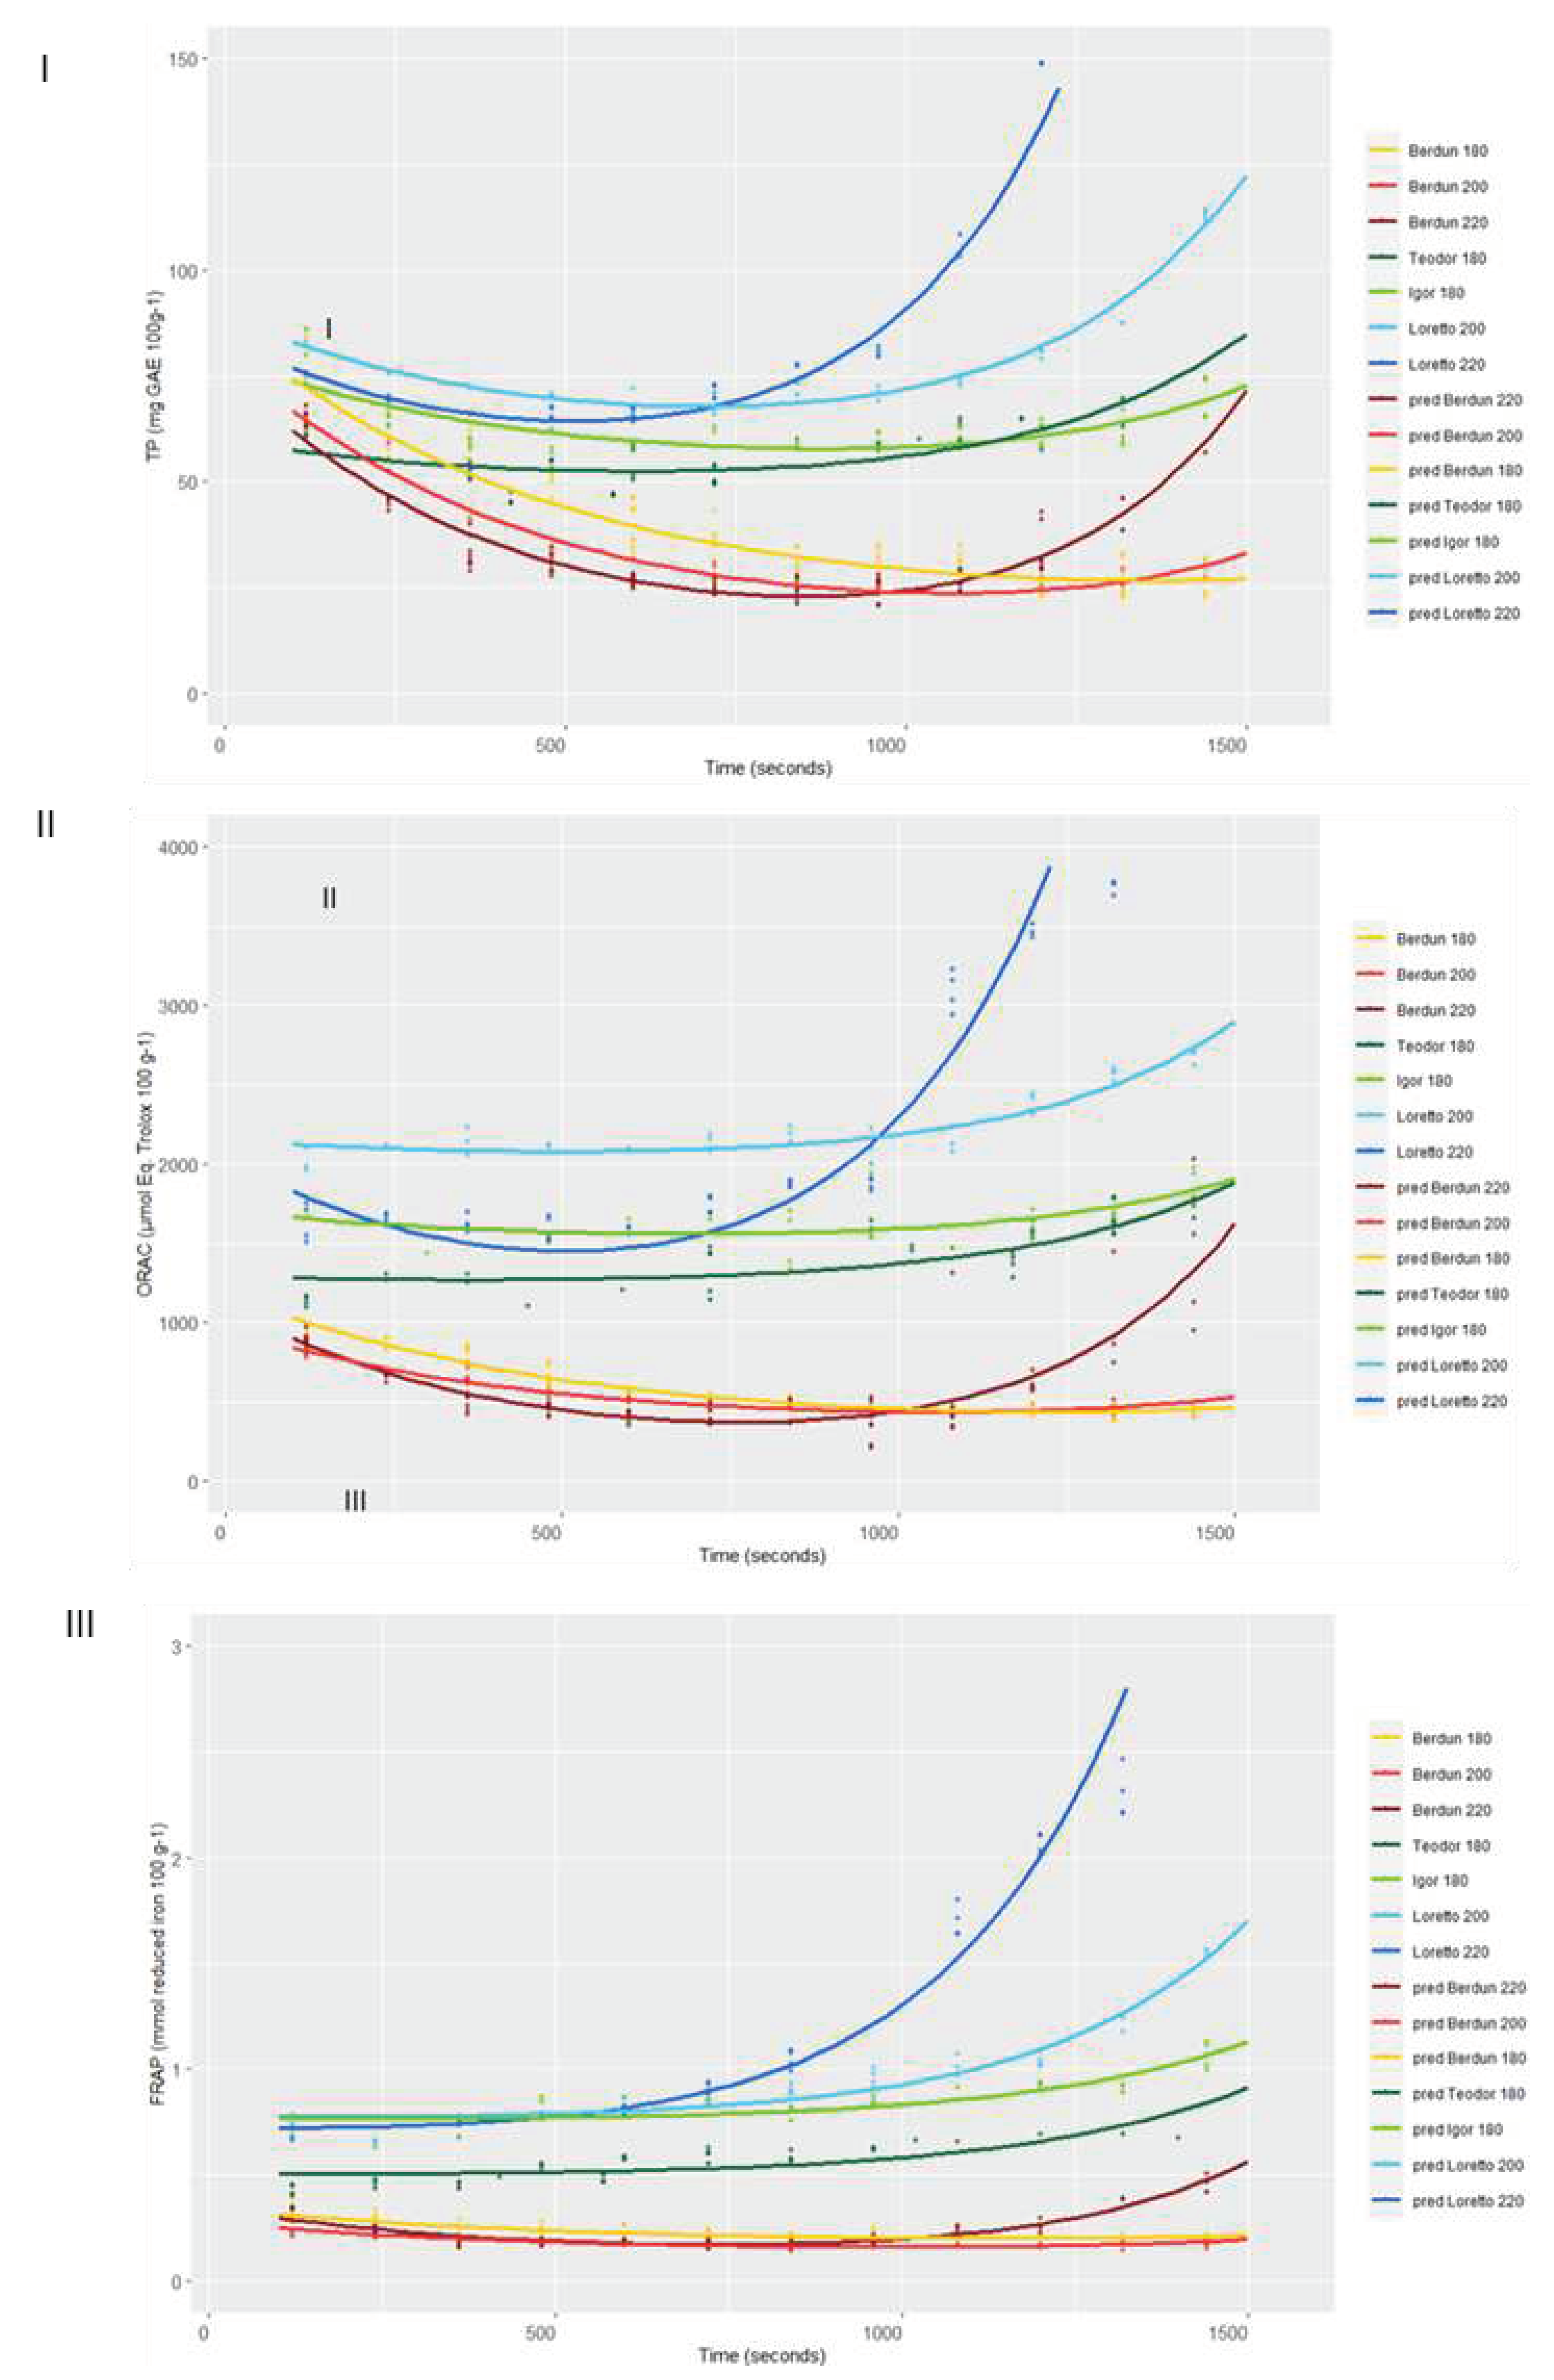
3.8. Modelling of the effect of thermal treatment on total antioxidant capacity (TAC).
First level of modelling
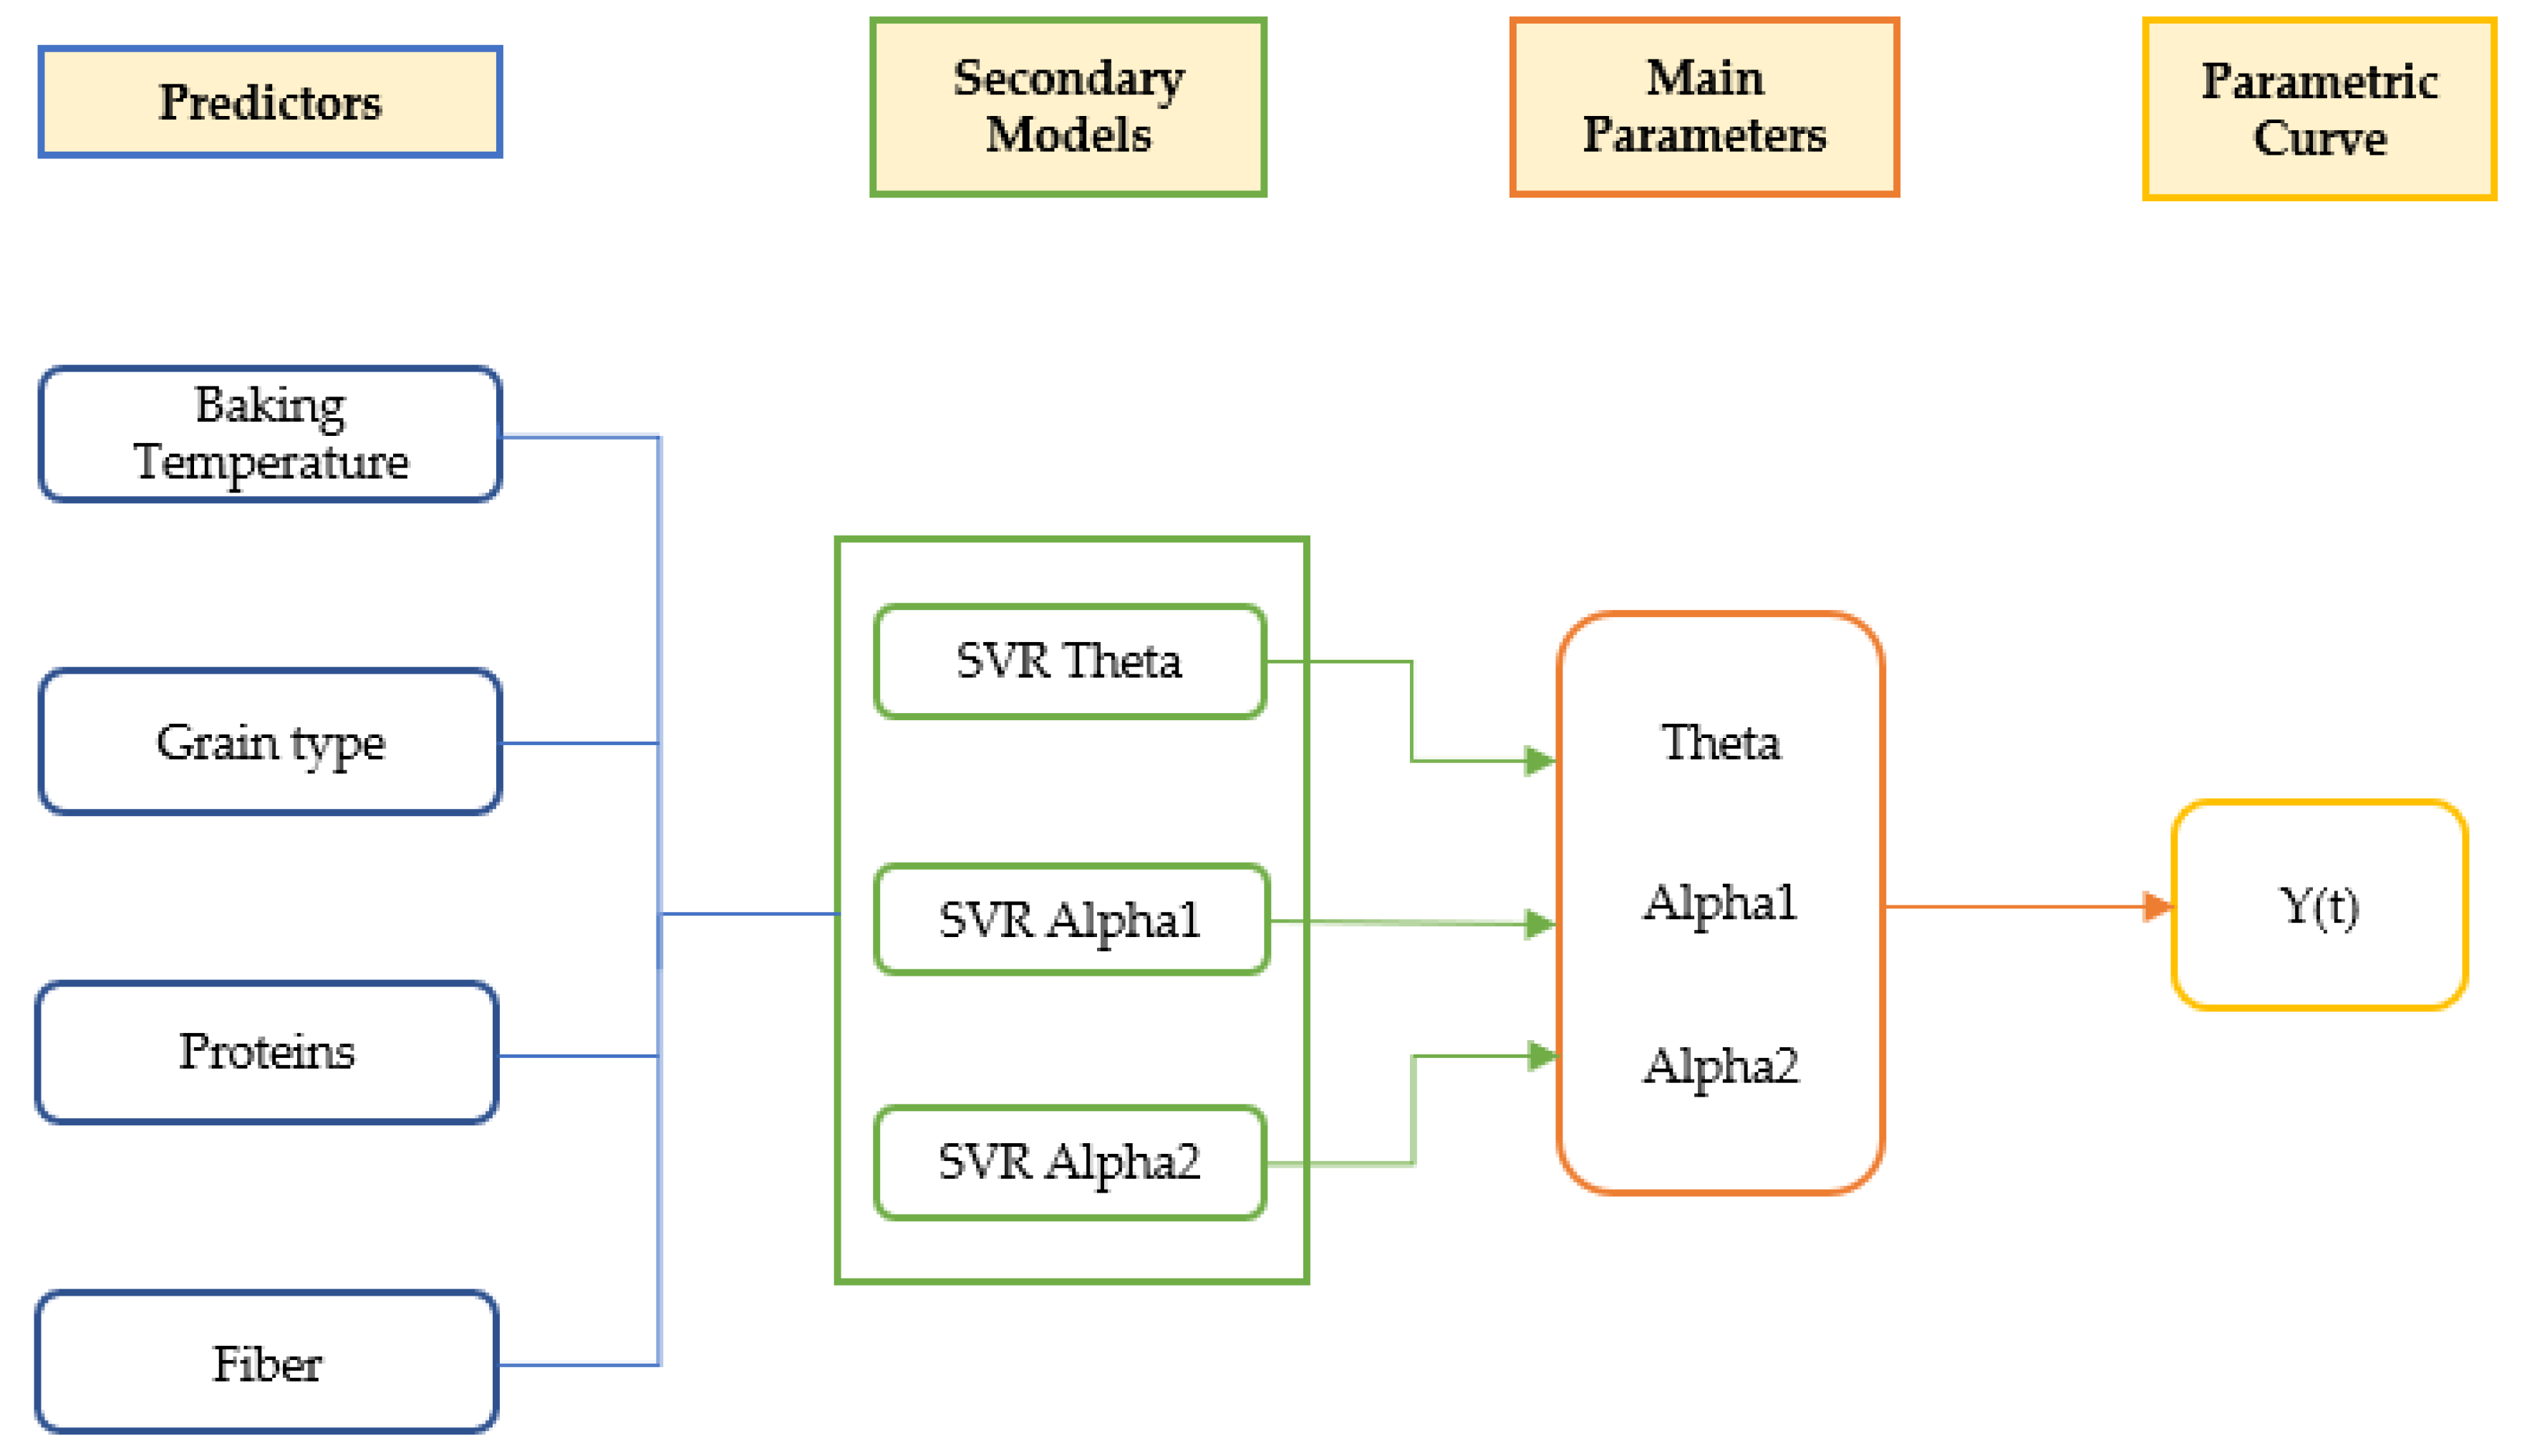
Second level of modelling
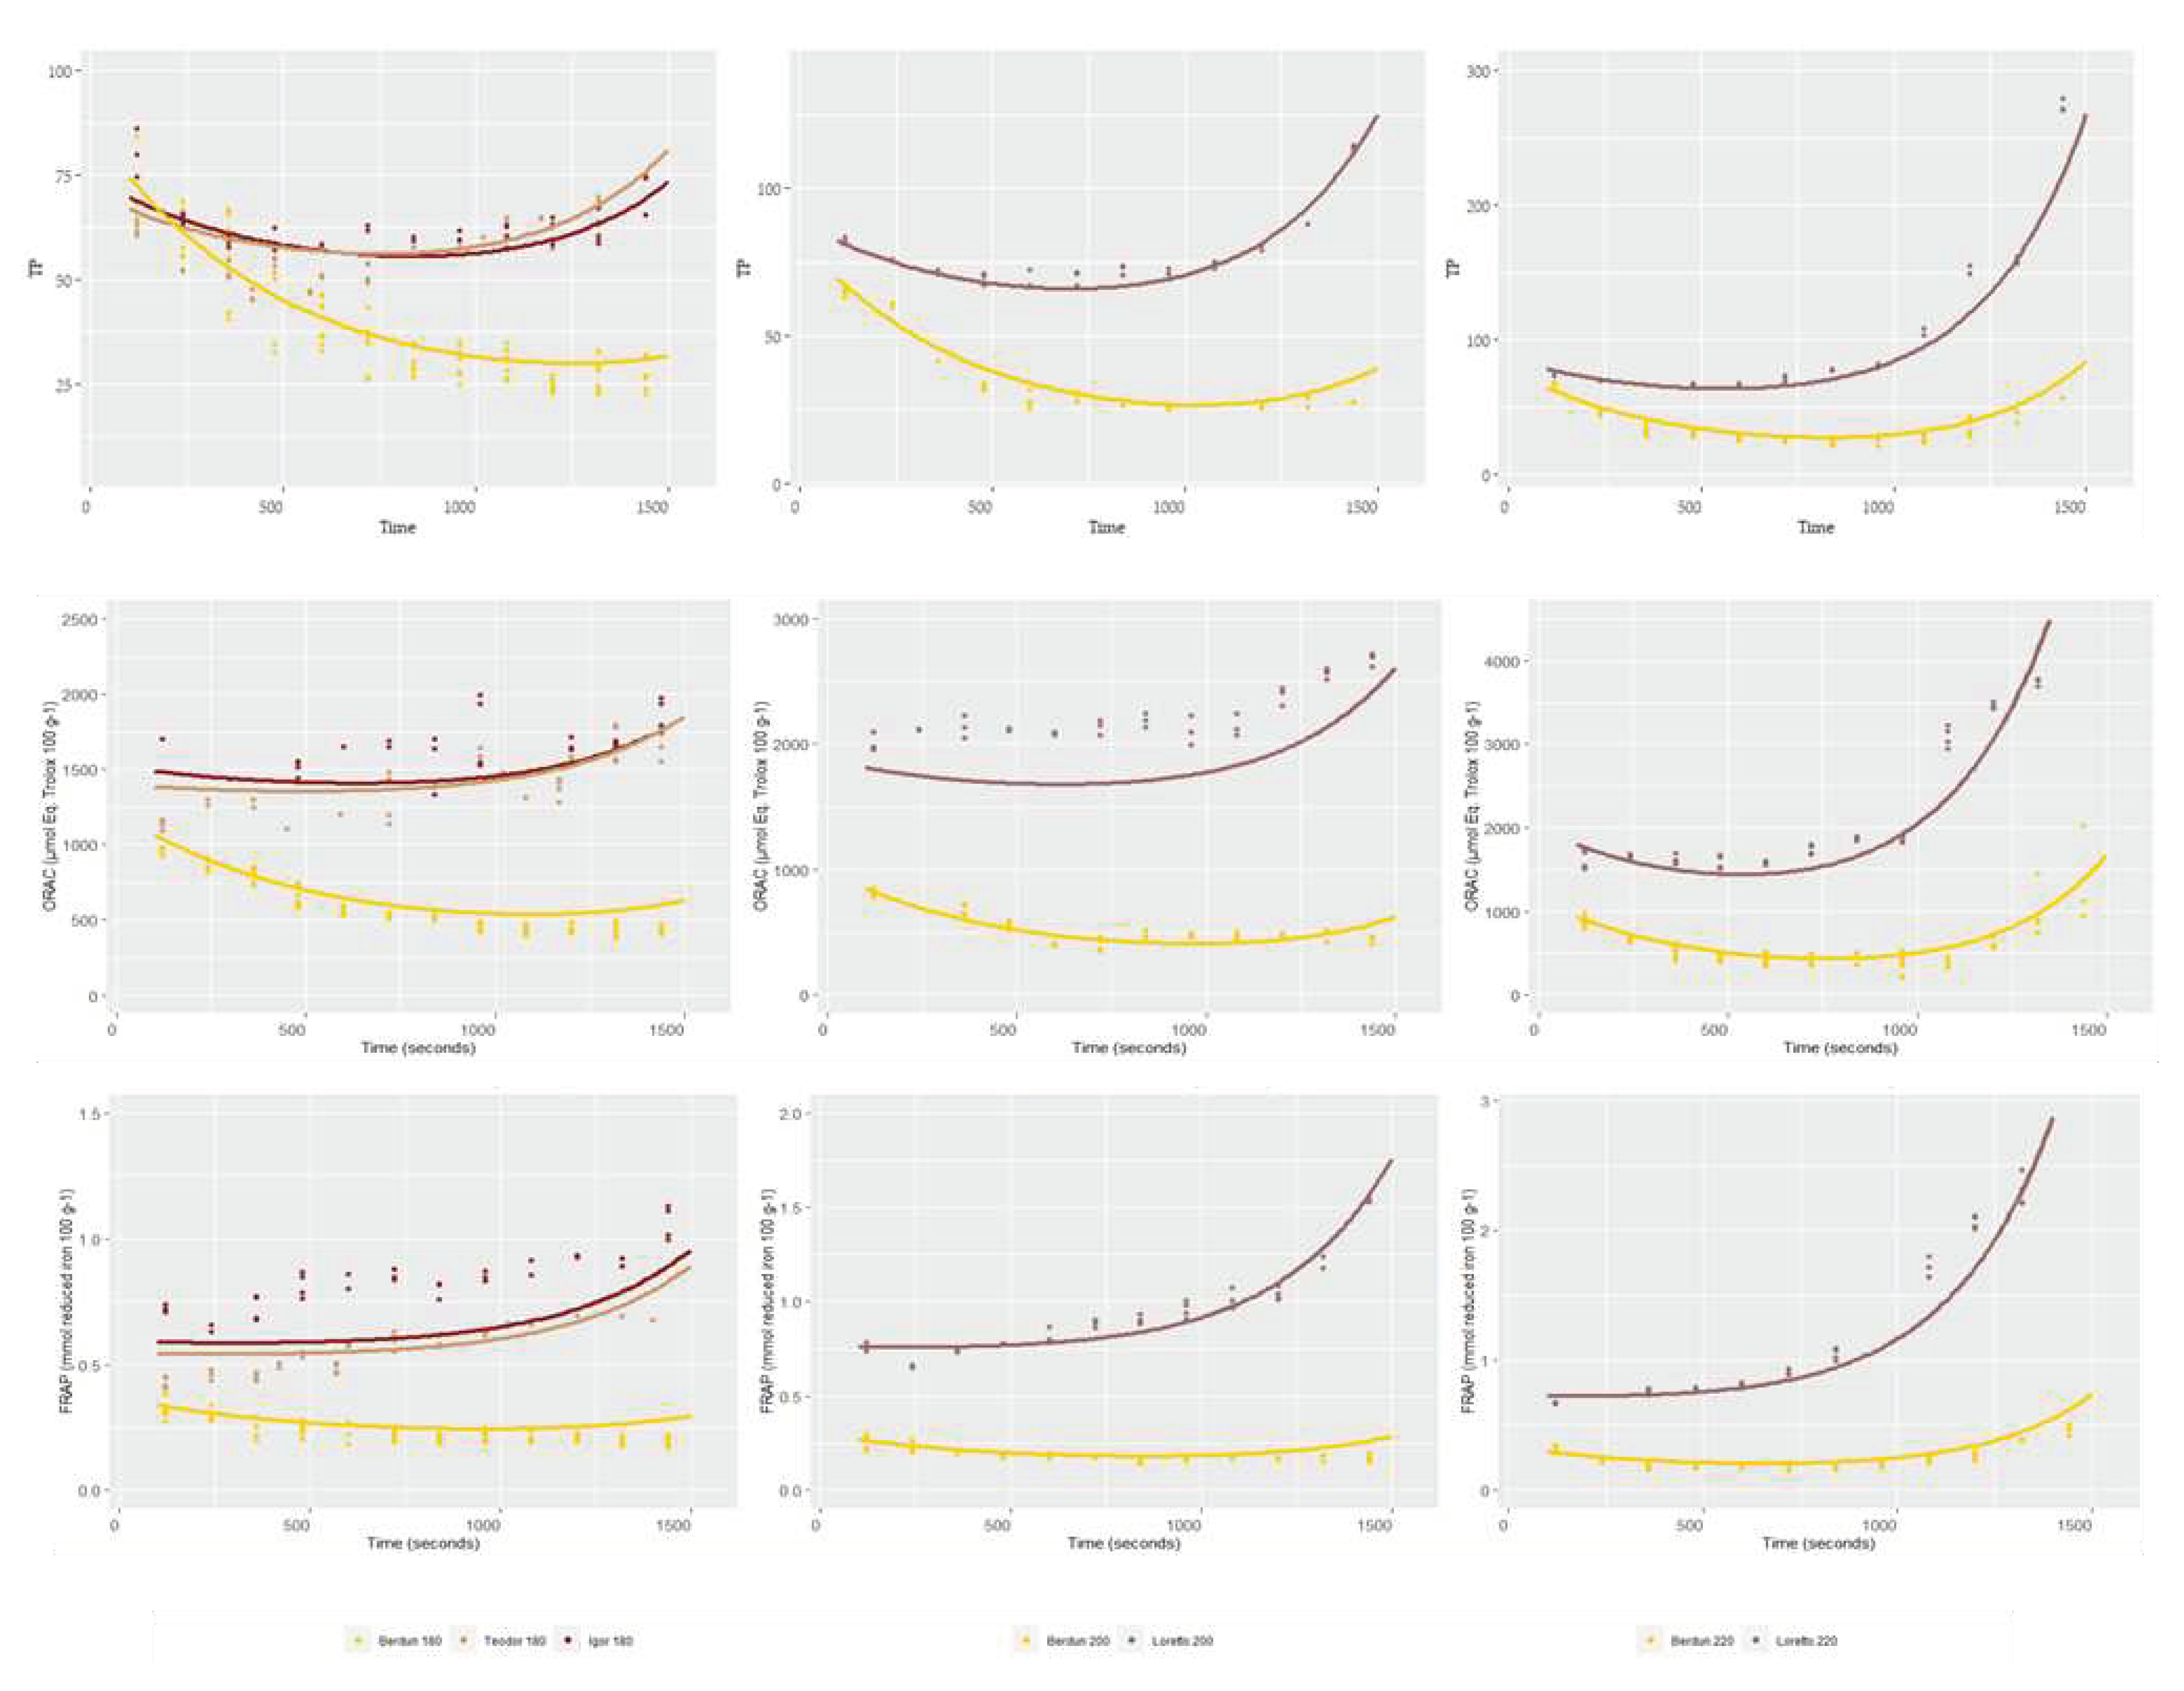
Sensitivity of modelling
3. Conclusions
Acknowledgments
References
- Sajdakowska, M.; Gębski, J.; Jeżewska-Zychowicz, M.; Królak, M. Consumer Choices in the Bread Market: The Importance of Fiber in Consumer Decisions. Nutrients 2021, 13, 132. [Google Scholar] [CrossRef]
- Anderson, J; Hanna, T. Whole grains and protection against coronary heart disease: what are the active components and mechanisms? American Journal of Clinical Nutrition. 1999, 70, 307–308. [Google Scholar] [CrossRef]
- Anderson, JW; Hanna, TJ; Peng, X; Kryscio, RJ. Whole grain foods and heart disease risk. Journal of the American College of Nutrition. 2000, 19 Suppl. 3, 291S–299S. [Google Scholar] [CrossRef]
- Bourdon, I; Yokoyama, W; Davis, P; Hudson, C; Backus, R; Richter, D; Knuckles, B; Schneeman, BO. Postprandial lipid, glucose, insulin and cholecystokinin responses in men fed barley pasta enriched with beta-glucan. American Journal of Clinical Nutrition. 1999, 69, 55–63. [Google Scholar] [CrossRef]
- Slavin, J; Jacobs, D; Marquart, L. Whole-grain consumption and chronic disease: protective mechanisms. Nutrition in Cancer. 1997, 27, 14–21. [Google Scholar] [CrossRef] [PubMed]
- Martín-Diana, AB; García-Casas, MJ; Martínez-Villaluenga, C; Frías, J; Peñas, E; Rico, D. Wheat and Oat Brans as Sources of Polyphenol Compounds for Development of Antioxidant Nutraceutical Ingredients. Foods. 2021, 10, 115. [Google Scholar] [CrossRef]
- Călinoiu, L.F.; Vodnar, D.C. Whole Grains and Phenolic Acids: A Review on Bioactivity, Functionality, Health Benefits and Bioavailability. Nutrients 2018, 10, 1615. [Google Scholar] [CrossRef]
- Available online: https://www.sphericalinsights.com/reports/europe-phenolic-antioxidant-market.
- Pruteanu, L. L.; Bailey, D. S.; Grădinaru, A. C.; Jäntschi, L. The Biochemistry and Effectiveness of Antioxidants in Food, Fruits, and Marine Algae. Antioxidants. 2023, 12, 860. [Google Scholar] [CrossRef]
- Pellegrini, N.; Vitaglione, P.; Granato, D.; Fogliano, V. Twenty-five years of total antioxidant capacity measurement of foods and biological fluids: merits and limitations. Journal of the science of food and agriculture. 2020, 100, 5064–5078. [Google Scholar] [CrossRef]
- Huang, D.; Ou, B.; Prior, R. L. The chemistry behind antioxidant capacity assays. Journal of agricultural and food chemistry. 2005, 53, 1841–1856. [Google Scholar] [CrossRef] [PubMed]
- Huang, D.; Ou, B.; Hampsch-Woodill, M.; Flanagan, J. A.; Deemer, E. K. Development and validation of oxygen radical absorbance capacity assay for lipophilic antioxidants using randomly methylated cyclodextrin as the solubility enhancer. J. Agric. Food Chem. 2002, 50, 1815–1821. [Google Scholar] [CrossRef] [PubMed]
- Niki, E. Lipid peroxidation: physiological levels and dual biological effects. Free radical biology & medicine. 2009, 47, 469–484. [Google Scholar] [CrossRef]
- Vanegas, S.M.; Meydani, M.; Barnett, J.B.; Goldin, B.; Kane, A.; Rasmussen, H.; Brown, C.; Vangay, P.; Knights, D.; Jonnalagadda, S.; et al. Substituting whole grains for refined grains in a 6-wk randomised trial has a modest effect on gut microbiota and immune and inflammatory markers of healthy adults. Am. J. Clin. Nutr. 2017, 105, 635–650. [Google Scholar] [CrossRef]
- Björck, I.; Östman, E.; Kristensen, M.; Mateo Anson, N.; Price, R.K.; Haenen, G.R.M.M.; Havenaar, R.; Bach Knudsen, K.E.; Frid, A.; Mykkänen, H.; et al. Cereal grains for nutrition and health benefits: Overview of results from in vitro, animal and human studies in the HEALTHGRAIN project. Trends Food Sci. Technol. 2012, 25, 87–100. [Google Scholar] [CrossRef]
- García-Castro, A.; Román-Gutiérrez, A.D.; Castañeda-Ovando, A.; Cariño-Cortés, R.; Acevedo-Sandoval, O.A.; López-Perea, P.; Guzmán-Ortiz, F.A. Cereals as a Source of Bioactive Compounds with Anti-Hypertensive Activity and Their Intake in Times of COVID-19. Foods 2022, 11, 3231. [Google Scholar] [CrossRef]
- Prior, R.L.; Wu, X.; Schaich, K. Standardized methods for the determination of antioxidant capacity and phenolics in foods and dietary supplements. J. Agric. Food Chem. 2005, 53, 4290–4302. [Google Scholar] [CrossRef]
- Tsiaka, T; Kritsi, E; Tsiantas, K; Christodoulou, P; Sinanoglou, VJ; Zoumpoulakis, P. Design and Development of Novel Nutraceuticals: Current Trends and Methodologies. Nutraceuticals. 2022, 2, 71–90. [Google Scholar] [CrossRef]
- Halvorsen, B.L.; Holte, K.; Myhrstad, M.C.; Barikmo, I.; Hvattum, E.; Remberg, S.F.; Wold, A.B.; Haffner, K.; Baugerød, H.; Andersen, L.F.; et al. A systematic screening of total antioxidants in dietary plants. J. Nutr. 2002, 132, 461–471. [Google Scholar] [CrossRef]
- Halvorsen, B.L.; Carlsen, M.H.; Phillips, K.M.; Bøhn, S.K.; Holte, K.; Jacobs, D.R., Jr.; Blomhoff, R. Content of redox-active compounds (ie, antioxidants) in foods consumed in the United States. Am. J. Clin. Nutr. 2006, 84, 95–135. [Google Scholar] [CrossRef]
- Haytowitz, DB.; Bhagwat, S. USDA Database for the Oxygen Radical Absorbance Capacity (ORAC) of Selected Foods, Release 2. United States Department of Agriculture 2010. Available online: http://www.orac-info-portal.de/download/ORAC_R2.pdf.
- Takebayashi, J.; Oki, T.; Watanabe, J.; Yamasaki, K.; Chen, J.; Sato-Furukawa, M.; Tsubota-Utsugi, M.; Taku, K.; Goto, K.; Matsumoto, T.; et al. Hydrophilic antioxidant capacities of vegetables and fruits commonly consumed in Japan and estimated average daily intake of hydrophilic antioxidants from these foods. J. Food Comp. Anal. 2013, 29, 25–31. [Google Scholar] [CrossRef]
- Zhiming, Li; Kaiying, Nie; Zhaojing, Wang. Quantitative Structure Activity Relationship Models for the Antioxidant Activity of Polysaccharides; Department of Bioengineering and Biotechnology, Huaqiao University: China, 2016. [Google Scholar]
- AOAC. Methods 990.03, 2003.05, 985.29 & 923.03. In Official Methods of Analysis of AOAC International, 18th ed.; AOAC: Gaithersburg, MD, USA, 2005. [Google Scholar]
- Slinkard, K.; Singleton, V.L. Total phenol analyses: Automation and comparison with manual methods. Am. J. Enol. Viticult. 1977, 28, 49–55. [Google Scholar] [CrossRef]
- Ou, B.; Hampsch-Woodill, M.; Prior, R.L. Development and validation of an improved oxygen radical absorbance capacity assay using fluorescein as the fluorescent probe. J. Agric. Food Chem. 2001, 49, 4619–4626. [Google Scholar] [CrossRef]
- Benzie, I.F.F.; Strain, J.J. The Ferric Reducing Ability of Plasma (FRAP) as measure of “antioxidant power”: The FRAP assay. Anal. Biochem. 1996, 239, 70–76. [Google Scholar] [CrossRef] [PubMed]
- Badarinath, A.V.; Rao, K.M.; Chetty, C.M.S.; Ramkanth, S.; Rajan, T.V.S. Review on In-vitro Antioxidant Methods: Comparisions, Correlations and Considerations. Inter. J. PharmTech Res. 2010, 2, 1276–1285. [Google Scholar]
- Nile, S.H.; Khobragade, C.N.; Park, S.W. Optimized and Comparative Antioxidant Assays and Its Applications in Herbal and Synthetic Drug Analysis as an Antioxidants. Mini-Rev. Med. Chem. 2012, 12, 1007–1014. [Google Scholar] [CrossRef]
- Available online: https://fdc.nal.usda.gov/.
- Singh, N. Pulses: an overview. J Food Sci Technol. 2017, 54, 853–857. [Google Scholar] [CrossRef]
- Singh, B; Singh, JP; Shevkani, K; Singh, N; Kaur, A. Bioactive constituents in pulses and their health benefits. J Food Sci Technol. 2017, 54, 858–870. [Google Scholar] [CrossRef] [PubMed]
- Gulati, P; Li, A; Holding, D; Santra, D; Zhang, Y; Rose, DJ. Heating Reduces Proso Millet Protein Digestibility via Formation of Hydrophobic Aggregates. J Agric Food Chem. 2017, 65, 1952–1959. [Google Scholar] [CrossRef] [PubMed]
- Parmar, N; Singh, N; Kaur, A; Virdi, AS; Shevkani, K. Protein and microstructure evaluation of harder-to-cook and easy-to-cook grains from different kidney bean accessions. LWT-Food Sci Technol. 2017, 79, 487–495. [Google Scholar] [CrossRef]
- Du, Y.; Esfandi, R.; Willmore, W.G.; Tsopmo, A. Antioxidant activity of oat proteins derived peptides in stressed hepatic HepG2 cells. Antioxidants. 2016, 5, 39. [Google Scholar] [CrossRef] [PubMed]
- Leung, R.; Venus, C.; Zeng, T.; Tsopmo, A. Structure-function relationships of hydroxyl radical scavenging and chromium-VI reducing cysteine-tripeptides derived from rye secalin. Food Chem. 2018, 254, 165–169. [Google Scholar] [CrossRef]
- Chen, S.; Lin, D.; Gao, Y.; Cao, X.; Shen, X. A novel antioxidant peptide derived from wheat germ prevents high glucose-induced oxidative stress in vascular smooth muscle cells in vitro. Food Funct. 2017, 8, 142–150. [Google Scholar] [CrossRef] [PubMed]
- Das, A.; Raychaudhuri, U.; Chakraborty, R. Cereal based functional food of Indian subcontinent: a review. J Food Sci Technol. 2012, 49, 665–72. [Google Scholar] [CrossRef] [PubMed]
- Torres-Fuentes, C.; Contreras, M.; Recio, I.; Alaiz, M.; Vioque, J. Identification and characterization of antioxidant peptides from chickpea protein hydrolysates. Food Chem. 2015, 180, 194–202. [Google Scholar] [CrossRef] [PubMed]
- Xie, J.; Du, M.; Shen, M.; Wu, T.; Lin, L. Physico-chemical properties, antioxidant activities and angiotensin-I converting enzyme inhibitory of protein hydrolysates from Mung bean (Vigna radiate). Food Chem. 2019, 270, 243–250. [Google Scholar] [CrossRef] [PubMed]
- Zhang, X.; He, H.; Xiang, J.; Li, B.; Zhao, M.; Hou, T. Selenium-containing soybean antioxidant peptides: Preparation and comprehensive comparison of different selenium supplements. Food Chem. 2021, 358, 129888. [Google Scholar] [CrossRef]
- Konopka, I.; Grabiński, J.; Skrajda, M.; Dąbrowski, G.; Tańska, M.; Podolska, G. Variation of wheat grain lipid fraction and its antioxidative status under the impact of delayed sowing. Journal of Cereal Science 2017, 76, 56–63. [Google Scholar] [CrossRef]
- Ciudad-Mulero, M.; Matallana-González, M. C.; Cámara, M.; Fernández-Ruiz, V.; Morales, P. Antioxidant Phytochemicals in Pulses and their Relation to Human Health: A Review. Current pharmaceutical design. 2020, 26, 1880–1897. [Google Scholar] [CrossRef]
- Das, A.; Raychaudhuri, U.; Chakraborty, R. Cereal based functional food of Indian subcontinent: a review. J Food Sci Technol. 2012, 49, 665–72. [Google Scholar] [CrossRef]
- Núñez-Gómez, V.; González-Barrio, R.; Periago, M.J. Interaction between Dietary Fiber and Bioactive Compounds in Plant By-Products: Impact on Bioaccessibility and Bioavailability. Antioxidants. 2023, 12, 976. [Google Scholar] [CrossRef] [PubMed]
- Călinoiu, LF.; Vodnar, DC. Whole Grains and Phenolic Acids: A Review on Bioactivity, Functionality, Health Benefits and Bioavailability. Nutrients. 2018, 10, 1615. [Google Scholar] [CrossRef]
- Tosh, SM.; Farnworth, ER.; Brummer, Y.; Duncan, AM.; Wright, AJ.; Boye, JI.; Marcotte, M.; Benali, M. Nutritional Profile and Carbohydrate Characterization of Spray-Dried Lentil, Pea and Chickpea Ingredients. Foods. 2013, 2, 338–349. [Google Scholar] [CrossRef] [PubMed]
- Muzolf-Panek, M.; Wa´skiewicz, A. Relationship between Phenolic Compounds, Antioxidant Activity and Color Parameters of Red Table Grape Skins Using Linear Ordering Analysis. Appl. Sci. 2022, 12, 6146. [Google Scholar] [CrossRef]
- Rico, D.; Peñas, E.; Del Carmen García, M.; Rai, D.K.; Martínez-Villaluenga, C.; Frias, J.; Martín-Diana, A.B. Development of Antioxidant and Nutritious Lentil (Lens culinaris) Flour Using Controlled Optimized Germination as a Bioprocess. Foods 2021, 10, 2924. [Google Scholar] [CrossRef] [PubMed]
- Aguilera, Y.; Dueñas, M.; Estrella, I.; Hernández, T.; Benitez, V.; Esteban, R.M.; Martín-Cabrejas, M.A. Evaluation of Phenolic Profile and Antioxidant Properties of Pardina Lentil as Affected by Industrial Dehydration. Journal of Agricultural and Food Chemistry 2010, 58, 10101–10108. [Google Scholar] [CrossRef]
- Prior, R.L. Oxygen radical absorbance capacity (ORAC): New horizons in relating dietary antioxidants/bioactives and health benefits. Journal of Functional Foods. 2015, 18, 797–810. [Google Scholar] [CrossRef]
- Mpofu, A.; Sapirstein, H.D.; Beta, T. Genotype and environmental variation in phenolic content, phenolic acid composition, and antioxidant activity of hard spring wheat. J. Agric. Food Chem. 2006, 54, 1265–1270. [Google Scholar] [CrossRef]
- Available online: http://www.ars.usda.gov/nutrientdata.
- Sablani, S.S.; Marcotte, M.; Baik, O.D.; Castaigne, F. Modeling of simultaneous heat and water transport in the baking process. Lebensm Wiss Technol. 1998, 31, 201–209. [Google Scholar] [CrossRef]
- Blanch, G.P.; Ruiz del Castillo, M.L. Effect of Baking Temperature on the Phenolic Content and Antioxidant Activity of Black Corn (Zea mays L.) Bread. Foods. 2021, 10, 1202. [Google Scholar] [CrossRef]
- Delgado-Andrade, C.; Rufián-Henares, J.A.; Morales, F.J. Assessing the Antioxidant Activity of Melanoidins from Coffee Brews by Different Antioxidant Methods. J. Agric. Food Chem. 2005, 53, 7832–7836. [Google Scholar] [CrossRef]
- Huang, D.; Ou, B.; Prior, RL. The chemistry behind antioxidant capacity assays. J Agric Food Chem. 2005, 53, 1841–56. [Google Scholar] [CrossRef] [PubMed]
- Rani, M.; Singh, G.; Siddiqi, R.A.; Gill, B.S.; Sogi, D.S.; Bhat, M.A. Comparative Quality Evaluation of Physicochemical, Technological, and Protein Profiling of Wheat, Rye, and Barley Cereals. Frontiers in Nutrition. 2021, 8. [Google Scholar] [CrossRef] [PubMed]
- Przygodzka, M.; Piskula, M.K.; Kukurová, K.; Ciesarová, Z.; Bednarikova, A.; Zieliński, H. Factors influencing acrylamide formation in rye, wheat and spelt breads. Journal of Cereal Science 2015, 65, 96–102. [Google Scholar] [CrossRef]
- Çelik, E.E.; Gökmen, V. Formation of Maillard reaction products in bread crust-like model system made of different whole cereal flours. European Food Research and Technology. 2020, 246, 1207–1218. [Google Scholar] [CrossRef]
- Saura-Calixto, F. Antioxidant dietary fiber product: a new concept and a potential food ingredient. J Agric Food Chem. 1998, 46, 4303–4306. [Google Scholar] [CrossRef]
- Liu, J.; Gan, J.; Yu, Y.; Zhu, S.; Yin, L.; Cheng, Y. Effect of laboratory-scale decoction on the antioxidative activity of Zhenjiang Aromatic Vinegar: The contribution of melanoidins. Journal of Functional Foods. 2016, 21, 75–86. [Google Scholar] [CrossRef]
- Delgado-Andrade, C.; Rufián-Henares, JA.; Morales, FJ. Assessing the antioxidant activity of melanoidins from coffee brews by different antioxidant methods. J Agric Food Chem. 2005, 53, 7832–6. [Google Scholar] [CrossRef] [PubMed]
- Froufe, H.J.C.; Abreu, R.M.V.; Ferreira, I.C.F.R. A QCAR model for predicting antioxidant activity of wild mushrooms. Escola Superior Agrária Instituto Politécnico de Bragança, Portugal 2009. [Google Scholar] [CrossRef]
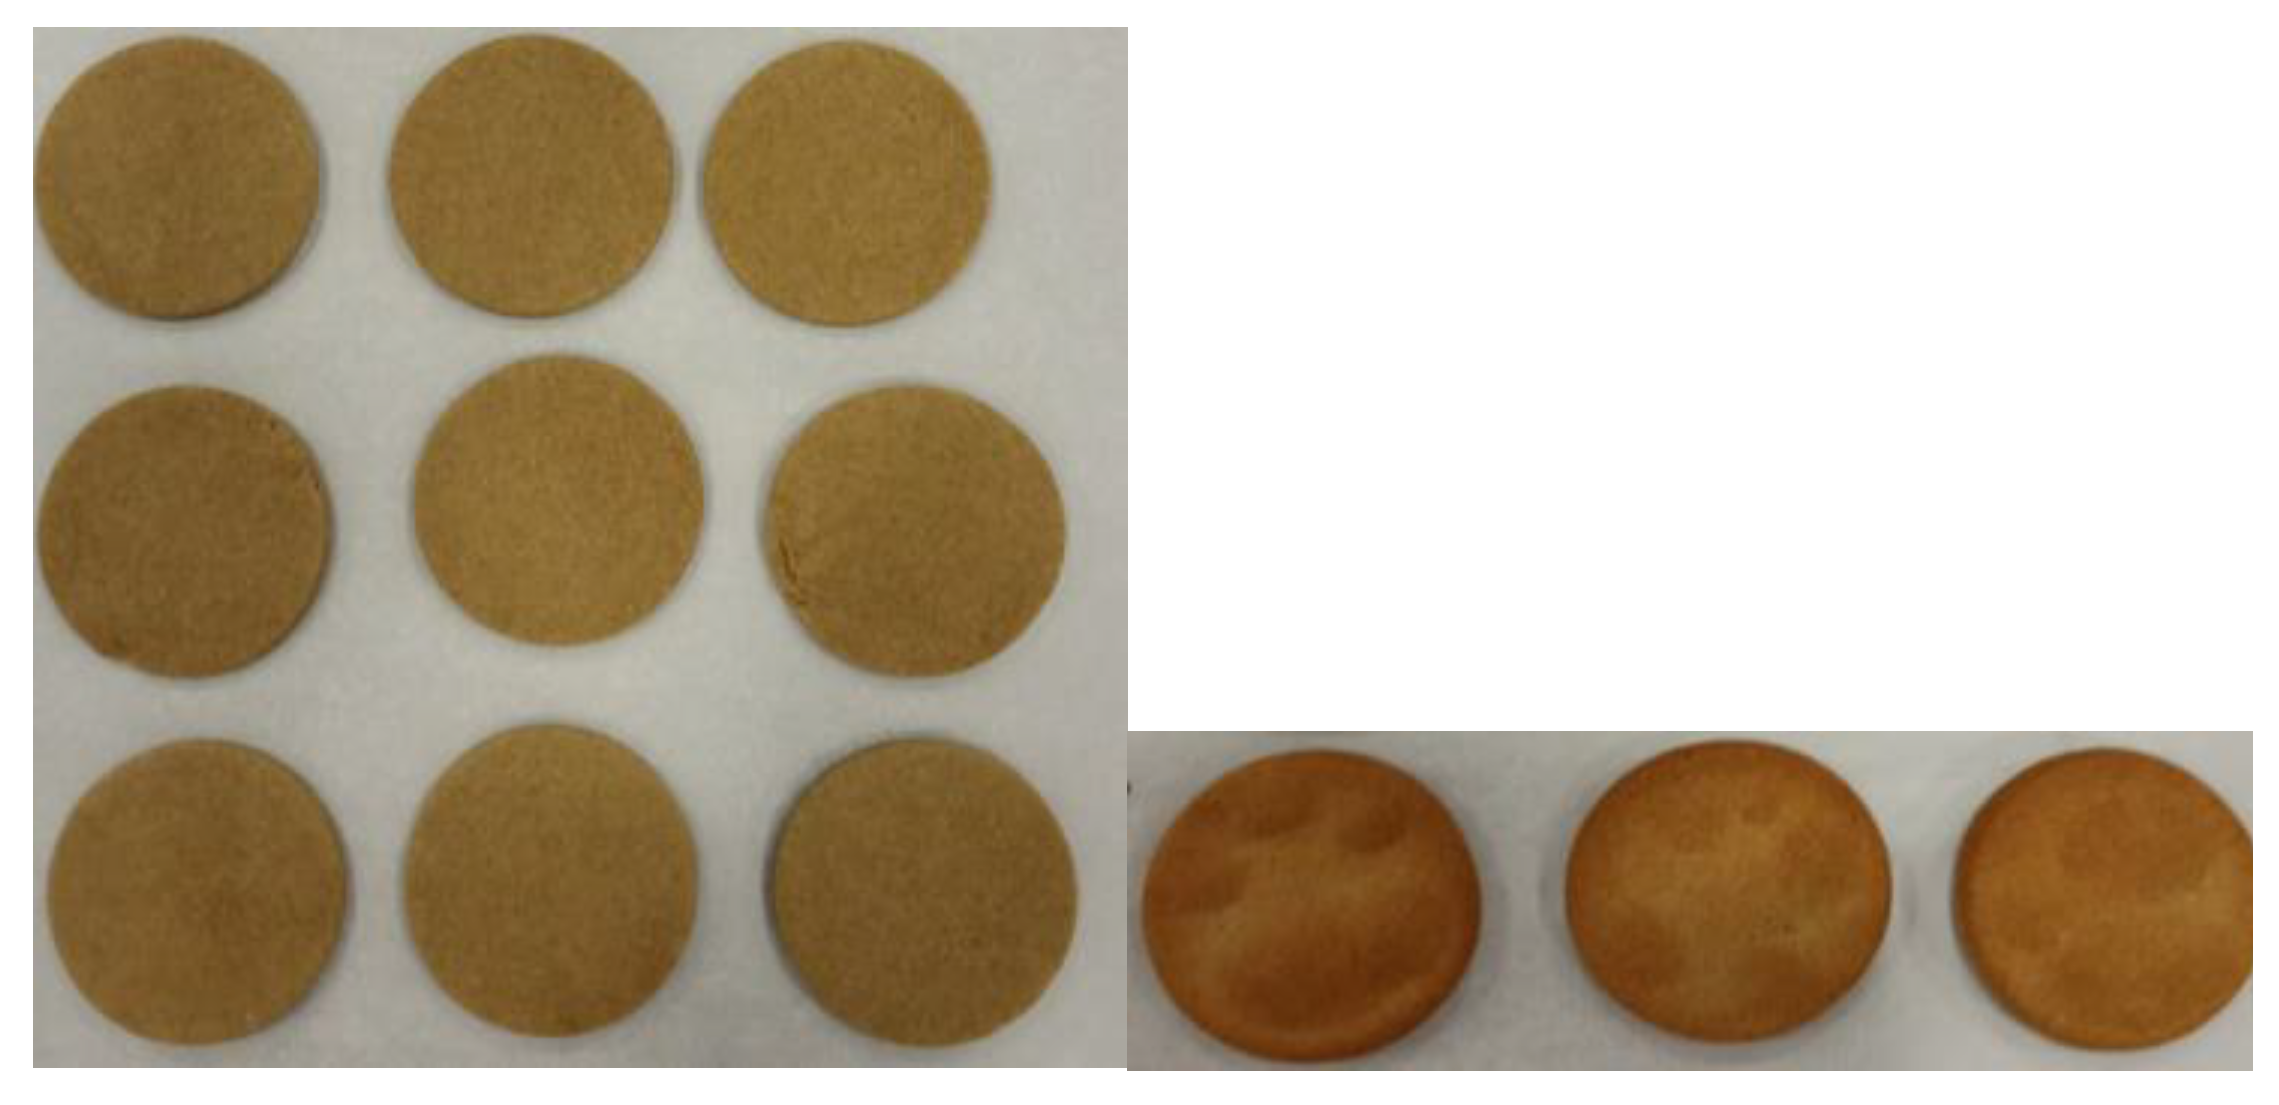
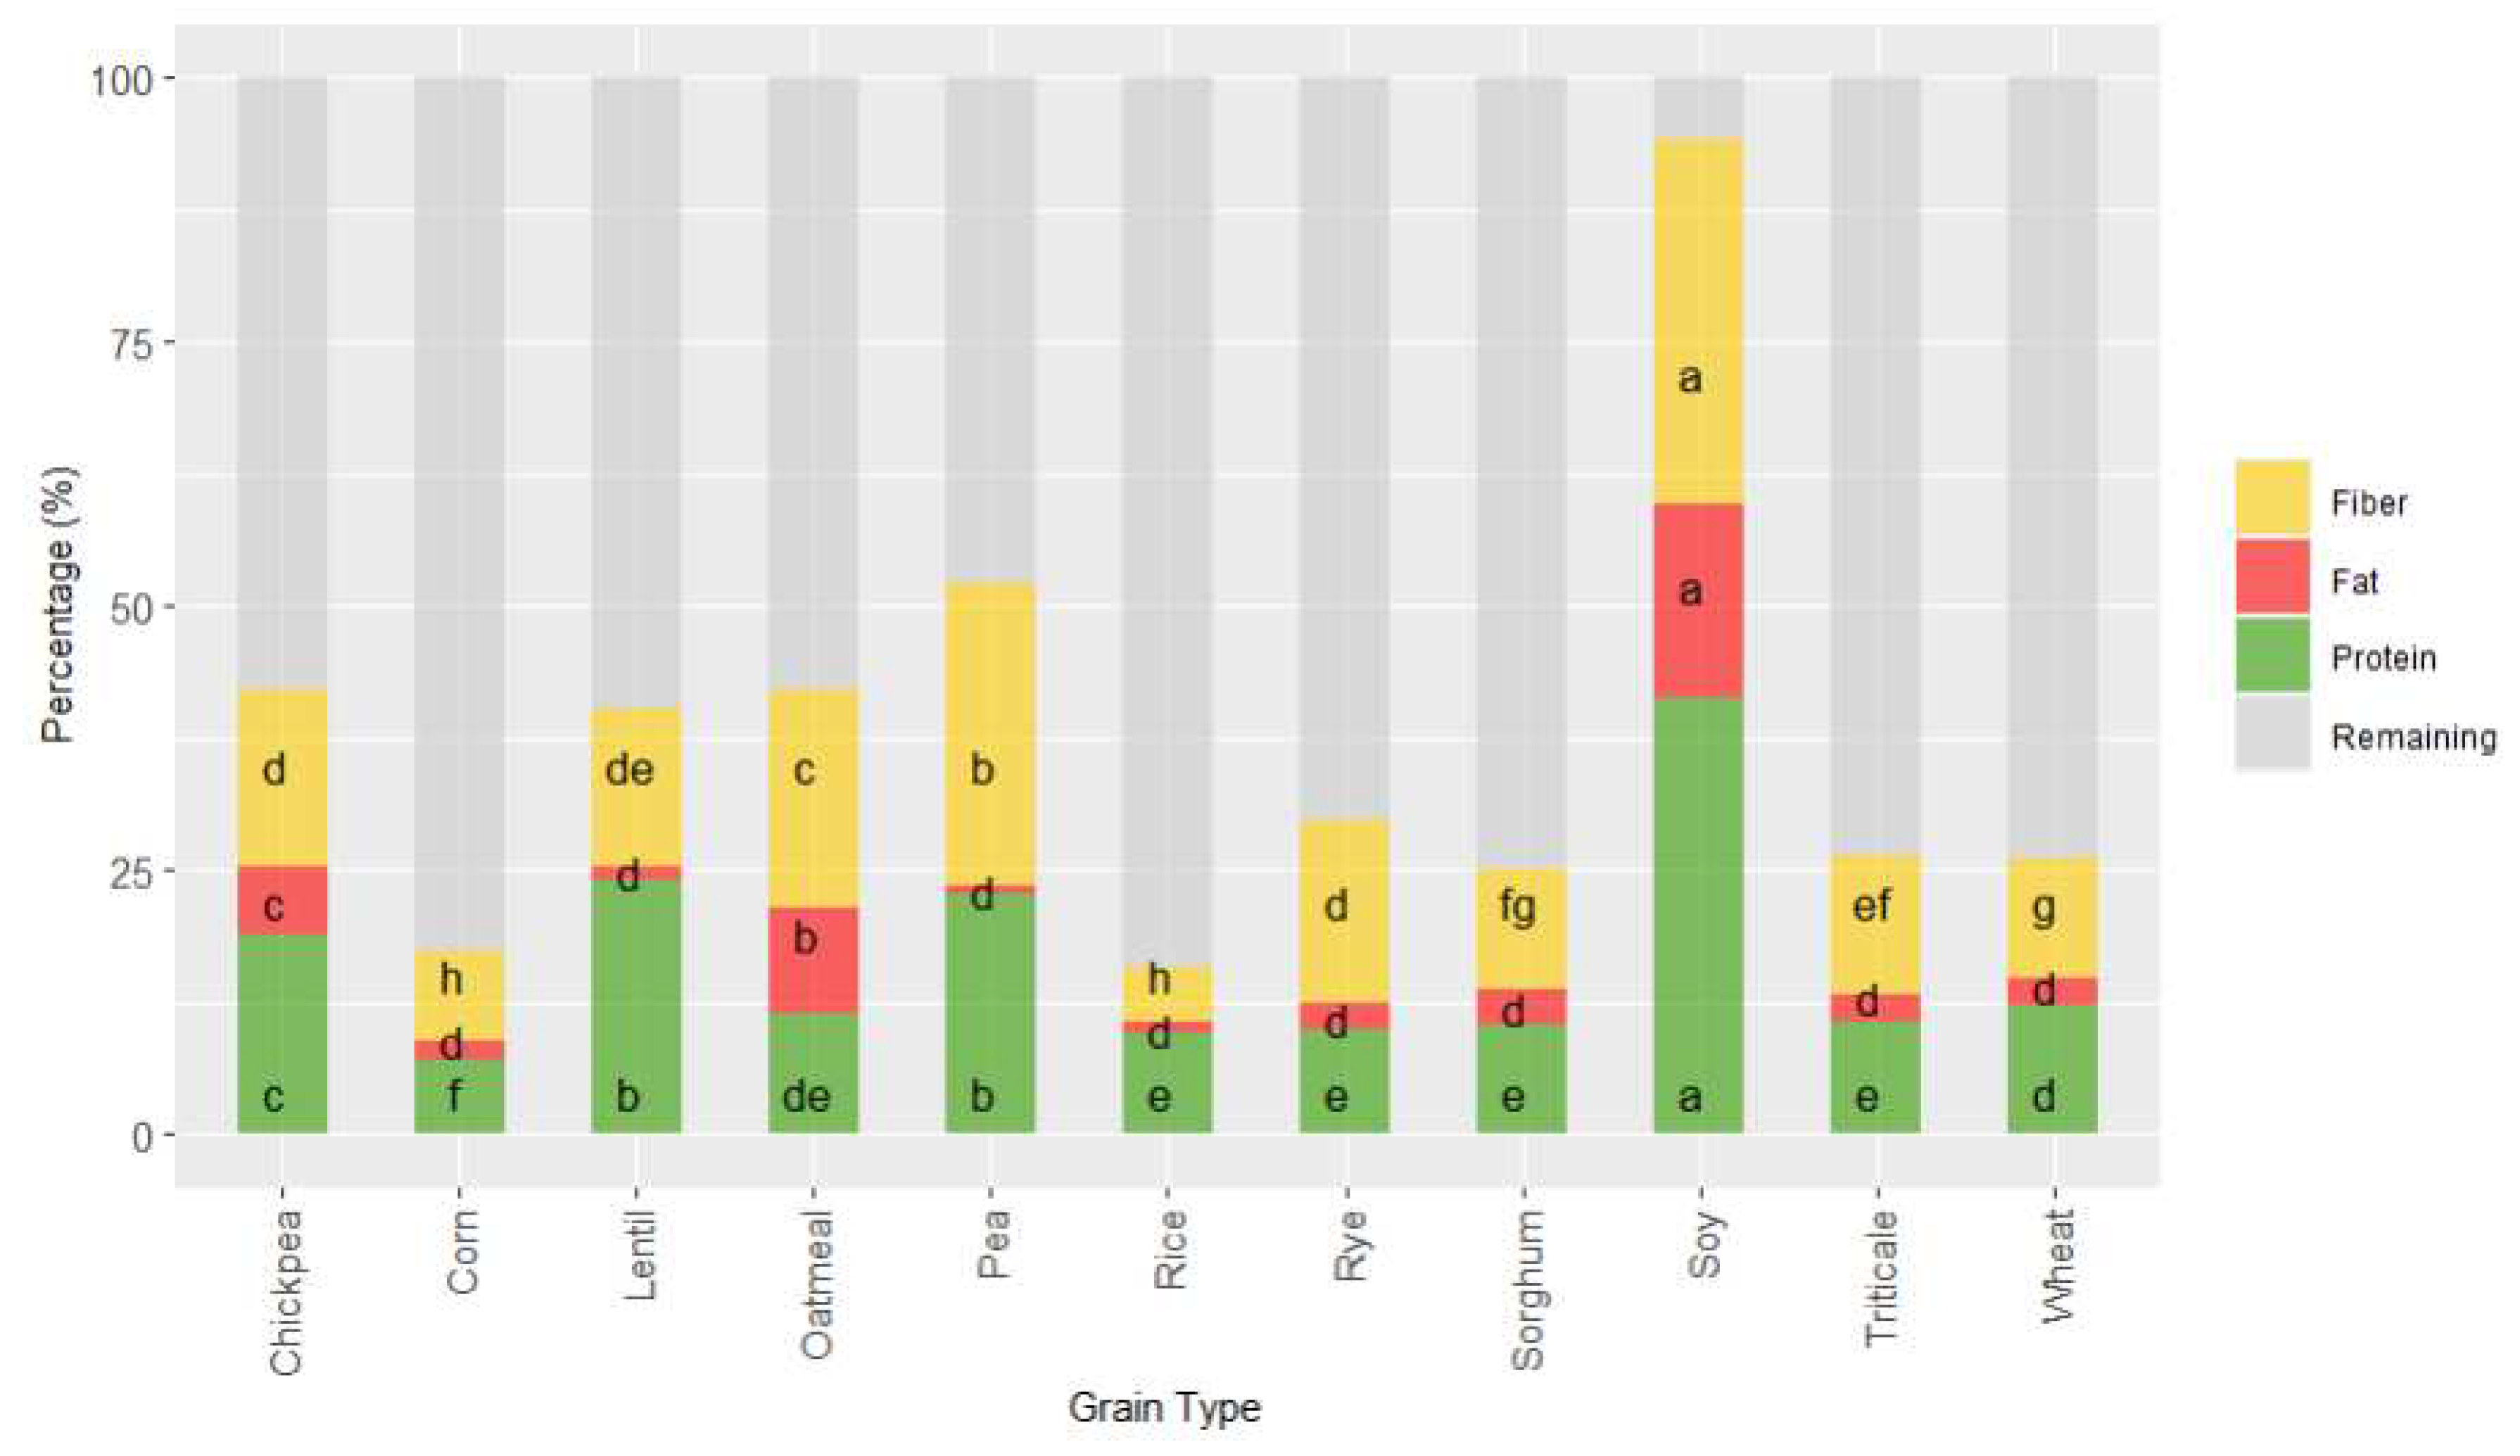
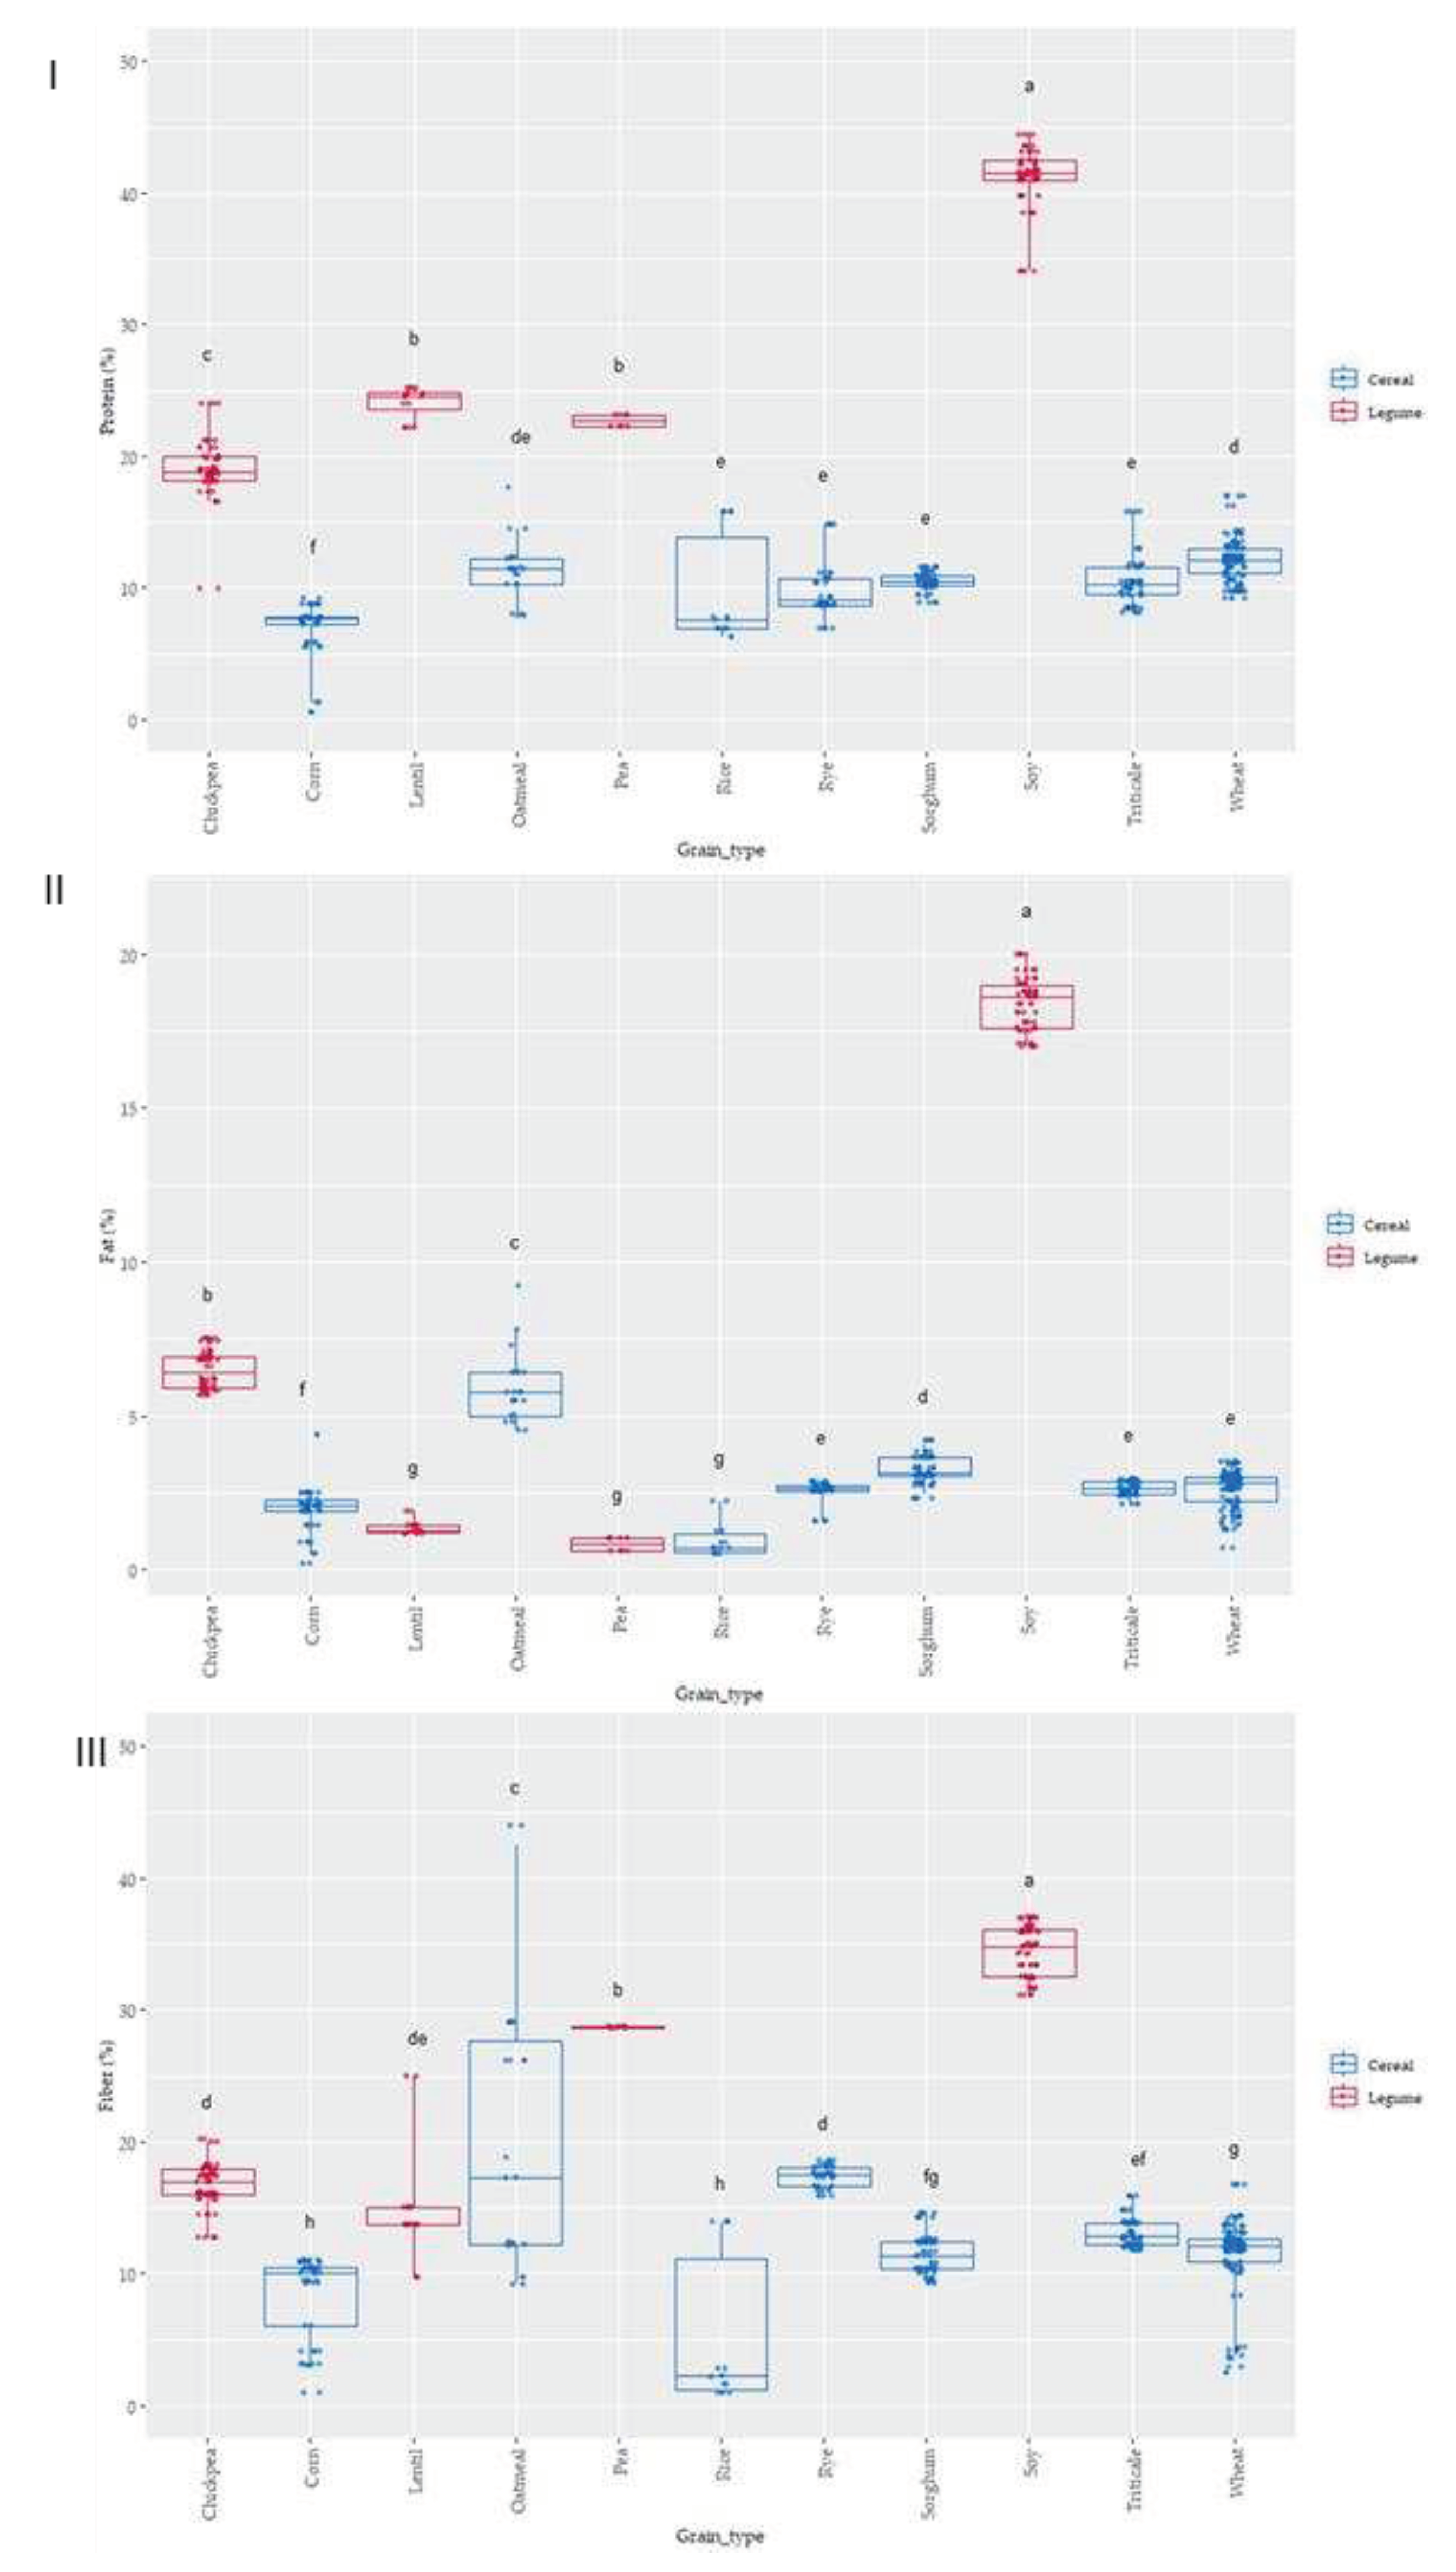
| Setting | TP | ORAC | FRAP | ||||||
|---|---|---|---|---|---|---|---|---|---|
| ϴ | Alpha1 | Alpha2 | ϴ | Alpha1 | Alpha2 | ϴ | Alpha1 | Alpha2 | |
| Berdun 180 °C | 0.605 | 1.985 | 0.100 | 0.291 | 0.826 | 0.117 | 0.296 | 0.297 | 0.059 |
| Igor 180 °C | 1.497 | 0.850 | 0.573 | 0.317 | 0.588 | 0.106 | 0.231 | 0.246 | 0.061 |
| Teodor 180 °C | 1.391 | 0.375 | 1.013 | 0.112 | 0.926 | 0.566 | 0.186 | 0.409 | 0.292 |
| Berdun 200 °C | 0.431 | 1.960 | 0.265 | 1.875 | 0.134 | 0.564 | 1.285 | 0.045 | 1.020 |
| Loretto 200 °C | 1.717 | 0.938 | 1.022 | 0.873 | 1.016 | 3.034 | 1.131 | 0.090 | 2.658 |
| Berdun 220 °C | 0.309 | 1.976 | 0.566 | 1.371 | 0.220 | 0.450 | 1.278 | 0.034 | 0.680 |
| Loretto 220 °C | 1.462 | 1.020 | 2.516 | 1.140 | 0.062 | 0.686 | 0.836 | 0.025 | 0.755 |
| Temperature | Variety | R2_TP | R2_ORAC | R2_FRAP |
|---|---|---|---|---|
| 180 °C | Berdun | 0.807 | 0.655 | -0.372 |
| 180 °C | Teodor | 0.021 | 0.500 | 0.387 |
| 180 °C | Igor | 0.396 | -0.404 | -2.081 |
| 200 °C | Berdun | 0.893 | 0.716 | -0.266 |
| 200 °C | Loretto | 0.952 | -2.051 | 0.935 |
| 220 °C | Berdun | 0.632 | 0.712 | 0.423 |
| 220 °C | Loretto | 0.919 | 0.844 | 0.881 |
Disclaimer/Publisher’s Note: The statements, opinions and data contained in all publications are solely those of the individual author(s) and contributor(s) and not of MDPI and/or the editor(s). MDPI and/or the editor(s) disclaim responsibility for any injury to people or property resulting from any ideas, methods, instructions or products referred to in the content. |
© 2023 by the authors. Licensee MDPI, Basel, Switzerland. This article is an open access article distributed under the terms and conditions of the Creative Commons Attribution (CC BY) license (http://creativecommons.org/licenses/by/4.0/).


