1. Introduction
Prostate cancer (PC) is one of the most common cancers in men in the world. This type of cancer is characterized by high morbidity and mortality rates, especially in elderly men. According to the WHO estimates, PC is the second in primary disease detection and the sixth in morbidity rate among all oncological diseases [
1,
2]. Similar to other cancers, PC is a multifactorial disease. Its main causes include genetic and ecological factors [
3]. The main criteria of PC include early cancer onset (starting at the age of 30), high malignancy of primarily diagnosed cancer, and fast cancer progression [
4].
PC develops without any visible signs and complaints, often beginning to cause discomfort at only late stages. Early stages of the disease can be either completely asymptomatic, or accompanied by concomitant, more common pathologies such as chronic prostatitis and benign prostatic hyperplasia. The methods used to treat PC are prostatectomy in case of localized cancer, and androgen deprivation therapy in case of metastasis [
5]. However, surgical resection is accompanied by a high risk of complications, with urinary incontinence and erectile dysfunction being the most common ones [
6].
To date, the commonly available methods of instrumental analysis of PC, and related diagnostic methods are not perfect. The commonly employed methods of PC screening include clinical examination, digital rectal examination, and transrectal ultrasound [
7]. Recently, multiparametric magnetic resonance imaging (mpMRI) has been widely used to diagnose PC [
8]. However, biopsy still remains the “golden standard” of PC diagnosis. It allows one to detect cancer cells in prostate tissue, to assess the Gleason score and, therefore, to determine the treatment strategy to be used by the clinician [
7]. At the same time, it is an invasive approach, which accordingly causes discomfort to the patient. However, systematic biopsy in case of active monitoring of patients with clinically insignificant PC (Gleason score <7) can overlook PC progression, which, in turn, can lead to PC diagnosis at later stages [
9,
10]. Furthermore, the fact that the human is involved in evaluation of results of the above instrumental analysis methods inevitably leads to subjectivity of the obtained data: the results of the same study can be interpreted differently if the patient is examined by more than one clinician.
The preferable painless diagnostic approaches include serological liquid biopsy. Specific biochemical markers are currently used for early PC diagnosis. These markers allow for fast and accurate procedure and diagnosis. However, despite the wide use of PSA-based screening (which consists in the determination of prostate-specific antigen level in blood samples) in practical healthcare, the ratio of patients with PC, in particular, with stage III PC, remains high and accounts for 45–48% [
11]. PSA screening usually leads to false positive results due to insufficient marker specificity [
13]. According to the American Urological Association, the ratio of men with PSA>3.0 ng/ml and without PC is 75.9% after follow-up biopsy [
12]. PSA is known to be induced by prostate. However, it is not considered a 100% tumour-specific marker of PC, since an increase in the PSA level can be related to prostatitis, benign prostatic hyperplasia, etc. [
7]. Furthermore, the molecular mechanisms of PC pathogenesis, invasion, and metastasis remain largely unknown. It is therefore important to determine the genetic drivers of PC in order to find new biomarkers for stratification of the risk and aggressiveness of PC during screening examinations.
Based on the above, search for new PC markers is required. Furthermore, since the PC aggressiveness depends on its stage, degree of tumour tissue differentiation, and the stage at which the disease is diagnosed, further development of novel methods of PC diagnosis, which will provide early PC revelation, is evident.
MiRNAs are a large family of highly conserved non-coding RNAs of 18 to 25 nucleotides in length. These RNA molecules can regulate the expression of several target genes involved in such normal biological processes as proliferation, differentiation, and apoptosis [
14]. To date, around 2,000 different miRNAs were identified in human, and their number is growing [
15]. Several studies reported abnormal miRNA expression in some cancers where these RNAs act as either tumour suppressors or oncogenes [
16,
17]. Recent studies revealed the potential of some miRNAs to act as diagnostic biomarkers [
17,
18]. Circulating MiRNAs were revealed in such biological fluids as blood, saliva, and urine. Wong et al. found miR-184 in the blood of 80% patients with tongue squamous cell carcinoma — as compared with only 13% healthy people [
19]. Waseem et al. considered miR-183-5p as a PC biomarker and showed that miR-183 expression correlates with a higher PSA level, higher Gleason score, and metastases [
20]. Fendler et al. identified 63 miRNAs with differential expression among the same categories of PC patients [
21].
Promising new-generation methods include the detection of PC using biosensors, which contain miniaturized chips “silicon-on-insulator”-based nanoribbon structures (SOI-NR biosensors). These biosensors make it possible to detect biological markers of human diseases in biological fluids at low concentrations (<10
-15), which correspond to early stages of the pathological process [
22]. Sub-femtomolar sensitivity was demonstrated for the SOI-NR biosensor-based assay upon detection of protein [
30,
33] and miRNA [
23,
24,
25] molecules. The benefits of the SOI-NR biosensor systems are their high concentration sensitivity (10
-17 to 10
-15 M), and the label-free signal acquisition in real time [
35,
36,
37].
In our study, we have used a biosensor, which comprised an array of “silicon-on-insulator” nanoribbon sensor structures. The latter have been fabricated by a complementary metal-oxide-semiconductor (CMOS)-compatible technology, with the use of gas-phase reduction and lithography [
26]. In order to provide biospecific detection, the surface of the sensor structures has been sensitized by covalent immobilization of DNA oligonucleotide probes (oDNA probes). Nucleotide sequences of the probes were complementary to those of four target miRNAs (miRNA-183 [
20], miRNA-346 [
27], miRNA-429 [
28], and miRNA-484 [
29], which were reported to be associated with PC. The work included two steps. At the first step, experiments on the detection of model DNA oligonucleotide targets (oDNAs) in buffer solution have been performed studied in order to determine the detection sensitivity. The sequences of these model oDNAs correspond to those of the target miRNAs, i.e. the target oDNAs used represent synthetic analogues of the target miRNAs. At the second step, we have investigated whether it is possible to detect the target miRNAs, isolated from the real samples of plasma of PC patients, and the detection of the target miRNAs has been successfully demonstrated.
2. Materials and Methods
2.1. Chemicals
Isopropanol (“AcrosOrganics”, Geel, Belgium), hydrofluoric acid (“Reakhim”, Moscow, Russia), and ethanol (“Reakhim”, Moscow, Russia) were used in the study. The 3,3'-dithiobis(sulfosuccinimidylpropionate) (DTSSP) cross-linker was obtained from Pierce (Waltham, MA, USA). Monocalcium phosphate (MCP), dimethylsulfoxide (DMSO), and 3-aminopropyltriethoxysilane (APTES) were purchased from Sigma Aldrich (St. Louis, MO, USA). Deionized water was obtained using the Milli-Q purification system (Millipore, USA).
2.2. Oligonucleotides
All oligonucleotides used in the experiments were synthesized by Evrogen (Moscow, Russia). The oDNA probes named "probe_1", "probe_2", "probe_3", and "probe_4" were used for the sensitization of the surface of nanoribbons. In the experiments on the determination of the detection sensitivity, model oDNAs were used as target molecules. These model target oDNAs (designated "CS") represent synthetic analogues of miRNAs. Sequences of CS oDNAs are complementary to oDNA probes with the same numeric designation. The nucleotide sequences of the oDNA probes and the model target oDNAs are listed in
Table 1 and
Table 2, respectively.
The sequences listed in
Table 1 and
Table 2 were determined using a miRBase online software (
https://www.mirbase.org/). Since mature miR-3p and miR-5p can also circulate in the blood and have various sequences, we decided to use the sequences of immature miRNA183, miRNA 346, miRNA 429, and miRNA 484 in order to be able to detect any mature miRNA form.
2.3. Preparation of Buffered Solution of Target oDNAs
The solutions of target oDNAs with the concentrations ranging from 10-18 to 10-15 M were prepared from the initial stock solution (100 μM in 50 mM monocalcium phosphate (MCP), pH 7.4) by tenfold serial dilutions in buffer solution (1 mM MPC, pH 7.4). The solution was incubated in a shaker for 30 minutes at 10°C and 600 rpm at each dilution step. The solutions were prepared immediately before their use in the measurements.
2.4. Collection of Blood Plasma Samples
All samples were collected using protocols of I.M. Sechenov First Moscow State Medical University (Sechenov University) in compliance with the order no. 1177n (Ministry of Health of Russian Federation; 20 December, 2012). Blood plasma samples were obtained from patients with PC diagnosed during either medical examination or surgery. The studies were performed in accordance with the ethical committee; patients provided an informed consent for participation in the study involving human biomaterial.
We have analyzed plasma samples of patients with confirmed PC (No. 5 and 44). Blood plasma samples from patients with benign cyst of the left kidney (No. 27) were used in control experiments. Patients' characteristics are presented in
Table 3.
Blood sampling was conducted on an empty stomach from the cubital vein before treatment. Samples were collected in vacutainers with 3.8% Sodium Citrate anticoagulant (S-Monovett®, SARSTEDT, Germany) and centrifuged at 3,000 rpm for 6 min at room temperature. Each plasma sample (500 µl) was collected in two dry test tubes, frozen, and stored at –80°C prior to analysis.
To extract miRNAs from blood plasma samples, miRCURY RNA Isolation Kit – Biofluids was used immediately before the experiment.
2.5. Fabrication of SOI-NR Chips
Fabrication of SOI-NR chips is described in detail elsewhere [
26,
30,
31,
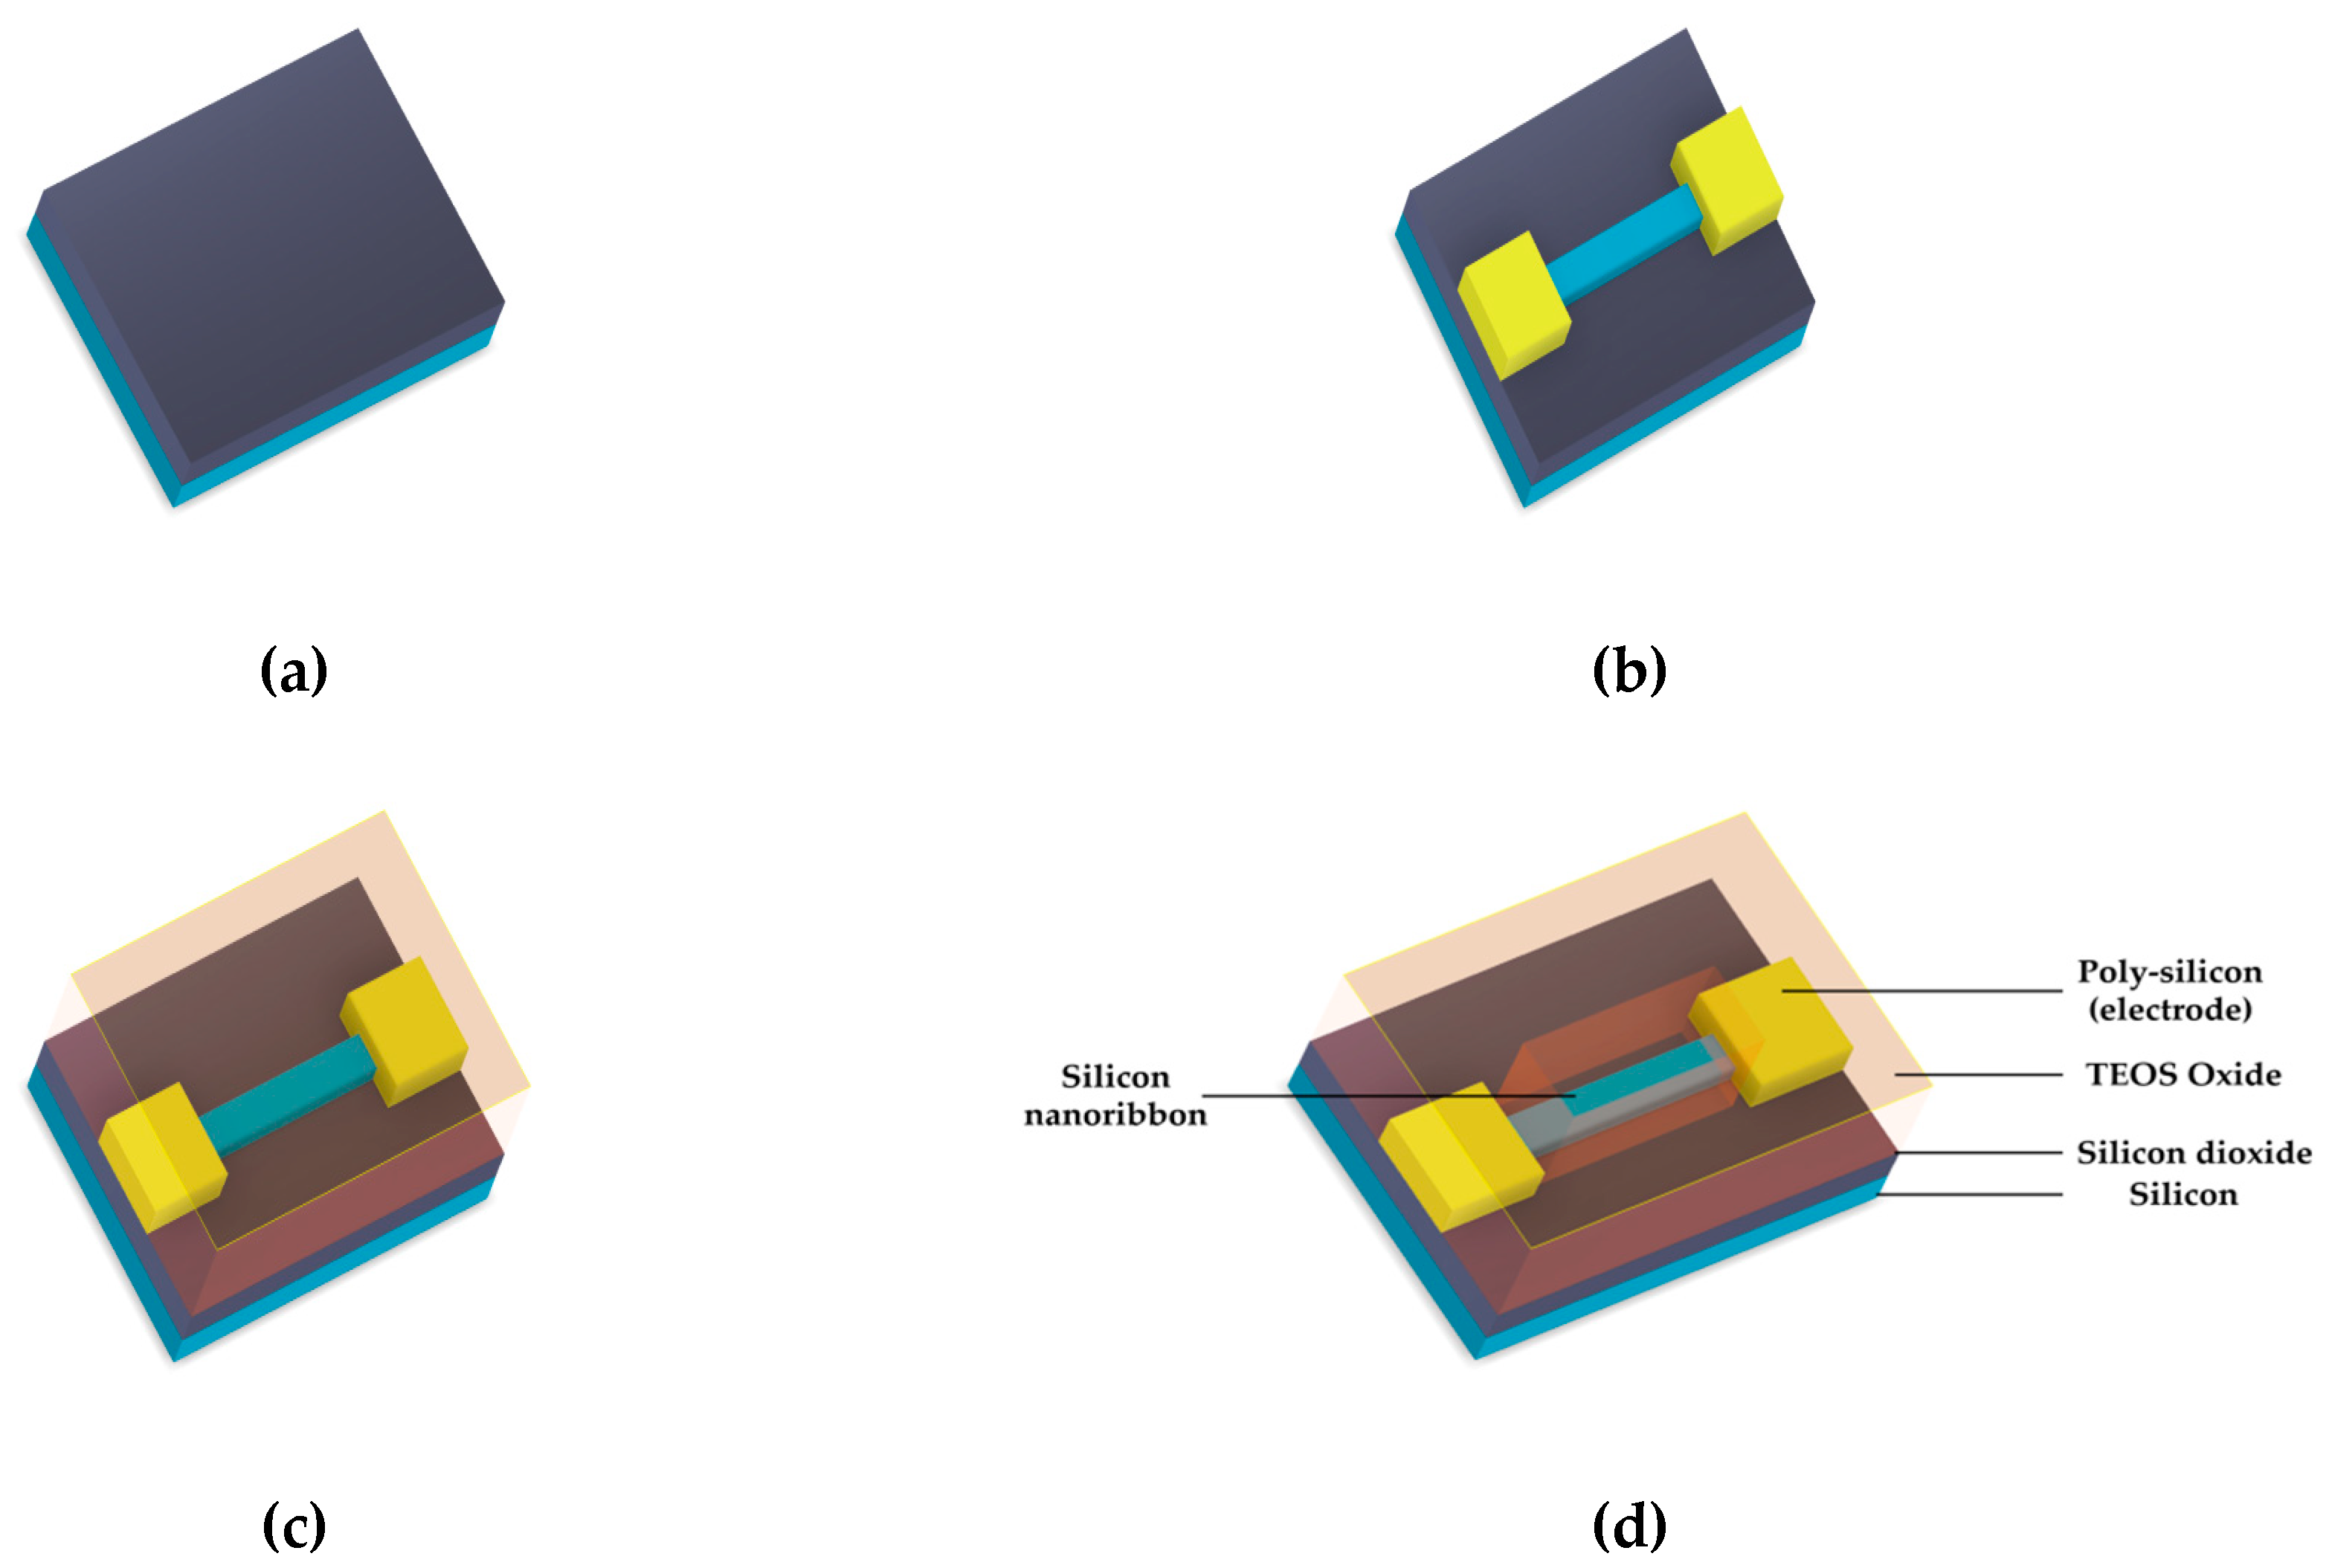
32]. The process of “silicon-on-insulator” (SOI)-based chip fabrication is schematically shown in
Figure 1. The SOI-NR chips were fabricated using electron beam lithography and gas-plasma chemical etching [
33]. The drain-source regions were formed by poly-Si layer deposition followed by doping. The resulting n
+-ohmic contacts determined the enrichment mode for n-SOI-NR structures during measurements. SOI-NR were grouped into pairs, so that each SOI-NR sensor chip comprised six pairs of nanoribbons. In order to perform measurements in electrolytic solutions, a tetraethyl orthosilicate layer was deposited onto the surface of the crystal with nanoribbons. SOI-based nanoribbon structures had n-type conductivity. The cut-off silicon layer was 32-nm-thick, while buried oxide (BOX) layer was 300-nm-thick. The nanoribbon width, thickness, and length were 3 μm, 32 nm, and 10 μm, respectively.
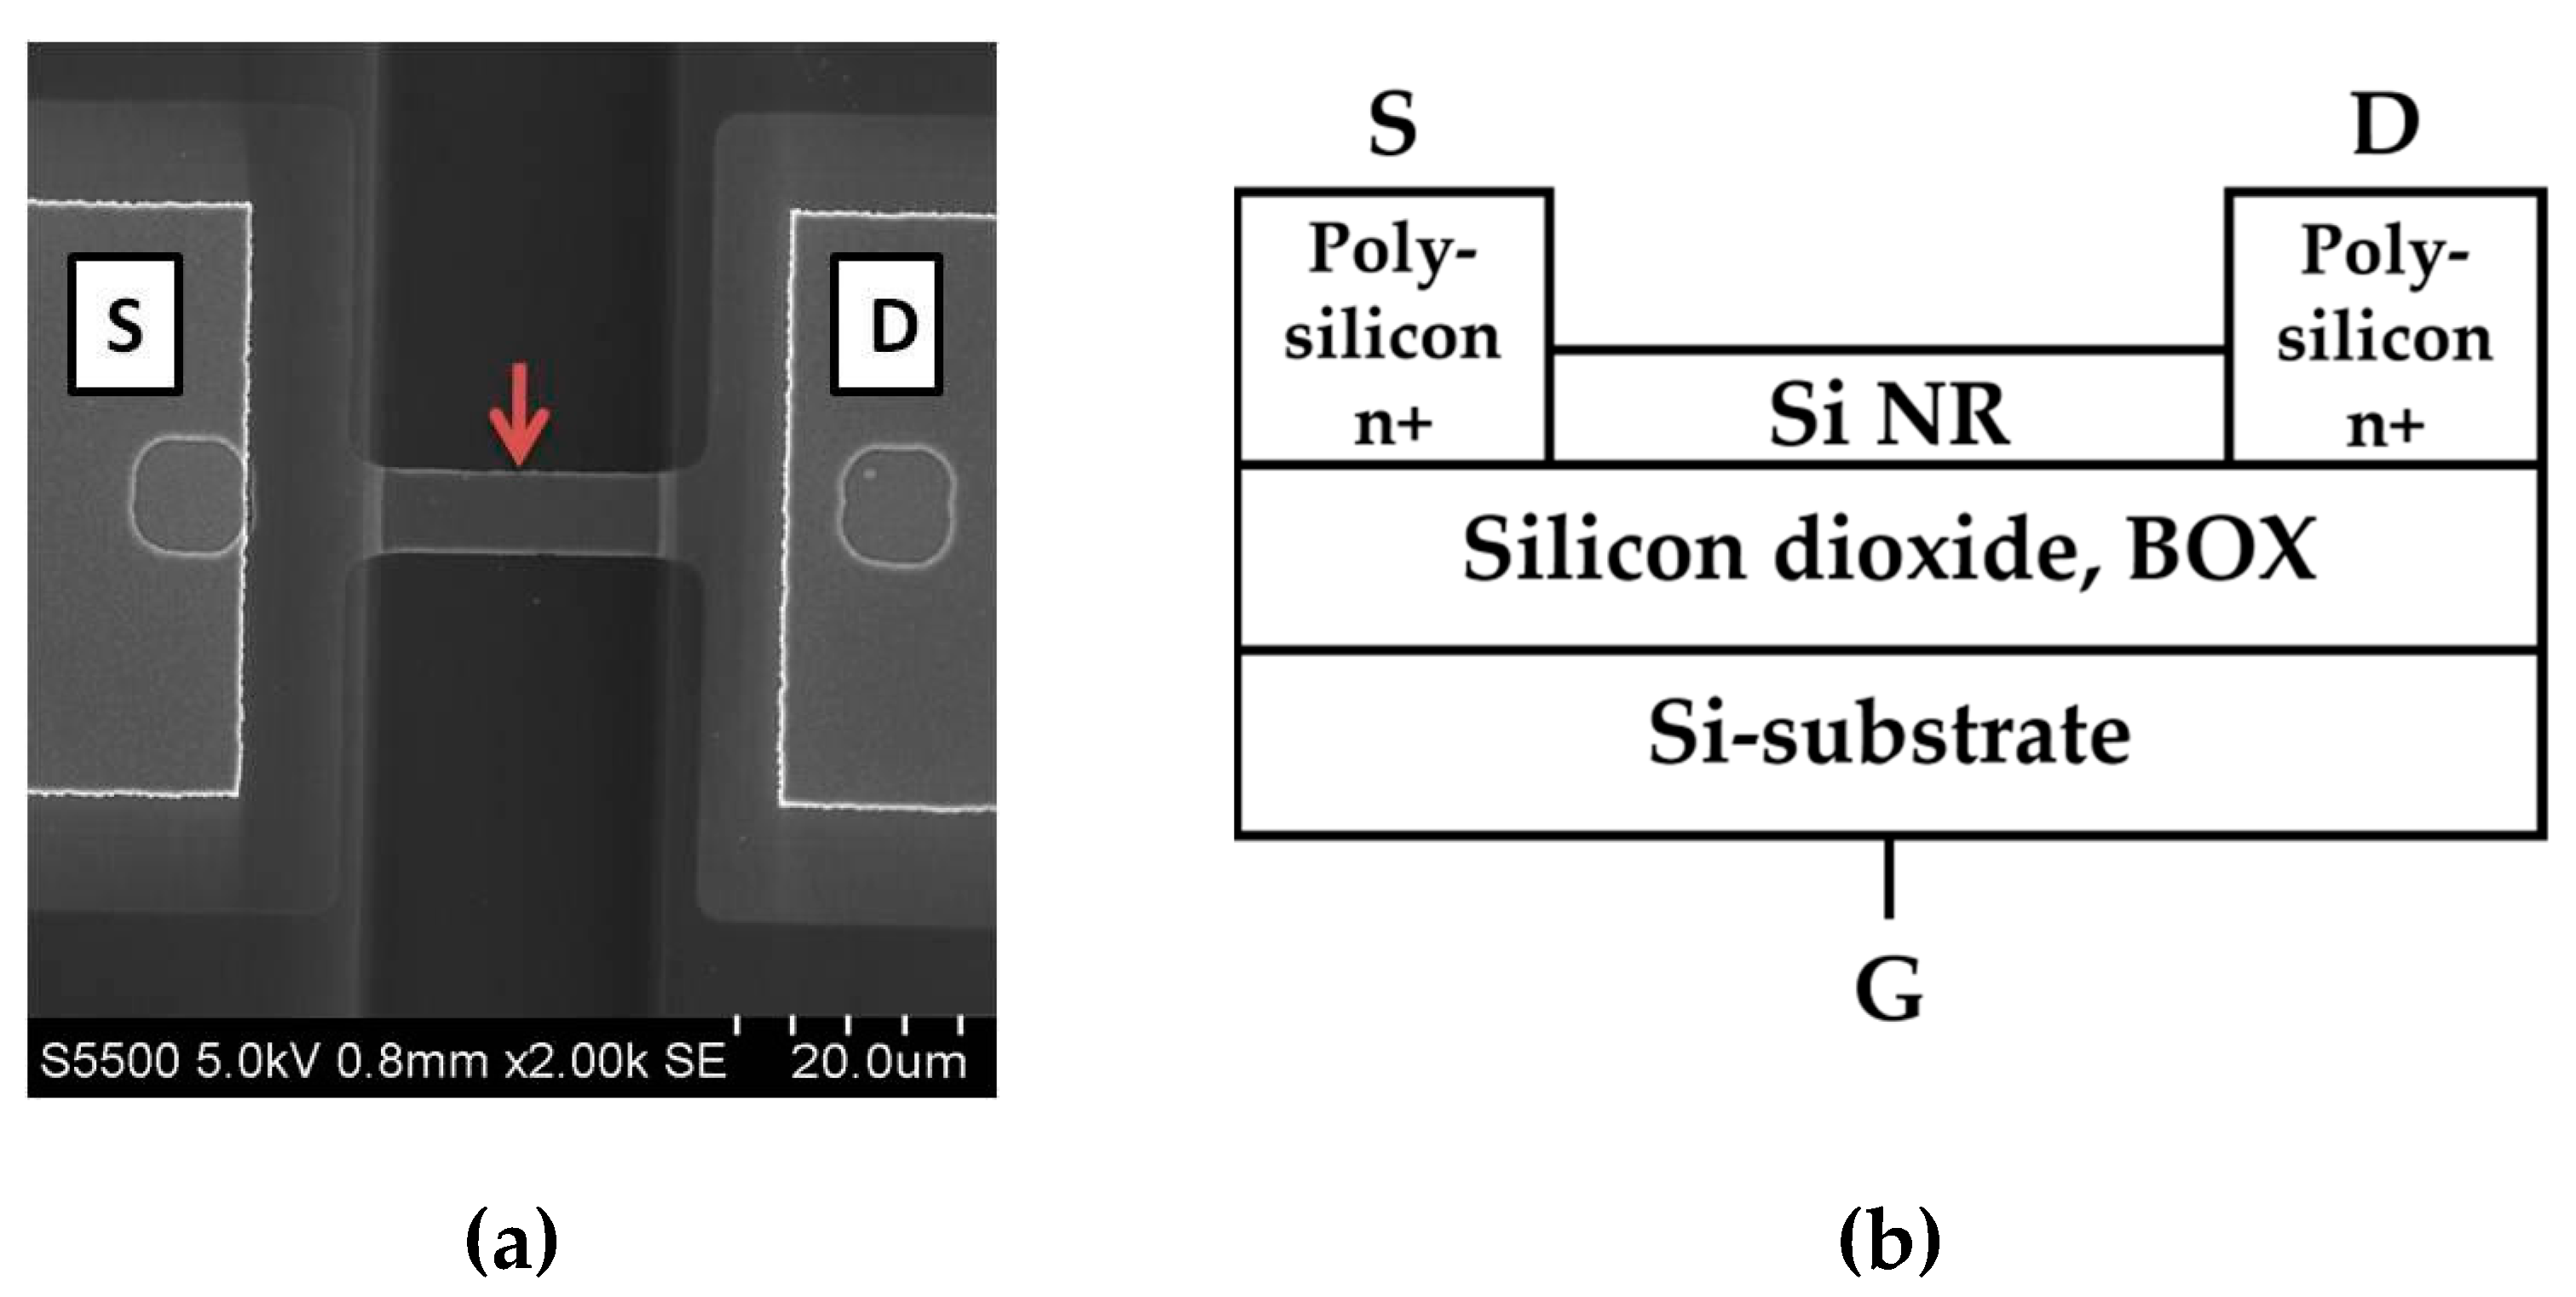
Figure 2 displays a SEM image of a nanoribbon and schematic cross-sectional image of a SOI-NR structure.
2.6. Fabrication of SOI-NR Chips
The SOI-NR chip surface was treated with isopropanol to remove mechanical impurities. The native oxide formed on the chip surface during storage was eliminated using hydrofluoric acid solution in ethanol. The chip was then treated in an ozone cleaner (UV Ozone Cleaner—ProCleaner™ Plus, Ossila Ltd, Sheffield, UK) in order to form hydroxyl groups on the nanoribbon surface, providing its further silanization with APTES vapour using a protocol similar to [
26,
34].
2.7. Sensitization of the Nanoribbons
oDNA probes (probe_1, probe_2, probe_3, and probe_4) were covalently immobilized on the silanized surface of nanoribbons using DTSSP cross-linker [
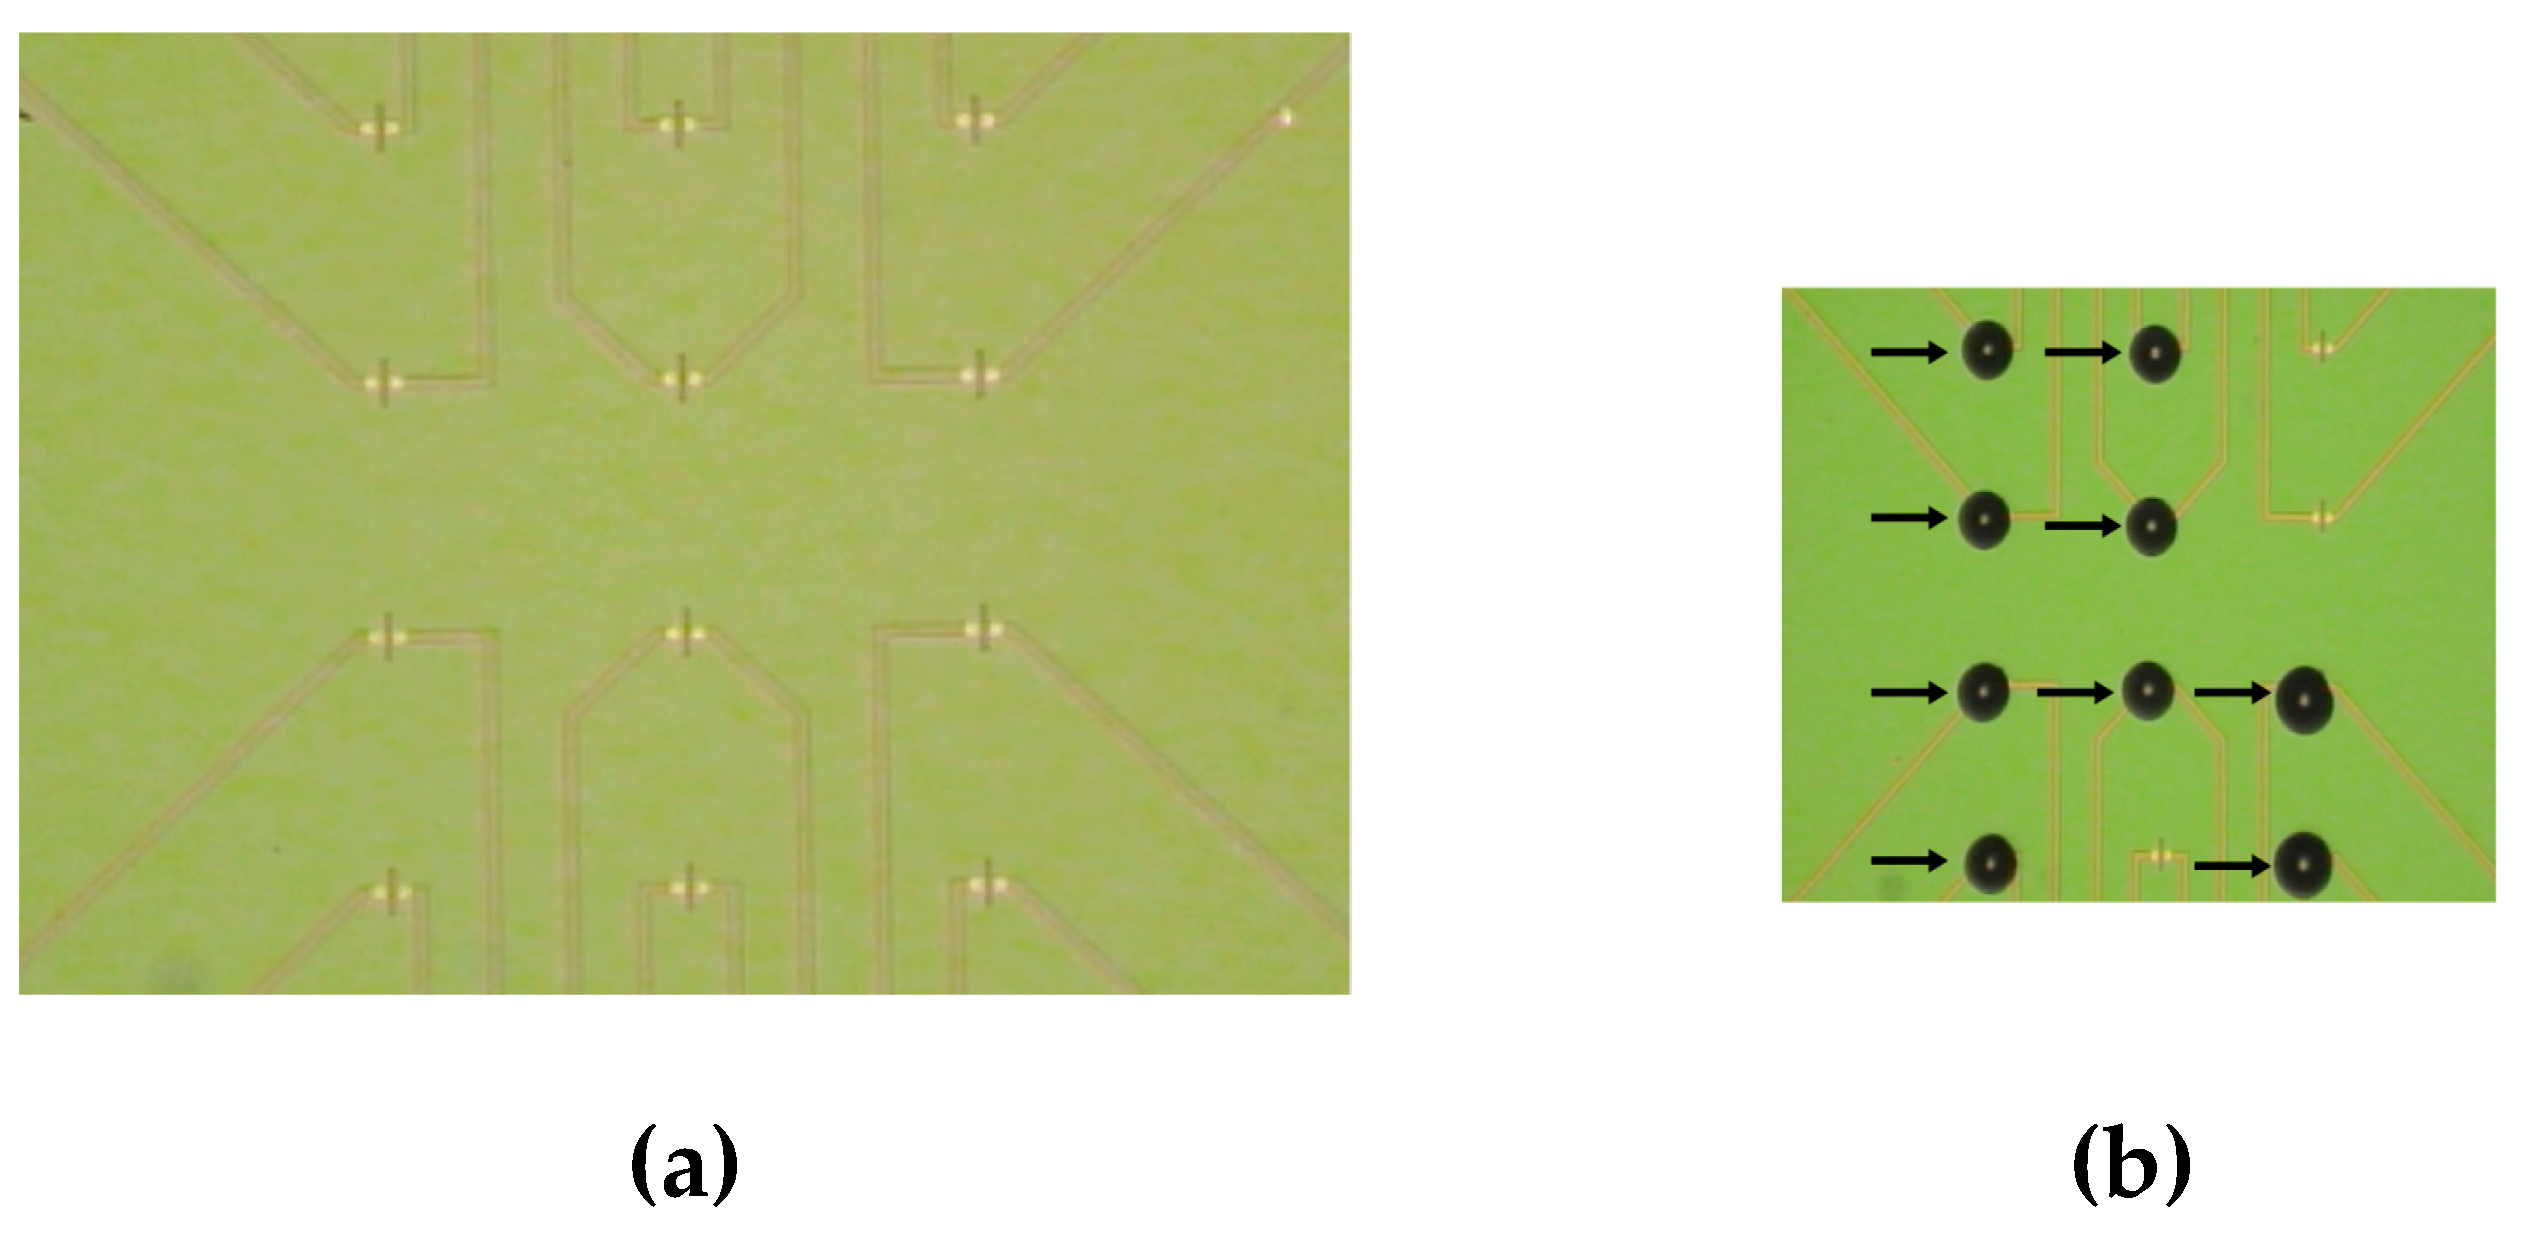
34]. For this purpose, the solutions containing one oDNA probe (1μM, 3 nl) in MCP (50 mM, pH 7.4) were precisely dispensed onto the DTSSP-activated surface of individual nanoribbons with a non-contact robotic iONE-600 liquid handling system equipped with a piezoelectric dispenser (M2-Automation GmbH, Berlin, Germany). The volume of the probe oDNA solution dispensed onto each individual nanoribbon was typically ~1 nL.
Figure 3 displays optical images of the SOI-NR chip surface before (
Figure 3a) and after (
Figure 3b) dispensing the probe oDNA solutions onto the nanoribbons.
The oDNA solutions were incubated on the nanoribbon surface for 30 min. Then the SOI-NR chip surface was washed with deionized water. In biosensor experiments, nanoribbons sensitized with oDNA probes were used as working sensors, while those without immobilized oDNA probes on the surface were used as control ones.
2.8. SOI-NR Biosensor
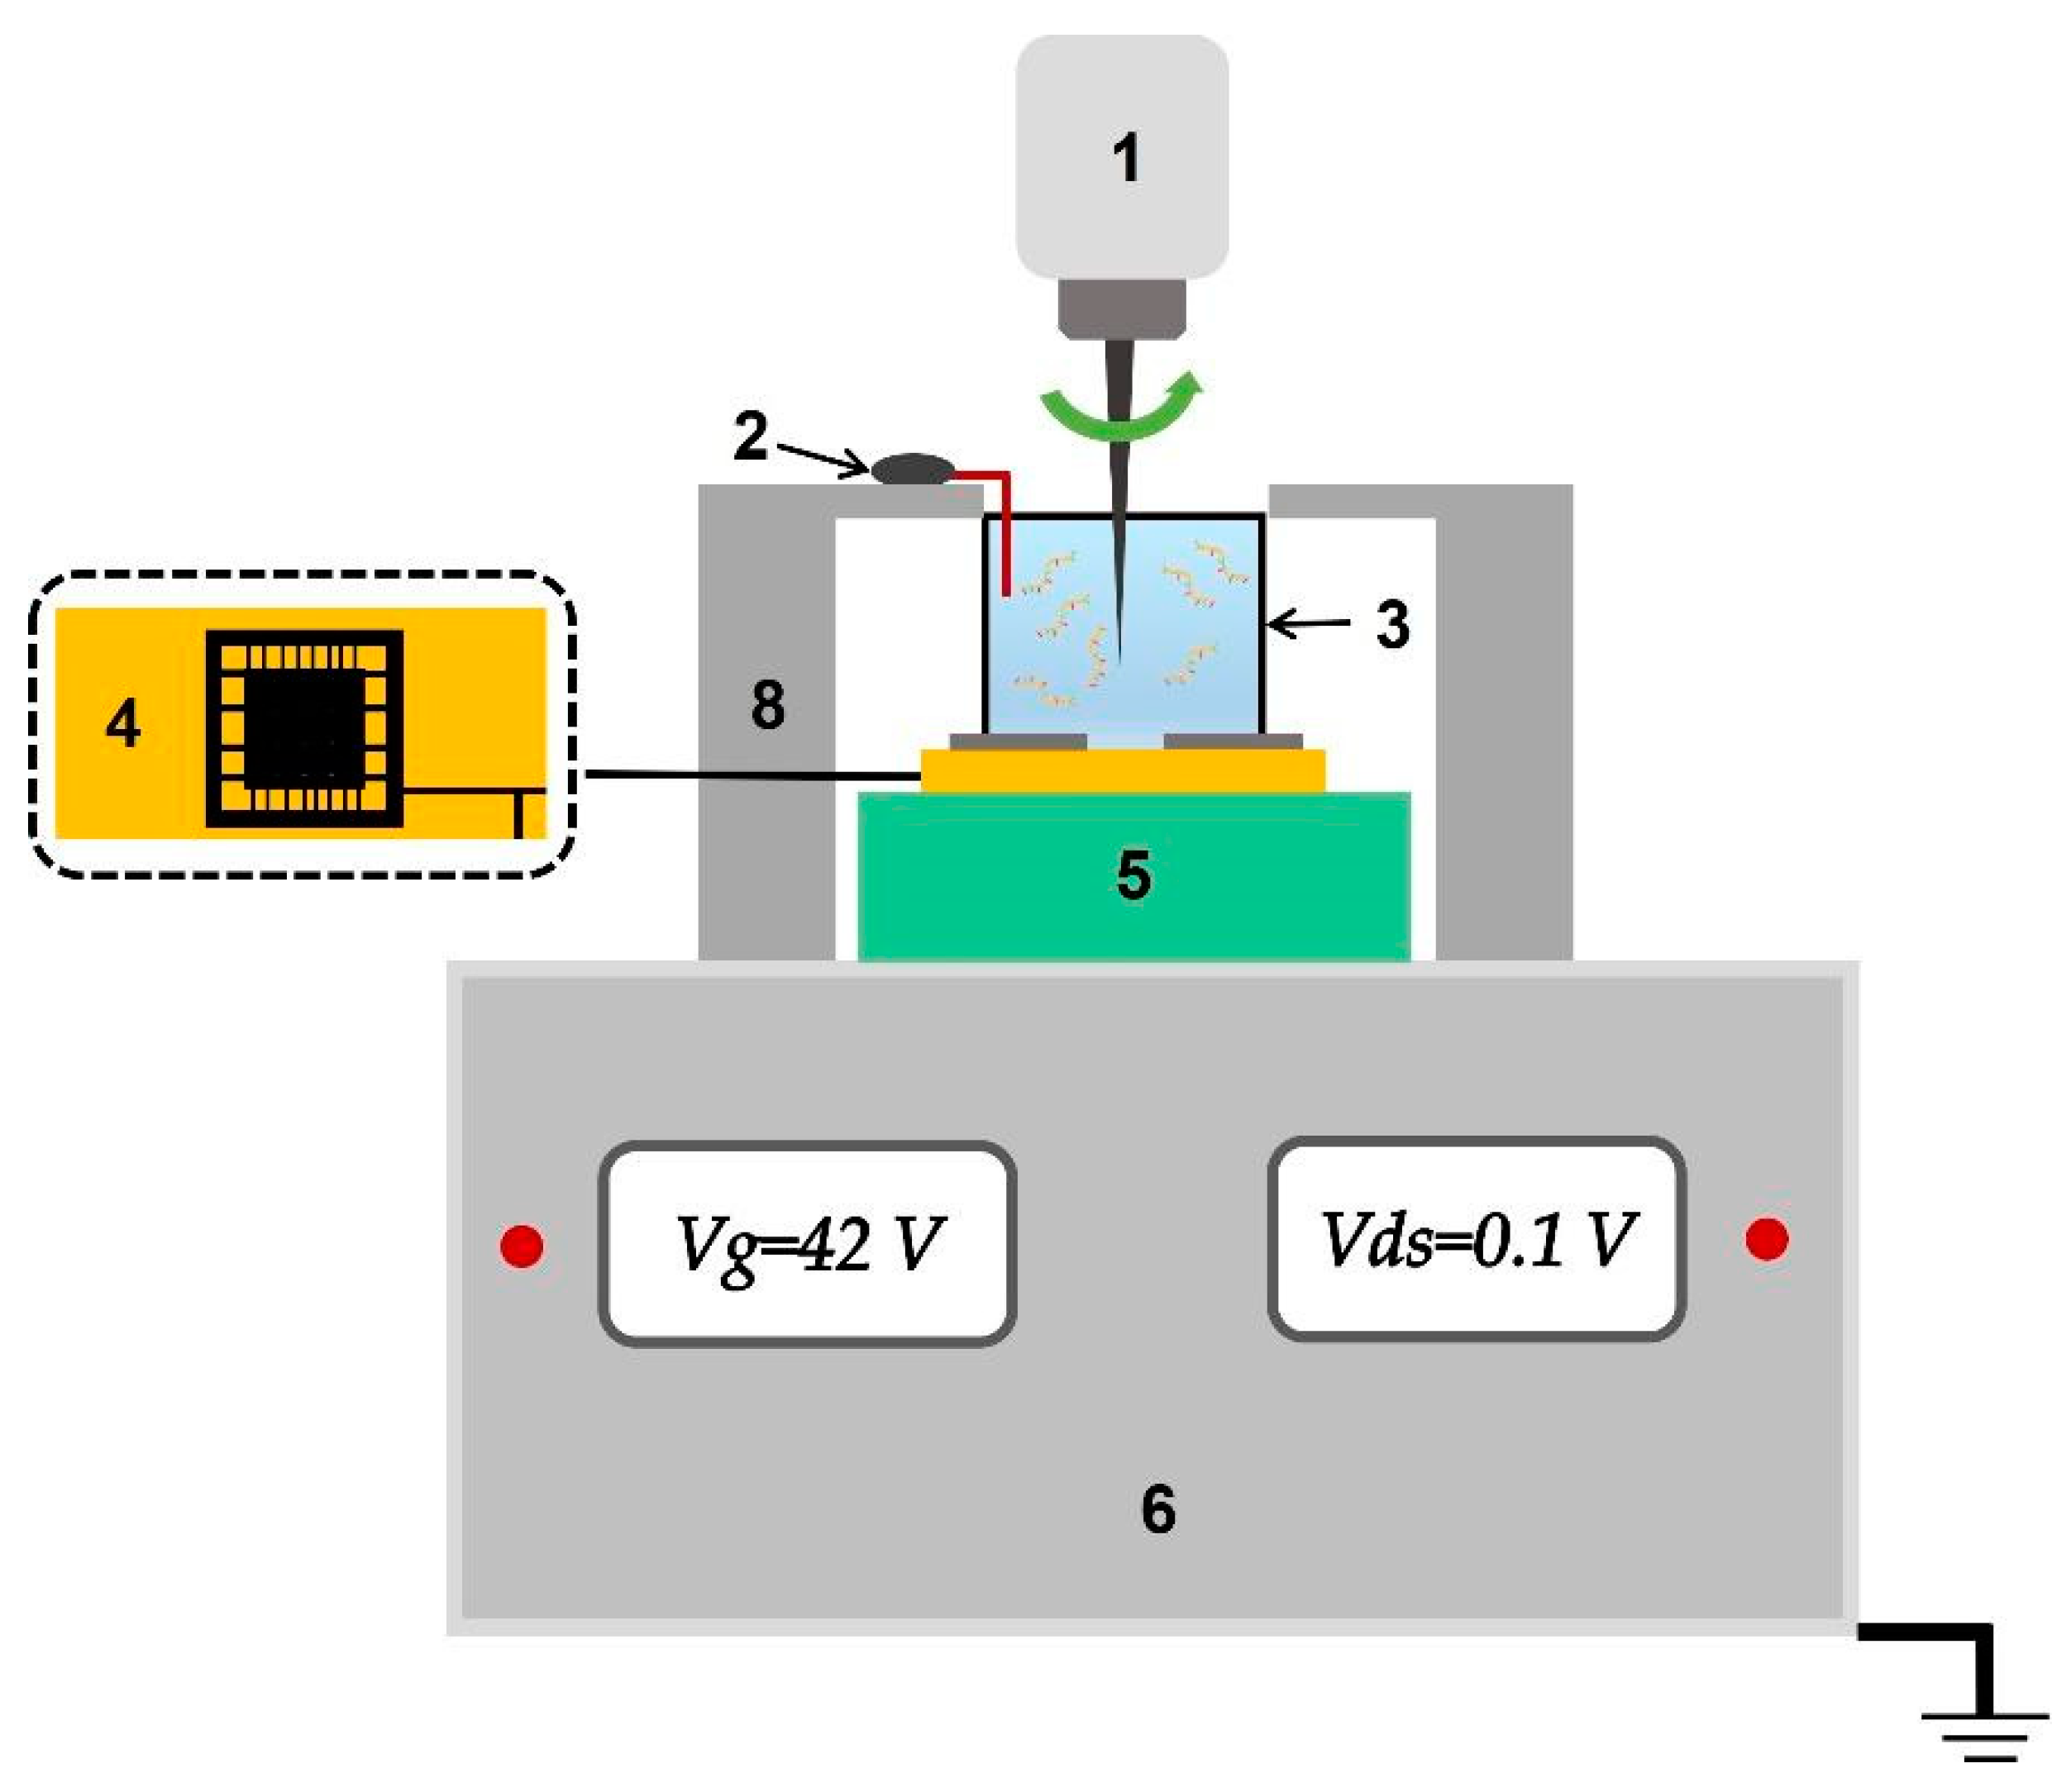
The SOI-NR biosensor system consists of analytical and electronic measurement modules (
Figure 4). The main element of the analytical module is a chip bearing six pairs of SOI-NR structures (nanoribbons) on its surface.
The chip is placed in the analytical module in a way that its surface is the bottom of the measuring cell. The diameter of the sensitive area containing nanoribbon sensors is ~2 mm. The microfluidic cell volume is 500 μl. The solution was stirred in the cell at 3,000 rpm. The electronic measurement module is designed for simultaneous registration of the signal from 10 nanoribbons on the chip and its real-time visualization on the screen of the personal computer during the experiment.
To increase the time stability of SOI-NR biosensor operation, an additional Pt electrode was immersed in the solution in the measuring cell similar to [
30].
2.9. Electrical Measurements
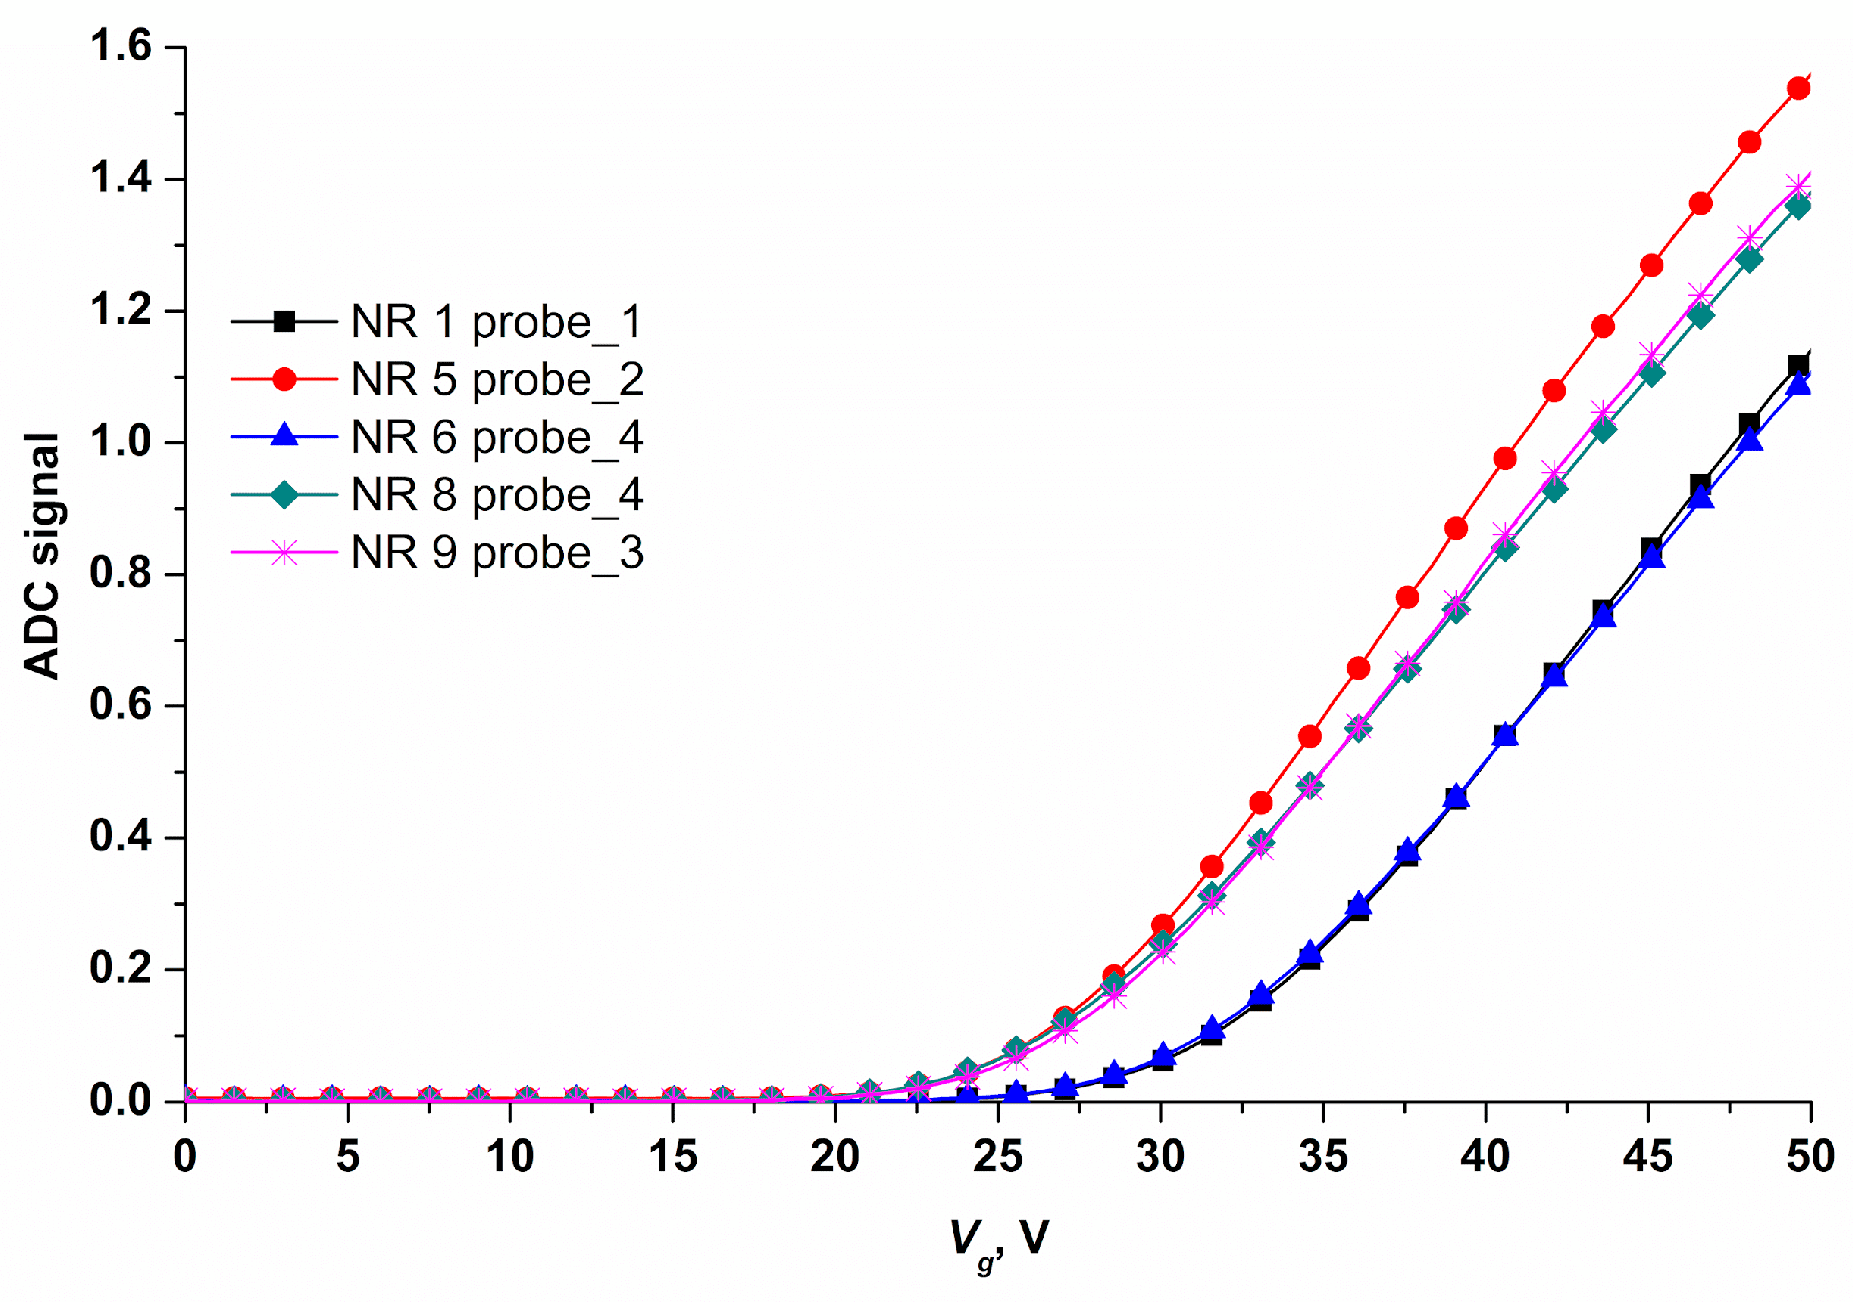
Electrical measurements, data collection and analysis were performed using a ten-channel "Agama +" setup (Moscow, Russia). During measurements, the nanoribbon surface was used as the transistor gate. The operating voltage for real-time experiments was determined based on the data of drain-gate characteristics (
Figure 5).
The operating point of the sensor in the region of drain-gate characteristic (Ids(Vg)) can be varied by applying voltage to the SOI-NR structure substrate. An exponential relation of the nanoribbon current to the surface potential is found for this point. Thus, the optimal operating voltage (Vg)= 42 V was found.
2.10. Biosensor Measurements
Measurements were performed in a buffer with low salt concentration (1mM MCP) to exclude the Debye screening effect [
35,
36].
We used the chip modified and sensitized with oDNA probes as described in section 2.6. In the first experimental series, we detected oDNA probes (CS_1, CS_2, CS_3, and CS_4) in buffer solution to determine the lowest concentration of the oDNAs. For measuring, 150 μl of buffered oDNA solution was added to the measuring cell containing 300 μl of 1mM MCP. The oDNA concentration in the analyzed solution varied in the range of 10-18–10-15 M. Solutions with different concentrations of four oDNAs, starting from the lowest one (10-18 M), were analyzed. After each analysis, the measuring cell was washed first with the buffer and then water (50 ml, 90°C).
In the second experimental series on detection of miRNAs isolated from plasma samples, the following protocol was used: 7 μl of the solution of miRNAs isolated from plasma of PC patients was added to the SOI-NR biosensor cell containing 100 μl of 1 mM MCP (pH 7.4). The measurement protocol was identical to the one used to detect target oDNAs. Control experiments were performed under similar conditions with the exception that the buffer solution containing miRNAs from the plasma of patients with left kidney cyst was added to the cell, while buffer from the protocol for miRNA isolation was used without biomolecules in order to detect the non-specific signal.
2.11. Data Analysis
The time function of the current was registered in real-time mode. In order to take into account non-specific interactions, values obtained in the blank experiment (i.e. using oDNA-free buffer solution) were used. These values were subtracted from absolute values obtained when analyzing the target oDNA solution. The registered changes in the current Ids from each nanoribbon were normalized to 1 by division by the initial current value: the ratio of Ids0 for a certain time period to the current value (Ids0) for the initial time period was calculated and expressed in relative units. After this, the difference between the normalized signal from working and control nanoribbons was measured (section 2.6). The resulting time dependencies for Ids (t) were presented as sensorgrams showing the differential signal calculated by subtracting the signal of the control nanoribbon from that of the working nanoribbon.
3. Results
The experiment included two measurement stages: 1) determination of method sensitivity (detection of model oDNAs, which are synthetic miRNA analogues, in buffer solution; 2) detection of miRNAs isolated from plasma samples of patients with confirmed PC diagnosis.
3.1. Determination of Method Sensitivity – Biospecific Detection of Target oDNAs in Buffer Solution
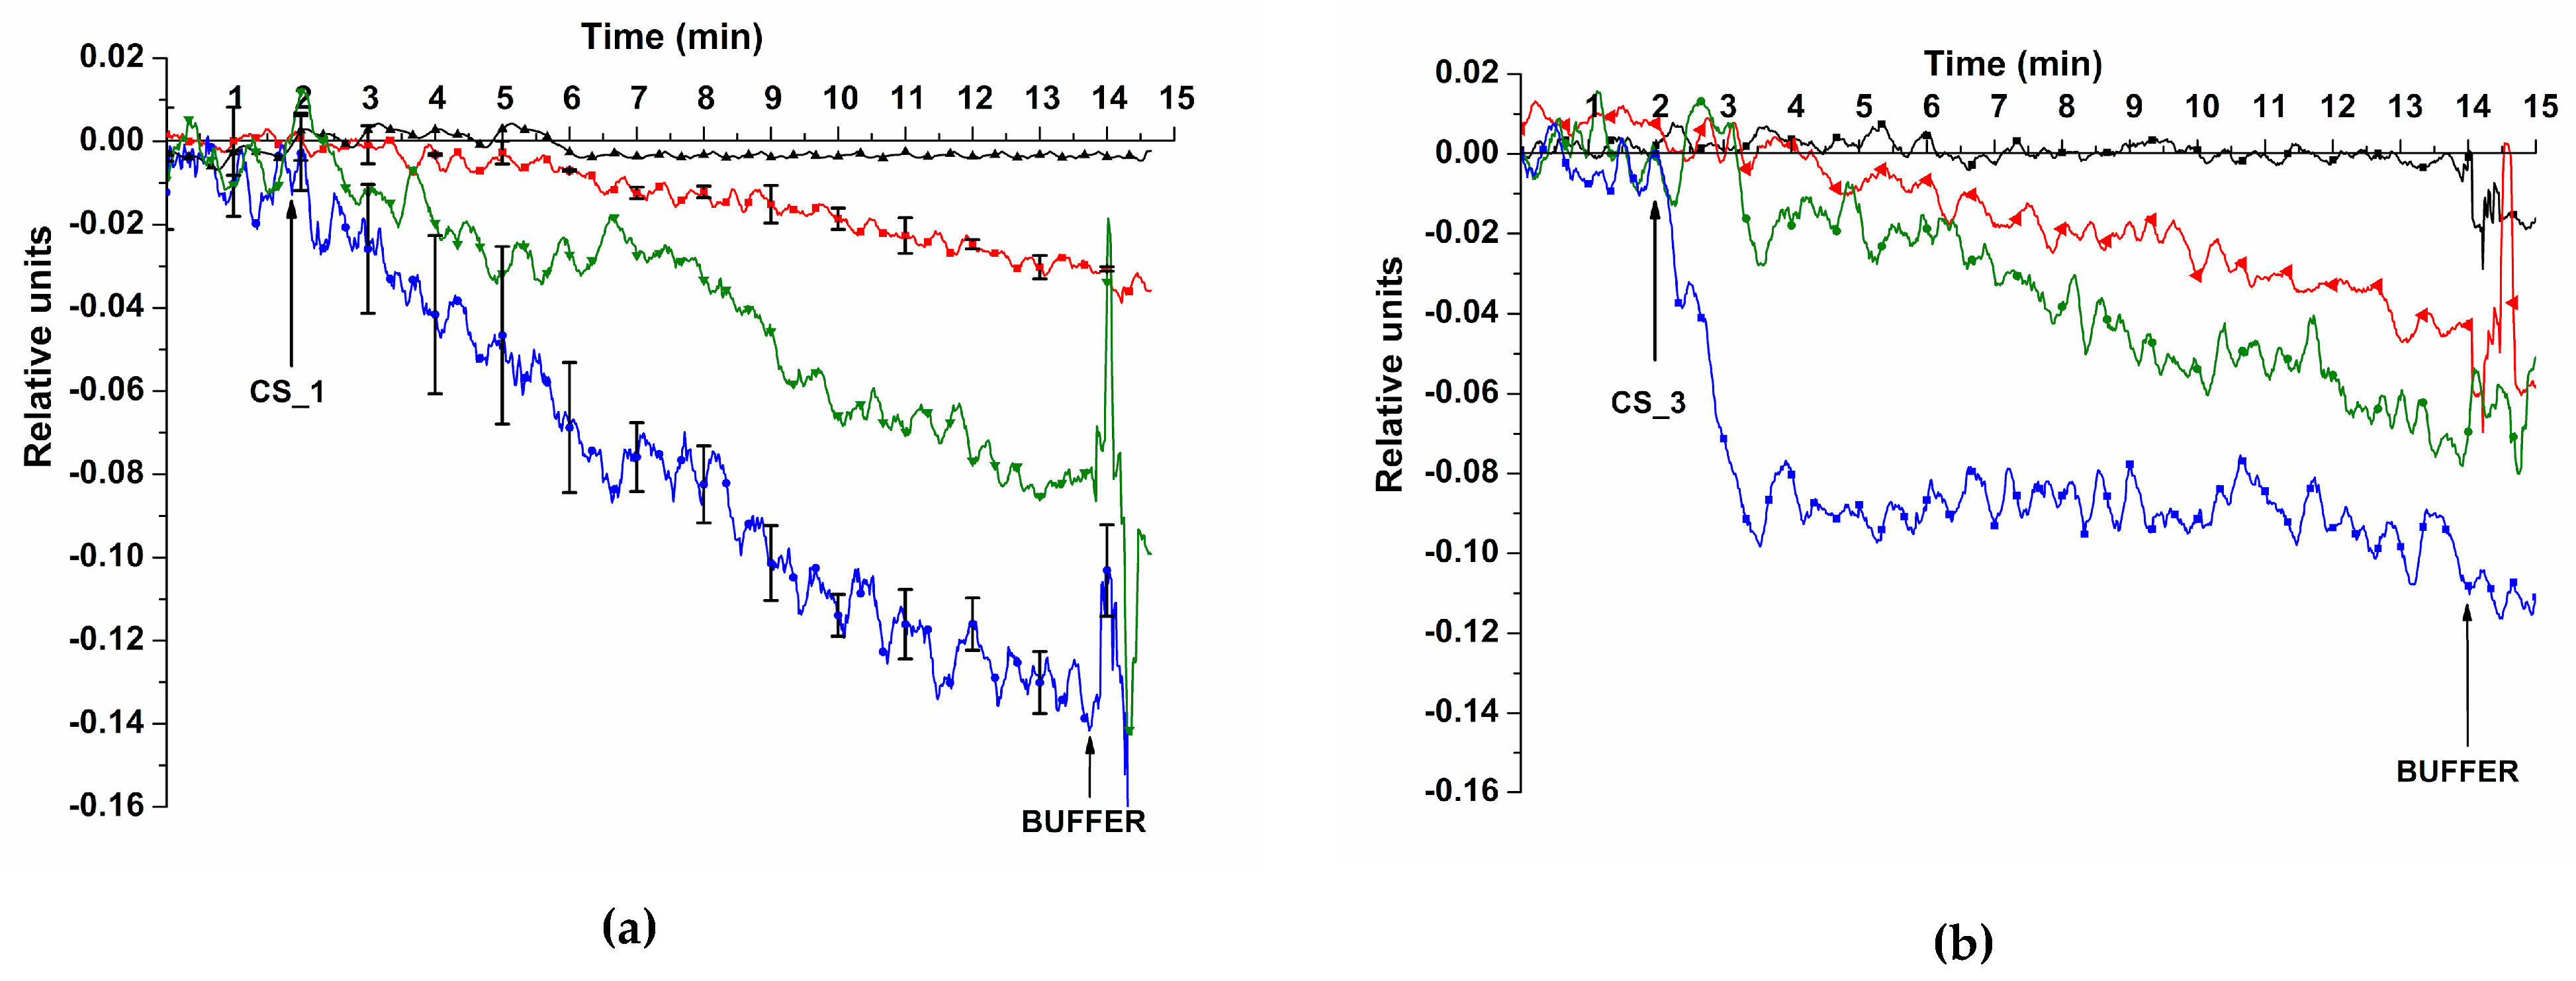
Figure 6 displays sensorgrams obtained before and after addition of target oDNA solutions CS_1 and CS_3 in the SOI-NR biosensor cell at the concentration of target molecules of 1.1
× 10
-18–10
-15 M.
Figure 6 shows that addition of test oDNA solutions with the concentration of target molecules in the range of 10
-17–10
-15 M leads to expected decrease in nanoribbon conductivity. This decrease is due to adsorption of negatively charged molecules on the sensor surface. No signal was registered for any target oDNA when analyzing a 10
-18 M solution.
The detected signal range for sensorgrams obtained when registering the signal from the nanoribbon with immobilized probe_1 is presented in
Figure 6 (a). sensorgrams were constructed based on data obtained in experiments on detecting CS_1 oDNA with the following concentrations: 10
-17 and 10
-15 M. The results were validated using standard deviation. Substitution of oDNA solution with buffer solution resulted in the same signal level. This was probably due to slow dissociation of probe/CS complexes.
The lowest concentration of the target oDNA we managed to detect in buffer solution using the SOI-NR biosensor was 1.1 × 10⁻¹⁷ M for all oDNAs analyzed (CS_1, CS_2, CS_3, and CS_4).
3.2. Biospecific Detection of miRNAs Isolated from Blood Plasma
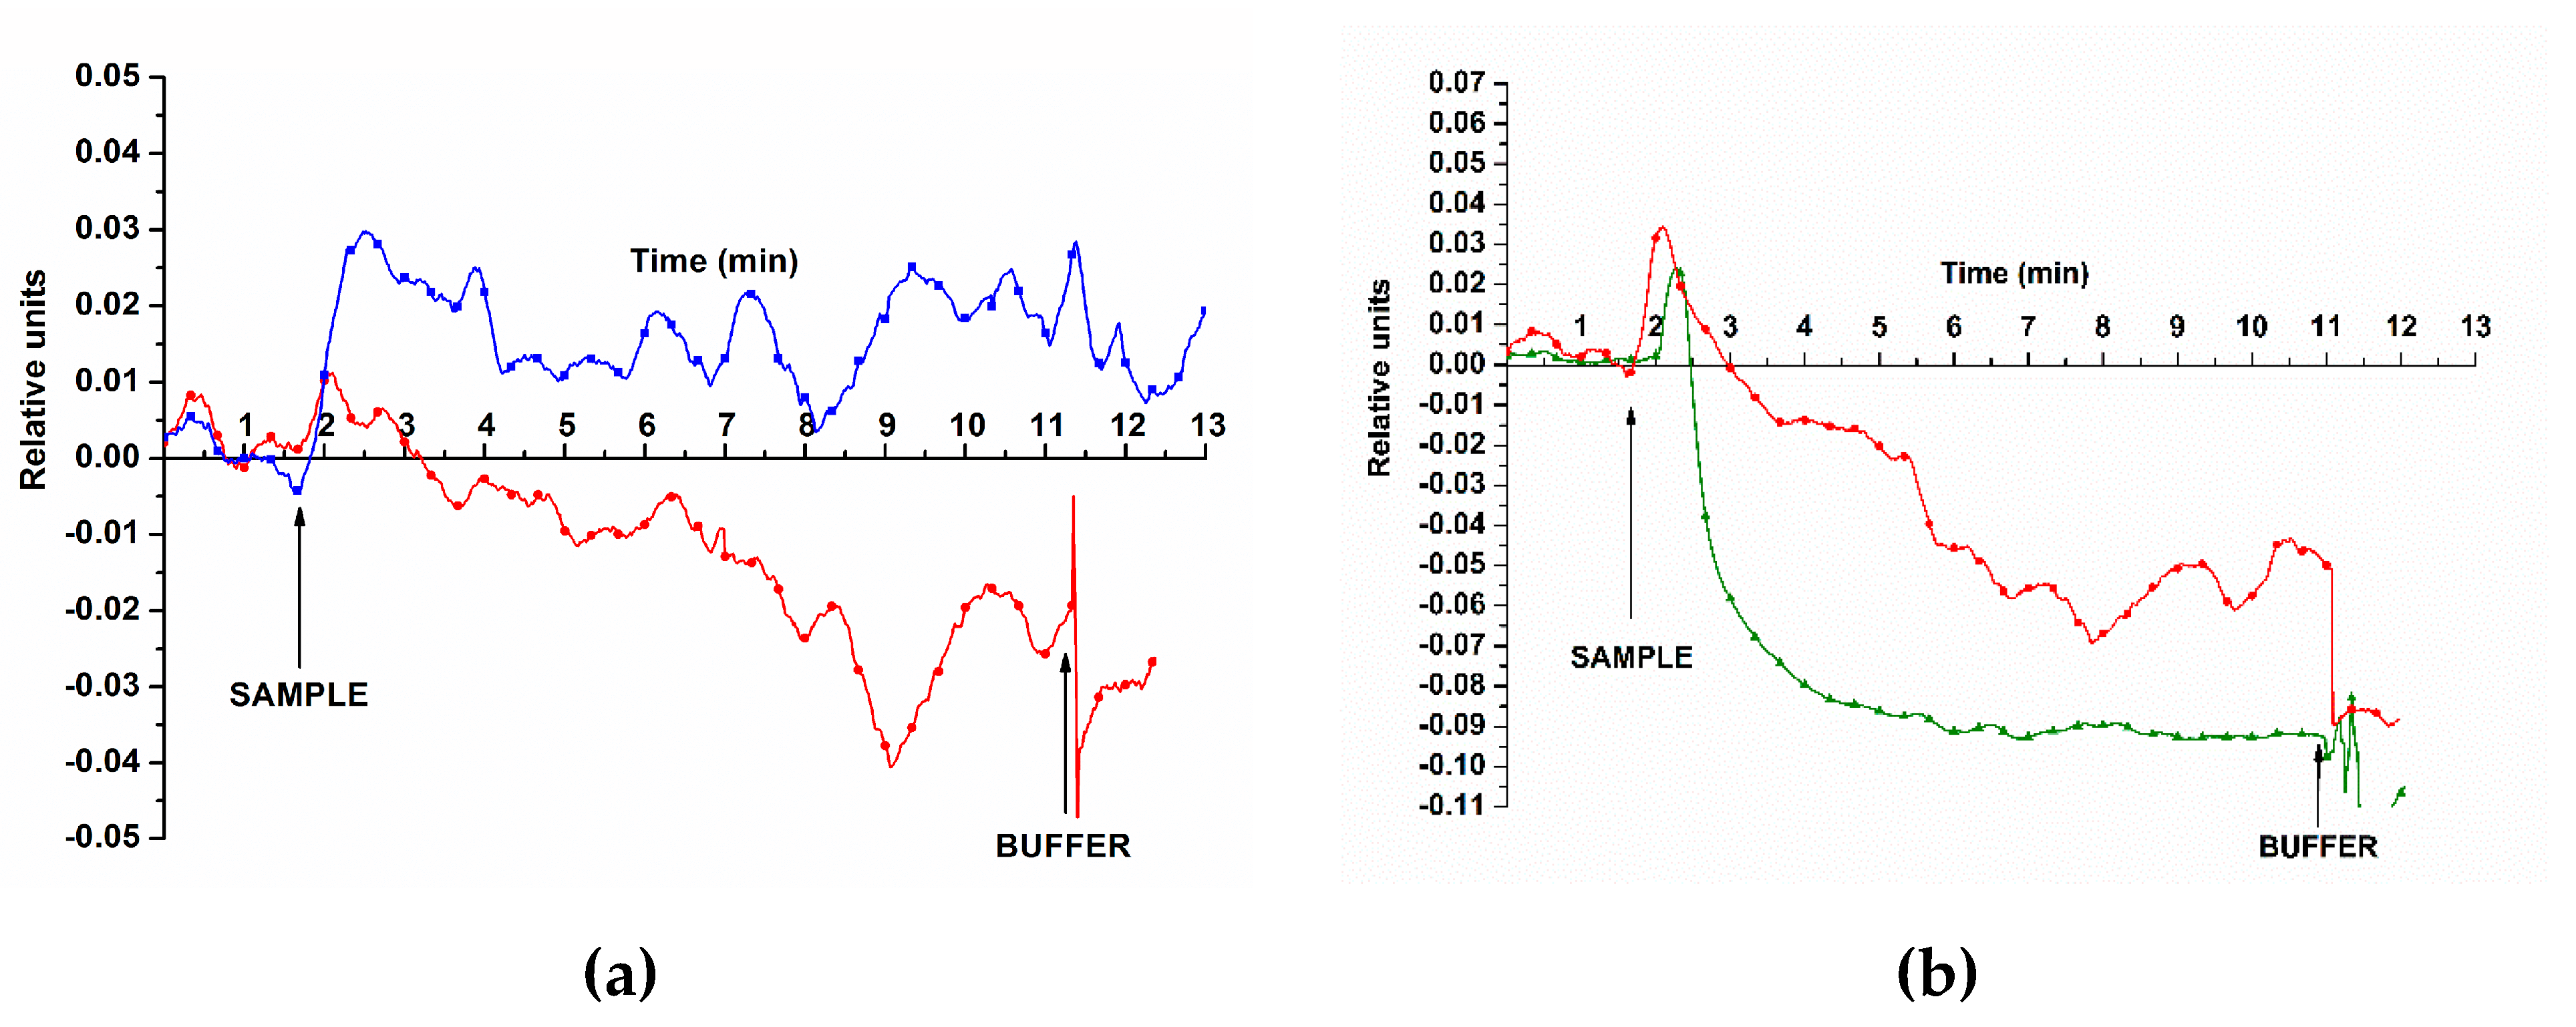
In the second experimental series, we evaluated the possibility of detecting miRNAs isolated from plasma samples. Examples of the signal obtained when detecting target miRNAs from plasma are presented in
Figure 7.
The curves shown in
Figure 7a indicate that addition of miRNAs isolated from the plasma of the PC patient results in decreased conductivity of nanoribbon sensors. The same trend can be observed for blood plasma samples No. 5 and 44.
The signal in control experiments changed insignificantly upon addition of miRNA samples isolated from plasma of patients with benign neoplasms (control sample No. 27; see
Figure 7a, blue curve).
4. Discussion
The SOI-NR biosensor is the promising tool for highly sensitive detection of biomolecules, since it makes it possible to detect the signal of a single biomolecule adsorbed on the sensor element surface [
37]. Usually, a series of protein molecules such as PSA are used for ELISA screening for PC diagnosis. However, as known to date, the PSA level does not always indicate the presence of PC. No uniform international standards of the PSA level have been established yet. Many men can have PC despite the low blood level of PSA. According to the 2019 report of the European Association of Urologists, the risk of PC is 57.6 and 8.4% at the PSA levels of 0–3 ng/ml and the Gleason score ≥7, respectively. The European Association reports that the risk groups to be screened among men of 40 and 60 years of age have the following parameters: PSA >1 and >2 ng/ml, respectively [
38,
39].
The limitation of the method of PSA screening is low specificity for differential tumour diagnosis. On the one hand, this may be due to the fact that protein markers of PC are not produced by tumour cells but rather associated with the inflammatory process. Hence, one of the limitations of its use for PC diagnosis is the lack of specific protein markers.
Another disadvantage is insufficient specificity of the ELISA method, which is the basis of modern diagnostic systems for non-invasive diagnosis of PC. ELISA detects biomarkers with the sensitivity of 10
-12 M. However, early-stage PC diagnosis requires the detection sensitivity of 10
-17 M [
40]. The SOI-NR biosensor has the high sensitivity required for detection of both proteins and nucleic acids, as shown in [
41].
The possibility to detect nucleic acids using the SOI-NR biosensor makes it possible to use this method as the basis of the diagnostic system for detection of non-protein biomarkers. Currently, the number of works on the search of miRNAs suitable for the use in medical diagnosis is increasingly growing. Tumours have a unique miRNA expression profile already at early stages of carcinogenesis [
42]. A series of studies demonstrate significant differences in miRNA levels between tumours and adjacent healthy tissues. Furthermore, a change in miRNA expression was noted in primary disease compared to the metastatic regions, which indicates the role of miRNAs in tumour progression [
43]. MiRNAs can be easily isolated using non-invasive methods due to their stable circulation in the blood, urine, and saliva. Further studies are required to identify specific miRNAs that can be used as biomarkers for early disease detection and prognosis [
18].
In our study, we demonstrated the possibility of highly sensitive, specific miRNA detection using target oDNAs, which are synthetic analogues of target miRNAs, as model objects. The detection was performed using the SOI-NR biosensor consisting of a chip with nanoribbons sensitized by oDNA probes with complementary sequences. The possibility to detect oDNA molecules in buffer solution at ultralow concentration (10-17 M) was shown. We also showed the possibility to detect miRNAs isolated from blood plasma of PC patients, which offers the opportunity to use the proposed approach for determining increased levels of target biomolecules in PC patients.
5. Conclusions
We proposed the approach for highly sensitive detection of miRNAs isolated from blood plasma samples. The approach is a label-free method for detection of nucleic acids based on the SOI-NR biosensor using chips containing nanoribbon structures. In the analysis, uses synthetic oDNAs, which are cheap, are employed as biological probes. The CMOS-compatible technology based on gas-phase reduction and lithography methods adjusted to mass production of chips containing dozens of nanoribbon structures is used for chip fabrication. The study results will be useful in developing new bioanalytical systems, which can further serve as the basis of diagnostic kits to detect diseases at early stages.
Author Contributions
Conceptualization, Yuri Ivanov, Tatyana Pleshakova and Alexander Archakov; Data curation, Kristina Goldaeva, Svetlana Kapustina, Andrey Kozlov and Vladimir Konev; Formal analysis, Vadim Ziborov, Alexander Dolgoborodov, Sergey Novikov and Evgeniy Yushkov; Funding acquisition, Alexander Archakov; Investigation, Kristina Malsagova, Kristina Goldaeva, Svetlana Kapustina, Vladimir Popov, Andrey Kozlov and Rafael Galiullin; Methodology, Yuri Ivanov and Vladimir Popov; Project administration, Tatyana Pleshakova; Resources, Vladimir Popov, Dmitry Enikeev, Natalia Potoldykova, Oleg Petrov, Alexander Dolgoborodov, Alexander Glukhov, Victoria Grabezhova, Vladimir Konev and Oleg Kovalev; Software, Rafael Galiullin and Vadim Ziborov; Supervision, Tatyana Pleshakova and Alexander Archakov; Validation, Dmitry Enikeev, Natalia Potoldykova, Vladimir Konev and Oleg Kovalev; Visualization, Kristina Goldaeva, Svetlana Kapustina and Ivan Shumov; Writing – original draft, Kristina Goldaeva and Svetlana Kapustina; Writing – review & editing, Yuri Ivanov.
Funding
The work was performed within the framework of the Program for Basic Research in the Russian Federation for a long-term period (2021-2030) (No. 122030100168-2).
Institutional Review Board Statement
The study was conducted according to the guidelines of the Declaration of Helsinki, and approved by independent ethical committee organized on the basis of Institute of Urology and Reproductive Health (Sechenov University) (Protocol No. 10–19 of 17 July 2019). All experiments with human plasma were carried out in compliance with Order no. 1177n (Ministry of Health of Russian Federation, 20 December 2012).
Informed Consent Statement
Informed consent was obtained from all subjects involved in the study.
Data Availability Statement
Correspondence and requests for materials should be addressed to Y.D.I.
Acknowledgments
The biosensor measurements were performed employing a nanoribbon detector, which pertains to “Avogadro” large-scale research facilities.
Conflicts of Interest
The authors declare no conflict of interest.
References
- Ferlay, J.; Colombet, M.; Soerjomataram, I.; Mathers, C.; Parkin, D. M.; Piñeros, M.; Znaor, A.; Bray, F. Estimating the Global Cancer Incidence and Mortality in 2018: GLOBOCAN Sources and Methods. Int J Cancer 2019, 144, 1941–1953. [Google Scholar] [CrossRef]
- Ebrahimi, S.; Hashemy, S. I.; Sahebkar, A.; Aghaee Bakhtiari, S. H. MicroRNA Regulation of Androgen Receptor in Castration-Resistant Prostate Cancer: Premises, Promises, and Potentials. CMP 2021, 14, 559–569. [Google Scholar] [CrossRef] [PubMed]
- Malik, S. S.; Batool, R.; Masood, N.; Yasmin, A. Risk Factors for Prostate Cancer: A Multifactorial Case-Control Study. Current Problems in Cancer 2018, 42, 337–343. [Google Scholar] [CrossRef] [PubMed]
- Van der Kwast, T. H.; Roobol, M. J. Defining the Threshold for Significant versus Insignificant Prostate Cancer. Nat Rev Urol 2013, 10, 473–482. [Google Scholar] [CrossRef] [PubMed]
- Xia, Q.; Ding, T.; Zhang, G.; Li, Z.; Zeng, L.; Zhu, Y.; Guo, J.; Hou, J.; Zhu, T.; Zheng, J.; Wang, J. Circular RNA Expression Profiling Identifies Prostate Cancer- Specific CircRNAs in Prostate Cancer. Cell Physiol Biochem 2018, 50, 1903–1915. [Google Scholar] [CrossRef] [PubMed]
- Pereverzev, A. S.; Kogan, M. Y. Prostate Cancer; Kharkov, 2004.
- European Association of Urology. Guidelines. 2022 Edition.
- Faiena, I.; Salmasi, A.; Mendhiratta, N.; Markovic, D.; Ahuja, P.; Hsu, W.; Elashoff, D. A.; Raman, S. S.; Reiter, R. E. PI-RADS Version 2 Category on 3 Tesla Multiparametric Prostate Magnetic Resonance Imaging Predicts Oncologic Outcomes in Gleason 3 + 4 Prostate Cancer on Biopsy. Journal of Urology 2019, 201, 91–97. [Google Scholar] [CrossRef]
- Guichard, G.; Larré, S.; Gallina, A.; Lazar, A.; Faucon, H.; Chemama, S.; Allory, Y.; Patard, J.-J.; Vordos, D.; Hoznek, A.; Yiou, R.; Salomon, L.; Abbou, C. C.; de la Taille, A. Extended 21-Sample Needle Biopsy Protocol for Diagnosis of Prostate Cancer in 1000 Consecutive Patients. Eur Urol 2007, 52, 430–435. [Google Scholar] [CrossRef]
- Djavan, B.; Ravery, V.; Zlotta, A.; Dobronski, P.; Dobrovits, M.; Fakhari, M.; Seitz, C.; Susani, M.; Borkowski, A.; Boccon-Gibod, L.; Schulman, C. C.; Marberger, M. Prospective Evaluation of Prostate Cancer Detected on Biopsies 1, 2, 3 and 4: When Should We Stop? J Uro l 2001, 166, 1679–1683. [Google Scholar] [CrossRef]
- Axel, E. M. Epidemiology and Statistics of Prostate Cancer in Russia, European Countries and the USA; Moscow: Moscow, 2002.
- Carter, H. B.; Albertsen, P. C.; Barry, M. J.; Etzioni, R.; Freedland, S. J.; Greene, K. L.; Holmberg, L.; Kantoff, P.; Konety, B. R.; Murad, M. H.; Penson, D. F.; Zietman, A. L. Early Detection of Prostate Cancer: AUA Guideline. J Urol 2013, 190, 419–426. [Google Scholar] [CrossRef]
- Draisma, G.; Etzioni, R.; Tsodikov, A.; Mariotto, A.; Wever, E.; Gulati, R.; Feuer, E.; de Koning, H. Lead Time and Overdiagnosis in Prostate-Specific Antigen Screening: Importance of Methods and Context. J Natl Cancer Inst 2009, 101, 374–383. [Google Scholar] [CrossRef]
- Dr.Manish (August 31, 2021.) Micro-RNA (MiRNA) In Oncology- Current Perspectives - Retrieved from [DentalReach]: Https://Dentalreach.Today/Dental-Education/Micro-Rna-Mirna-in-Oncology-Current-Perspectives-2/. 31 August.
- Homo Sapiens MiRNA (1872 Sequences). Available online: Http://Www.Mirbase.Org/Cgibin/Mirna_summary.Pl?Org=hsa (accessed on 21 March 2014).
- Garzon, R.; Croce, C. M. MicroRNAs and Cancer: Introduction. Semin Oncol 2011, 38, 721–723. [Google Scholar] [CrossRef] [PubMed]
- Anjaly, K.; Tiku, A. B. MicroRNA Mediated Therapeutic Effects of Natural Agents in Prostate Cancer. Mol Biol Rep 2021, 48, 5759–5773. [Google Scholar] [CrossRef] [PubMed]
- Https://Dentalreach.Today/Dental-Education/Micro-Rna-Mirna-in-Oncology-Current-Perspectives-2/.
- Wong, T.S.; Liu, X.B.; Wong, B.Y.; Ng, R.W.; Yuen, A.P.; Wei, W.I. Mature MiR-184 Aspotential Oncogenic MicroRNA of Squamous Cell Carcinoma of Tongue. Clin. Cancer Res. 2008, 14, 2588–2592. [Google Scholar] [CrossRef] [PubMed]
- Waseem, M.; Ahmad, M. K.; Serajuddin, M.; Bhaskar, V.; Sankhwar, S. N.; Mahdi, A. A. MicroRNA-183-5p: A New Potential Marker for Prostate Cancer. Indian J Clin Biochem 2019, 34, 207–212. [Google Scholar] [CrossRef]
- Jung, K. MiRNAs Can Predict Prostate Cancer Biochemical Relapse and Are Involved in Tumor Progression. Int J Oncol 2011. [Google Scholar] [CrossRef]
- Rissin, D.M.; Kan, C.W.; Campbell, T.G.; Howes, S.C.; Fournier, D.R.; Song, L.; Piech, T.; Patel, P.P.; Chang, L.; Rivnak, A.J.; et al. Single-molecule enzyme-linked immunosorbent assay detects serum proteins at subfemtomolar concentrations. Nat. Biotechnol. 2010, 28, 595–599. [Google Scholar] [CrossRef]
- Ivanov, Y. D.; Malsagova, K. A.; Popov, V. P.; Pleshakova, T. O.; Kozlov, A. F.; Galiullin, R. A.; Shumov, I. D.; Kapustina, S. I.; Tikhonenko, F. V.; Ziborov, V. S.; Dolgoborodov, A. Yu.; Petrov, O. F.; Gadzhieva, O. A.; Bashiryan, B. A.; Shimansky, V. N.; Potoldykova, N. V.; Enikeev, D. V.; Usachev, D. Yu.; Archakov, A. I. Nanoribbon-Based Electronic Detection of a Glioma-Associated Circular MiRNA. Biosensors 2021, 11, 237. [Google Scholar] [CrossRef]
- Ivanov, Y. D.; Malsagova, K. A.; Pleshakova, T. O.; Galiullin, R. A.; Kozlov, A. F.; Shumov, I. D.; Popov, V. P.; Kapustina, S. I.; Ivanova, I. A.; Isaeva, A. I.; Tikhonenko, F. V.; Kushlinskii, N. E.; Alferov, A. A.; Tatur, V. Yu.; Ziborov, V. S.; Petrov, O. F.; Glukhov, A. V.; Archakov, A. I. Aptamer-Sensitized Nanoribbon Biosensor for Ovarian Cancer Marker Detection in Plasma. Chemosensors 2021, 9, 222. [Google Scholar] [CrossRef]
- Lu, N.; Gao, A.; Dai, P.; Song, S.; Fan, C.; Wang, Y.; Li, T. CMOS-Compatible Silicon Nanowire Field-Effect Transistors for Ultrasensitive and Label-Free MicroRNAs Sensing. Small 2014, 10, 2022–2028. [Google Scholar] [CrossRef]
- Ivanov, Y. D.; Pleshakova, T. O.; Kozlov, A. F.; Malsagova, K. A.; Krohin, N. V.; Shumyantseva, V. V.; Shumov, I. D.; Popov, V. P.; Naumova, O. V.; Fomin, B. I.; Nasimov, D. A.; Aseev, A. L.; Archakov, A. I. SOI Nanowire for the High-Sensitive Detection of HBsAg and α-Fetoprotein. Lab Chip 2012, 12, 5104–5111. [Google Scholar] [CrossRef]
- Selth LA, Townley S, Gillis JL, Ochnik AM, Murti K, Macfarlane RJ, Chi KN, Marshall VR, Tilley WD, Butler LM: Discovery of Circulating MicroRNAs Associated with Human Prostate Cancer Using a Mouse Model of Disease. Int J Cancer. 2012, 131 (3), 652-661. [CrossRef]
- Lin, H.-M.; Mahon, K. L.; Spielman, C.; Gurney, H.; Mallesara, G.; Stockler, M. R.; Bastick, P.; Briscoe, K.; Marx, G.; Swarbrick, A.; Horvath, L. G. Phase 2 Study of Circulating MicroRNA Biomarkers in Castration-Resistant Prostate Cancer. Br J Cancer 2017, 116, 1002–1011. [Google Scholar] [CrossRef] [PubMed]
- Ouyang, Y.; Gao, P.; Zhu, B.; Chen, X.; Lin, F.; Wang, X.; Wei, J.; Zhang, H. Downregulation of MicroRNA-429 Inhibits Cell Proliferation by Targeting P27Kip1 in Human Prostate Cancer Cells. Mol Med Rep 2015, 11, 1435–1441. [Google Scholar] [CrossRef] [PubMed]
- Malsagova, K. A.; Ivanov, Y. D.; Pleshakova, T. O.; Kaysheva, A. L.; Shumov, I. D.; Kozlov, A. F.; Archakov, A. I.; Popov, V. P.; Fomin, B. I.; Latyshev, A. V. A SOI-Nanowire Biosensor for the Multiple Detection of D-NFATc1 Protein in the Serum. Anal. Methods 2015, 7, 8078–8085. [Google Scholar] [CrossRef]
- Ivanov, Y.; Pleshakova, T.; Malsagova, K.; Kurbatov, L.; Popov, V.; Glukhov, A.; Smirnov, A.; Enikeev, D.; Potoldykova, N.; Alekseev, B.; Dolotkazin, D.; Kaprin, A.; Ziborov, V.; Petrov, O.; Archakov, A. Detection of Marker MiRNAs, Associated with Prostate Cancer, in Plasma Using SOI-NW Biosensor in Direct and Inversion Modes. Sensors 2019, 19, 5248. [Google Scholar] [CrossRef] [PubMed]
- Ivanov, Y. D.; Goldaeva, K. V.; Malsagova, K. A.; Pleshakova, T. O.; Galiullin, R. A.; Popov, V. P.; Kushlinskii, N. E.; Alferov, A. A.; Enikeev, D. V.; Potoldykova, N. V.; Archakov, A. I. Nanoribbon Biosensor in the Detection of MiRNAs Associated with Colorectal Cancer. Micromachines 2021, 12, 1581. [Google Scholar] [CrossRef]
- Malsagova, K. A.; Pleshakova, T. O.; Galiullin, R. A.; Kozlov, A. F.; Shumov, I. D.; Popov, V. P.; Tikhonenko, F. V.; Glukhov, A. V.; Ziborov, V. S.; Petrov, O. F.; Fortov, V. E.; Archakov, A. I.; Ivanov, Y. D. Highly Sensitive Detection of CA 125 Protein with the Use of an N-Type Nanowire Biosensor. Biosensors (Basel) 2020, 10, E210. [Google Scholar] [CrossRef] [PubMed]
- Ivanov, Yu. D.; Danichev, V. V.; Pleshakova, T. O.; Shumov, I. D.; Ziborov, V. S.; Krokhin, N. V.; Zagumenniy, M. N.; Ustinov, V. S.; Smirnov, L. P.; Shironin, A. V.; Archakov, A. I. Irreversible Chemical AFM-Based Fishing for Detection of Low-Copied Proteins. Biochem. Moscow Suppl. Ser. B 2013, 7, 46–61. [Google Scholar] [CrossRef]
- Stern, E.; Wagner, R.; Sigworth, F. J.; Breaker, R.; Fahmy, T. M.; Reed, M. A. Importance of the Debye Screening Length on Nanowire Field Effect Transistor Sensors. Nano Lett. 2007, 7, 3405–3409. [Google Scholar] [CrossRef]
- Laborde, C.; Pittino, F.; Verhoeven, H. A.; Lemay, S. G.; Selmi, L.; Jongsma, M. A.; Widdershoven, F. P. Real-Time Imaging of Microparticles and Living Cells with CMOS Nanocapacitor Arrays. Nat Nanotechnol 2015, 10, 791–795. [Google Scholar] [CrossRef]
- Hahm, J. I., & Lieber, C. M. Direct Ultrasensitive Electrical Detection of DNA and DNA Sequence Variations Using Nanowire Nanosensors. Nano Lett. 2004 4(1), 51-54.
- Bonkat, G., Pickard, R., Bartoletti, R., Cai, T., Bruyère, F., & Geerlings, S. E. (2017). European Association of Urology Guidelines 2017.
- Thompson, I. M.; Pauler, D. K.; Goodman, P. J.; Tangen, C. M.; Lucia, M. S.; Parnes, H. L.; Minasian, L. M.; Ford, L. G.; Lippman, S. M.; Crawford, E. D.; Crowley, J. J.; Coltman, C. A. Prevalence of Prostate Cancer among Men with a Prostate-Specific Antigen Level ≤4.0 Ng per Milliliter. N Engl J Med 2004, 350(22), 2239–2246. [Google Scholar] [CrossRef]
- Rissin, D. M.; Kan, C. W.; Campbell, T. G.; Howes, S. C.; Fournier, D. R.; Song, L.; Piech, T.; Patel, P. P.; Chang, L.; Rivnak, A. J.; Ferrell, E. P.; Randall, J. D.; Provuncher, G. K.; Walt, D. R.; Duffy, D. C. Single-Molecule Enzyme-Linked Immunosorbent Assay Detects Serum Proteins at Subfemtomolar Concentrations. Nat Biotechnol 2010, 28, 595–599. [Google Scholar] [CrossRef] [PubMed]
- Wu, C. C., Pan, T. M., Wu, C. S., Yen, L. C., Chuang, C. K., Pang, S. T., Yang, Y. S., & Ko, F. H. Label-Free Detection of Prostate Specific Antigen Using a Silicon Nanobelt Field-Effect Transistor. International Journal of Electrochemical Science, 2012, 7(5), 4432-4442.
- Shimomura, A.; Shiino, S.; Kawauchi, J.; Takizawa, S.; Sakamoto, H.; Matsuzaki, J.; Ono, M.; Takeshita, F.; Niida, S.; Shimizu, C.; Fujiwara, Y.; Kinoshita, T.; Tamura, K.; Ochiya, T. Novel Combination of Serum MicroRNA for Detecting Breast Cancer in the Early Stage. Cancer Sci 2016, 107, 326–334. [Google Scholar] [CrossRef] [PubMed]
- Chen W, Tang Z, Sun Y, Zhang Y, Wang X, Shen Z, Liu F, Qin X. miRNA expression profile in primary gastric cancers and paired lymph node metastases indicates that miR-10a plays a role in metastasis from primary gastric cancer to lymph nodes. Exp Ther Med. 2012, 3(2), 351-356. [CrossRef]
Figure 1.
Schematic of the process of SOI-NR chip fabrication: SOI-structure assembly (a), electron beam/optical lithography, S/D contacts deposition, plasma-chemical etching (b), TEOS deposition (chemical vapor deposition) (c), and gas-plasma etching (d).
Figure 1.
Schematic of the process of SOI-NR chip fabrication: SOI-structure assembly (a), electron beam/optical lithography, S/D contacts deposition, plasma-chemical etching (b), TEOS deposition (chemical vapor deposition) (c), and gas-plasma etching (d).
Figure 2.
Figure 2. SEM image of a nanoribbon; The arrow indicates nanoribbon location between two electrodes (S – source, D – drain) (a), schematic cross-sectional image of SOI-NR (b).
Figure 2.
Figure 2. SEM image of a nanoribbon; The arrow indicates nanoribbon location between two electrodes (S – source, D – drain) (a), schematic cross-sectional image of SOI-NR (b).
Figure 3.
Figure 3. Optical images of the surface of the SOI-NR biosensor chip before sensitization with oDNA probes (a) and after application of oDNA probe solutions on the surface of individual nanoribbons (b) using non-contact robotic iONE-600 system equipped with a piezoelectric dispenser.
Figure 3.
Figure 3. Optical images of the surface of the SOI-NR biosensor chip before sensitization with oDNA probes (a) and after application of oDNA probe solutions on the surface of individual nanoribbons (b) using non-contact robotic iONE-600 system equipped with a piezoelectric dispenser.
Figure 4.
Figure 4. Schematic image of the main components of the analytical module of the SOI-NR biosensor. Numbers indicate the elements of the module: the stirrer (1), the platinum electrode (2), the measuring cell (3), the SOI-NR sensor chip (4), the chip holder (5), and the ten-channel data collection and storage system (6).
Figure 5.
Figure 5. An example of drain-gate characteristics for five nanoribbon sensors on a chip. Measurements were performed under the following conditions: 1mM MCP, Vg=0÷50 V, and Vds=0.1 V; nanoribbons were modified with covalently immobilized oDNA probes: probe_1, probe_2, probe_3, and probe_4.
Figure 6.
Example sensorgrams obtained when detecting target oDNAs (CS_1 (a) and CS_3 (b)) using the SOI-NR biosensor. Experimental conditions: n-type conductivity chip, nanoribbons sensitized with oDNA probes (probe_1 (a) and probe_3 (b)), 1mM MCP, Vg=42 V, Vds=0.1 V, and volume – 450 μl; concentrations of target oDNA solutions in the cell: 1.1 × 10⁻¹⁸ M (black line), 1.1 × 10⁻¹⁷ M (red line), 1.1 × 10⁻¹⁶ M (green line), and 1.1 × 10⁻¹⁵ M (blue line). Arrows indicate the time point of adding test and wash solutions to the cell.
Figure 7.
Typical sensorgrams obtained when detecting miRNA isolated from plasma using the SOI-NR biosensor. Experimental conditions: n-type conductivity chip, nanoribbons with immobilized oDNA probes (probe_1 (a); probe_2 (b)); test miRNA from blood plasma – control sample No. 27 (cyst of the left kidney, blue line), samples NO. 44 and 5 (PC, red and green lines, respectively); 1mM MCP, Vg=42 V, Vds=0.1 V, volume – 107 μl. Arrows indicate the time point of adding miRNA solution and wash buffer MCP to the cell.
Table 1.
Nucleotide sequences of oDNA probes immobilized on the surface of nanoribbons.
Table 1.
Nucleotide sequences of oDNA probes immobilized on the surface of nanoribbons.
| oDNA probe name |
oDNA probe sequence |
| probe_1 |
5’-(NH2)-(T)10TCGTGGATCTGTCTCTGCTCTGTTTATGGCCCTTCGGTAATTCACTGACTGAGACTGT
TCACAGTGAATTCTACCAGTGCCATACACAGAACAGGAGTCACACTGCGG |
| probe_2 |
5’-(NH2)-(T)10CCGCTCTGCCCAGGCAGCTGCAGGCCCAGCCCCTGCCTCCTTCAGAGCAACAGAG
AGGCAGGCATGCGGGCAGACAGACGCCCAACACAGAGACC |
| probe_3 |
5’-(NH2)-(T)10GCAGCGGAТGGACGGТТТТACCAGACAGТAТТAGACAGAGGGCCAGGТCТAACCAТGТCТGGТA
AGACGCCCAТCGGCCGGCG |
| probe_4 |
5’-(NH2)-(T)10 CGCCAAAAAAGCCAGGGТCACCCCCCGGGAAAGТCCCТAТТТAGGGGТТТAТC
GGGAGGGGACТGAGCCТGACGAGGCТ |
Table 2.
Nucleotide sequences of model target oDNAs, which represent synthetic analogues of corresponding target miRNAs.
Table 2.
Nucleotide sequences of model target oDNAs, which represent synthetic analogues of corresponding target miRNAs.
| oDNA name |
oDNA sequence (CS) complementary to the probe |
Corresponding
miRNA |
| CS_1 |
CCGCAGAGТGТGACТCCТGТТCТGТGТAТGGCACТGGТAGAAТТCACТGТGAACAGТCТCAGТCAGТGAAТТACCGAAGGGCCAТAAACAGAGCAGAGACAGAТCCACGA |
hsa-mir-183 [20] |
| CS_2 |
GGТCТCТGТGТТGGGCGТCТGТCТGCCCGCAТGCCТGCCТCТCТGТТGCТCТGAAGGAGGCAGGGGCТGGGCCТGCAGCТGCCТGGGCAGAGCGG |
hsa-mir-346 [27] |
| CS_3 |
CGCCGGCCGAТGGGCGТCТТACCAGACAТGGТТAGACCТGGCCCТCТGТCТAAТACТGТCТGGТAAAACCGТCCAТCCGCТGC |
hsa-mir-429 [28] |
| CS_4 |
AGCCТCGТCAGGCТCAGТCCCCТCCCGAТAAACCCCТAAAТAGGGACТТТCCCGGGGGGТGACCCТGGCТТТТТТGGCG |
hsa-mir-484 [29] |
Table 3.
The characteristics of blood plasma samples
Table 3.
The characteristics of blood plasma samples
| |
Sample |
Age |
Gender |
Diagnosis |
TNM stage |
Total Gleason score (points) |
| Experiment |
Sample No. 44 |
68 |
male |
prostate cancer |
T1cN0M0 |
6 |
| Sample No. 5 |
59 |
male |
prostate cancer |
T2cN0M0 |
6 |
| Control |
Sample No. 27 |
51 |
male |
left kidney cyst |
– |
– |
|
Disclaimer/Publisher’s Note: The statements, opinions and data contained in all publications are solely those of the individual author(s) and contributor(s) and not of MDPI and/or the editor(s). MDPI and/or the editor(s) disclaim responsibility for any injury to people or property resulting from any ideas, methods, instructions or products referred to in the content. |
© 2023 by the authors. Licensee MDPI, Basel, Switzerland. This article is an open access article distributed under the terms and conditions of the Creative Commons Attribution (CC BY) license (http://creativecommons.org/licenses/by/4.0/).
