Introduction
Arthrography is the most efficient imaging tool employed to diagnose complex jointlesions, preoperatively [
1]. Distending articular cavity by injecting contrast material, arthrograms can show ligament, tendon and cartilage issues with clear detail [
2]. Magnetic resonance arthrography (MRA) represents the most reliable exam to assess both large and small articulations because of its intrinsic high contrast resolution for soft tissue imaging [
3,
4,
5,
6,
7,
8]; however, it is an expensive exam, with long acquisition time; in addition, some drawback such as metallic implants, claustrophobia, and long waiting time are increasing in daily practice.
Dual-energy CT (DECT) represents a relatively new technology capable to characterize tissues and other material (e.g., iodine) because of different attenuation values at different energy levels [
9,
10]. Dedicated application and relative maps were proposed to identify gout, bone marrow edema (BME), and to reduce artifacts around metal implants [
11,
12,
13,
14,
15,
16].
Multiple applications of DECT could be employed to improve the diagnostic capabilities of CT arthrography [
17,
18].
For example, DECT virtual non-contrast (VNC) images may be used to avoid the acquisition of non-contrast images, with subsequent reduction of radiation dose to the patient [
19,
20]. VNC are routinely employed for the assessment of abdominal parenchyma [
21], and vascular imaging [
22]. Moreover, VNC images from dual-energy CT arthrography (DECTA) of the shoulder with iodine removal have been proposed for the assessment of the glenoid morphology and for quantitative measurements of glenoid area [
19]. Similarly, 2D and 3D CT high resolution CT bone images can be used for pre-operative planning in case of femoro-acetabular impingement syndrome [
20].
In addition, DECT can be employed to identify BME in traumatic and non-traumatic settings [
21,
22,
23,
24,
25,
26,
27,
28,
29,
30,
31], to detect sings of inflammation in case of inflammatory arthritis [
32,
33] and soft tissues lesions [
34,
35,
36]. The presence of BME around the joint may help to clarify the diagnosis, especially in case of trauma.
Moreover, virtual mono energetic imaging (VMI) has been proposed to reduce artifacts around metallic components in operated patients [
23,
24], and also to optimize the visualization of contrast material injected into the articular cavity [
19]. The dilution of contrast material indeed may vary, depending on the concentration of contrast material employed and on the presence of pre-existing fluid within the articular cavity. Furthermore , DECT has been used for the identification of intraarticular loose bodies at shoulder CTA [
10]
In addition, iodine maps were proposed on DECTA of the shoulder to optimize the visualization of contrast material injected and to improve the accuracy compared to standard CTA [
25]. Similarly, iodine maps could be employed to distinguish intra or peri-articular calcifications from iodine, such rotator cuff tears.
Finally, DECT is characterized by an intrinsic increase in soft-tissue contrast, such in case of collagen imaging applications, that can be employed to enhance to visualization of ligaments and tendons around the imaged joints [
34,
35,
36].
The purpose of this paper is to review and discuss benefits and pitfall of the DECTA application in clinical practice.
DECT imaging protocol and post-processing
DECTA examinations can be performed with any dual energy or spectral CT scanner. In our clinical practice, we use a dual-source DECT scanner (Somatom® Definition Force, Siemens Healthcare, Forchheim, Germany).
At our institution, the injection of contrast material is performed under ultrasound or radioscopic guidance, with a 22-gauge spinal needle, according to the operator choice. We use a mixture of iodinated contrast material (Iopamiro 370, Iopamidolo, 3,7 g of iodine, Bracco imaging, Milano), and saline (1:2 ratio).
For DECT, patients are positioned supine, with the target articulation in a neutral position. The scanning parameters were as follows: tube A at 80 kV, and tube B at 150 kV with a tin filter. The tube current–time product for tube A and B were 220 and 138 reference mAs, respectively. Automated attenuation-based tube current modulation should be employed to limit the radiation burden.
During post-processing we achieve three datasets of images (thickness 0.75 mm; increment 0.6 mm): an 80-kVp set, a 150-kVp, and a blended virtual 120 kVp set of images with Br 64 kernel—osteo-window filter. Moreover , soft-tissue kernel (Qr32) 80-kVp and 150- kVp set of images are reconstructed on an off-line workstation (SyngoVia® VB20; Siemens, Erlangen, Germany). A three-material decomposition algorithm is applied, and multiple lookup tables are available. Applications are chosen according to radiologist choice. VMI is employed to achieve a VNC dataset for bone measurements or to reduce artifacts in case of metallic components. Iodine maps are used to enhance the visualization of subtle labral or tendon tears. Also, in case of small articulations such as wrist of elbow, 0.3 mm reconstructions are obtained to improve the visualization of tiny articular anatomic structures, and of subtle cartilage lesions. Finally, BME maps are achieved in case of trauma to rule out or confirm the presence of BME around the imaged joint.
Virtual non contrast (VNC) and virtual monoenergetic imaging (VMI)
Both shoulder and hip arthrography are used for preoperative evaluation in case of dislocations, impingement, and dysplasia [
4,
5]. The assessment of morphology and anatomic angles is usually performed both on 2D and 3D reconstructions [
19]. However, in the case of single energy CT (SECT) arthrography, measurements could be invalidated because intraarticular iodinated contrast material overlays bone, especially as concerns 3D VRT reformats [
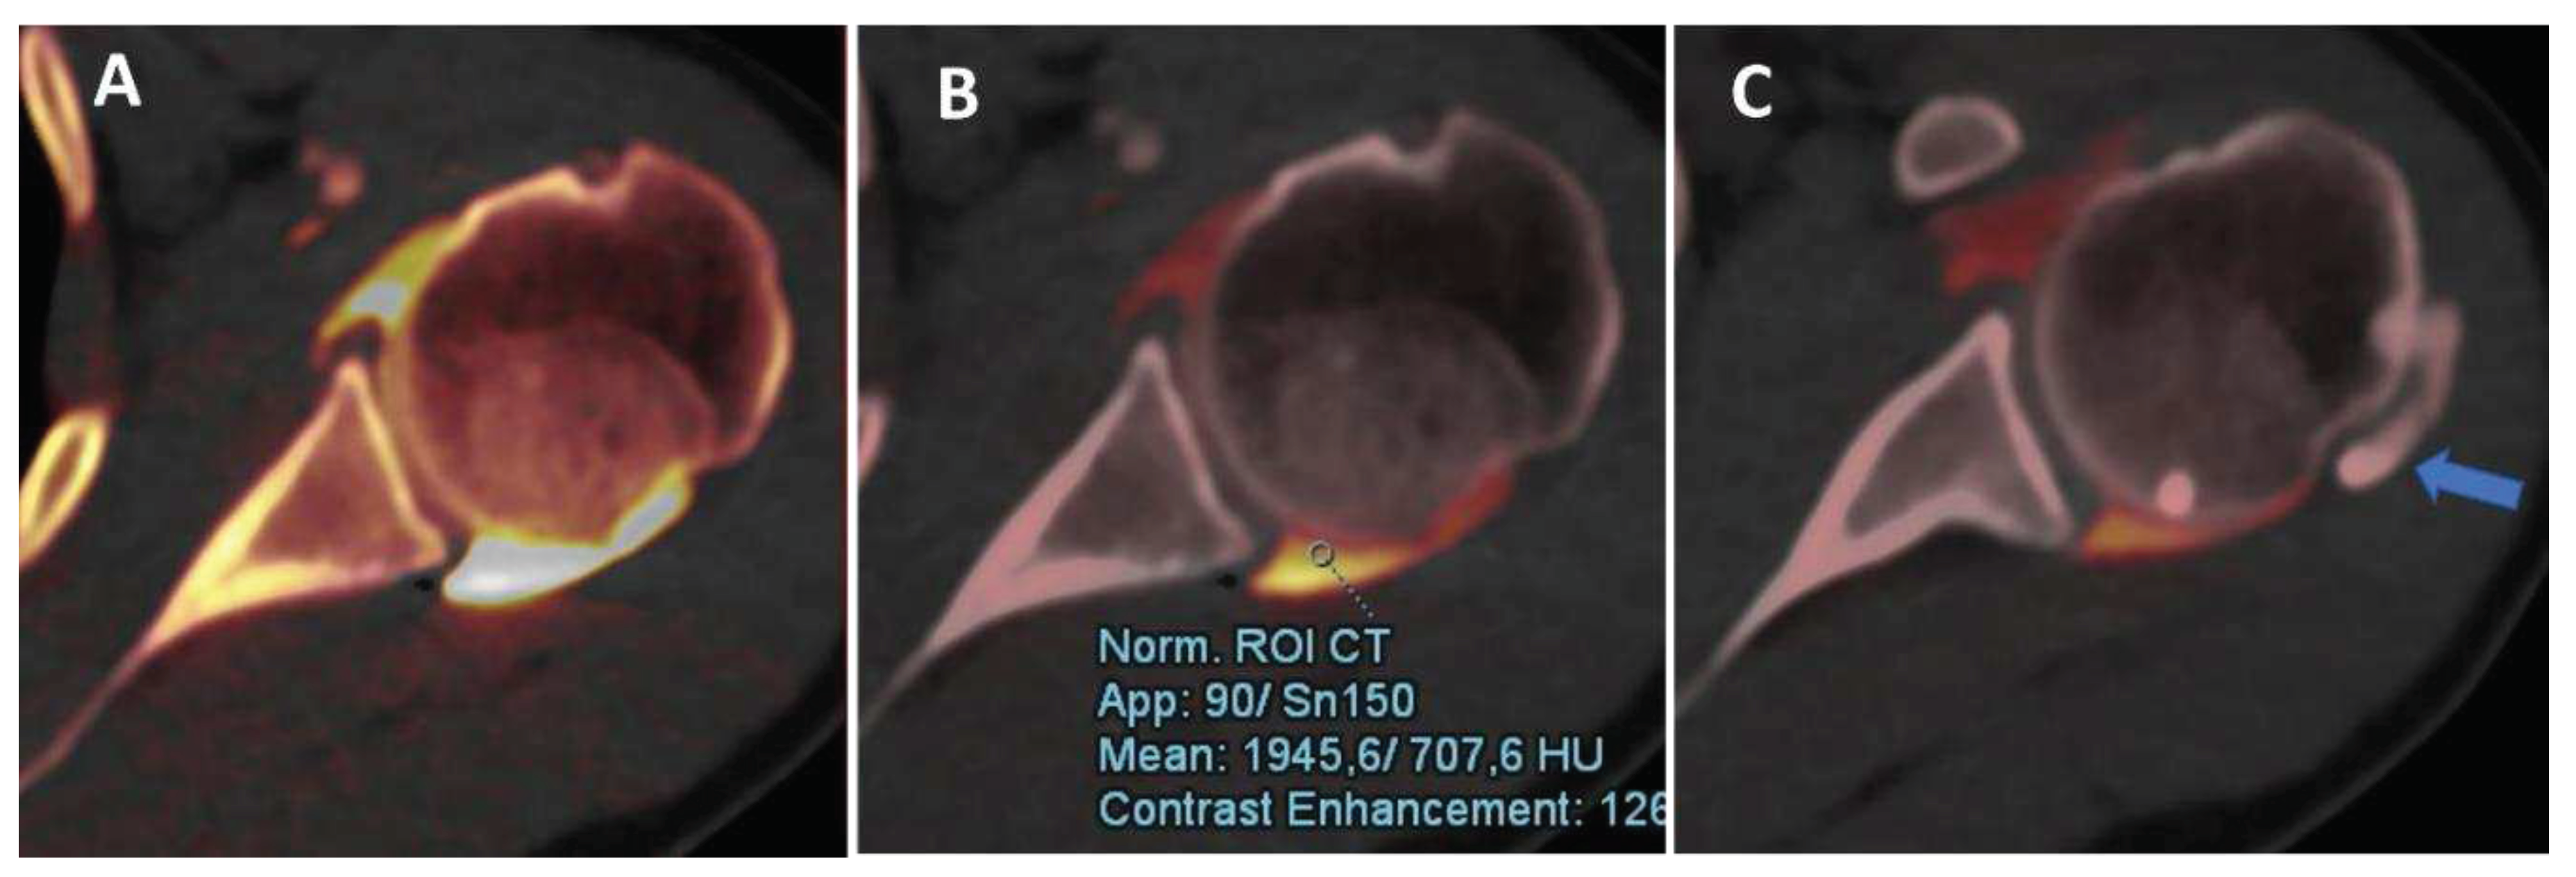
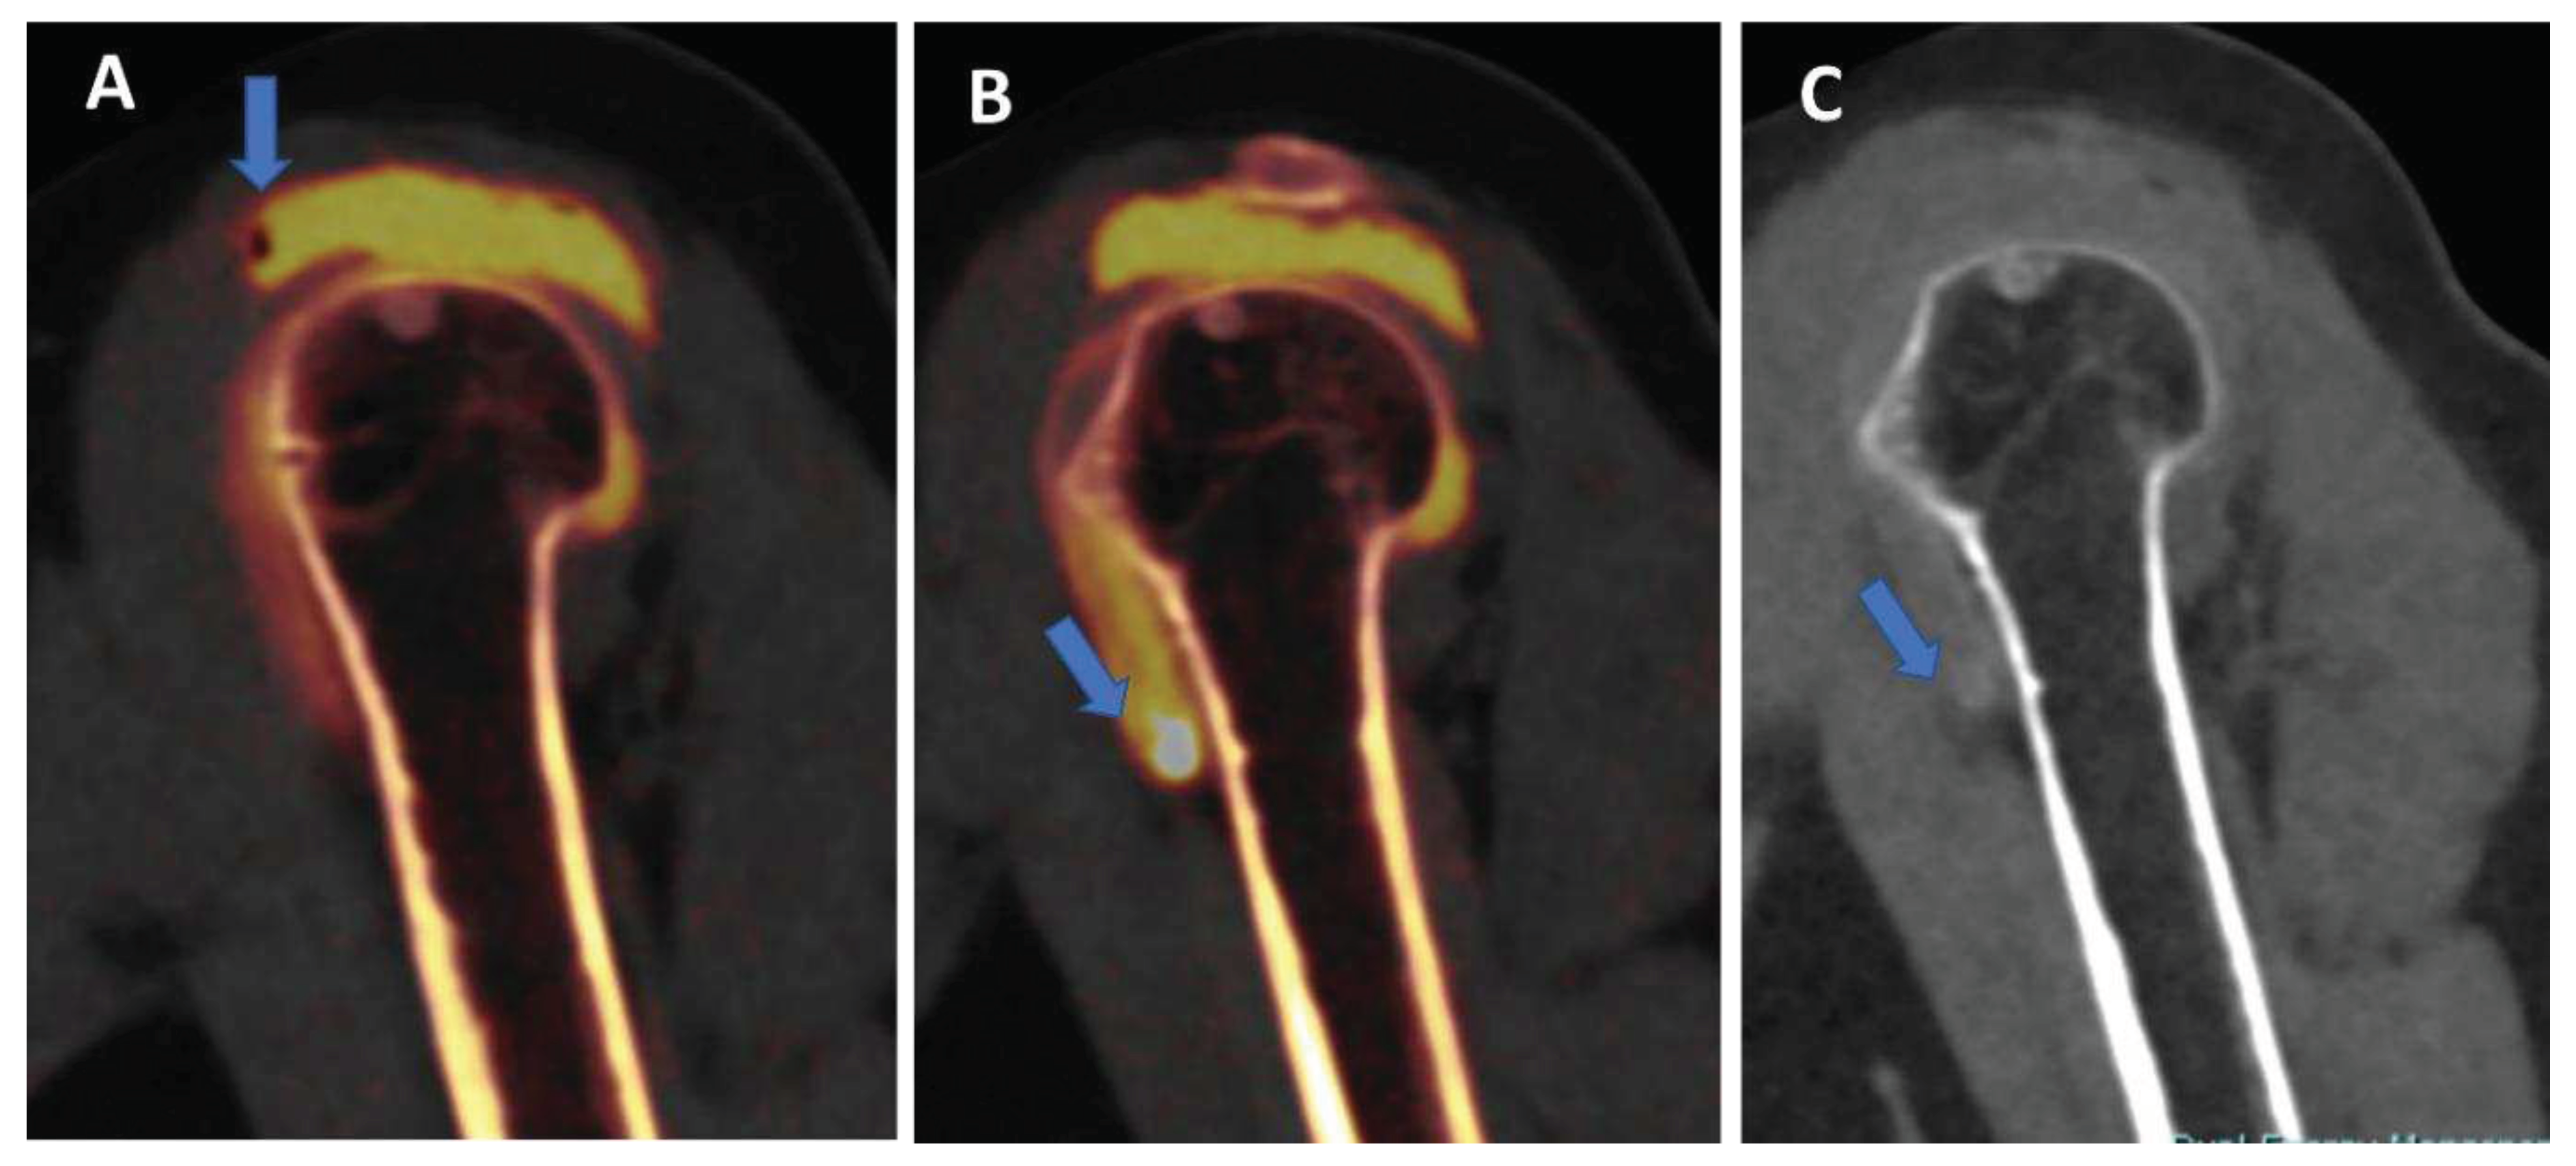
19]. By using VNC imaging application, DECTA allows the subtraction of iodine from the articular cavity, allowing a reliable measurement of glenoid or acetabular regions. In our experience, the subtraction can be performed on post-processing either by using VMI application (by increasing the values of keV), or by achieving VNC images from iodine maps (
Figure 1,
Figure 2). The I application has the advantage that the values of KeV can be smoothly modulated to achieve the optimal visualization of contrast material for the purpose. For this reason, VMI should be the preferred application for reducing blooming artifacts in case of highly concentrated contrast material (
Figure 3). This may represent an important pitfall of CTA, because abnormally dense contrast could be visualized for several reasons in clinical practice, including peri-capsular extravasation during puncture, trapped contrast material in small intra-articular “recess” such as in operated patients with fibrous band or synechiae, or simply because of dense contrast material accumulating in dependent regions.
In clinical practice, in case od shoulder dislocation, CT represents the most reliable imaging tool for the preoperative planning in case of bony glenoid lesions [
37]. When shoulder instability becomes recurrent, surgery is indicated to fix the problem. Soft tissue damage includes anteroinferior labral detachment or capsular damage, leading to capsular redundancy. Bony instability is produced by lesions to the humeral head or the glenoid rim [
37]. The risk of failure of surgical repair increases as the radiologist fails to address the presence or to correctly quantify the entity of a bone defect. often, the reference standard for preoperative evaluation in patient with shoulder instability includes both an MRI to assess soft tissue injury and non-contrast CT scan to assess bone damage. This may be problematic in that the additional non-contrast CT scan increases radiation exposure to the patient, and the MRI adds significant monetary cost and/or examination time.
Further to this, there are two types of glenoid bone loss: fragment type and erosion type [
38]. Both types are often associated to a Hill-Sachs lesion (HSL), representing a bone loss of the humeral head, caused by the impact of humeral head dislocated anteriorly with the glenoid rim. This is the case of the typical ‘bipolar lesion’. The contact zone between glenoid rim and the humeral head is called the ‘glenoid track’. In case of HSL on-track lesion, the risk of recurrent dislocation is low. Conversely, if HSL is off-track, the risk of engagement and dislocation is higher [
38]. Once again, CT represents the most reliable imaging tool for the differentiation between the ‘on-track/off-track’ lesions. For off-track lesions, either remplissage or Latarjet procedure is indicated, depending upon the glenoid defect size and the risk of recurrence [
38].
In this scenario, DECTA may play a crucial role, allowing both soft tissue assessment and glenoid bony measurement, performed on 2D and 3D virtual unenhanced images.
Moreover, imaging plays a critical role in the assessment of patients with femoroacetabular impingement [
20]. MR arthrography is best tool for imaging chondral and labral lesions [
20]. However, the protocol should include a large-FOV fluid-sensitive sequence to exclude mimickers, radial imaging to determine the presence of a cam deformity, and imaging of the distal femoral condyles for measurement of femoral torsion. For this reason, the imaging protocol is usually relatively long. Conversely, CT has been considered a valuable tool for planning of complex surgical corrections [
20]. However, advanced imaging, such as 3D simulation has the potential to improve surgical decision-making [
20]. Although oblique axial MR images were initially used to describe the alpha angle, the extent of cam deformity could be underestimated, because this dataset shows only the anterior position of the proximal femur [
20]. Anatomic landmarks, such as the most prominent appearance of the greater trochanter (femoral 12-o’clock position) and the acetabular teardrop (acetabular 12-o’clock position) can be used for accurate topographic allocation of the cam deformity on radial images. A threshold of 60° has been introduced for an imaging diagnosis because it is associated with progression of osteoarthritis within 2–5 years in patients with early symptoms. For clinical routine, morphologic and topographic assessment of osseous deformities of the femoral head and neck should be performed. Alpha angles are useful for identifying where the deformity is most pronounced [
21]. Because of its wide availability, low cost, and high level of detail in assessing cortical and cancellous bone, CT remains an important modality in the diagnostic workup of FAI. Also, CT is still considered the imaging reference standard for measurement of femoral torsion. Furthermore, CT-based 3D models of the pelvis are important for preoperative planning of complex osteotomies and can be used for surgical navigation [
20].
Similarly to DECTA of the shoulder, DECTA of the hip could therefore represent a one-stop one-shop procedure that allows detailed assessment of chondral and labral defects, as well as 2D and 3D hip bony anatomy.
IODINE MAPS and VNC imaging
Iodine maps have been largely employed in body and vascular imaging to increase the contrast among soft tissues because iodine maps enhance the signal coming from iodine contrast [
20,
21,
22,
23]. In a recently published paper [
5], DECTA of the shoulder was superior in the detection of glenoid labrum and rotator cuff tears with respect to standard CTA (sensitivity raising from 84.2% to 92.1% for reader 1; specificity raising from 77.8% to 88.9% for reader 2). Conversely, intra-observer agreement was higher for CTA if compared to DECTA [
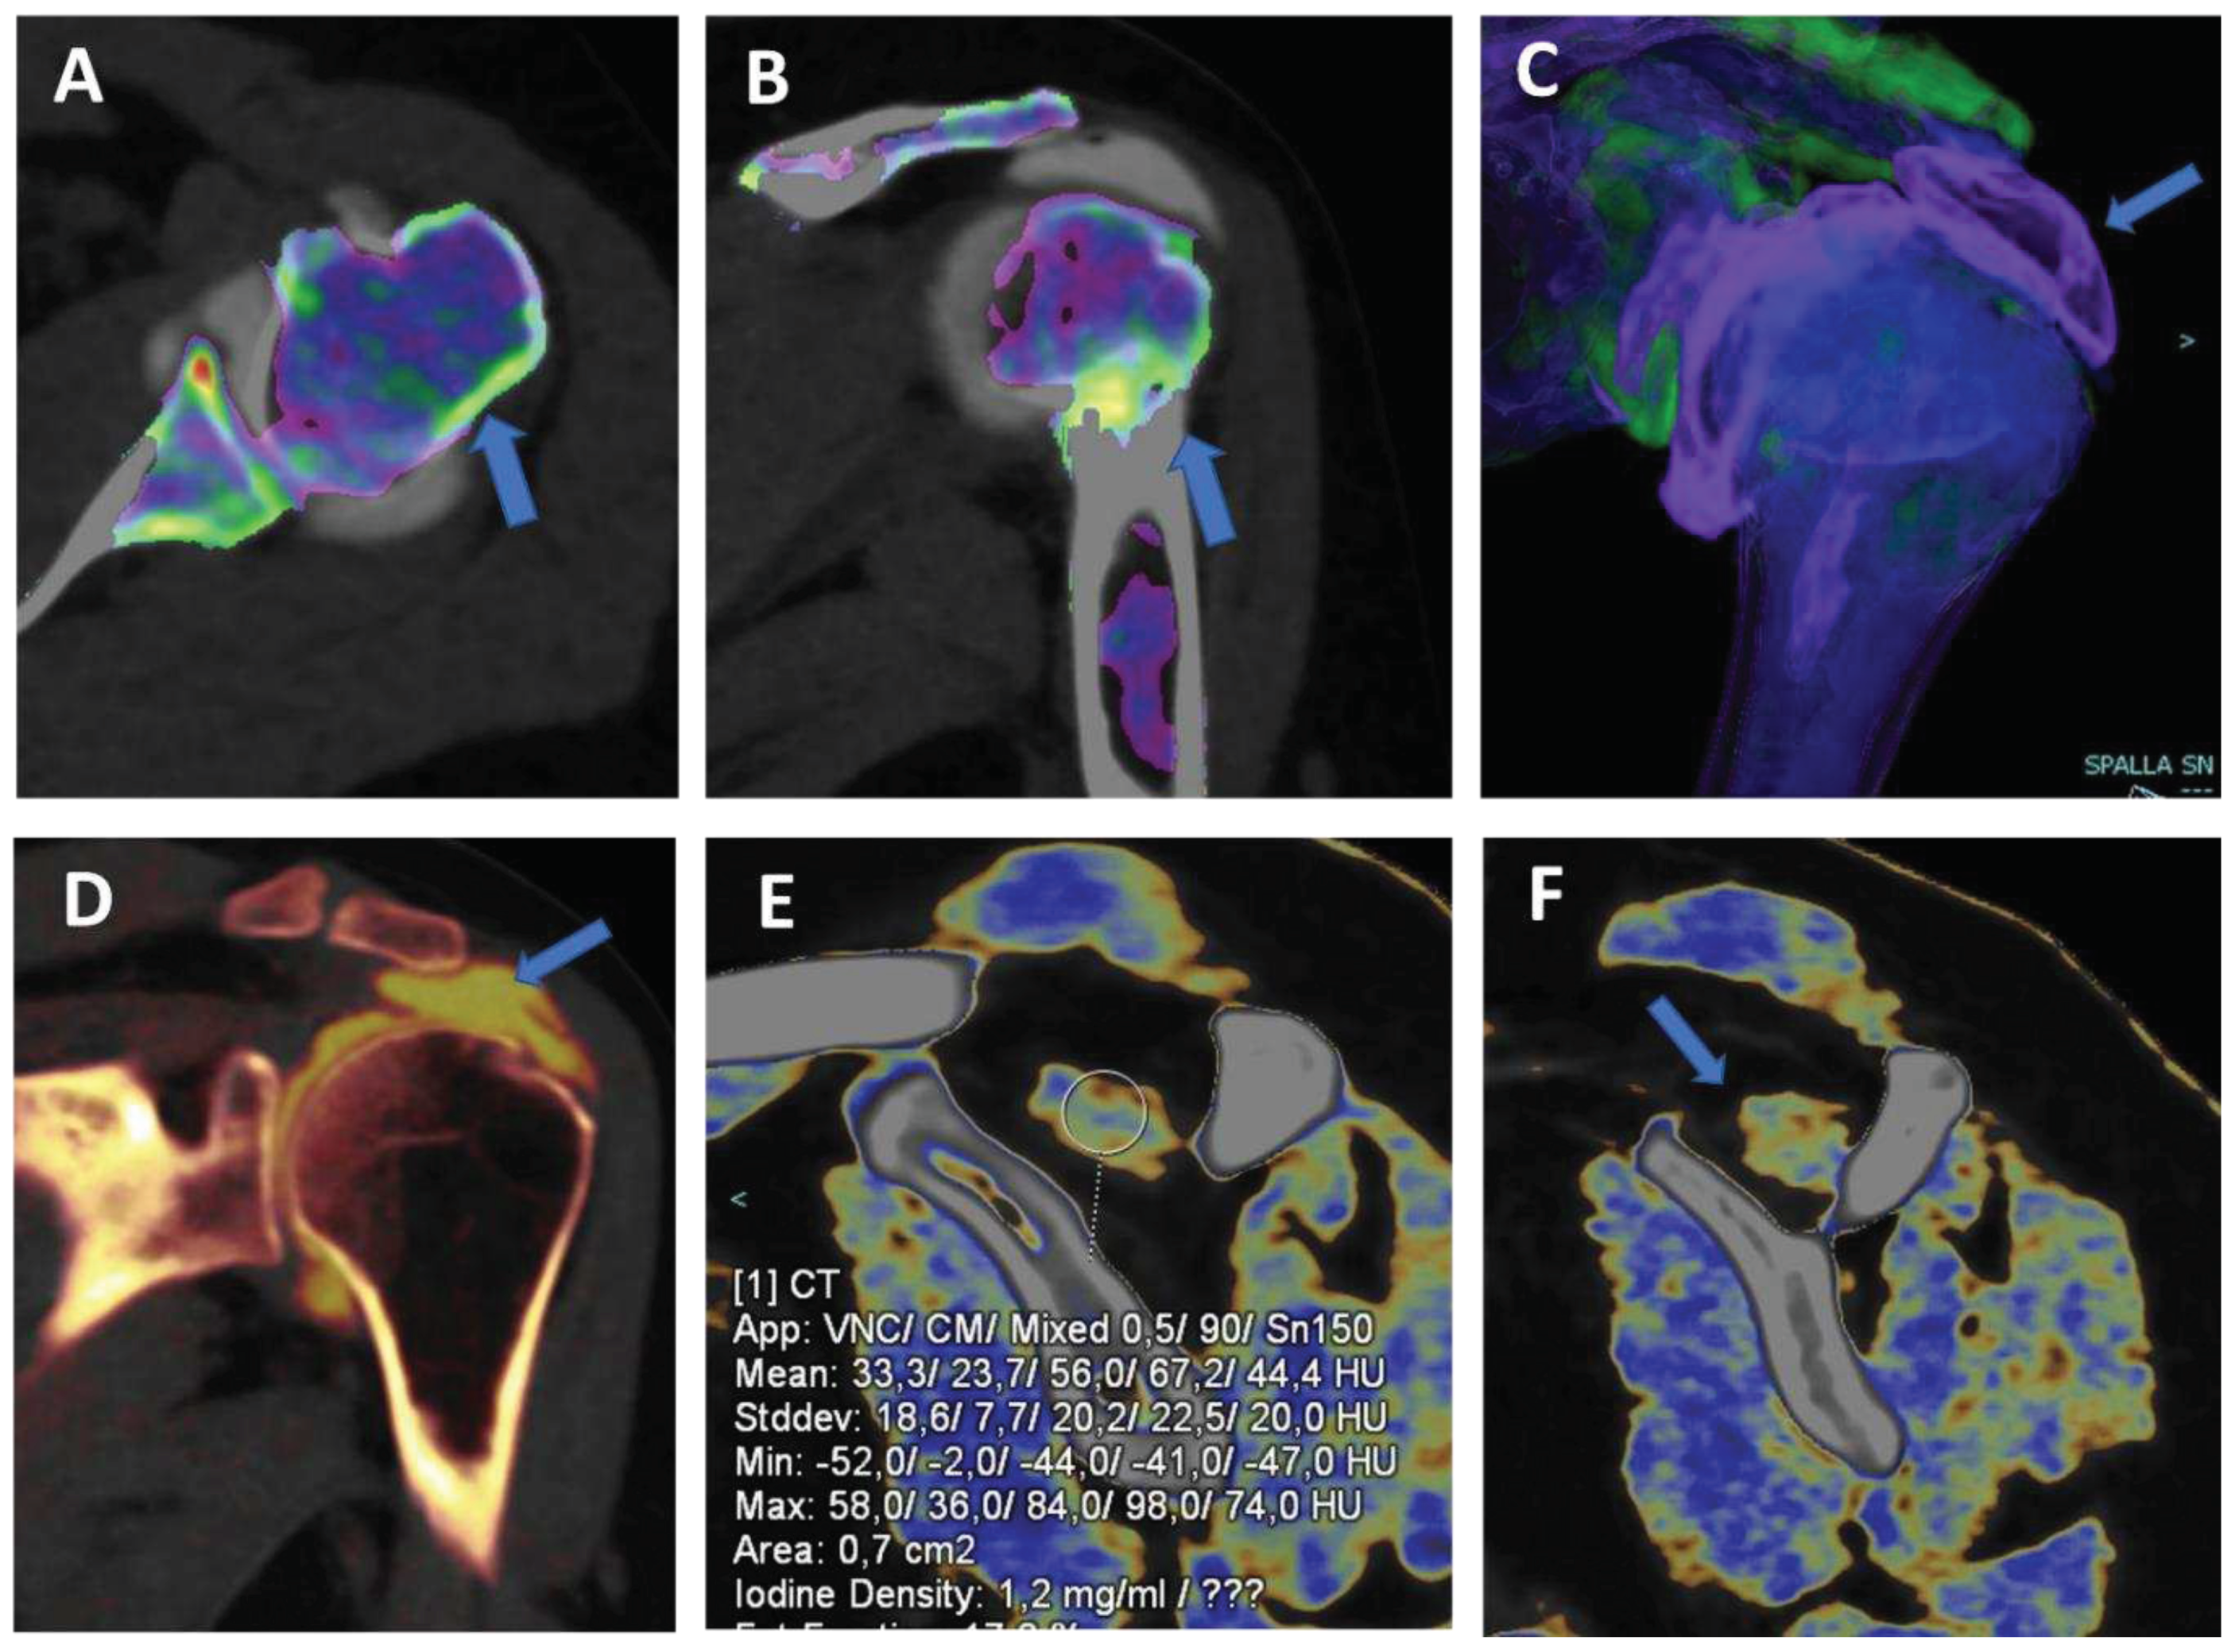
24]. In clinical practice, iodine maps can be used to enhance the visualization of tiny, subtle tears, by modulating the vividness of contrast material, with subsequent increase of contrast within soft tissues, including articular cartilages (
Figure 4). The possibility of modulating the signal from injected contrast material may be very useful in case of difficulties in injecting contrast material in the articular cavity. For example the signal can be augmented in case of diluted contrast material, such in case of injection of small amount of contrast material, or in case of presence of pre-existing intra-articular fluid. Conversely, the signal from injected contrast material could be reduced in case of poorly diluted contrast material, causing artifacts that may obscure the adjacent bony or soft tissue structures. Also, in clinical practice, the signal coming from contrast material can be changed depending on the radiologist choice with non-destructive flow.
Also, DECT has been proposed for the identification of intra-articular loose bodies. In the study by Stern et al [
19], no difference was observed in the detection of periosteal calcifications between VNC and DECTA images (p=0.29), while the detection of intraarticular loose bodies was superior on VNC images (p=0.02). Moreover, the use of VNC can improve the confidence for both periosteal calcifications and intraarticular loose bodies (p<0.001) [
19].
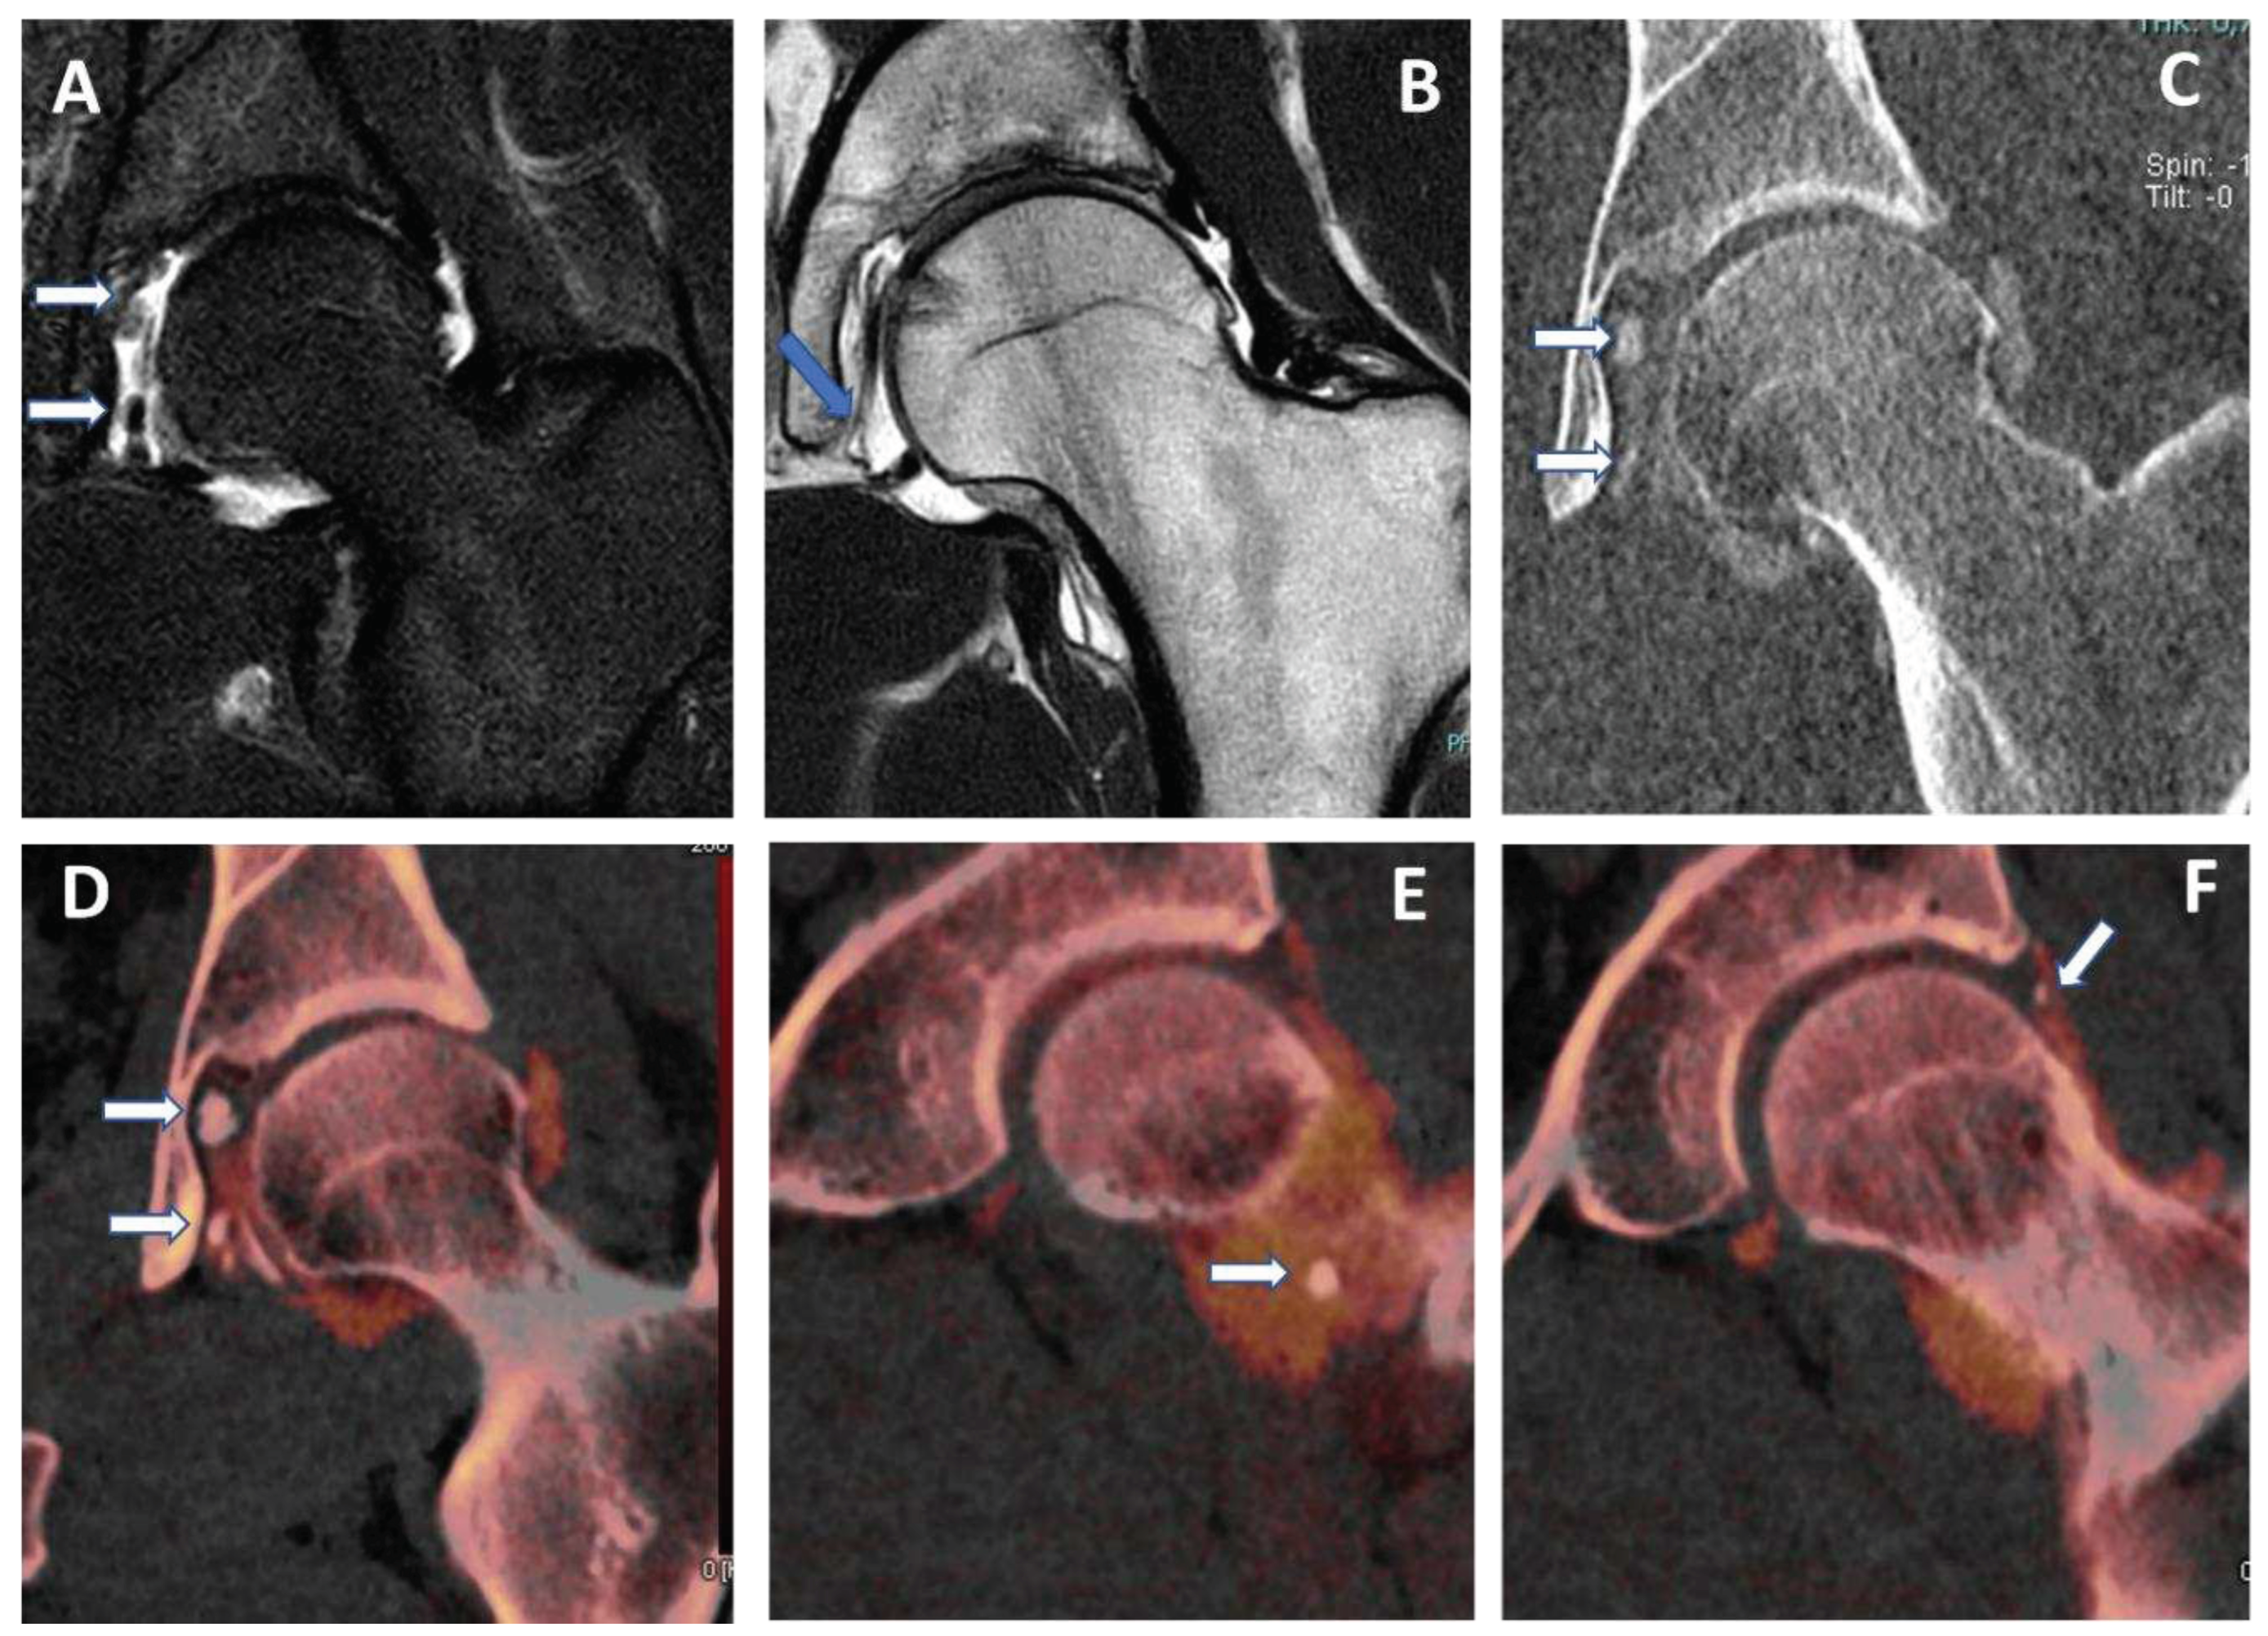
In our experience, both VMI and VNC from iodine maps can be used to enhance the identification of loose bodies and to distinguish calcifications from non-calcified loose bodies. Moreover, these applications can be employed, alone or in combination, to avoid potential pitfalls, such as tendon or labral calcifications (that may mimic the passage of contrast material in case of subtle tear) or the abnormal accumulation of highly concentrated contrast material in a distal articular recess, simulating the presence of intra-articular calcifications (
Figure 3).
Figure 5.
capsular, labral and loose calcifications in femoro-acetabular impingement. On MRA coronal STIR and T1 weighted images (A and B) is possible to recognize subtle filling defects (arrows on A) and capsular thickening (blue arrow in B). On DECTA VM I 1 mm coronal reconstructed image (C), calcifications are partially and erroneously subtracted (arrows). The corresponding DECTA iodine map images (D, E, and F), reconstructed on coronal plane (1 mm thickness), clearly show the presence of loose bodies, capsular and labral calcifications (arrows). .
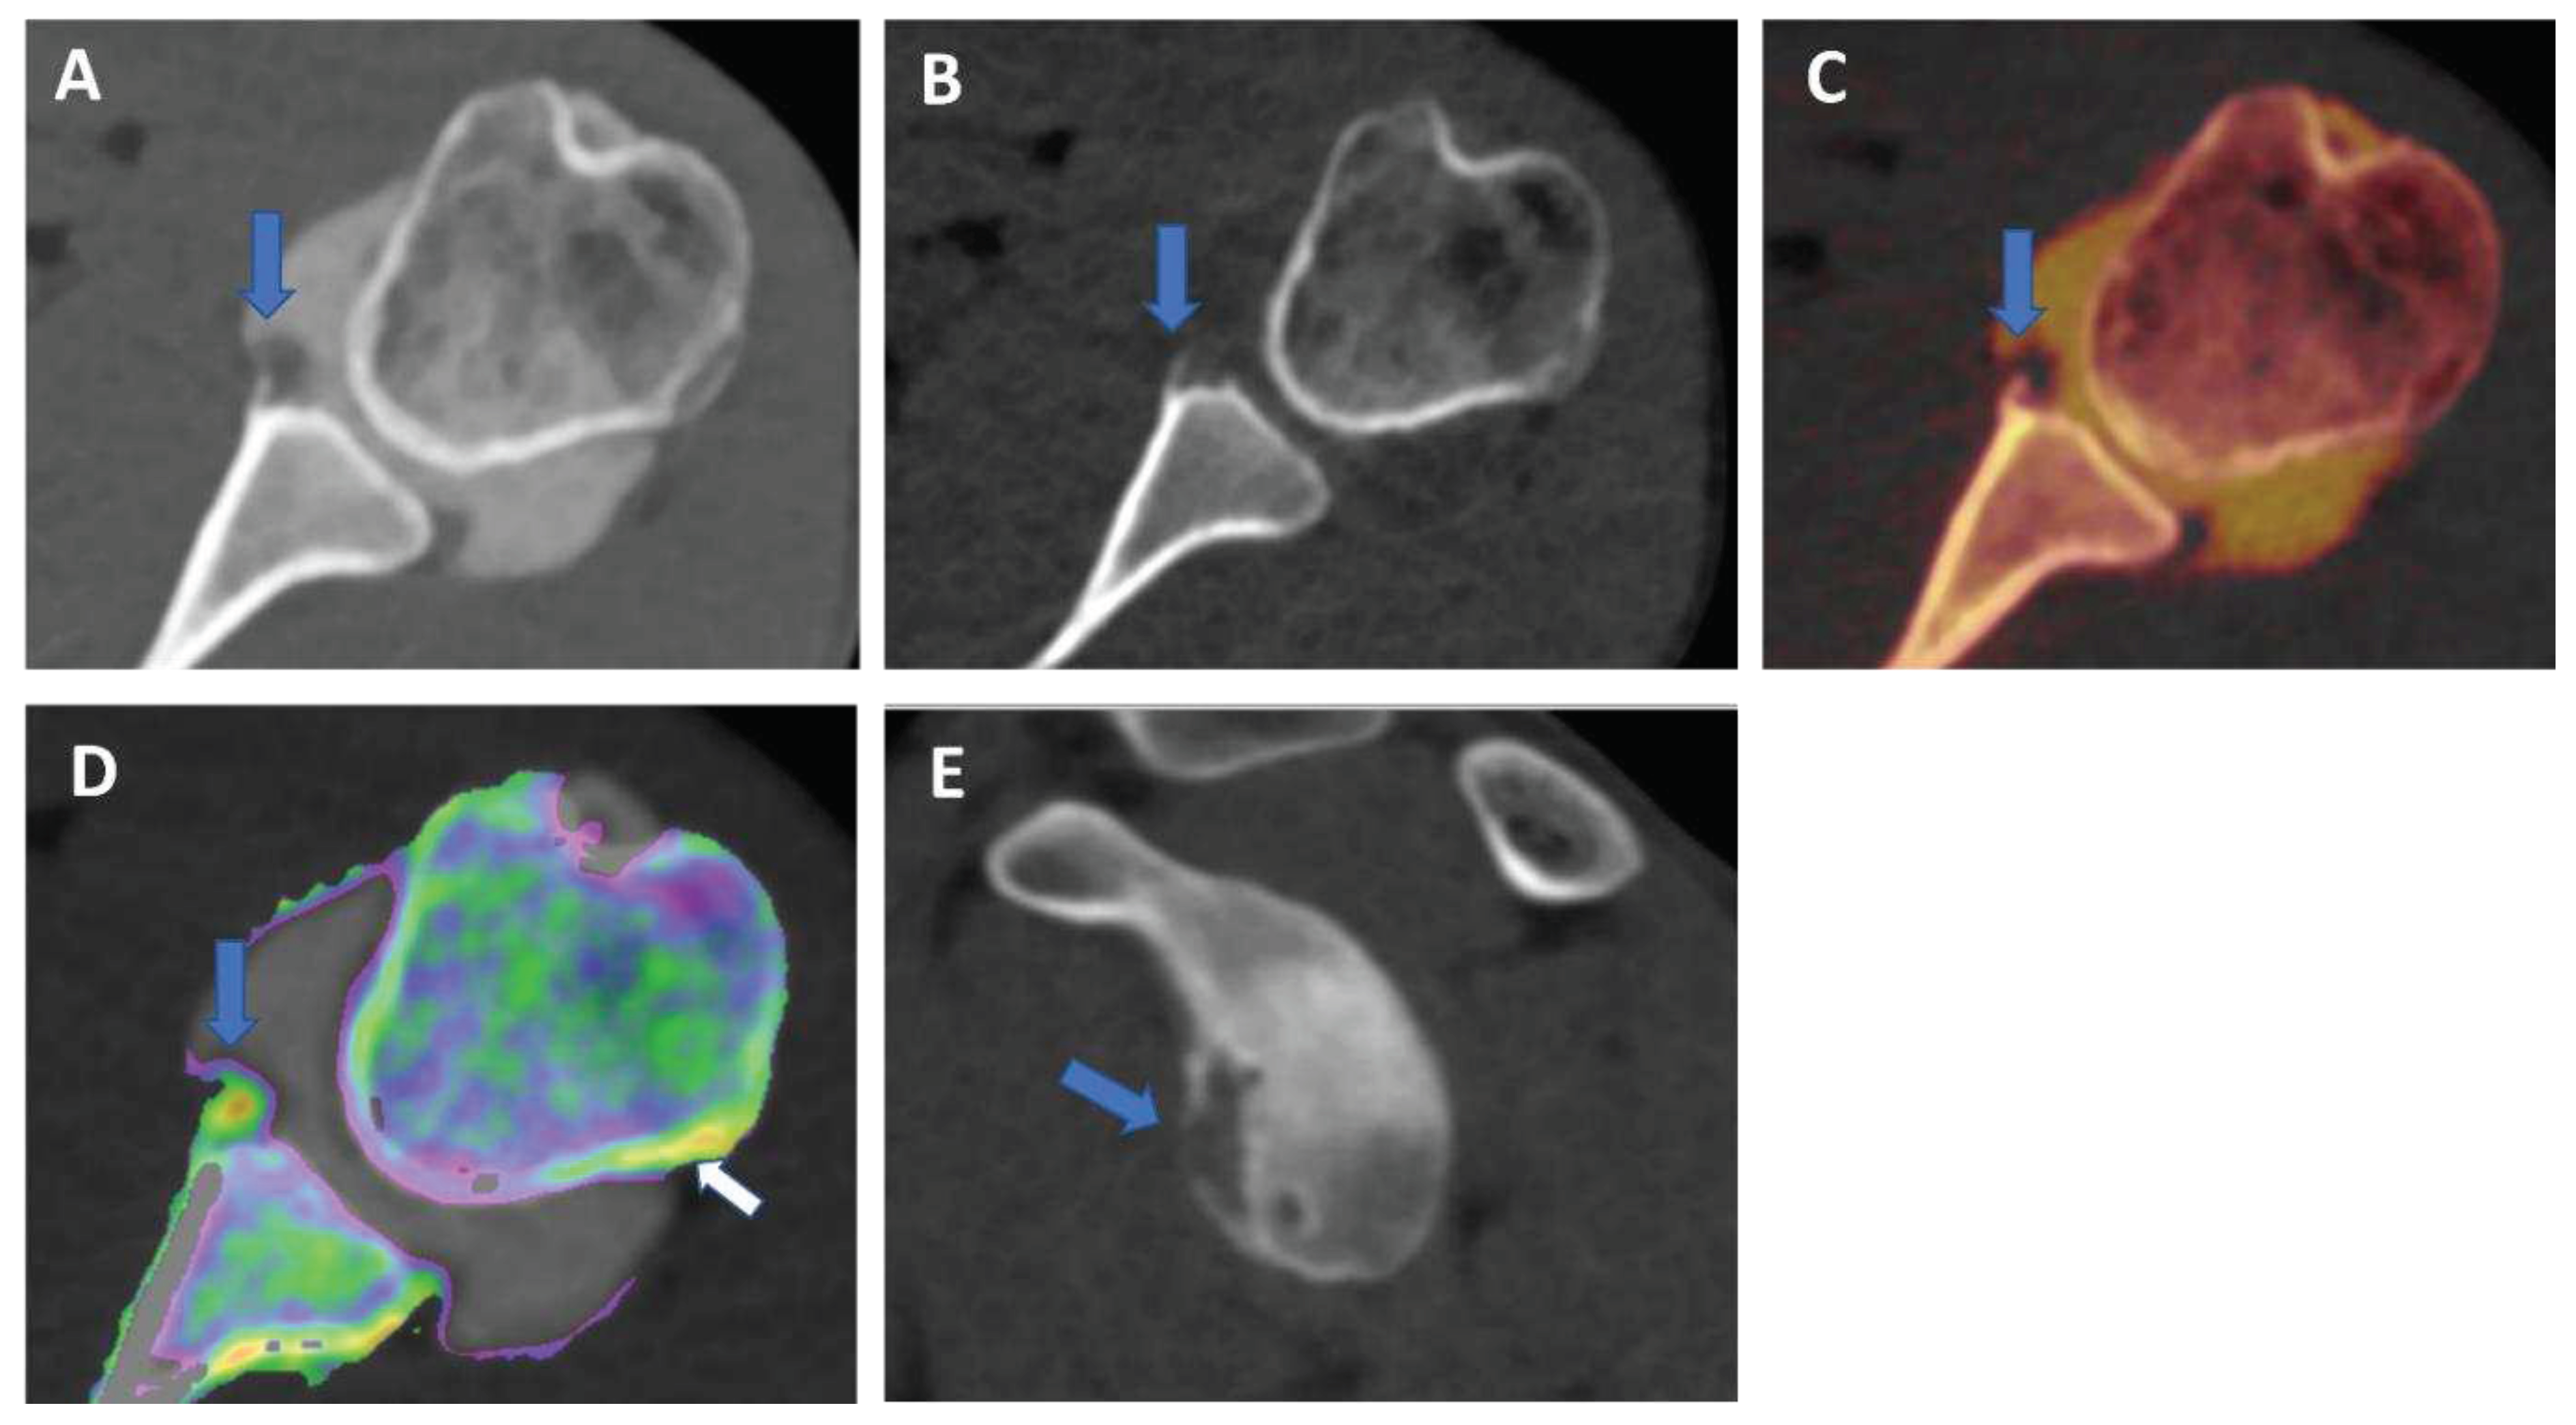
VNC images can generate “fat map” that could be used to identify and quantify the presence of atrophy of peri-articular muscle belly (
Figure 6) [
25]. In the study by Molwitz et al, Dual-energy CT material decomposition and virtual non-contrast-enhanced DECT HU values were successfully employed to assess muscle fat reliably [
25]. In particular, studying 21 patients and using MRI as the reference for diagnosis, the authors measured HU values on VNC DECT images in 126 regions of interest within the posterior paraspinal muscle, achieving a very good correlation between DECT and MRI (r = 0.91; r = − 0.98). For this reason dual-energy computed tomography could represent an alternative tool for the assessment of muscle quality, an important parameter for the risk of recurrent tendon or ligaments tear around joints.
Virtual non calcium (VNCa) imaging
DECT has been successfully used to identify BME in traumatic and non-traumatic settings [
14,
15], with very high diagnostic accuracy values both as concerns of spine and appendicular skeletal imaging [
26,
27,
28,
29,
30]. In clinical practice, BME maps reconstructed from VNCa imaging could be employed to detect bone marrow lesions around the imaged joints. Although iodinated contrast material could generate some artifacts in the adjacence areas, the presence of BME can still be visualized. For example, in case of shoulder trauma with doubtful dislocation, the presence of BME on the posterior aspect of the humeral head may help to corroborate the diagnosis of Hill-Sachs lesion (
Figure 1;
Figure 6). In addition, BME around the joint, with or without erosions, can be found in inflammatory diseases, such as septic or aseptic arthritis [
31,
32,
33] (Figure 7).
Figure 7.
Shoulder acute crystal arthritis. On coronal STIR and T1-weighted MR images (A and B) is possible to identify erosive changes and BME of humeral head (arrow), with corpuscular fluid within articular cavity. On para-coronal 2D and 3D DECT images (C and D) severe bone reabsorption with edema of femoral head is confirmed (arrow).
In particular, DECT have been recently proposed for the diagnosis of osteomyelitis of the lower limb [foti]. Osteomyelitis is an infection of the bone which involves the medullary canal, but often may involve adjacent joints. In the said study, 44 patients were enrolled with 32 positive cases. DECT achieved an overall AUC of 0.88, and an AUC of 0.85 as concerns the detection of BME. However, the diagnosis of infection was based also on the presence of bone erosions, that were better identified with DECT with respect to MRI (p = 0.02).
High resolution, isotropic CT images
One of the major intrinsic advantages of CT is the possibility to achieve high spatial resolution images with bone or soft-tissue windows [
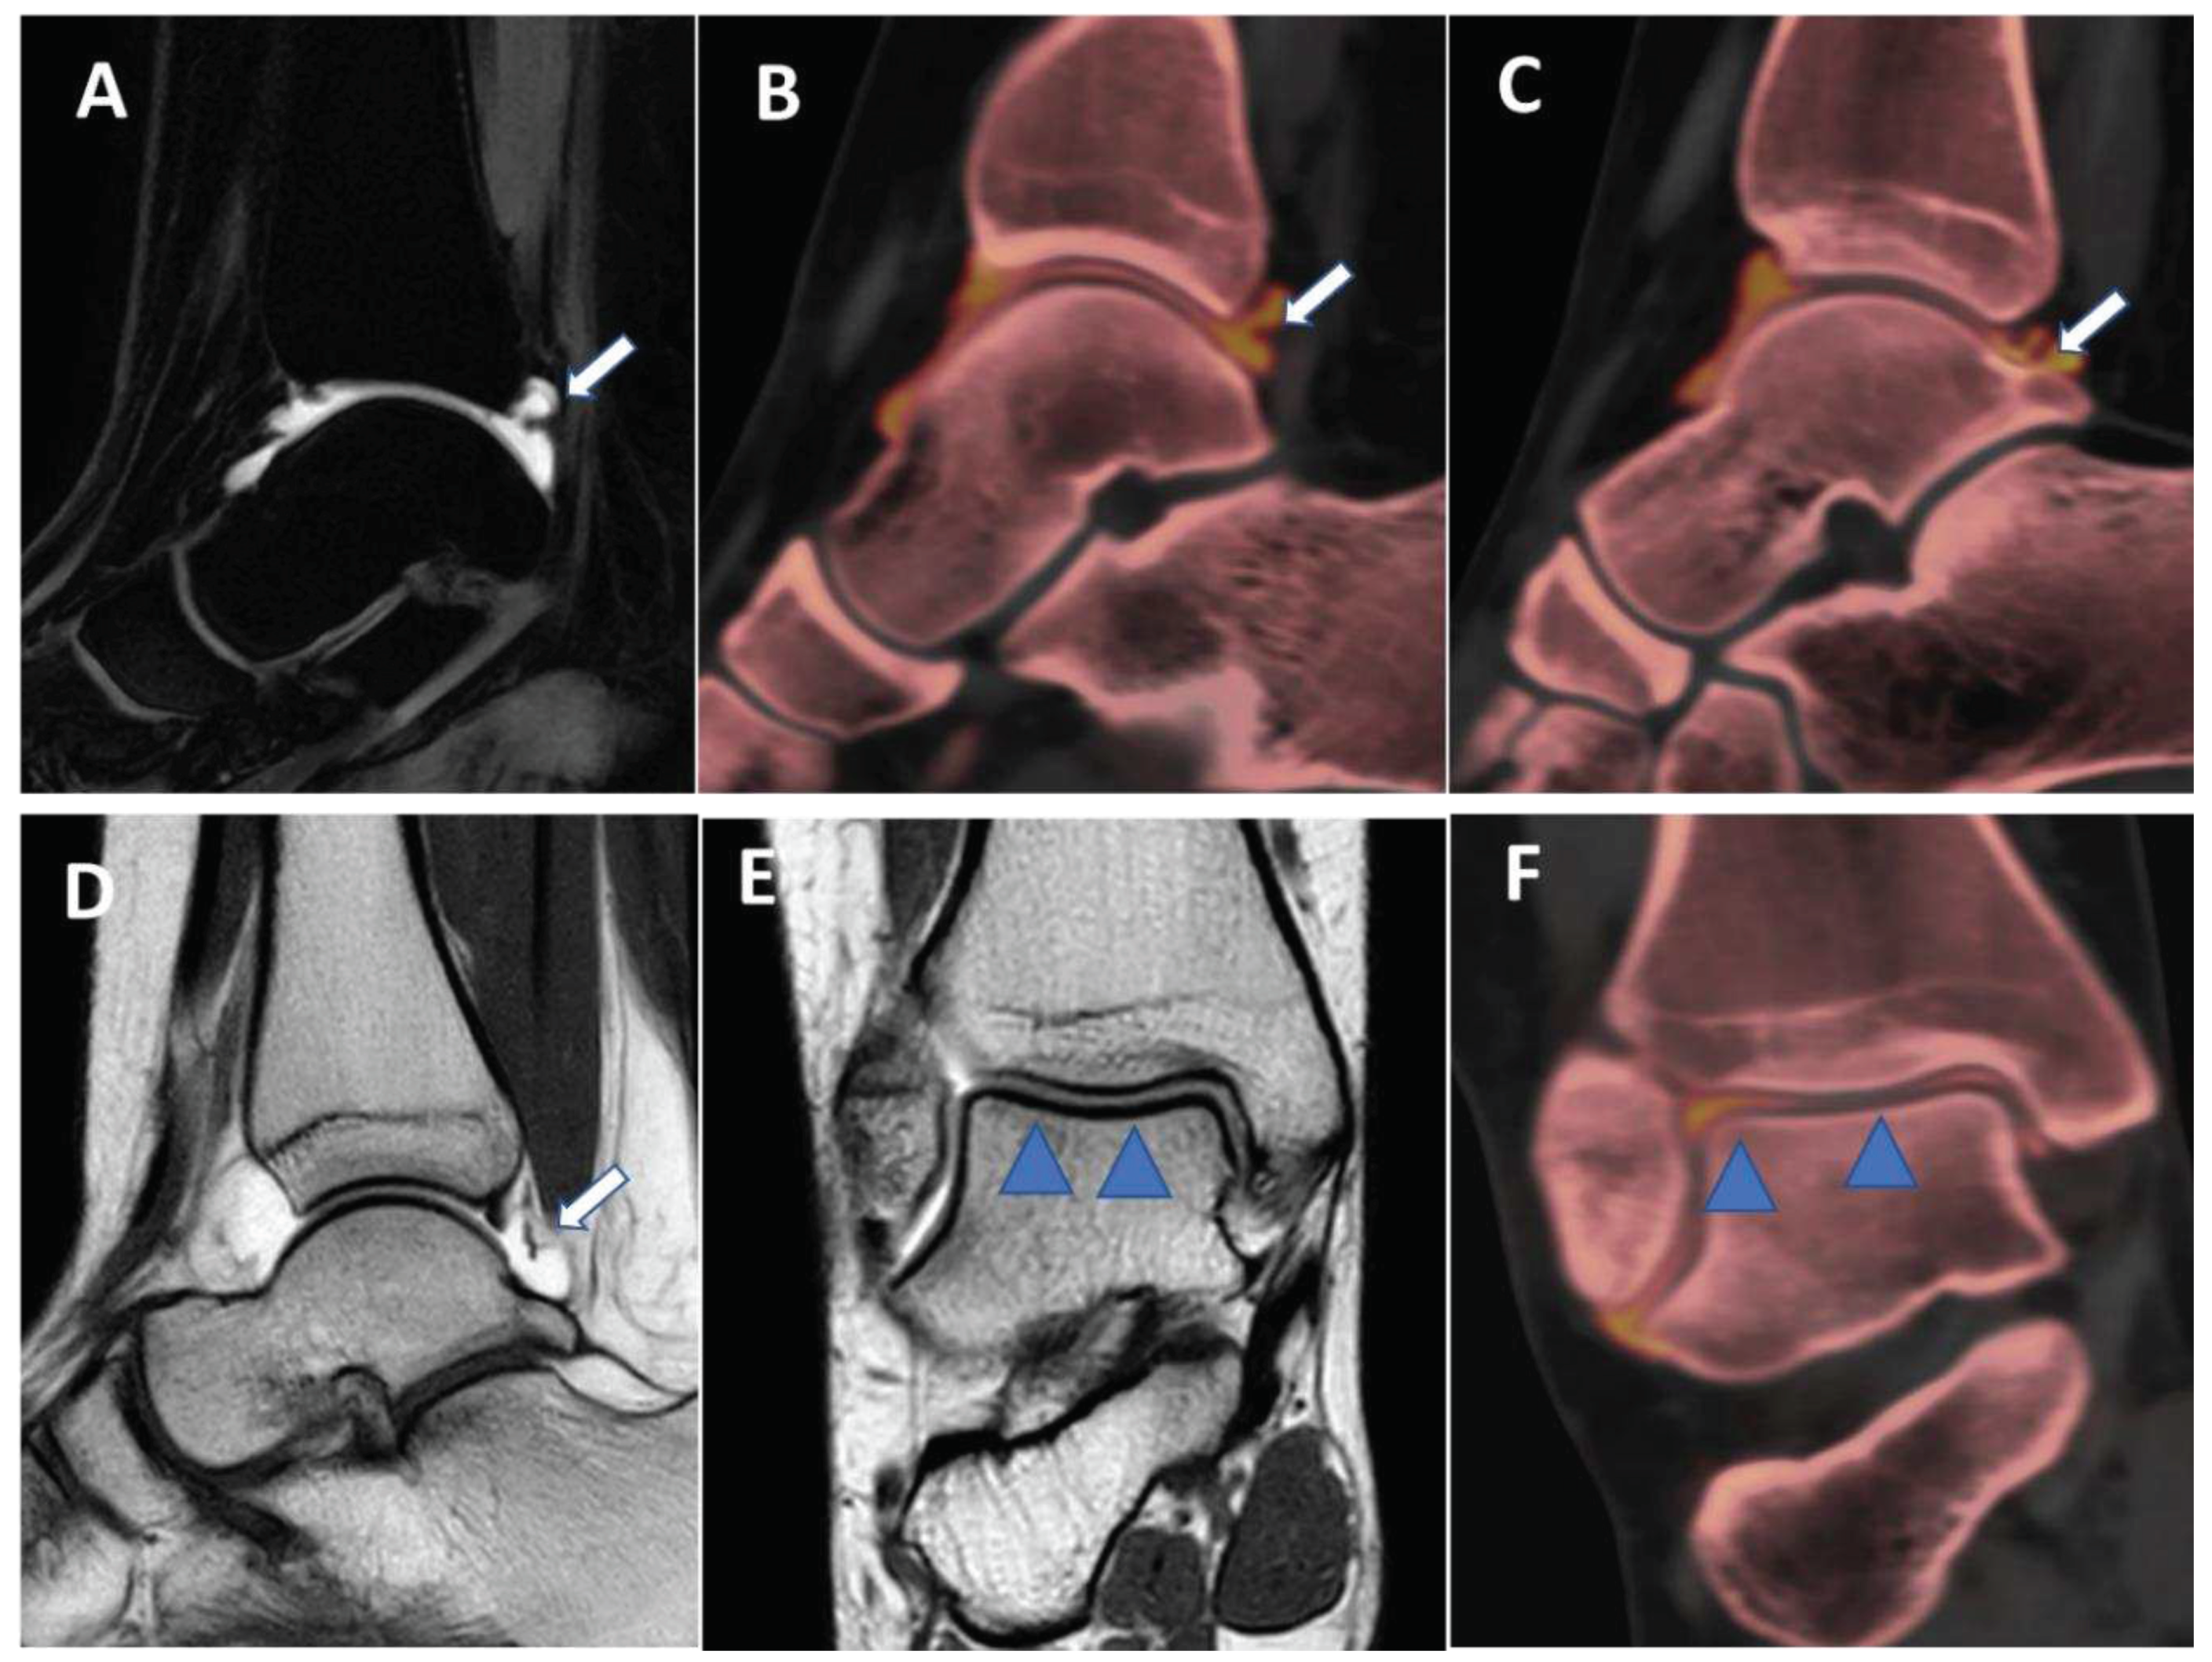
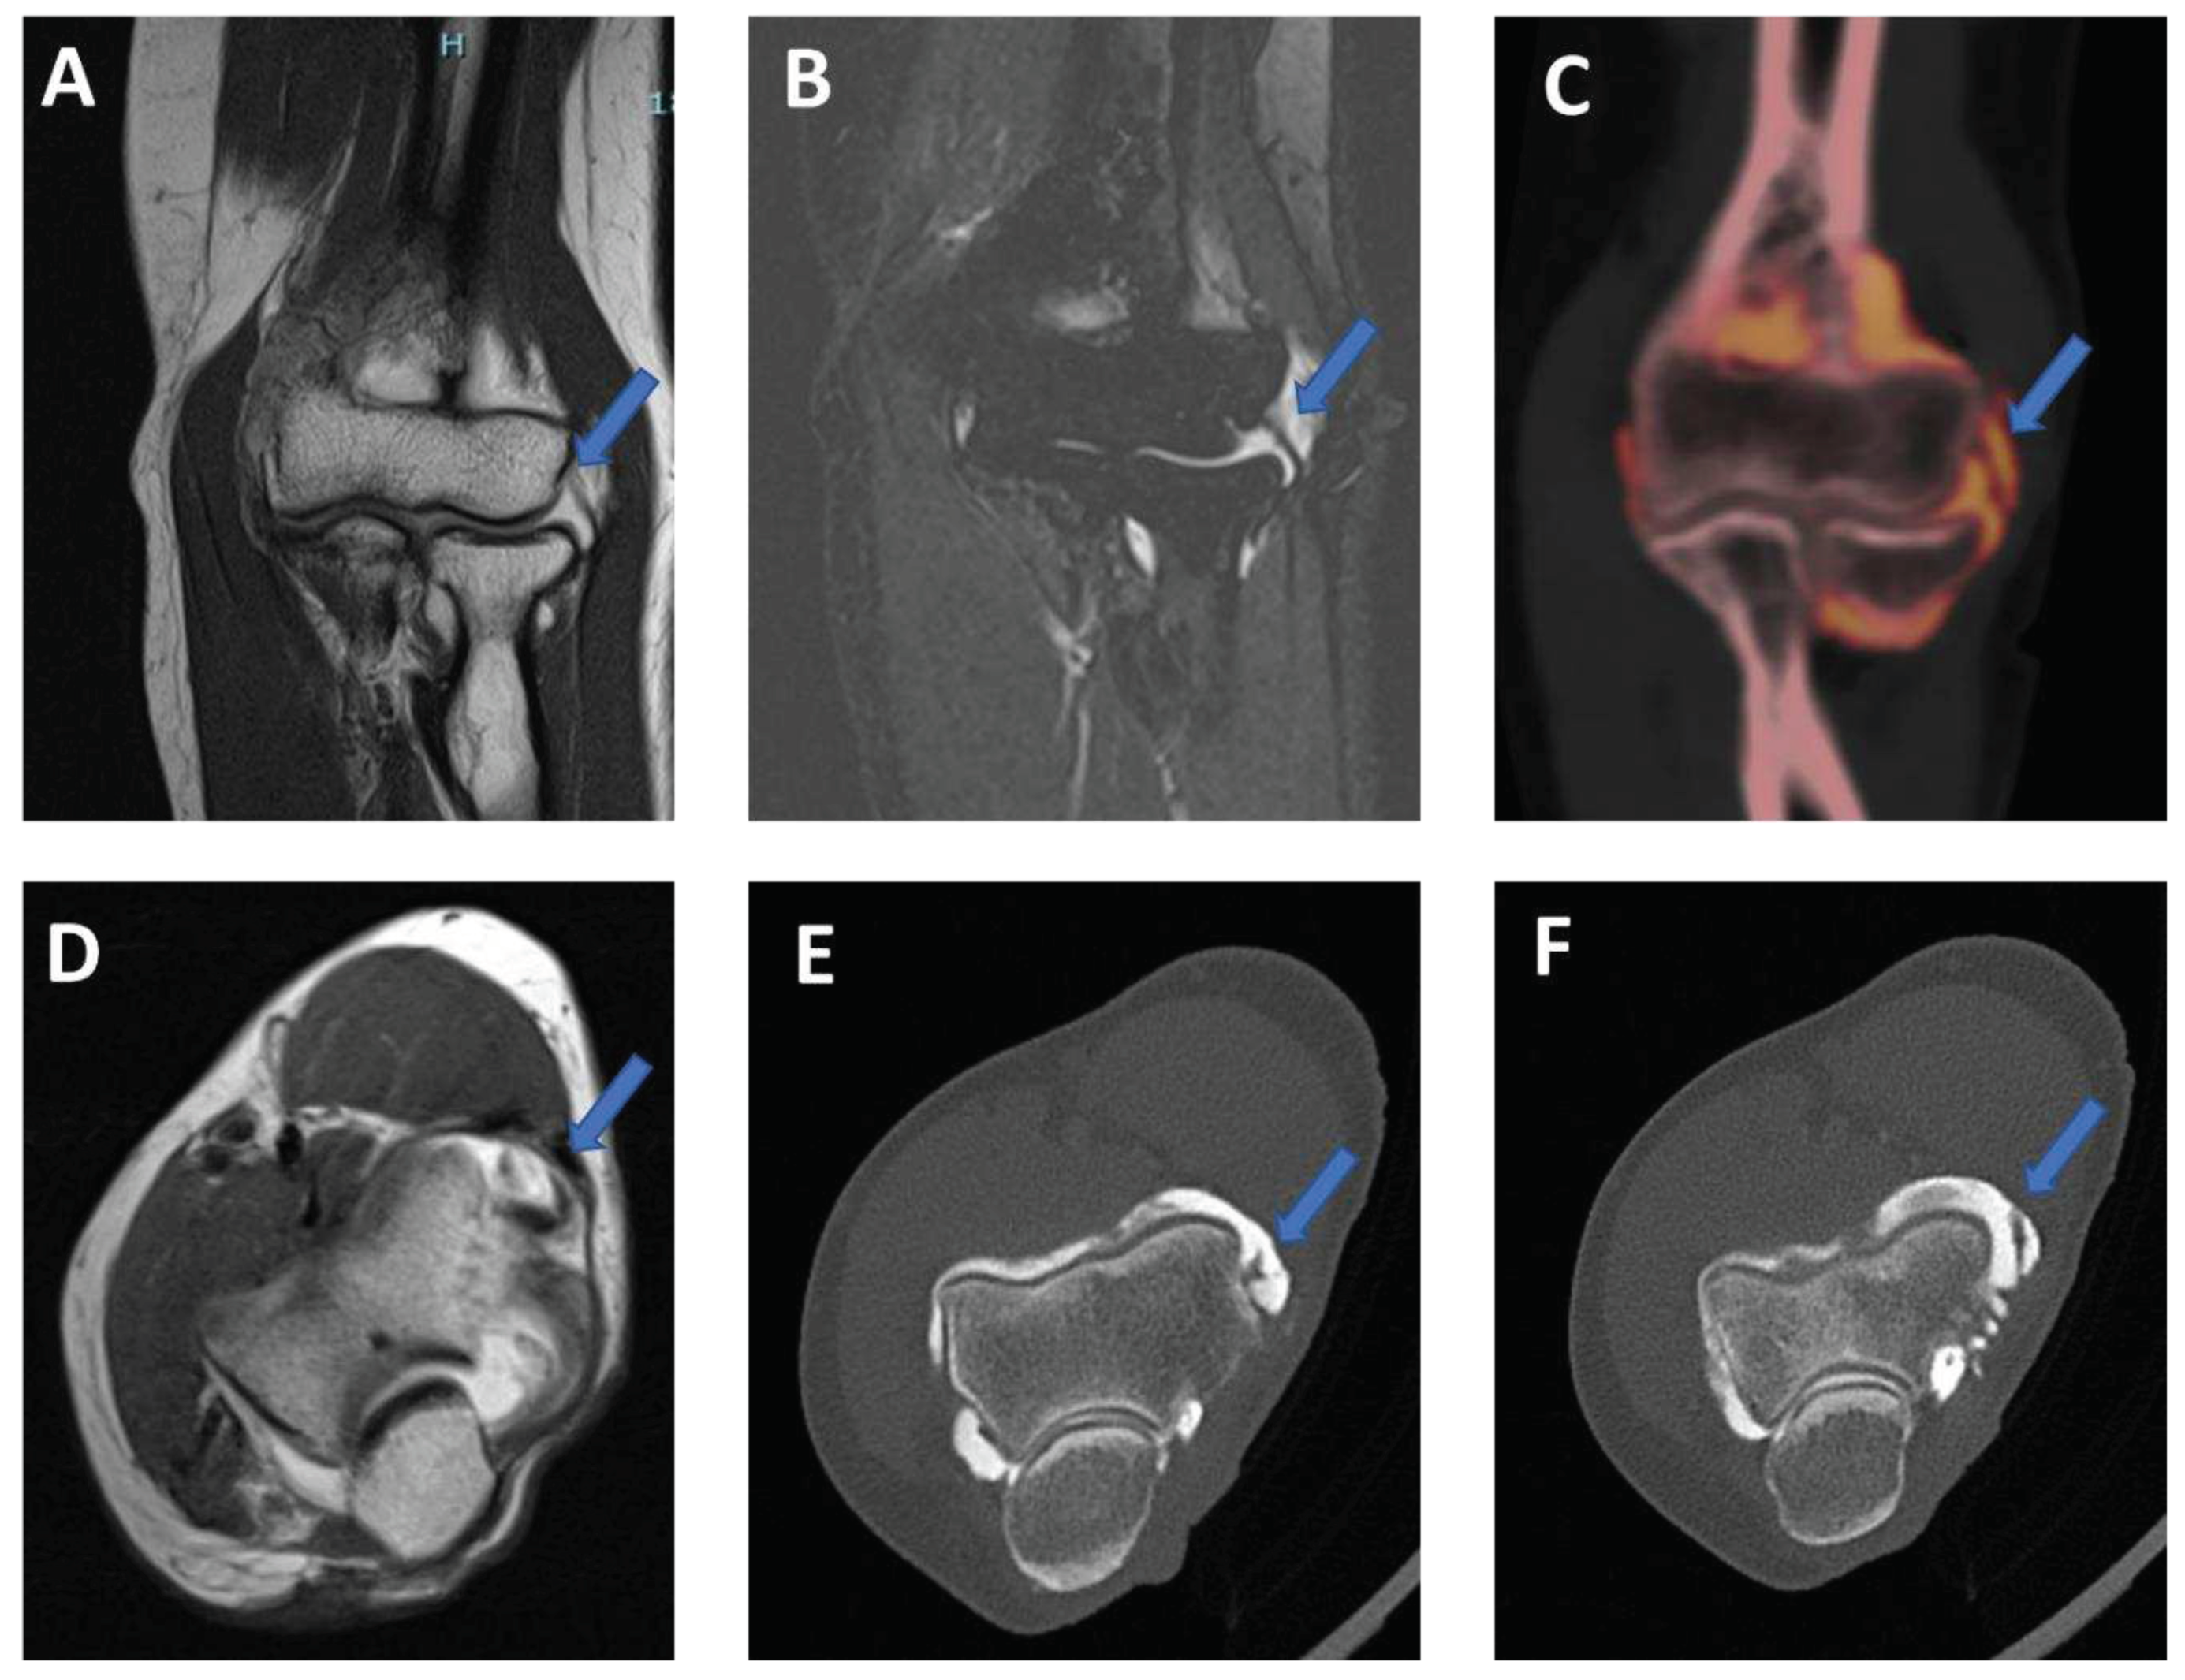
39]. In clinical practice, recent DECT scanner allows achieving 0.3 mm isotropic images, that can be reconstructed on any imaging plane, simulating rotational images acquired on MRI, and allowing to correctly evaluate complex anatomic structures. Also, thanks to the additional advantage of intrinsic high contrast resolution of DECT, these images can help for the visualization of cartilages, intra-articular plicae, and normal anatomy of tiny anatomic structure in small joints as the wrist Figure 7,
Figure 8 and
Figure 9).
Figure 7.
Posterior capsular plica at ankle arthrograms. On 3 mm sagittal STIR and T1 weighted images (A and D) a thin posterior plica (arrow) is depicted. The same plica is nicely depicted on corresponding sagittal 0.3 mm DECT iodine maps images (arrow on B and C). On 3 mm Coronal T1 weighted images (E), partial volume effect may hinder subtle cartilage defects (blue arrowheads). On the corresponding 0.3 mm coronal DECTA, articular cartilages are optimally imaged without any artifact.
Figure 8.
Lateral plica syndrome at elbow arthrography. On the 3 mm coronal STIR and T1 weighted images (A and B) a tiny lateral plica (arrow) is depicted. The same plica is nicely depicted on corresponding reconstructed coronal 0.5 mm DECT iodine map image (arrow). On 3 mm axial T1 weighted image (D), partial volume effect does not allow to correct image the plica (arrow) and articular cartilages. On the corresponding 0.5 mm axial DECTA, the plica (arrow) and the adjacent articular cartilages are beautifully visualized without any artifact.
Figure 9.
High spatial resolution wrist anatomy at DECTA. On 0.4 mm coronal DECTA iodine map images (A-C) triangular fibrocartilage complex (arrowhead) and scapho-lunate ligament (arrow) can be nicely depicted.
Figure 9.
High spatial resolution wrist anatomy at DECTA. On 0.4 mm coronal DECTA iodine map images (A-C) triangular fibrocartilage complex (arrowhead) and scapho-lunate ligament (arrow) can be nicely depicted.
Tendon and ligaments
DECT intrinsic high contrast can be used for the evaluation of collagenous structures. Using collagen postprocessing techniques may increase diagnostic confidence in assessing disc bulging, tendon and ligaments tears [
9].
In subjects with subacute to chronic traumatic ACL disruption confirmed by MR imaging, receiver operating characteristic curve analysis of DECT performance showed that sagittal oblique images with dual-energy bone removal, soft tissue windowing, and single-energy bone removal were most accurate, with area under the curve (AUC) of 0.95, 0.94, and 0.93, respectively (35). DECTA has shown high diagnostic accuracy values in depicting glenoid labral and rotator cuff tears in the shoulder [
5]. DECT is particularly well suited to the assessment of traumatic joint injuries. There is less beam hardening artifact in the knees and ankles when compared to the shoulders or pelvis, and the marrow spaces are large when compared to the smaller peripheral bones (36). Also typical pattern of BME around the joints can assist the radiologist in determining the integrity of the ligaments, whose assessment is enhanced by collagen imaging (36). Visualization of the collateral ligaments and menisci is also enhanced using DECT collagen mapping techniques. Collagen mapping is also applicable in other joints, including the wrists and ankles. This is particularly useful in the assessment of displaced fractures where tendon entrapment will alter orthopedic surgical management (36).
However, to the best of our knowledge, there are no data available on human subjects regarding the accuracy of DECT arthrography in depicting tendon or ligament tears in other joints.
Conclusions
Arthrography represents a complex exam during clinical practice, often employed for pre-operative assessment. MRA represents the most reliable imaging tool, for its intrinsic high contrast resolution for soft tissue imaging. Standard CTA represents a valid alternative exam, being a fast and cheap exam, with high spatial resolution concerning bone imaging. However, several DECT applications can be used, in clinical practice, to increase the contrast in soft tissue and to reduce the gap with MRA. In this setting, CT arthrograms should always be acquired and reconstructed in dual-energy mode, allowing to improve CTA diagnostic accuracy.
Disclosure
The authors declare that they have no conflict of interest.
Ethical approval
"all procedures performed in studies involving human participants were in accordance with the ethical standard of the institutional and/or national research committee and with the 1964 Helsinki declaration and its later amendments or comparable ethical standard.
Informed consent was obtained by all patients enrolled for this prospective study.
References
- Roy JS, Braën C, Leblond J, Desmeules F, Dionne CE, MacDermid JC, Bureau NJ, Frémont P. Diagnostic accuracy of ultrasonography, MRI and MR arthrography in the characterisation of rotator cuff disorders: A systematic review and meta-analysis. Br J Sports Med. 2015 Oct;49(20):1316-28. Epub 2015 Feb 11. PMID: 25677796; PMCID: PMC4621376. [CrossRef]
- Sahin G, Demirtaş M. An overview of MR arthrography with emphasis on the current technique and applicational hints and tips. Eur J Radiol. 2006 Jun;58(3):416-30. Epub 2006 Feb 7. PMID: 16464555. [CrossRef] [PubMed]
- Chung CB, Corrente L, Resnick D. MR arthrography of the shoulder. Magn Reson Imaging Clin N Am. 2004 Feb;12(1):25-38, v-vi. PMID: 15066591. [CrossRef] [PubMed]
- Foti G, Avanzi P, Mantovani W, Dal Corso F, Demozzi E, Zorzi C, Carbognin G. MR arthrography of the shoulder: Evaluation of isotropic 3D intermediate-weighted FSE and hybrid GRE T1-weighted sequences. Radiol Med. 2017 May;122(5):353-360. Epub 2017 Feb 15. PMID: 28197872. [CrossRef] [PubMed]
- Foti G, Mantovani W, Catania M, Avanzi P, Caia S, Zorzi C, Carbognin G. Evaluation of glenoid labral tears: Comparison between dual-energy CT arthrography and MR arthrography of the shoulder. Radiol Med. 2020 Jan;125(1):39-47. Epub 2019 Sep 20. PMID: 31541346. [CrossRef] [PubMed]
- Kassarjian A. Hip MR arthrography and femoroacetabular impingement. Semin Musculoskelet Radiol. 2006 Sep;10(3):208-19. PMID: 17195129. [CrossRef] [PubMed]
- Kramer J, Recht MP. MR arthrography of the lower extremity. Radiol Clin North Am. 2002 Sep;40(5):1121-32. PMID: 12462472. [CrossRef] [PubMed]
- Cerezal L, Abascal F, García-Valtuille R, Del Piñal F. Wrist MR arthrography: How, why, when. Radiol Clin North Am. 2005 Jul;43(4):709-31, viii. PMID: 15893533. [CrossRef] [PubMed]
- Wong WD, Shah S, Murray N, Walstra F, Khosa F, Nicolaou S. Advanced Musculoskeletal Applications of Dual-Energy Computed Tomography. Radiol Clin North Am. 2018 Jul;56(4):587-600. PMID: 29936949. [CrossRef] [PubMed]
- Stern C, Graf DN, Bouaicha S, Wieser K, Rosskopf AB, Sutter R. Virtual non-contrast images calculated from dual-energy CT shoulder arthrography improve the detection of intraarticular loose bodies. Skeletal Radiol. 2022 Aug;51(8):1639-1647. Epub 2022 Feb 11. PMID: 35147726; PMCID: PMC9197803. [CrossRef]
- Gamala M, Jacobs JWG, van Laar JM. The diagnostic performance of dual energy CT for diagnosing gout: A systematic literature review and meta-analysis. Rheumatology (Oxford). 2019. [CrossRef]
- Suh CH, Yun SJ, Jin W, Lee SH, Park SY, Ryu CW. Diagnostic performance of dual-energy CT for the detection of bone marrow oedema: A systematic review and meta-analysis. Eur Radiol. 18;28:4182–94. [CrossRef]
- Bamberg F, Dierks A, Nikolaou K, Reiser MF, Becker CR, Johnson TR. Metal artifact reduction by dual energy computed tomography using monoenergetic extrapolation. Eur Radiol. 2011;21:1424–9. [CrossRef]
- Foti G, Serra G, Iacono V, Marocco S, Bertoli G, Gori S, Zorzi C. Identification of Non-Traumatic Bone Marrow Oedema: The Pearls and Pitfalls of Dual-Energy CT (DECT). Tomography. 2021 Aug 26;7(3):387-396. PMID: 34449751; PMCID: PMC8396255. [CrossRef]
- Foti G, Serra G, Iacono V, Zorzi C. Identification of Traumatic Bone Marrow Oedema: The Pearls and Pitfalls of Dual-Energy CT (DECT). Tomography. 2021 Sep 3;7(3):424-433. PMID: 34564299; PMCID: PMC8482263. [CrossRef]
- Foti G, Fighera A, Campacci A, Natali S, Guerriero M, Zorzi C, Carbognin G. Diagnostic Performance of Dual-Energy CT for Detecting Painful Hip Prosthesis Loosening. Radiology. 2021 Sep;300(3):641-649. Epub 2021 Jul 6. PMID: 34227883. [CrossRef] [PubMed]
- Hamid S, Nasir MU, So A, Andrews G, Nicolaou S, Qamar SR. Clinical Applications of Dual-Energy CT. Korean J Radiol. 2021 Jun;22(6):970-982. Epub 2021 Apr 1. PMID: 33856133; PMCID: PMC8154785. [CrossRef]
- Agostini A, Borgheresi A, Mari A, Floridi C, Bruno F, Carotti M, Schicchi N, Barile A, Maggi S, Giovagnoni A. Dual-energy CT: Theoretical principles and clinical applications. Radiol Med. 2019 Dec;124(12):1281-1295. Epub 2019 Dec 2. PMID: 31792703. [CrossRef] [PubMed]
- Stern C, Marcon M, Bouaicha S, et al. Dual energy CT arthrography in shoulder instability: Successful iodine removal with virtual non-contrast images and accurate 3D reformats of the glenoid for assessment of bone loss. Skeletal Radiol. 2021. [CrossRef]
- Schmaranzer F, Kheterpal AB, Bredella MA. Best Practices: Hip Femoroacetabular Impingement. AJR Am J Roentgenol. 2021 Mar;216(3):585-598. Epub 2021 Jan 21. PMID: 33474984; PMCID: PMC8116615. [CrossRef]
- Mallinson PI, Coupal TM, McLaughlin PD, Nicolaou S, Munk PL, Ouellette HA. Dual-energy CT for the musculoskeletal system. Radiology. 2016;281:690–707. [CrossRef]
- Zhang LJ, Peng J, Wu SY, et al. Liver virtual non-enhanced CT with dual-source, dual-energy CT: A preliminary study. Eur Radiol. 2010;20:2257–64. [CrossRef]
- Si-Mohamed S, Dupuis N, Tatard-Leitman V, et al. Virtual versus true non-contrast dual-energy CT imaging for the diagnosis of aortic intramural hematoma. Eur Radiol. 2019;29:6762–71. [CrossRef]
- Liang H, Zhou Y, Zheng Q, Yan G, Liao H, Du S, Zhang X, Lv F, Zhang Z, Li YM. Dual-energy CT with virtual monoenergetic images and iodine maps improves tumor conspicuity in patients with pancreatic ductal adenocarcinoma. Insights Imaging. 2022 Sep 24;13(1):153. PMID: 36153376; PMCID: PMC9509509. [CrossRef]
- Foti G, Longo C, D'Onofrio M, Natali S, Piovan G, Oliboni E, Iacono V, Guerriero M, Zorzi C. Dual-Energy CT for Detecting Painful Knee Prosthesis Loosening. Radiology. 2023 Mar;306(3):e211818. Epub 2022 Oct 18. PMID: 36255306. [CrossRef] [PubMed]
- Molwitz I, Leiderer M, McDonough R, Fischer R, Ozga AK, Ozden C, Tahir E, Koehler D, Adam G, Yamamura J. Skeletal muscle fat quantification by dual-energy computed tomography in comparison with 3T MR imaging. Eur Radiol. 2021 Oct;31(10):7529-7539. Epub 2021 Mar 26. PMID: 33770247; PMCID: PMC8452571. [CrossRef]
- Foti G, Faccioli N, Silva R, Oliboni E, Zorzi C, Carbognin G. Bone marrow edema around the hip in non-traumatic pain: Dual-energy CT vs MRI. Eur Radiol. 2020 Jul;30(7):4098-4106. Epub 2020 Mar 12. PMID: 32166490. [CrossRef] [PubMed]
- Wilson MP, Lui K, Nobbee D, Murad MH, McInnes MDF, McGrath TA, Katlariwala P, Low G. Diagnostic accuracy of dual-energy CT for the detection of bone marrow edema in the appendicular skeleton: A systematic review and meta-analysis. Eur Radiol. 2021 Mar;31(3):1558-1568. Epub 2020 Sep 8. PMID: 32901304. [CrossRef] [PubMed]
- Li M, Qu Y, Song B. Meta-analysis of dual-energy computed tomography virtual non-calcium imaging to detect bone marrow edema. Eur J Radiol. 2017 Oct;95:124-129. Epub 2017 Aug 7. PMID: 28987656. [CrossRef] [PubMed]
- Foti G, Mantovani W, Faccioli N, Crivellari G, Romano L, Zorzi C, Carbognin G. Identification of bone marrow edema of the knee: Diagnostic accuracy of dual-energy CT in comparison with MRI. Radiol Med. 2021 Mar;126(3):405-413. Epub 2020 Aug 25. PMID: 32840730. [CrossRef] [PubMed]
- Booz C, Nöske J, Lenga L, Martin SS, Yel I, Eichler K, Gruber-Rouh T, Huizinga N, Albrecht MH, Vogl TJ, Wichmann JL. Color-coded virtual non-calcium dual-energy CT for the depiction of bone marrow edema in patients with acute knee trauma: A multireader diagnostic accuracy study. Eur Radiol. 2020 Jan;30(1):141-150. Epub 2019 Jul 26. PMID: 31350586. [CrossRef] [PubMed]
- Ragab G, Elshahaly M, Bardin T. Gout: An old disease in new perspective - A review. J Adv Res. 2017 Sep;8(5):495-511. Epub 2017 May 10. PMID: 28748116; PMCID: PMC5512152. [CrossRef]
- Fukuda T, Umezawa Y, Asahina A, Nakagawa H, Furuya K, Fukuda K. Dual energy CT iodine map for delineating inflammation of inflammatory arthritis. Eur Radiol. 2017 Dec;27(12):5034-5040. Epub 2017 Jul 3. PMID: 28674965. [CrossRef] [PubMed]
- Foti G, Longo C, Sorgato C, Oliboni ES, Mazzi C, Motta L, Bertoli G, Marocco S. Osteomyelitis of the Lower Limb: Diagnostic Accuracy of Dual-Energy CT versus MRI. Diagnostics (Basel). 2023 Feb 13;13(4):703. PMID: 36832191; PMCID: PMC9955987. [CrossRef]
- Glazebrook KN, Brewerton LJ, Leng S, Carter RE, Rhee PC, Murthy NS, Howe BM, Ringler MD, Dahm DL, Stuart MJ, McCollough CH, Fletcher JG. Case-control study to estimate the performance of dual-energy computed tomography for anterior cruciate ligament tears in patients with history of knee trauma. Skeletal Radiol. 2014 Mar;43(3):297-305. Epub 2013 Dec 14. PMID: 24337491. [CrossRef] [PubMed]
- Hickle J, Walstra F, Duggan P, Ouellette H, Munk P, Mallinson P. Dual-energy CT characterization of winter sports injuries. Br J Radiol. 2020 Feb 1;93(1106):20190620. Epub 2019 Oct 1. PMID: 31573325; PMCID: PMC7055449. [CrossRef]
- Friedman LG, Ulloa SA, Braun DT, Saad HA, Jones MH, Miniaci AA. Glenoid Bone Loss Measurement in Recurrent Shoulder Dislocation: Assessment of Measurement Agreement Between CT and MRI. Orthop J Sports Med. 2014 Sep 15;2(9):2325967114549541. PMID: 26535360; PMCID: PMC4555629. [CrossRef]
- Itoi, E. 'On-track' and 'off-track' shoulder lesions. EFORT Open Rev. 2017 Aug 1;2(8):343-351. PMID: 28932486; PMCID: PMC5590004. [CrossRef]
- Pham N, Raslan O, Strong EB, Boone J, Dublin A, Chen S, Hacein-Bey L. High-Resolution CT Imaging of the Temporal Bone: A Cadaveric Specimen Study. J Neurol Surg B Skull Base. 2022 Jan 31;83(5):470-475. PMID: 36091630; PMCID: PMC9462966. [CrossRef]
|
Disclaimer/Publisher’s Note: The statements, opinions and data contained in all publications are solely those of the individual author(s) and contributor(s) and not of MDPI and/or the editor(s). MDPI and/or the editor(s) disclaim responsibility for any injury to people or property resulting from any ideas, methods, instructions or products referred to in the content. |
© 2023 by the authors. Licensee MDPI, Basel, Switzerland. This article is an open access article distributed under the terms and conditions of the Creative Commons Attribution (CC BY) license (http://creativecommons.org/licenses/by/4.0/).
