0. Introduction
Welding is an indispensable production method that plays a crucial role in both manufacturing and industry. Nowadays, approximately 50% of robots worldwide are utilized for welding purposes. The advent of intelligent welding technology, which is based on welding robots, has emerged as a critical technology in industries such as aerospace, rail transportation, and shipbuilding. By integrating sensors and vision systems, welding robots can achieve real-time monitoring and control of the welding process. Consequently, welding robots not only enable automatic detection and adjustment of welding quality but also facilitate the automation and intelligent control of multiple processes, including welding, shaping, transportation, and inspection. This integration leads to improved productivity and welding quality. Moreover, with the assistance of cloud computing and big data, remote control and intelligent management can be achieved. Therefore, it is essential to conduct in-depth research on the logical relationship among welding factors, including materials, process parameters, and quality, in order to enhance welding performance and achieve high-performance manufacturing.
The welding quality of large thick plate bridge steel of Q345qD, typically used in H-type structures, is significantly affected by the GMAW (Gas Metal Arc Welding) welding process parameters. These parameters play a crucial role in ensuring the safety and durability of bridges. Therefore, when employing welding robots for bridge construction, it is essential to have a clear understanding of the relationship between the welding process parameters and the resulting welding quality.
H-type steel structure has the advantages of simple components, saving labor and materials, which has become an increasingly widely used steel structure type in modern new economic bridge structures, industrial buildings, and power station construction. The production and construction of bridge steel mainly adopt the welding connection mode. Therefore, the performance of the welded joint directly affects the safety and lifespan of the entire steel component building [
1,
2]. The thick steel plate uses multi-pass welding process and GMAW, in which welding process parameters are the main factors affecting welding temperature field and stress-strain field, mainly including welding current, welding voltage and welding speed. The welding process parameters relate to the parameter setting of welding current, welding voltage and welding speed, to avoid uneven heating or excessive residual stress and strain concentration in the welding geometric model. There are many methods to optimize welding parameters, including theoretical analysis, simulation and test. Yi [
3] investigated the influence of electrode pressure, welding speed, tensile and shear strength of seam welding joints in 304 stainless steel and improved the tensile strength to 607.5MPa [
4]. Zhang [
5] researched the single-pass flat plate and multi-pass butt welding models by establishing a BP neural network to optimize the welding process parameters, getting an optimized welding voltage of 30.3V, and a wire feeding speed of 12600mm/min [
6]. Xu [
7] designed a time-optimal algorithm that incorporates dynamic constraints into the welding seam tracking process, improving the mechanical performance and stability of the welding seam tracking process. Wu [
8] investigated the influence of different welding parameters matching on temperature field and joint tensile strength by orthogonal test method. Chang [
9] introduced various new TIG welding technologies at home and abroad, including magnetically controlled TIG welding technology, and elaborated on their characteristics and mechanisms in changing arc characteristics, molten pool flow, etc. Xin [
10] studied the influence of welding process parameters on Q245R steel, and no crack was found in bending test results, which fully meets the relevant technical standards of pressure-bearing equipment [
11]. Aravind [
12] conducted experimental research on cold metal transfer (CMT) welding on Al5083 thin plate. Adopting L9Taguchi orthogonal test design, the welding current (A), welding speed (mm/min) and welding frequency (Hz) are taken as input parameters for CMT welding. The weld quality is studied by measuring reinforcement, weld width (BW), penetration depth (DOP) and heat affected zone width (HAZW). Optimized parameters are found by VIKOR multi-objective optimization method [
13]. Zhou [
14] optimized the process parameters by using numerical simulation technology and orthogonal experiment method for SUS301L stainless steel. With the optimum process parameters, the weld surface is silvery white, continuous and complete, the weld zone is equiaxed and columnar, which meet the experimental results [
15]. Rizvi [
16] focused on optimizing different welding parameters through Taguchi technology, getting an optimum technological parameter of 23V, wire stroke 350IPM and gas flow 15l/min. At present, there is limited research on the welding quality control of thick-plate-bridge steel due to its large structure size, multi-pass welding, complex and diverse process parameters, difficult processing, complex and diverse metal chemical elements in the weld structure, and uneven thermal characteristics of materials simulated by numerical simulation.
Therefore, this study focuses on Q345qD, a large-scale thick-plate-bridge steel, and utilizes ABAQUS simulation software, the thermal-elastic-plastic finite element method, and FORTRAN to develop a welding simulation program. The objective is to optimize and simulate the GMAW process parameters for bridge steel, identify the optimal welding process parameters, and investigate their effects. By optimizing the welding process parameters, the study aims to enhance the quality of welded joints and prevent welding defects.1. Welding process parameters
1. Welding process parameters
1.1. Definition on welding process parameters
In the welding process of multi-pass welds to large thick plates, welding process parameters are one of the main factors affecting the microstructure and properties of weld joints. Using Q345qD steel, we studied the influence of GMAW welding process parameters by thermal-elastic-plastic finite element method. The welding geometric model size is 300×250×20mm, and the groove shape is an “X” with an angle of 60°. According to the standards of Code for Design of Steel Structures of Railway Bridges (TB10091-2017) and Symbol Representation of Welds (CB/T324-2008), the welds are set to be four layers and four passes, which are welded by gas shielded welding and submerged arc welding. In actual welding, because of the combination of weld and base metal, it is difficult to define the contour of weld in simulation, so the simulation model is simplified to keep the welding sequence and welding boundary conditions unchanged during the loading process of welding heat source.
1.2. Methodology
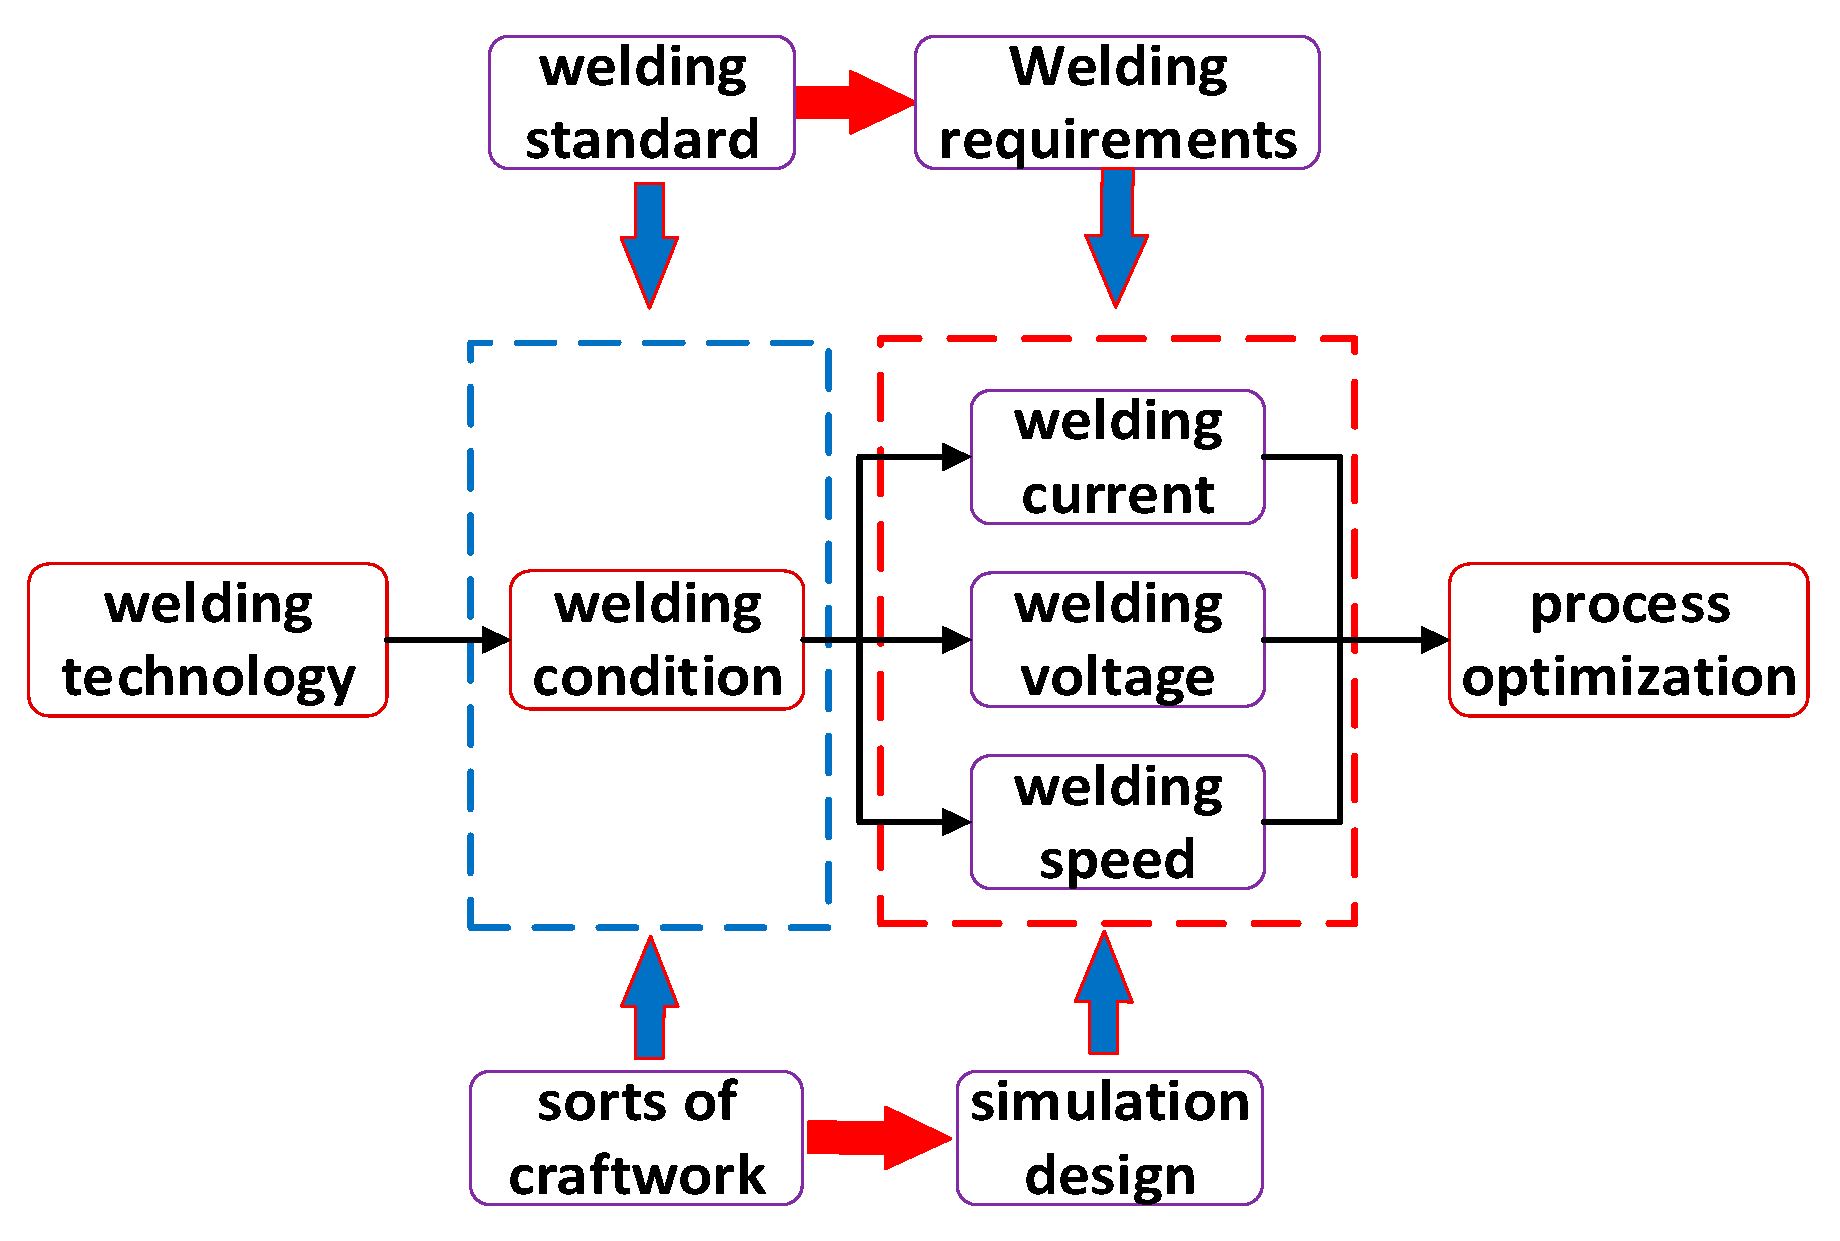
Aiming at the GMAW welding method of Q345qD thick-plate-bridge steel, the scheme design and numerical simulation analysis of welding process parameters are carried out. In the actual welding process, the parameters include current, voltage, and speed, which vary depending on the welding methods and objects. During the welding simulation, the welding process parameters play a crucial role in determining the welding heat and weld formation. Therefore, it is essential to analyze and optimize the welding process parameters for design, as this significantly impacts the welding quality. The study and process flow are shown in
Figure 1.
Combining the optimization scheme of welding process parameter design with research into simulation thermal-elastic-plastic theory, we adopt ABAQUS software to carry out the optimization simulation operation of welding process parameters. Because the strain field and stress field are generated by the thermal-mechanical coupling between the temperature field and the material itself, only the influence law of each welding process parameter on the welding temperature field is analyzed here. A complete thermal-mechanical coupling of the temperature field with different welding process parameters of a single weld is carried out, and the welding process is accurately simulated. The influence of welding process parameters on the welding process is explored, and the optimal welding process parameter scheme is obtained.
1.3. Specification of parameters
This simulation experiment discusses the simulation of multi-pass welding of large thick plates. The model size is 300×250×20mm, adopting an X-shaped groove, and the thick plate pass is divided into four welds, which are aligned forward and backward. CO2 gas shielded welding is used for backing submerged arc welding. The temperature range of the welding pass is 135~165℃, the allowable deformation error is 1~2mm, and the cooling speed is 35 ~ 60℃/s. Referring to the welding Code for Steel Structures (GB/T50661-2011) and Welding Wire of Carbon Steel, Low Alloy Steel for Gas Shielded Electric Welding (GB/T8110-2008), the welding current, welding voltage and welding speed are proposed, as shown in
Table 1.
2. Numerical analysis
2.1. Thermal-mechanical coupling
Welding process is a coupling way to heat transfer, electromagnetism and thermodynamics, which connects metals or other thermoplastic materials. It is complex and changeable, which contains complex thermodynamic problems. The thermodynamic problems directly affect the composition and distribution of welding microstructure. According to the classical thermodynamic formula, the thermodynamic heat transfer in welding process can be divided into three forms: heat conduction, heat convection and heat radiation [
17]. In thermal-elastoplastic analysis, the assumptions are made as follows [
17].
1. Material yield follows Mises yield criterion.
2. Elastic strain and plastic strain of materials can be separated from temperature strain.
3. The mechanical properties of materials depend on temperature changes.
4. The behavior of material in plastic zone after yielding follows plastic flow criterion and strengthening criterion.
5. Based on the small-time increment, the mechanical properties, stress and strain of materials show linear changes.
In the welding process, with the continuous movement of welding heat source, the welding material and base metal will fuse with each other, then generate heat during phase transformation. The temperature at each point in the welding process can be expressed as equation (1).
where,
T refers to the instantaneous temperature at any point in the welding process (k),
is the coordinate of a certain point,
t is the time (s).
Therefore, for the nonlinear transient heat conduction problem, its temperature control equation can be expressed as follows.
where,
is the heat flow in the object is expressed,
expressed as welding material density,
c is the welding material heat capacity,
,
,
represent the heat transfer coefficient of welding materials in three-dimensional coordinates,
T it is expressed as differential equation of transient welding temperature field.
2.2. Welding heat source
The heat source model is a characteristic equation for simulating the heat distribution of welding heat input in the weld direction, which represents the range and form of heat distribution. The heat source model has a great influence on the simulation accuracy of the welding temperature field and stress-strain field near the heat source [
18].
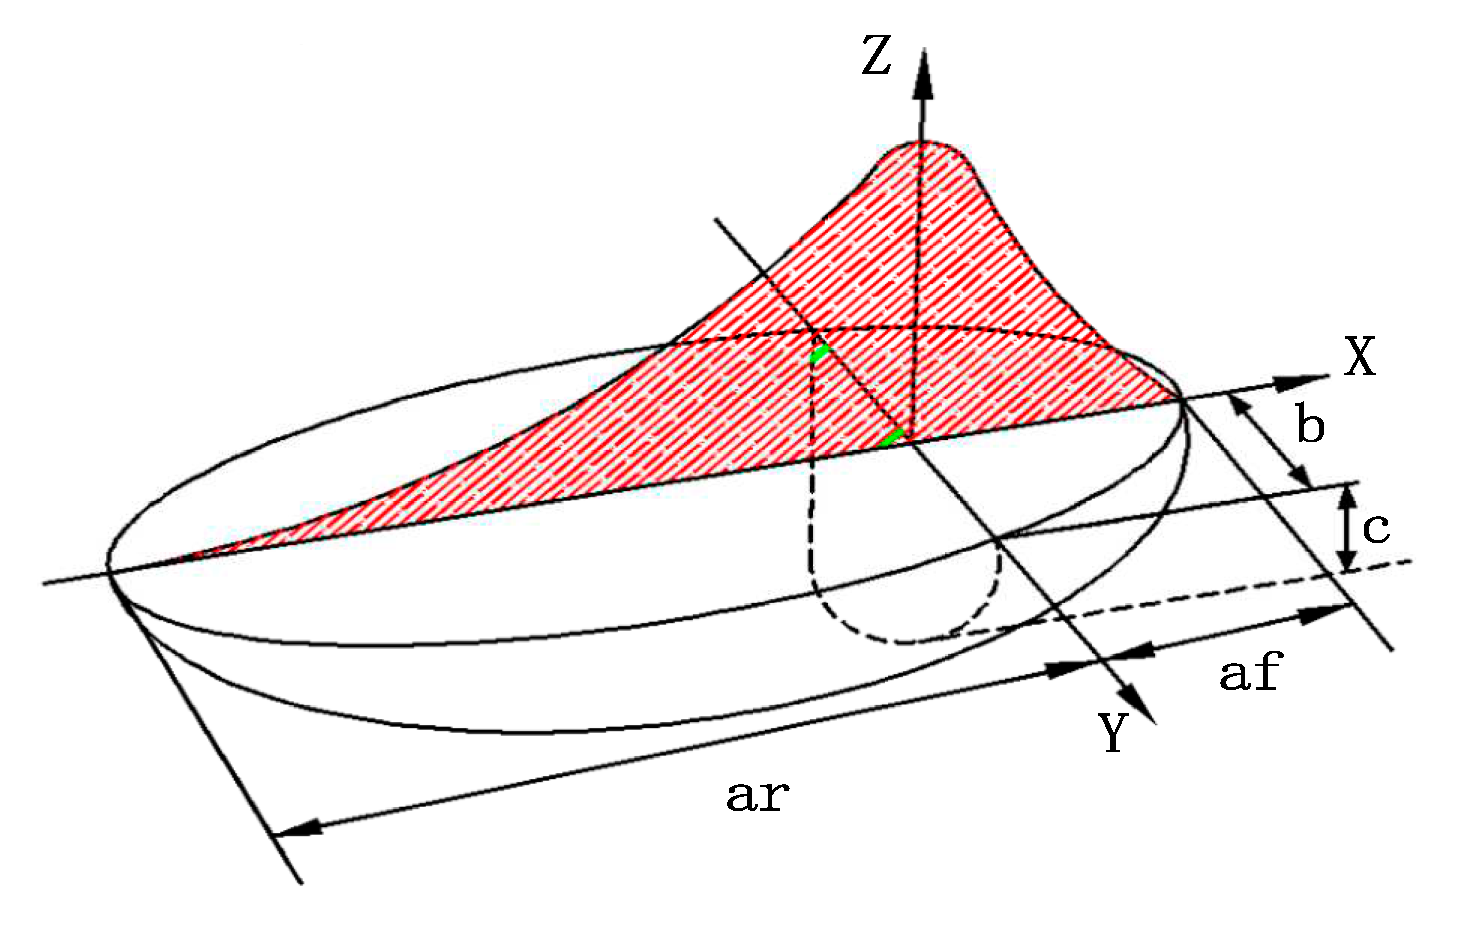
The development of welding heat sources has changed from plane space to three-dimensional space, in which point heat sources and surface heat sources are often used in plane simulation operations. At present, the bulk heat source model is mostly used for welding simulation of thick plates, considering the influence of weld penetration, weld width, heat transfer distribution and electric strength. The double ellipsoid heat source model not only accurately simulates the temperature range in the first half of the actual arc loading process which is higher than the second half, but also accurately simulates the penetration effect of arc on weld, which satisfies the accurate simulation of the GMAW welding pool, shown in
Figure 2.
Heat density diffusion function of first quarter ellipsoid:
Heat density diffusion function of tail quarter ellipsoid:
where,
-represents the welding heat input, and
is the welding heat source efficiency.
,
respectively represent different proportional functions of heat and heat of the front and rear ellipsoids, and
. ,
represents the inner diameter parameter of double ellipsoid. b represents the melting width dimension of double ellipsoid. c represents the penetration size of double ellipsoid.
,
,
b, and
c -represent the shape and size parameters of ellipsoids respectively, and are independently selected according to different weld sizes and welding process parameters, which fully considers the difference of heat flow energy distribution of heat source models.
2.3. Secondary development of heat source model subroutine
Using FORTRAN language for secondary development of the welding subroutine in ABAQUS, which simulates the loading process of the welding heat source, the size of the welding heat source, weld penetration, weld width and loading direction of the welding heat source are all set in subroutine. The secondary development of the heat source SUBROUTINE adopts the subroutine in FORTRAN language, where the subroutine starts at “subroutine”, and uses the end statement. According to four welds, different welding process parameters are set in subprogram, the relationship among heat flow, TIME and position is formed by using total time control method.
2.4. Numerical modelling
Adopting Q345qD bridge steel, which is a low alloy high strength steel with carbon content of 0.16%. It has high strength and toughness, so it can bear the load and impact of rolling stock, with good fatigue resistance, low temperature toughness and atmospheric corrosion resistance. It is a steel specially used for viaducts or highway bridges. Its chemical composition is shown in
Table 2.
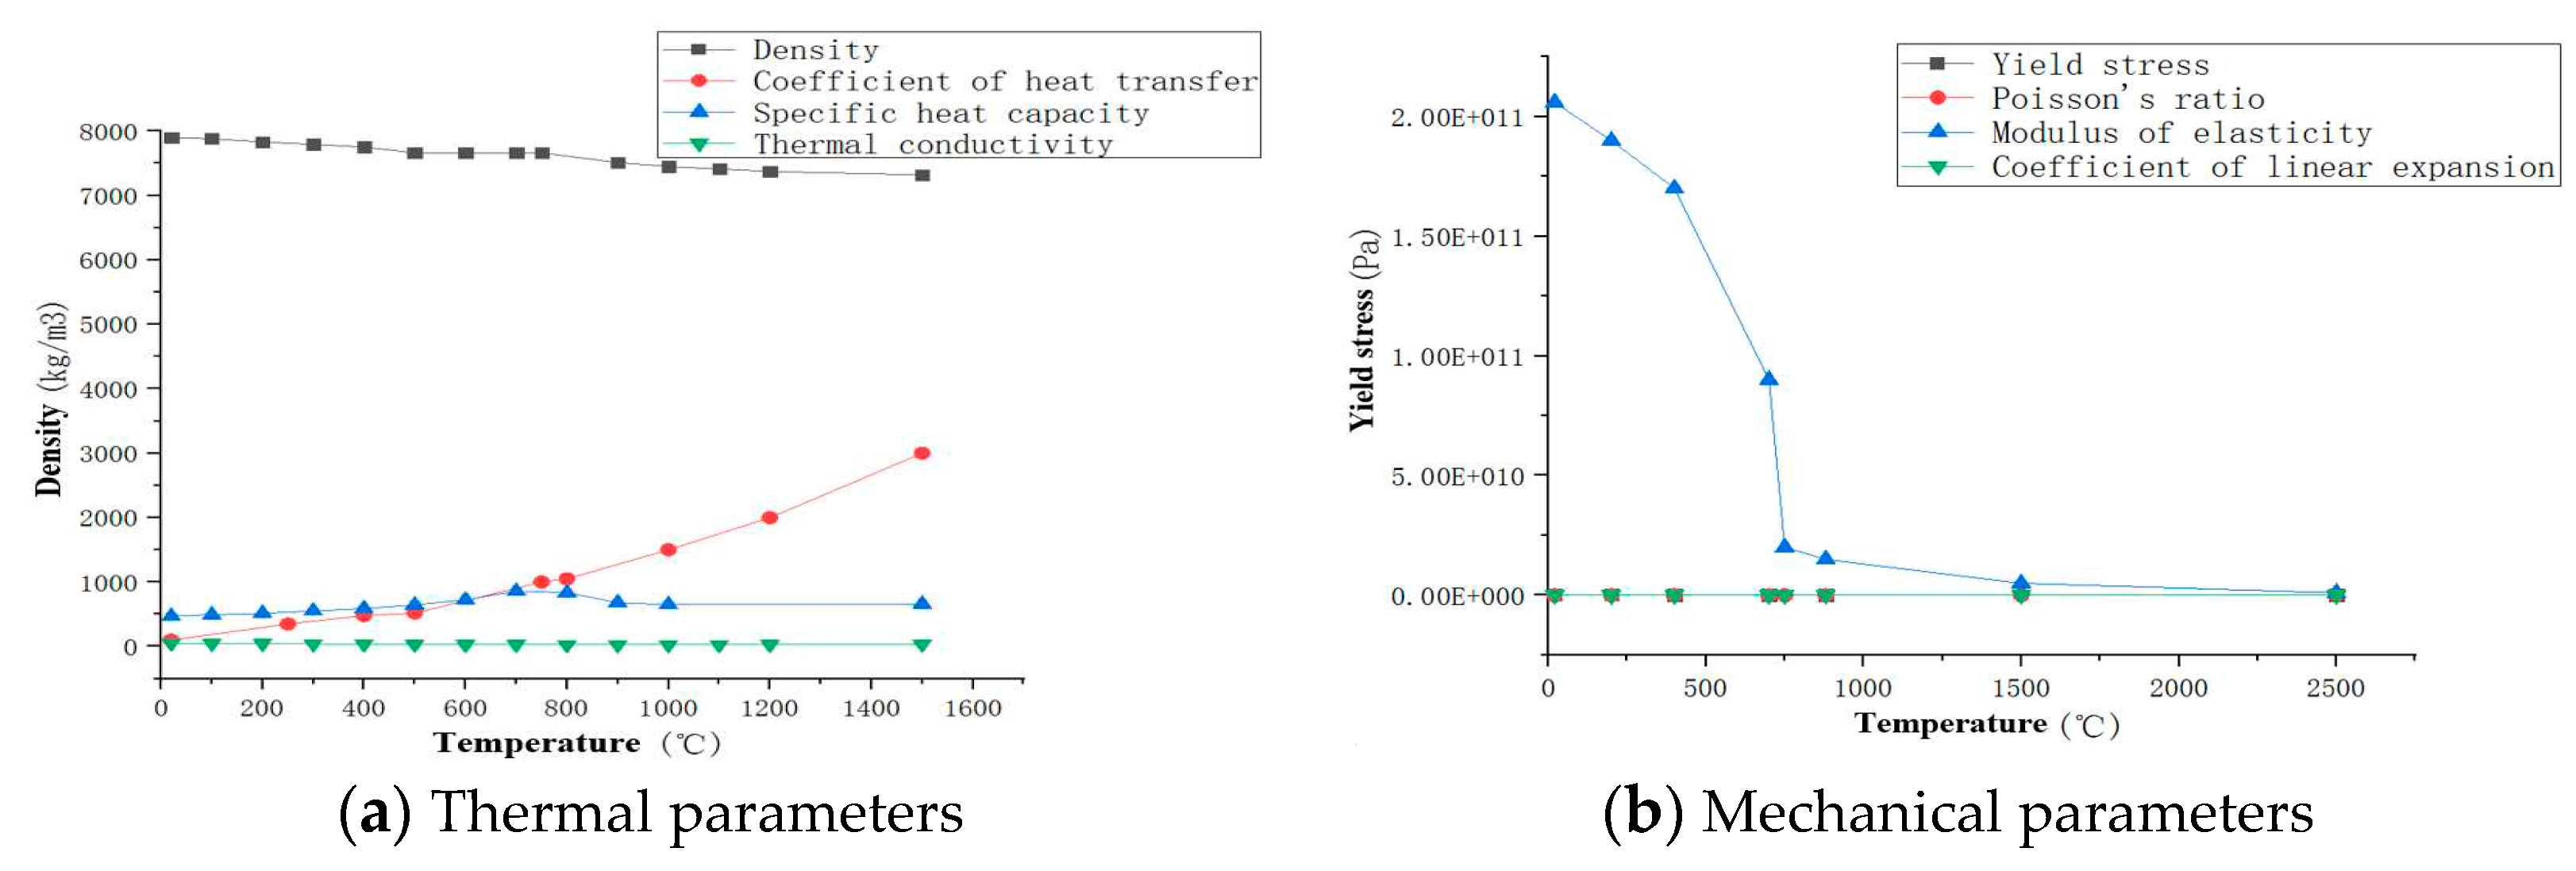
The main chemical composition of Q345qD steel is manganese and silicon, with impact absorption energy of 187KV2/J, yield strength of 397MPa and tensile strength of 533MPa. The welding temperature field and stress-strain field are simulated by the method of butt welding, because the thermal physical parameters of Q345qD bridge steel are distributed differently under different high temperature conditions. The absolute zero of numerical simulation is -273.15℃, the Stephen-Boltzmann constant is 5.67×10
-8, the latent heat of the material is 256400 J/kg, the radiation heat transfer coefficient is 0.85 and the ambient temperature is 20℃. Other characteristic parameters of the material, such as density, specific heat capacity, thermal conductivity, Poisson’s ratio, yield stress, elastic modulus and linear expansion coefficient, are shown in
Figure 3.
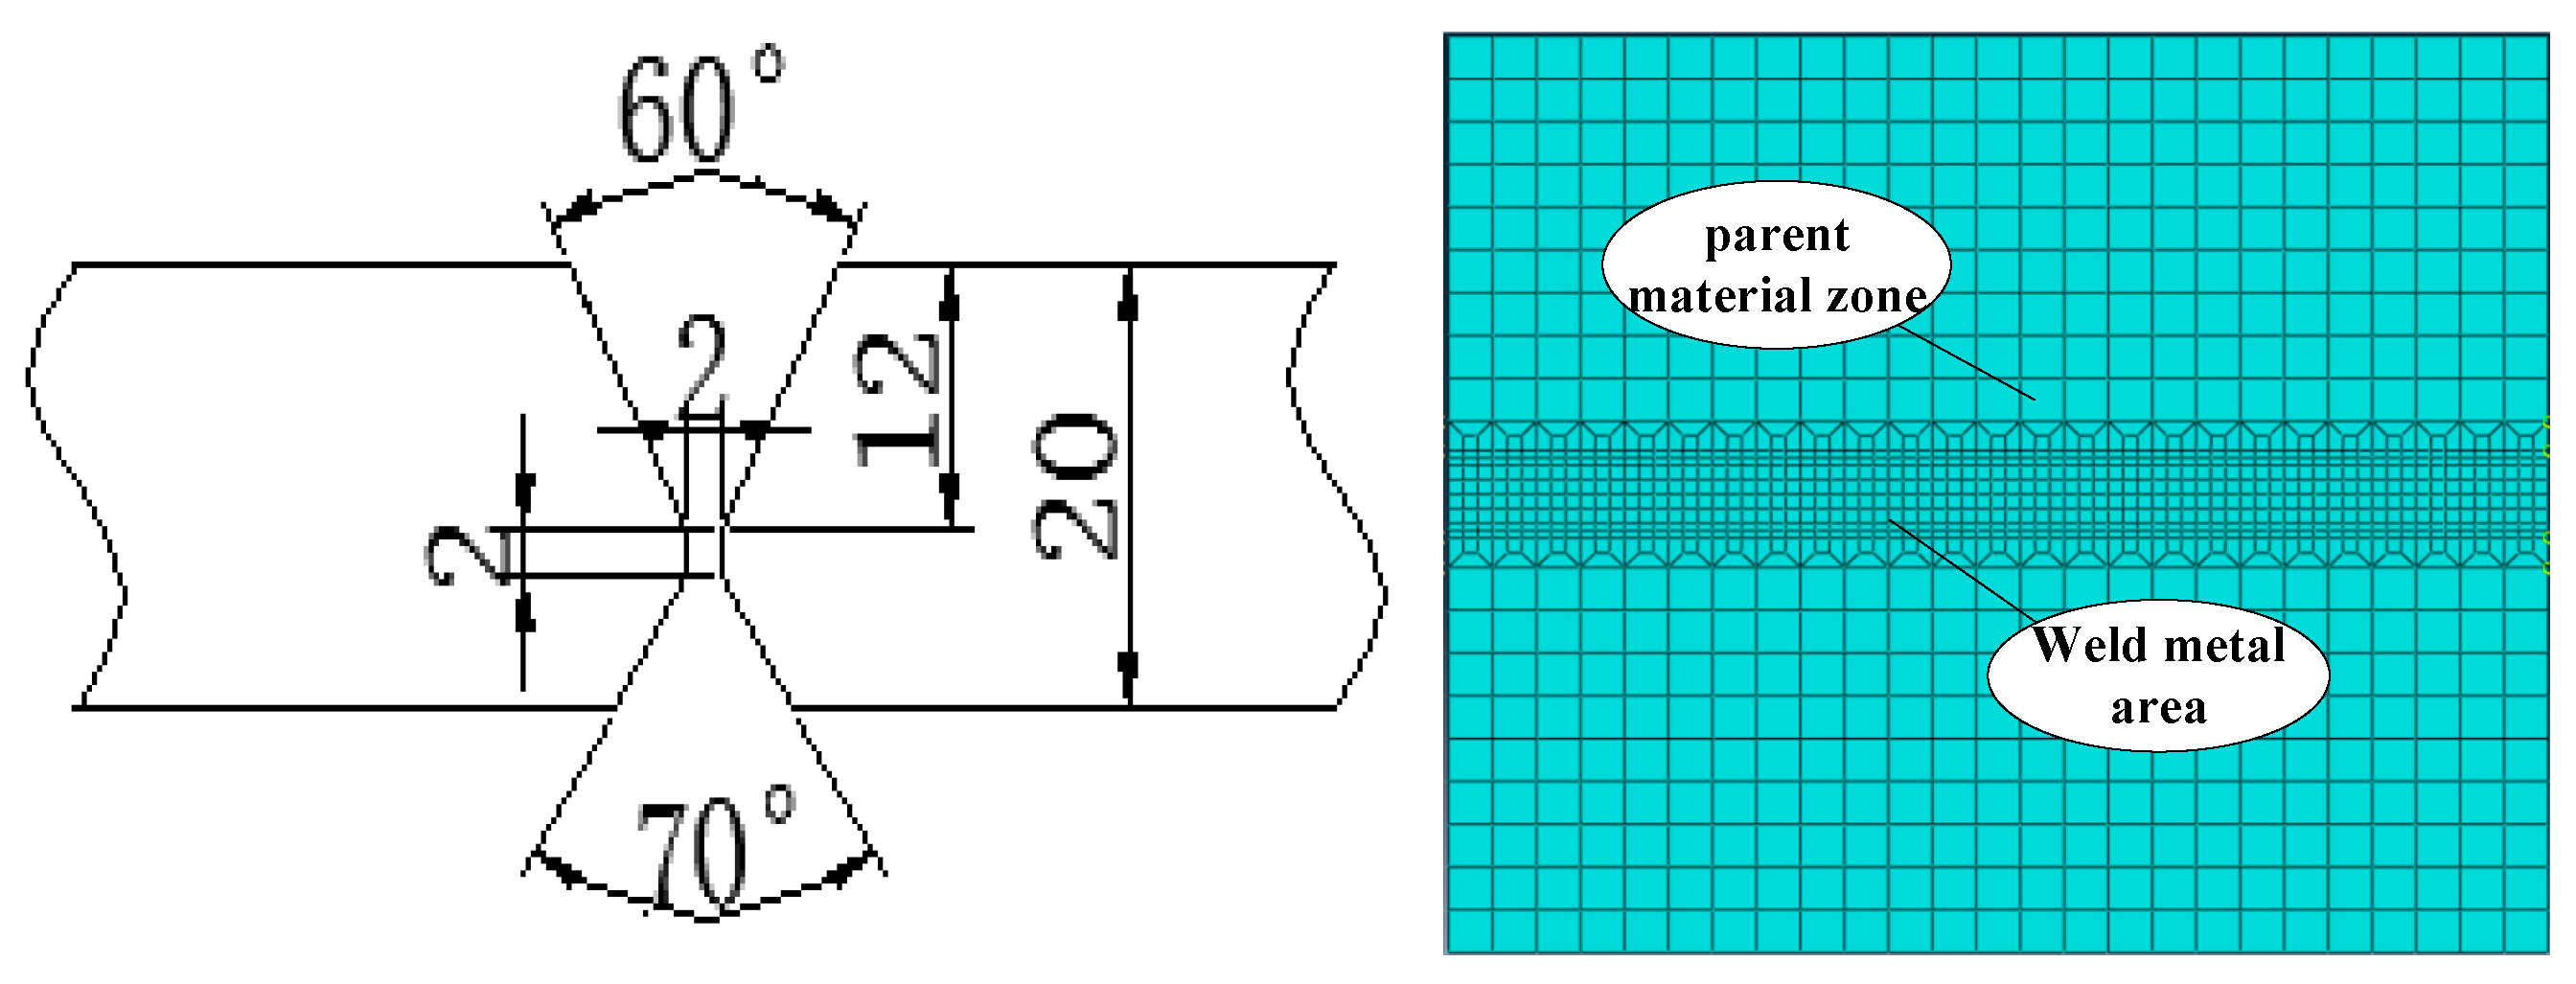
Considering the size of steel and the technological characteristics brought by multi-pass welding, using ABAQUS to establish a flat butt multi-pass welding model and conduct simulation research. Assuming the model is an ideal elastic-plastic rigid body, the material is Q345qD steel, the size is 300×250×20mm, and the weld seam and base metal are established by zones. X-shaped groove is adopted for groove, whose size and weld bead number are shown in
Figure 4.
2.5. Boundary conditions
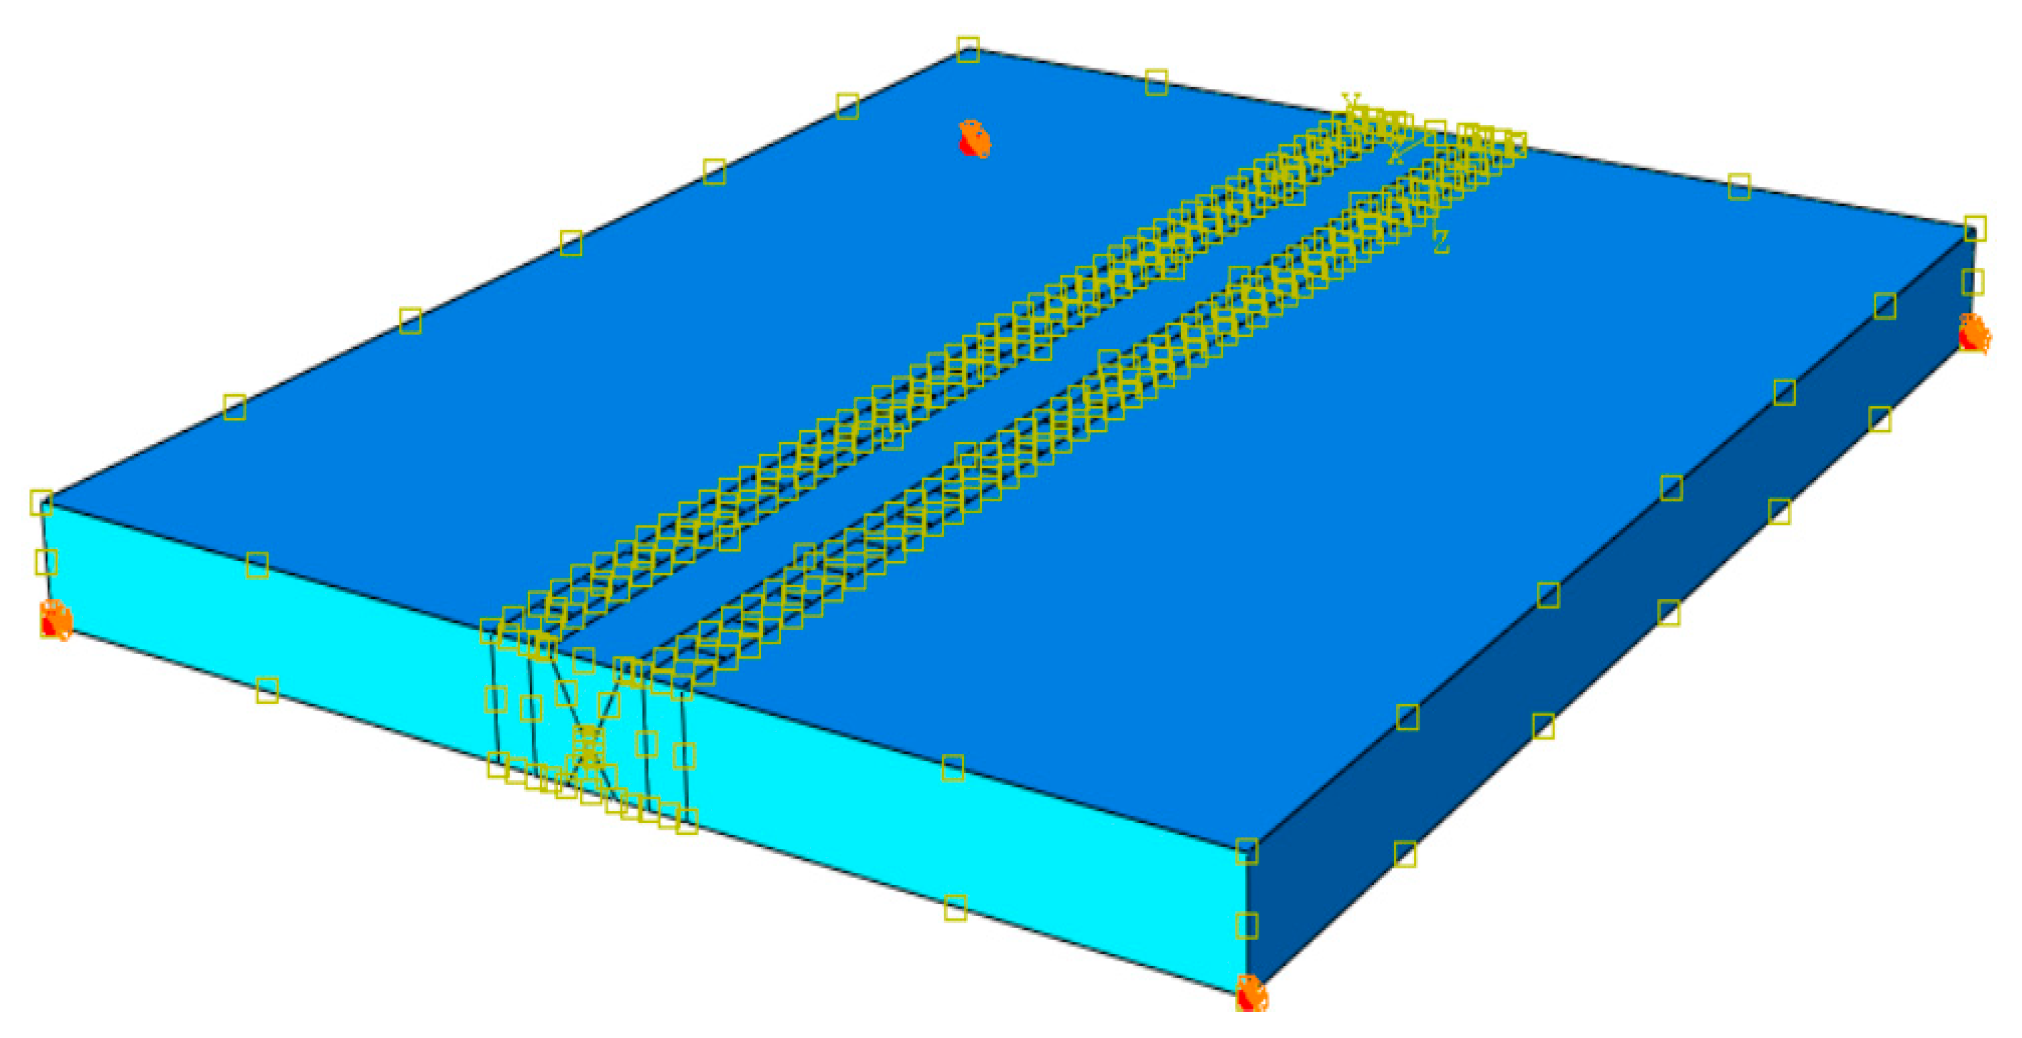
Based on the actual welding process, heat conduction is the main way inside the welding material, while convection heat transfer and radiation heat transfer are the main ways outside. Therefore, the environmental temperature is set at 20℃, which accurately simulates the environmental boundary conditions of the welding model. Restrict its motion boundary and consider its gravity influence, so the degree of freedom is constrained in three directions to the four vertices in the bottom surface for multi-pass welding of flat plates, as shown in
Figure 5.
3. Simulation results.
3.1. Effect of welding current
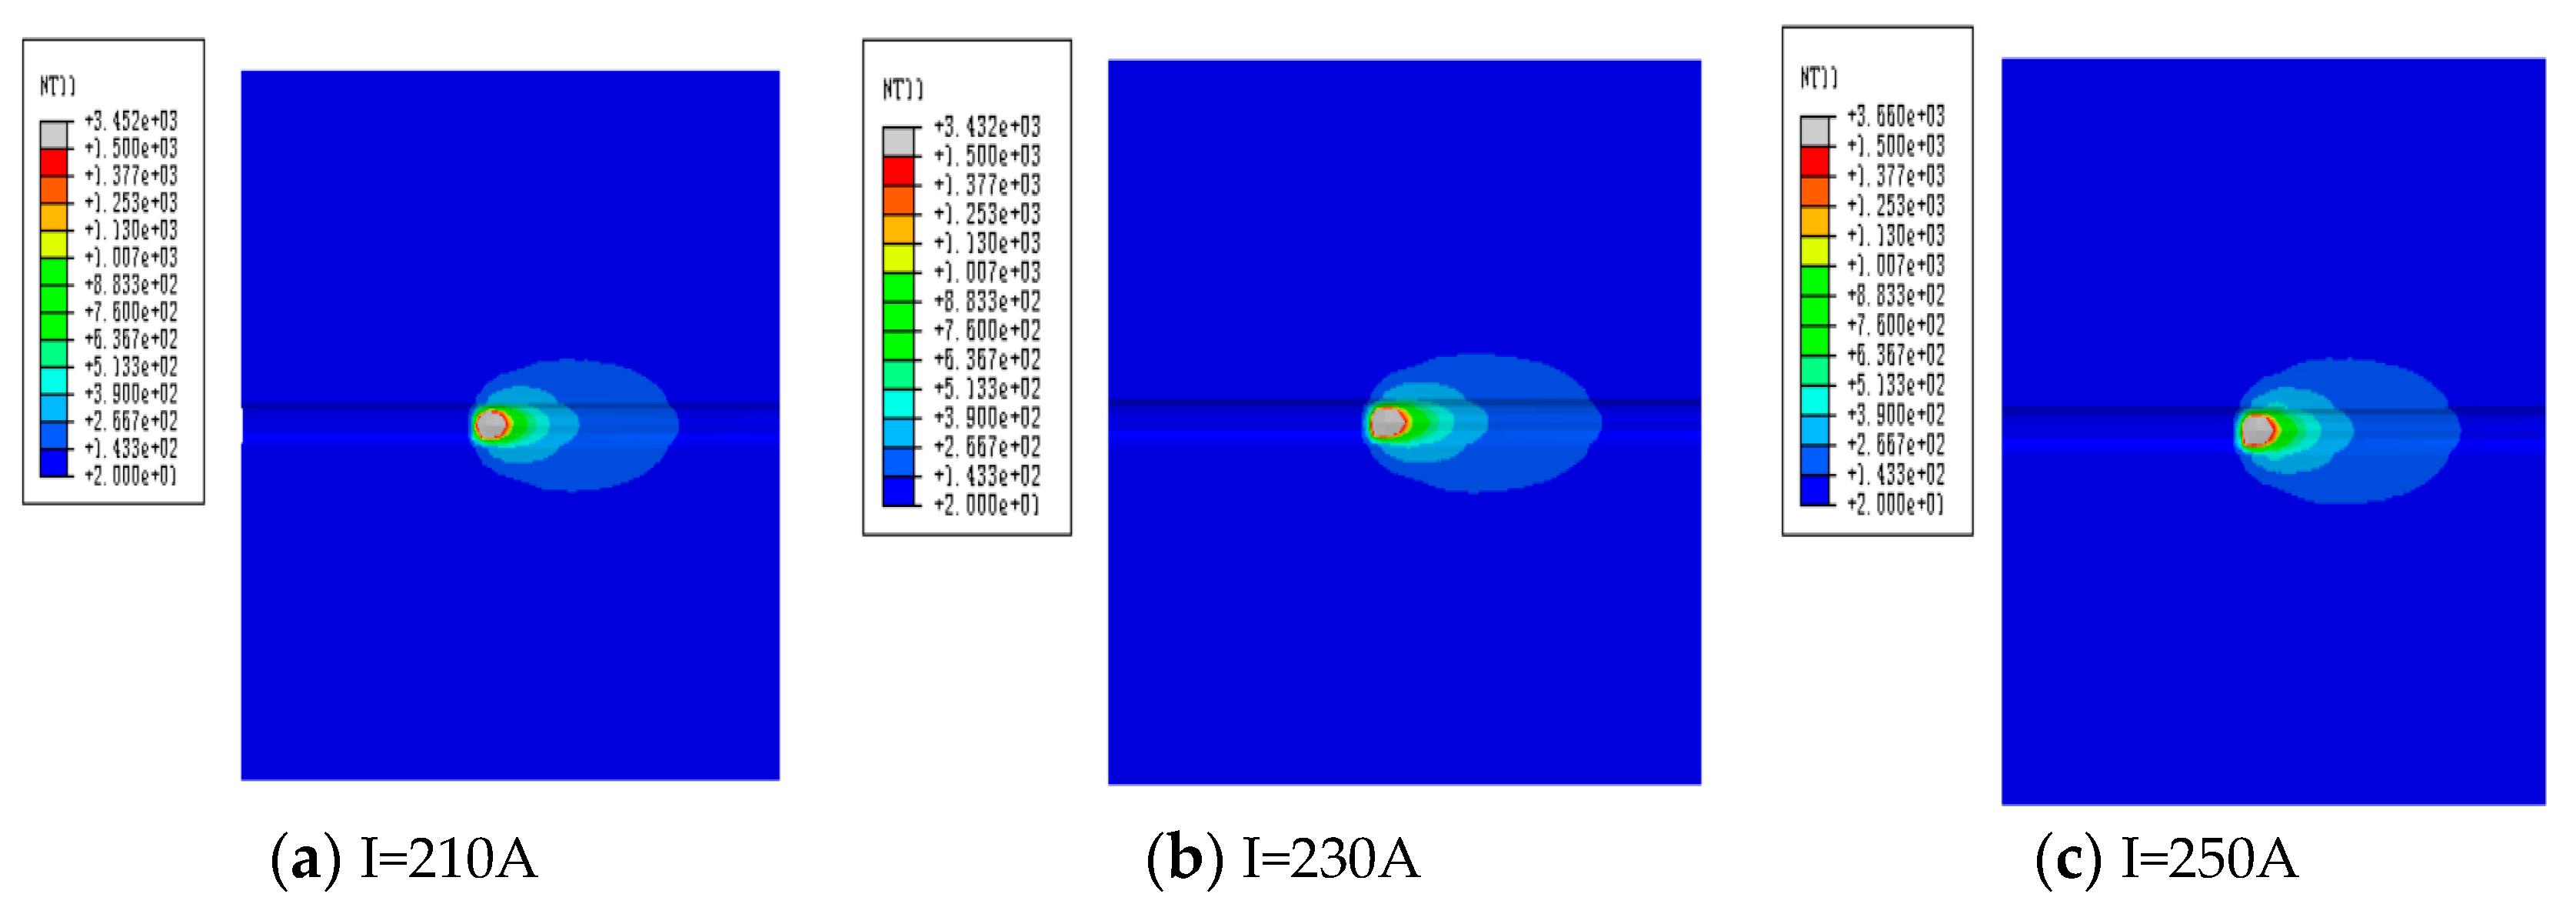
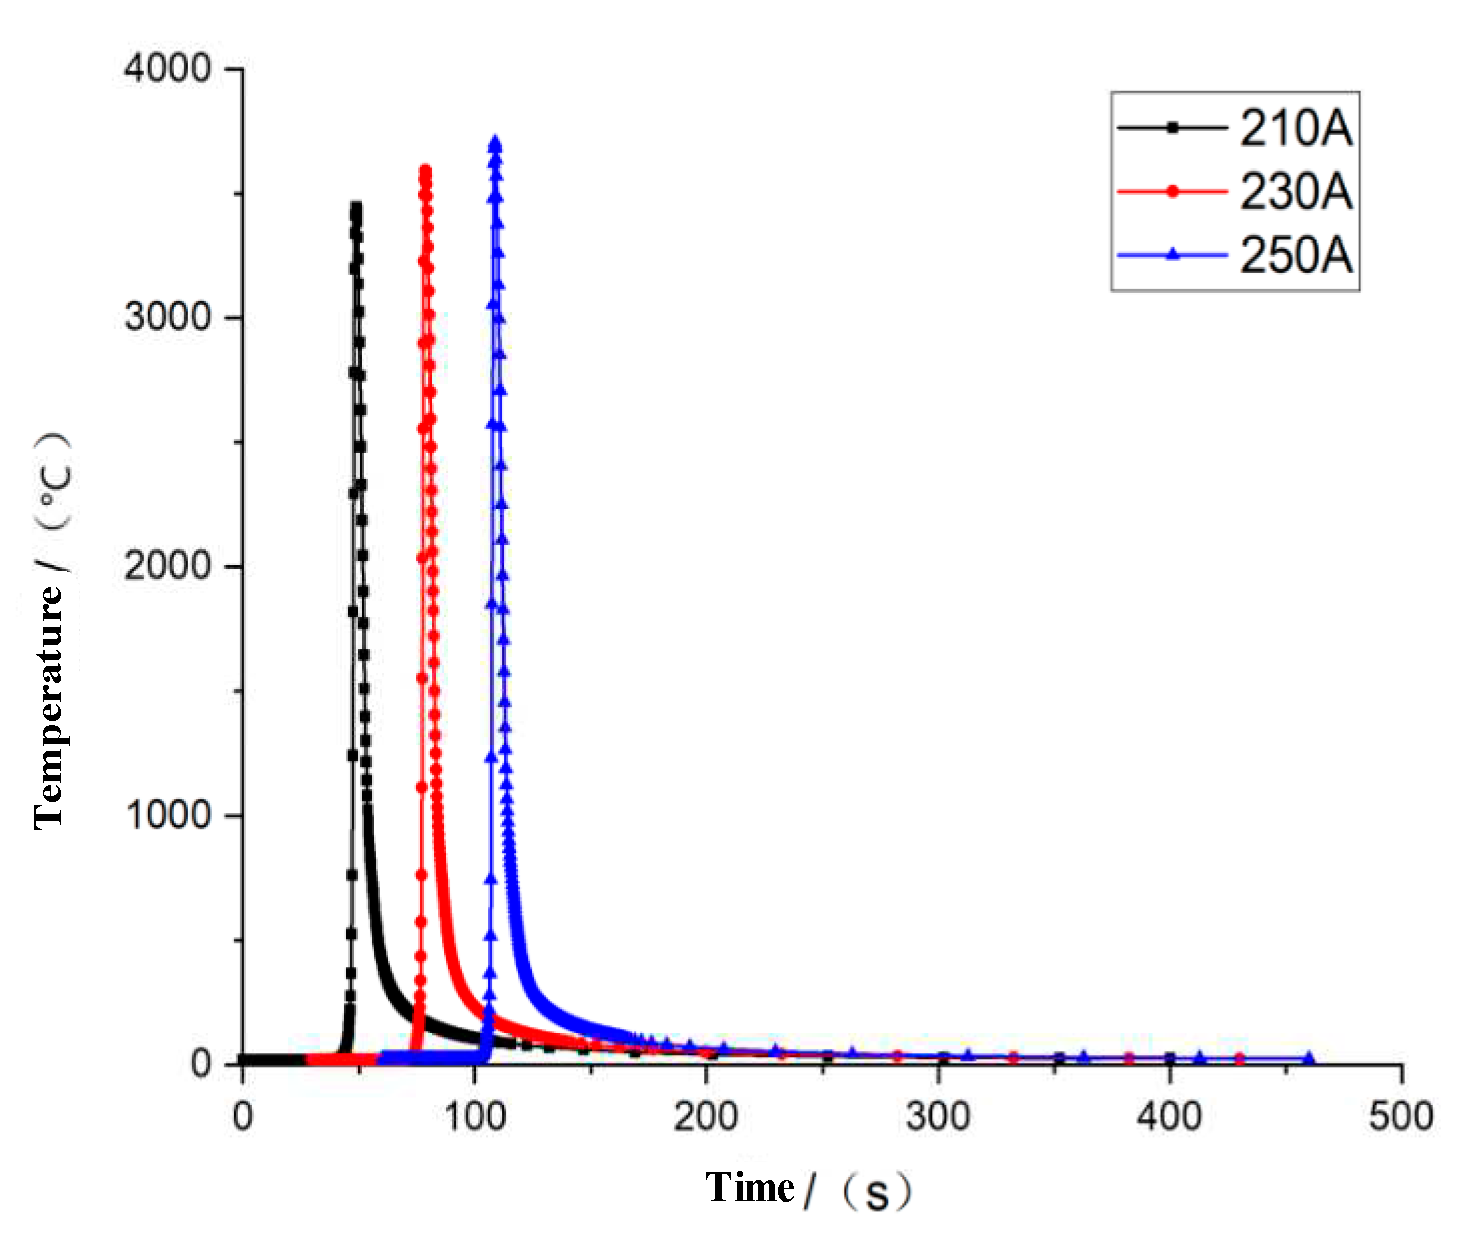
With other parameters and welding boundary conditions unchanged, during the welding heat source charging process, the welding voltage is set to 32V, the welding speed is set to 0.003m/s, then the current value is taken separately to determine the influence of welding current on welding performance. According to the welding method and welding manual specifications, the welding current ranges from 210A to 250A. Since the boundary value and the center value have a representative influence, the welding simulation is carried out with 210A, 230A and 250A currents, and the temperature field changes are shown in
Figure 6 and
Figure 7.
From
Figure 6 and
Figure 7, with the increase of welding current, there is a greater welding heat, whose maximum temperature can reach 3706℃.
3.2. Effect of welding voltage
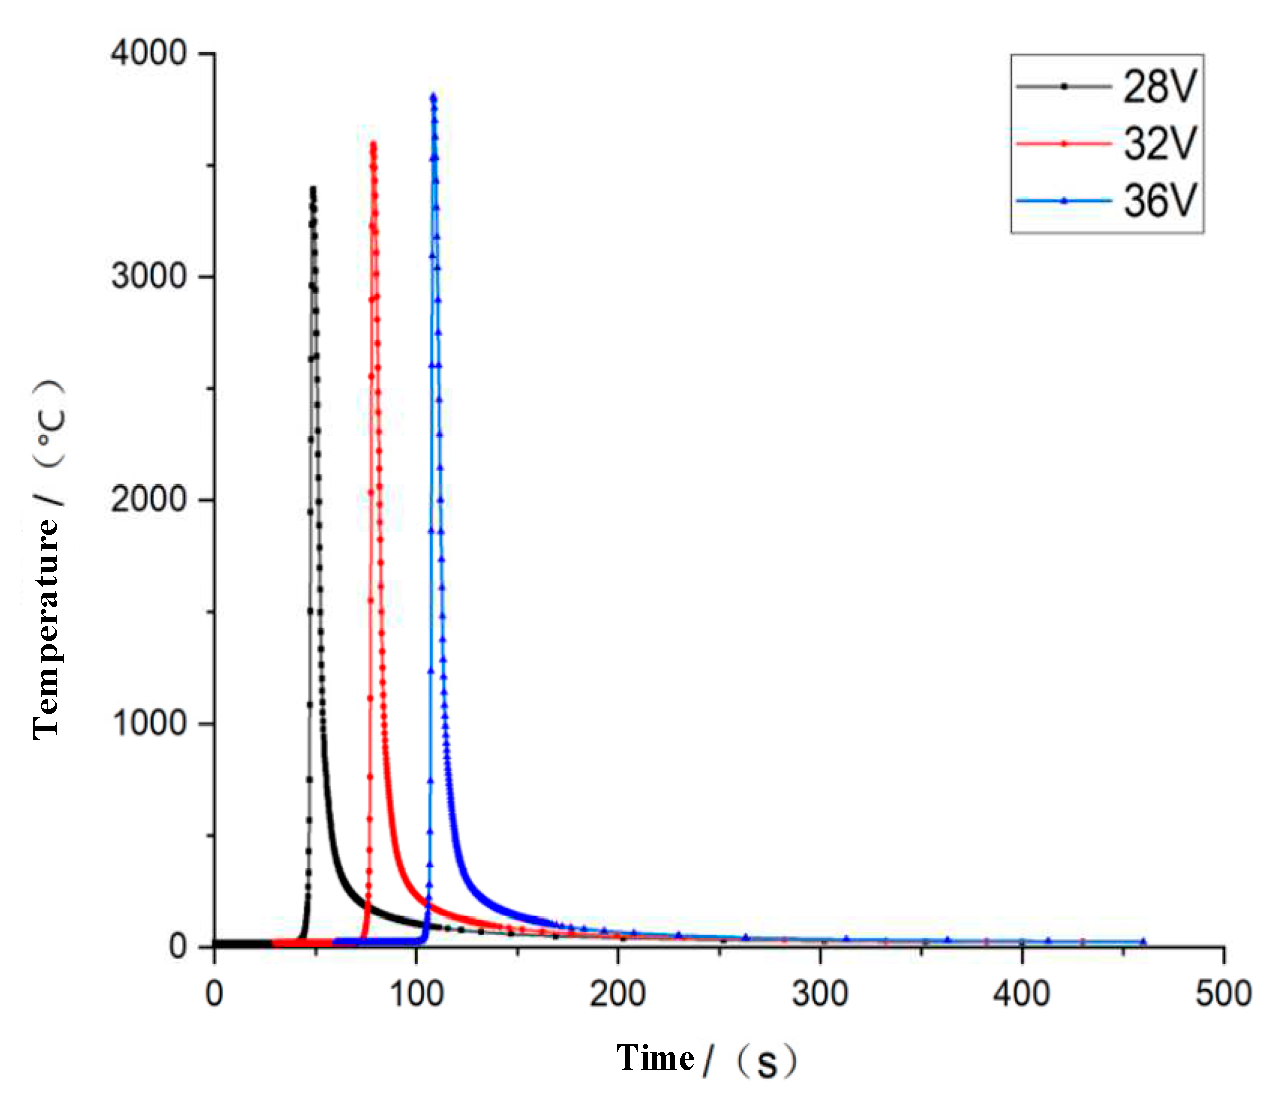
Similarly, on the premise of keeping other welding conditions unchanged, the welding current is 230A, the welding speed is 0.003m/s, then the welding voltage is taken separately to detect the influence of welding voltage on welding performance. According to the welding method and welding manual specifications, the welding voltage ranges from 28V to 36V. In the same way, welding simulation is carried out with 28V, 32V and 36V voltages, and the temperature field changes are shown in
Figure 8 and
Figure 9.
From
Figure 8 and
Figure 9, as the increase of the welding voltage, there is a greater welding heat, whose unit node temperature can reach 3807℃.
3.3. Effect of welding speed
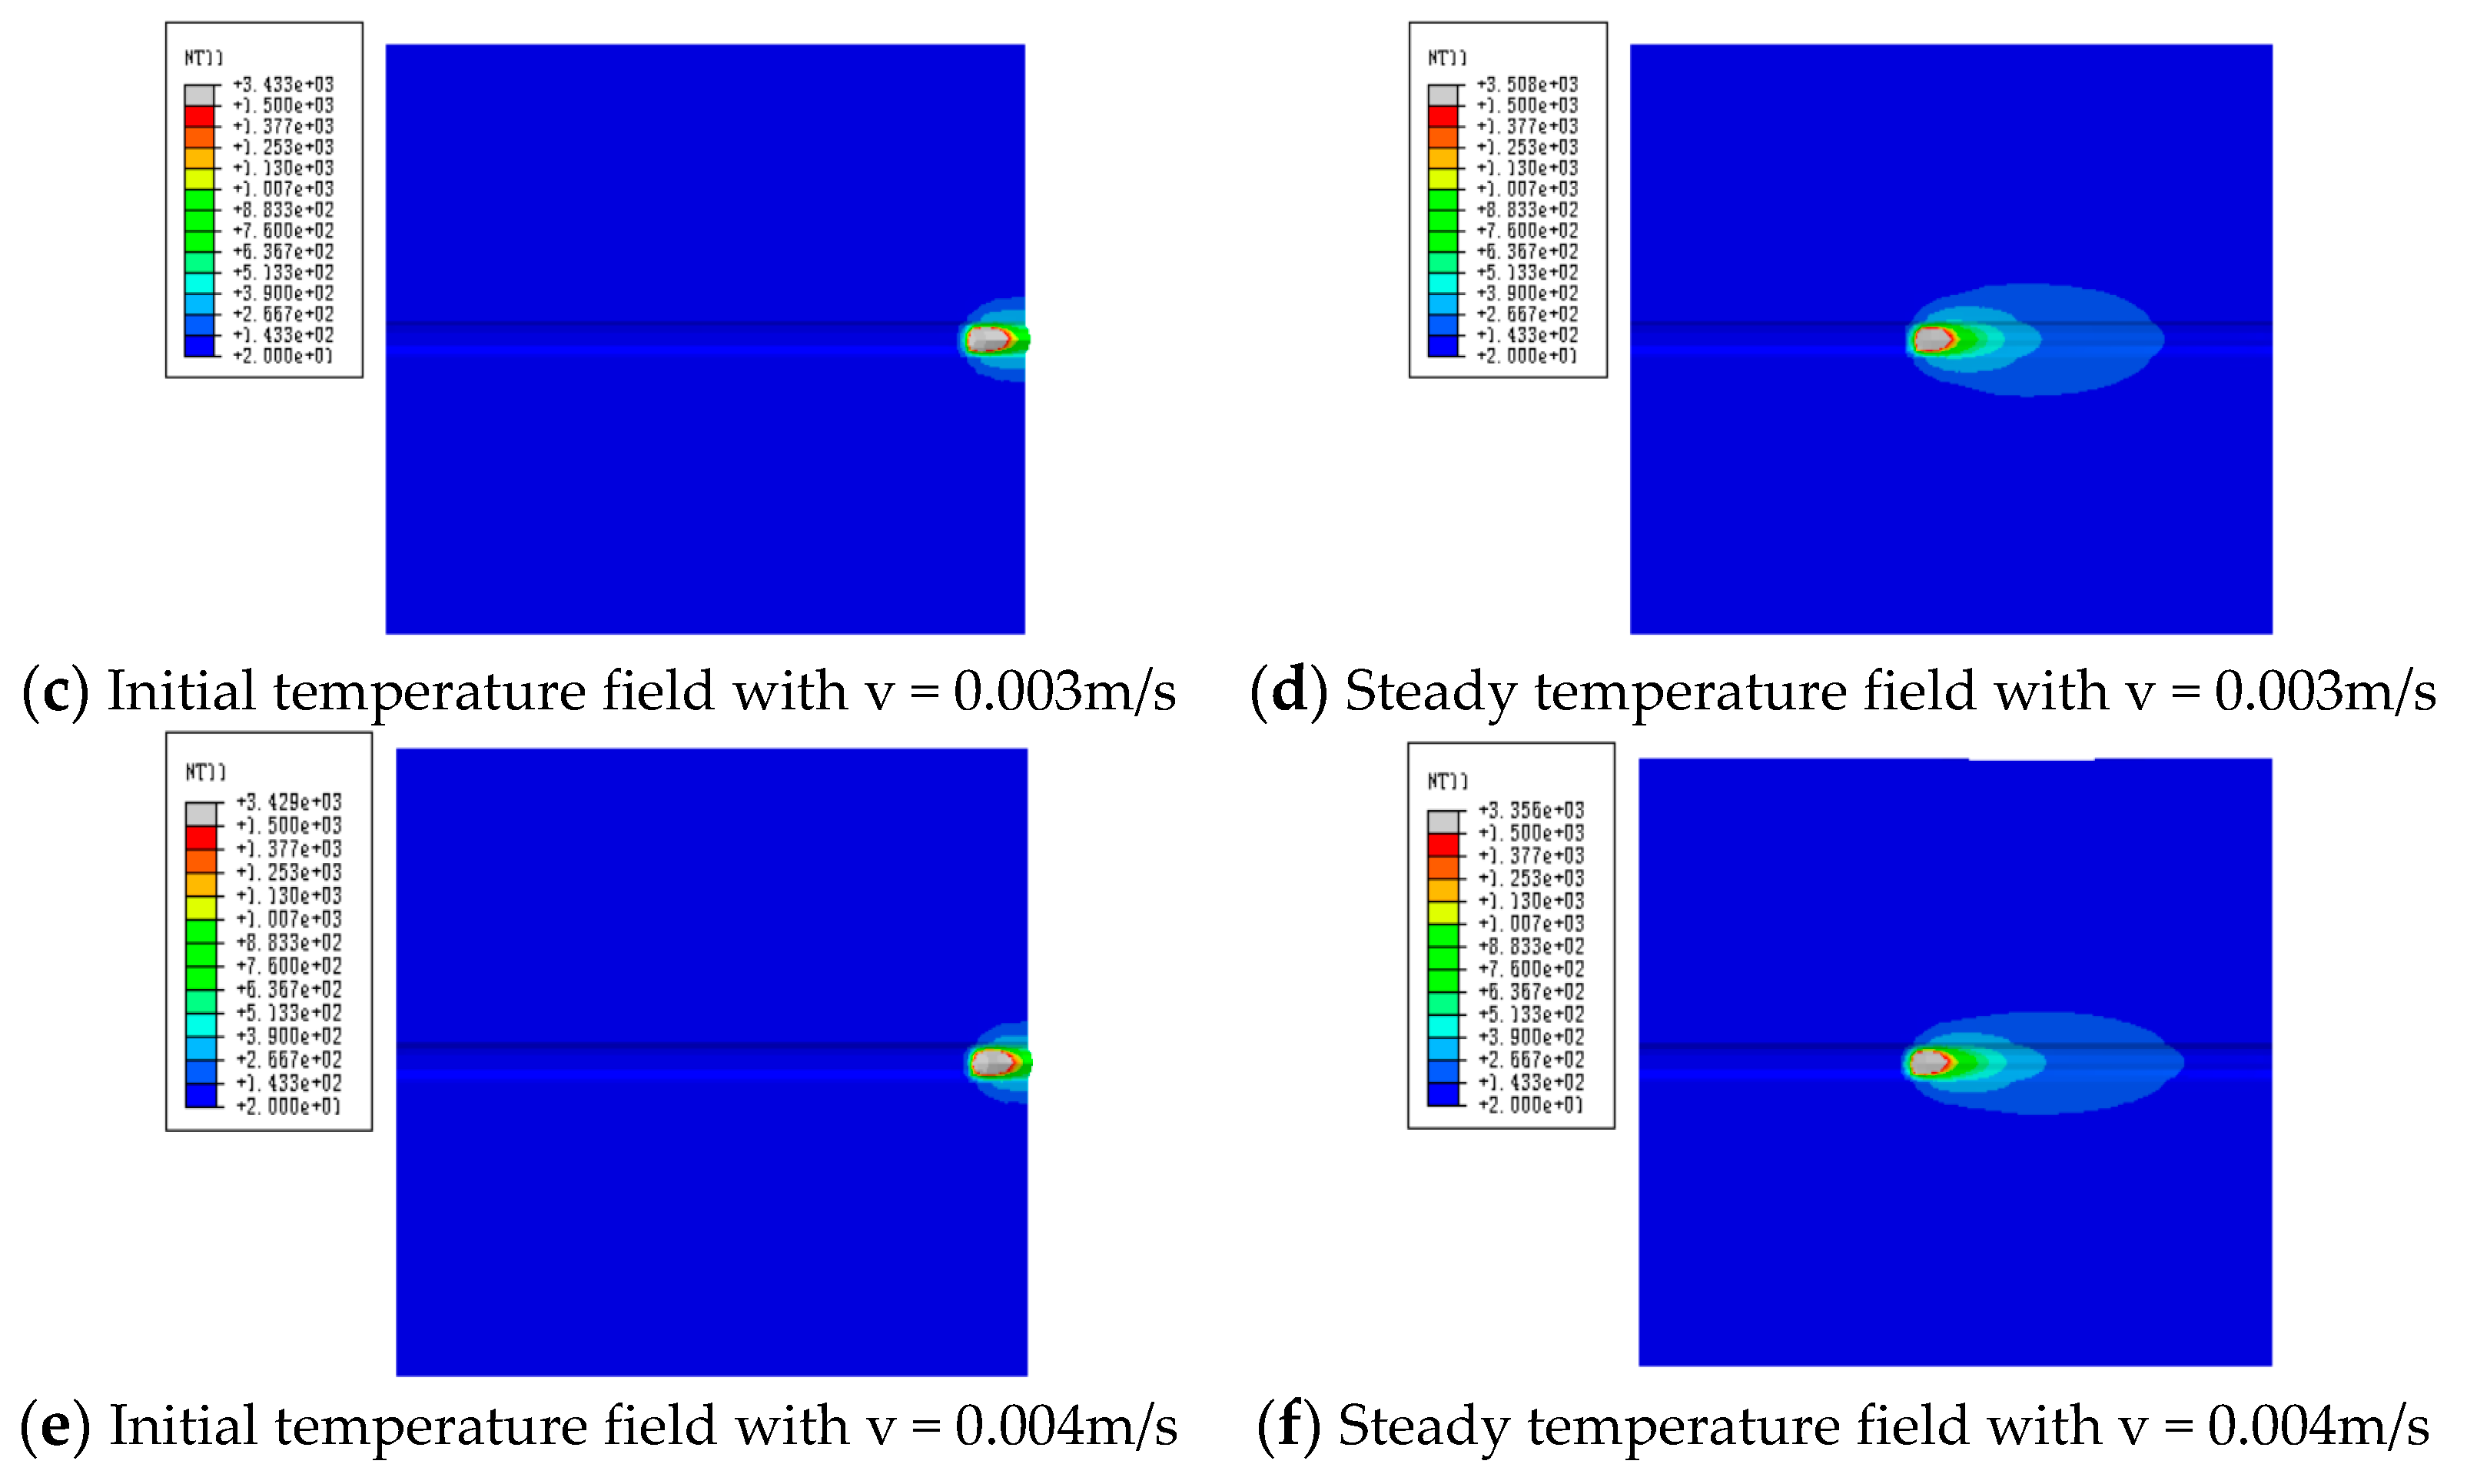
In practical welding, the welding speed is different and it is also a key parameter to affect the welding joints. Selecting three welding speeds, v=0.002m/s, v=0.003m/s and v=0.004m/s, to investigate the effect of welding speed, getting the results shown in
Figure 10.
According to
Figure 10, the diffusion shape of the temperature field in the welding results is similar to the elliptical shape, which has nothing to do with the different welding speeds, but the area of the elliptical shape is different due to the different loading and running speeds of the welding heat source which decrease as the welding speed increases. However, with the continuous running of the heat source, the rear part of the temperature field is gradually shortened and reduced, so if the size of the welding geometry model in the loading direction of the heat source is long enough, the temperature field will gradually appear oval. This is because with the increase in welding speed, the welding heat input is small, which makes the maximum temperature of the welded joint decrease with the increase in welding speed.
4. Optimization analysis and experiment
Multi-pass welding simulation is based on single-pass welding simulation. Combined with the influence of welding process standards on welding process parameters and processes, the optimization scheme for multi-pass welding process parameters is designed as shown in
Table 3.
According to
Table 3, the numerical simulation of welding is carried out, and the distribution of the temperature field, stress field and strain field in the simulation is analyzed.
4.1. Temperature field
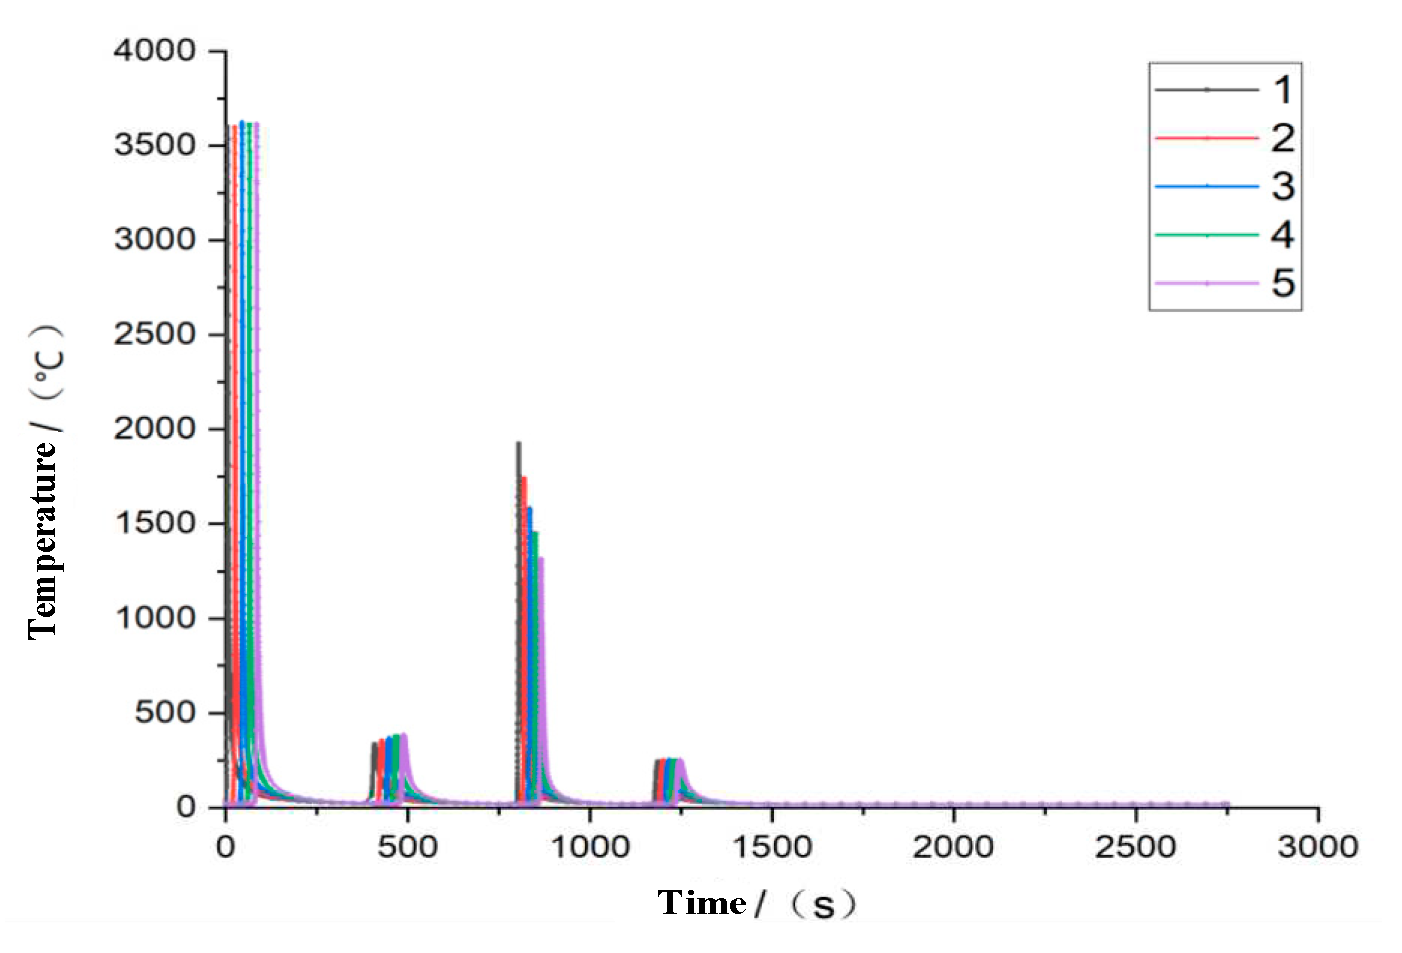
In multi-pass welding, there are complex nonlinear changes in the welding process. According to the optimized parameters, five grid nodes are selected in the first welding seam, investigating thermal variation of welding, as shown in
Figure 11.
According to the change in joint temperature, the maximum temperature of the first weld is 3658℃. With the operation of the heat source, the temperature is gradually transferred to the next weld, while the second weld is on the back of the flat plate, the temperature is relatively low at 300℃. When the heat source is operated to the third weld, submerged arc welding is used, the temperature is relatively high and the distance from the joint is different, the minimum temperature transferred to the joint is 1300℃. It can be concluded from the welding temperature field that the welding temperature field changes sharply, the cooling speed of the temperature field is faster, the better microstructure, plasticity and toughness of the welded joint can be obtained.
4.2. Stress field
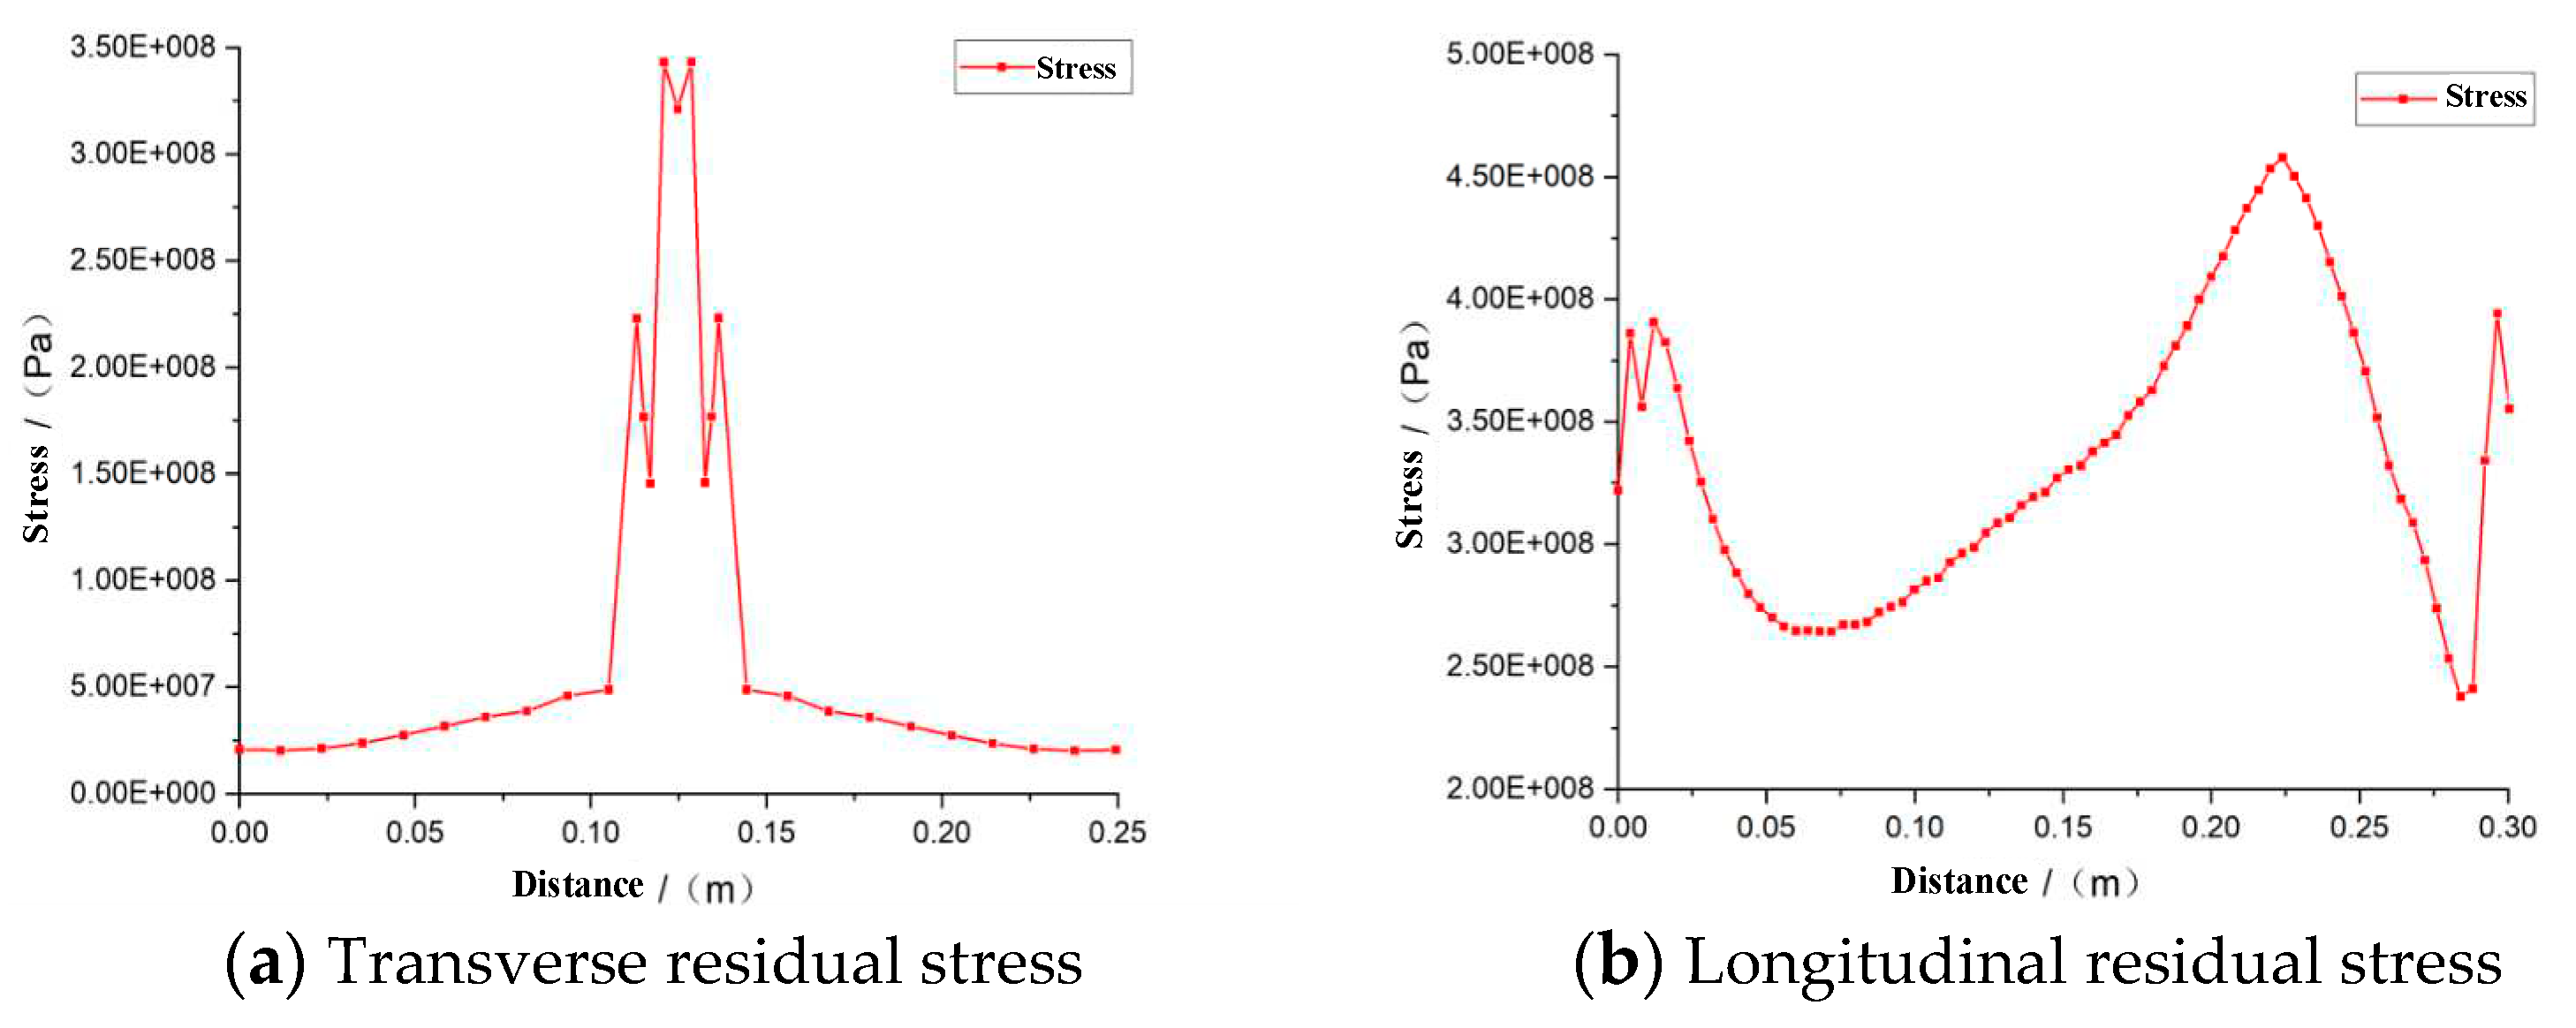
According to the optimization scheme of welding, the residual stress variation is shown in
Figure 12.
When analyzing welding residual stress in large thick plate welded steel members, it is observed that the distribution range in the thickness direction is small. The stress is biaxial and exhibits a plane state, consisting mainly of transverse residual stress and longitudinal residual stress. As shown in
Figure 12, the welding residual stress is primarily concentrated in the weld zone. In the transverse residual stress variation curve, the value increases as it approaches the weld, reaching its maximum peak at the middle position with a maximum residual stress of 345MPa. At the same time, when far away from the weld area, the transverse residual stress changes from tensile stress to compressive stress, finally decreases gradually. In the longitudinal residual stress, it can be seen that the welding starting end is under pressure, the welding seam area is under tension, and the overall distribution is relatively standard, which meets the welding requirements.
4.3. Strain field
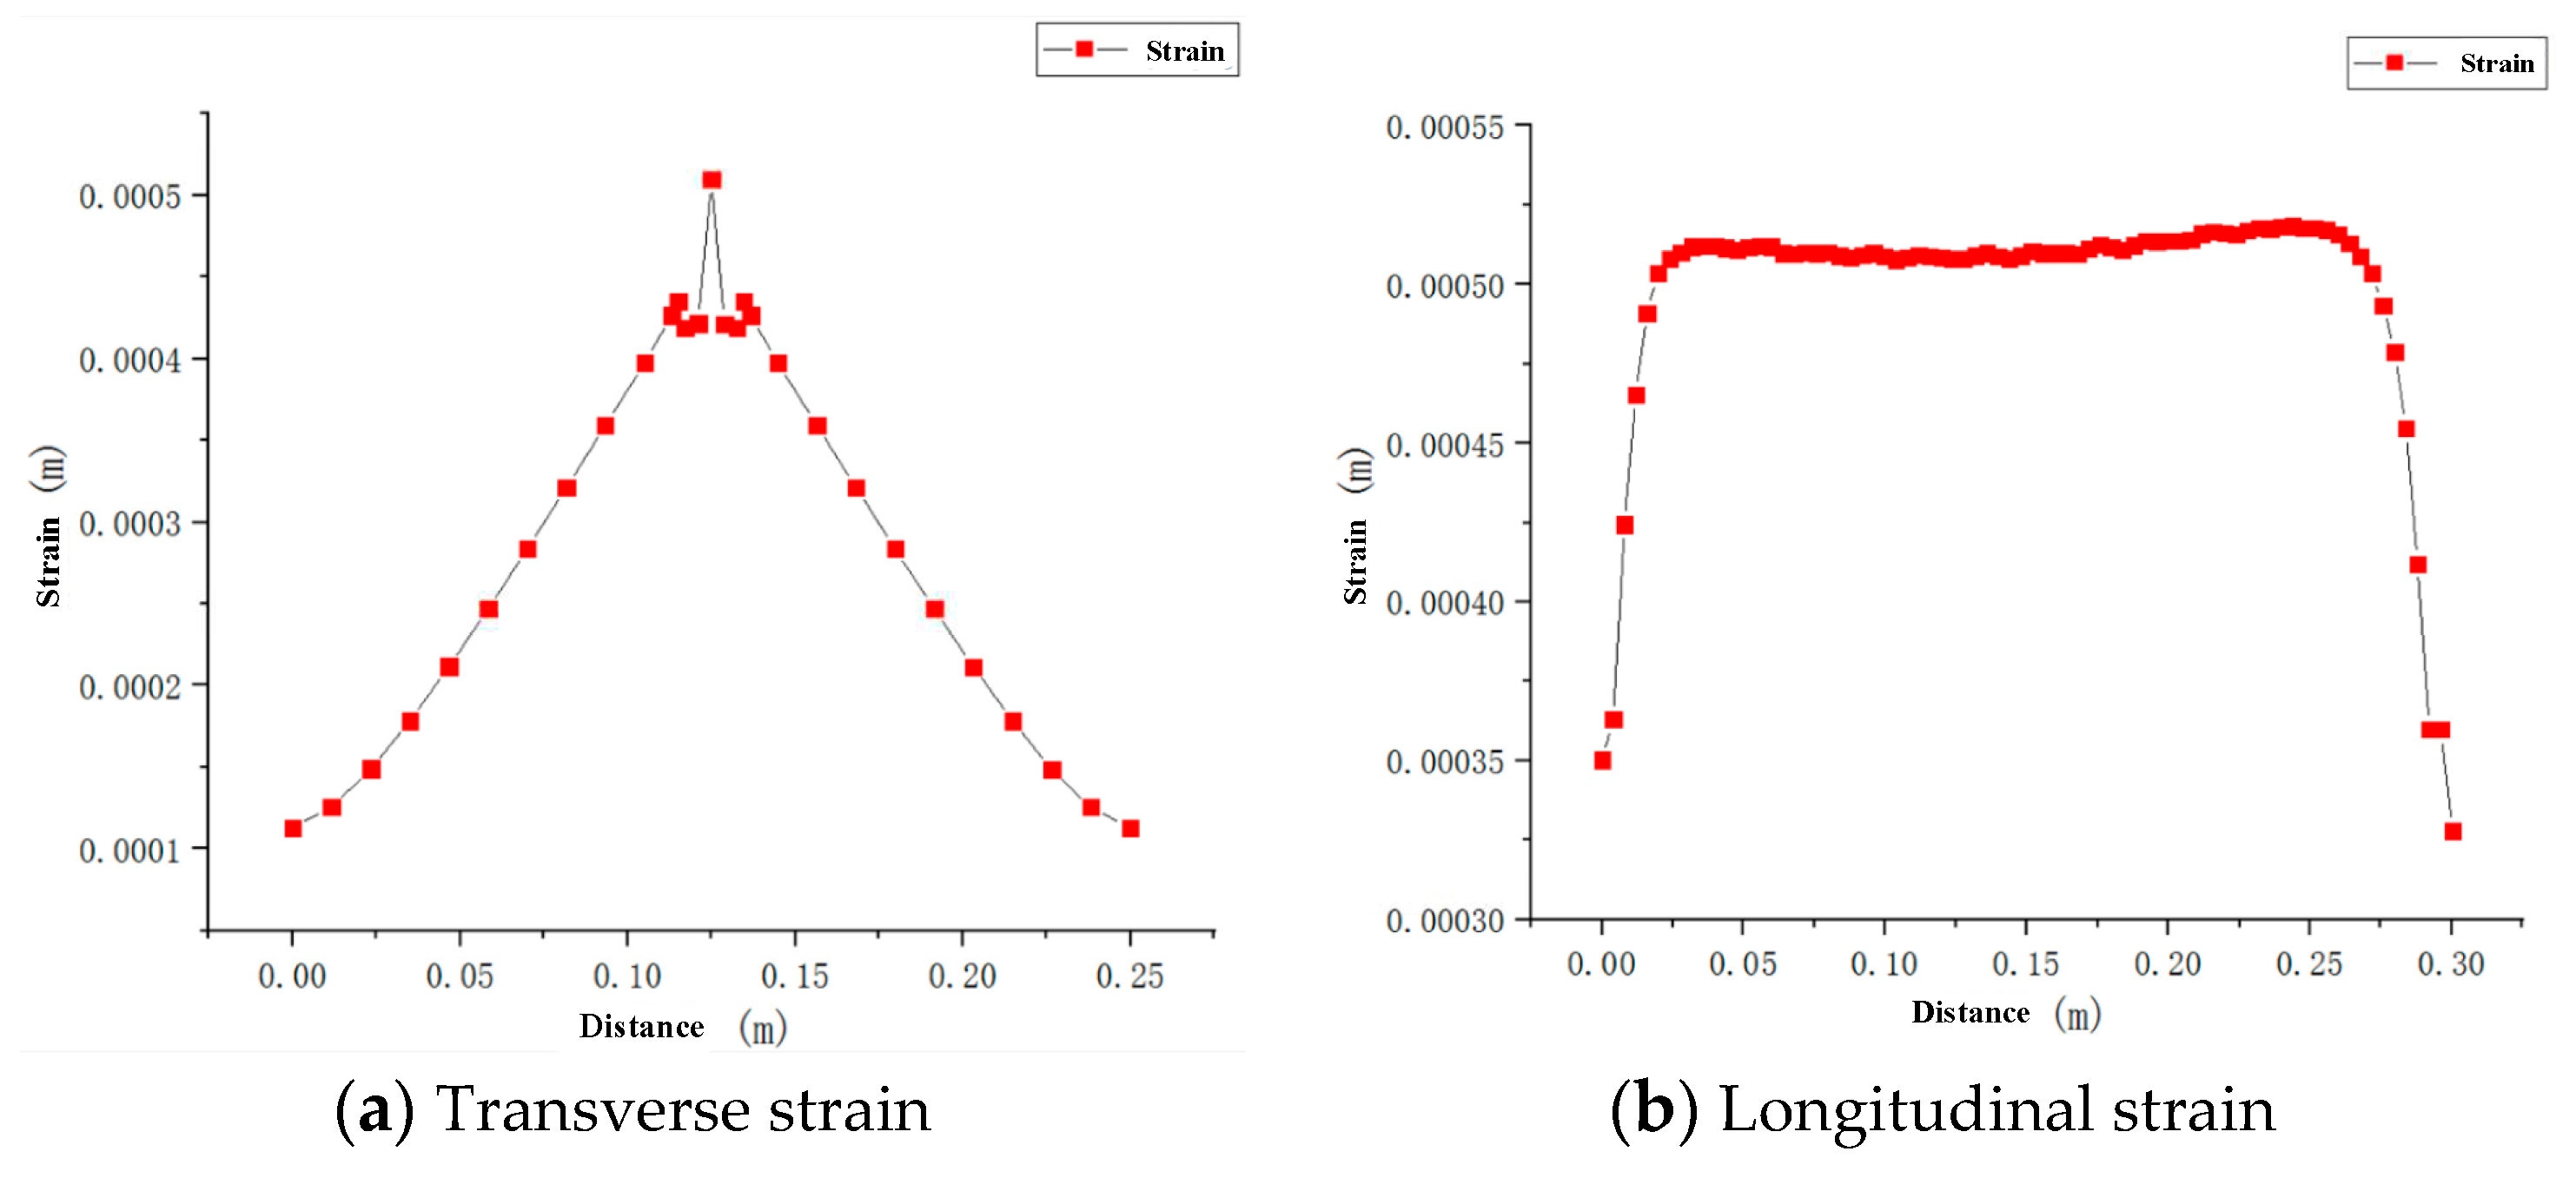
In the welding process, the deformation caused by welding will cause a huge waste of materials and workers’ labor, which will reduce the service life and seriously affect the accuracy of welded steel members, especially large thick steel members. Therefore, in the welding process, it is necessary to control the deformation. According to the simulation results, the lateral and longitudinal displacement strains are shown in
Figure 13.
From
Figure 13, it is clear that with the operation of the welding heat source, the strain increases gradually from the edge to the weld area, reaches its maximum at the center of the weld, with the maximum strain being 0.52mm, then decreases gradually away from the weld. It can be seen that the longitudinal strain is very small at the beginning and then rises sharply, which means that the temperature difference has not caused excessive strain at the beginning of heat source loading, but with the cooling, the strain increases gradually in the weld zone due to the influence of residual stress. The deformation of the whole welded plate is small and evenly distributed, which meets the welding requirements.
4.4. Welding test detection
According to the welding optimization scheme, a test is carried out on the welded plate. After the welding is finished and the welded part is cooled down, the mechanical inspection and macroscopic inspection are carried out on the welded plate, checking whether it meets the welding quality. The experimental welding plates and equipment are shown in
Figure 14.
After welding and cooling, the flat joint plate is tested and the mechanical properties of its welding area are tested. The results are as follows:
1. The average tensile strength and yield strength of the weld zone are 565.5MPa and 404MPa respectively, so the test results show that the tensile properties of welded joints are excellent and meet the welding standards.
2. There is no crack in the welded joint, and it has excellent plastic toughness, which meets the toughness requirements.
3. The highest hardness of HAZ is 194.8HV, the average hardness is 188.525HV. The hardness is lower than HV380 and meets the welding standard.
4. The welded plate has no significant deformation or distortion; the maximum deformation is 0.6mm.
5. There are no pores, residues, cracks or pits at the welded joints.
6. Welded joint section without incomplete penetration, incomplete fusion, or flash.
5. Conclusions
Taking Q345Qd bridge steel, through thermal-elastic-plastic finite simulation, the process parameters of GMAW welding current, welding voltage and welding speed are investigated, and the conclusions are as follows.
1. Based on the welding quality requirements of Q345qD for thick-plate-bridge steel, the technical route of the GMAW welding process is established and its parameters are studied. According to thermal-elastic-plastic analysis, the optimal welding parameters are carried out.
2. As results show that with the gradual increase of welding current, the maximum welding temperature can reach 3706℃, the optimal welding current is 230A, the optimal welding voltage is 32V, and the optimal welding speed is 0.003 m/s.
3. According to the simulation analysis of single welding process parameters, the welding residual stress is mainly distributed in the weld zone; its value increases closer to the weld, reaching the maximum peak value in the middle position. The maximum residual stress is 345MPa.
4. According to the experimental results, the average tensile strength and yield strength of the weld zone are 565.5MPa and 404MPa, indicating that the welded joint has excellent tensile properties.
The optimal parameters of the GMAW welding will be applied to the welding robots, which will benefit a lot to improve the performance of the bridge.
Author Contributions
Conceptualization, Rong Li; methodology, Ming Xiong; software, Liebang Zhan; validation, Ban Wang; formal analysis, Juyong Zhang; investigation, Shuxuan Yang; resources, Rong Li; data curation, Hui Zhang; writing—original draft preparation, Liebang Zhan; writing—review and editing, Rong Li; visualization, Ban Wang; supervision, Juyong Zhang; project administration, Rong Li; funding acquisition, Rong Li. All authors have read and agreed to the published version of the manuscript.
Funding
This work was supported by the Zhejiang Province Commonweal Projects of China (LGG22E050015), Open Research Program of CAS Key Laboratory of Solar Activity (KLSA201903), and Specialized Research Fund for State Key Laboratories (E12612A02S).
Institutional Review Board Statement
Not applicable.
Informed Consent Statement
Not applicable.
Data Availability Statement
Not applicable.
Acknowledgments
This work was supported by the Zhejiang Province Commonweal Projects of China (LGG22E050015), Open Research Program of CAS Key Laboratory of Solar Activity (KLSA201903), and Specialized Research Fund for State Key Laboratories (E12612A02S).
Conflicts of Interest
The authors declare no conflict of interest.
References
- Sun Jian politician, Jiang Meiling, Hao Yongkuan. Welding crack control measures for thick steel structures. China Metal Bulletin 2019, 274–276.
- Zhang Jinquan. Manufacturing processes and deformation control for large-scale welding H-steel. Engineering Machinery, 2013, 44(04): 48-52+8-9.
- Yi Runhua, Deng Lipeng.304 Process Parameters Optimization of Energy Storage Seam Welding of 304 Stainless Steel Sheet. Hot Working Technology 2019, 48, 172–174.
- Kang Cunfeng, Shi Chunyang, Liu Zixiao, Liu Zhifeng,Jiang Xiaoqing, Chen Shunjun, Ma Chunmin. Research on the optimization of welding parameters in high-frequency induction welding pipeline. Journal of Manufacturing Processes 2020, 59. [CrossRef]
- Zhang kaikai. Study on Weld Shapes Prediction and Process Parameters Optimization Methods of CN645ACW Welding Wire. Chongqing university, 2019.
- Palani, K.; Arunprasad, S. Multi response Optimization of Welding Parameters in Dissimilar Plasma Arc Welded Joints Using RSM Based GRA Coupled with PCA. IOP Conf. Series: Mater. Sci. Eng. 2020, 954. [Google Scholar] [CrossRef]
- Xu Menglong, Xue Long, Zou Yong. Research on DSP weld seam tracking control system for mobile welding robots [J]. Welding Technology,2007, No.179(04):45-47+86.
- Wu chenglong, david moses, Huang zehan. Process Parameter Optimization of GH4169 Pulse Laser Welding. Tool Engineering 2020, 54, 38–42.
- Chang Yunlong, Gao Feng, Lu Lin. TIG welding technology research status and development trend [C]. Proceedings of the China Shipbuilding and Marine Engineering Welding and Coating Technology Development Forum. 2012, 6.
- Xin Zheng, Gu Yuanhai, Guo Chuanjun, Ji Chunming. Optimization of Process Parameters of Q245R Submerged Arc Welding. Hot Working Technology 2012, 41, 202–203.
- Zhang Juanyi, Liu Zuguo, Zhiwei Jiang, Jin Xiangzhong, Li Junhao. Process parameters optimization of laser lap welding of thin plate Invar36 for LNG ships. Laser Technology 2021, 1–12.
- Aravind, A.P.; Suryaprakash, S.; Vishal, S.; Sethuraman, M.; Kannan, T.D.B.; Umar, M.; Rajak, S. Optimization of welding parameters in CMT welding of Al 5083 alloys using VIKOR optimization method. IOP Conf. Series: Mater. Sci. Eng. 2020, 912. [Google Scholar] [CrossRef]
- Fu Zheng, Tao Ye, Chea Chang, Zhang Hao, Shao Leilei. Optimization of optical fiber laser welding process parameters for stainless steel plate. Welding Technology 2015, 44, 48–51.
- Zhou Xinyu, Zhang Juanyi, Liu Zuguo, Li Junhao, Jin Xiangzhong, Hao Zhongjia, Chen Huiyang, Yu Xiaofei. Study on the parameter optimization of laser welding of SUS301L stainless steel for metro roof. Laser Technology 2021, 1–12.
- Lv Xiaoqing, Wang Xu, Xu Lianyong, Jing Hongyang, Han Yongdian. Multi-objective optimization of MAG welding process parameters based on combination model. Transactions of the china welding institution, 2020, 41(02): 6-11+97.
- Rizvi, S.A.; Ali, W. Optimization of Welding Parameters and Microstructure and Fracture Mode Characterization of GMA Welding by Using Taguchi Method on SS304H Austenitic Steel. Mech. Mech. Eng. 2018, 22, 1121–1132. [Google Scholar] [CrossRef]
- Ma feng. Study on numerical simulation of welding Deformation and residual stress of aluminum alloy based on ABAQUS. Chongqing Jiaotong University, 2016.
- Li, X. Numerical simulation of welding temperature field of Q345 steel plate based on different heat source models. Welding Technology 2020, 49, 19–21. [Google Scholar]
|
Disclaimer/Publisher’s Note: The statements, opinions and data contained in all publications are solely those of the individual author(s) and contributor(s) and not of MDPI and/or the editor(s). MDPI and/or the editor(s) disclaim responsibility for any injury to people or property resulting from any ideas, methods, instructions or products referred to in the content. |
© 2023 by the authors. Licensee MDPI, Basel, Switzerland. This article is an open access article distributed under the terms and conditions of the Creative Commons Attribution (CC BY) license (http://creativecommons.org/licenses/by/4.0/).
