Submitted:
10 July 2023
Posted:
11 July 2023
You are already at the latest version
Abstract
Keywords:
1. Introduction
2. Materials and Methods
2.1. Sample preparation
2.2. Surface characterization
2.3. Cell culture and adhesion
2.4. Cell proliferation
3. Results and Discussion
4. Conclusion
Author Contributions
Funding
Institutional Review Board Statement
Informed Consent Statement
Data Availability Statement
Acknowledgments
Conflicts of Interest
References
- Aziz-Kerrzo, M.; Conroy, K.G.; Fenelon, A.M.; Farrell, S.T.; Breslin, C.B. Electrochemical studies on the stability and corrosion resistance of titanium-based implant materials. Biomaterials 2001, 22, 1531–1539. [Google Scholar] [CrossRef]
- Choi, M.-J.; Min, B.K.; Hong, M.-H.; Lee, H.-J.; Son, J.S.; Kwon, T.-Y. Influence of Oxidative Etching Solution Temperatures on the Surface Roughness and Wettability of a Titanium Alloy. J. Nanosci. Nanotechnol. 2019, 19, 1044–1047. [Google Scholar] [CrossRef]
- Kim, I.-H.; Im, J.-S.; Lee, M.-H.; Min, B.K.; Son, J.S.; Hong, M.-H.; Kwon, T.-Y. Formation of Nano/Micro Hierarchical Structures on Titanium Alloy Surface by a Novel Etching Solution. J. Nanosci. Nanotechnol. 2020, 20, 4529–4532. [Google Scholar] [CrossRef] [PubMed]
- Lamolle, S.F.; Monjo, M.; Rubert, M.; Haugen, H.J.; Lyngstadaas, S.P.; Ellingsen, J.E. The effect of hydrofluoric acid treatment of titanium surface on nanostructural and chemical changes and the growth of MC3T3-E1 cells. Biomaterials 2009, 30, 736–742. [Google Scholar] [CrossRef]
- Monjo, M.; Lamolle, S.F.; Lyngstadaas, S.P.; Rønold, H.J.; Ellingsen, J.E. In vivo expression of osteogenic markers and bone mineral density at the surface of fluoride-modified titanium implants. Biomaterials 2008, 29, 3771–3780. [Google Scholar] [CrossRef]
- Zhao, L.; Mei, S.; Chu, P.K.; Zhang, Y.; Wu, Z. The influence of hierarchical hybrid micro/nano-textured titanium surface with titania nanotubes on osteoblast functions. Biomaterials 2010, 31, 5072–5082. [Google Scholar] [CrossRef] [PubMed]
- Zhang, J.; Xie, Y.; Zuo, J.; Li, J.; Wei, Q.; Yu, Z.; Tang, Z. Cell responses to titanium treated by a sandblast-free method for implant applications. Mater. Sci. Eng. C 2017, 78, 1187–1194. [Google Scholar] [CrossRef] [PubMed]
- Yoshinari, M.; Watanabe, Y.; Ohtsuka, Y.; Derand, T. Solubility control of thin calcium-phosphate coating with rapid heating. J. Dent. Res. 1997, 76, 1485–1494. [Google Scholar] [CrossRef]
- Gittens, R.A.; McLachlan, T.; Olivares-Navarrete, R.; Cai, Y.; Berner, S.; Tannenbaum, R.; Schwartz, Z.; Sandhage, K.H.; Boyan, B.D. The effects of combined micron-/submicron-scale surface roughness and nanoscale features on cell proliferation and differentiation. Biomaterials. 2011, 3213, 3395–3403. [Google Scholar] [CrossRef]
- Gittens, R.A.; Olivares-Navarrete, R.; Cheng, A.; Anderson, D.M.; McLachlan, T.; Stephan, I.; Geis-Gerstorfer, J.; Sandhage, K.H.; Fedorov, A.G.; Rupp, F.; et al. The roles of titanium surface micro/nanotopography and wettability on the differential response of human osteoblast lineage cells. Acta Biomater. 2012, 9, 6268–6277. [Google Scholar] [CrossRef]
- Truong, V.K.; Lapovok, R.; Estrin, Y.S.; Rundell, S.; Wang, J.Y.; Fluke, C.J.; Crawford, R.J.; Ivanova, E.P. The influence of nano-scale surface roughness on bacterial adhesion to ultrafine-grained titanium. Biomaterials 2010, 31, 3674–3683. [Google Scholar] [CrossRef] [PubMed]
- Puckett, S.D.; Taylor, E.; Raimondo, T.; Webster, T.J. The relationship between the nanostructure of titanium surfaces and bacterial attachment. Biomaterials 2010, 31, 706–713. [Google Scholar] [CrossRef]
- von Wilmowsky, C.; Moest, T.; Nkenke, E.; Stelzle, F.; Schlegel, K.A. Implants in bone: Part I. A current overview about tissue response, surface modifications and future perspectives. Oral Maxillofac. Surg. 2013, 18, 243–257. [Google Scholar] [CrossRef]
- Yildiz, H.; Bertl, K.; Stavropoulos, A. Titanium implants surface roughness after different implantoplasty protocols: a laboratory study. Clin. Exp. Dent. Res. 2022, 8, 1315–1321. [Google Scholar] [CrossRef]
- Schliephake, H.; Aref, A.; Scharnweber, D.; Bierbaum, S.; Sewing, A. Effect of modifications of dual acid-etched implant surfaces on peri-implant bone formation. Part I: organic coatings. Clin. Oral Implant. Res. 2009, 20, 31–37. [Google Scholar] [CrossRef]
- Novaes, A.B. Jr.; de Souza, S.L.S.; de Barros, R.R.M.; Pereira, K.K.Y.; Iezzi, G.; Piattelli, A. Influence of implant surfaces on osseointegration. Braz. Dent. J. 2010, 21, 471–481. [Google Scholar] [CrossRef]
- Webster, T.J.; Ross, A.P. Anodizing color coded anodized Ti6Al4V medical devices for increasing bone cell functions. Int. J. Nanomed. 2013, 8, 109–117. [Google Scholar] [CrossRef] [PubMed]
- Jemat, A.; Ghazali, M.J.; Razali, M.; Otsuka, Y. Surface Modifications and Their Effects on Titanium Dental Implants. BioMed Res. Int. 2015, 2015, 791725. [Google Scholar] [CrossRef] [PubMed]
- Le Guehennec, L.; Lopez-Heredia, M.-A.; Enkel, B.; Weiss, P.; Amouriq, Y.; Layrolle, P. Osteoblastic cell behaviour on different titanium implant surfaces. Acta Biomater. 2008, 4, 535–543. [Google Scholar] [CrossRef]
- Stoilov, M.; Stoilov, L.; Enkling, N.; Stark, H.; Winter, J.; Marder, M.; Kraus, D. Effects of Different Titanium Surface Treatments on Adhesion, Proliferation and Differentiation of Bone Cells: An In Vitro Study. J. Funct. Biomater. 2022, 13, 143. [Google Scholar] [CrossRef]
- Wennerberg, A.; Albrektsson, T. Effects of titanium surface topography on bone integration: A systematic review. Clin. Oral Implant. Res. 2009, 20, 172–184. [Google Scholar] [CrossRef]
- Berglundh, T.; Gotfredsen, K.; Zitzmann, N.U.; Lang, N.P.; Lindhe, J. Spontaneous progression of ligature induced peri-implantitis at implants with different surface roughness: an experimental study in dogs. Clin. Oral Implant. Res. 2007, 18, 655–661. [Google Scholar] [CrossRef] [PubMed]
- Lang, N.P.; Salvi, G.E.; Huynh-Ba, G.; Ivanovski, S.; Donos, N.; Bosshardt, D.D. Early osseointegration to hydrophilic and hydrophobic implant surfaces in humans. Clin. Oral Implant. Res. 2011, 22, 349–356. [Google Scholar] [CrossRef]
- Sartoretto, S.C.; Alves, A.T.N.N.; Resende, R.F.B.; Calasans-Maia, J.; Granjeiro, J.M.; Calasans-Maia, M.D. Early osseointegration driven by the surface chemistry and wettability of dental implants. J. Appl. Oral Sci. 2015, 23, 279–287. [Google Scholar] [CrossRef] [PubMed]
- Chopra, D.; Jayasree, A.; Guo, T.; Gulati, K.; Ivanovski, S. Advancing dental implants: Bioactive and therapeutic modifications of zirconia. Bioact. Mater. 2022, 13, 161–178. [Google Scholar] [CrossRef]
- Shalabi, M.; Gortemaker, A.; Hof, M.V.; Jansen, J.; Creugers, N. Implant Surface Roughness and Bone Healing: a Systematic Review. J. Dent. Res. 2006, 85, 496–500. [Google Scholar] [CrossRef] [PubMed]
- Chambrone, L.; Shibli, J.A.; Mercúrio, C.E.; Cardoso, B.; Preshaw, P.M. Efficacy of standard (SLA) and modified sandblasted and acid-etched (SLActive) dental implants in promoting immediate and/or early occlusal loading protocols: a systematic review of prospective studies. Clin. Oral Implant. Res. 2014, 26, 359–370. [Google Scholar] [CrossRef]
- Bowers, K.T.; Keller, J.C.; A Randolph, B.; Wick, D.G.; Michaels, C.M. Optimization of surface micromorphology for enhanced osteoblast responses in vitro. Int. J. Oral Maxillofac. Implant. 1992, 7, 302–310. [Google Scholar]
- Buser, D.; Broggini, N.; Wieland, M.; Schenk, R.K.; Denzer, A.J.; Denzer, D.L.; Hoffmann, B.; Lussi, A.; Steinemann, S.G. Enhanced bone apposition to a chemically modified SLA titanium surface. J. Dent. Res. 2004, 83, 529–533. [Google Scholar] [CrossRef]
- Schwarz, F.; Herten, M.; Sager, M.; Wieland, M.; Dard, M.; Becker, J. Bone regeneration in dehiscence-type defects at chemically modified (SLActive ) and conventional SLA titanium implants: a pilot study in dogs. J. Clin. Periodontol. 2007, 34, 78–86. [Google Scholar] [CrossRef]
- Le Guéhennec, L.; Soueidan, A.; Layrolle, P.; Amouriq, Y. Surface treatments of titanium dental implants for rapid osseointegration. Dent. Mater. 2007, 23, 844–854. [Google Scholar] [CrossRef]
- P,M, Brett.; J, Harle.; V, Salih.; R, Mihoc.; I, Olsen.; F,H, Jones.; M, Tonetti. Roughness response genes in osteoblasts. Bone 2004, 35, 124–133. [CrossRef]
- Kim, I.-H.; Son, J.S.; Choi, S.H.; Kim, K.-H.; Kwon, T.-Y. Nano- and Micro-Scale Oxidative Patterning of Titanium Implant Surfaces for Improved Surface Wettability. J. Nanosci. Nanotechnol. 2016, 16, 1883–1886. [Google Scholar] [CrossRef]
- Chen-Xi, Wang.; Ting, Ma.; Ming-Yue, Wang.; Hou-Zuo, Guo.; Xi-Yuan, Ge.; Yu, Zhang.; Ye, Lin. Facile distribution of an alkaline microenvironment improves human bone marrow mesenchymal stem cell osteogenesis on a titanium surface through the ITG/FAK/ALP pathway. Int. J. Implant. Dent. 2021, 7, 56. [CrossRef]
- Hao, L.; Lawrence, J.; Phua, Y.F.; Chian, K.S.; Lim, G.C.; Zheng, H.Y. Enhanced human osteoblast cell adhesion and proliferation on 316 LS stainless steel by means of CO2 laser surface treatment. J. Biomed. Mater. Res. Part B: Appl. Biomater. 2004, 73, 148–156. [Google Scholar] [CrossRef]
- Boulter, E.; Estrach, S.; Tissot, F.S.; Hennrich, M.L.; Tosello, L.; Cailleteau, L.; de la Ballina, L.R.; Pisano, S.; Gavin, A.-C.; Féral, C.C. Cell metabolism regulates integrin mechanosensing via an SLC3A2-dependent sphingolipid biosynthesis pathway. Nat. Commun. 2018, 9, 1–15. [Google Scholar] [CrossRef]
- Rupp, F.; Scheideler, L.; Olshanska, N.; de Wild, M.; Wieland, M.; Geis-Gerstorfer, J. Enhancing surface free energy and hydrophilicity through chemical modification of microstructured titanium implant surfaces. J. Biomed. Mater. Res. A. 2006, 76, 323–334. [Google Scholar] [CrossRef]
- Bayrak, M.; Kocak-Oztug, N.A.; Gulati, K.; Cintan, S.; Cifcibasi, E. Influence of Clinical Decontamination Techniques on the Surface Characteristics of SLA Titanium Implant. Nanomaterials 2022, 12, 4481. [Google Scholar] [CrossRef] [PubMed]
- D,E, MacDonald. ; N, Deo.; B, Markovic.; M, Stranick.; P, Somasundaram. Adsorption and dissolution behavior of human plasma fibronectin on thermally and modified titanium dioxide particles. Biomaterials. 2002, 23, 1269–1279.
- Rupp, F.; Scheideler, L.; Rehbein, D.; Axmann, D.; Geis-Gerstorfer, J. Roughness induced dynamic changes of wettability of acid etched titanium implant modifications. Biomaterials 2004, 25, 1429–1438. [Google Scholar] [CrossRef]
- Wennerberg, A.; Albrektsson, T.; Andersson, B.; Krol, J.J. A histomorphometric and removal torque study of screw-shaped titanium implants with three different surface topographies. Clin. Oral. Implants Res. 1995, 6, 24–30. [Google Scholar] [CrossRef] [PubMed]
- Davies, J.E. Understanding Peri-Implant Endosseous Healing. J. Dent. Educ. 2003, 67, 932–949. [Google Scholar] [CrossRef] [PubMed]
- Boyan, B.D.; Dean, D.D.; Lohmann, C.H.; Cochran, D.L.; Sylvia, V.L.; Schwartz, Z. The Titanium-Bone Cell Interface In Vitro: The Role of the Surface in Promoting Osteointegration. Titan. Med. 2001, 561–585. [Google Scholar] [CrossRef]
- Junker, R.; Dimakis, A.; Thoneick, M.; Jansen, J.A. Effects of implant surface coatings and composition on bone integration: a systematic review. Clin. Oral Implant. Res. 2009, 20, 185–206. [Google Scholar] [CrossRef]
- Brett, P.; Harle, J.; Salih, V.; Mihoc, R.; Olsen, I.; Jones, F.; Tonetti, M. Roughness response genes in osteoblasts. Bone 2004, 35, 124–133. [Google Scholar] [CrossRef]
- Zinelis, S.; Silikas, N.; Thomas, A.; Syres, K.; Eliades, G. Surface characterization of SLActive dental implants. Eur. J. Esthet. Dent. 2012, 7, 72–92. [Google Scholar] [PubMed]
- D,V, Kilpadi.; G,N, Raikar.; J, Liu.; J,E, Lemons.; Y, Vohra.; J,C, Gregory. Effect of surface treatment on unalloyed titanium analyses. J. Biomed. Mater. Res. 1998, 40, 646–659.
- J, Pan.; H, Liao.; C, Leygraf.; D, Thierry.; J, Li. Variation of oxide films on titanium induced by osteoblast-like cell culture and influence of an H₂O₂ pretreatment. J. Biomed. Mater. Res. 1998, 40, 244–256. [CrossRef]
- Oh, T.-J.; Yoon, J.; Meraw, S.J.; Giannobile, W.V.; Wang, H.-L. Healing and osseointegration of submerged microtextured oral implants. Clin. Oral Implant. Res. 2003, 14, 643–650. [Google Scholar] [CrossRef]
- Bowers, K.T.; Keller, J.C.; A Randolph, B.; Wick, D.G.; Michaels, C.M. Optimization of surface micromorphology for enhanced osteoblast responses in vitro. Int. J. Oral Maxillofac. Implant. 1992, 7, 302–310. [Google Scholar]
- Martin, J.; Schwartz, Z.; Hummert, T. Effect of titanium surface roughness on prolif eration, differentiation, and protein syn thesis of human osteoblast-like cells (MG63). J. Biomed. Mater. Res. 1995, 29, 389–401. [Google Scholar] [CrossRef]
- Kim, M.-J.; Choi, M.-U.; Kim, C.-W. Activation of phospholipase D1 by surface roughness of titanium in MG63 osteoblast-like cell. Biomaterials 2006, 27, 5502–5511. [Google Scholar] [CrossRef] [PubMed]
- Keller, J.C.; Schneider, G.B.; Stanford, C.M.; Kellogg, B. Effects of Implant Microtopography on Osteoblast Cell Attachment. Implant. Dent. 2003, 12, 175–181. [Google Scholar] [CrossRef] [PubMed]
- Conserva, E.; Menini, M.; Ravera, G.; Pera, P. The role of surface implant treatments on the biological behavior of SaOS-2 osteoblast-like cells. Anin vitrocomparative study. Clin. Oral Implant. Res. 2013, 24, 880–889. [Google Scholar] [CrossRef]
- Rosales-Leal, J.; Rodríguez-Valverde, M.; Mazzaglia, G.; Ramón-Torregrosa, P.; Díaz-Rodríguez, L.; García-Martínez, O.; Vallecillo-Capilla, M.; Ruiz, C.; Cabrerizo-Vílchez, M. Effect of roughness, wettability and morphology of engineered titanium surfaces on osteoblast-like cell adhesion. Colloids Surfaces A: Physicochem. Eng. Asp. 2010, 365, 222–229. [Google Scholar] [CrossRef]
- Kang, B.-S.; Sul, Y.-T.; Oh, S.-J.; Lee, H.-J.; Albrektsson, T. XPS, AES and SEM analysis of recent dental implants. Acta Biomater. 2009, 5, 2222–2229. [Google Scholar] [CrossRef] [PubMed]
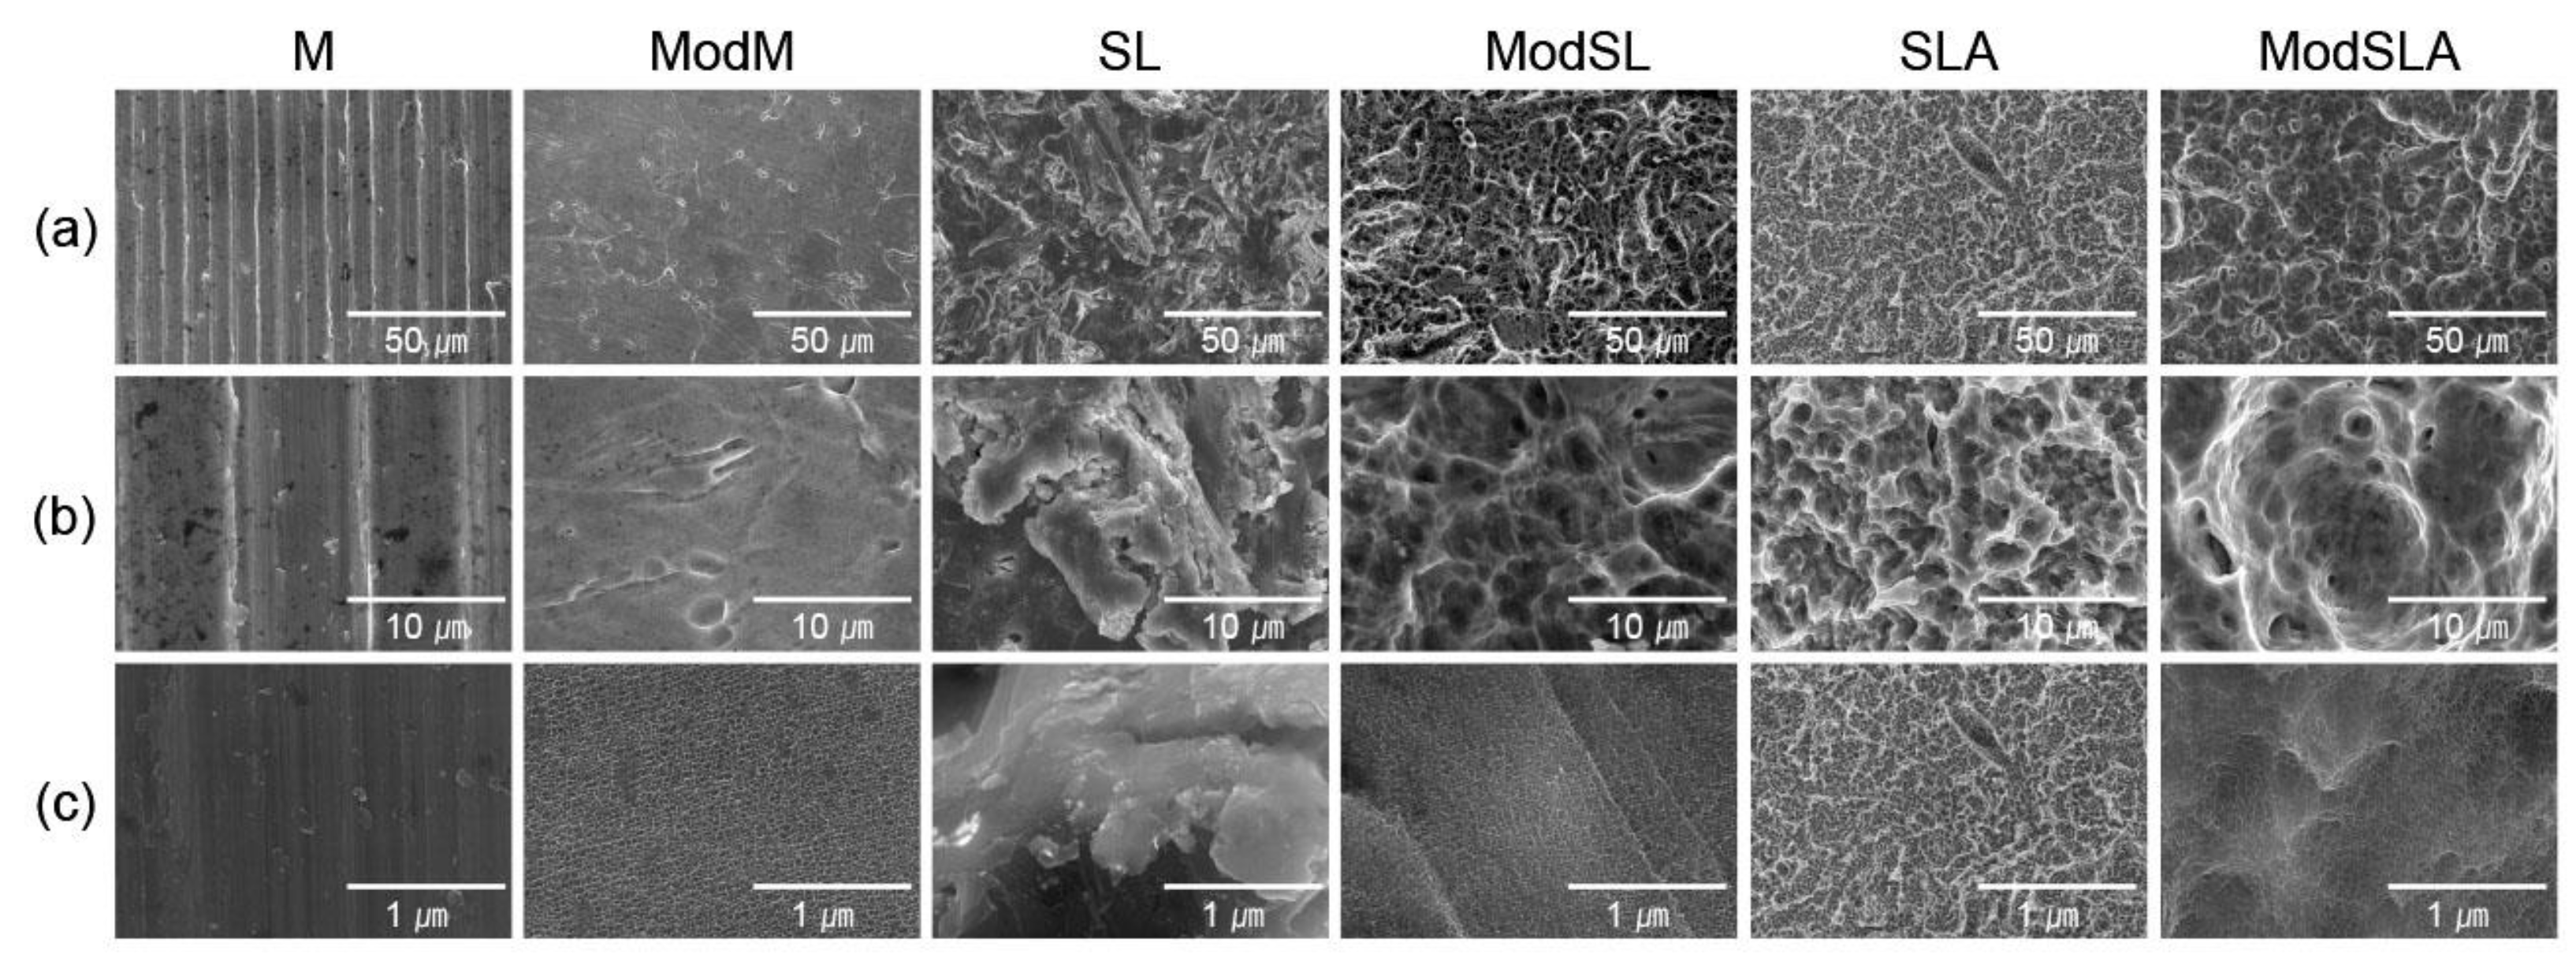
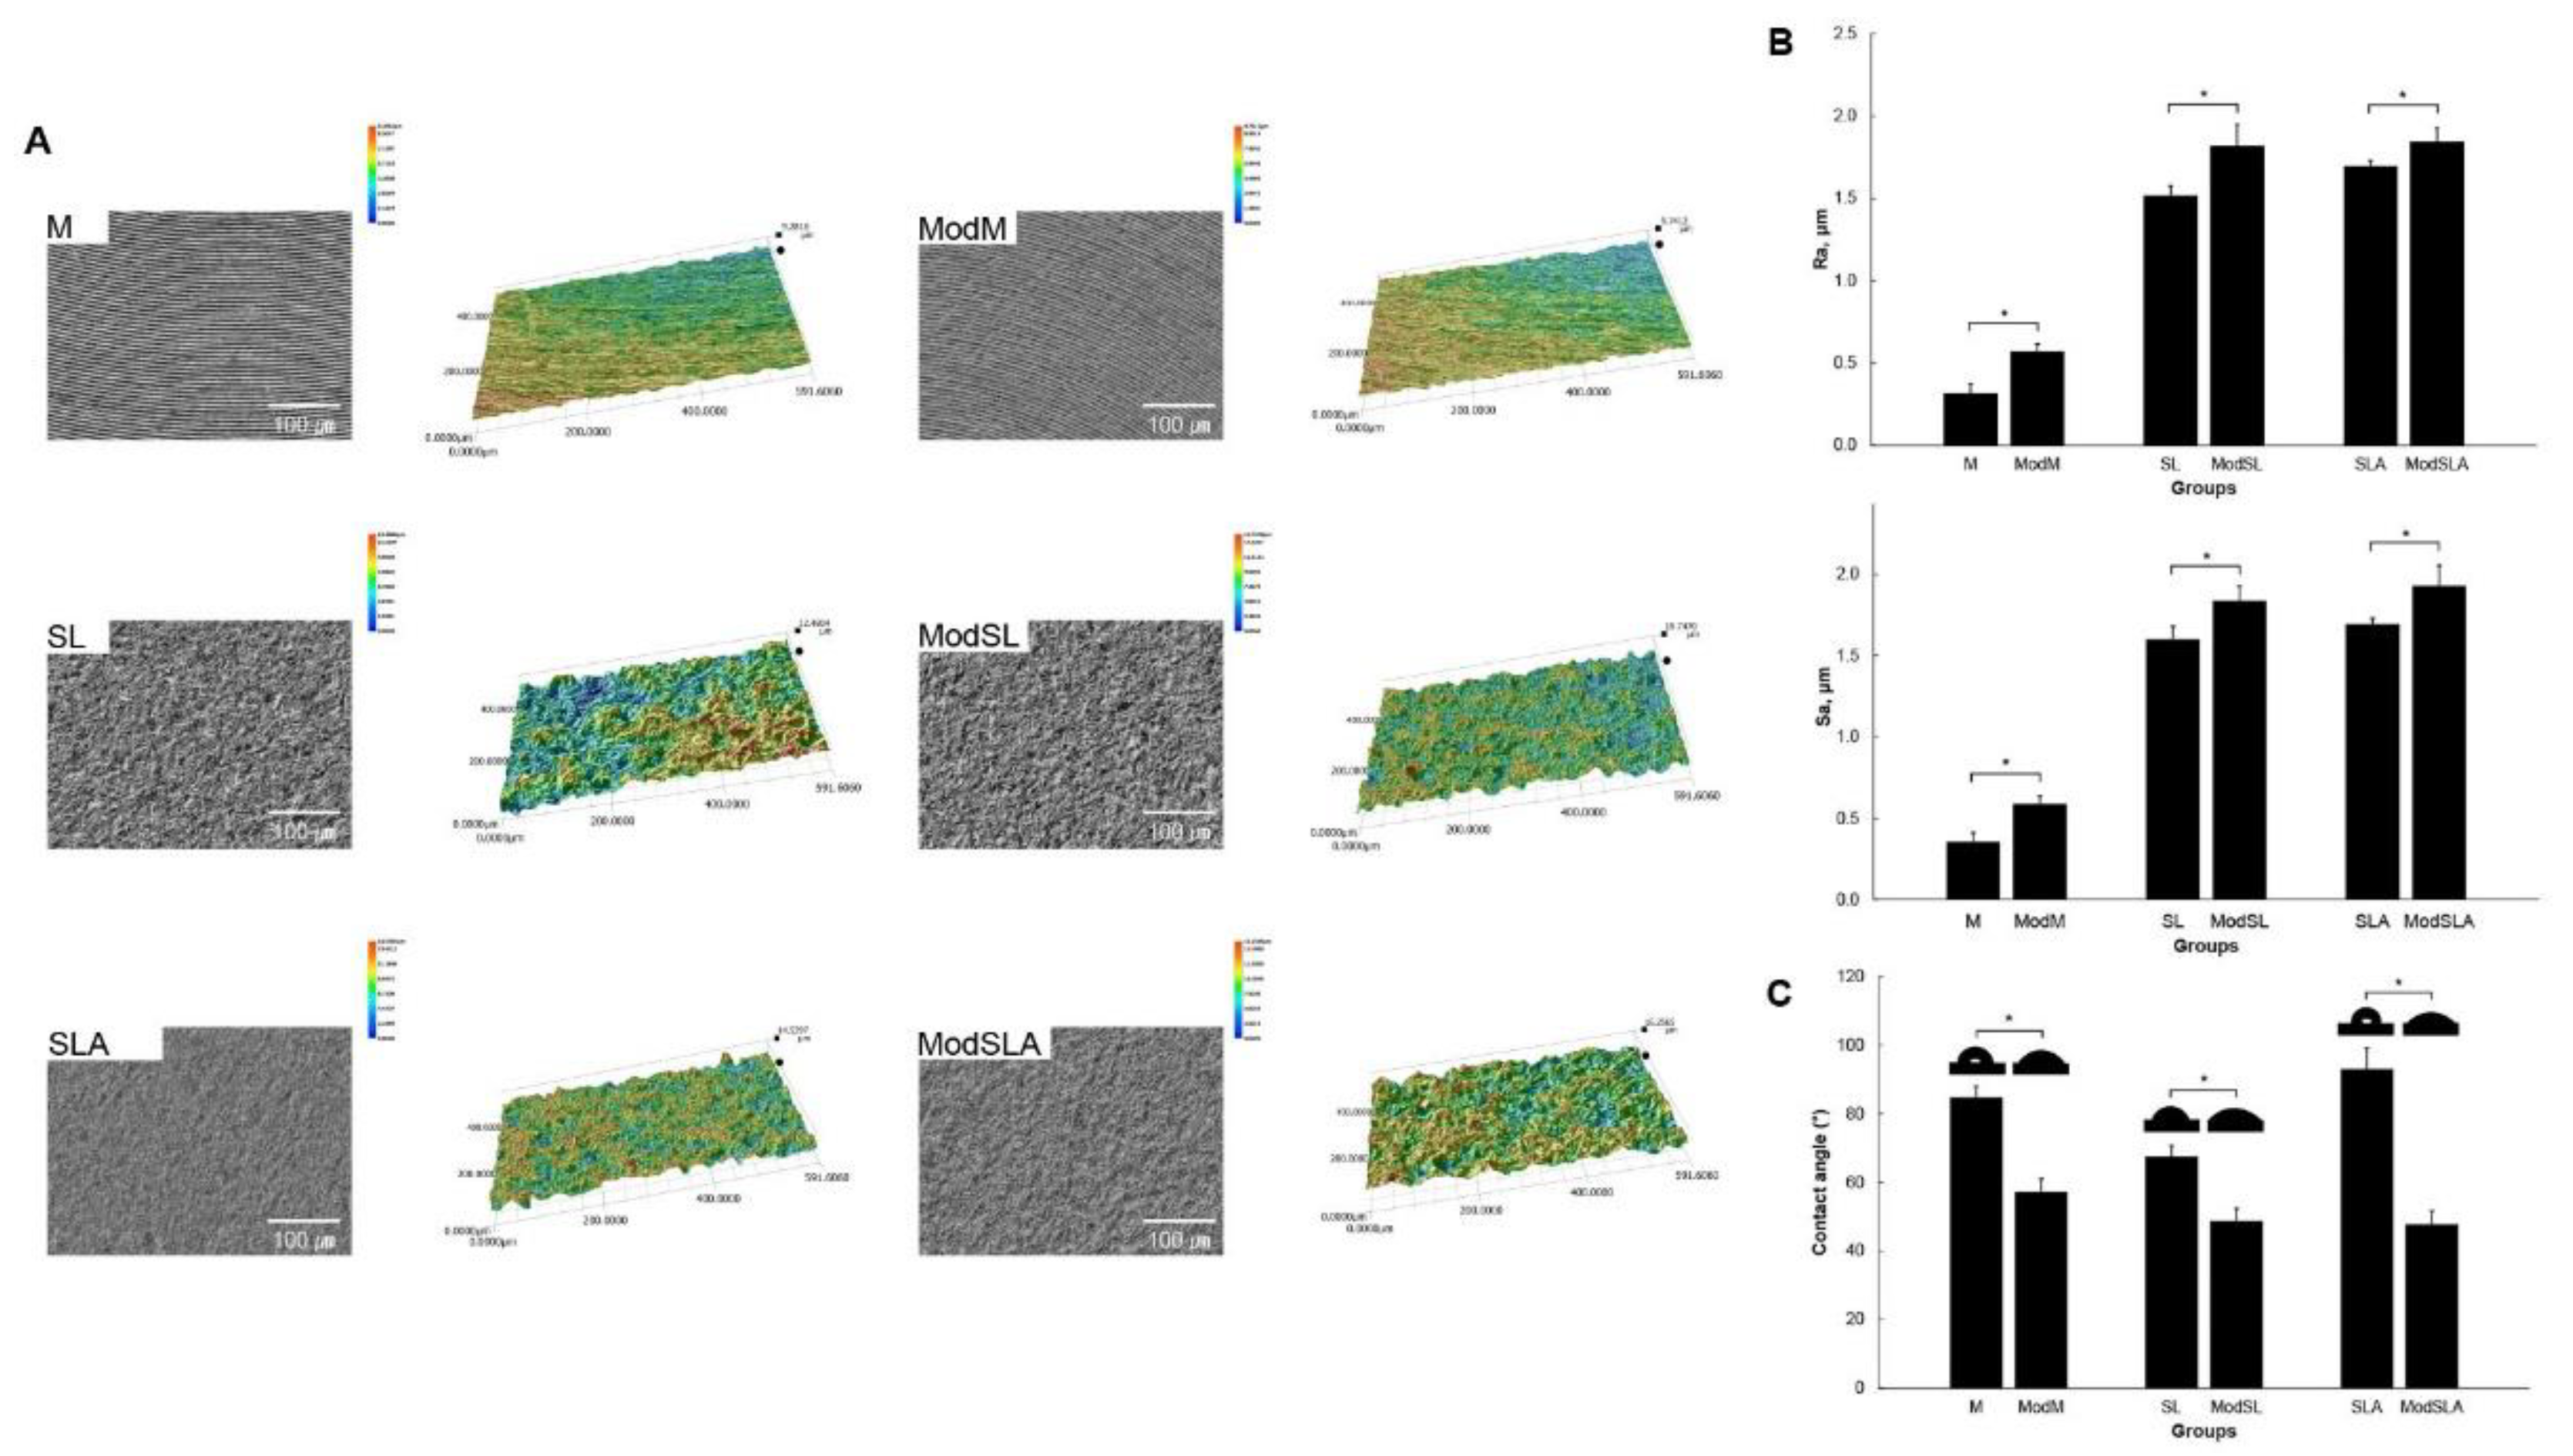
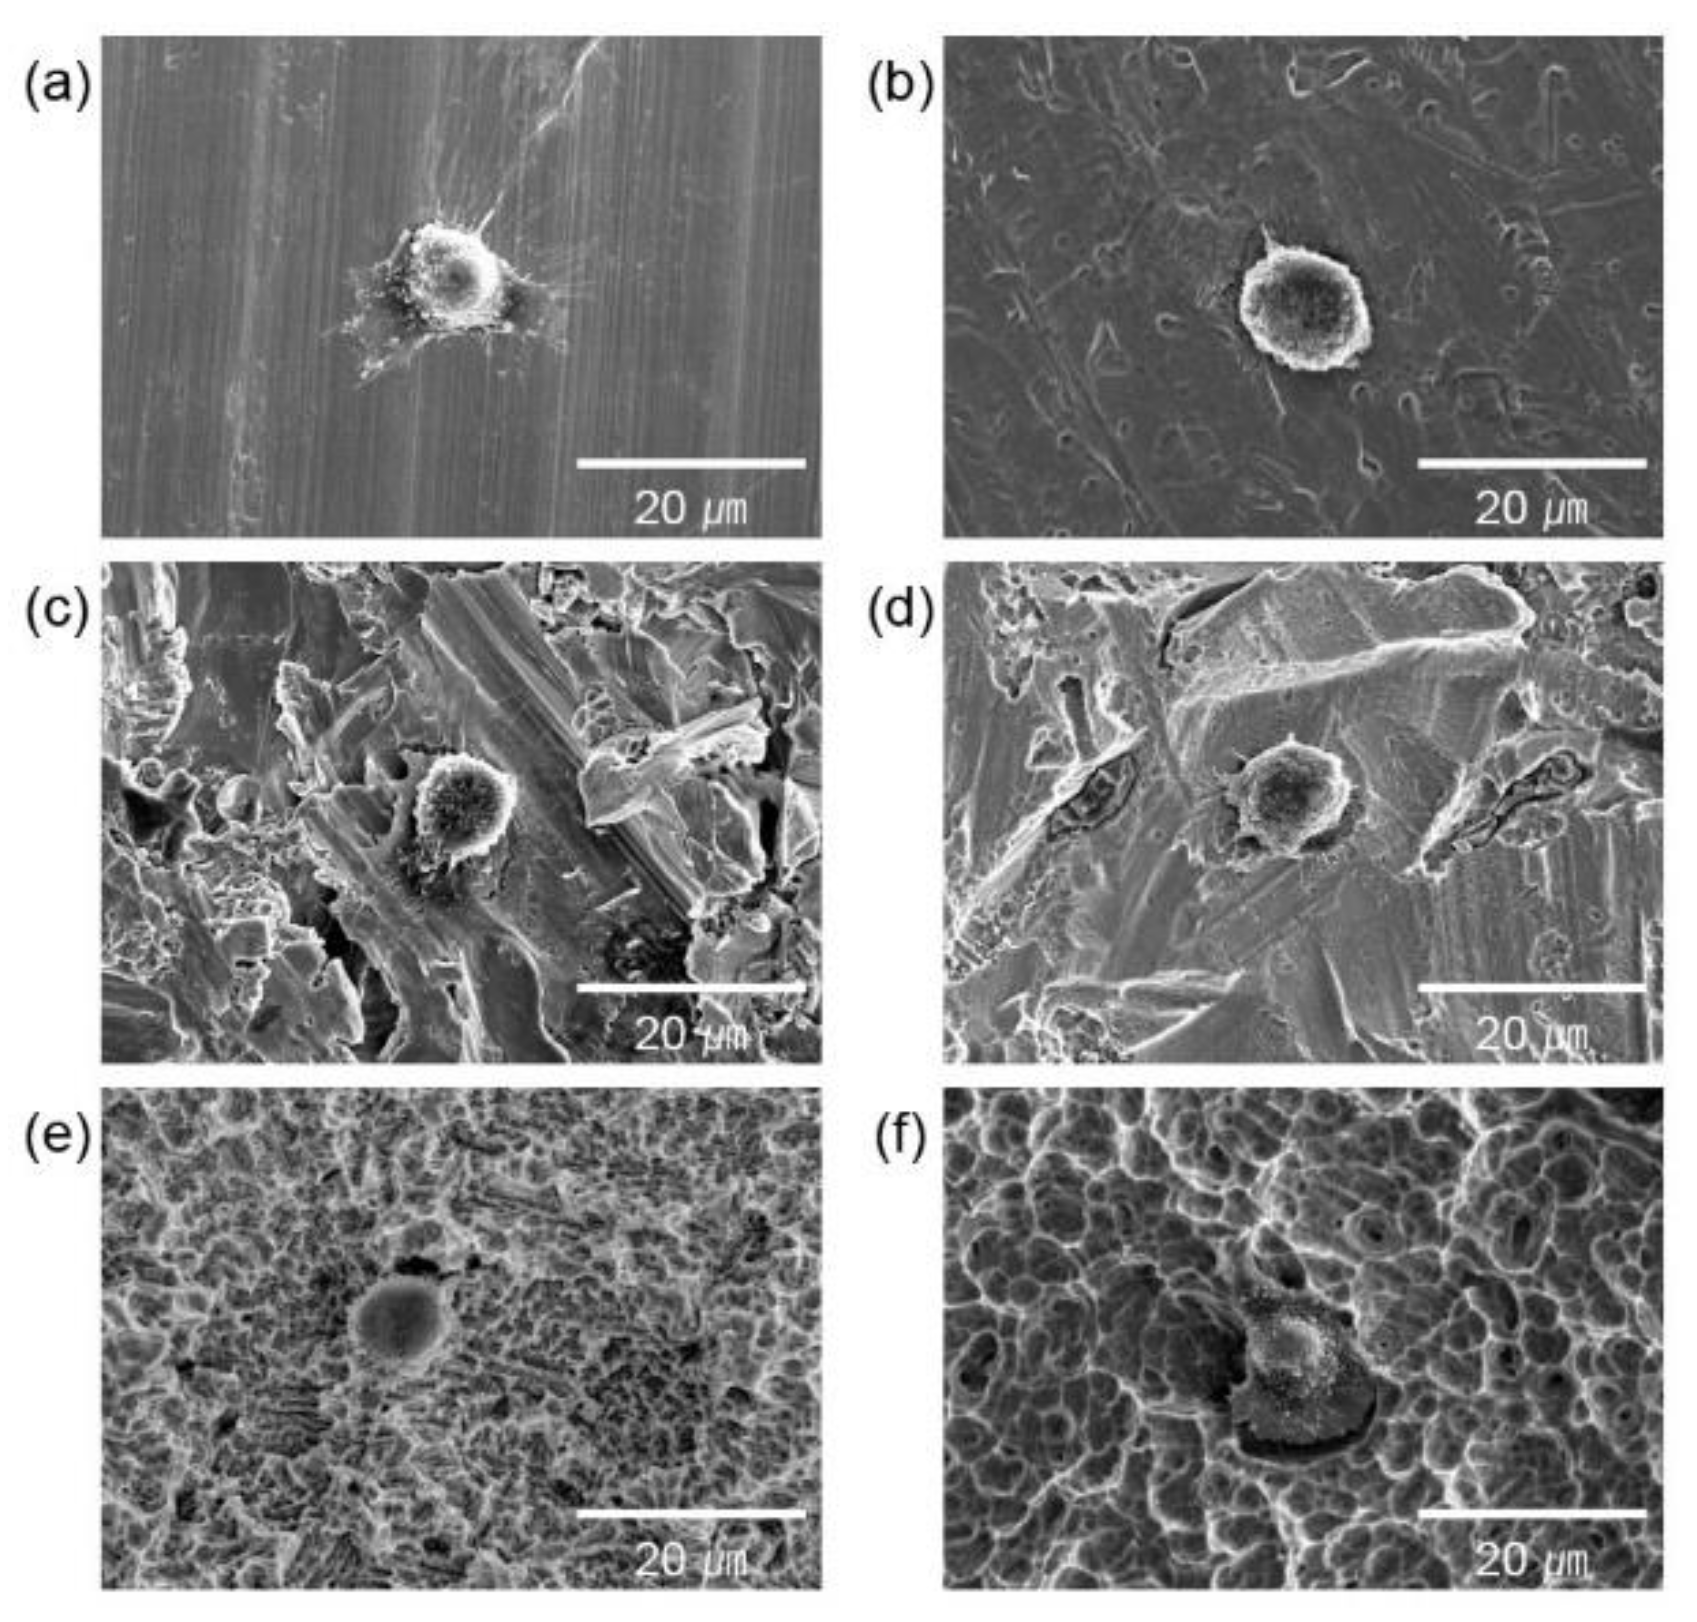
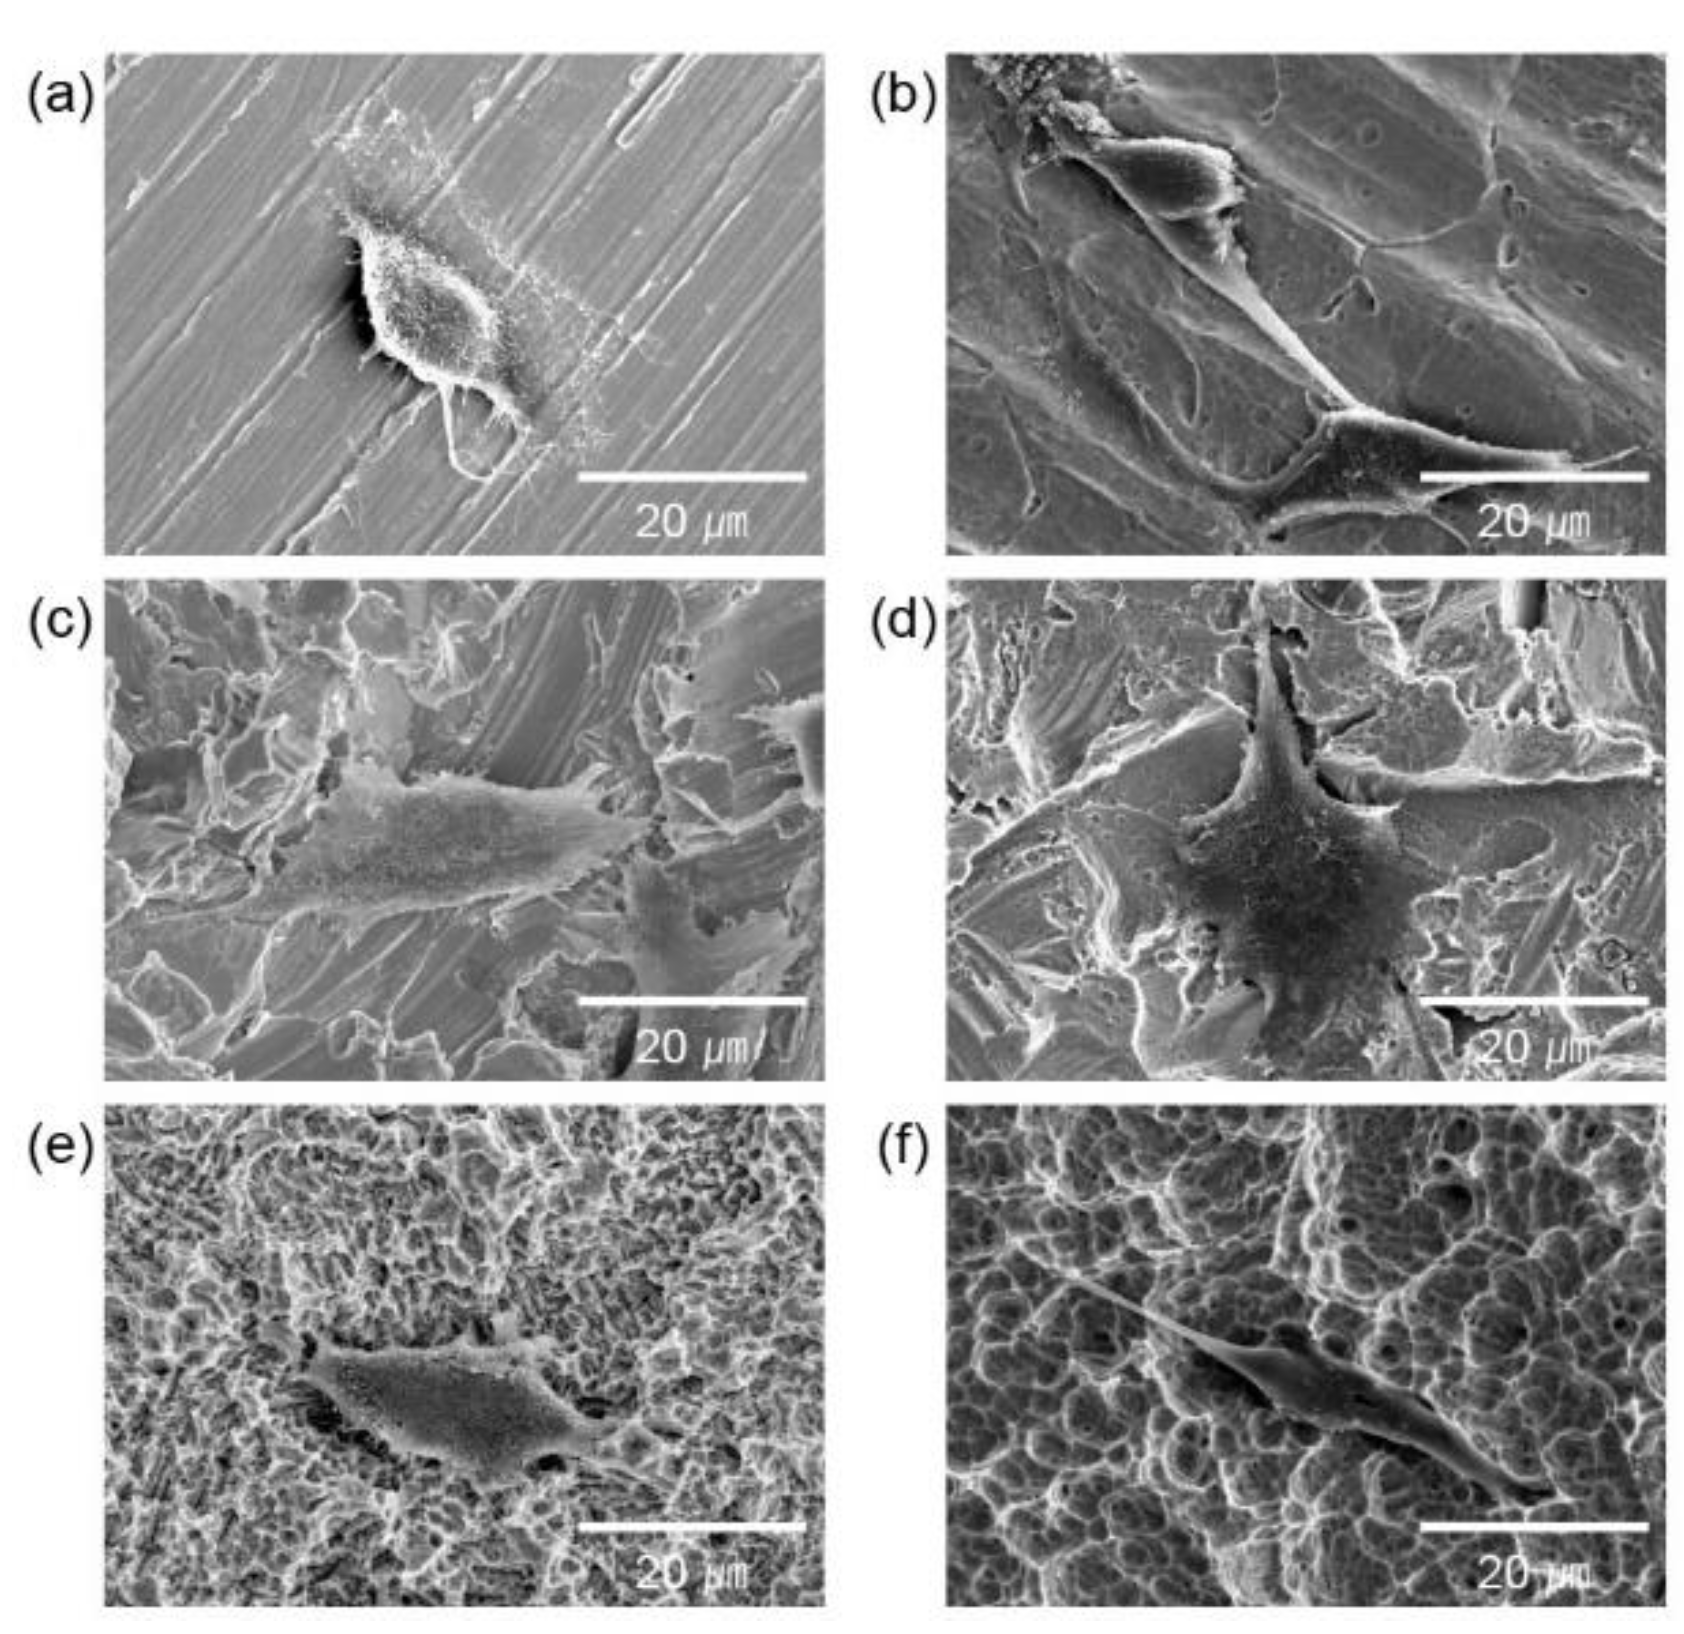
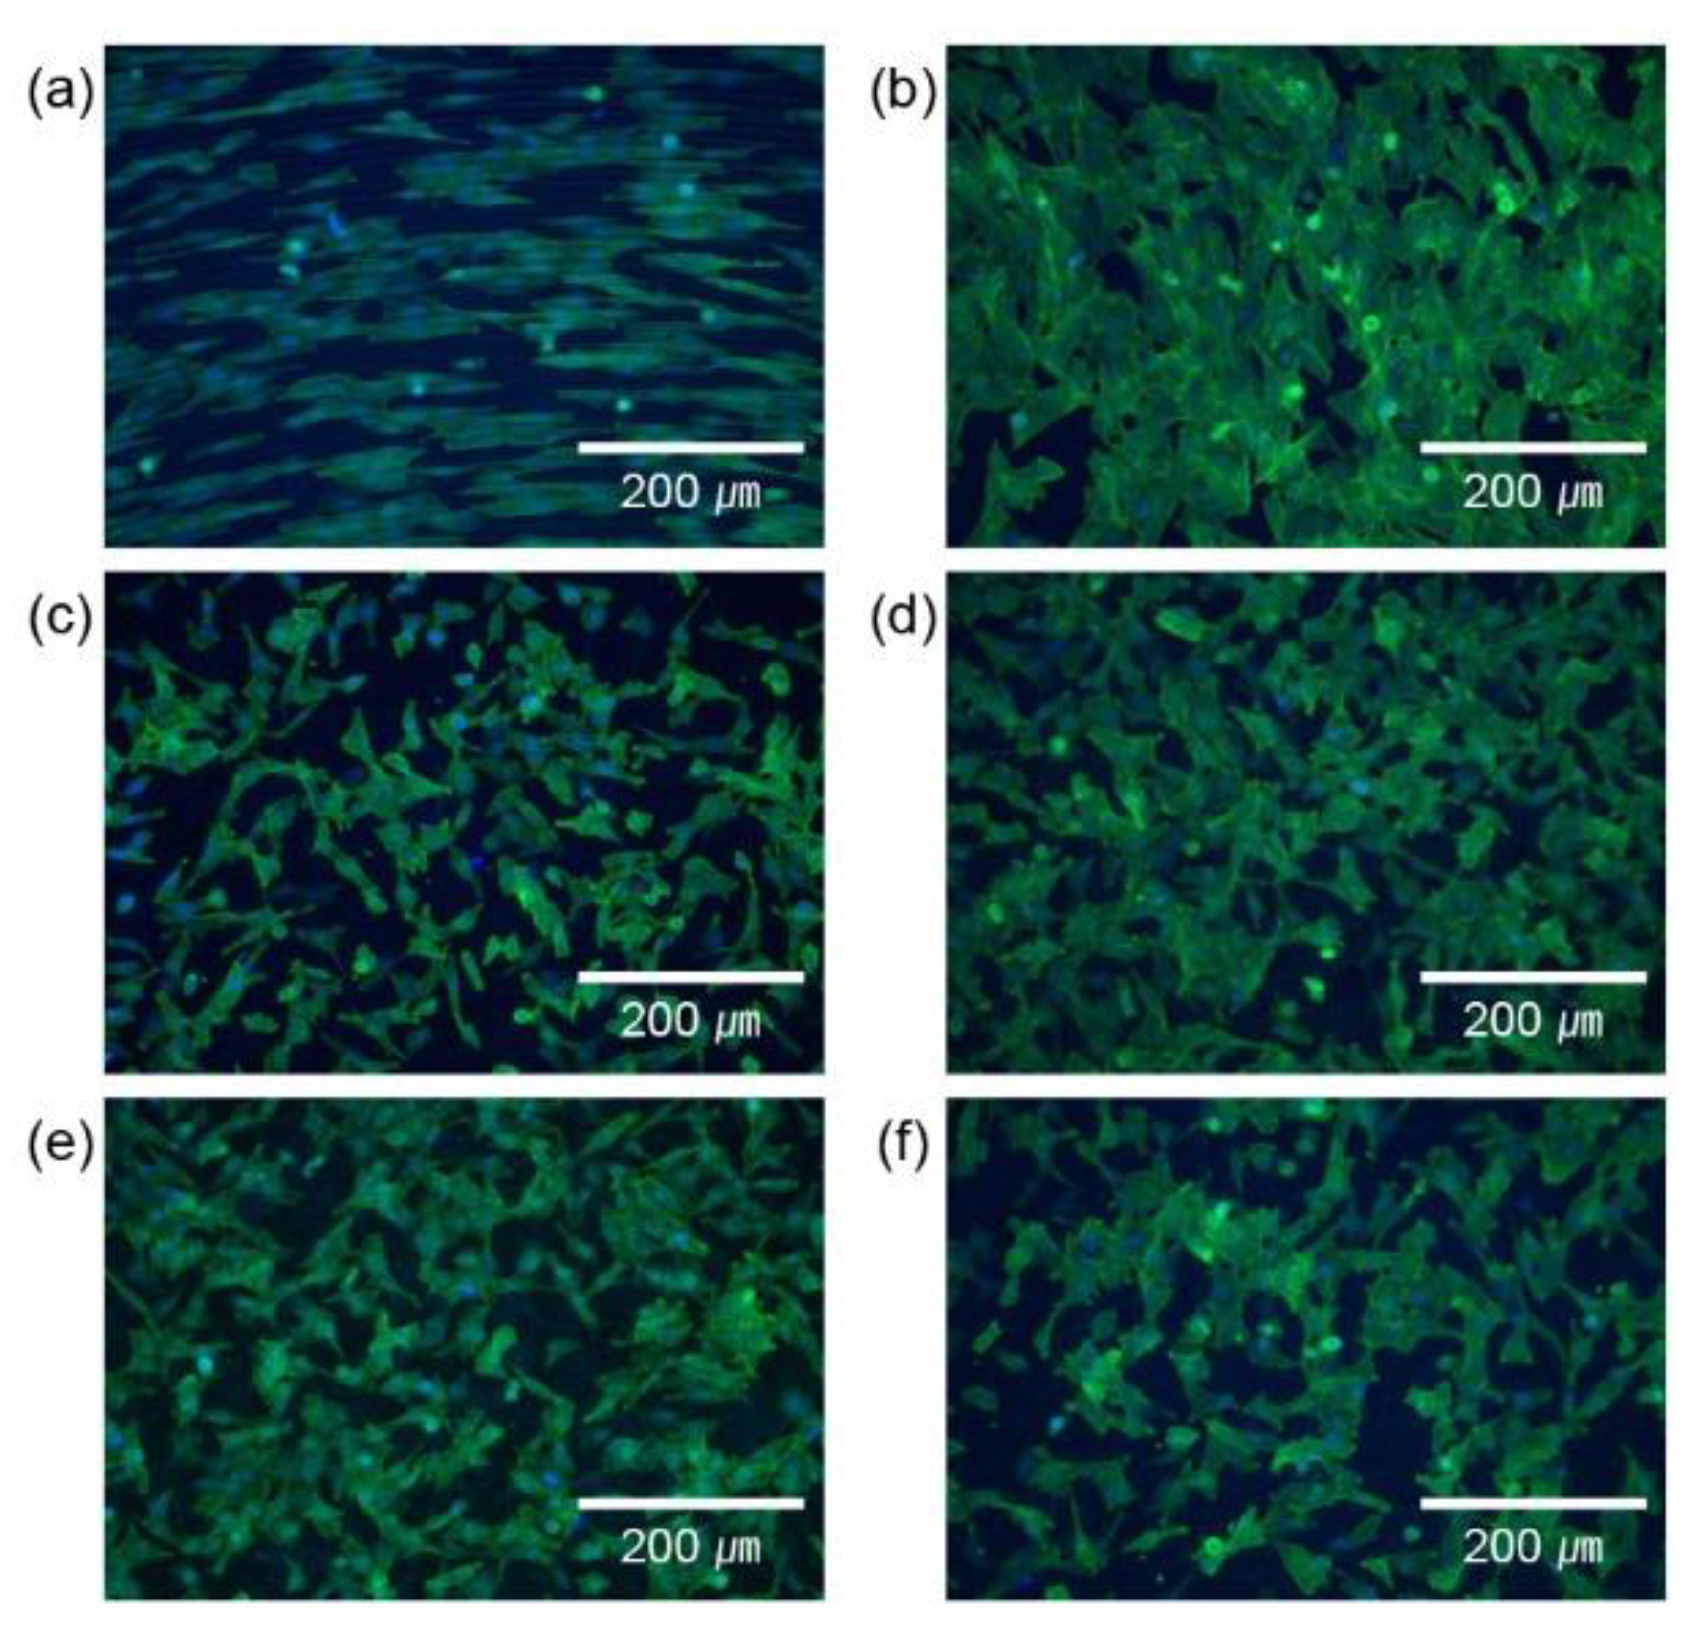
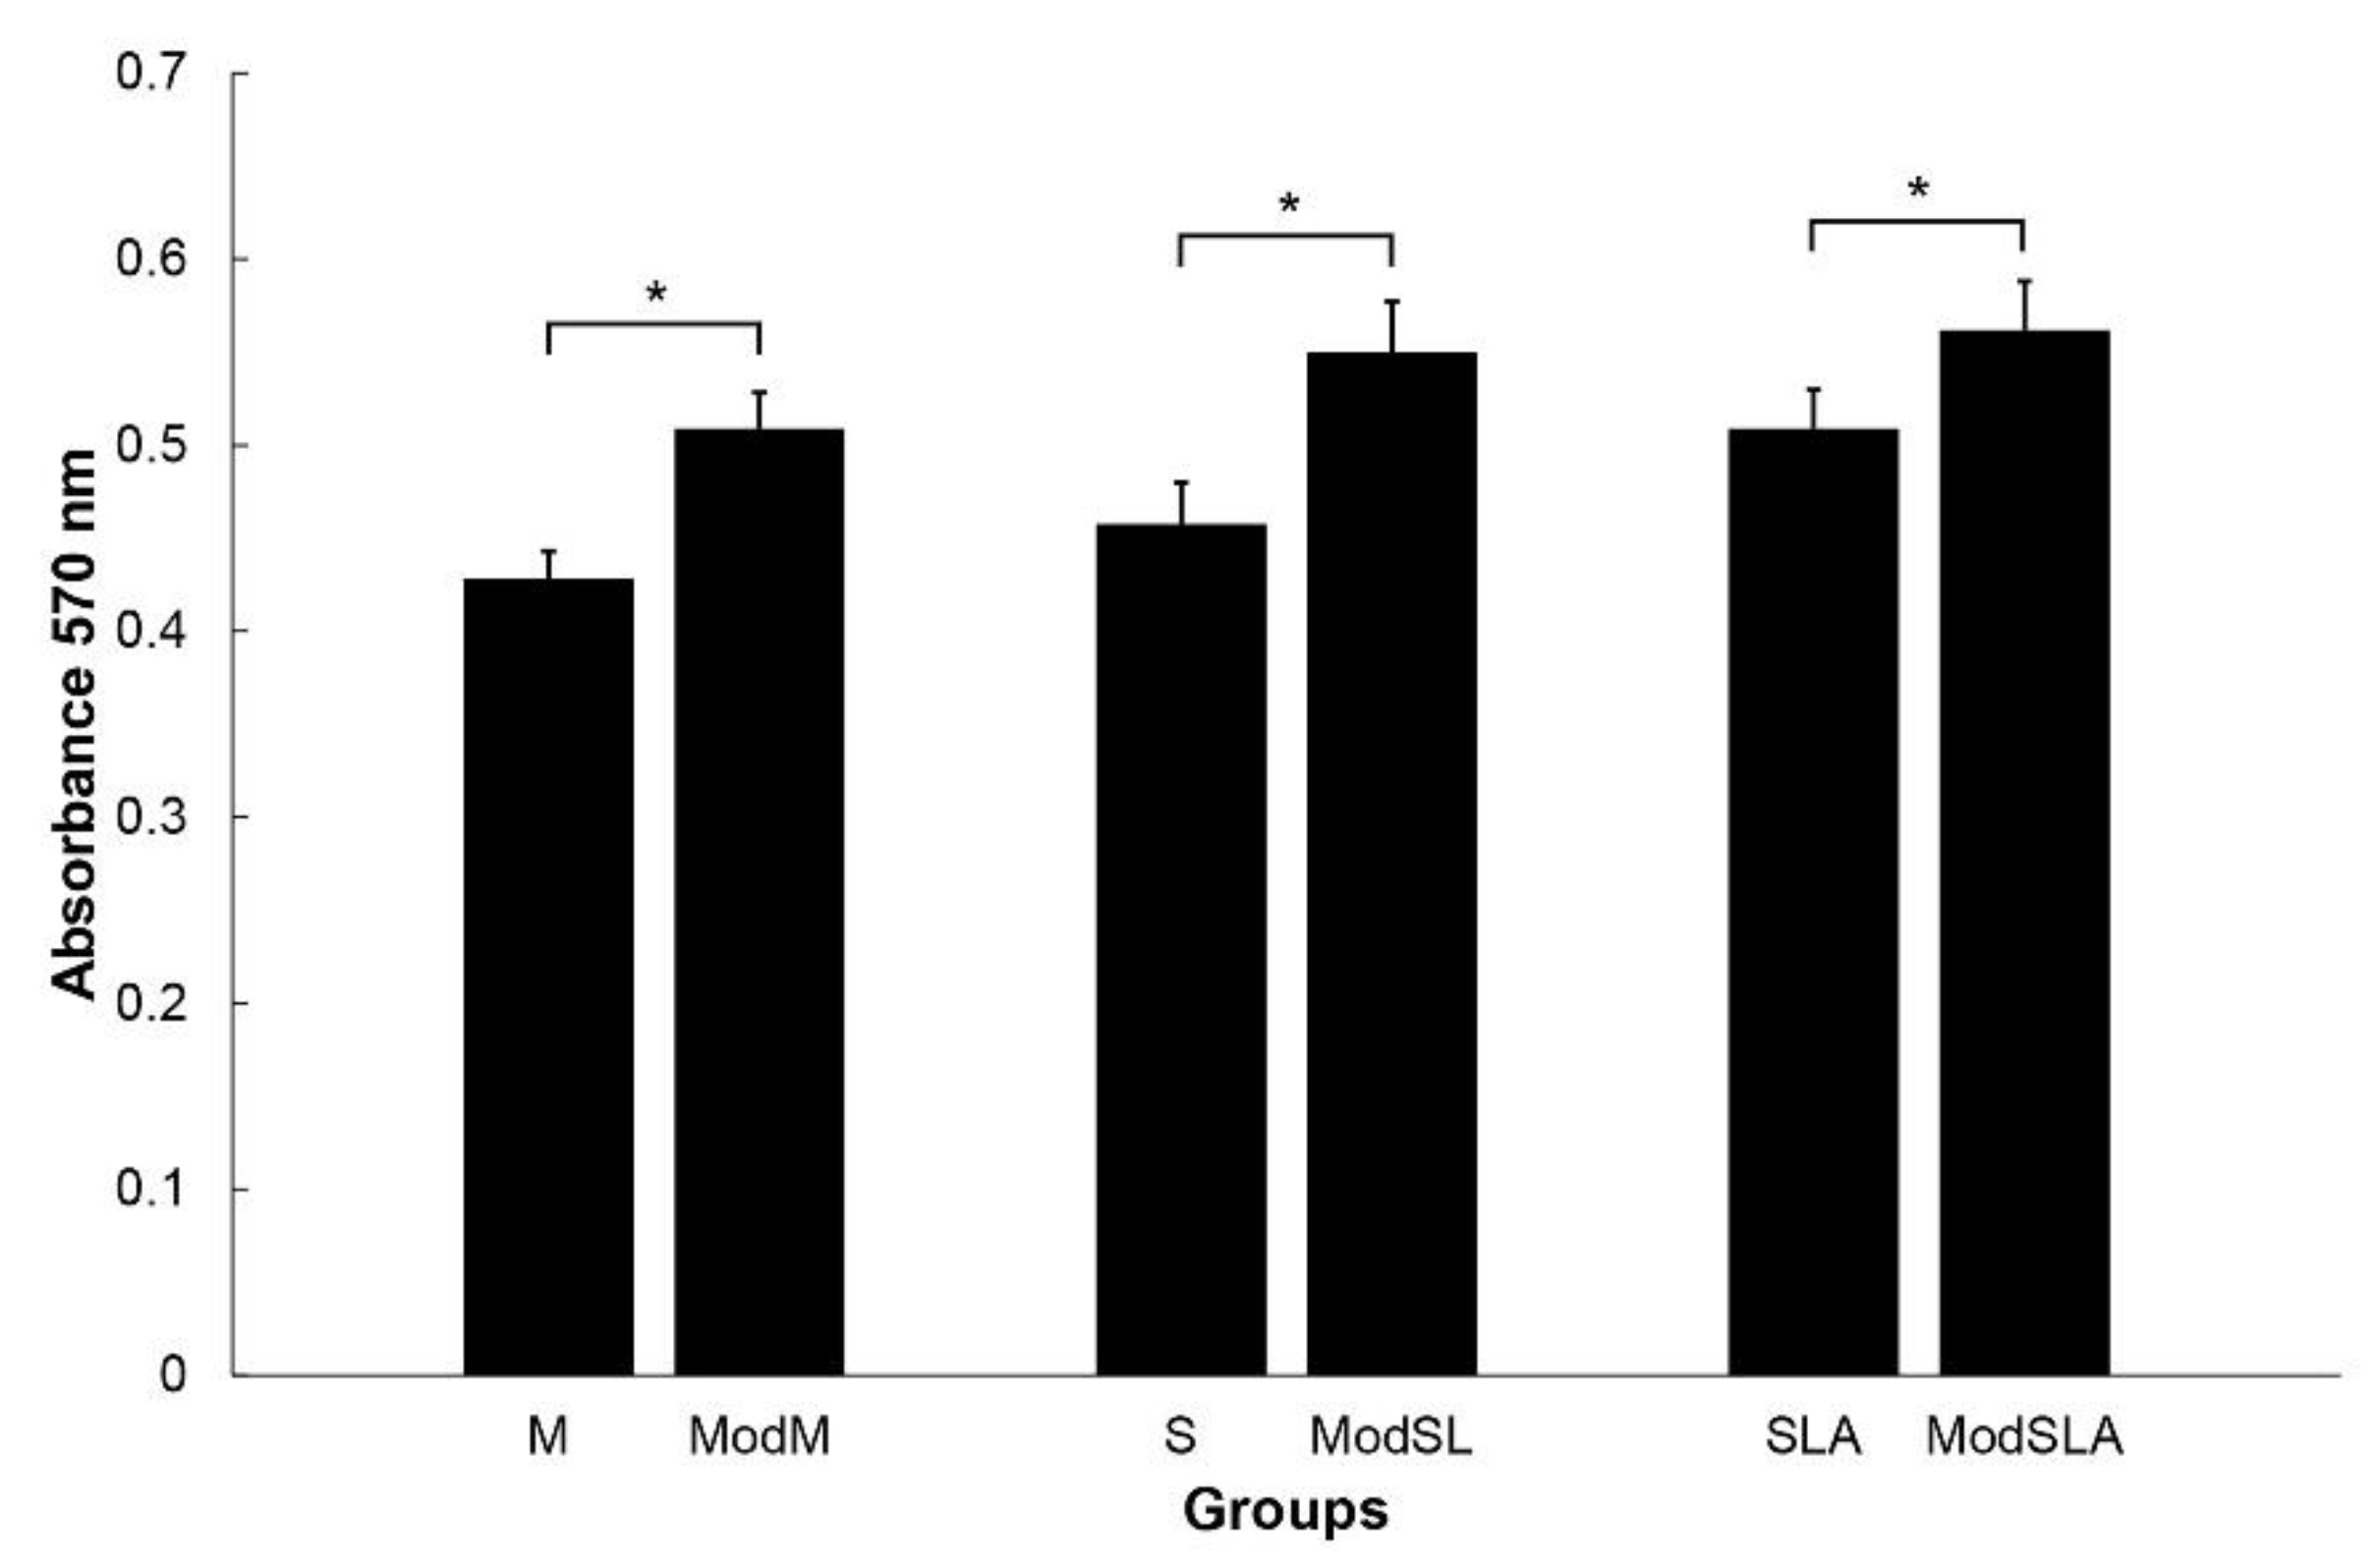
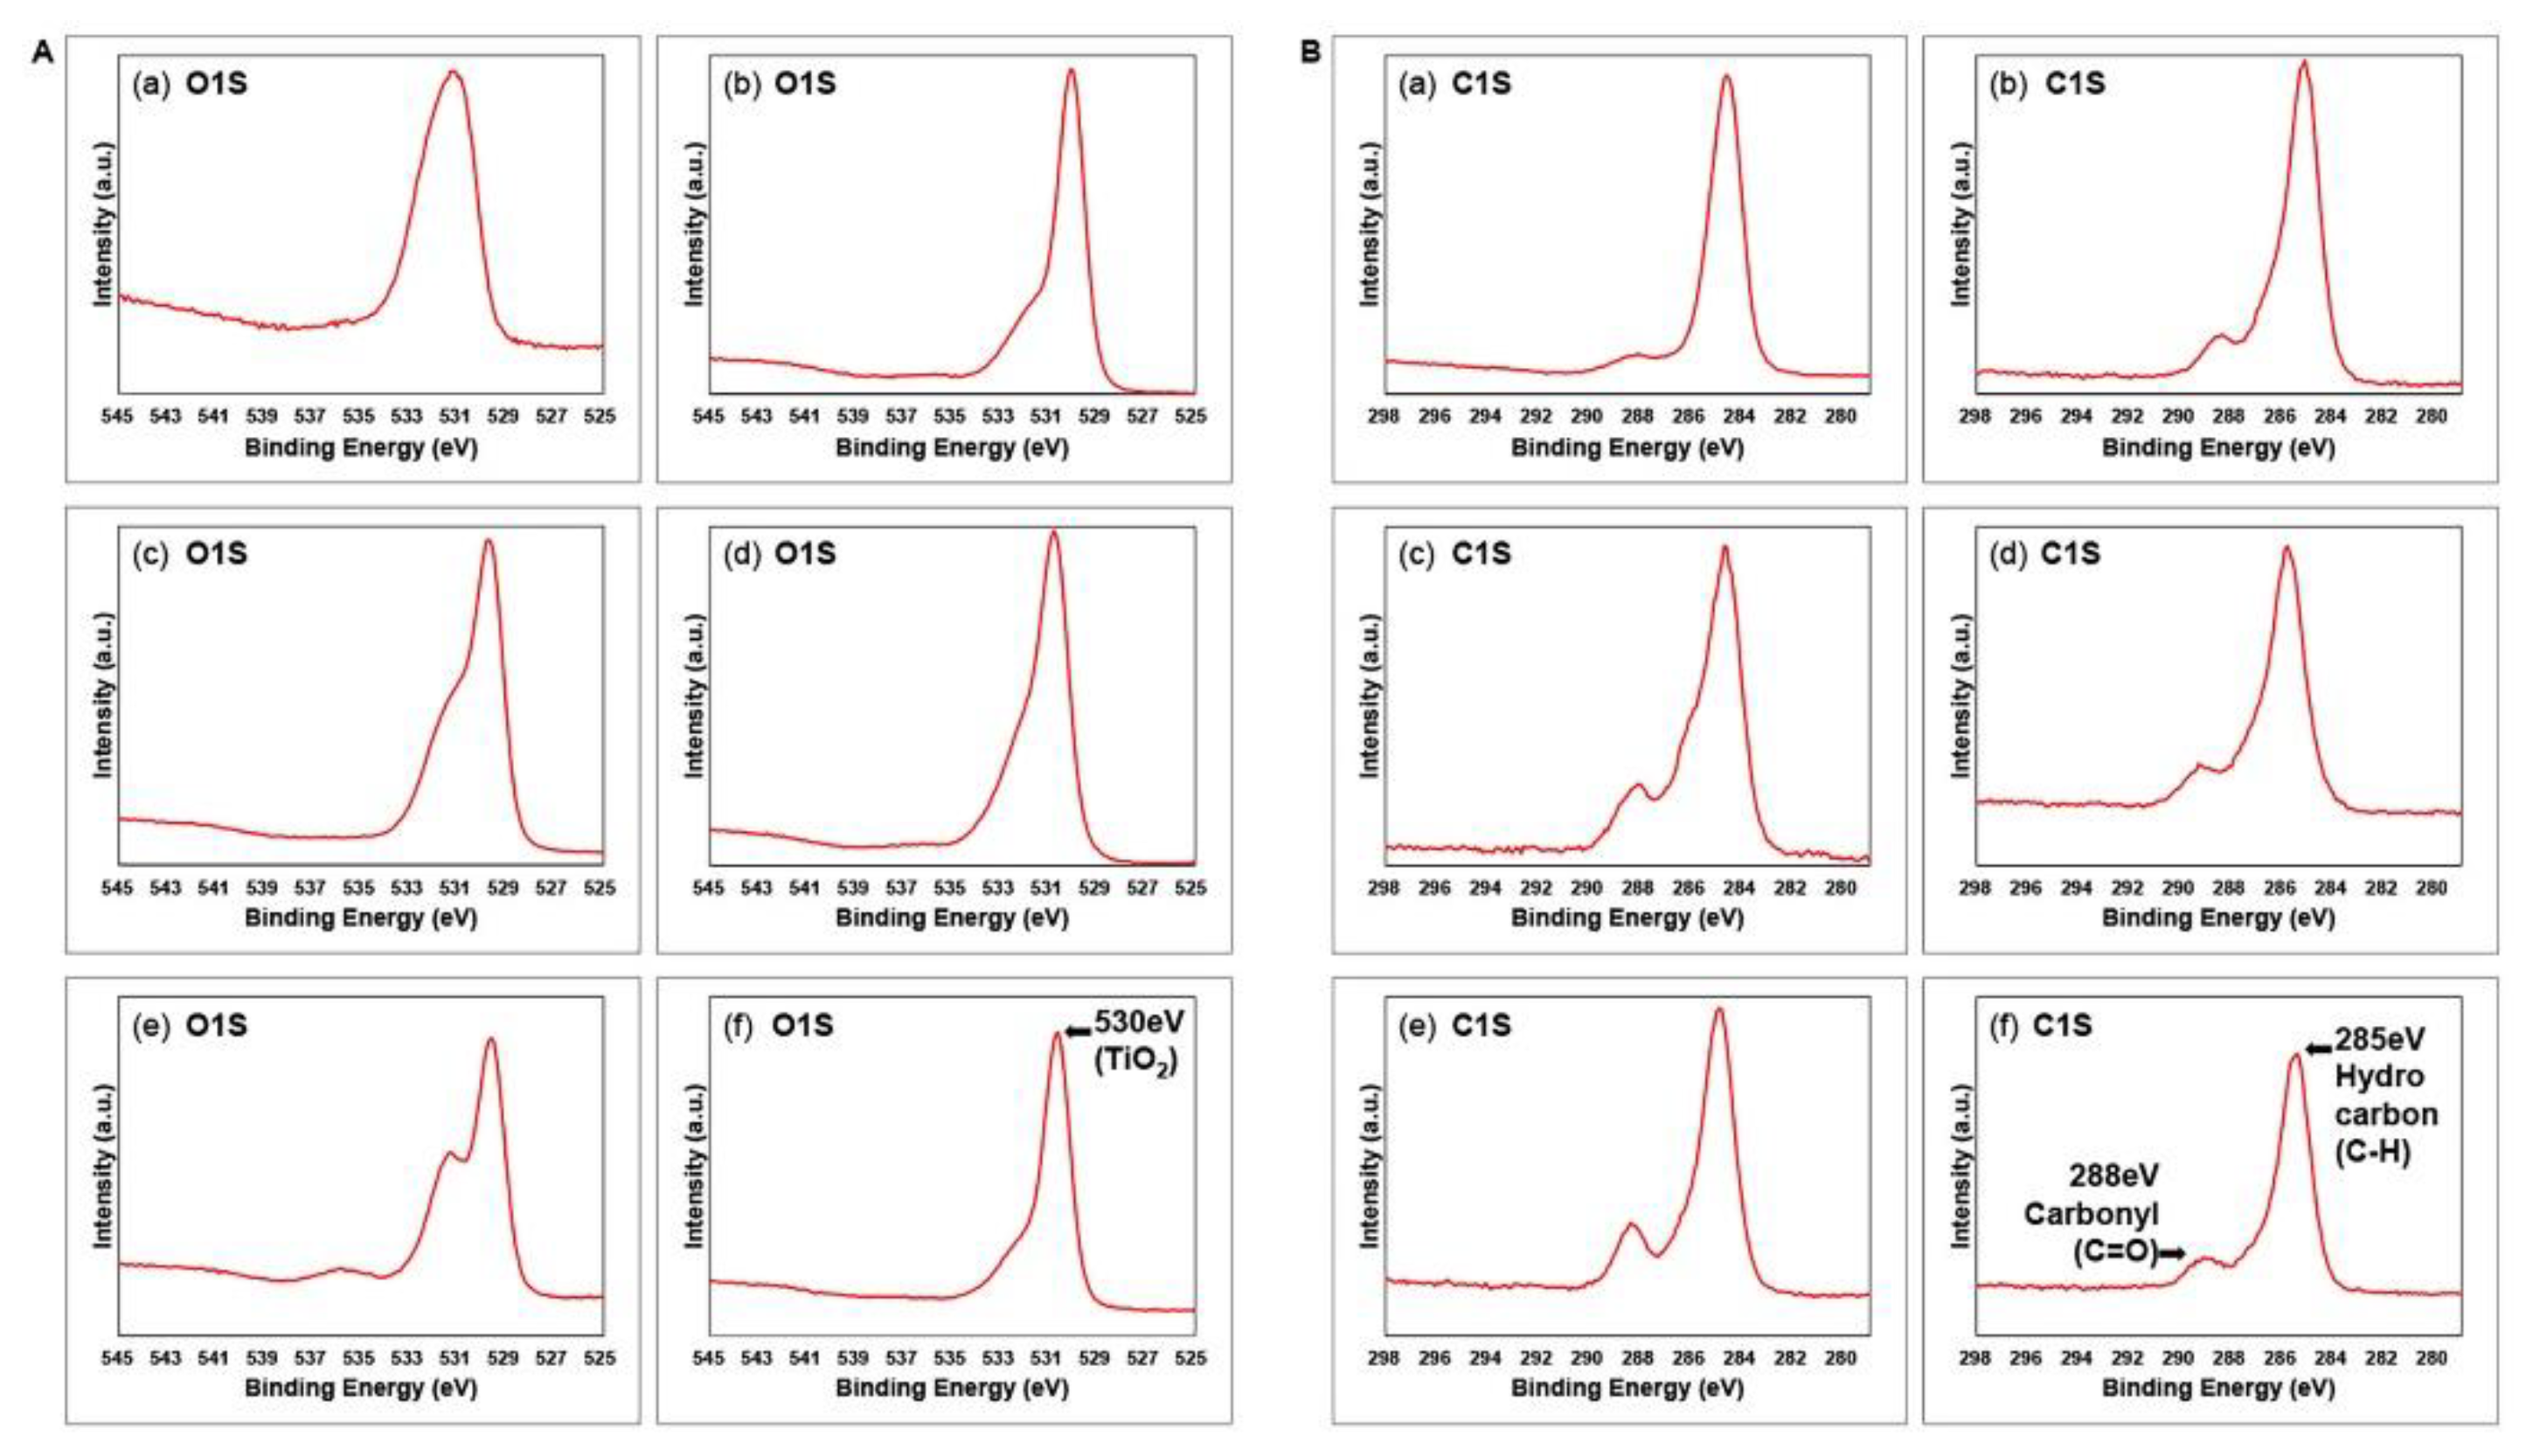
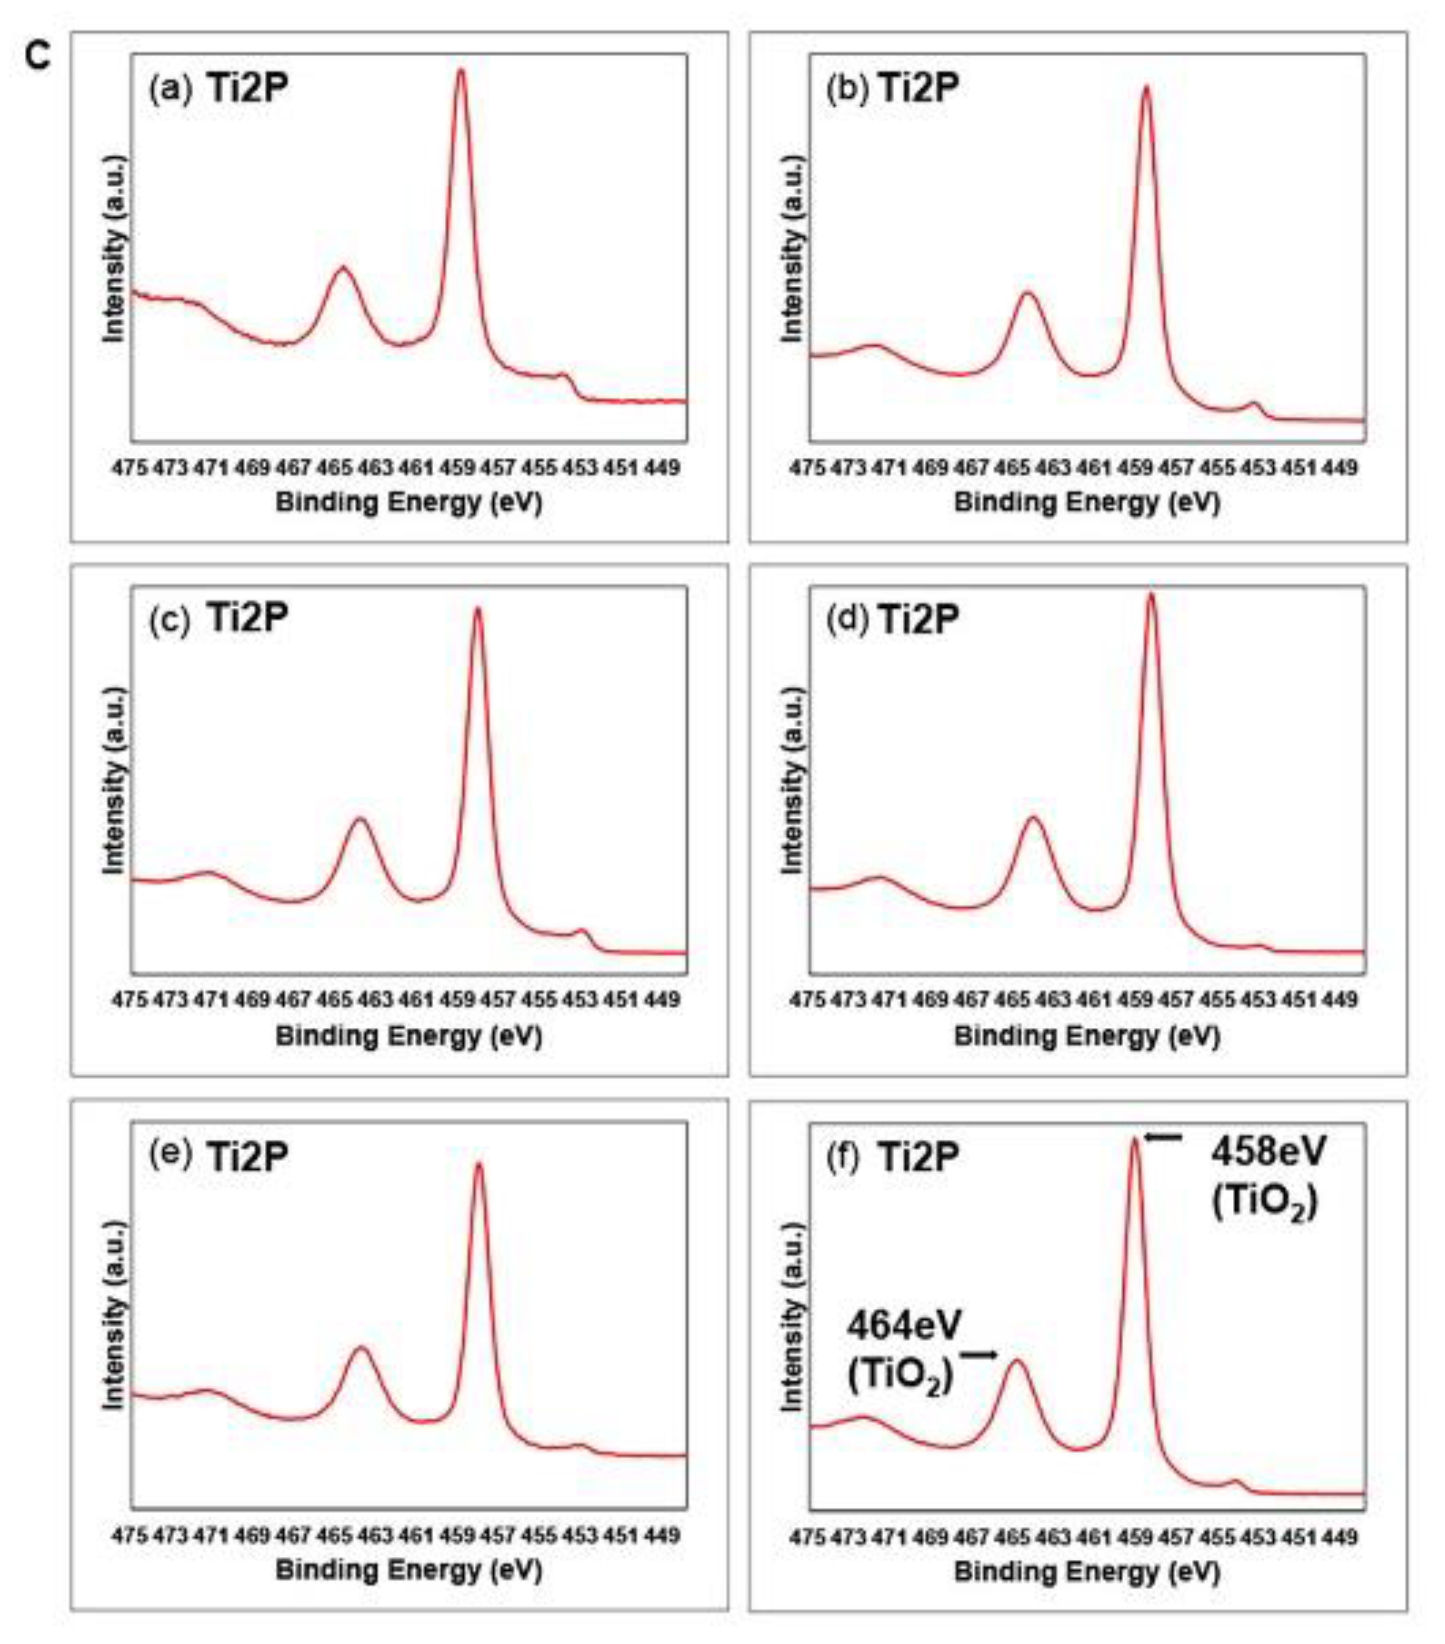
| Group (n = 10) | Surface Treatment |
|---|---|
| M | No surface treatment |
| ModM | No surface treatment + eco-friendly solutiona) etching |
| SL | Alumina sandblasted |
| ModSL | Alumina sandblasted + eco-friendly solution etching |
| SLA | Alumina sandblasted + acid-etching |
| ModSLA | Alumina sandblasted + acid-etching + eco-friendly solution etching |
| Element | Machined | Sandblasted | SLA | |||||||||
|---|---|---|---|---|---|---|---|---|---|---|---|---|
| M | ModM | SL | ModSL | SLA | ModSLA | |||||||
| at% | BE | at% | BE | at% | BE | at% | BE | at% | BE | at% | BE | |
| M | 5.2 | 459.0 | 19.6 | 458.6 | 16.3 | 458.1 | 17.7 | 458.4 | 14.0 | 458.2 | 21.0 | 459.2 |
| SL | 24.7 | 531.1 | 46.2 | 530.1 | 56.0 | 529.8 | 54.2 | 529.9 | 44.0 | 529.7 | 47.5 | 530.7 |
| SLA | 69.9 | 284.7 | 34.1 | 285.2 | 27.5 | 284.8 | 27.9 | 285.0 | 41.9 | 284.9 | 31.3 | 285.5 |
Disclaimer/Publisher’s Note: The statements, opinions and data contained in all publications are solely those of the individual author(s) and contributor(s) and not of MDPI and/or the editor(s). MDPI and/or the editor(s) disclaim responsibility for any injury to people or property resulting from any ideas, methods, instructions or products referred to in the content. |
© 2023 by the authors. Licensee MDPI, Basel, Switzerland. This article is an open access article distributed under the terms and conditions of the Creative Commons Attribution (CC BY) license (http://creativecommons.org/licenses/by/4.0/).


