1. Introduction
Nowadays, cancer is a growing disease worldwide. Infographics on the World Cancer Day website estimate that 10 million people died of cancer in 2020. The World Health Organization (WHO) on its website has confirmed that cancer is one of the leading causes of death worldwide. The report 'The Numbers of Cancer in Italy - 2020' by the Italian Medical Oncologists Association (AIOM) indicates that there were an estimated 18 million cases of cancer in 2018. In terms of prevention, the focus is on interventions aimed at reducing the incidence of the disease through reduced exposure to risk factors, and through attempts to increase health resistance at individual level. Early detection of cancer and appropriate treatments increase the chances of survival and cure. Type and stage of cancer suggest the most suitable therapy to be applied; to date, the most commonly used treatments are chemotherapy, radiotherapy, hormone therapy, immunotherapy, surgery, etc., either as single strategy and possibly in combination [
1]. Standard protocols, however, have several downsides, including not being able to distinguish between healthy and cancerous cells. In fact, the main expected feature from any antitumor treatments should be that they have few toxic effects and the ability to kill tumor cells without damaging healthy tissues. In this regard, in recent years, there has been an increased demand for research and screening of new anti-cancer agents, including plant bioactive substances, that have few side effects during tumor management. About 35,000 phytoconstituents have been obtained from terrestrial and marine sources, to be potentially employed in standard cancer therapies [
2]. It is known in the literature that various plant metabolites, such as flavonoids, phenolics, terpenoids, saponins, and alkaloids, show potent chemoprotective activity against different types of cancer cells, triggering apoptosis and cell cycle arrest, modulation of tumor-suppressive microRNAs, inhibition of oncogenes, and anti-apoptotic factors [
3]. The mechanisms of action of these bioactive compounds are different and may include: i) reduction of oxidative stress-mediated DNA damage; ii) induction of cell cycle checkpoint arrest in G1, G1/S, S and G2/M phase to promote apoptosis; iii) reduction of anti-apoptotic protein levels; iv) induction of the expression of several cell cycle inhibitors, such as p53, p21 and p27, and apoptotic markers, such as the cell death agonist BCL2-associated X protein (BAX), Caspase3, Caspase7, Caspase 8, Caspase 9, etc [
4,
5].
Punica granatum L. (pomegranate) belongs to the family Lythraceae (Punicoideae subfamily) and it is considered as an ornamental tree indigenous to Mediterranean regions and Iran. Since ancient times, this plant has found application in traditional medicine, such as in treatment of gastrointestinal, cardiovascular, and endocrine diseases. Indeed, seed, flower, bark, peel, juice, and leaves of pomegranate are rich in potentially bioactive compounds, making it a functional food [
6,
7,
8]. Numerous biological studies, focused on the phytocomplexes extracted from pomegranate fruit, have demonstrated the nutraceutical and nutritional properties of this plant extract. Acids, sugars, vitamins, minerals, and secondary metabolites, like simple phenols, flavonoids, anthocyanins and tannins, are considered the main phytochemicals of pomegranate derivatives that present anti-inflammatory, antibacterial, anticarcinogenic, antihypertensive, and antiviral activities [
9,
10]. In particular, several studies showed that pomegranate, containing high amount of polyphenols, exhibits anti-inflammatory effects and absence of toxicity, representing an excellent adjuvant to be used in combination with standard anti-cancer therapies [
11], As well as the remarkable antioxidant capacity of
P. granatum fruit peel was shown to reduce the breast cancer cell proliferation, inducing apoptosis [
12].
In this study, phytocomplexes were isolated from pomegranate fruits using an extraction technique based on hydrodynamic cavitation (HC) processes, consisting in the creation of a periodic depression in a liquid mixture, for example by means the circulation of the liquid through a nozzle of suitable geometric shape. Vapor filled nano- and micro-bubbles, created when the pressure of the circulating liquid or liquid-solid mixture falls below the vapor pressure, subsequently grow and eventually implode under the external force produced in the recovered pressure area. The implosion events release extremely intense energy pulses in the form of pressure shock-waves, hydraulic jets, extreme transient heating, and chemical dissociation reactions [
13]. The remarkable effectiveness, efficiency, yield and scalability of HC in the field of the extraction of natural products have been widely proven [
14], as well as HC was recently suggested for the first time for the application to the extraction of whole pomegranate fruits [
15]. Extracts collected at different times during the HC-based process were biochemically characterized. Then, the possible antiproliferative capacity of the most antioxidant extract was evaluated against the human breast cancer line (AU565-PAR), as well as possible cytotoxic effects were evaluated on peripheral blood mononuclear cells (PBMCs) from healthy donors.
2. Materials and Methods
2.1. Raw Materials and Extraction Process
Whole pomegranate fruits from the Wonderful variety were purchased from a local producer in Apulia region, south-eastern Italy, in mid-November, i.e. in the second half of the harvest period, and processed the day after.
According to a recent comprehensive review, research has not yet identified a sufficiently effective, efficient, affordable and scalable technique for the extraction of whole pomegranate fruits, including the byproducts left after squeezing the juice, although industry has progressed independently, offering important pomegranate-based ingredients widely used in food supplements [
15]. In the same review, for the first time HC was suggested as a promising extraction technique, based on the previous experience with plenty of natural products.
In this study, the extraction of whole pomegranate fruits in water was performed using a semi-industrial scale (200 liters) HC pilot device, optimized for food applications. The details of the HC-based extractor, comprising a closed hydraulic circuit with a centrifugal pump and a circular Venturi-shaped reactor as the key components, along with the meaning of the cavitation number as a measure of cavitation intensity and regime, were those described in a previous study [
16]. No active heat dissipation method was applied. Power and energy consumption were measured by means of a three-phase digital power meter (IME, Milan, Italy, model D4-Pd). An amount of 48 kg of whole fresh pomegranate fruit, including the thick peel, was ground in ice to coarse pieces, with maximum linear size around 10 mm, then pitched in the HC device, where water was added until a volume including ice equal to 100 liters. The initial temperature was 21.5°C. After filtering with a 200 µm sieve (stainless steel mesh), five samples (M1-M5 fractions) were collected at different extraction times, temperatures, and specific energy consumption, as shown in
Table 1, and stored in sterile bottles at −20 °C until analysis. The HC process was smooth, with a fairly constant cavitation number of 0.11 to 0.12, ensuring optimal cavitation yield [
14].
After thawing the extracts on ice, their volume was measured and characteristics, such as viscosity, color, and presence of particles/filaments, were assessed. Based on the obtained volume, aliquots of samples were prepared and subjected to the following analyses; in detail, pure extracts were kept as they were (CRUDE; C), freeze-dried and resuspended in water (LYOPHILIZED; L), and filtered with nitex (0.45μm) to produce the aqueous extract (AQUEOUS; A).
2.2. Total Phenolic Content Analysis
Folin-Ciocalteu spectrophotometric assay was performed to determine the amount of simple phenolic compounds present in the extracts, following the method of Impei and colleagues [
17]. After incubation with the reagents, an ELISA microplate reader (Sunrise, Tecan, Austria) was used to read the absorbance of the samples at 760 nm. The concentration of the phenolic component was estimated by a calibration curve (0–3 mg/L; R
2=0.9975), adequately prepared using gallic acid (GA) as standard. Results were expressed as micrograms (µg) of gallic acid equivalent per milligram (mg) of sample fresh weight (µg GAE/mg SFW).
2.3. Total Flavonoids Content Analysis
Aluminum chloride colorimetric method was applied to quantify flavonoids, as described in Di Marco and colleagues [
18]. For this assay, the absorbance of the samples was measured at 415 nm (using the same ELISA microplate reader), and the concentration of the total flavonoid content was calculated based on a standard curve of quercetin (Q; 0–5 mg/L; R
2=0.9975). Results were reported as µg of quercetin equivalent per mg of sample fresh weight (µg QE/mg SFW).
2.4. Determination of Condensed Tannin Content
The concentration of tannins in the samples was determined spectrophotometrically, using the method described by Weidner et al. [
19] and following the modifications reported in Impei et al. [
17]. The absorbance of the sample was measured at 510 nm. Pure catechin was used for the preparation of standard calibration curve (C; 0-300 mg/L; R
2=0.9891). The amount of total condensed tannins was expressed as µg of catechin equivalent per mg of sample fresh weight (µg CE/mg SFW).
2.5. Determination of Specific Anthocyanins by Spectrophotometric Analysis
According to Giusti and Wrolstad [
20] method, two buffers (0.025 M Potassium Chloride Buffer, pH 1.0; 0.4 M Sodium Acetate Buffer, pH 4.5) were prepared. Fifty µL of each of them were separately mixed with 50 µL of the extract. Then, the samples were incubated, in the dark, for 15 minutes. The absorbance of both solutions was measured at 510 nm (for Cyanidin), 523 nm (for Delphinidine), 557 nm (for Malvidine), 505 nm (for Pelargonidin), 496 nm (for Pelargonidin 3-glucoside), 511 nm (for Peonidin), 520 nm (for Petunidin 3-glucoside), and 700 nm (as background), by a UV/Vis spectrophotometer (Varian Cary 50 Bio UV-Vis, The Netherlands). Equation (1) was used for measuring the absorbance of the sample:
where x is the wavelength at which each single anthocyanin absorbs. Subsequently, the concentration of the single anthocyanin was estimated according to Equation (2):
where A is the absorbance measured for the sample at the wavelength of the single anthocyanin, MW is the molecular weight of the single anthocyanin (i.e., Cyanidin, 287.24; Delphinidine, 303.24; Malvidine, 331.29; Pelargonidin, 271.24; Pelargonidin 3-glucoside, 433.4; Peonidin, 301.27; Petunidin 3-glucoside, 479.41), ε is the molar absorptivity of the anthocyanin (i.e., Cyanidin, 24600; Delphinidine, 34700; Malvidine, 36200; Pelargonidin, 17800; Pelargonidin 3-glucoside, 15600; Peonidin, 37200; Petunidin 3-glucoside, 18900), and l is the length of the cuvette employed for the realization of the test. Results were reported as µg of each anthocyanin per mg of sample fresh weight.
2.6. In Vitro Antiradical Assay
FRAP (2,4,6-tris 2-pyridyl-s-triazine; Sigma Aldrich), and ABTS (2,2′-azino-bis-3-ethylbenzothiazoline-6-sulfonic acid; Sigma-Aldrich) assays were carried out according to Benzie and Strain [
21], and Re et al. [
22] guidelines, after the application of the modifications reported in Gismondi et al. [
23], for evaluating the antioxidant properties of the samples. Free radical scavenging activity was expressed as µg of ascorbic acid equivalents per mg of sample fresh weight (µg AAE/mg) for the FRAP test and as micromoles of ascorbic acid equivalents per mg of sample fresh weight (µmol AAE/mg) for ABTS, according to adequate calibration curves produced with pure ascorbic acid.
2.7. HPLC-DAD Analysis
To delineate the biochemical profile of each extract, High Pressure Liquid Chromatographic system associated with a Diode Array Detector (HPLC-DAD) was used for the analysis. The system was equipped with a CBM-20A controller, an LC-20 AD pump, a SIL-20a HT autosampler, and an SPD-M20A diode array detector (DAD) (Shimadzu, Kyoto, Japan). A Luna 3u C18(2) column (150 mm × 4.60 mm × 3 μm) (Phenomenex, Torrance, CA, USA) and mobile phases consisting of 1% formic acid (v/v) (phase A) and MeOH (phase B), at a flow rate of 0.95 mL per minute, were used for the chromatographic separation. Each sample (20 μL) was injected in the instrument and the column temperature was set at 40 °C. The elution started at 15% B solvent; this condition was maintained for 20 min; then, it was linearly increased up to 35% B solvent in 20 min and up to 90% in 55 min; at 70 min, the pump B value was reported at the initial condition (15%). Data acquisition was obtained using LAB-SOLUTION software (Shimadzu). Flavonoid compounds (i.e., Resveratrol; Quercetine-3-glucoside; Myricetin; Quercetin; Genistein; Kaempferol; Chrysin; Epicatechin) and phenolics (i.e., Gallic acid; 3-Hydroxytyrosol; Vanillic acid; Rosmarinic acid; 4-Hydroxybenzoic acid; Chlorogenic acid; Caffeic acid; Syringic acid; ρ-Coumaric acid; Salicylic acid; 1,1-Dimethylallyl caffeate; Caffeic acid phenethyl ester; 5,7-Dimethoxycumarin) were quantified in the samples at 280 nm. Qualitative and quantitative determination of each metabolite was carried out comparing their retention times (minutes), absorption spectra, and peak areas with those of pure standard molecules (Sigma-Aldrich, Milan, Italy). The results were expressed as ng of standard equivalent per mg of sample fresh weight.
2.8. Cell Culture
In this study the human breast cancer cell line AU565 was used (kindly provided by professor Ira-Ida Skvortsova, Medical University of Innsbruck Tyrolean Cancer Research Institute, Innsbruck, Austria). The cell line was cultured in RPMI-1640 medium supplemented with 10% (v/v) heat inactivated fetal bovine serum (FBS), L-glutamine (2 mM), Penicillin-Streptomycin (100 mg/mL) (all from Sigma, MO, USA). AU565 were maintained at 37 °C in a humidified 5% CO2 atmosphere and passaged three times a week after detachment with trypsin (0.05%) and EDTA solution (0.02%) in PBS (Sigma). In addition, cytotoxic effects on peripheral blood mononuclear cells (PBMCs) from healthy donors (HD) were evaluated. Three HD were obtained from individuals attending the local blood Transfusion Unit of Policlinic of “Tor Vergata” in Rome, who were referred to the Virology Unit of PTV for screening and provided written informed consent. The study was performed in accordance with the ethical principles of the Declaration of Helsinki and the Guidelines for Good Clinical Practice. The ethical committee of Tor Vergata University/Hospital approved this study (protocol number: COVID_SEET prot.7562/2020).
PBMCs from heparinized blood samples were isolated by density gradient centrifugation (Pancoll human, PAN-Biotech, Aidenbach, Bavaria) and cultured at a density of 0.1 x 10⁶/500 µL in RPMI 1640 (PAN Biotech, Aidenbach, Bavaria) enriched with 2 mM L-glutamine, 100 U/mL penicillin, 0.1 mg/mL streptomycin, 12% fetal bovine serum in the presence of recombinant human interleukin-2 (IL-2) 20 U/mL (all from Sigma, MO, USA).
2.9. M3 Treatments
To verify the effect on PBMCs and AU565 of M3 extract from L series, which was chosen due to its high content in secondary metabolites among all samples, cells were cultured at a concentration of 0.03x10⁶/500µL for 18 h at 37 °C in a humidified atmosphere containing 5% CO2. Then, they were treated, or not, with the M3-L sample at different concentrations, starting from 0.06 mg/mL to 50 mg/mL for 48 h. In addition to the control conditions, a treatment was also carried out with ddH2O, as a control vehicle for M3, and with etoposide, an inhibitor of DNA synthesis forming a complex with topoisomerase II. After incubation, cells were detached with a trypsin solution analyzed. Similarly, PBMCs were treated, or not, with M3 at the same concentrations reported above for the same timing.
2.10. Cell Viability and Apoptosis Assay
Alive and dead cells were counted by optic microscopy at 48 h of treatment, after staining with 10% Trypan Blue (EuroClone S.p.A., Italy). The percentage of apoptotic cells was estimated by flow cytometry (CytoFLEX; Beckman Coulter, Inc.), measuring the number of hypodiploid nuclei on 150.000 events. In detail, cells were harvested, washed in PBS, and incubated for 45 min in 70% v/v ethanol on ice. Then, they were washed with PBS and stained with propidium iodide (1.25 µg/mL). In addition, early apoptosis by annexin V (ANX-V) staining was evaluated. In detail, cells were harvested, washed, incubated for 15 min with ANX-V and with 7-aminoactinomycin D (7AAD) vitality marker on ice, and analysed. Data acquisition and analysis were performed by CytExpert 2.4 (Beckman Coulter, Inc.).
2.11. Reactive Oxygen Species (ROS) Production Assay
ROS production was evaluated by DCFDA/H2DCFDA-Cellular ROS Assay Kit (ab113851, abcam). The DCFDA assay protocol is based on the fluorescence of this marker after interaction with ROS, considering an excitation/emission spectrum fixed at 485 nm/535 nm. After detachment, AU565 cells were incubated for 30 minutes at 37 °C with 20 µM DCFDA and then washed with 1X Buffer according to the manufacturer’s instructions. The analysis was carried out by flow cytometry (CytoFLEX; Beckman Coulter, Inc). Alive cells were selected using a morphological gate and the mean fluorescence intensity (MFI) of DCFDA was assessed in relation to the different treatments, as shown in
Figure S1.
2.12. Statistical Analysis
The results were reported as means ± standard deviation (SD) of 3 independent measurements. Data were subjected to a one-way analysis of variance (ANOVA) and a post-hoc lowest standard deviations (LSD) test (Excel software); p values were indicated as follows: *p<0.05; **p<0.01; ***p<0.001. The relationship existing between classes of phytochemicals and antioxidant power was estimated by Pearson’s correlation coefficients, using PAST software (v4.03).
4. Discussion
In
P. granatum, the availability of appreciable levels of nutraceutics, such as polyphenols, tannins and anthocyanins, fostered the interest toward the consumption of this functional food with significant health promoting properties [
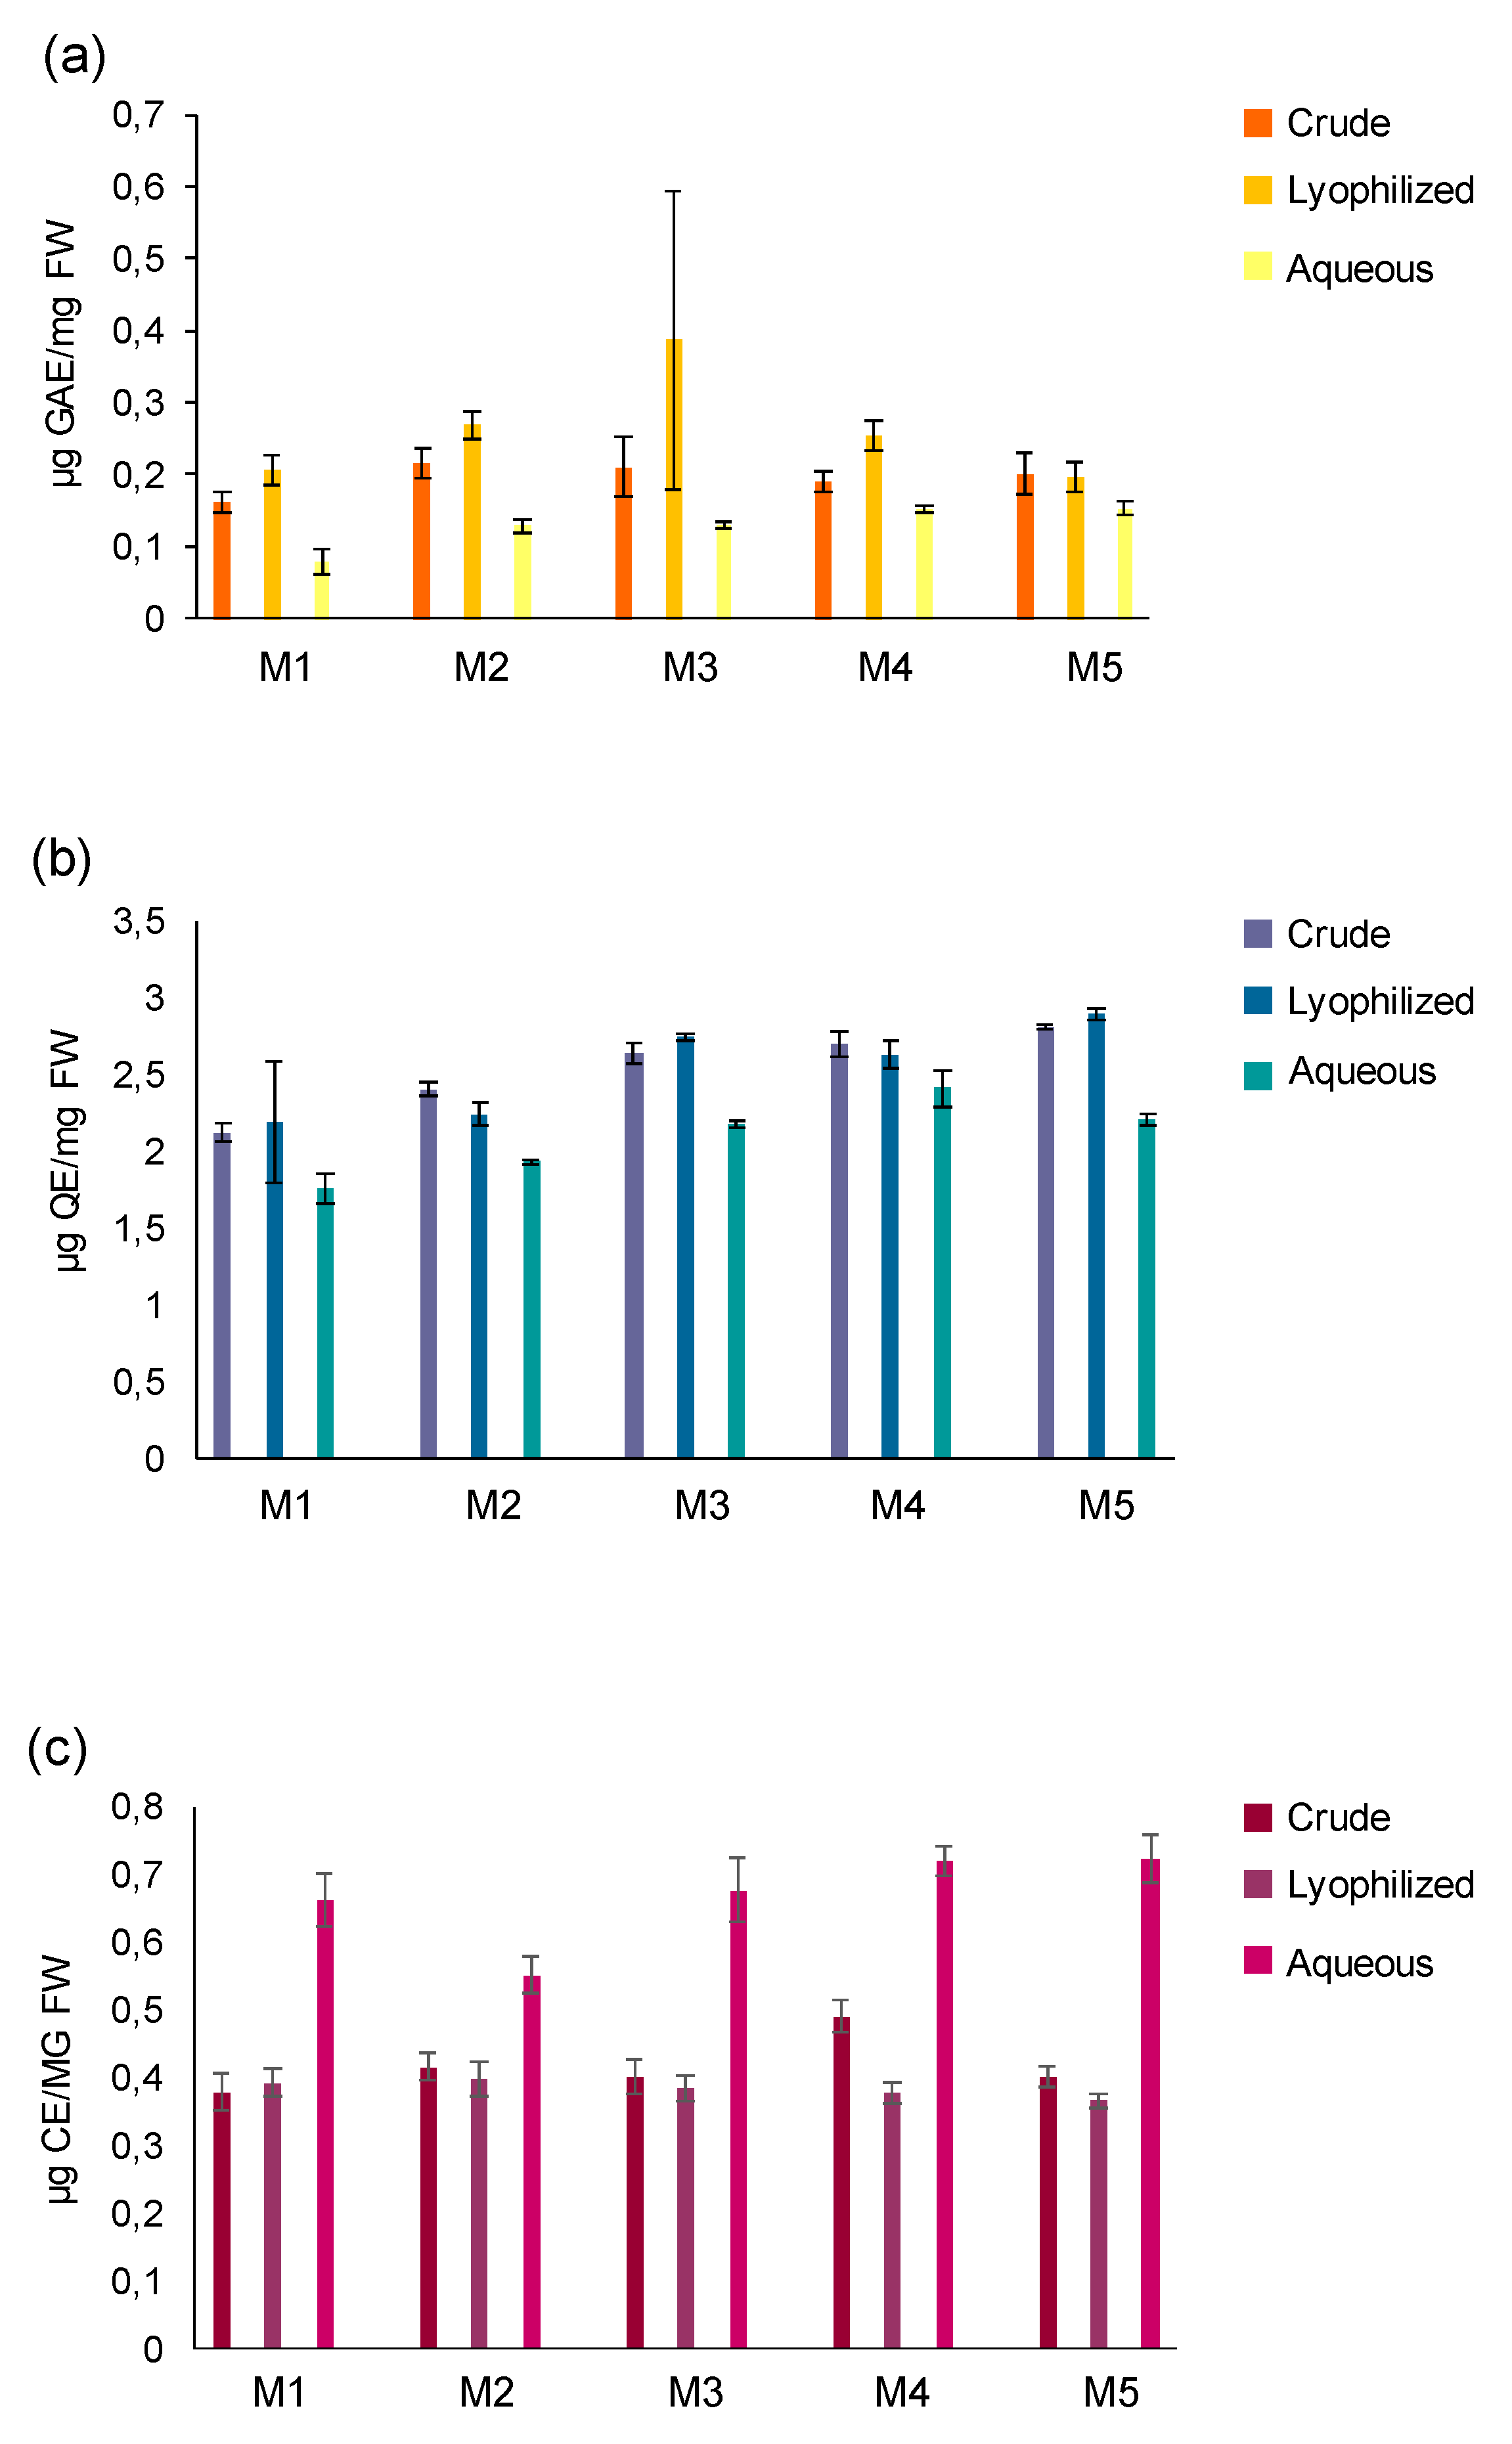
24]. In our study, the content of phenolics and flavonoids, measured by spectrophotometric assays, was constant across C and L extracts, while the same classes of secondary metabolites tended to decrease in the A fractions, albeit not significantly, perhaps due to the filtering procedure applied on these samples. In general, the fractions that retained greater amounts of phytochemicals were those from C and L series and, in particular, M2, M3, and M4 for total phenols and M3, M4 and M5 for flavonoids. By contrast, all aqueous extracts were significantly rich in condensed tannins. The latter, among all tannins, are the ones that bear the major medicinal properties. Condensed tannins form complexes with proteins, enzymes, and polymers, such as cellulose and hemicelluloses. The stability of the tannin-protein complex depends on several factors and are dynamic and time-dependent [
25]. It is possible that the filtering performed on the A samples eliminated the protein component of the pomegranate, allowing a release of the tannins present in the extracts. A portion of these tannins could be correlated with epicatechin, whose detection by HPLC-DAD revealed the highest values precisely in the aqueous fractions. Indeed, catechins are considered as precursors of condensed tannins [
25].
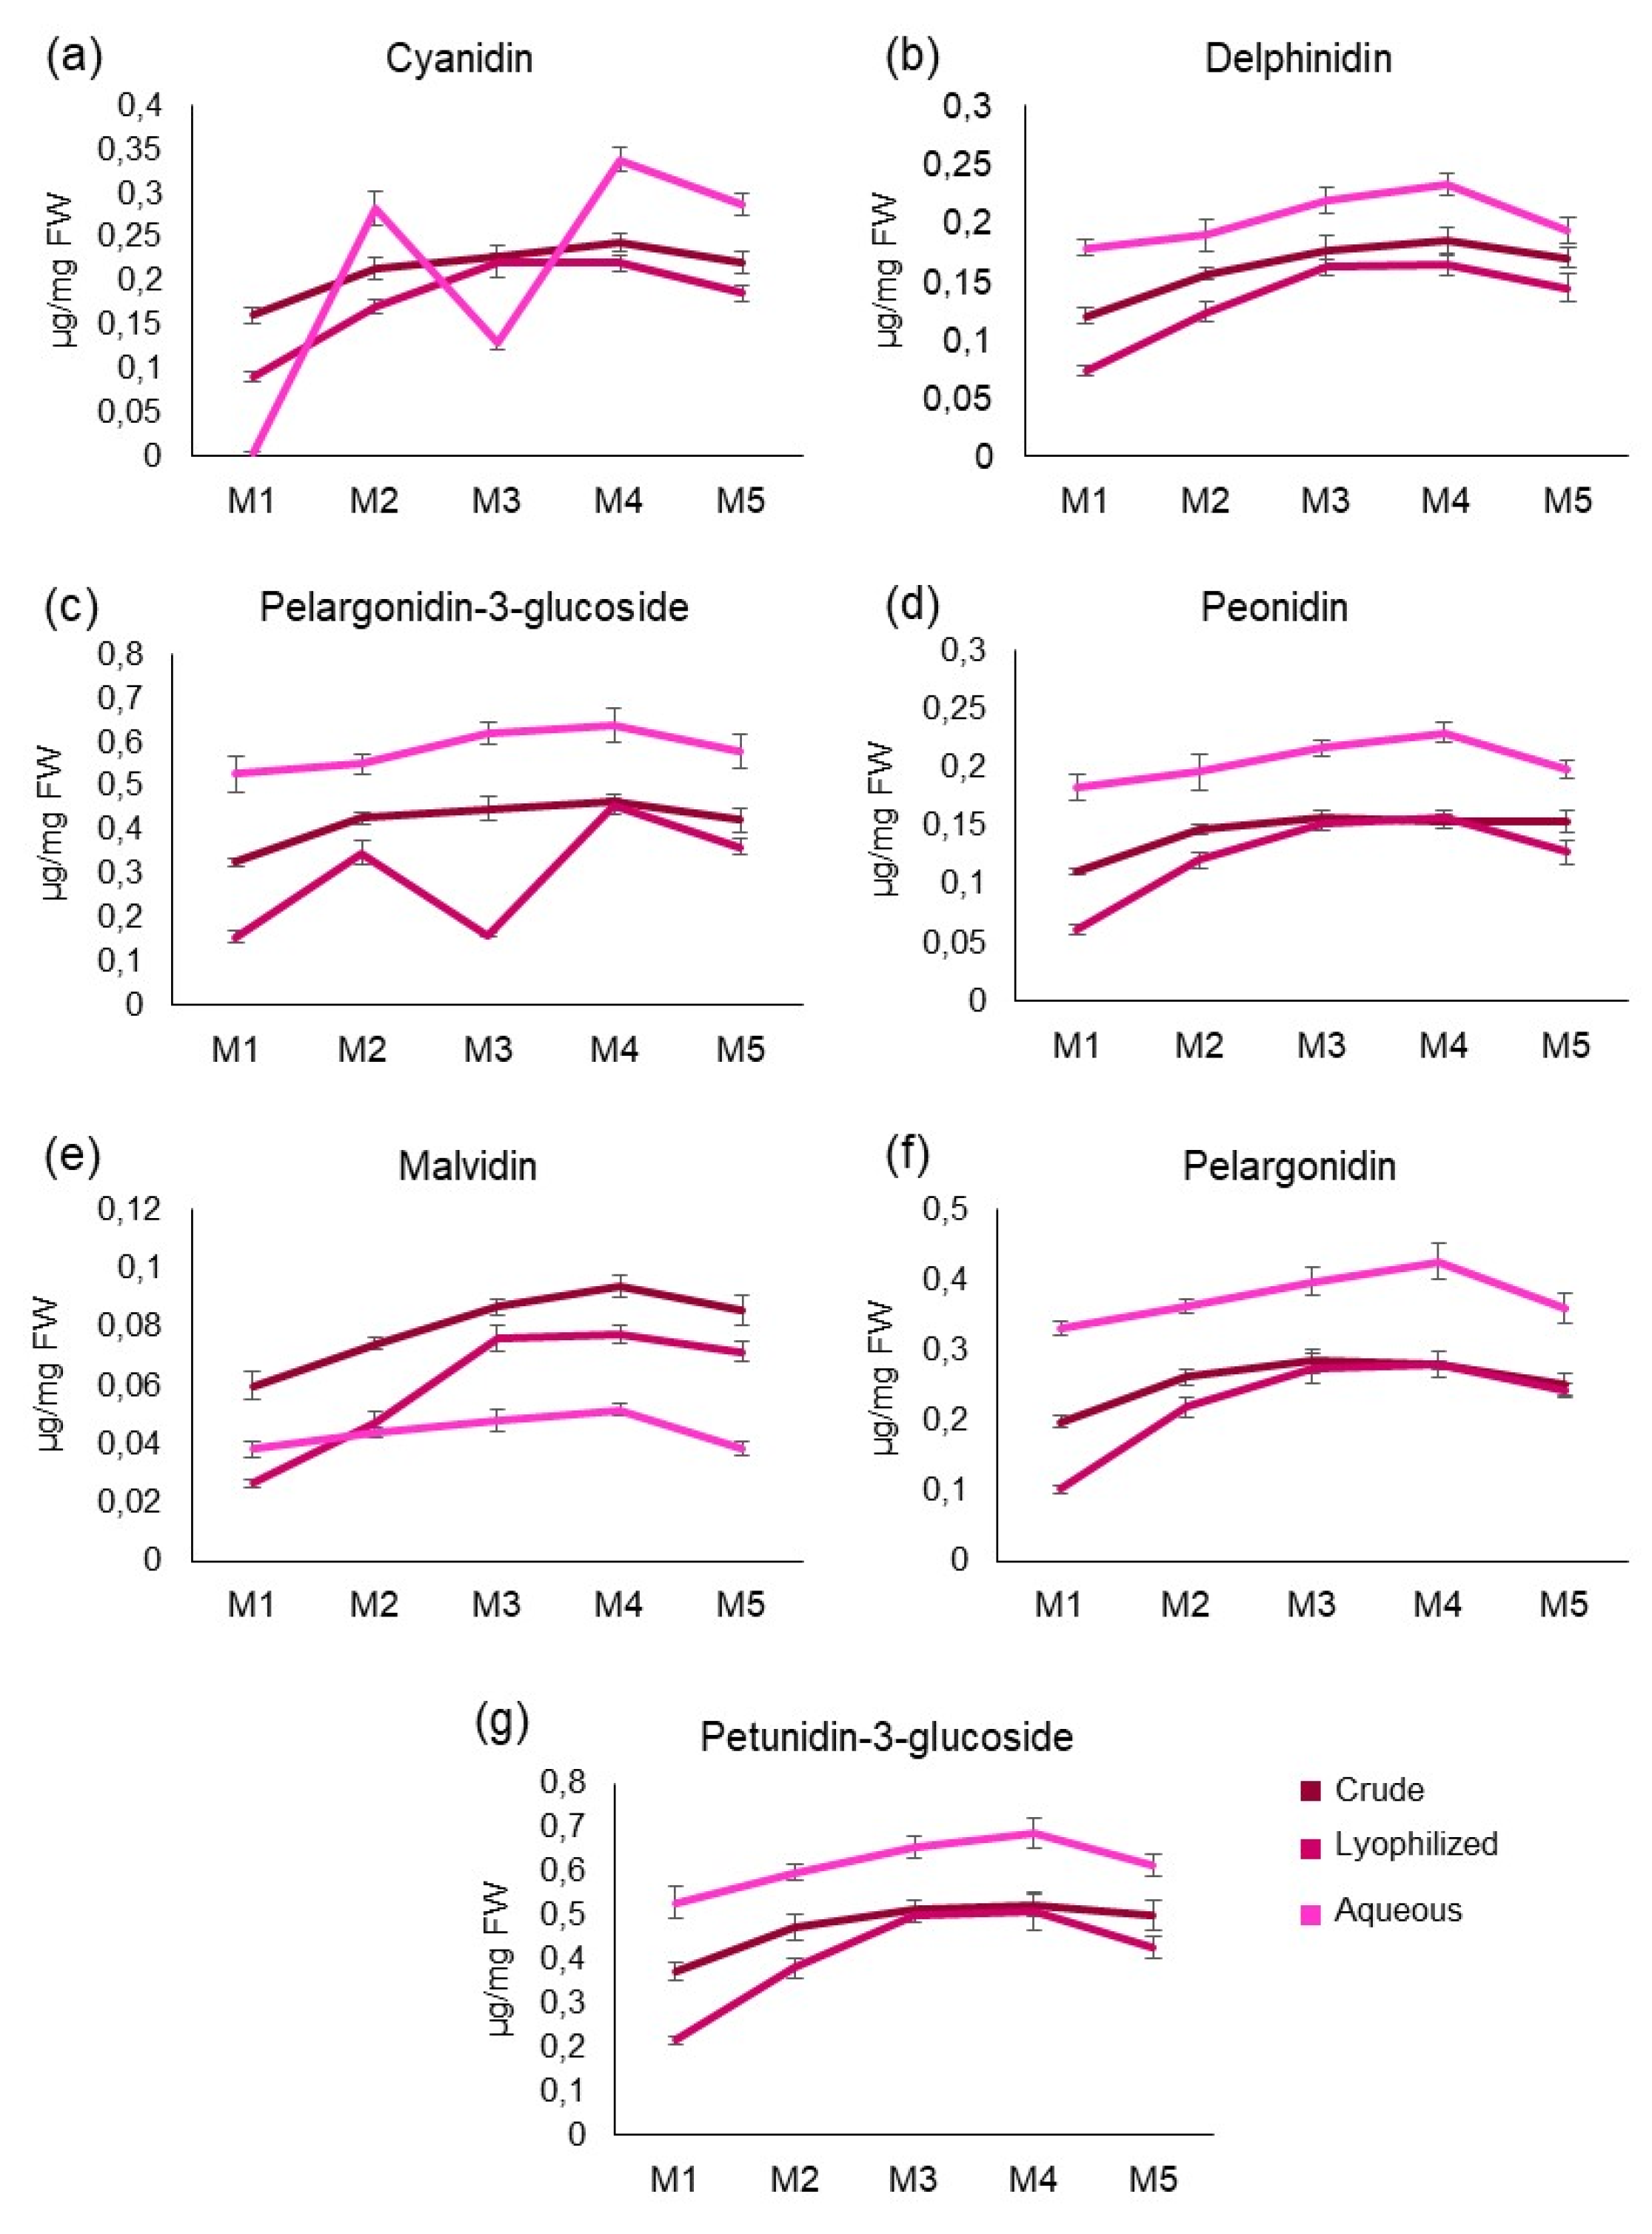
Anthocyanins, components typical in pomegranate and known for their antioxidant activity as scavengers for free radicals [
26], together with the condensed tannins, were particularly abundant in the aqueous fractions, compared to C and L ones, except for malvidin, whose concentration tended to decrease in L and A extracts, perhaps due to its molecular instability [
27]. As anthocyanins are water-soluble phenolic pigments and represent a subclass of flavonoids, the decrease of the total flavonoids detected in the aqueous extracts might not be related to the loss of other compounds from the same molecular class. The samples richest in anthocyanins were M3 and M4 for all the extracts, as well as for total phenol, flavonoid, and condensed tannin content. To have a fingerprint of the extracts, specific phenolics and flavonoids were monitored by HPLC-DAD. Interesting was the absence of gallic acid in all the samples, although it represents a peculiar unit of the tannins [
28]. Thus, this simple phenol could be degraded during the cavitation process, or absent in its free form. In the aqueous extracts, vanillic acid, epicatechin, and caffeic acid showed the highest values of the dataset in M3, as well as chlorogenic acid and quercetine-3-
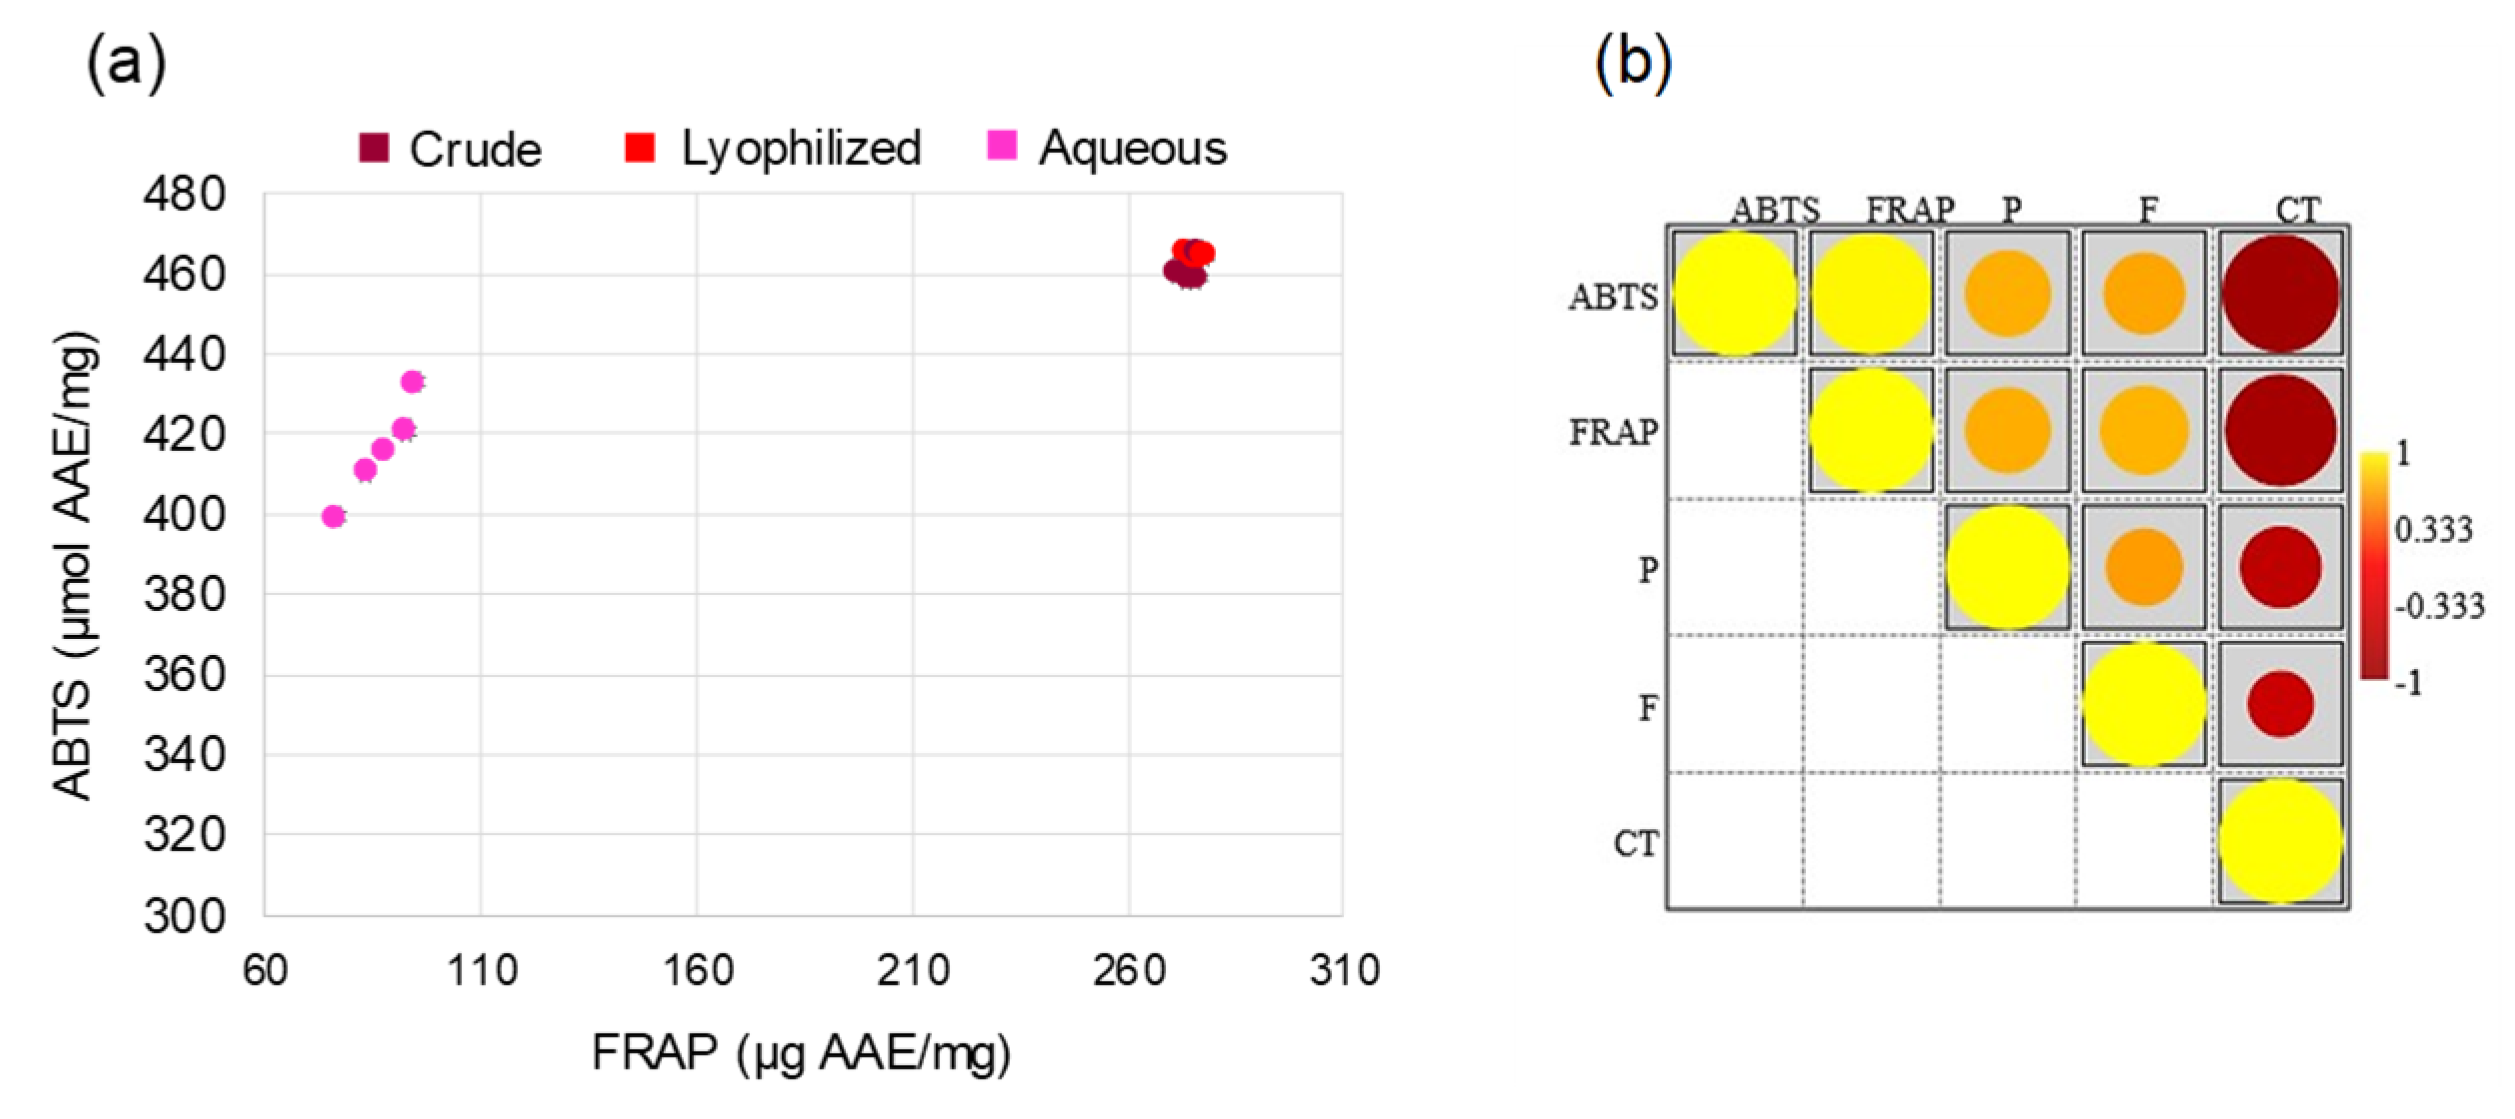
O-glucoside in the M4 fraction. The phenolic and flavonoid compounds, which characterized the biochemical profiles of the C and L fractions, reflected the high antioxidant activity of these samples, detected with FRAP and ABTS tests, as also confirmed by Pearson’s correlation analysis. It is noteworthy that just 5 minutes of process time (sample M1) were enough to produce relatively high contents of bioactive compounds, likely due to the immediate extraction of pomegranate juice. The apparent, slight decline in the content of bioactive compounds for samples collected after M3 or M4 could suggest a degradation of certain heat sensitive compounds, unbalanced by further extraction from peel and seeds. Finally, M3 was chosen instead of M4 because the respective contents of bioactive compounds, as well as the levels of antioxidant activity, were indistinguishable, while M3 was produced with only 15 minutes of process time (against 25 minutes for M4), at the temperature of about 30 °C (36 °C for M4), and with much lower energy consumption (38 Wh per kg of fresh raw material) than M4 (62 Wh/kg), thus allowing higher affordability and productivity to the HC-based extraction method.
Numerous research papers have provided extensive evidence on the anti-cancer properties of pomegranate products. A number of studies have suggested that the whole pomegranate fruit, as well as its juice and oil, are promising chemopreventive/chemotherapeutic agents by exerting anti-inflammatory, antiproliferative, and anticancer effects through modulation of multiple signaling pathways [
29]. Pomegranate constituents have been shown to: inhibit UVB-induced DNA damage in skin cancer [
30], reduce serum PSA levels [
31], inhibit STAT3 phosphorylation and NFκB activation in prostate cancer [
31], inhibit DNA adduct formation in lung cancer [
32], and inhibit COX-2 expression, AKT phosphorylation and NFκB DNA binding activity in colon cancer [
33].
In this study, the potential anticancer capacity of pomegranate fruit HC extract was evaluated. As described in other studies [
11,
12] pomegranate contains high amount of polyphenols with anti-inflammatory and therapeutic effects on different breast cancer, suggesting its use in combination with standard therapies. We observed that M3-L sample reduced cell proliferation and induced apoptosis on AU565 breast cancer line. In particular, the
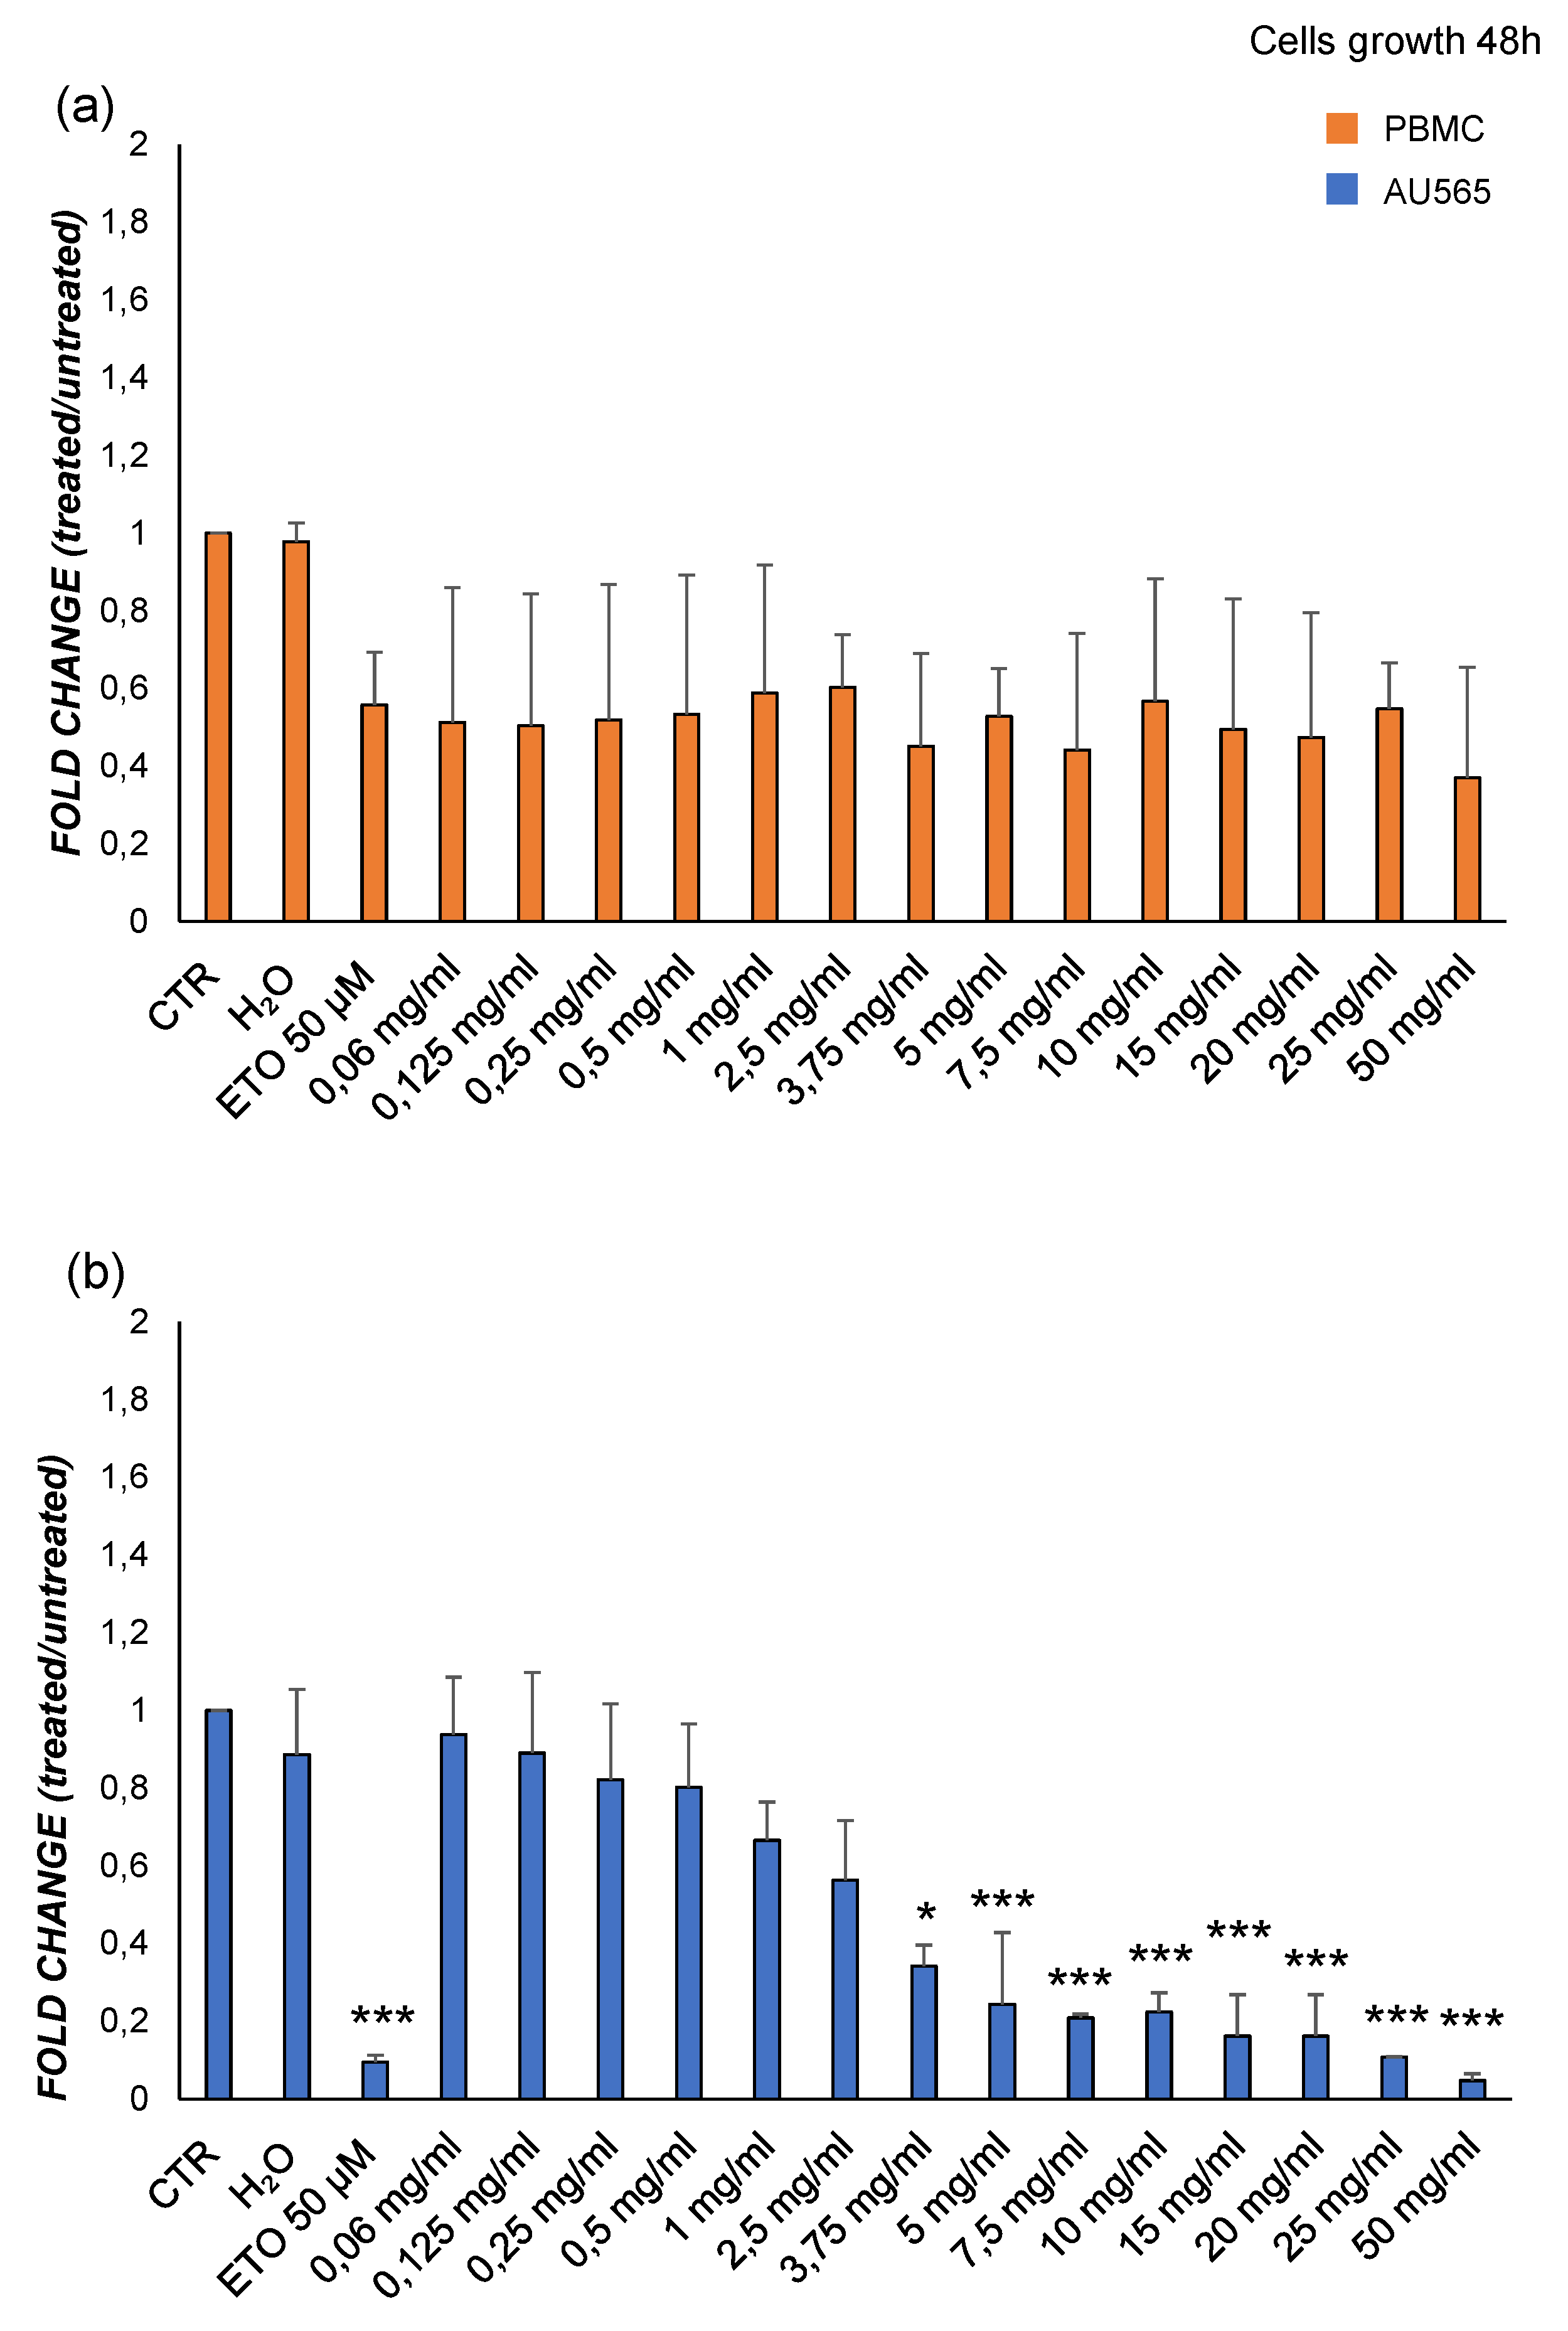
in vitro experiments showed that starting from 3.75 mg/mL of M3 a significative decrease of viability of tumor cells was detectable, together with the enhancement of cell death. Interestingly, the same cellular phenomena in PBMCs appeared to be comparable to those of the untreated control at all concentrations tested, confirming that only cancer cells were susceptible to pomegranate exposure.
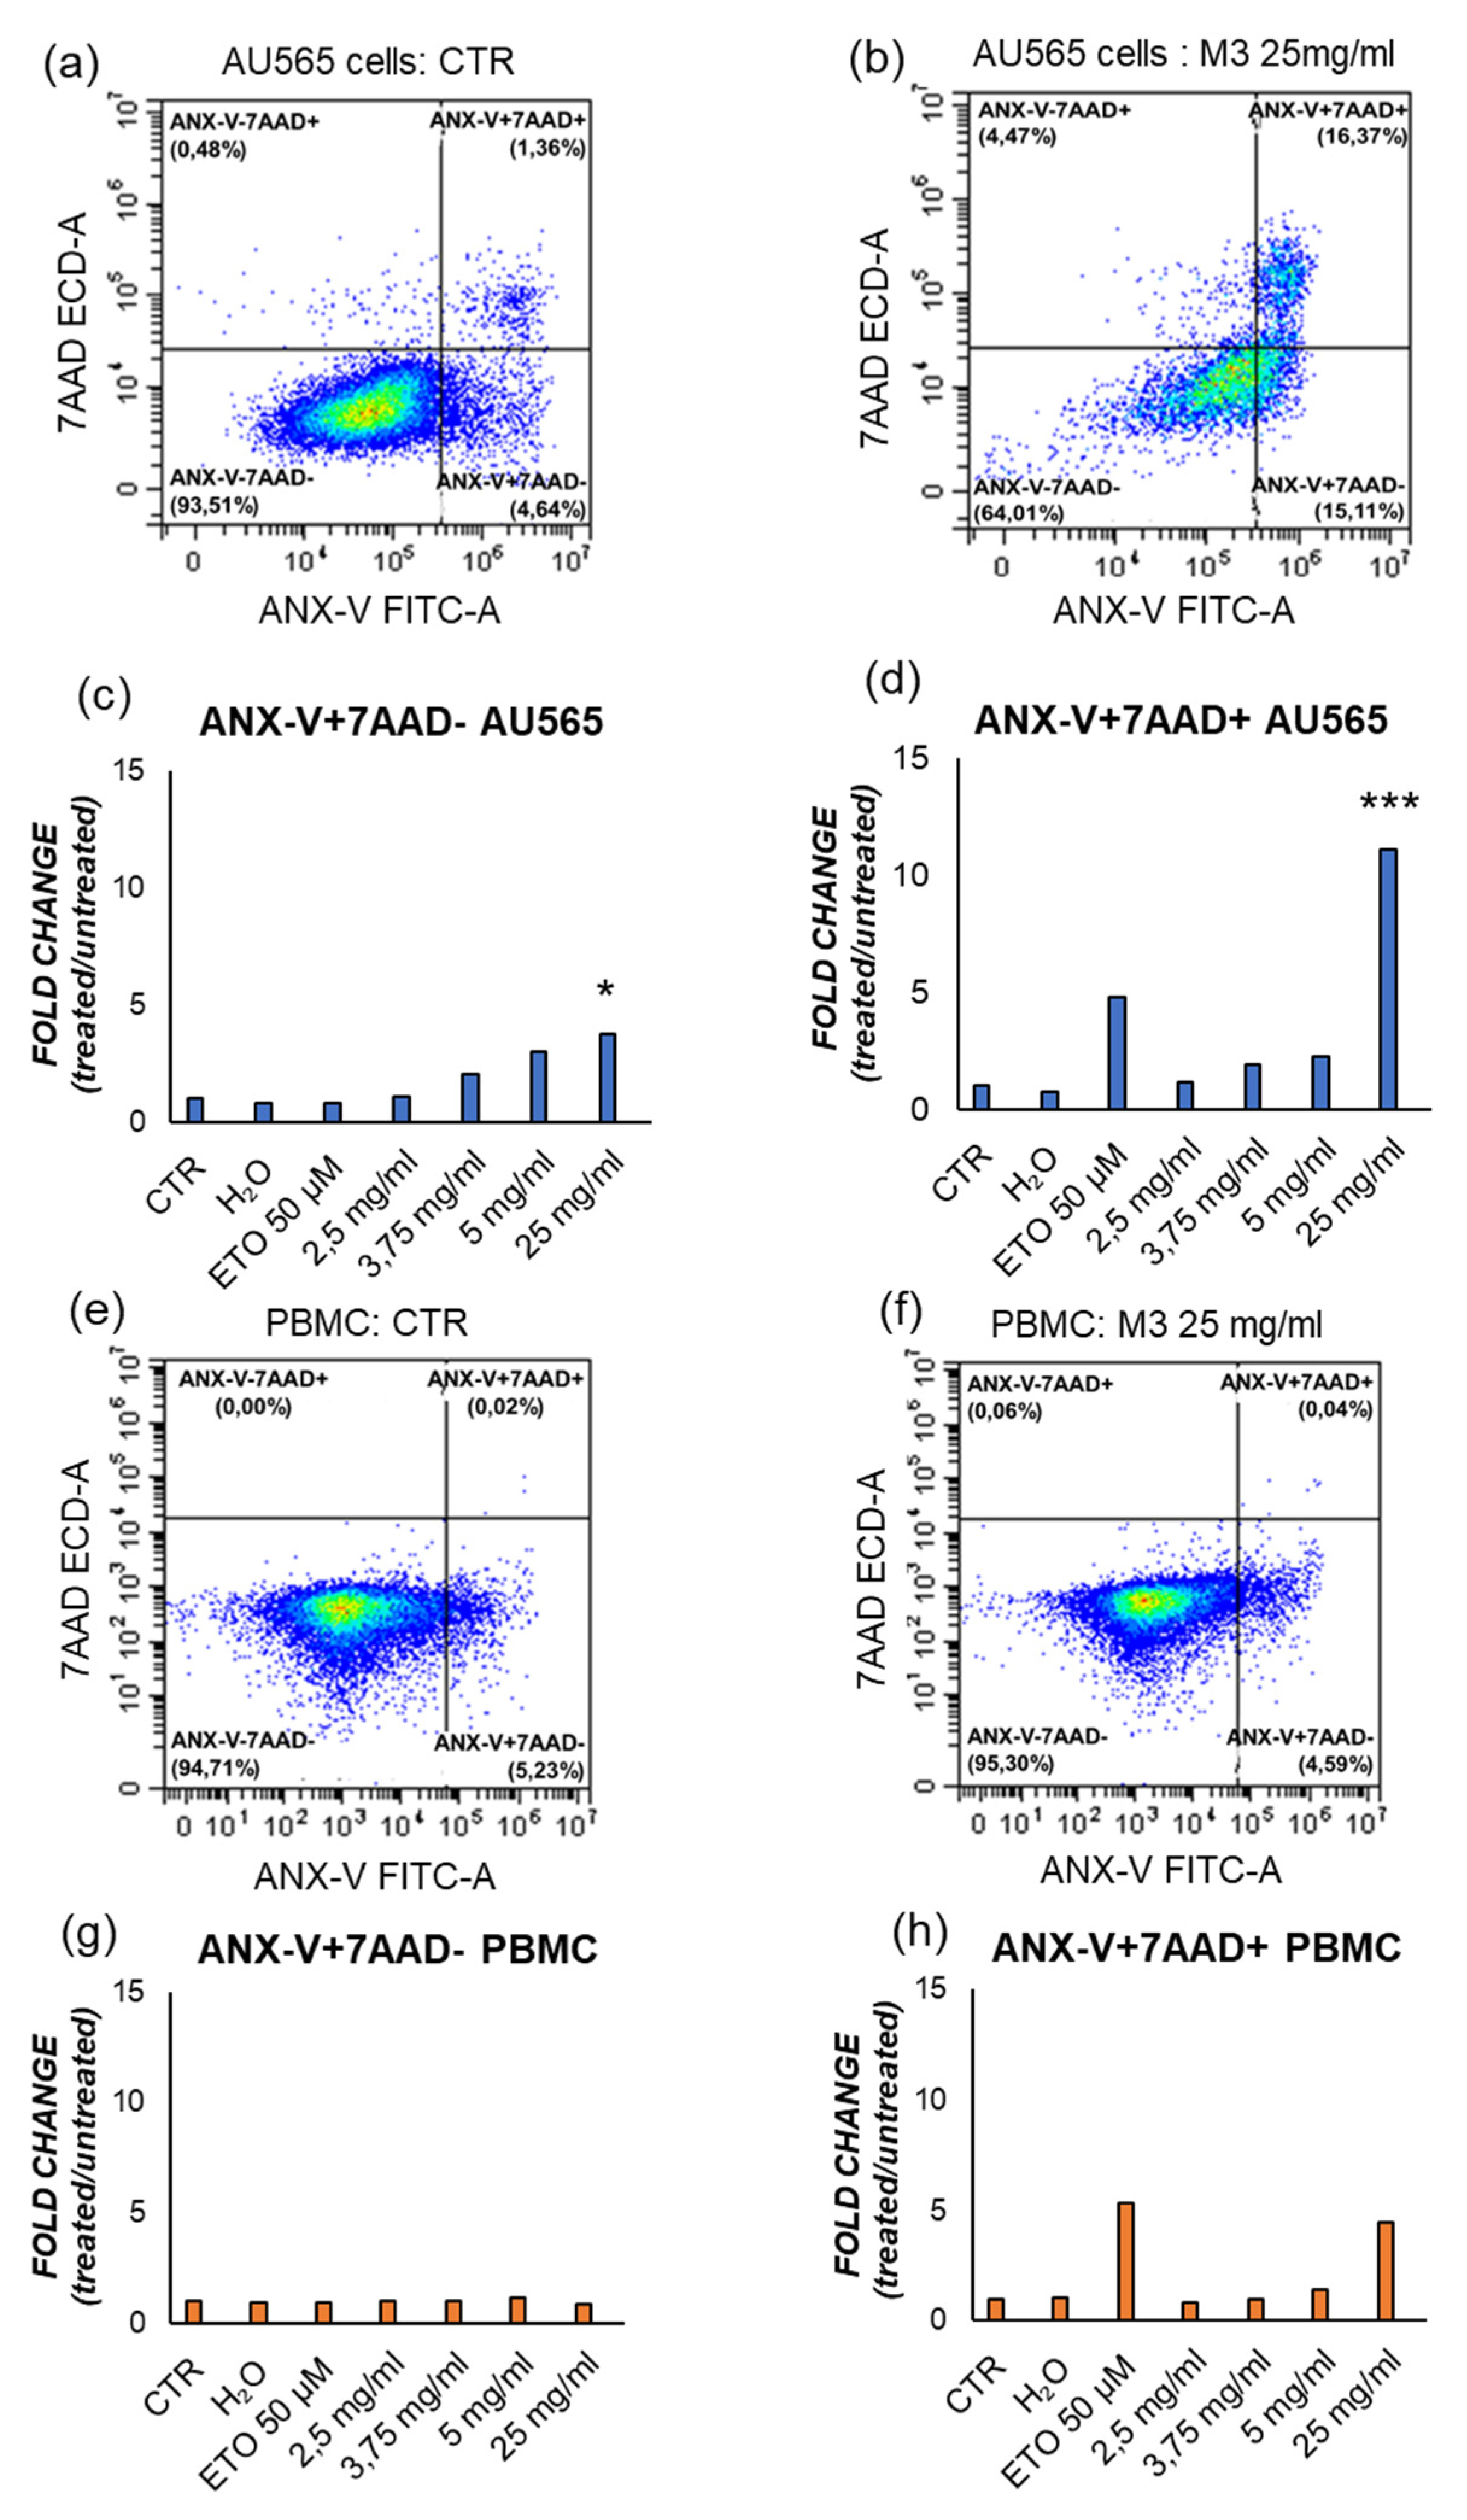
To confirm that the treatments induced apoptosis, annexin V/PI assay was carried out on AU565 and PBMCs, distinguishing early apoptotic cells from late apoptotic/necrotic ones [
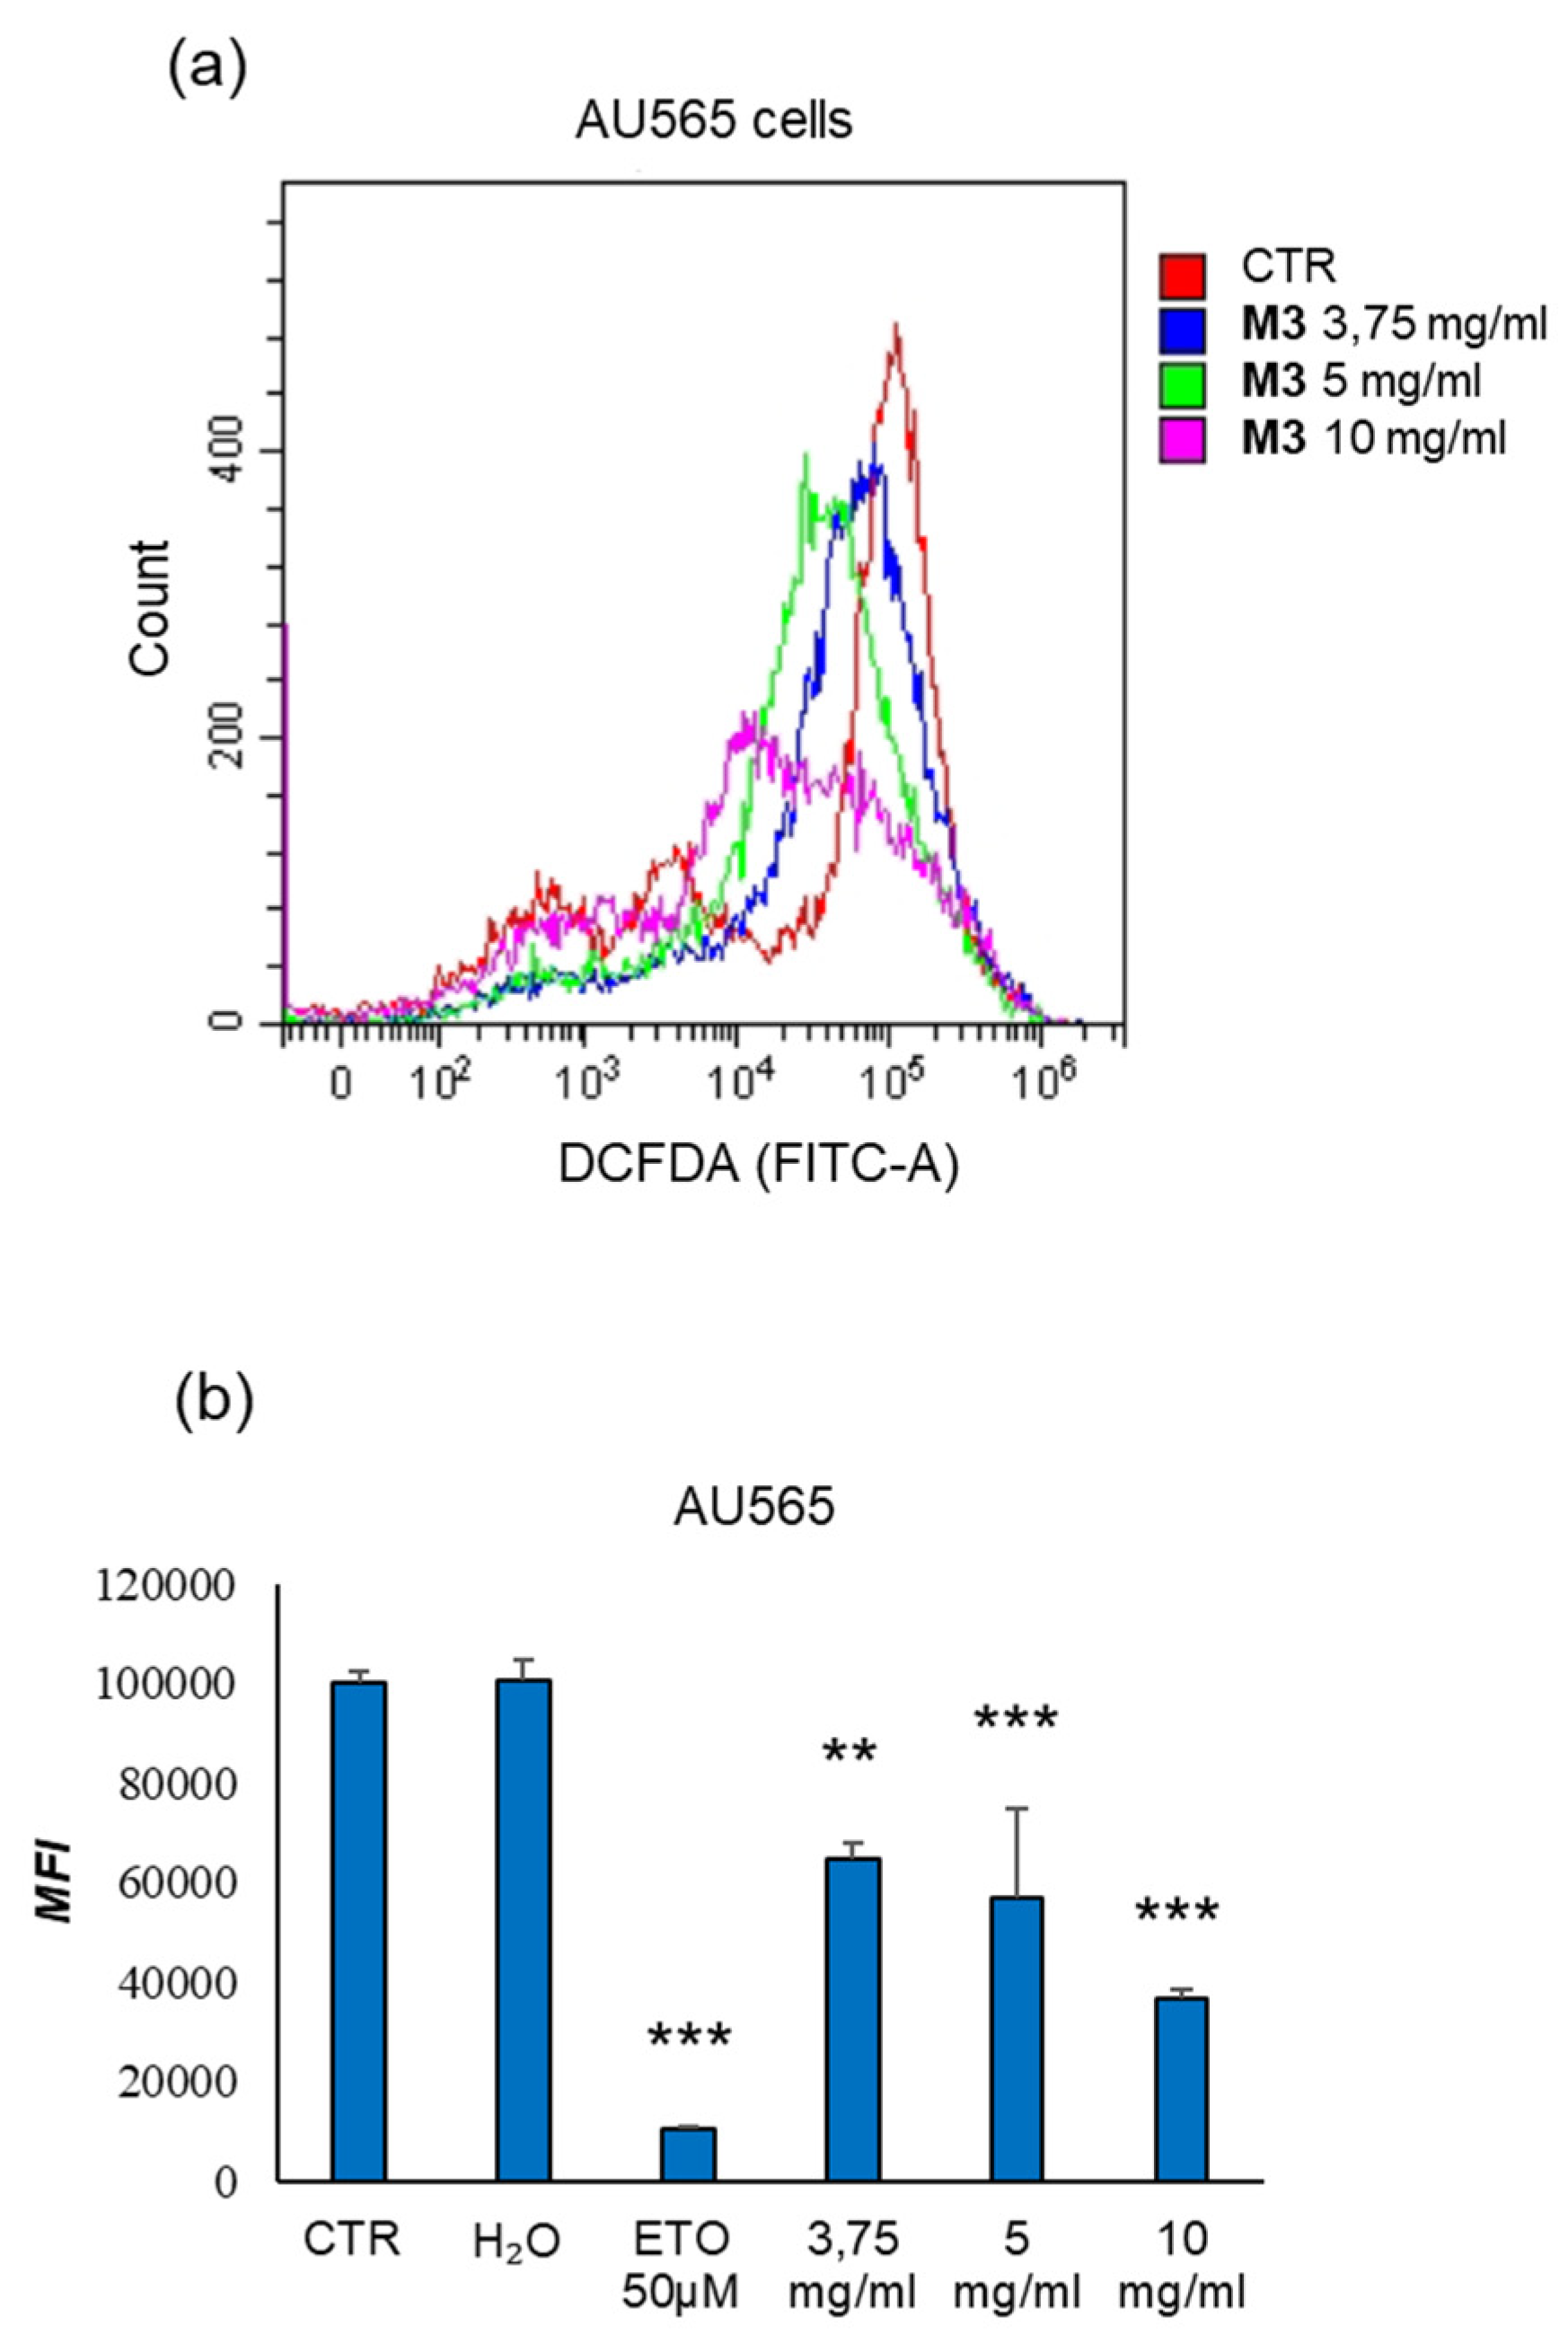
34]. The treatment with M3 determined a significant increase in the percentage of annexin V-positive cells compared to the control at 25 mg/mL. Moreover, at this concentration, the levels of late apoptotic/necrotic cells was higher respect to the untreated sample. Clearly, these experiments asserted that plant treatment was able to specifically induce cell death by apoptosis. Finally, also the intracellular ROS concentration was measured, demonstrating a significant decrease of the oxidative status after treatment with pomegranate sample.
Our evidence finds support in the literature as pomegranate juice has the highest antioxidant capacity compared to other polyphenol-rich beverages, such as red wine, grape juice, blueberry juice, and green tea [
35]. It is known, indeed, that pomegranate extract contains a broad spectrum of nutraceutics with strong antioxidant capacity. These compounds would exert their antiradical activity in several ways, including removing or neutralizing free radicals, chelating metals, influencing cell signaling pathways, and modulating gene expression [
36,
37]. Studies on Caco-2 colon cancer cells treated with punicalagin and ellagic acid, obtained from pomegranate, have shown pro-apoptotic and oxidative stress-reducing effects, providing information about the possible molecular mechanism of action underlying the bioactivity of
P. granatum [
38].
Author Contributions
Conceptualization, Antonella Minutolo, Angelo Gismondi, Mauro Centritto and Francesco Meneguzzo; Data curation, Antonella Minutolo, Angelo Gismondi, Rossella Chirico, Gabriele Di Marco, Marialaura Fanelli and Francesco Meneguzzo; Investigation, Alessia D'Agostino and Lorenzo Albanese; Methodology, Lorenzo Albanese, Federica Zabini and Francesco Meneguzzo; Resources, Mauro Centritto and Francesco Meneguzzo; Supervision, Antonella Minutolo, Angelo Gismondi, Claudia Matteucci and Francesco Meneguzzo; Validation, Rossella Chirico, Gabriele Di Marco, Vita Petrone and Marialaura Fanelli; Writing – original draft, Antonella Minutolo, Angelo Gismondi, Rossella Chirico, Marialaura Fanelli and Francesco Meneguzzo; Writing – review & editing, Antonella Canini, Sandro Grelli, Federica Zabini and Claudia Matteucci.
Figure 1.
Content of secondary metabolites in pomegranate samples. (a) Total content of phenolics; (b) Total content of flavonoids; (c) Total content of condensed tannins. These quantities were measured by spectrophotometric assays in the fractions (M1-M5) of crude, lyophilized and aqueous extracts. The unit of measure was indicated in the y-axis of each graph. Only in (c), the significance of the results showed a p-value <0.05 for all the aqueous samples vs the respective crude and lyophilized ones.
Figure 2.
Anthocyanin quantitation in pomegranate samples in the fractions (M1-M5) of crude, lyophilized and aqueous extracts. Line charts showing the level of (a) Cyanidin; (b) Delphinidin; (c) Pelargonidin 3-glucoside; (d) Peonidin; (e) Malvidin; (f) Pelargonidin; (g) Petunidin 3-glucoside. Results were expressed as µg per mg of plant fresh weight.
Figure 3.
Antioxidant activity of pomegranate samples. (a) Antiradical power measured by ABTS and FRAP assays in the fractions (M1-M5) of crude, lyophilized and aqueous extracts. Results were expressed as µg AAE and µmol AAE, respectively for FRAP and ABTS, per mg of plant fresh weight. (b) Pearson’s correlation between content of plant secondary metabolites and antioxidant potentials (p<0.05 boxed). Quantities were phenols (P), flavonoids (F), condensed tannins (CT).
Figure 4.
Viability analysis following treatment with increasing doses of M3. (a) PBMC from healthy donors; (b) AU565 cells. Results are expressed as the ratio between the number of alive cells after treatments and that measured in the control condition (fold change). (*) p≤0.050, (**) p≤0.010, (***) p<0.001. Data are shown as mean ± SD of at least three experiments performed.
Figure 5.
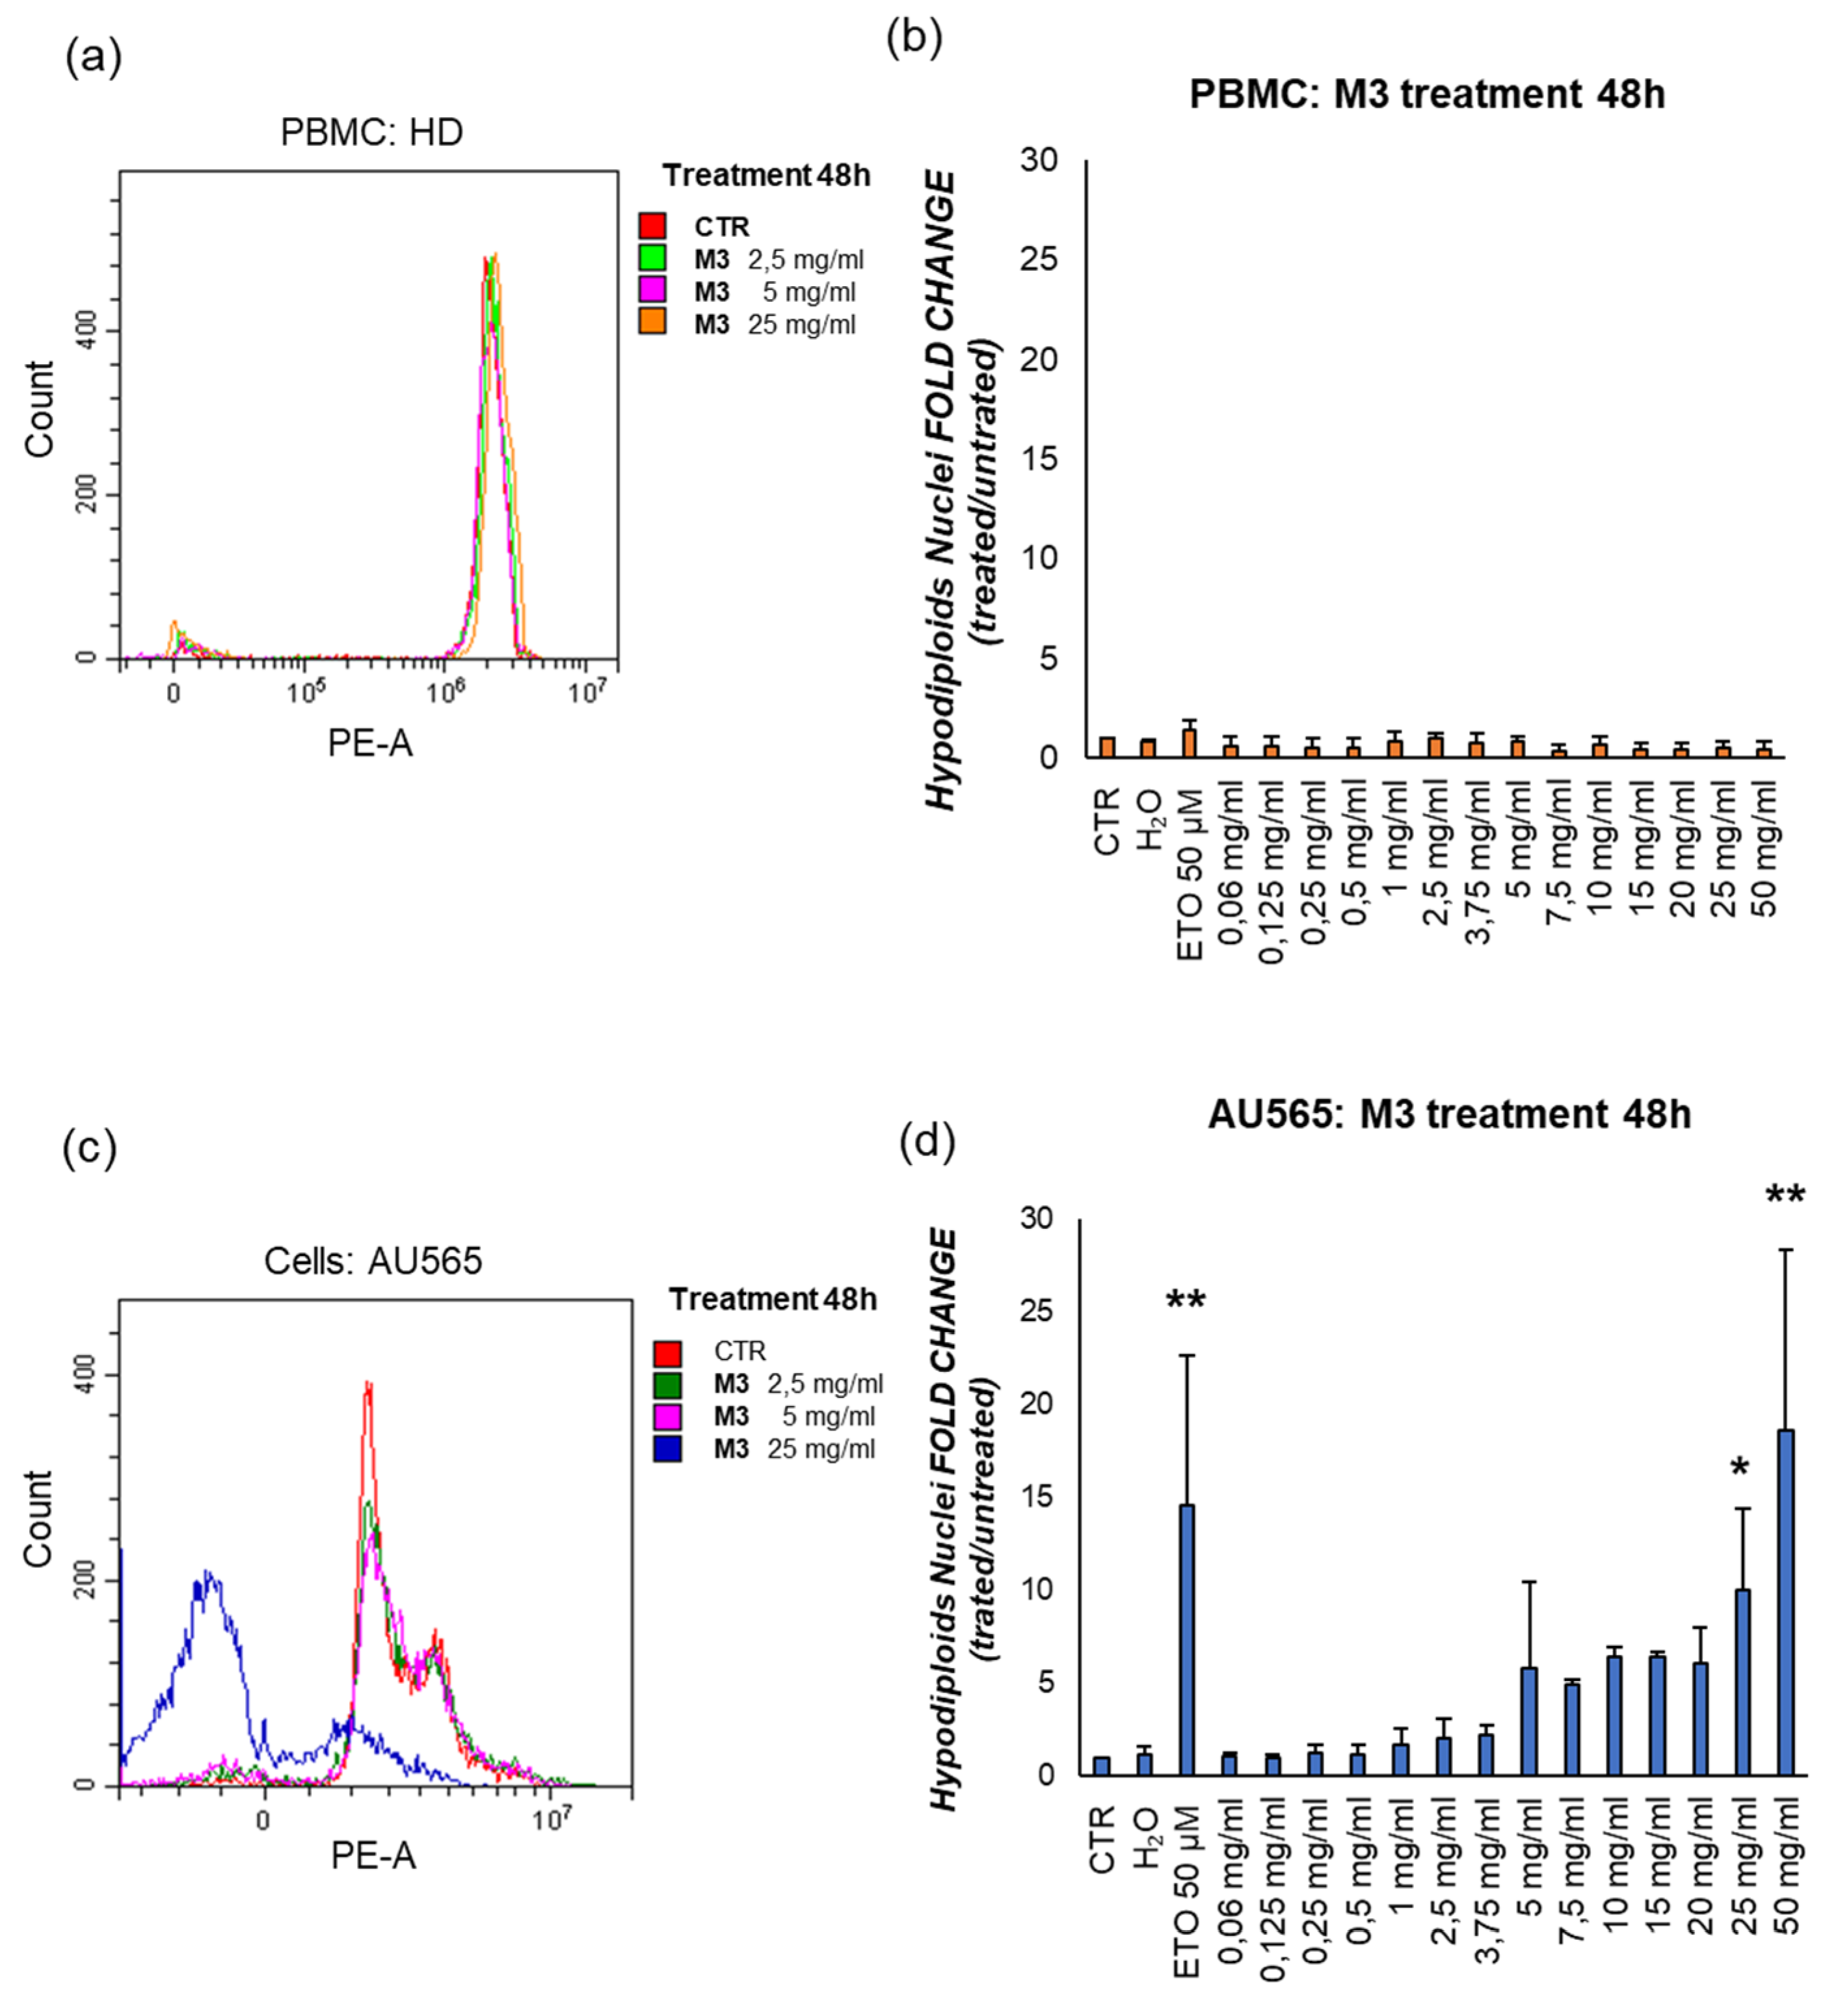
Evaluation of the apoptosis expressed as mean fluorescence intensity in (a,b) PBMC; (c,d) AU565 cells. The results in the histograms are expressed as the ratio between the percentage of hypodiploid nuclei measured in the treatment and control conditions (fold change). (*) p≤0.050, (**) p≤0.010, (***) p≤0.001. Data are shown as mean ± SD of at least three independent experiments.
Figure 6.
Representative flow cytometric analysis of the effect of M3 25 mg/mL on early apoptosis (ANX-V+/7AAD-) and late apoptosis/necrosis (ANX-V+/7AAD+) in (b) AU565; (f) PBMC, with respect to their control conditions (a,e). The results in the histograms represent the fold change of the ratio between the percentage of cells ANX-V+/7AAD- and ANX-V+/7AAD+, respectively in (c,d) AU565; (g,h) PMBCs. (*) p≤0.050, (**) p≤0.010, (***) p<0.001. Data are shown as mean ± SD.
Figure 7.
Evaluation of effects of M3 treatment on the modulation of ROS production in AU565. (a) Results are expressed as cell counts in relation to the fluorescence intensity of the DCFDA probe (FITC-A) following treatment with M3. (b) In the histogram, the results are expressed as mean fluorescence intensity in AU565. (**) p≤0.010, (***) p<0.001. Data are shown as mean ± SD of at least three experiments performed.
Table 1.
Samples collected at different extraction times (minutes), temperatures (°C), and specific energy (Wh per kg of fresh raw material).
Table 1.
Samples collected at different extraction times (minutes), temperatures (°C), and specific energy (Wh per kg of fresh raw material).
| Fractions |
Process Time
(minutes) |
Process Temperature
(°C) |
Specific Energy
(Wh/kg) |
| M1 |
5 |
24.0 |
13 |
| M2 |
10 |
27.5 |
25 |
| M3 |
15 |
30.5 |
38 |
| M4 |
25 |
36.5 |
62 |
| M5 |
45 |
47 |
108 |
Table 2.
Cytotoxic effect of M3 extract treatments on AU565 and PBMCs from healthy donors (n = 3). Mean ± SD of three independent measurements of Trypan blue assay.
Table 2.
Cytotoxic effect of M3 extract treatments on AU565 and PBMCs from healthy donors (n = 3). Mean ± SD of three independent measurements of Trypan blue assay.
| Cells Type |
EC30 (mg/mL) |
LD30 (mg/mL) |
| AU565 |
2.44 ± 0.01 |
>50 |
| PBMCs |
>50 |
>50 |
Table 3.
Percentage of Annexin V (ANX-V) and propidium iodide (PI) negative and positive AU565 cells treated with M3-L extract for 48 hours. Results are reported in percentage, as mean ± SD. (*) p≤0.050; (**) p≤0.010.
Table 3.
Percentage of Annexin V (ANX-V) and propidium iodide (PI) negative and positive AU565 cells treated with M3-L extract for 48 hours. Results are reported in percentage, as mean ± SD. (*) p≤0.050; (**) p≤0.010.
| AU565 |
ANX+/7AAD+ (%) |
ANX+/7AAD- (%) |
| CTR |
1.28±0.30 |
4.74±0.25 |
| H₂O |
0.94±0.02 |
3.66±0.18 |
| ETO 50 µM |
6.16±0.10 |
3.86±0.28 |
| 2,5 mg/mL |
1.5±0.15 |
4.98±0.01 |
| 3,75 mg/mL |
2.47±0.25 |
9.74±0.7 |
| 5 mg/mL |
2.92±0.23 |
14.28±1.14* |
| 25 mg/mL |
14.15±1.35** |
17.6±2.56** |
| PBMCs |
ANX-V+/7AAD+ (%) |
ANX-V+/7AAD- (%) |
| CTR |
4.73±0.30 |
0.84±0.15 |
| H₂O |
0.92±0.10 |
0.75±0.35 |
| ETO 50 µM |
0.81±0.36 |
3.42±0.25 |
| 2,5 mg/mL |
2.45±0.45 |
0.65±0.28 |
| 3,75 mg/mL |
3.16±0.12 |
0.79±0.14 |
| 5 mg/mL |
9.03±0.18 |
1.24±0.32 |
| 25 mg/mL |
4.72±0.45 |
4.06±0.14 |

