Submitted:
09 July 2023
Posted:
11 July 2023
You are already at the latest version
Abstract
Keywords:
1. Introduction

2. State of the art
3. Design alternatives and techniques for a broad AQ monitoring network and its architecture
4. Data fusion, spatial interpolation, and route planner application
4.1. Analysis of the user’s profile: weighting pollutants
4.2. Kriging for spatial interpolation of pollution
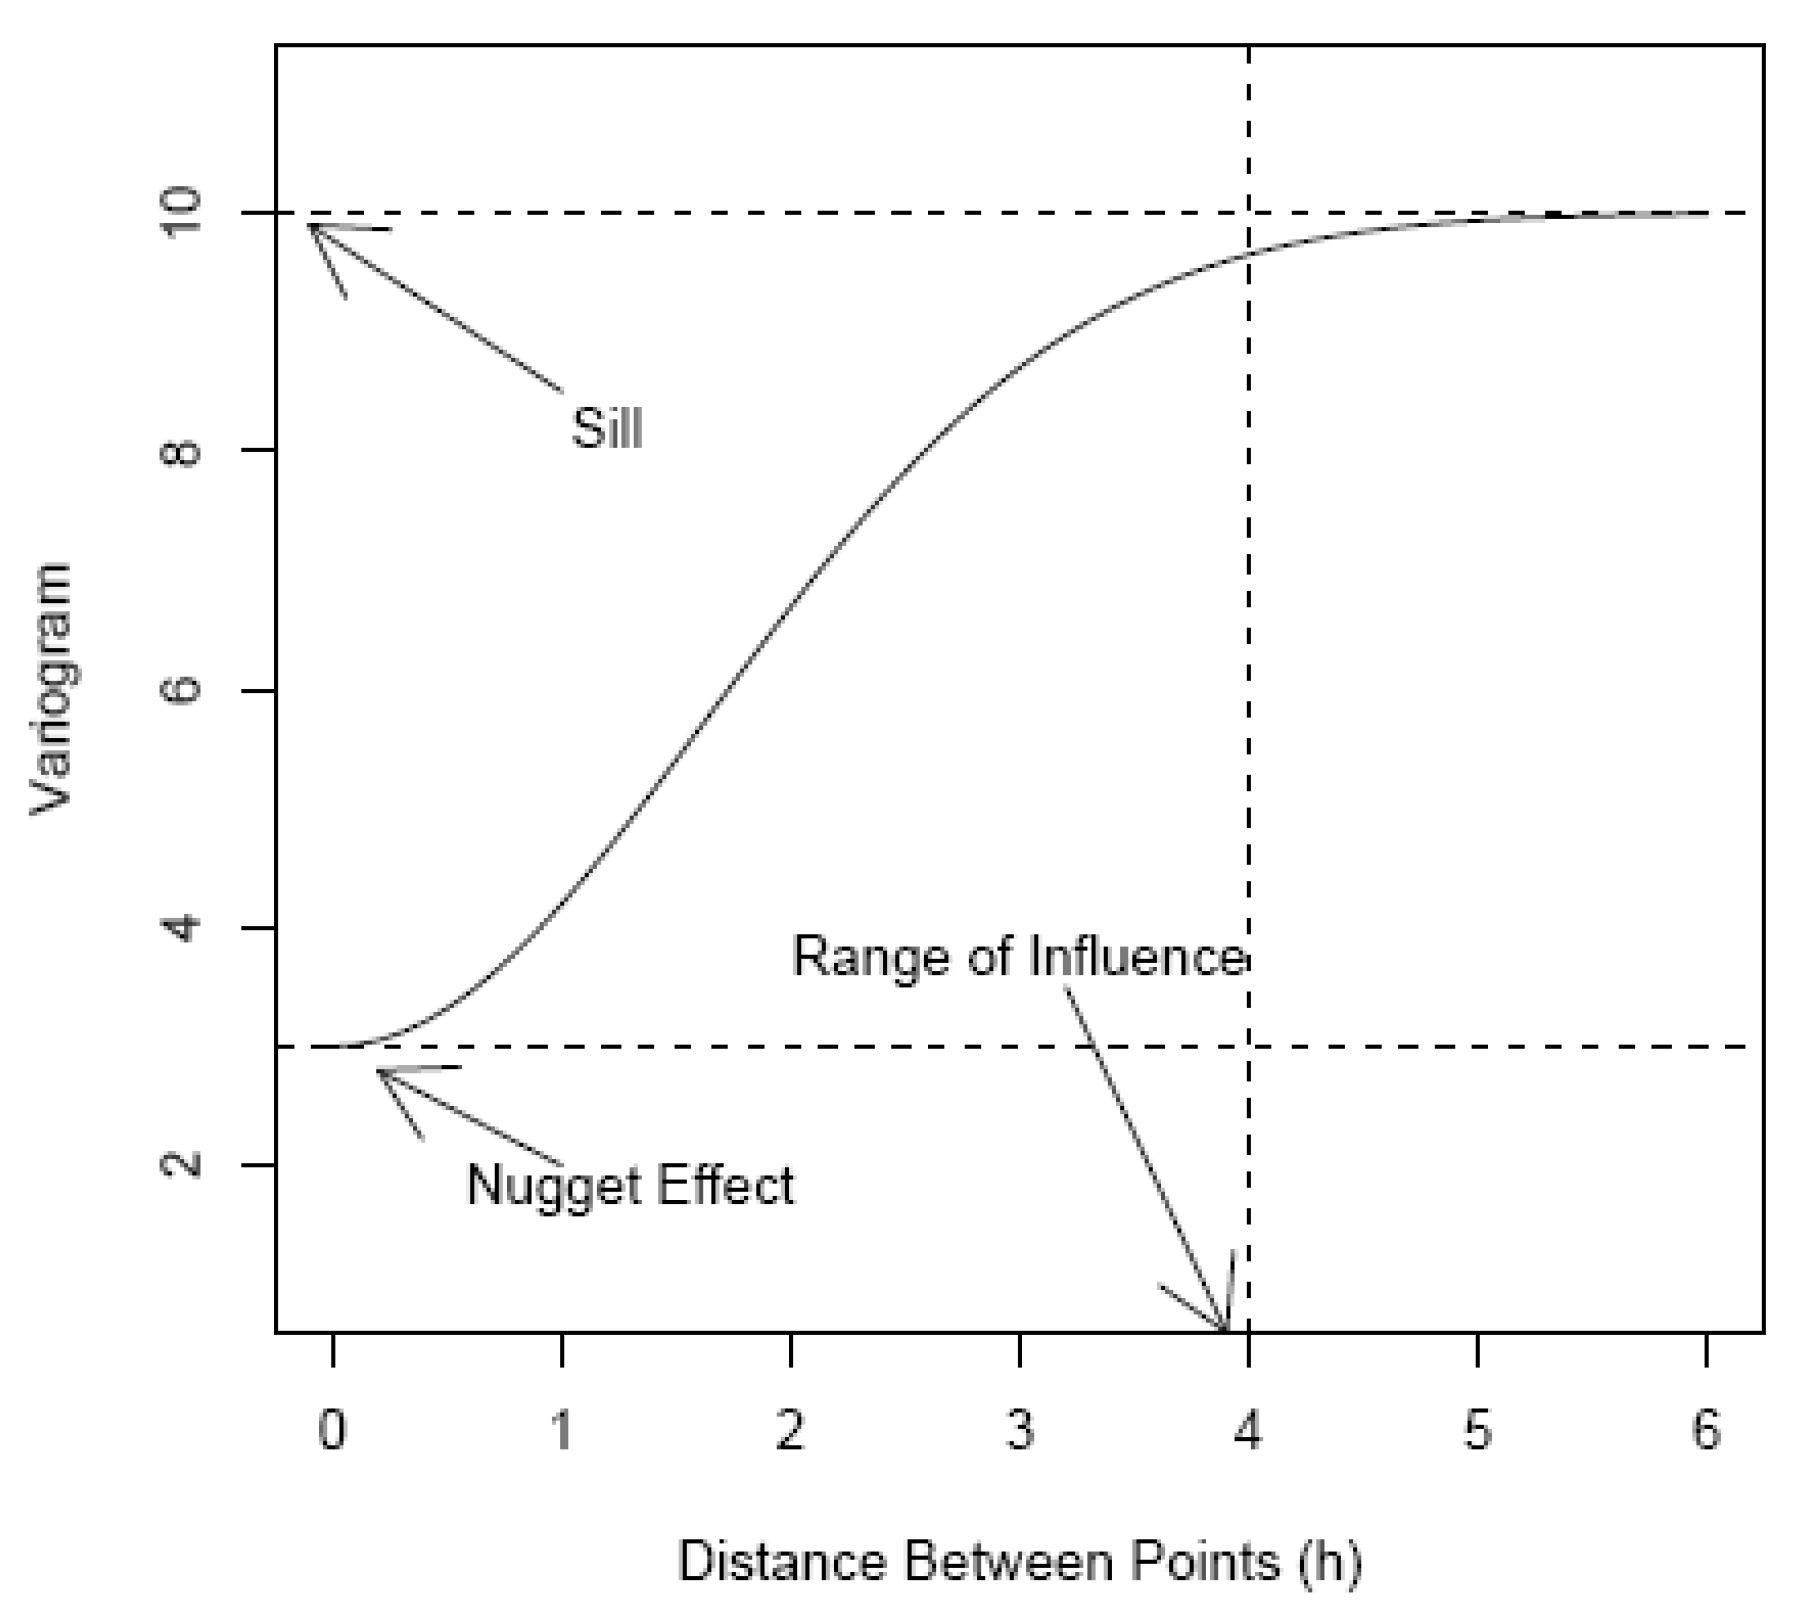
- The Sill: corresponds to the maximum height of the variogram curve. As h gets large, the correlation (and hence covariance) between the measured values at two points separated by a distance h become independent.
- The Range: is the distance h such that pairs of sites further than this distance apart are negligibly correlated. The range of influence is sometimes defined as the point at which the curve is of the difference between the nugget and the sill.
- The Nugget Effect: is expected that , i.e. should be equal to zero if . However, this is usually not the case. As the distance h goes to zero, there is a nugget effect due to measurement error and micro-scale variation.
4.3. Mapping of pollution over the grid on the city
4.4. Healthy route planner
5. Results and discussion
5.1. Analysis of the healthy route planner with different scenarios
5.2. Statistical analysis for the different scenarios
6. Conclusions and future work
Author Contributions
Funding
Institutional Review Board Statement
Informed Consent Statement
Conflicts of Interest
References
- H. Adair-Rohani. Air pollution responsible for 6.7 million deaths every year. https://www.who.int/teams/environment-climate-change-and-health/air-quality-and-health/health-impacts/types-of-pollutants, 2023. Accessed: 27/02/2023.
- Eurostat: Statistics Explained. Respiratory diseases statistics. https://ec.europa.eu/eurostat/statisticsexplained/ index.php?title=Respiratory_diseases_statistics#Deaths_from_diseases_of_the_respiratory_ system, September 2022. Accessed: 22/05/2023.
- BBC News. Air pollution news. https://www.bbc.co.uk/news/world-europe-46017339, 29 October 2018. Accessed: 23/05/2023.
- Molinari G, Colombo G, C. C. Respiratory allergies: a general overview of remedies, delivery systems, and the need to progress. International Scholarly Research Allergy. Hindawi 2014, 1, 1–16. [Google Scholar] [CrossRef]
- González-Díaz, S.; Arias-Cruz, A.; Macouzet-Sánchez, C.; Partida-Ortega, A. Impact of air pollution in respiratory allergic diseases. Medicina Universitaria 2016, 18, 212–215. [Google Scholar] [CrossRef]
- Zimmerman, N.; Presto, A.A.; Kumar, S.P.N.; Gu, J.; Hauryliuk, A.; Robinson, E.S.; Robinson, A.L.; Subramanian, R. A machine learning calibration model using random forests to improve sensor performance for lower-cost air quality monitoring. Atmospheric Measurement Techniques 2018, 11, 291–313. [Google Scholar] [CrossRef]
- Yadav, K.; Arora, V.; Kumar, M.; Tripathi, S.N.; Motghare, V.M.; Rajput, K.A. Few-Shot Calibration of Low-Cost Air Pollution (PM2.5) Sensors Using Meta Learning. IEEE Sensors Letters 2022, 6, 1–4. [Google Scholar] [CrossRef]
- Ajuntament de Valencia, minut a minut. Estaciones contaminación atmosféricas. https://valencia.opendatasoft.com/explore/dataset/estacions-contaminacio-atmosferiques-estaciones-contaminacion-atmosfericas/table/, 2023. Accessed: 21/05/2023.
- Conselleria d’Agricultura, Desenvolupament Rural, Emergència Climàtica i Transició Ecològica. RED VALENCIANA DE VIGILANCIA Y CONTROL DE LA CONTAMINACIÓN ATMOSFÉRICA. https://agroambient.gva.es/va/web/calidad-ambiental/datos-on-line, 2023. Accessed: 27/05/2023.
- ISO 11771:2010. Air quality -Determination of time-averaged mass emissions and emission factors -General approach. Technical report, ISO, 2010.
- ISO 37122:2019. Sustainable cities and communities -Indicators for smart cities. TC268 Sustainable cities and communities. Technical report, ISO, 2019.
- DIRECTIVE 2008/50/EC. OF THE EUROPEAN PARLIAMENT AND OF THE COUNCIL OF THE EUROPEAN PARLIAMENT AND OF THE COUNCIL of 21 May 2008 on ambient air quality and cleaner air for Europe. Official Journal of the European Communities 2008, L 152, 1–44. [Google Scholar]
- aqicn.org project. World Air Quality Index project. https://aqicn.org/, 2023. Accessed: 27/02/2023.
- Nova Fitness Co., Ltd. . Air quality sensor SDS011. https://cdn-reichelt.de/documents/datenblatt/X200/SDS011-DATASHEET.pdf, 2023. Accessed: 27/04/2023.
- DecentLab, Ltd.. Air quality sensor DL-LP8P. https://www.catsensors.com/media/Decentlab/Productos/Decentlab-DL-LP8P-datasheet.pdf, 2023. Accessed: 27/04/2023.
- SGX, SensorTech. Air quality sensor MiCS-6814. https://www.sgxsensortech.com/content/uploads/2015/02/1143_Datasheet-MiCS-6814-rev-8.pdf, 2023. Accessed: 21/05/2023.
- Winsen, Ltd.. Air quality sensor zphs01b. https://www.winsen-sensor.com/d/files/zphs01b-english-version1_1-20200713.pdf, 2023. Accessed: 20/03/2023.
- S.L., K.T. Calidad del Aire Urbano: Información ambiental y parámetros meteorológicos en entornos urbanos. https://www.kunak.es/, 2023. Accessed: 28/2/2023.
- Ltd., O.I.P. Accurate and Affordable Air Quality Monitoring Solutions. https://oizom.com, 2023. Accessed: 28/2/2023.
- García, M.R.; Spinazzé, A.; Branco, P.T.; Borghi, F.; Villena, G.; Cattaneo, A.; Gilio, A.D.; Mihucz, V.G.; Álvarez, E.G.; Lopes, S.I.; Bergmans, B.; Orłowski, C.; Karatzas, K.; Marques, G.; Saffell, J.; Sousa, S.I. Review of low-cost sensors for indoor air quality: Features and applications. Applied Spectroscopy Reviews 2022, 57, 747–779. [Google Scholar] [CrossRef]
- Rothkrantz, L. Multi parameter routing in air polluted urban areas. 2020 Smart City Symposium Prague (SCSP), 2020, pp. 1–6. [CrossRef]
- Steeneveld, G.; Vreugdenhil, L.; van der Molen, M.; Ligtenberg, A. Towards a Healthy Urban Route Planner for cyclists and pedestrians in Amsterdam. EMS annual meeting abstracts 2017, 14. Annual Meeting European Meteorological Society, Dublin : EMS2017-305 ; Conference date: 04-09-2017 Through 08-09-2017.
- RIVM Institute. Environmental Health Atlas - Explore and discover your living environment. https://www.atlasleefomgeving.nl/en, 2023. Accessed: 27/05/2023.
- Alvear, O.; Zamora, W.; Calafate, C.T.; Cano, J.C.; Manzoni, P. EcoSensor: Monitoring environmental pollution using mobile sensors. 2016 IEEE 17th International Symposium on A World of Wireless, Mobile and Multimedia Networks (WoWMoM), 2016, pp. 1–6. [CrossRef]
- Khedo, K.; Rajiv, P.; Avinash, M. A Wireless Sensor Network Air Pollution Monitoring System. International Journal of Wireless and Mobile Networks 2010, 2. [Google Scholar] [CrossRef]
- Müller, S.; Voisard, A. Air Quality Adjusted Routing for Cyclists and Pedestrians. Proceedings of the 1st ACM SIGSPATIAL InternationalWorkshop on the Use of GIS in Emergency Management; Association for Computing Machinery: New York, NY, USA, 2015; EM-GIS ’15. [CrossRef]
- Vamshi, B.; Prasad, R.V. Dynamic route planning framework for minimal air pollution exposure in urban road transportation systems. 2018 IEEE 4th World Forum on Internet of Things (WF-IoT), 2018, pp. 540–545. [CrossRef]
- Google. Google Maps. https://google.maps/, 2023. Accessed: 27/02/2023.
- AntsRoute. The solution for planning last-mile route of field workforce. https://antsroute.com/en, 2023. Accessed: 27/02/2023.
- Here. Our mission is to enable a digital representation of reality to radically improve the way the world moves, lives and interacts. https://www.here.com/, 2023. Accessed: 27/02/2023.
- Systems, E. ESP32 system-on-chip. https://www.espressif.com/en/products/socs/esp32, 2023. Accessed: 28/1/2023.
- Pycom.io. Fipy, five network development board for IoT. https://pycom.io/product/fipy/, 2022. Accessed: 28/12/2022.
- Kiesewetter, G.; Schoepp, W.; Heyes, C.; Amann, M. Modelling PM2. 5 impact indicators in Europe: health effects and legal compliance. Environmental Modelling & Software 2015, 74, 201–211. [Google Scholar]
- Ubilla, C.; Yohannessen, K. Contaminación atmosférica efectos en la salud respiratoria en el niño. Revista Médica Clínica Las Condes 2017, 28, 111–118. [Google Scholar] [CrossRef]
- Orellano, P.; Quaranta, N.; Reynoso, J.; Balbi, B.; Vasquez, J. Effect of outdoor air pollution on asthma exacerbations in children and adults: systematic review and multilevel meta-analysis. PloS one 2017, 12, e0174050. [Google Scholar] [CrossRef] [PubMed]
- Sanchez, P.B.C.; Macias, G.E.M.; Anchundia, Y.J.P.; Moreira, J.L.Z. Contaminación atmosférica y efectos respiratorios en niños, en mujeres embarazadas y en adultos mayores.
- Bienestar, O. La Exposición Al Dióxido de Nitrógeno Durante El Embarazo perjudica La Capacidad de Atención de los Niños. https://www.atresmedia.com/objetivo-bienestar/actualidad/exposicion-dioxido-nitrogeno-embarazo-perjudica-capacidad-atencion-ninos_20170803598433970cf2c0f4136d712c.html, 2017. Accessed on 15.06.2023.
- Vargas, S.; Onatra, W.; Osorno, L.; Páez, E.; Sáenz, O. Contaminación atmosférica y efectos respiratorios en niños, en mujeres embarazadas y en adultos mayores. Revista udca actualidad & divulgación científica 2008, 11, 31–45. [Google Scholar]
- ISGlobal. La exposición a la contaminación atmosférica durante el embarazo también perjudica a la capacidad de atención en la infancia. http://bit.ly/exposicion-a-contaminacion-atmosferica-durante-embarazo, 2017. Accessed on 15.06.2023.
- E.H., I.; R.M., S. An Introduction to Applied Geostatistics; Oxford University Press: New York, 1989.
- Cressie, N. Statistics for Spatial Data; John Wiley: New York, 1993. [Google Scholar]
- Matheron, G. Traite de geostatistique appliquee, Tome I. Memoires du Bureau de Recherches Geologiques et Minieres 1962, 1. [Google Scholar]
- OSM contributors. Open Street Map. https://www.openstreetmap.org/, 2023. Accessed: 27/05/2023.
- Boeing, G. OSMnx: New methods for acquiring, constructing, analyzing, and visualizing complex street networks. Computers, Environment and Urban Systems 2017, 65, 126–139. [Google Scholar] [CrossRef]
- Segura-Garcia, J.; Calero, J.M.A.; Pastor-Aparicio, A.; Marco-Alaez, R.; Felici-Castell, S.; Wang, Q. 5G IoT System for Real-Time Psycho-Acoustic Soundscape Monitoring in Smart Cities With Dynamic Computational Offloading to the Edge. IEEE Internet of Things Journal 2021, 8, 12467–12475. [Google Scholar] [CrossRef]
| 1 |
pgRouting extends the PostGIS / PostgreSQL geospatial database to provide geospatial routing functionality. |
| 2 | Pycom Ltd. went into bankruptcy in September 2022, but the newly created Pycom BV took over the company |

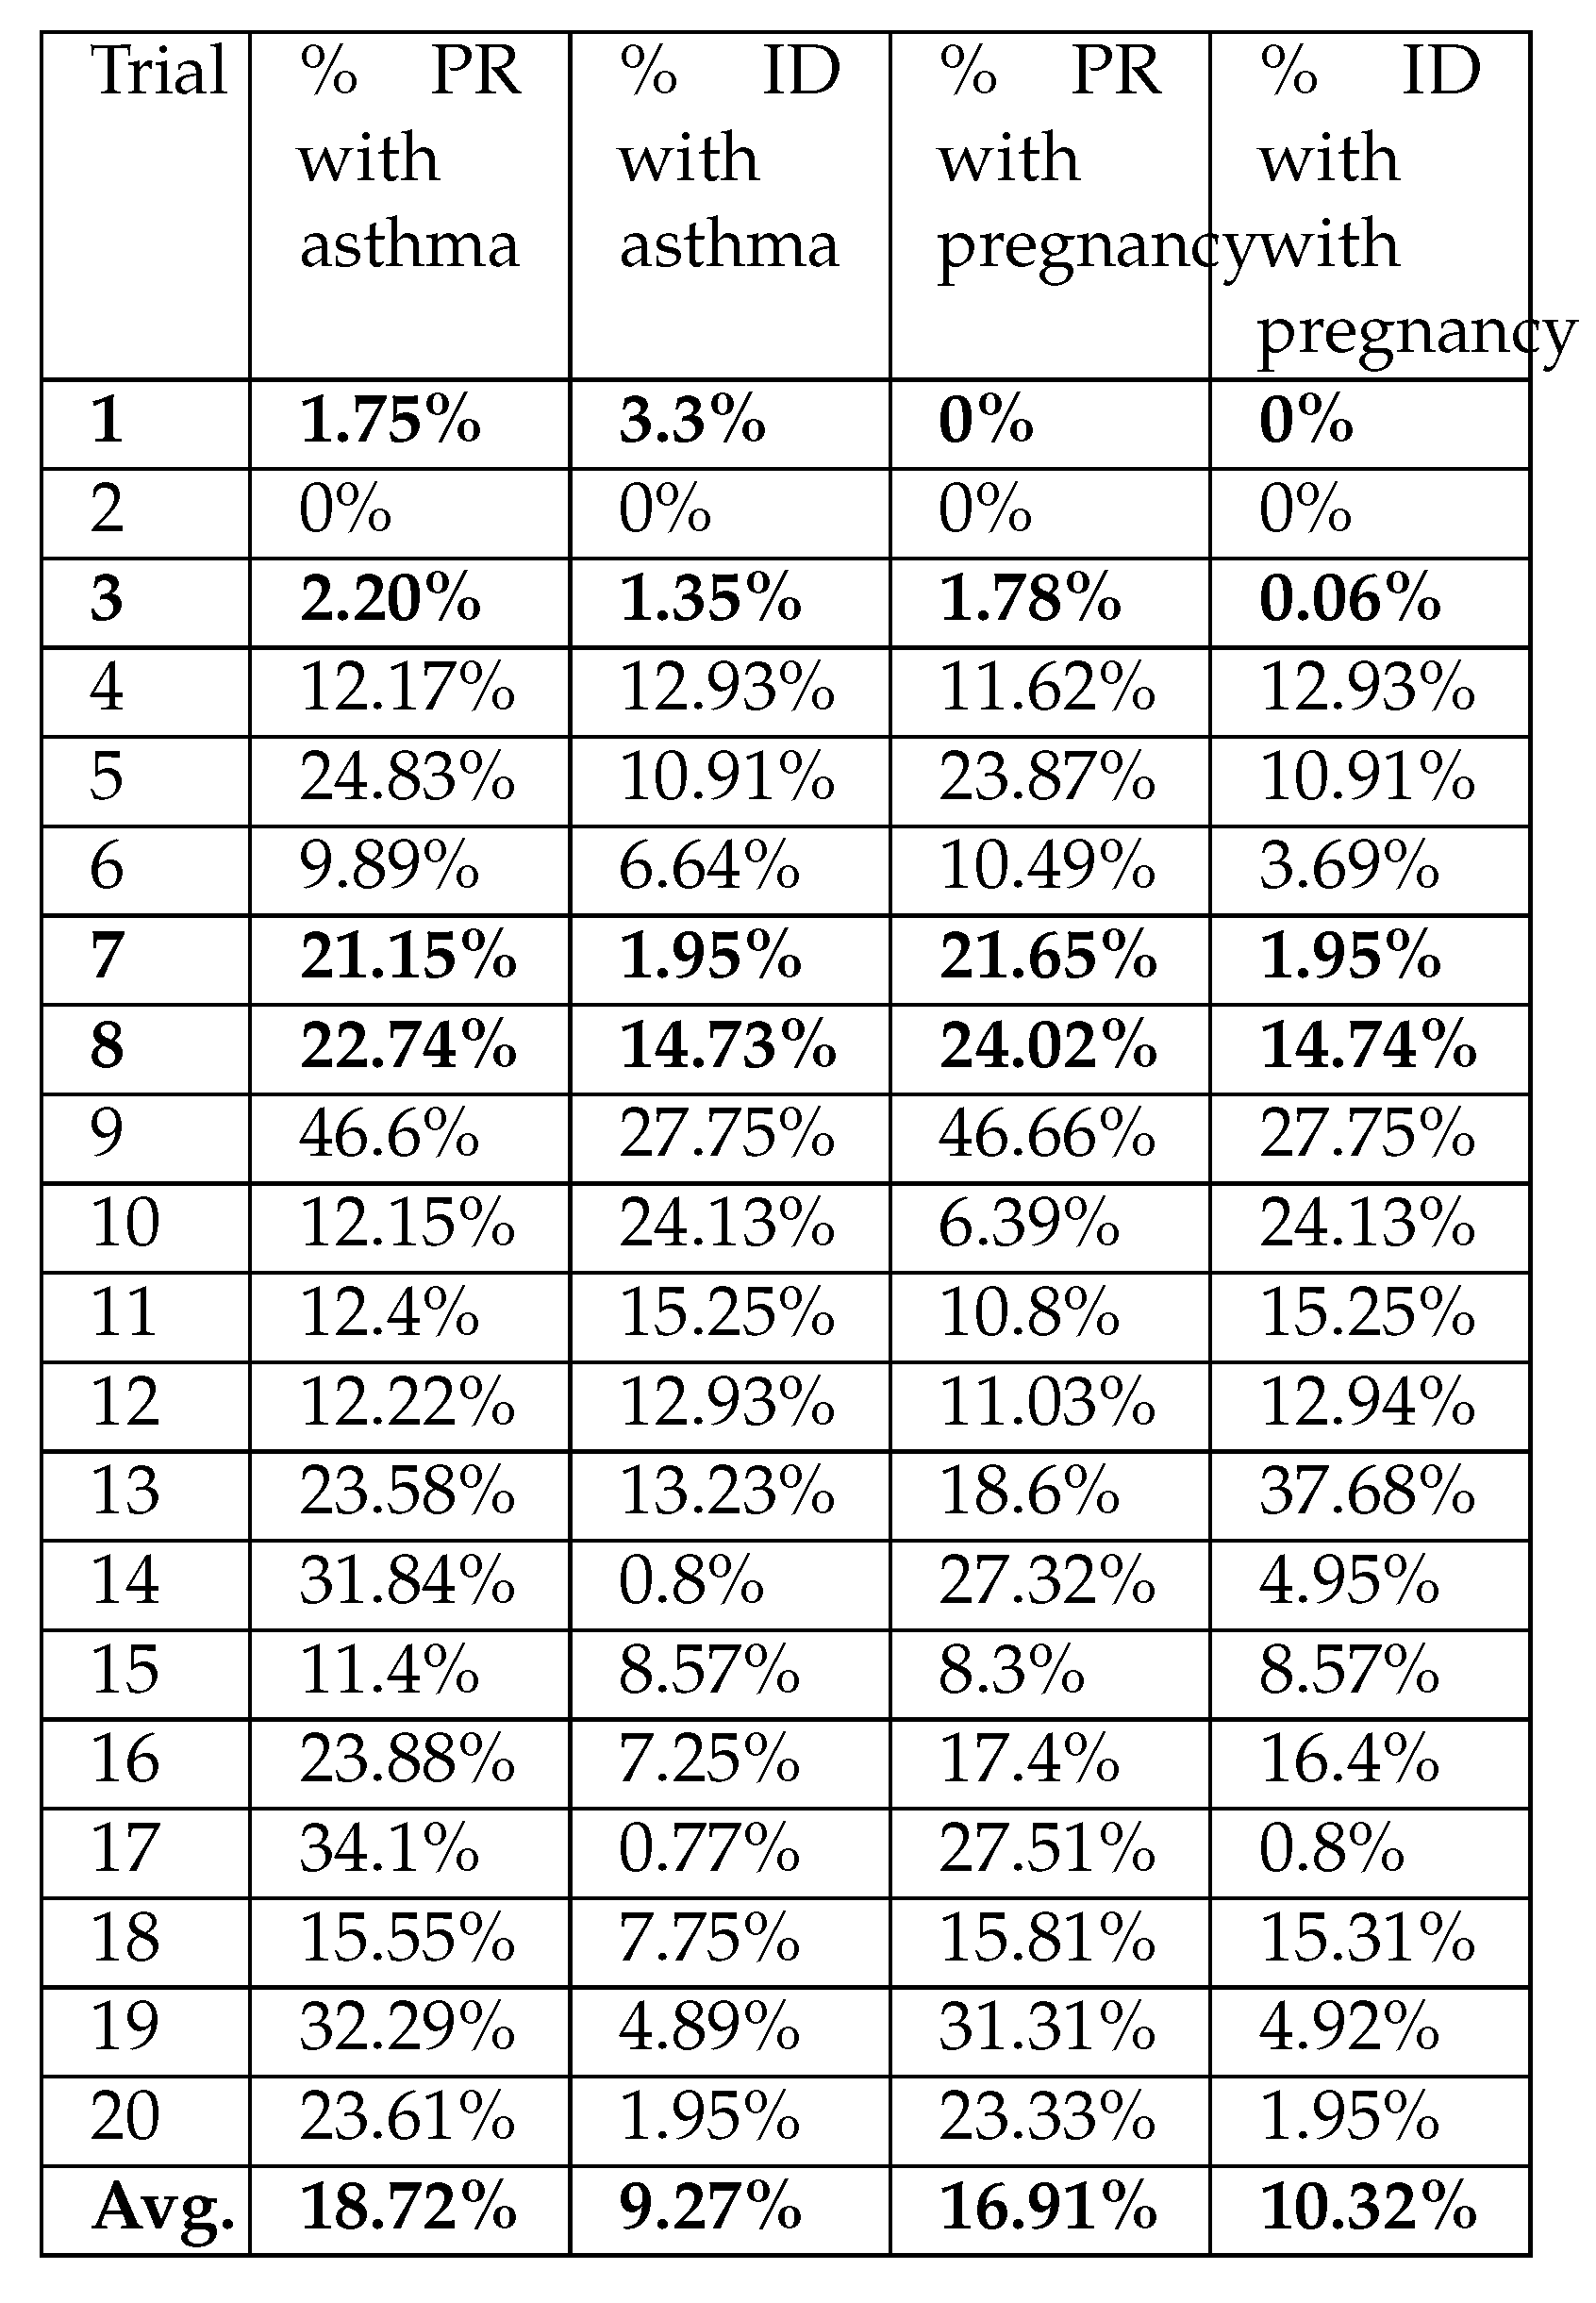
| Trial | % PR with asthma | % ID with asthma | % PR with pregnancy | % ID with with pregnancy |
| 1 | 1.75% | 3.3% | 0% | 0% |
| 2 | 0% | 0% | 0% | 0% |
| 3 | 2.20% | 1.35% | 1.78% | 0.06% |
| 4 | 12.17% | 12.93% | 11.62% | 12.93% |
| 5 | 24.83% | 10.91% | 23.87% | 10.91% |
| 6 | 9.89% | 6.64% | 10.49% | 3.69% |
| 7 | 21.15% | 1.95% | 21.65% | 1.95% |
| 8 | 22.74% | 14.73% | 24.02% | 14.74% |
| 9 | 46.6% | 27.75% | 46.66% | 27.75% |
| 10 | 12.15% | 24.13% | 6.39% | 24.13% |
| 11 | 12.4% | 15.25% | 10.8% | 15.25% |
| 12 | 12.22% | 12.93% | 11.03% | 12.94% |
| 13 | 23.58% | 13.23% | 18.6% | 37.68% |
| 14 | 31.84% | 0.8% | 27.32% | 4.95% |
| 15 | 11.4% | 8.57% | 8.3% | 8.57% |
| 16 | 23.88% | 7.25% | 17.4% | 16.4% |
| 17 | 34.1% | 0.77% | 27.51% | 0.8% |
| 18 | 15.55% | 7.75% | 15.81% | 15.31% |
| 19 | 32.29% | 4.89% | 31.31% | 4.92% |
| 20 | 23.61% | 1.95% | 23.33% | 1.95% |
| Avg. | 18.72% | 9.27% | 16.91% | 10.32% |
| Module | Gas sensors | Connection type |
|---|---|---|
| SDS011 [14] | PM, T, HR, PA | UART |
| DL-LP8P [15] | , T, HR, PA | LoRAWAN |
| MiCS-6814 [16] | , , , , | I2C, SPI |
| ZPHS01B [17] | , , , , TVOC, T, HR | UART |
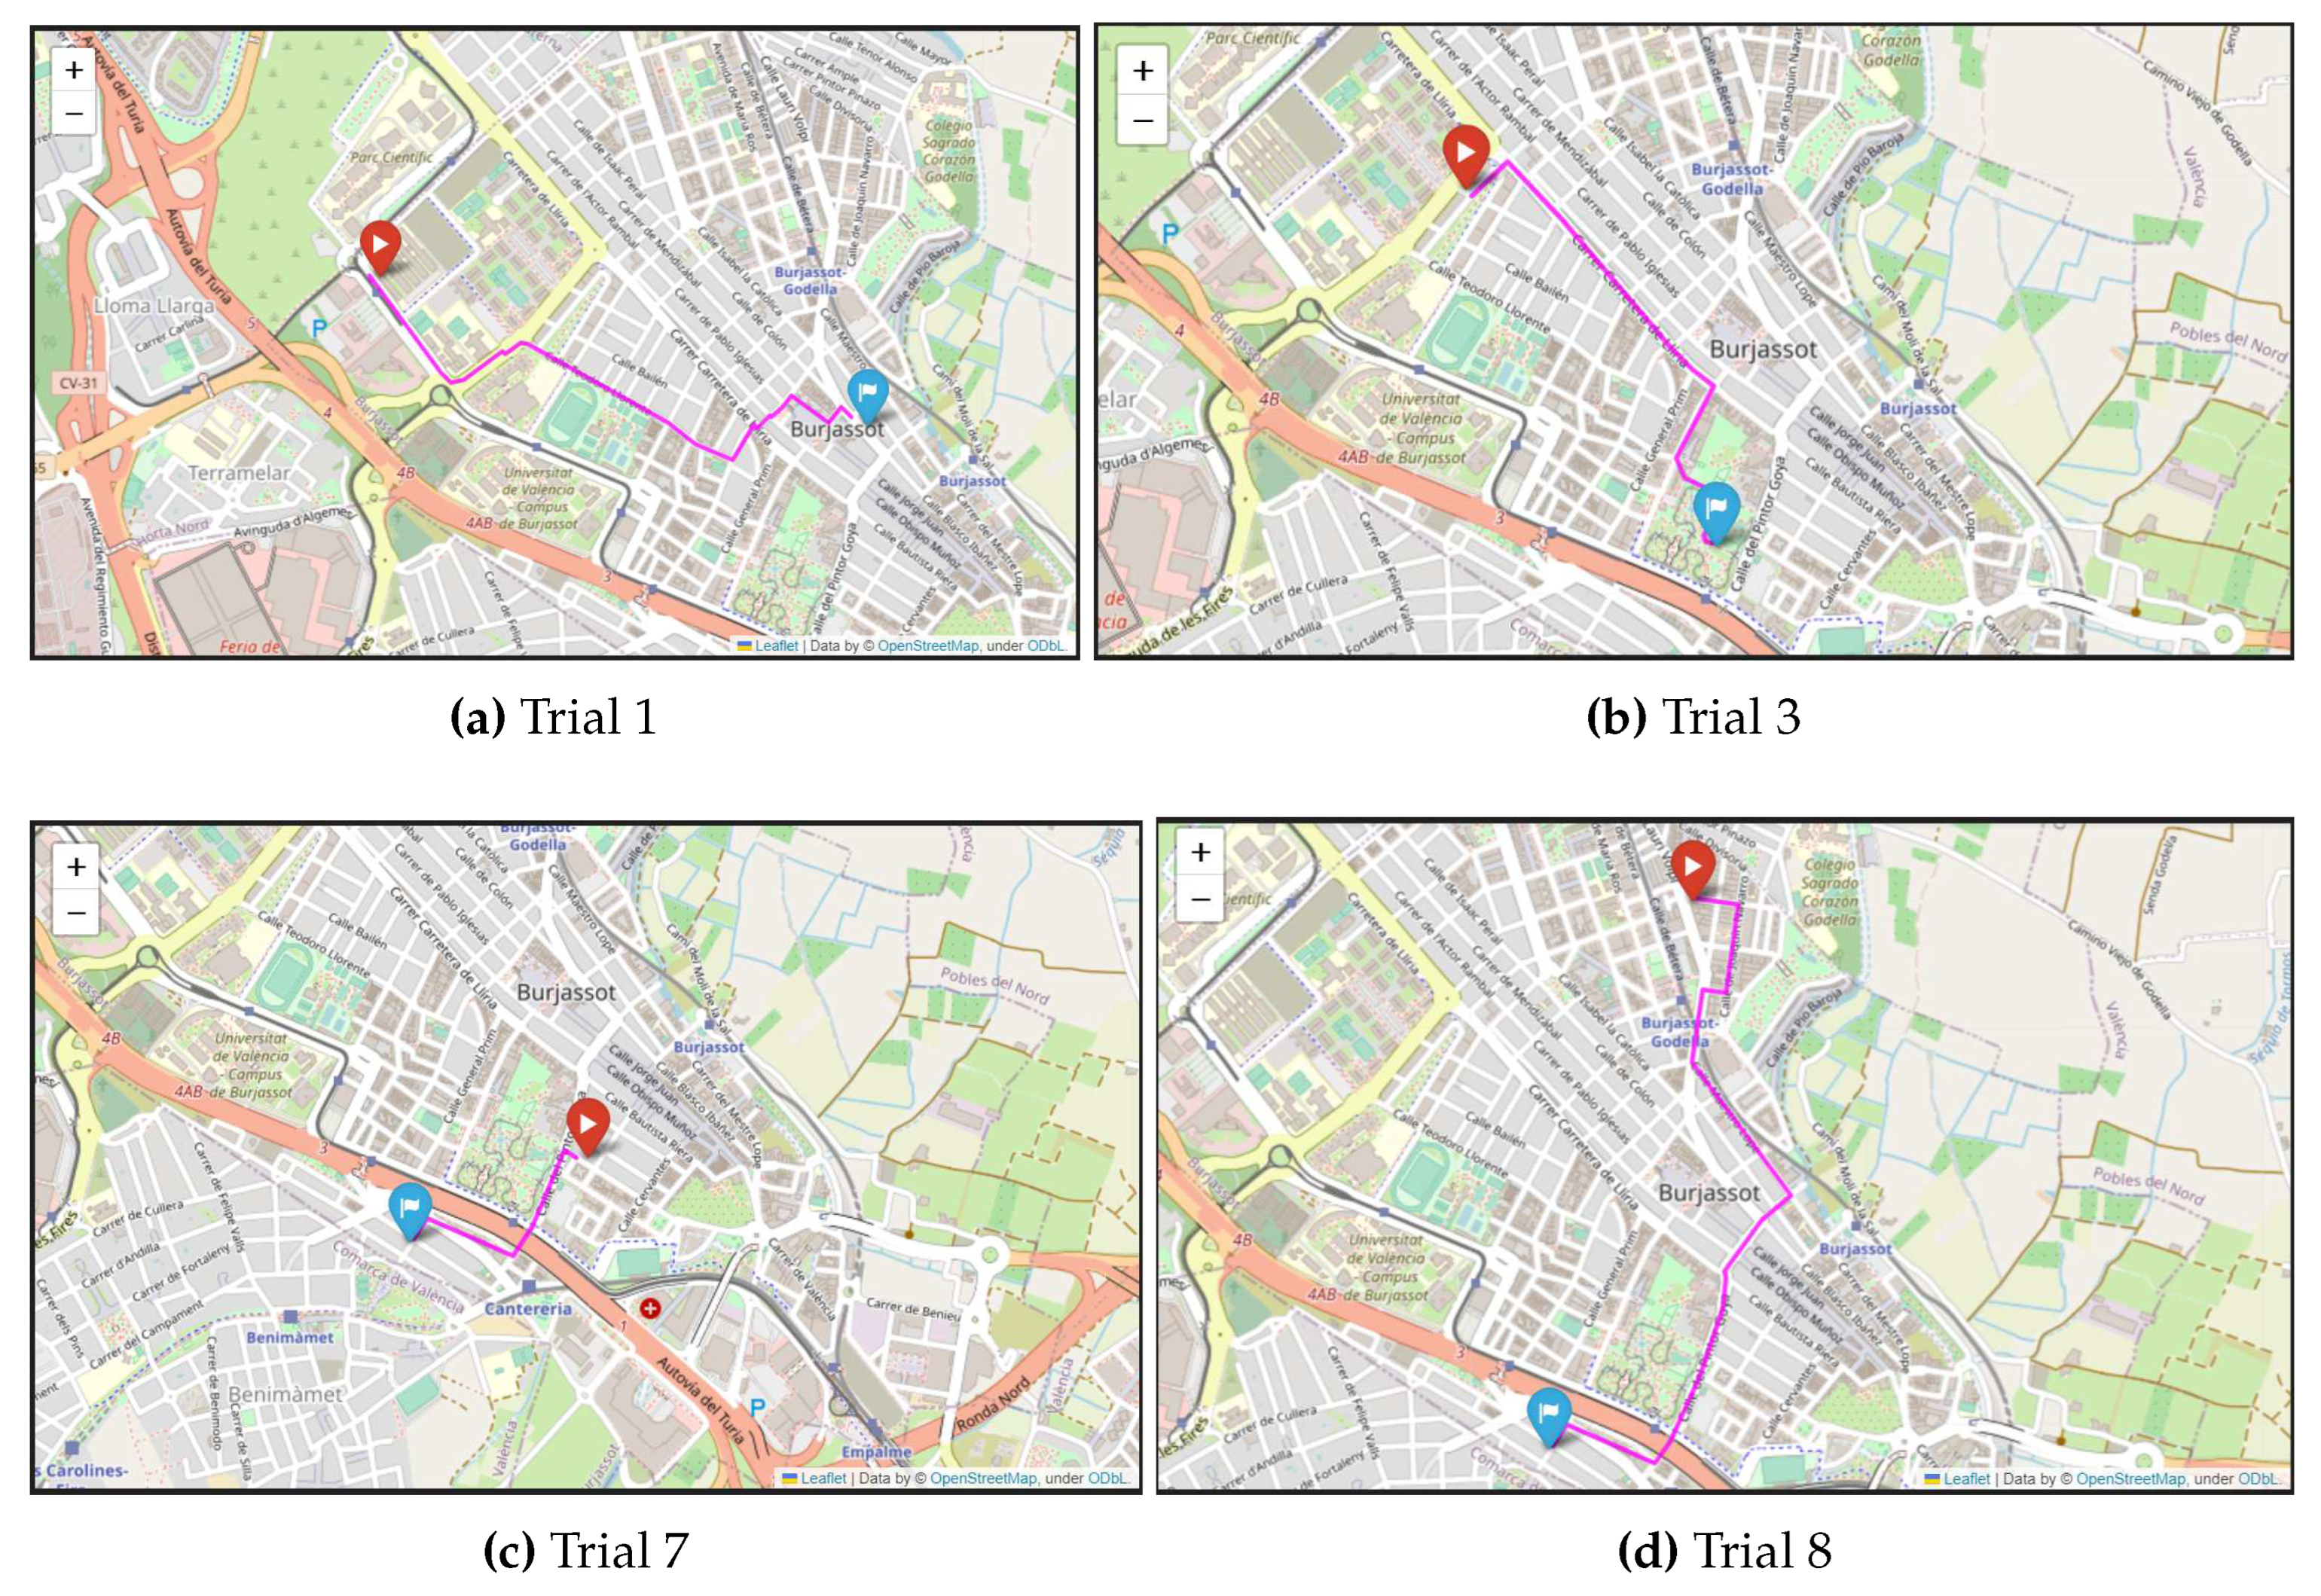
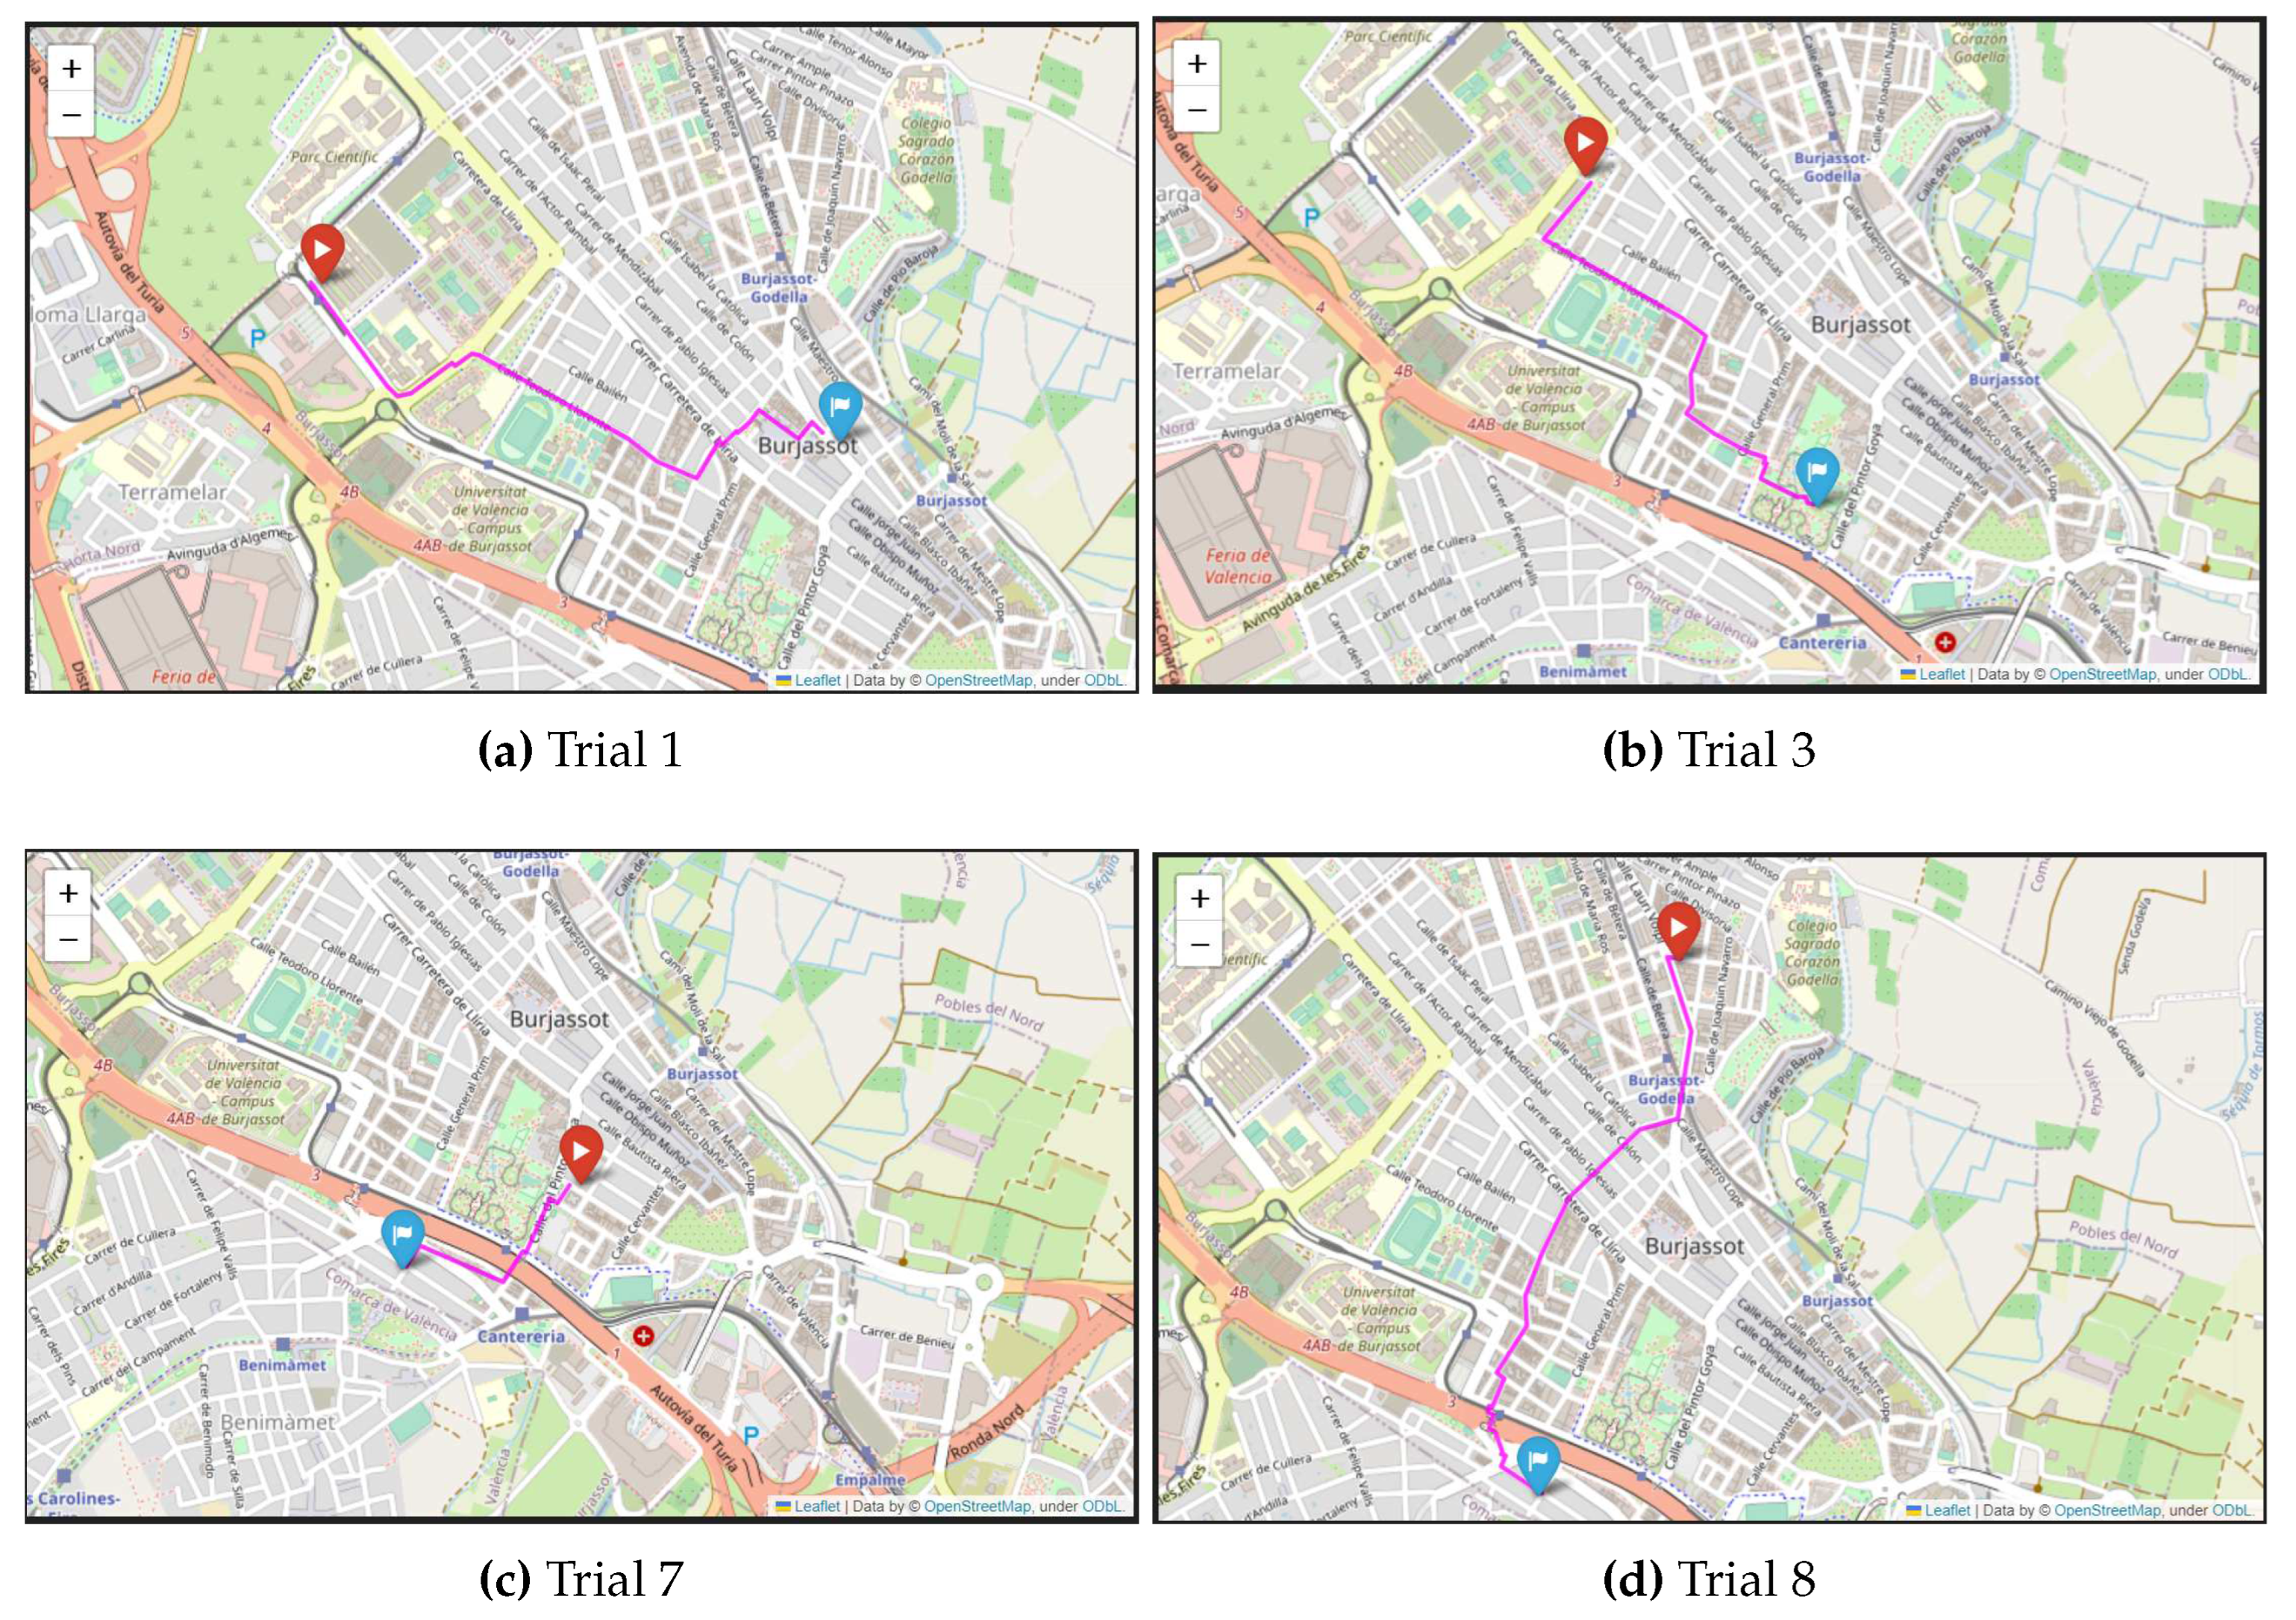
| Trial | Src. | Dto. | DD | HH | C. Asthma | D. Asthma | C. Preg. | D. Preg. | C. SPF Asthma | C. SPF Preg. | D. SPF |
|---|---|---|---|---|---|---|---|---|---|---|---|
| 1 | ETSE | Oficina de correos de Burjassot | Fri. 16/06/2023 | 10:13 | 42848.7 | 1728.1 | 17927.14 | 1671.05 | 43609.68 | 17927.14 | 1671.05 |
| 2 | ETSE | Residencia micampus Burjassot | Fri. 16/06/2023 | 12:21 | 28349.79 | 816.02 | 7679.55 | 816.02 | 28349.79 | 7679.55 | 816.02 |
| 3 | Residencia micampus Burjassot | Parque de la Granja | Fri. 16/06/2023 | 19:32 | 46232.2 | 1295.79 | 9822.41 | 1279.08 | 47273.17 | 10000.21 | 1278.33 |
| 4 | C/ Vista Alegre 2 | Polideportivo de Burjassot | Sat. 17/06/2023 | 9:21 | 432.97 | 850.25 | 191.17 | 850.25 | 492.98 | 216.3 | 740.34 |
| 5 | C/ Vista Alegre 2 | Hospital IMED | Sat. 17/06/2023 | 20:47 | 1290.39 | 2385.04 | 322.92 | 2385.04 | 1716.59 | 424.17 | 2124.88 |
| 6 | C/ Maestro Giner 32 | Restaurante Colonial buffet | Sun. 18/06/2023 | 14:09 | 954.03 | 1215.45 | 323.4 | 1178.19 | 1058.74 | 361.32 | 1134.74 |
| 7 | C/ Maestro Giner 32 | Restaurante Quitin | Sun. 18/06/2023 | 14:28 | 413.58 | 640.03 | 86.99 | 640.03 | 524.55 | 111.02 | 627.55 |
| 8 | C/ Vista Alegre 2 | Restaurante Quitin | Sun. 18/06/2023 | 14:31 | 1161.19 | 1996.87 | 249.01 | 1997.02 | 1502.93 | 327.74 | 1702.75 |
| 9 | C/ Vista Alegre 2 | ETSE | Mon. 19/06/2023 | 10:35 | 415.82 | 2281.57 | 893.67 | 2281.57 | 778.73 | 1675.34 | 1648.43 |
| 10 | ETSE | Residencia micampus Burjassot | Fri. 16/06/2023 | 12:21 | 28349.79 | 816.02 | 7679.55 | 816.02 | 28349.79 | 7679.55 | 816.02 |
| 11 | ETSE | C/ maestro Giner 32 | Mon. 19/06/2023 | 14:31 | 546.89 | 1928.15 | 156.95 | 1928.15 | 624.33 | 175.94 | 1928.15 |
| 12 | C/ Vista Alegre 2 | Consum 1 | Wed. 21/06/2023 | 9:32 | 433.32 | 850.26 | 139.79 | 850.41 | 493.63 | 157.11 | 740.34 |
| 13 | C/ Vista Alegre 2 | Consum 2 | Wed. 21/06/2023 | 9:41 | 513.38 | 663.54 | 159.03 | 923.98 | 671.82 | 159.03 | 575.77 |
| 14 | C/ Vista Alegre 2 | Mercadona | Wed. 21/06/2023 | 9:47 | 341.57 | 473.96 | 104.97 | 494.65 | 501.38 | 144.4 | 470.17 |
| 15 | C/ Lauri Volpi 12 | Druni | Wed. 21/06/2023 | 11:08 | 522.42 | 867.41 | 154.86 | 867.41 | 589.62 | 168.88 | 793.06 |
| 16 | C/ Lauri Volpi 15 | Mercadona | Wed. 21/06/2023 | 12:47 | 412.1 | 379.06 | 110.94 | 420.58 | 541.36 | 134.31 | 351.59 |
| 17 | C/ Vista Alegre 2 | Mercadona | Thurs. 22/06/2023 | 12:32 | 376.14 | 473.8 | 97.69 | 473.96 | 570.79 | 134.76 | 470.17 |
| 18 | Parada Burjassot-Godella | Centro de salud | Thurs. 22/06/2023 | 12:48 | 811.98 | 1380.04 | 196.48 | 1503.31 | 961.48 | 233.37 | 1273.13 |
| 19 | C/ Vista Alegre 2 | Parque de la granja | Sun. 25/06/2023 | 17:19 | 373.1 | 528.61 | 65.95 | 528.77 | 551.04 | 96 | 502.75 |
| 20 | C/ Maestro Giner 32 | Mercado | Mon. 26/06/2023 | 11:46 | 291.5 | 666.91 | 69.12 | 666.91 | 381.59 | 90.15 | 653.92 |
Disclaimer/Publisher’s Note: The statements, opinions and data contained in all publications are solely those of the individual author(s) and contributor(s) and not of MDPI and/or the editor(s). MDPI and/or the editor(s) disclaim responsibility for any injury to people or property resulting from any ideas, methods, instructions or products referred to in the content. |
© 2023 by the authors. Licensee MDPI, Basel, Switzerland. This article is an open access article distributed under the terms and conditions of the Creative Commons Attribution (CC BY) license (http://creativecommons.org/licenses/by/4.0/).


