Preprint
Article

Are Rotations and Translations of Head Posture Related to Performance Parameters in Three Different Dynamic Tasks?

Altmetrics

Downloads

159

Views

132

Comments

0

A peer-reviewed article of this preprint also exists.

Submitted:

09 July 2023

Posted:

11 July 2023

You are already at the latest version

Alerts
Abstract
This study assessed the relationship between head posture displacements and biomechanical parameters in three different tasks. One hundred male and female students (20 ± 3yrs) were assessed via the PostureScreen Mobile app to quantify postural displacements of head rotations and translations including: 1) the cranio-vertebral angle (CVA) (°), 2) anterior head translation (AHT) (cm), 3) lateral head translation in the coronal plane (cm), and 4) lateral head side bending (°). Biomechanical parameters during gait and jumping were measured using the G-Walk sensor. The assessed gait spatiotemporal parameters were cadence (steps / min), speed (m / s), symmetry index, % left and right stride length (% height), and right and left propulsion index. The pelvic movement parameters were: 1) tilt symmetry index, 2) tilt left and right range, 3) obliquity symmetry index, 4) obliquity left and right range, 5) rotation symmetry index, and 6) rotation left and right range. The jump parameters measured were: 1) flight height (cm), 2) take off force (kN), 3) impact Force (kN), 4) take off speed (m / s), 5) peak speed (m / s), 6) average speed concentric phase (m / s), 7) maximum concentric power (kW), 8) average concentric power (kW) during the counter movement jump (CMJ), and 9) CMJ with arms thrust (CMJAT). At a significance-level of p ≤ 0.001, moderate to high correlations (0.4 < r < 0.8) were found between CVA, AHT, lateral translation head and all the gait and jump parameters. Weak correlations (0.2 < r <  0.4) were ascertained for lateral head bending and all the gait and jump parameters except for gait symmetry index and pelvic symmetry index, where moderate correlations were identified (0.4 < r < 0.6). The findings indicate moderate to high correlations between specific head posture displacements, such as CVA, lateral head translation and AHT with the various gait and jump parameters. These findings highlight the importance of considering head posture in the assessment and optimization of movement patterns during gait and jumping. Our findings contribute to the existing body of knowledge and may have implications for clinical practice and sports performance training. Further research is warranted to elucidate the underlying mechanisms and establish causality in these relationships, which could potentially lead to the development of targeted interventions for improving movement patterns and preventing injuries.
Keywords: 
Subject: Medicine and Pharmacology  -   Orthopedics and Sports Medicine

1. Introduction

Gait and jump analysis hold immense importance in understanding the biomechanics and functional abilities of athletes across all sports. These analyses provide valuable information about the quality and efficiency of movement patterns, offering insights into musculoskeletal health, performance, and injury prevention [1,2,3,4,5,6,7]. Understanding an individual's jumping and gait mechanics is crucial, particularly when considering the spinal factors that may affect these parameters. One such factor is head posture, which is proposed to play a significant role in the overall relationship between movement patterns and spinal alignment [8,9,10,11,12,13]. It is plausible that alterations in gait and jump performance are associated with abnormal head posture; this hypothesis stems from the understanding that deviations in head posture can detrimentally affect both postural control and proprioception [9,14,15,16]. Consequently, these effects can have a cascading impact on the entire kinetic chain, resulting in modifications in gait and jump parameters, as well as an elevated susceptibility to injuries [17,18,19,20]. Despite the significance of this potential relationship, limited research has been conducted to investigate the connection between head posture and the mechanics of gait and jump movements.
Importantly, since posture is three-dimensional (3D) it should be assessed in three-dimensions, however, most previous studies have only focused on sagittal plane alignment and have not considered coronal plane (lateral) translational and rotational postural differences [12,17,21,22]. Further, to the best of our knowledge, there are currently no studies that have investigated this relationship within the context of translational and rotational head posture measurement differences specifically among university students. Biomechanically, the movements of the spine are intricate and involve complex coupling patterns that are influenced by the anatomical and mechanical characteristics between two or more motion segments [23,24,25,26]. A primary main motion as a translation or rotation of the head / cervical spine in one geometric plane can lead to ‘coupled’ movements in other planes [27,28]. This emphasizes the importance of conducting a global posture assessment that considers translational and rotational displacements, as suggested by Harrison and Oakley [29,30]. As postural displacements can exist in multiple planes, there is a need for a more comprehensive understanding of the relationship between 3D posture parameters and gait parameters. Upon reviewing evidence, however, the relationship between postural parameters and gait / jump analysis has not been sufficiently covered, as most measures of posture that are correlated with gait / jump analysis have not been assessed in 3D [31,32,33,34].
Recent technological advancements have made it possible to accurately measure posture parameters, including translational and rotational displacements in multiple planes [35,36]. These advancements present a unique opportunity to identify potential areas of postural abnormalities for interventions that can improve gait and jump parameters across various population groups due to their accessibility, accuracy, and ease of use. In the context of analyzing gait and jump performance, the current gold-standard laboratory-based assessment methods, such as motion capture systems, optical encoders, position transducers and force plates offer high accuracy but are limited in their clinical use due to setup and analysis time, technical expertise requirements and high costs. To overcome these limitations, the valid and reliable wireless inertial BTS G-WALK sensor system (G-Walk) has been introduced as a more practical alternative for gait and jump performance assessment [37,38]. Thus, the aim of this study is to provide a more comprehensive understanding of the relationship between 3D head / neck posture parameters and gait and jump parameters that are essential to understanding the effects of 3D postural parameters on performance during walking and jumping across healthy collegiate students. The current study tests the main hypothesis that posture displacements as rotations and translations of the head will have negative impacts on gait and jumping in a young, healthy student population.

2. Materials and Methods

For this study, one-hundred healthy male and female collegiate students were recruited for participation. The inclusion criteria included: (i) ages between 17 to 26; (ii) a normal body mass index (BMI) of up to 24.9; and (iii) no previous history of musculoskeletal / movement disorders of any kind. Ethical approval was obtained from the Ethics Committee of the University of Sharjah, reference number: REC-21-10-25-S. Informed consent was also obtained from all the participants prior to data collection in accordance with relevant guidelines and regulations. All participants were screened for the following exclusion criteria: (i) inflammatory joint disease or other systemic pathologies; (ii) prior history of overt injury and surgery relating to the musculoskeletal system or disorder related to the spine and extremities; (iii) musculoskeletal pain in the previous three months; (iv) neurological disorders; and (v) vision and / or hearing related impairments.

2.1. Outcome measures

2.1.1. Posture measurement

The PostureScreen® Mobile app (PSM) is a digital posturographic assessment tool that was used to perform a 3D postural examination. The PSM has established reliability and has been shown to be a valid method for evaluating static posture [35,36]. PSM captures images of the participant from four directions: anterior and posterior (coronal plane) and the left and right sides (sagittal plane). After the photographic capture, specific anatomical reference points are digitized by the user such as the pelvic iliac spines, the greater trochanter, the femoral condyle and the tragus. The PSM then calculates specific body angles and distances based on the anatomical digitization and creates an output file containing values of posture variables and images of the participant that can be used to compare and analyze the postural deviations from neutral among participants.

2.1.2. Gait and jump paramters

The G-Walk is a portable gait lab system that functions using a special sensor which is placed on each participant. The sensor can provide objective data regarding kinetics, kinematics, and spatio-temporal parameters by accurately measuring components of movement in 6 integrated protocols, 2 of which were utilized in this study [39,40]. The G-walk system was used in several studies for gait and jump analysis previously [42,43,44]. Further, the G-Walk system can differentiate between parameters for the left and right sides, in addition to comparing values obtained with established normal ranges based on each participant’s sex, age, height and weight [41,42].
The G-Walk measurement includes several protocols. This study mainly explores the data related to two protocols, one of which is related to ambulation, called ‘walking’ and the other protocol is related to athletic performance, called ‘jumping’. Each protocol measures certain pre-set parameters related to kinetics, kinematics, spatio-temporal parameters, and specific general parameters associated with that activity. Moreover, the jumping protocol includes several types of jumps of which two were selected for this study. Each protocol is discussed in detail in the section below:
  • A-Walking
The sensor is placed on the L5-S1 vertebrae, the participant is then instructed to walk in a straight line using their natural speed to allow the execution of at least 5 complete gait cycles (>7m) before making a change of direction. Before each change of direction, the participant was instructed to stop for a minimum of 1 second, turn around towards the new direction and take a pause of at least 1 second before starting to walk again.
The following parameters were selected from the measurements obtained through the walking protocol:
1-Spatiotemporal Parameters-Global Analysis
  • Cadence (steps/min): number of steps taken by the participant in one minute.
  • Speed (m/s): average walking speed.
  • Stride length (m): average value of distances between each initial contact and the next one of the same sides.
  • %Stride length (%height): Stride length normalized over the height of the subject.
2-Stance Phase
  • This includes all the steps taken by the patient during the trial showcased by initial contact and foot off (thus showcasing the symmetry between right and left steps, and the symmetry between steps taken on each side respectively.
3-Gait Cycle
  • Different graphs representing left and right gait cycles starting with stance phase, shown via initial contact (0%), and the next initial contact on the same foot (100%), in addition to toe off (represented using a dotted line) to signal the start of the stride phase
  • Symmetry index, which is the percentage of symmetry between the curve of anterior/posterior acceleration during left and right gait cycles, the maximum value of 100 represents ideal symmetry throughout walking.
Figure 1. Symmetry Index shown to compare the curve of anteroposterior acceleration between left (red) and right (green) gait cycles. The light area around the line represents the normative ranges for this subject based on their demographic data.
Preprints 79011 g001
4-Single Support Phases
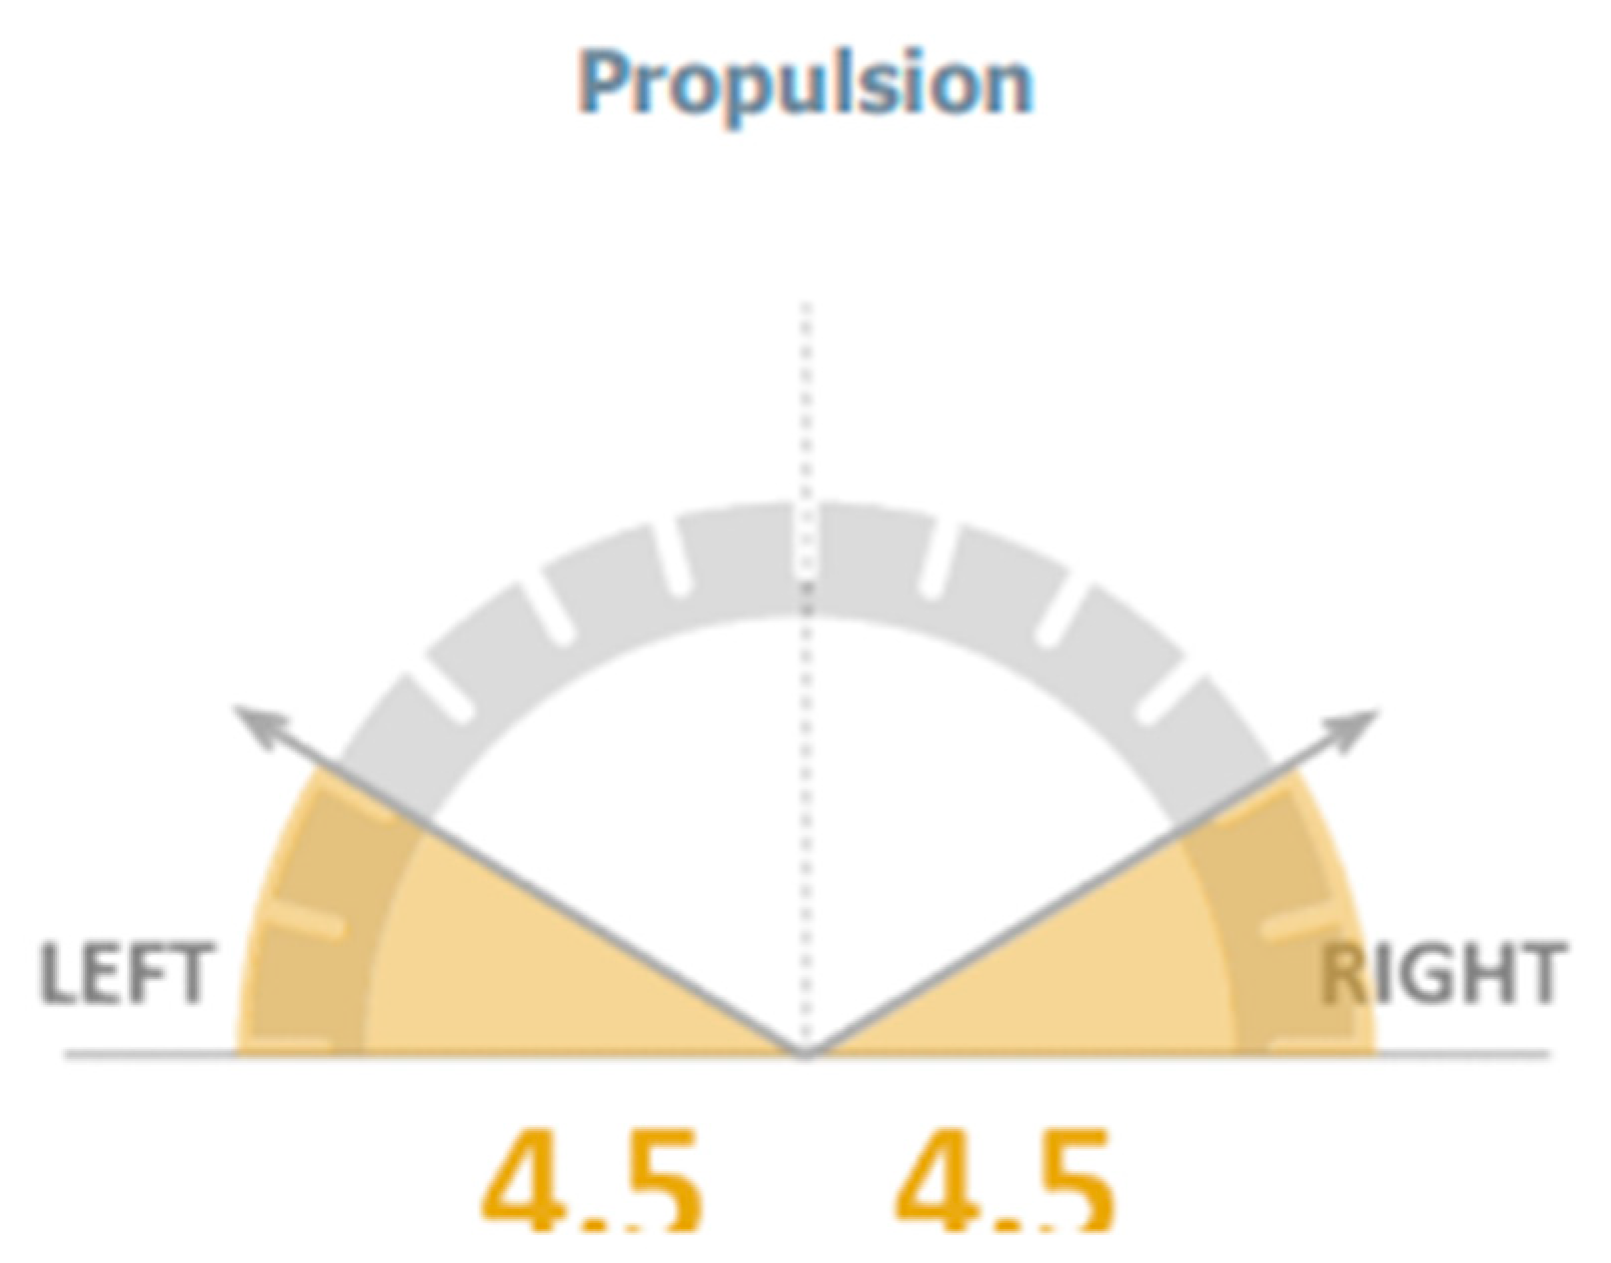
  • Propulsion (represented using a blue line), in addition to propulsion index (represented using the slope of the blue line) where more “vertical” lines indicate higher propulsion indices, thus, better propulsion symmetry between both sides.
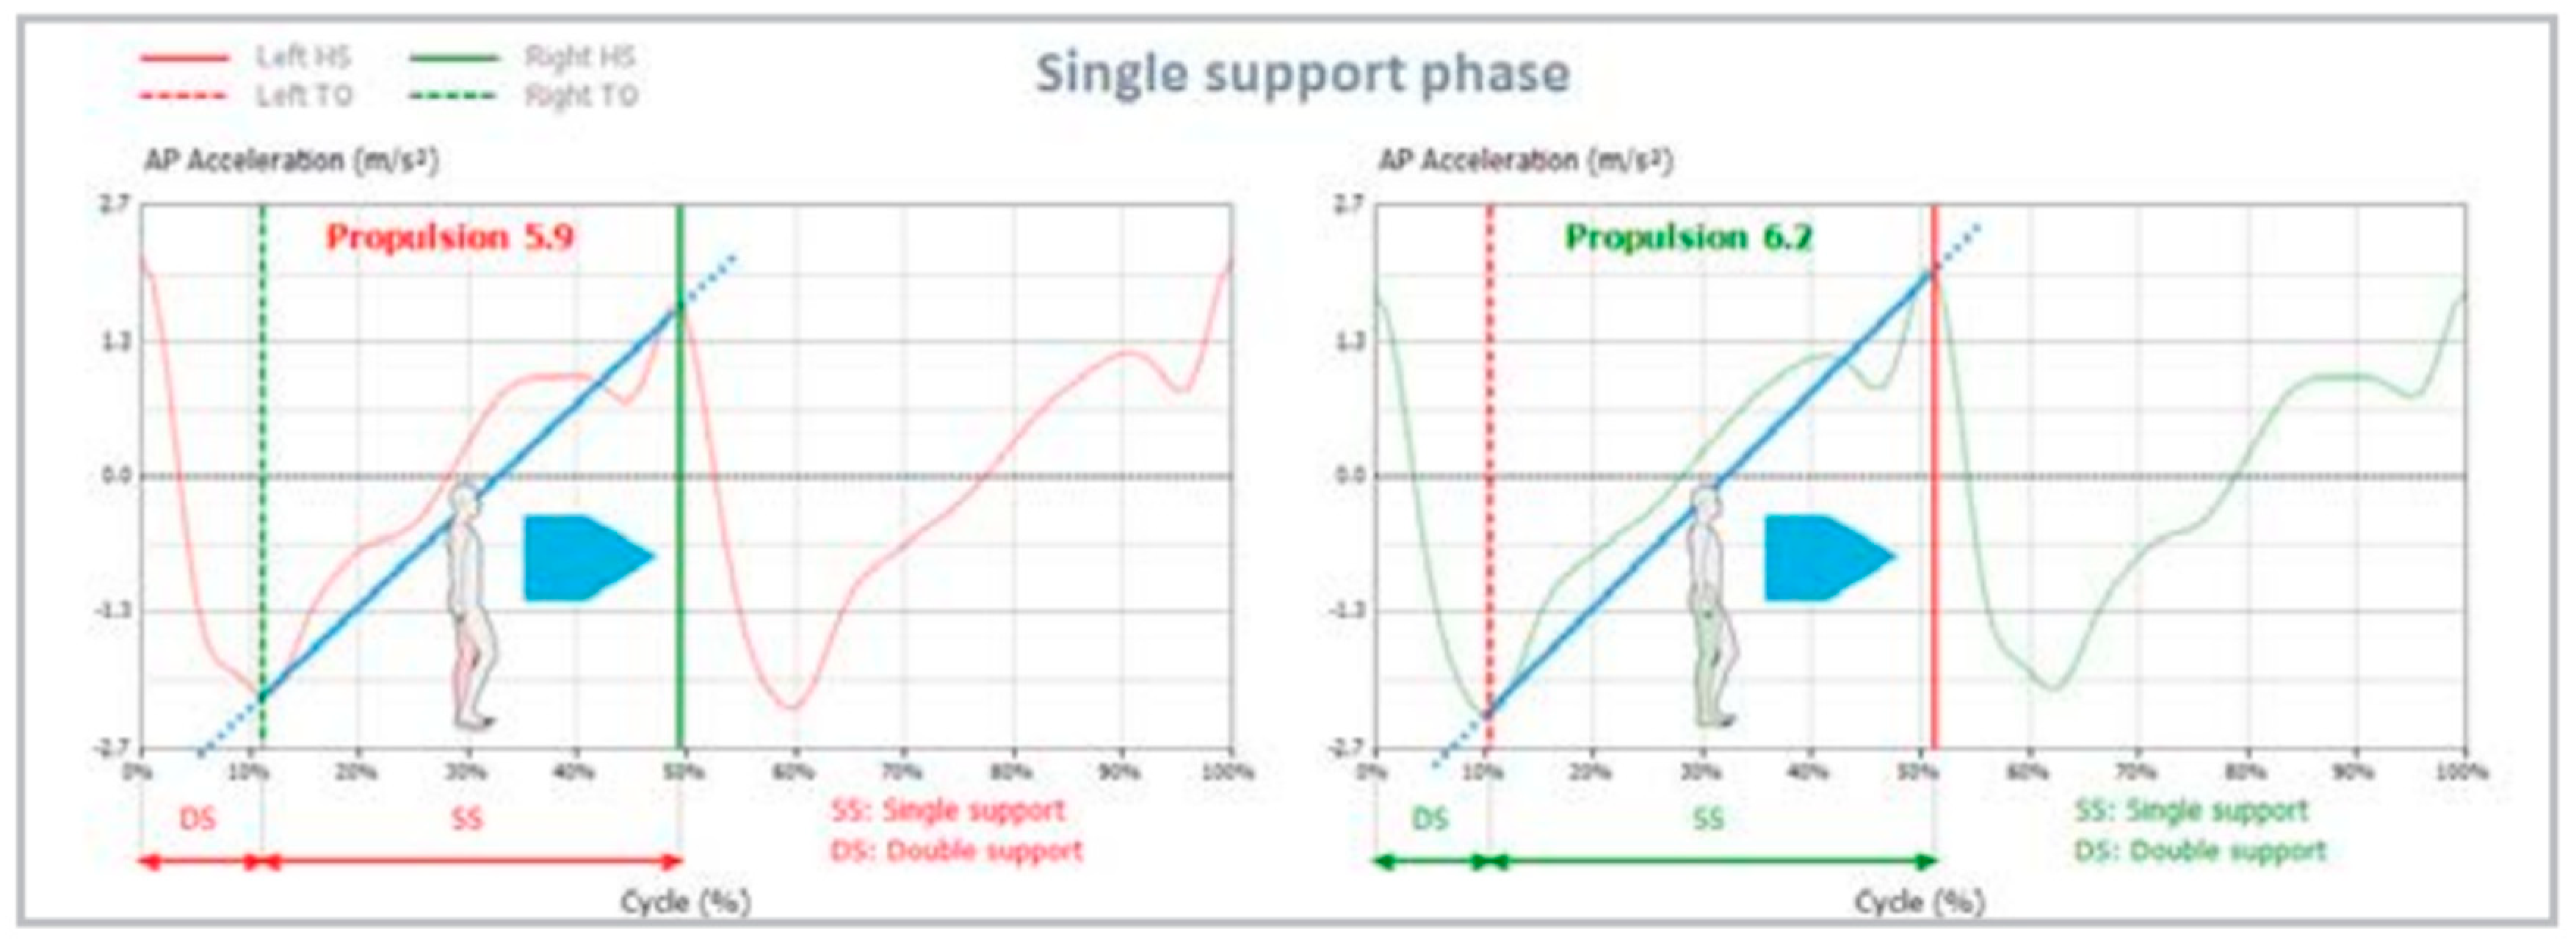
Figure 2. Propulsion during the single support phase represented by the blue line. The slope indicates the symmetry between both sides where a more vertical line showcases better symmetry between left (red) and right (green) lines.
Preprints 79011 g002
Figure 3. Propulsion Index calculated for left and right-side gait cycles.
Preprints 79011 g003
5-Pelvic Angles
  • Tilt: positive angular values indicate an anterior tilt of the pelvis, while negative angular values indicate a posterior tilt of the pelvis (sagittal plane movement).
  • Obliquity: negative angular values indicate DOWN condition, while positive angular values indicate UP position for the considered side (frontal plane movement).
  • Rotation: negative angular values indicate pelvis internally rotated, while positive angular values indicate a pelvis externally rotated (transverse plane movement).
  • Relative symmetry index, minimum and maximum angles were shown for each of the 3 pelvic parameters mentioned above.
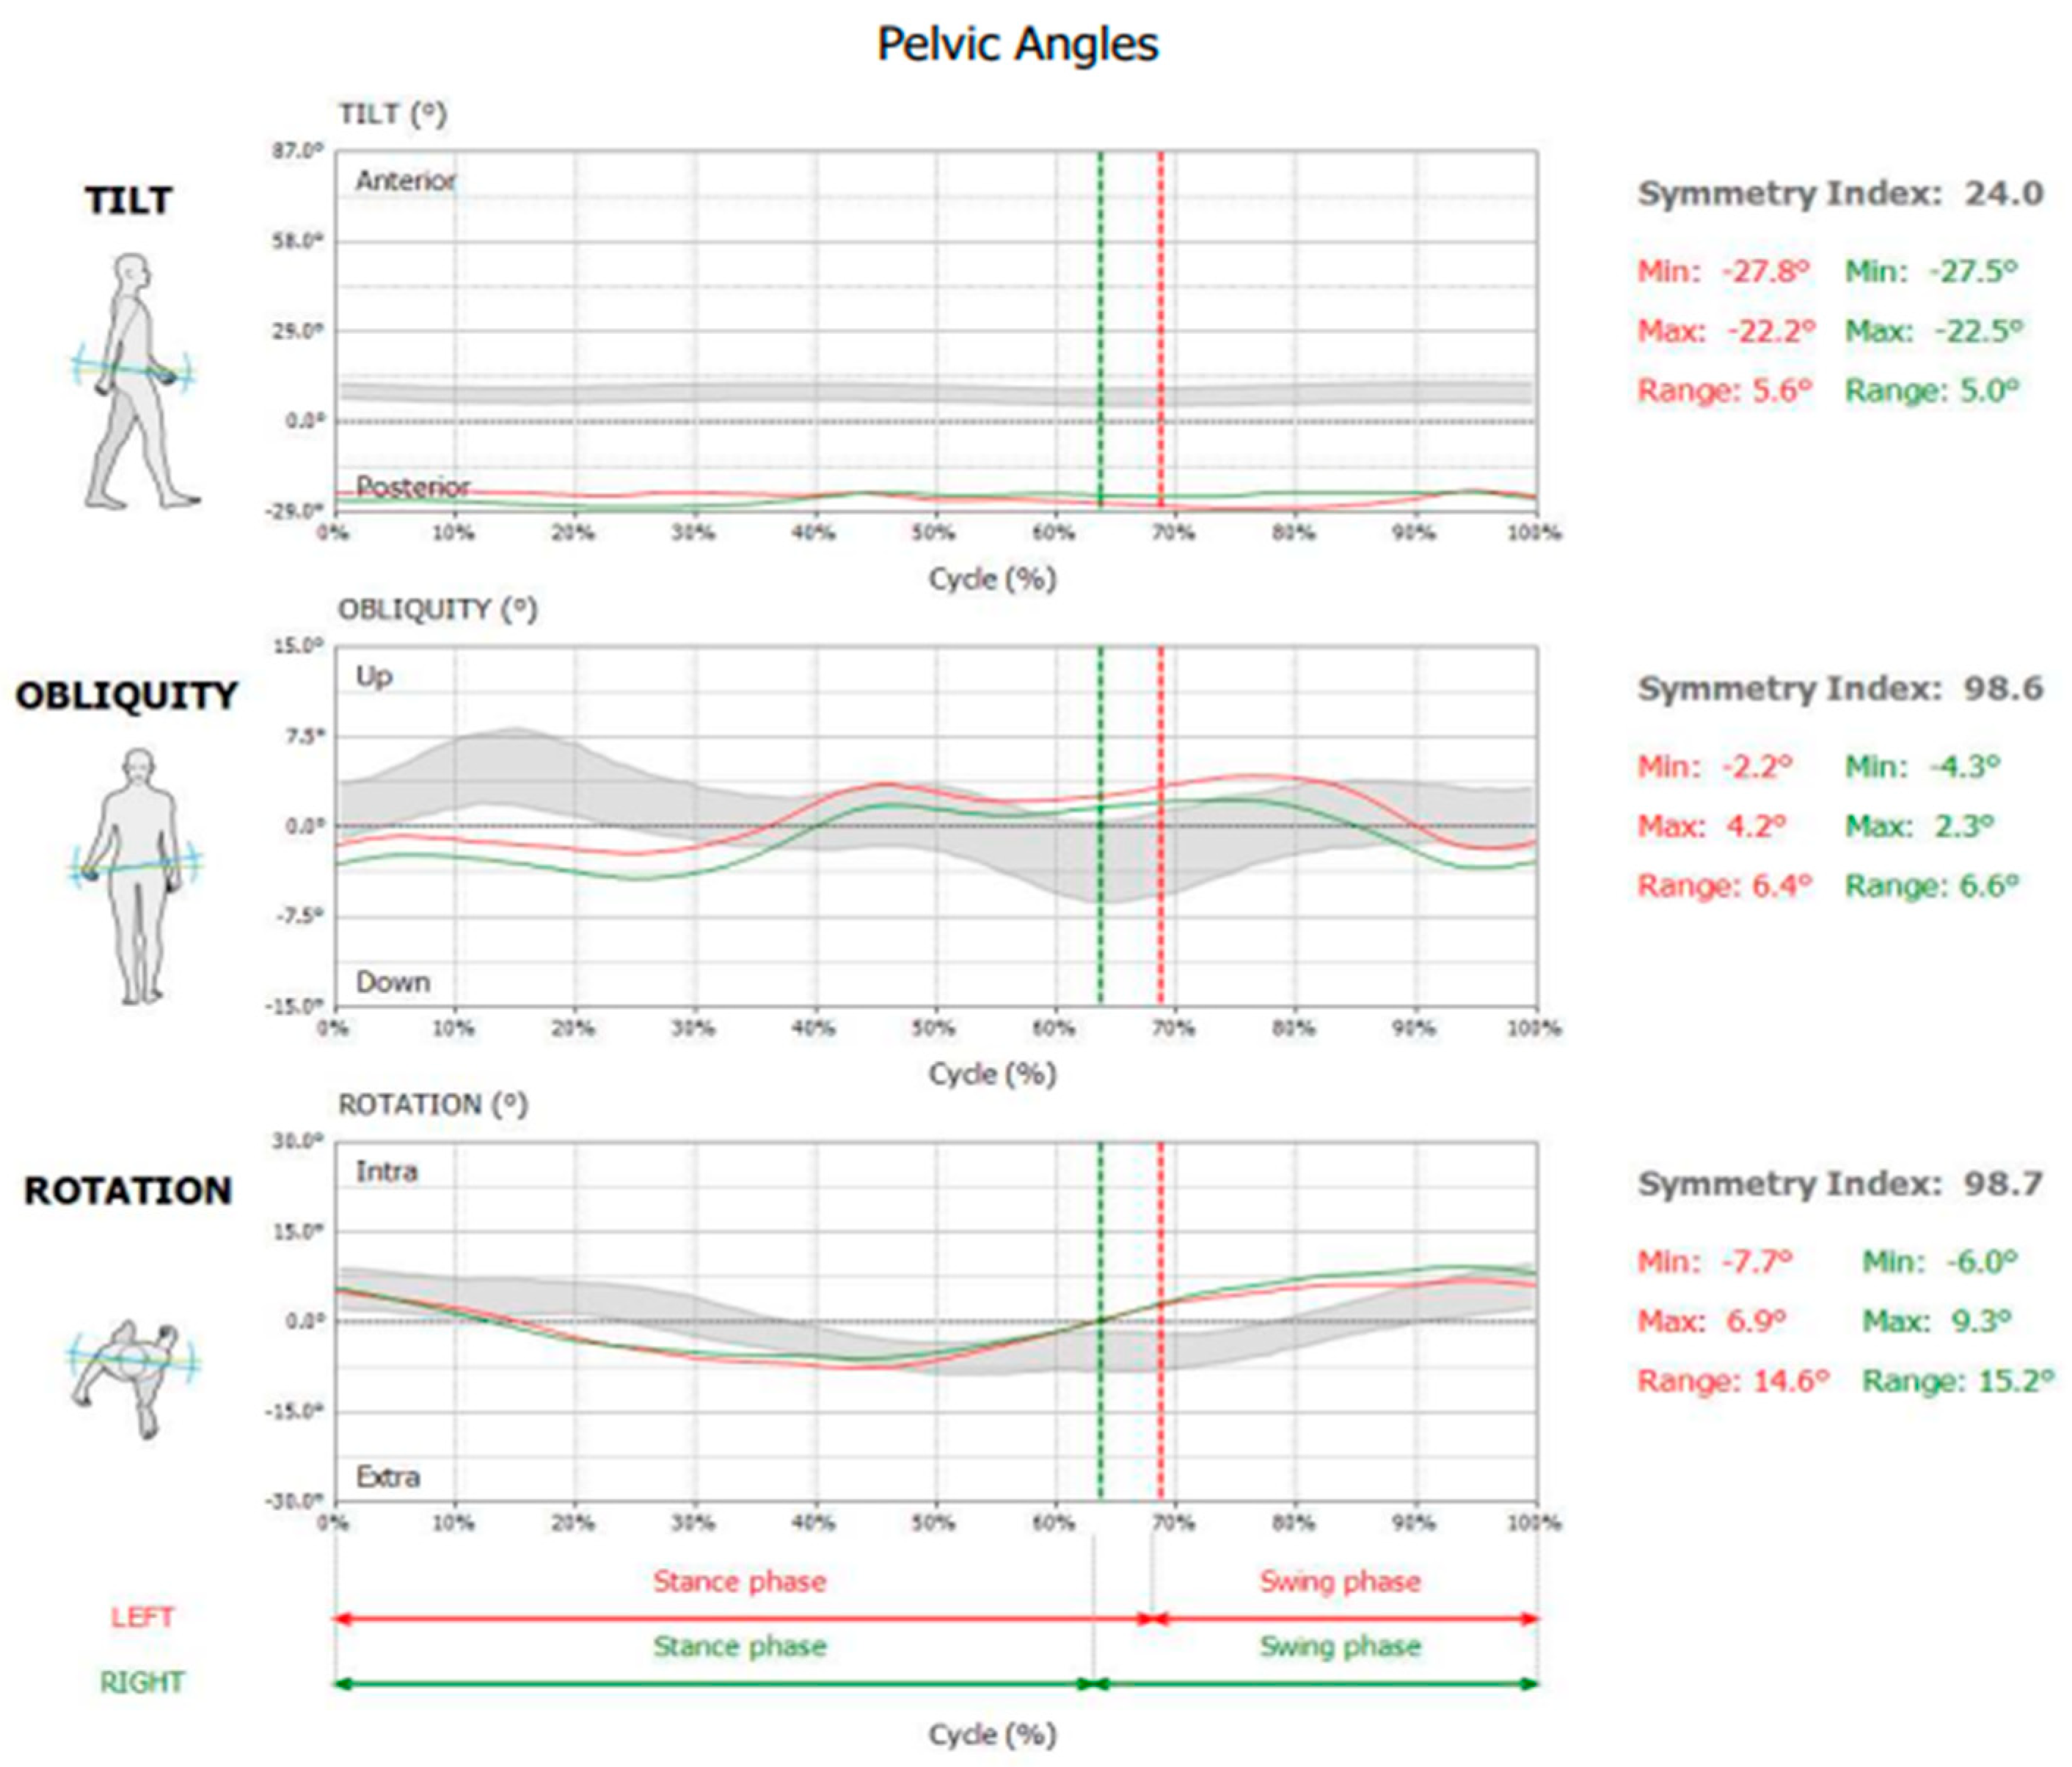
Figure 4. Pelvis Tilt, Obliquity and Rotation measurements as shown in the generated report. Gray band indicates normative ranges for this subject based on their demographic data.
Preprints 79011 g004
  • B-Jumping
The sensor is placed on L5-S1 vertebrae, and the upcoming jump was explained in detail to each participant prior to acquisition.
The jumping protocol covers 6 kinds of jumps, the following two were selected for this study:
1-
Counter Movement Jump (CMJ)
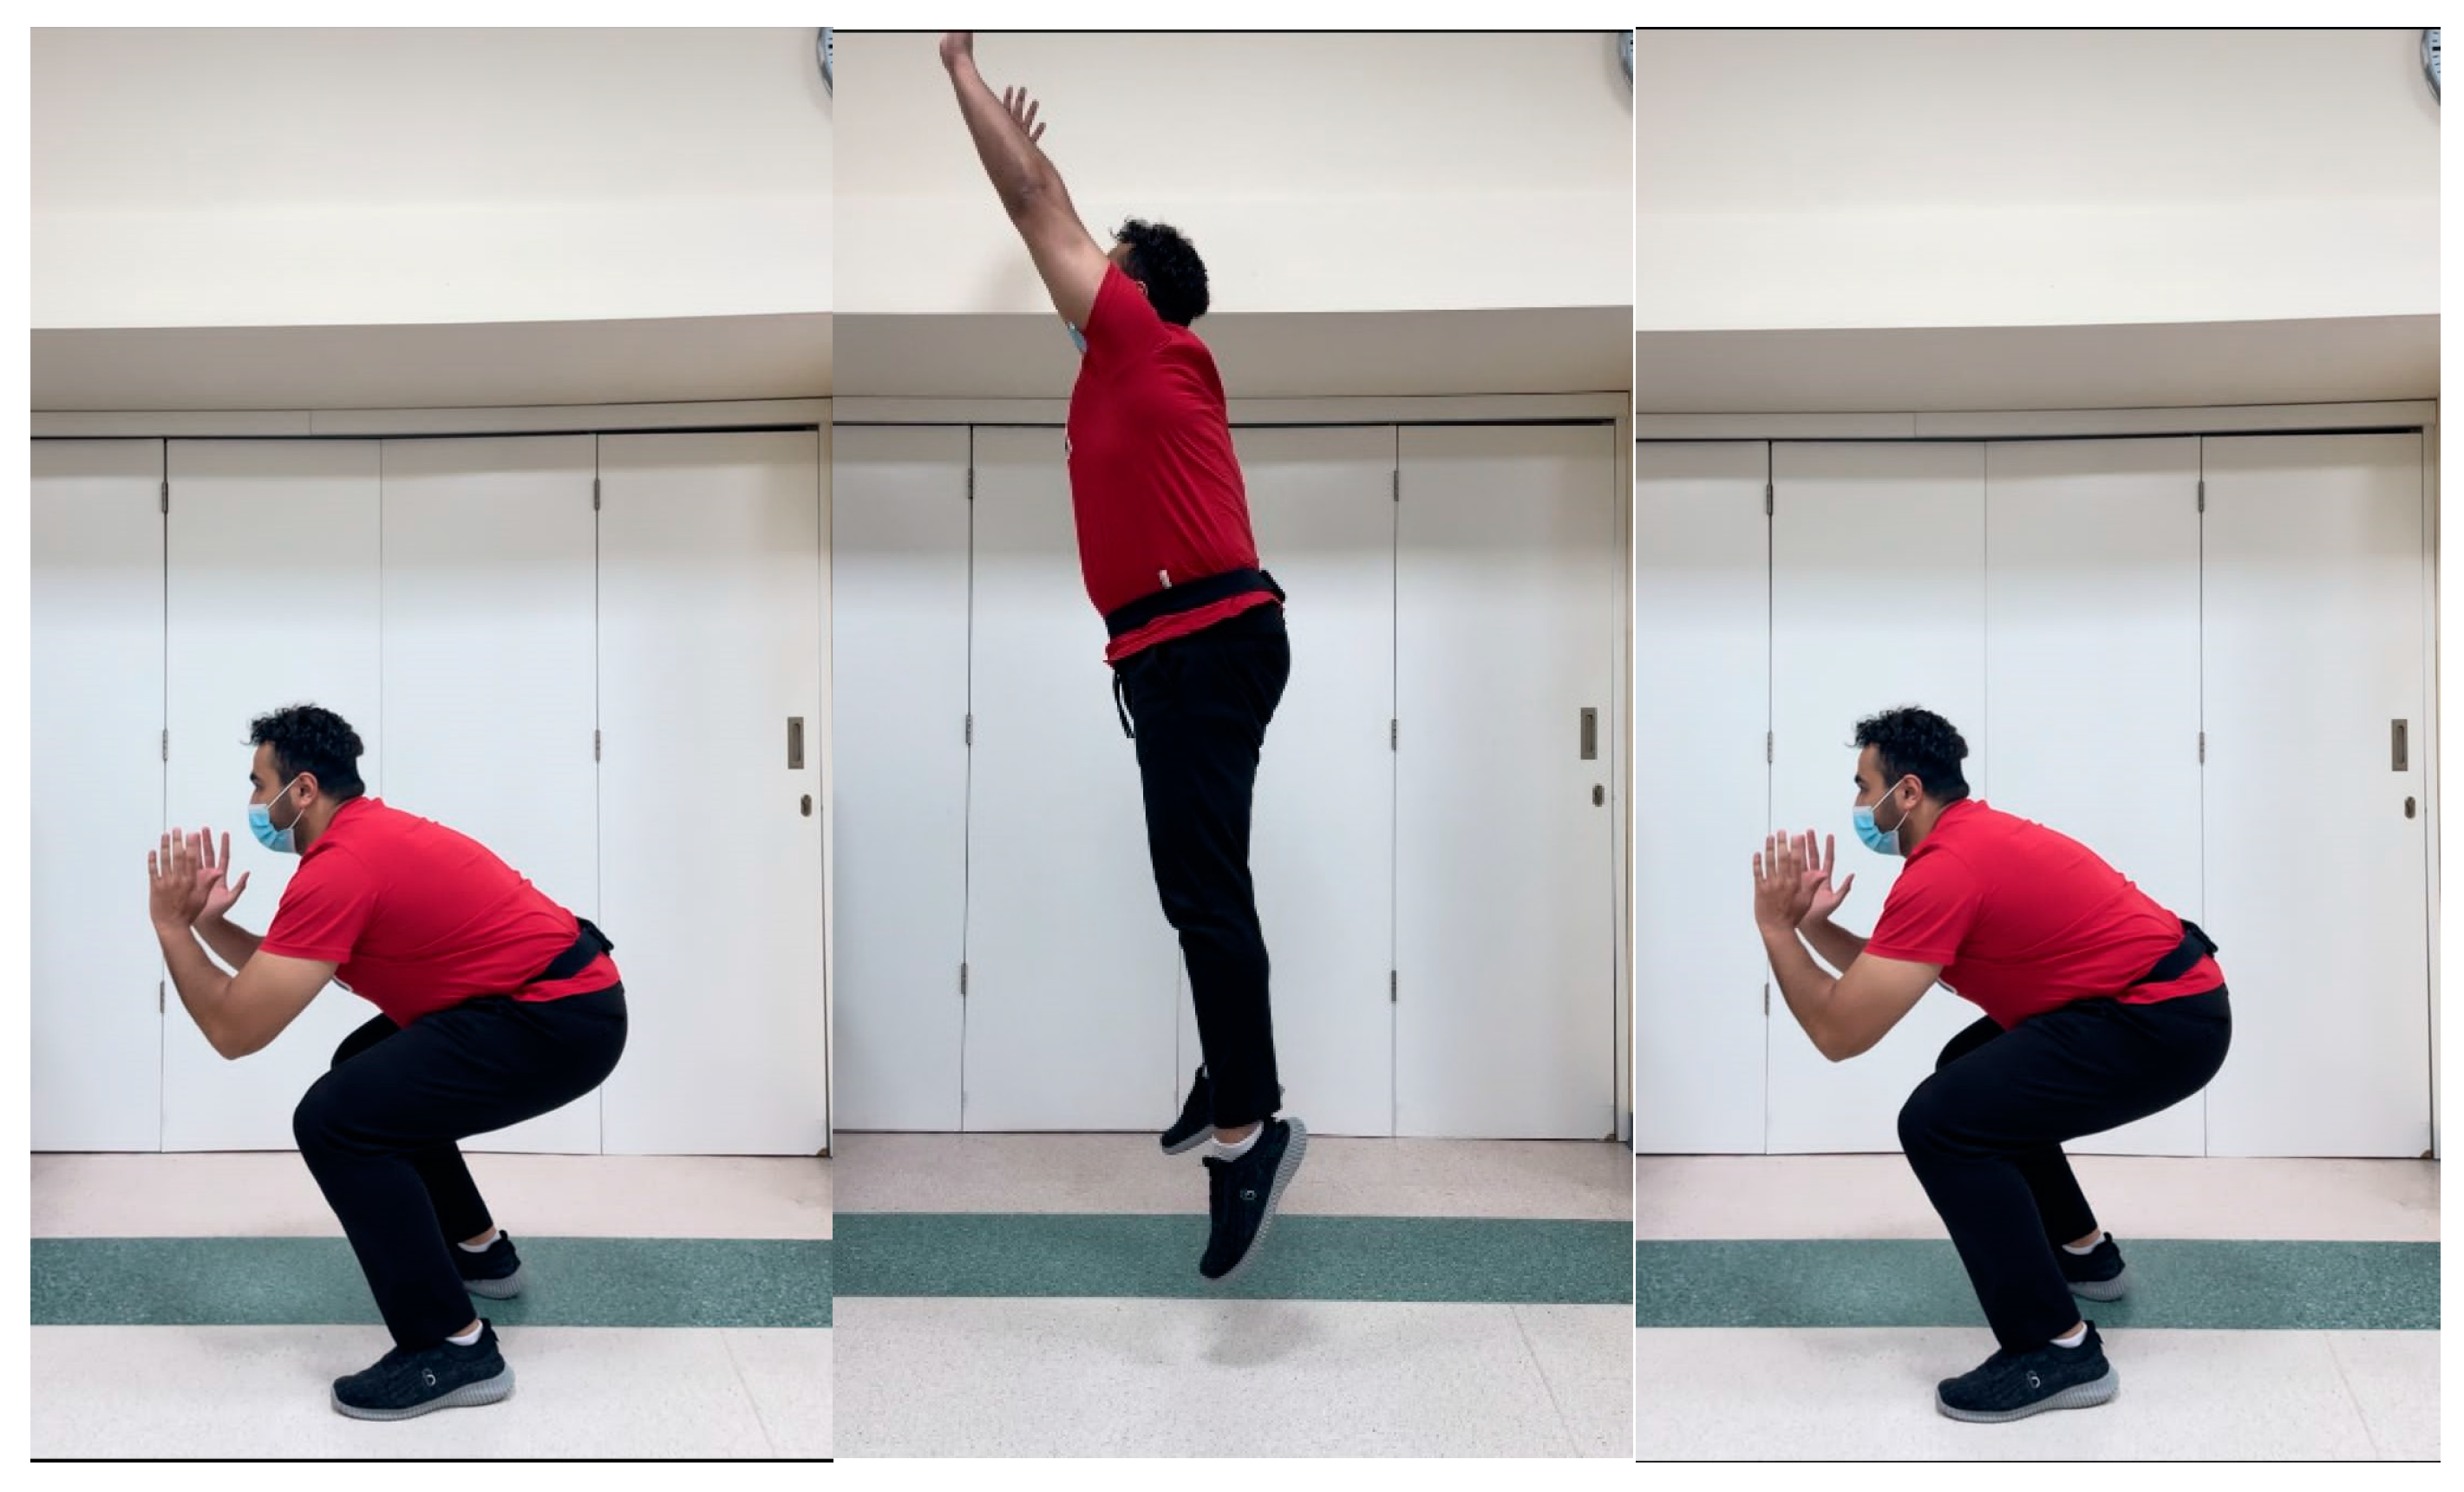
  • The participant begins the test in upright position with their hands on the hips and their feet placed in line with the shoulders. They are then instructed to jump by performing a countermovement towards the downward direction and bending their knees by 90°. During the entire course of the test, the trunk should remain upright with hands near the hips (Figure 5).
2-
CMJ with Arms Thrust (CMJAT)
  • The participant begins the test in upright position with their hands on the sides and their feet placed in line with the shoulders. They are then instructed to jump by performing a countermovement towards the downward direction and bending their knees by 90°, with the help of using their arms as they extended them upwards. During the entire course of the test, the trunk should remain upright with arms and hands extending upwards in a thrust maneuver (Figure 6).
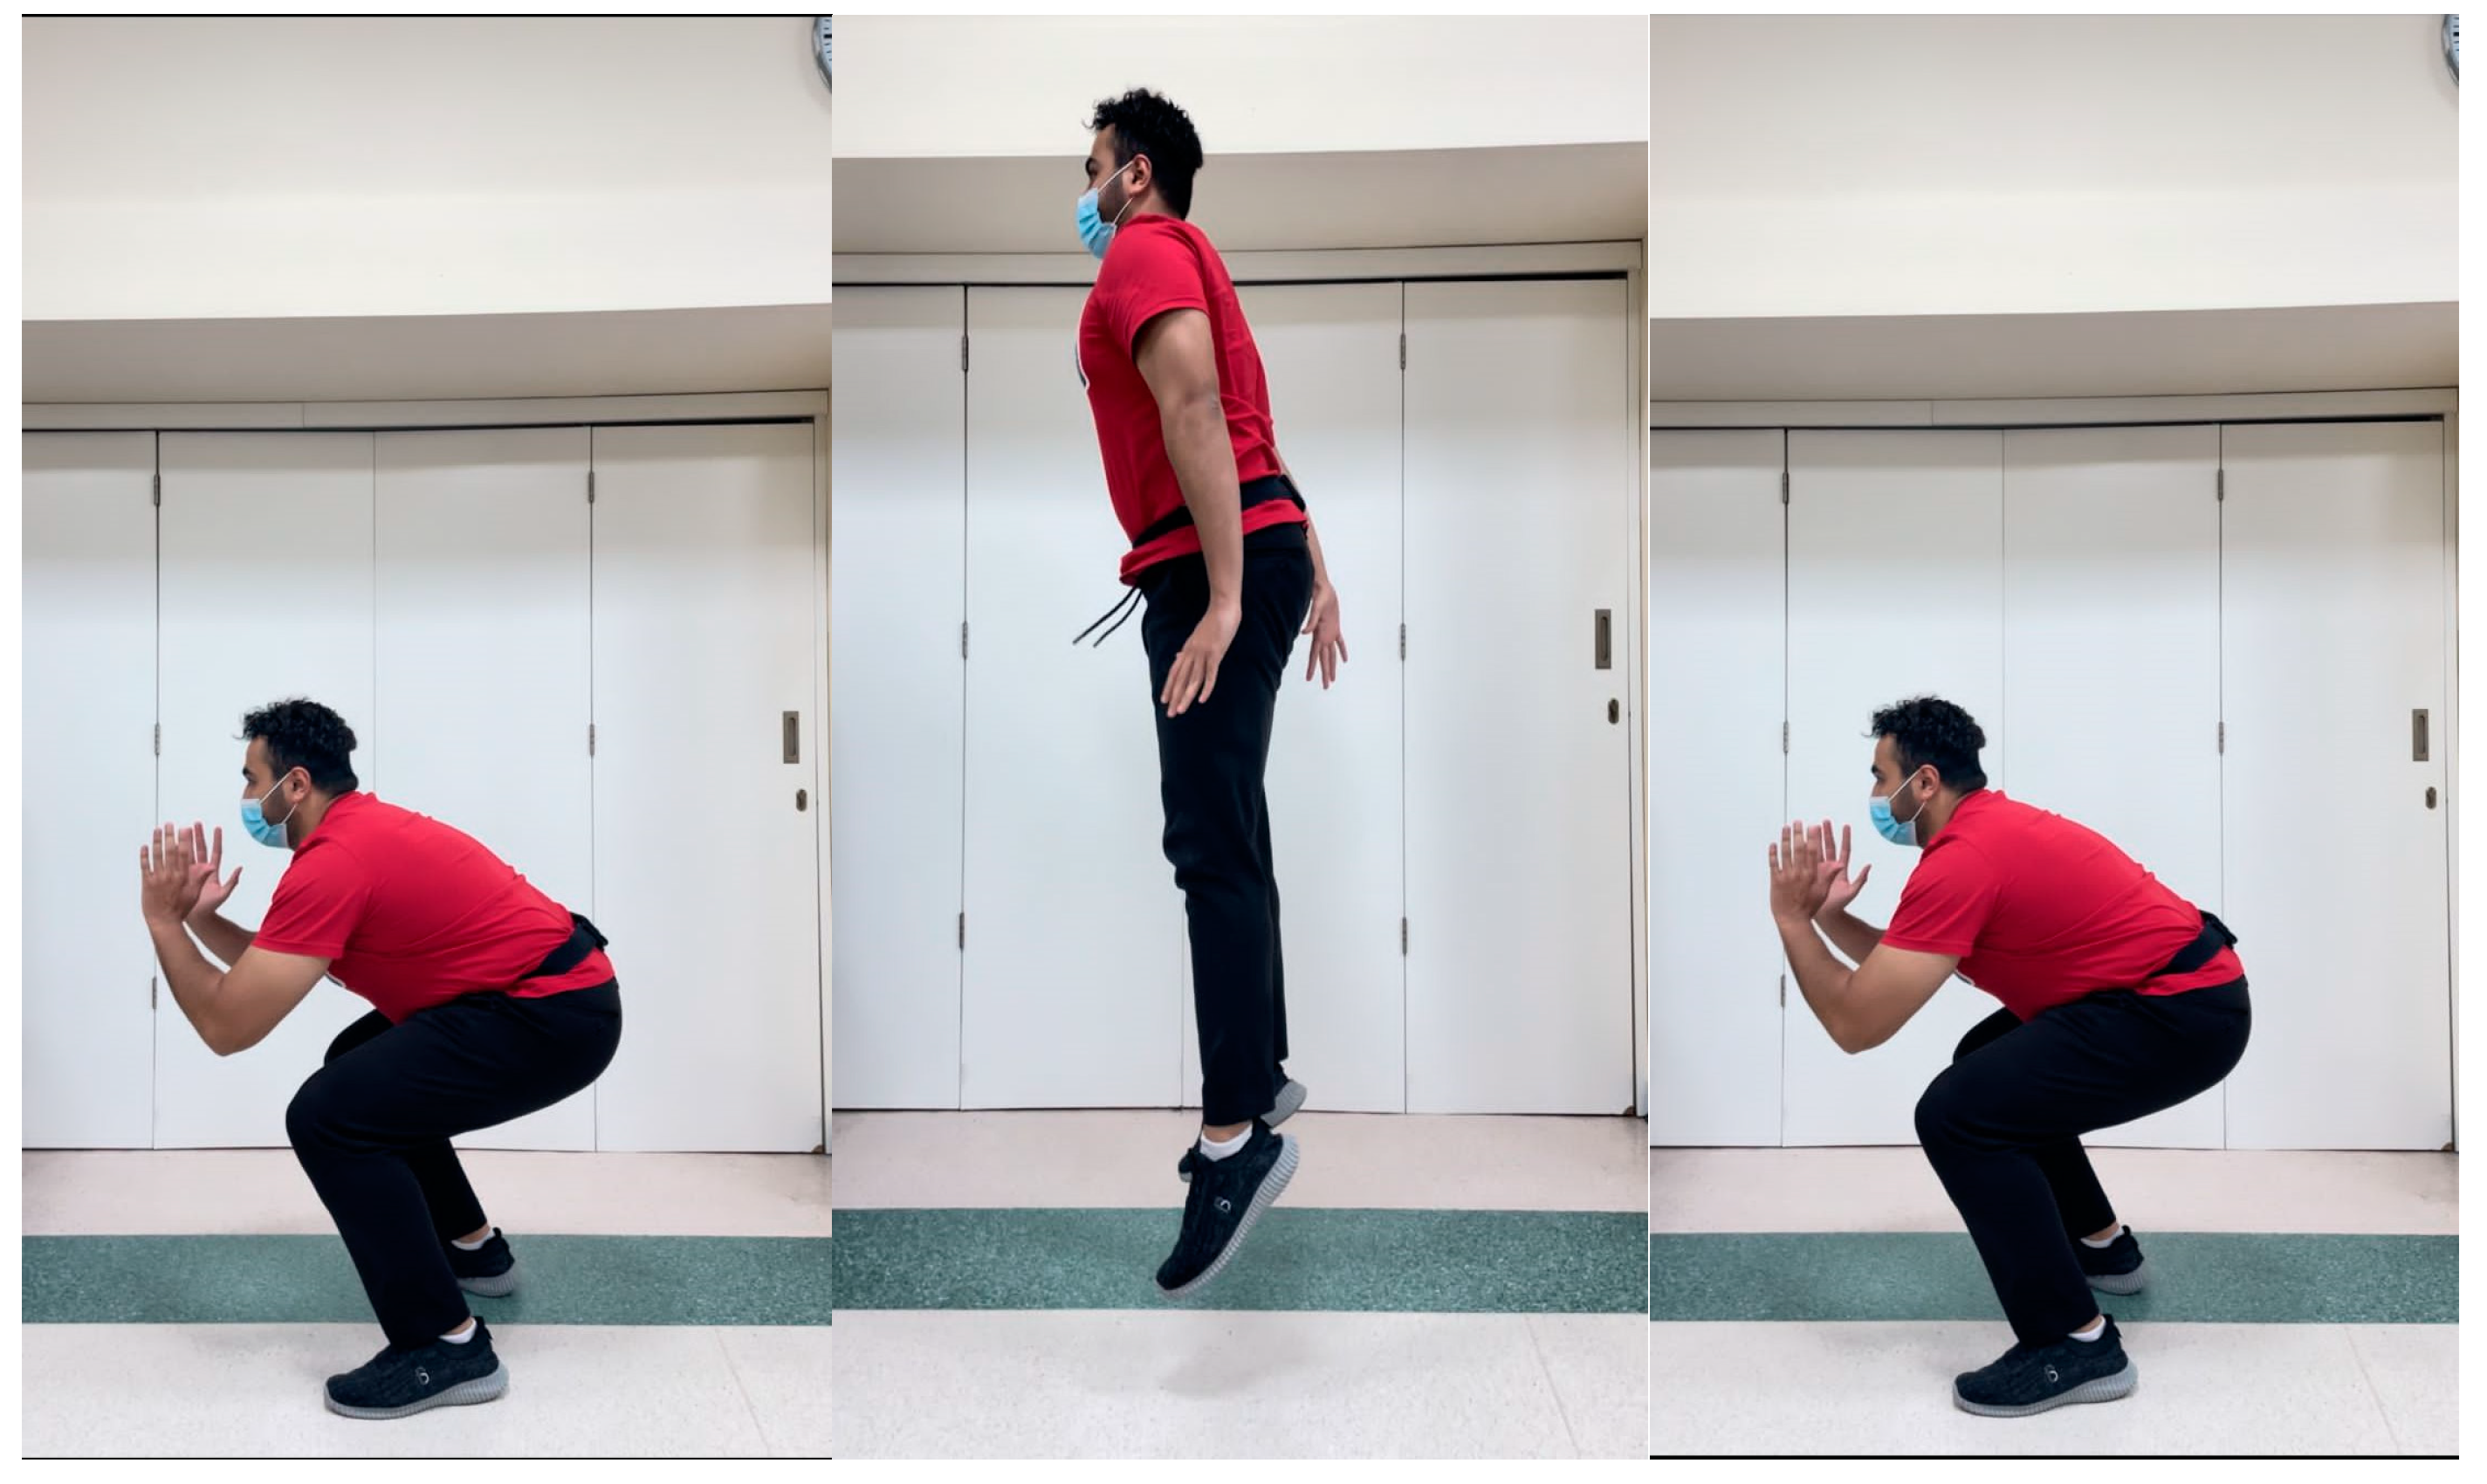
Figure 5. Performance of the counter movement jump (CMJ).
Preprints 79011 g005
Figure 6. Performance of the counter-movement jump with arms thrust (CMJAT).
Preprints 79011 g006
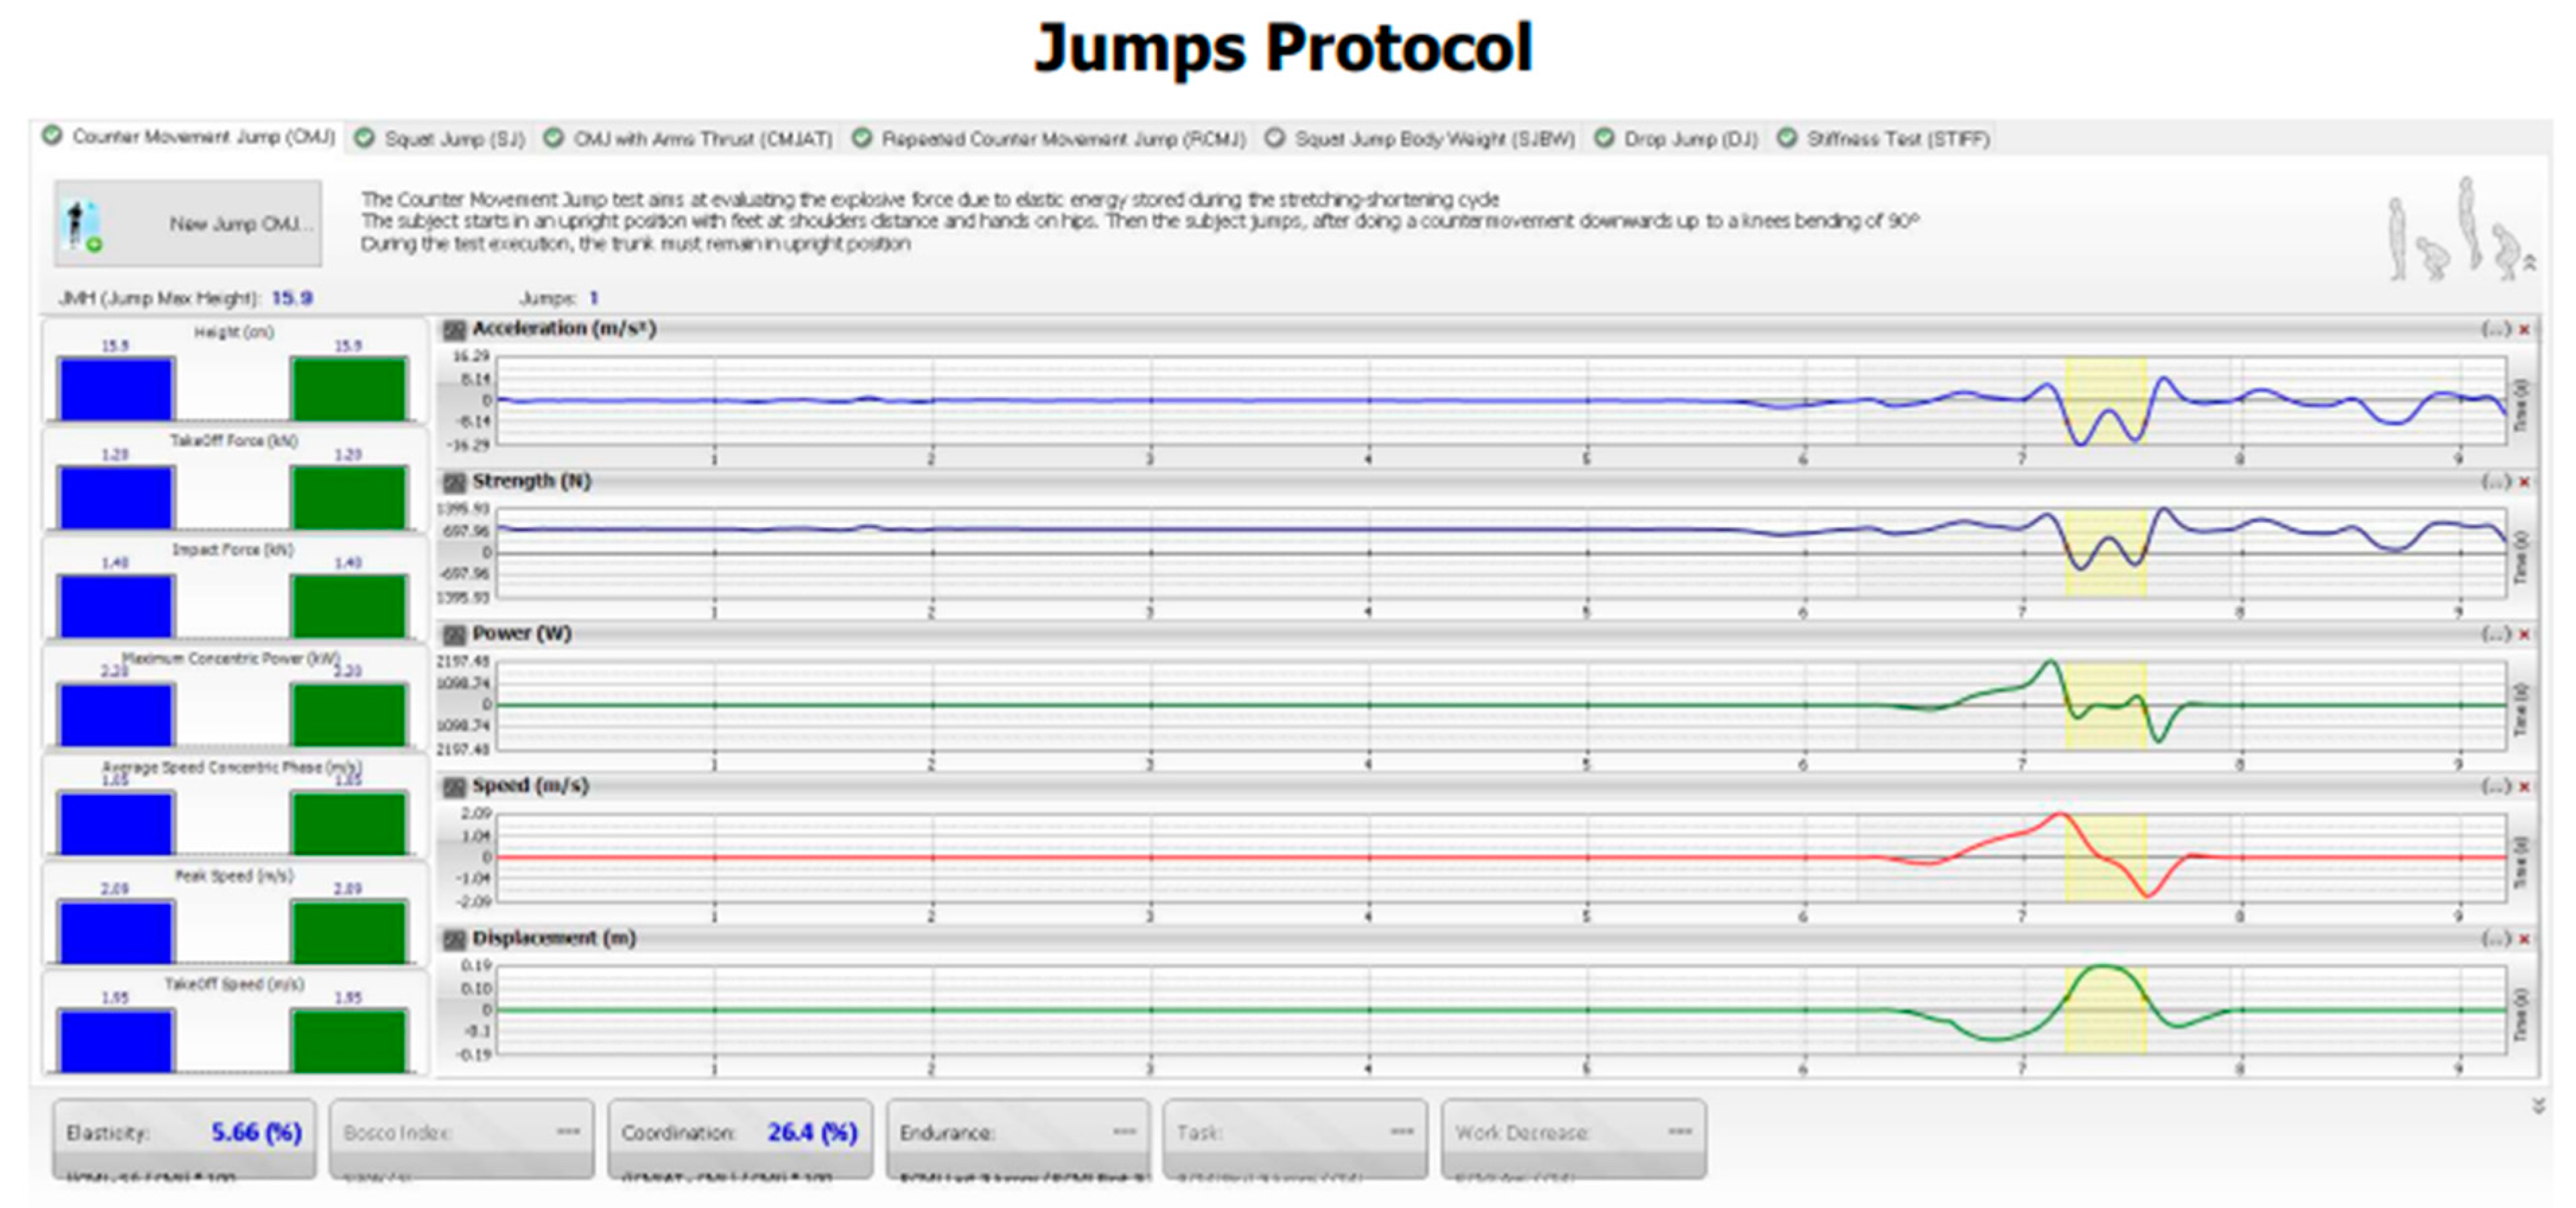
The following information was computed for each jump:
  • Flight Height (cm)
  • Take-Off Force (kN)
  • Impact Force (kN)
  • Take-Off Speed (m/s)
  • Peak Speed (m/s)
  • Average Speed Concentric Phase (m/s)
  • Maximum Concentric Power (kW)
  • Average Concentric Power (kW)
Figure 7. Jump parameters as shown in the G-Walk software.
Preprints 79011 g007
Each Participant had 1 practice trial prior to data acquisition. Additionally, each trial was verbally explained and visually demonstrated by the data collector prior to data collection of said trial. Collection of all data occurred in one session with two-minute breaks given after each activity. Incorrect performance was pointed out and the trial was repeated to obtain accurate data based on the pre-set protocols.

2.2. Data analysis

2.2.1. Sample size determination

A Fisher Z transformation was used to estimate the sample size with the power level set at .80, the beta set at .20 and the alpha set at .05. The estimated sample size required for correlation was 74; therefore, we enrolled a larger sample size of 100 to ensure external validity and to also strengthen the study.

2.2.2. Statistical analysis

Descriptive data are presented as the mean ± standard deviation. The Shapiro-Wilk test was used to determine the normality of the collected numerical variables. None of the numerical variables, however, satisfied the parametric assumptions, therefore, they are presented as the median and interquartile range (IQR). Spearman's rank correlation coefficient was then performed, and the correlation coefficient (r) and p-values are reported to demonstrate the relationship between the head posture parameters and both the gait parameters and the jump parameters. The correlation coefficient ranges between -1 and 1, where a positive or negative sign indicates that the correlation between said variables have positive or negative relationships, respectively. The level of significance was set at 0.05.

3. Results

3.1. Participant demographics and characteristics

Participant characteristics are shown in Table 1. The Shapiro-Wilk test was used to test for the normality of the numerical variables reported, however, all the numerical variables did not follow the parametric assumptions, thus, they were described by the median and interquartile range (Table 2, Table 3, Table 4 and Table 5).

3.2. Correlations between variables

Several correlations were found between head posture parameters in terms of rotations and translations displacements and gait parameters (Table 6). Firstly, moderate positive correlations were found between CVA and all gait parameters included with a p < 0.001 and r values that fall between 0.43 to 0.58 for cadence, speed, symmetry index, %left stride length (% height), %right stride length (%height), left propulsion index, right propulsion index, tilt symmetry index, tilt range left, tilt range right, obliquity symmetry index, obliquity range left, obliquity range right, rotation symmetry index, rotation range left, and rotation range right.
Moderate negative correlations were found between lateral translation of the head and speed (r=-0.46 p < 0.001), %left stride length (%height) (r = -0.42, p < 0.001), %right stride length (%height) (r = -0.51, p < 0.001) and tilt symmetry index (r=-0.51, p < 0.001). In addition, strong negative correlations were found between lateral translation of the head and cadence (r = -0.74, p < 0.001), symmetry index (r = -0.7, p < 0.001) and rotation symmetry index (r = -0.69, p < 0.001). The remaining variables showed weak negative correlations ranging between -0.06 to -0.36 (p-values ranging from 0.001 to 0.004) for left propulsion index, right propulsion index, tilt left range, tilt right range, obliquity symmetry index, obliquity right range, rotation left range, and rotation right range.
Various moderate negative correlations were found between AHT and cadence (r = -0.51, p < 0.001), speed (r = -0.44, p < 0.001), %left stride length (%height) (r = -0.48, p < 0.001), %right stride length (%height) (r = -0.46, p < 0.001), left propulsion index (r = -0.47, p < 0.001), tilt right range (r = -0.47, p < 0.001), rotation left range (r = -0.42, p < 0.001), and rotation right range (r = -0.41, p <0.001). In addition, strong negative correlations were found between AHT and tilt symmetry index (r = -0.62, p < 0.001), tilt left range (r = -0.81, p < 0.001), obliquity symmetry index (r = -0.75, p < 0.001), obliquity left range (r = -0.65, p < 0.001), and obliquity right range (r = -0.64, p < 0.001). Moreover, a weak negative correlation was found between AHT and right propulsion index (r = -0.39, p = 0.001) and rotation symmetry index (r = -0.27, p = 0.01)
Several moderate negative correlations were found between lateral angulation of the head and tilt symmetry index (r = -0.45, p < 0.001), obliquity symmetry index (r = -0.4, p < 0.001), and rotation symmetry index ( r= -0.43, p < 0.001). In addition, weak negative correlations were found between lateral angulation and various other variables including cadence, speed, symmetry index, %left stride length (%height), %right stride length (%height), left propulsion index, right propulsion index, tilt left range, tilt right range, obliquity left range, obliquity right range, and rotation right range with r values ranging between -0.1 to -0.39 and p-values ranging from < 0.001 to 0.011.
Multiple Correlations were found between head posture parameters in terms of rotations and translations displacements and jump parameters. Starting with CMJ, moderate positive correlations were found between CVA and flight height (r = 0.41, p < 0.001), average concentric speed phase (r = 0.41, p < 0.001), and average concentric power (r = 0.52, p < 0.001). In addition, multiple weak correlations were found between CVA and take-off force (r = 0.39, p < 0.001), take-off speed (r = 0.39, p < 0.001), peak speed (r = 0.38, p < 0.001), and maximum concentric power (r = 0.27, p = 0.03). As for lateral translation of the head, multiple negative correlations were found between it and flight height (r = -0.39, p < 0.001), take-off force (r = -0.4, p < 0.001), impact force (r = -0.48, p < 0.001), take-off speed (r = -0.43, p < 0.001), peak speed (r = -0.42, p < 0.001), average speed concentric phase (r = -0.42, p < 0.001), and average concentric power (r = -0.54, p < 0.001). Moreover, a weak negative correlation was found with maximum concentric power (r = -0.31, p < 0.003).
As for AHT coronal, moderate negative correlations were found with flight height (r = -0.44, p < 0.001), impact force (r = -0.55, p < 0.001), take-off speed (r = -0.49, p < 0.001), peak speed (r = -0.49, p < 0.001), average speed concentric phase (r = -0.57, p < 0.001), maximum concentric power (r = -0.41, p<0.001) and average concentric power (r = -0.48, p < 0.001). In addition, a strong negative correlation was found with take-off force (r = -0.65, p < 0.001). As for lateral angulation, moderate negative correlations were found with peak speed, average speed concentric phase and maximum concentric power (r = -0.4, p < 0.001) for all 3 variables. Moreover, weak negative correlations were found with the remaining variables with r values ranging from -0.37 to -0.39 (p-value of < 0.001).
As for CMJAT variables, weak positive correlations were found between CVA and impact force (r = 0.39, p < 0.001), average speed concentric phase (r = 0.39, p < 0.001), and maximum concentric power (r = 0.27, p < 0.001). On the other hand, moderate positive correlations were found with all the remaining variables with a p-value of < 0.001 and an r value ranging from 0.43 to 0.55. When it comes to lateral translation of the head (sagittal), weak negative correlations were found with flight height (r = -0.39, p < 0.001) and maximum concentric power (r= -0.31, p = 0.003). Moreover, moderate negative correlations were found with all the remaining CMJAT variables with a p-value of 0.001 and an r value ranging from -0.4 to -0.54. As for AHT, strong negative correlations were found with flight height (r = -0.7, p < 0.001) and take-off force (r = -0.65, p < 0.001). In addition, moderate negative correlations were found with all remaining CMJAT variables with a p-value of < 0.001 and an r value ranging from -0.48 to -0.6. Finally, for lateral angulation of the head, moderate negative correlations were found with impact force, take-off speed, and average speed concentric phase (r = 0.4, p < 0.001). In addition, weak negative correlations were found with the remaining CMJAT variables with a p-value of < 0.001 and an r value ranging from -0.31 to -0.39.
Table 8. Spearman correlation coefficient (r) and p-values (p) between CVA, lateral translation head sagittal, AHT coronal, and lateral angulation head (first row), and each of the CMJAT parameters (first column).
CMJAT CVA Lateral translationhead AHT Lateral angulation head
r p r p r p r p
CMJAT - flight height (cm) 0.55* < 0.001 -0.39* < 0.001 -0.70* < 0.001 -0.39* < 0.001
CMJAT – take-off force (kN) 0.43* < 0.001 -0.40* < 0.001 -0.65* < 0.001 -0.38* < 0.001
CMJAT - impact force (kN) 0.39* < 0.001 -0.48* < 0.001 -0.55* < 0.001 -0.40* < 0.001
CMJAT – take-off Speed (m/s) 0.44* < 0.001 -0.43* < 0.001 -0.50* < 0.001 -0.40* < 0.001
CMJAT - peak speed (m/s) 0.48* < 0.001 -0.42* < 0.001 -0.55* < 0.001 -0.39* < 0.001
CMJAT - average Speed concentric phase (m/s) 0.39* < 0.001 -0.42* < 0.001 -0.60* < 0.001 -0.40* < 0.001
CMJAT - maximum concentric power (kW) 0.27* 0.03 -0.31* 0.003 -0.48* < 0.001 -0.31* 0.003
CMJAT - average concentric power (kW) 0.52* < 0.001 -0.54* < 0.001 -0.60* < 0.001 -0.31* 0.003
*Indicates a statistically significant correlation (p < 0.05).

4. Discussion

In this investigation, we examined the relationship between head postural displacements, specifically translations and rotations of the head, and gait and jump performance parameters. Our study’s primary hypothesis is supported by our findings in as much as we identified numerous statistically significant correlations between head posture displacements and many parameters related to gait and jump. Notably, we observed moderate to high correlations between CVA, lateral translation of the head, and AHT with all gait and jump parameters. Conversely, weak correlations were found between lateral angulation of the head and the gait and jump parameters, except for gait and pelvic symmetry index, where a moderate correlation was identified. These significant correlations emphasize the growing body of evidence demonstrating the significance of head posture related to functional performance measures.
It is noted that most studies assessing relationships between head posture and functional performance measures have exclusively assessed sagittal plane alignment only (e.g. AHT or the CVA) [12,43,44,45,46,47]. However, a unique contribution to the literature as determined in the present study was the statistically significant relationships between various gait and jump parameters to coronal head postures including lateral head tilt and lateral head translation. It is also important to mention these results are limited to young, healthy university students, that are known to have forward head posture [48,49], however, our results indicate that coronal plane deviations of the head are likely also common and need to be evaluated.

4.1. Posture and Athletic Skills

We assessed two types of athletic skill activities: 1) jumping, which is correlated with athletic-based activities, and 2) gait, which is an integral part of daily ambulation. The observed associations can be attributed to the significant impact of head posture on sensorimotor integration, which has been proven to influence the performance of specific tasks like walking and jumping [50]. Several studies have identified the adverse effects of head postural displacements on sensorimotor processing and integration [9,51,52,53]. Moustafa et al., for example, found college athletes having forward head posture demonstrated both less efficient physical fitness performance as well as altered sensorimotor processing and integration as compared to athletes without having a forward head position [54]. Thus, suboptimal performance of said tasks in individuals with abnormal head posture could be attributed to the fact that spinal dysfunction of any kind can negatively influence processing in the central nervous system because spinal dysfunction can lead to maladaptive central plastic changes, which in turn, likely results in abnormal responses subsequent to the altered input to the central nervous system [55,56,57,58,59]. This assumption has been supported by strong associations between parameters of sensorimotor integration and head posture.
Proper performance of a voluntary motor activity heavily relies on peripheral sensory input, wherein peripheral pathways transmit sensory data to the central motor cortex (M1). The posterior cingulate cortex and other regions of the parietal cortex, the supplementary motor area, the dorsal premotor cortex, the ventral premotor cortex, the basal ganglia, the cerebellum, the thalamus, the brainstem, and even the spinal cord itself are among the other regions where sensorimotor integration takes place, is influenced by it, and can ultimately change the motor output in M1. Therefore, abnormalities in normal afferent input processing can disrupt processing of neural networks that are present in the cortical motor areas, thus, leading to negatively impacted motor control [60,61,62,63]. This is supported by previous evidence which demonstrated that correcting the altered sagittal cervical spine aberrant alignment through structural rehabilitation (care specifically dedicated to improvement in alignment) led to more effective responses in several sensorimotor outcome metrics (balance, oculomotor control, head repositioning error) [64,65,66,67].
However, to the best of our knowledge, when it comes to jumping, no evidence currently investigates the relationship between coronal plane alignment and jump parameters, which makes it a gap in the current evidence available. Therefore, investigating the effects of head postural parameters in terms of rotations and translations measurements on biomechanical parameters related to various types of activities would seem essential, to determine if the extent of said parameters affects different activity types differently, and to determine the degree of influence that head posture measurement differences has on a variety of athletic skills including the jump variables measured herein.

4.2. Posture and Gait Asymmetries

In the recent literature, adulty spine deformity (ASD) categories have been investigated for their influence on and correlation to gait abnormalities; where ASD categories include: thoracic hyperkyphosis, anterior sagittal balance of C7-S1, decreased distal lumbar curve and pelvic retro-version, and coronal scoliosis > 20° [68,69,70,71,72]. The majority of investigations have identified that in adults with ASD, the spine alignment profiles in the sagittal plane have clear and significant correlations with gait endurance, gait kinematics, and gait asymmetry [68,69,70,71,72]. When it comes to coronal plane alignment, only limited evidence explores the relationship between coronal ASD (scoliosis) and gait abnormalities, indicating that adverse alignments in the coronal plane also lead to alterations in performance during walking [68,69].
Similarly, previous investigations have identified that anatomical leg length inequality (ALLI) has a direct effect on gait alterations and adopted strategies of asymmetry in both the sagittal and coronal planes [73,74,75]. In a systematic review of literature, Khamis and Carmeli identified that ALLI > 1 cm was significantly associated with altered gait and that the asymmetry increased with the magnitude of ALLI [73]. However, authors have demonstrated that mild ALLI’s (ALLI = 5mm - 1cm) also alter gait parameters [75]. Specific to the head and neck, in a recent systematic review, Lin and colleagues [12] found that the evidence to support a relationship between forward head posture and altered gait kinematics was lacking with few previous investigations available, and these studies did not address non-sagittal cervical postures. Problematically in regards to coronal plane head rotations and translations, the current authors were unable to identify relevant studies that have specifically investigated altered postures of the head and their effect on gait kinematics. Thus, our investigation and its findings appear to be unique.

4.3. Study Limitations

Several limitations can be proposed for this study, to be addressed in future works. Starting with the population of choice, which was a young, adult, overall healthy, and symptom-free population, thus, the results obtained from investigating a population with current symptoms are unknown. Secondly, because we chose a young adult, asymptomatic population to investigate, it is unknown how our study results might relate to other groups with differences in age. Third, future investigations should seek to identify if postural alterations of the thoracic cage and the pelvis have the potential to affect the variables presented herein to a greater, lesser, or equal extent as identified herein. Finally, since this is a cross-sectional investigation, it is unknown whether improvements, via interventional trials, in head posture variables are able to improve the gait and dynamic tasks reported herein.

5. Conclusions

We identified statistically significant relationships between various gait and jump functional performance measures and 3D head posture displacements. Our results indicate that studies focusing exclusively on the sagittal plane alignment is not sufficient to capture all possible correlations existing between 3D posture and performance measures; thus, it is recommended that 3D postural assessment approaches, which are now easily performed due to recent advancements in technology [35,36], are routinely used for studies evaluating relationships between static body posture and functional performance measures. Head postures as assessed as translations and rotations relative to neutral alignment, have important implications to performance parameters related to gait and jumping. Future studies are needed to further understand these relationships.

Author Contributions

N.S., I.M.M., A.A. and D.E.H. conceived the research idea and participated in its design. N.S., I.M.M., A.A., and N.S. contributed to the statistical analysis. N.S., I.M.M. A.A., and N.S. participated in data collection and study supervision. N.S., I.M.M., A.A., N.S., P.A.O., and D.E.H. contributed to the interpretation of the results and wrote the drafts. All authors have read and agreed to the submitted version of the manuscript.

Funding

CBP Nonprofit (Eagle, ID, USA) approved possible funding of this manuscript for publication fees in the JCM.

Institutional Review Board Statement

The research was conducted in accordance with the senior citizen’s services department and approved by the Research Institute of Medical & Health Sciences of the University of Sharjah (reference number: REC-21-10-25-S).

Informed Consent Statement

All participant’s pictures in the study were included after written informed consent was signed and obtained.

Data Availability Statement

The datasets analyzed in the current study are available from the corresponding author upon reasonable request.

Conflicts of Interest

PAO is a paid consultant for CBP NonProfit, Inc. DEH teaches rehabilitation methods and is the CEO of a company that distributes products to physicians in the U.S.A. used for the rehabilitation of postural abnormalities. All the other authors declare that they have no competing interests.

References

  1. Menz, H.B.; Lord, S.R.; Fitzpatrick, R.C. Age-related differences in walking stability. Age Ageing 2003, 32, 137–142. [Google Scholar] [CrossRef]
  2. Promsri, A.; Cholamjiak, P.; Federolf, P. Walking Stability and Risk of Falls. Bioengineering 2023, 10, 471. [Google Scholar] [CrossRef]
  3. Biewener, A.A.; Farley, C.T.; Roberts, T.J.; Temaner, M.; Ludlow, L.W.; Weyand, P.G.; Beck, O.N.; Taboga, P.; Grabowski, A.M.; Giovanelli, N.; et al. Muscle mechanical advantage of human walking and running: implications for energy cost. J. Appl. Physiol. 2004, 97, 2266–2274. [Google Scholar] [CrossRef]
  4. Kwak, S.T.; Chang, Y.-H. Fascicle dynamics of the tibialis anterior muscle reflect whole-body walking economy. Sci. Rep. 2023, 13, 4660. [Google Scholar] [CrossRef] [PubMed]
  5. Graci, V.; Salsich, G.B. Trunk and lower extremity segment kinematics and their relationship to pain following movement instruction during a single-leg squat in females with dynamic knee valgus and patellofemoral pain. J. Sci. Med. Sport 2014, 18, 343–347. [Google Scholar] [CrossRef]
  6. Nunes, G.S.; de Moraes, W.S.L.A.; Sampaio, V.d.S.; Seda, N.R.; Mouta, G.d.S.; Dangui, A.J.M.; Petersen, R.d.S.; Nakagawa, T.H. Are Changes in Dynamic Knee Movement Control Related to Changes in Pain or Function in People With Knee Disorders? A Systematic Review and Meta-analysis. J. Orthop. Sports Phys. Ther. 2023, 53, 388–401. [Google Scholar] [CrossRef] [PubMed]
  7. Myer, G.D.; Ford, K.R.; Hewett, T.E. Tuck Jump Assessment for Reducing Anterior Cruciate Ligament Injury Risk. Athl. Ther. Today 2008, 13, 39–44. [Google Scholar] [CrossRef] [PubMed]
  8. Kang, J.-H.; Park, R.-Y.; Lee, S.-J.; Kim, J.-Y.; Yoon, S.-R.; Jung, K.-I. The Effect of The Forward Head Posture on Postural Balance in Long Time Computer Based Worker. Ann. Rehabilitation Med. 2012, 36, 98–104. [Google Scholar] [CrossRef] [PubMed]
  9. Lee, J.-H. Effects of forward head posture on static and dynamic balance control. J. Phys. Ther. Sci. 2016, 28, 274–277. [Google Scholar] [CrossRef] [PubMed]
  10. Ruivo, R.M.; Pezarat-Correia, P.; Carita, A.I. Effects of a Resistance and Stretching Training Program on Forward Head and Protracted Shoulder Posture in Adolescents. J. Manip. Physiol. Ther. 2016, 40, 1–10. [Google Scholar] [CrossRef] [PubMed]
  11. Muyor, J.M.; López-Miñarro, P.A.; Casimiro, A.J. Effect of stretching program in an industrial workplace on hamstring flexibility and sagittal spinal posture of adult women workers: A randomized controlled trial. J. Back Musculoskelet. Rehabilitation 2012, 25, 161–169. [Google Scholar] [CrossRef]
  12. Lin, G.; Zhao, X.; Wang, W.; Wilkinson, T. The relationship between forward head posture, postural control and gait: A systematic review. Gait Posture 2022, 98, 316–329. [Google Scholar] [CrossRef]
  13. Ahmadipoor, A.; Khademi-Kalantari, K.; Rezasoltani, A.; Naimi, S.-S.; Akbarzadeh-Baghban, A. Effect of Forward Head Posture on Dynamic Balance Based on the Biodex Balance System. J. Biomed. Phys. Eng. 2022, 12, 543–548. [Google Scholar] [CrossRef] [PubMed]
  14. Caneiro, J.P.; O’Sullivan, P.; Burnett, A.; Barach, A.; O’Neil, D.; Tveit, O.; Olafsdottir, K. The influence of different sitting postures on head / neck posture and muscle activity. Man Ther 2010, 15, 54–60. [Google Scholar] [CrossRef]
  15. Shaghayegh fard, B.; Ahmadi, A.; Maroufi, N.; Sarrafzadeh, J. Evaluation of forward head posture in sitting and standing positions. Eur Spine J 2016, 25, 3577–3582. [Google Scholar] [CrossRef]
  16. Ruivo, R.M.; Pezarat-Correia, P.; Carita, A.I. Effects of a Resistance and Stretching Training Program on Forward Head and Protracted Shoulder Posture in Adolescents. J. Manip. Physiol. Ther. 2016, 40, 1–10. [Google Scholar] [CrossRef] [PubMed]
  17. Jain, D. EFFECTS OF FORWARD HEAD POSTURE ON POSTURAL BALANCE IN YOUNG ADULTS. Int. J. Adv. Res. 2019, 7, 136–146. [Google Scholar] [CrossRef] [PubMed]
  18. Kang, J.-H.; Park, R.-Y.; Lee, S.-J.; Kim, J.-Y.; Yoon, S.-R.; Jung, K.-I. The Effect of The Forward Head Posture on Postural Balance in Long Time Computer Based Worker. Ann. Rehabilitation Med. 2012, 36, 98–104. [Google Scholar] [CrossRef]
  19. Lau, K.T.; Cheung, K.Y.; Chan, K.B.; Chan, M.H.; Lo, K.Y.; Chiu, T.T.W. Relationships between sagittal postures of thoracic and cervical spine, presence of neck pain, neck pain severity and disability. Man. Ther. 2010, 15, 457–462. [Google Scholar] [CrossRef]
  20. Kapandji, I.A. The Physiology of the Joints. Volume 3. the trunk and the vertebral column. Postgrad Med J 1975, 51, 682. [Google Scholar]
  21. Harman, K.; Hubley-Kozey, C.L.; Butler, H. Effectiveness of an Exercise Program to Improve Forward Head Posture in Normal Adults: A Randomized, Controlled 10-Week Trial. J. Man. Manip. Ther. 2005, 13, 163–176. [Google Scholar] [CrossRef]
  22. Alowa, Z.; Elsayed, W. The impact of forward head posture on the electromyographic activity of the spinal muscles. J. Taibah Univ. Med Sci. 2020, 16, 224–230. [Google Scholar] [CrossRef] [PubMed]
  23. Panjabi, M.M.; M., M. The Stabilizing System of the Spine. Part I. Function, Dysfunction, Adaptation, and Enhancement. J. Spinal Disord. 1992, 5, 383–389. [CrossRef]
  24. Cholewicki, J.; IV, J.J.V. Relative contribution of trunk muscles to the stability of the lumbar spine during isometric exertions. Clin. Biomech. 2002, 17, 99–105. [Google Scholar] [CrossRef] [PubMed]
  25. Panjabi, M.; Abumi, K.; Duranceau, J.; Oxland, T.M. Spinal Stability and Intersegmental Muscle Forces. Spine 1989, 14, 194–200. [Google Scholar] [CrossRef]
  26. Boynton, A.M.; Carrier, D.R. The Human Neck is Part of the Musculoskeletal Core: Cervical Muscles Help Stabilize the Pelvis During Running and Jumping. Integr. Org. Biol. 2022, 4, obac021. [Google Scholar] [CrossRef] [PubMed]
  27. Panjabi, M.M.; M., M. The Stabilizing System of the Spine. Part II. Neutral Zone and Instability Hypothesis. J. Spinal Disord. 1992, 5, 390–397. [CrossRef] [PubMed]
  28. Adams, M.; Dolan, P.; Hutton, W.C. The stages of disc degeneration as revealed by discograms. . 1986, 68, 36–41. [Google Scholar] [CrossRef]
  29. Harrison, D.E.; Oakley, P.A. An Introduction to Chiropractic BioPhysics® (CBP®) Technique: A Full Spine Rehabilitation Approach to Reducing Spine Deformities. 2022. [Google Scholar] [CrossRef]
  30. Oakley, P.A.; Ehsani, N.N.; Moustafa, I.M.; Harrison, D.E. Restoring cervical lordosis by cervical extension traction methods in the treatment of cervical spine disorders: a systematic review of controlled trials. J. Phys. Ther. Sci. 2021, 33, 784–794. [Google Scholar] [CrossRef]
  31. Tao, W.; Liu, T.; Zheng, R.; Feng, H. Gait Analysis Using Wearable Sensors. Sensors 2012, 12, 2255–2283. [Google Scholar] [CrossRef]
  32. Wang, W.; Adamczyk, P.G. Analyzing Gait in the Real World Using Wearable Movement Sensors and Frequently Repeated Movement Paths. Sensors 2019, 19, 1925. [Google Scholar] [CrossRef] [PubMed]
  33. Muro-De-La-Herran, A.; Garcia-Zapirain, B.; Mendez-Zorrilla, A. Gait Analysis Methods: An Overview of Wearable and Non-Wearable Systems, Highlighting Clinical Applications. Sensors 2014, 14, 3362–3394. [Google Scholar] [CrossRef] [PubMed]
  34. Bisi, M.C.; Stagni, R. Development of gait motor control: What happens after a sudden increase in height during adolescence? Biomed Eng Online 2016, 15. [Google Scholar] [CrossRef] [PubMed]
  35. Szucs, K.A.; Brown, E.V.D. Rater reliability and construct validity of a mobile application for posture analysis. J. Phys. Ther. Sci. 2018, 30, 31–36. [Google Scholar] [CrossRef]
  36. Boland, D.M.; Neufeld, E.V.; Ruddell, J.; Dolezal, B.A.; Cooper, C.B. Inter- and intra-rater agreement of static posture analysis using a mobile application. J. Phys. Ther. Sci. 2016, 28, 3398–3402. [Google Scholar] [CrossRef]
  37. Volkan-Yazici, M.; Çobanoğlu, G.; Yazici, G. Test-retest reliability and minimal detectable change for measures of wearable gait analysis system (G-walk) in children with cerebral palsy. Turk J Med Sci 2022, 52, 658–666. [Google Scholar] [CrossRef] [PubMed]
  38. De Ridder, R.; Lebleu, J.; Willems, T.; De Blaiser, C.; Detrembleur, C.; Roosen, P. Concurrent Validity of a Commercial Wireless Trunk Triaxial Accelerometer System for Gait Analysis. J. Sport Rehabilitation 2019, 28. [Google Scholar] [CrossRef] [PubMed]
  39. Randell, R.K.; Clifford, T.; Drust, B.; Moss, S.L.; Unnithan, V.B.; de Ste Croix, M.B.A.; Datson, N.; Martin, D.; Mayho, H.; Carter, J.M.; et al. Physiological Characteristics of Female Soccer Players and Health and Performance Considerations: A Narrative Review. Sports Med. 2021, 51, 1377–1399. [Google Scholar] [CrossRef] [PubMed]
  40. Park, G.; Woo, Y. Comparison between a center of mass and a foot pressure sensor system for measuring gait parameters in healthy adults. J. Phys. Ther. Sci. 2015, 27, 3199–3202. [Google Scholar] [CrossRef]
  41. Yazici, G.; Yazici, M.V.; Çobanoğlu, G.; Küpeli, B.; Özkul, Ç.; Oskay, D.; Güzel, N.A. The reliability of a wearable movement analysis system (G-walk) on gait and jump assessment in healthy adults. Journal of Exercise Therapy and Rehabilitation 2020, 7, 159–167. [Google Scholar]
  42. Pau, M.; Leban, B.; Collu, G.; Migliaccio, G.M. Effect of light and vigorous physical activity on balance and gait of older adults. Arch. Gerontol. Geriatr. 2014, 59, 568–573. [Google Scholar] [CrossRef] [PubMed]
  43. Mahmoud, N.F.; Hassan, K.A.; Abdelmajeed, S.F.; Moustafa, I.M.; Silva, A.G. The Relationship Between Forward Head Posture and Neck Pain: a Systematic Review and Meta-Analysis. Curr. Rev. Musculoskelet. Med. 2019, 12, 562–577. [Google Scholar] [CrossRef] [PubMed]
  44. Al Suwaidi, A.S.; Moustafa, I.M.; Kim, M.; Oakley, P.A.; Harrison, D.E. A Comparison of Two Forward Head Posture Corrective Approaches in Elderly with Chronic Non-Specific Neck Pain: A Randomized Controlled Study. J. Clin. Med. 2023, 12, 542. [Google Scholar] [CrossRef] [PubMed]
  45. Khan, A.; Khan, Z.; Bhati, P.; Hussain, M.E. Influence of Forward Head Posture on Cervicocephalic Kinesthesia and Electromyographic Activity of Neck Musculature in Asymptomatic Individuals. J. Chiropr. Med. 2020, 19, 230–240. [Google Scholar] [CrossRef] [PubMed]
  46. Martinez-Merinero, P.; Nuñez-Nagy, S.; Achalandabaso-Ochoa, A.; Fernandez-Matias, R.; Pecos-Martin, D.; Gallego-Izquierdo, T. Relationship between Forward Head Posture and Tissue Mechanosensitivity: A Cross-Sectional Study. J. Clin. Med. 2020, 9, 634. [Google Scholar] [CrossRef]
  47. Pacheco, J.; Raimundo, J.; Santos, F.; Ferreira, M.; Lopes, T.; Ramos, L.; Silva, A.G. Forward head posture is associated with pressure pain threshold and neck pain duration in university students with subclinical neck pain. Somatosens. Mot. Res. 2018, 35, 103–108. [Google Scholar] [CrossRef]
  48. Naz, A.; Bashir, S.; Noor, R. Prevalence of forward head posture among university students. Rawal Medical Journal 43.
  49. Singh, S.; Kaushal, K.; Jasrotia, S. Prevalence of forward head posture and its impact on the activity of daily living among students of Adesh University – A cross-sectional study. Adesh Univ. J. Med Sci. Res. 2020, 2, 99–102. [Google Scholar] [CrossRef]
  50. Hodges, P.W.; Smeets, R.J. Interaction between pain, movement, and physical activity: Short-term benefits, long-term consequences, and targets for treatment. Clin J Pain 2015, 31, 97–107. [Google Scholar] [CrossRef] [PubMed]
  51. Danna-Dos-Santos, A.; Degani, A.M.; Latash, M.L. Anticipatory control of head posture. Clin. Neurophysiol. 2007, 118, 1802–1814. [Google Scholar] [CrossRef] [PubMed]
  52. Massion, J. Movement, posture and equilibrium: Interaction and coordination. Prog. Neurobiol. 1992, 38, 35–56. [Google Scholar] [CrossRef] [PubMed]
  53. Frank, J.S.; Earl, M. Coordination of Posture and Movement. Phys. Ther. 1990, 70, 855–863. [Google Scholar] [CrossRef] [PubMed]
  54. Moustafa, I.; Kim, M.; Harrison, D.E. Comparison of sensorimotor integration and skill-re-lated physical fitness components between college athletes with and without forward head posture. J. Sport Rehabil. 2022, 32, 53–62. [Google Scholar] [CrossRef]
  55. Abbruzzese, G.; Berardelli, A. Sensorimotor integration in movement disorders. Mov. Disord. 2002, 18, 231–240. [Google Scholar] [CrossRef] [PubMed]
  56. Haavik, H.; Murphy, B. The role of spinal manipulation in addressing disordered sensorimotor integration and altered motor control. J. Electromyogr. Kinesiol. 2012, 22, 768–776. [Google Scholar] [CrossRef]
  57. Haavik-Taylor, H.; Murphy, B. Cervical spine manipulation alters sensorimotor integration: A somatosensory evoked potential study. Clin. Neurophysiol. 2007, 118, 391–402. [Google Scholar] [CrossRef] [PubMed]
  58. Pickar, J.G. Neurophysiological effects of spinal manipulation. Spine J. 2002, 2, 357–371. [Google Scholar] [CrossRef] [PubMed]
  59. Taylor, H.H.; Murphy, B. Altered Central Integration of Dual Somatosensory Input After Cervical Spine Manipulation. J. Manip. Physiol. Ther. 2010, 33, 178–188. [Google Scholar] [CrossRef] [PubMed]
  60. Hishinuma, M.; Yamaguchi, T. Axonal projection of descending pathways responsible for eliciting forelimb stepping into the cat cervical spinal cord. Exp. Brain Res. 1990, 82, 597–605. [Google Scholar] [CrossRef] [PubMed]
  61. Desmurget, M.; Sirigu, A. A parietal-premotor network for movement intention and motor awareness. Trends Cogn. Sci. 2009, 13, 411–419. [Google Scholar] [CrossRef]
  62. Azevedo, R.d.A.; Cruz, R.; Couto, P.; Silva-Cavalcante, M.D.; Boari, D.; Lima-Silva, A.E.; Millet, G.Y.; Bertuzzi, R.; Drouin, P.J.; Kohoko, Z.I.N.; et al. Spinal and Supraspinal Factors in Human Muscle Fatigue. Physiol. Rev. 2001, 81, 1725–1789. [Google Scholar] [CrossRef]
  63. Krakauer, J.W.; Ghazanfar, A.A.; Gomez-Marin, A.; MacIver, M.A.; Poeppel, D. Neuroscience Needs Behavior: Correcting a Reductionist Bias. Neuron 2017, 93, 480–490. [Google Scholar] [CrossRef] [PubMed]
  64. E Harrison, D.; Harrison, D.D.; Betz, J.J.; Janik, T.J.; Holland, B.; Colloca, C.J.; Haas, J.W. Increasing the cervical lordosis with chiropractic biophysics seated combined extension-compression and transverse load cervical traction with cervical manipulation: nonrandomized clinical control trial. J. Manip. Physiol. Ther. 2003, 26, 139–151. [Google Scholar] [CrossRef]
  65. Harrison, D.E.; Cailliet, R.; Harrison, D.D.; Janik, T.J.; Holland, B. A new 3-point bending traction method for restoring cervical lordosis and cervical manipulation: A nonrandomized clinical controlled trial. Arch. Phys. Med. Rehabilitation 2002, 83, 447–453. [Google Scholar] [CrossRef]
  66. Harrison, D.E.; Cailliet, R.; Betz, J.; Haas, J.W.; Harrison, D.D.; Janik, T.J.; Holland, B. Conservative methods for reducing lateral translation postures of the head: a nonrandomized clinical control trial. J. Rehabilitation Res. Dev. 2004, 41, 631. [Google Scholar] [CrossRef]
  67. Oakley, P.A.; Kallan, S.Z.; Harrison, D.E. Structural rehabilitation of the cervical lordosis and forward head posture: a selective review of Chiropractic BioPhysics® case reports. J. Phys. Ther. Sci. 2022, 34, 759–771. [Google Scholar] [CrossRef] [PubMed]
  68. Kawkabani, G.; Saliby, R.M.; Mekhael, M.; Rachkidi, R.; Massaad, A.; Ghanem, I.; Kharrat, K.; Kreichati, G.; Saad, E.; Lafage, V.; et al. Gait kinematic alterations in subjects with adult spinal deformity and their radiological determinants. Gait Posture 2021, 88, 203–209. [Google Scholar] [CrossRef]
  69. Mekhael, E.; El Rachkidi, R.; Saliby, R.M.; Nassim, N.; Semaan, K.; Massaad, A.; Karam, M.; Saade, M.; Ayoub, E.; Rteil, A.; et al. Functional assessment using 3D movement analysis can better predict health-related quality of life outcomes in patients with adult spinal deformity: a machine learning approach. Front. Surg. 2023, 10, 1166734. [Google Scholar] [CrossRef] [PubMed]
  70. Sato, K.; Tominaga, R.; Endo, T.; Miura, T.; Iwabuchi, M.; Ito, T.; Shirado, O. The association of dynamic spinal alignment on gait endurance of patients with adult spinal deformity: a cross-sectional study. Spine Deform. 2022, 11, 1–7. [Google Scholar] [CrossRef]
  71. Arima, H.; Yamato, Y.; Hasegawa, T.; Togawa, D.; Kobayashi, S.; Yasuda, T.; Banno, T.; Oe, S.; Matsuyama, Y. Discrepancy Between Standing Posture and Sagittal Balance During Walking in Adult Spinal Deformity Patients. Spine 2017, 42, E25–E30. [Google Scholar] [CrossRef] [PubMed]
  72. Semaan, K.; Rachkidi, R.; Saad, E.; Massaad, A.; Kawkabani, G.; Saliby, R.M.; Mekhael, M.; Karam, K.A.; Fakhoury, M.; Jaber, E.; et al. Alterations of gait kinematics depend on the deformity type in the setting of adult spinal deformity. Eur. Spine J. 2022, 31, 3069–3080. [Google Scholar] [CrossRef] [PubMed]
  73. Khamis, S.; Carmeli, E. Relationship and significance of gait deviations associated with limb length discrepancy: A systematic review. Gait Posture 2017, 57, 115–123. [Google Scholar] [CrossRef]
  74. Shi, Y.; Pang, H.; Xu, H.; Li, X.; Cao, Y.; Merryweather, A.; Zheng, P.; Xiang, J. Effects of orthotic insole on gait patterns in children with mild leg length discrepancy. Gait Posture 2022, 93, 191–197. [Google Scholar] [CrossRef] [PubMed]
  75. Khamis, S.; Carmeli, E. The effect of simulated leg length discrepancy on lower limb biomechanics during gait. Gait Posture 2018, 61, 73–80. [Google Scholar] [CrossRef]
Table 1. Descriptive data for the demographic variables are presented. The values are presented as mean and standard deviation (SD) for age, weight, height and BMI (body mass index) in addition to the distribution of the sample in terms of gender and ethnicity.
Variable N=100
Age (years) 21.10 ± 1.70
Weight (kg) 67.77 ± 17.28
Height (cm) 166.68 ± 8.72
BMI (kg/m2) 24.27 ± 5.33
Gender (%)
Male 27
Female 73
Race / ethnicity (n)
Arab-Non GCC 51
Arab-GCC 31
Non-Arab 18
Table 2. Descriptive statistics of posture parameters as the median and interquartile range (IQR).
Head Posture Parameters N = 100
Median (IQR)
CVA (°) 51.60 (46.60, 55.30)
Lateral translation head (cm) 3.79 (2.68, 5.03)
AHT (cm) 0.69 (0.18, 1.21)
Lateral angulation head (°) 10.32 (6.67 ,14.3)
Note: CVA, craniovertebral angle; AHT, anterior head translation.
Table 3. Descriptive statistics of spatiotemporal parameters reported as the median and interquartile range (IQR).
Gait Spatiotemporal Parameters N = 100
Median (IQR)
Cadence 109.70 (105.30, 116.30)
Speed (m/s) 1.15 (0.98 ,1.24)
Symmetry index 92.20 (80.90, 95.60)
% Left stride length (% height) 76 (66.70, 83.20)
% Right stride length (% height) 75.40 (67.70, 82.60)
Left propulsion index 5.50 (4.20, 7.50)
Right Propulsion Index 4.80 (3.90, 7.60)
Tilt - symmetry index 47.10 (24.30, 77.90)
Tilt - left - range 4.30 (3.30, 5.40)
Tilt - right - Range 8.40 (3.70, 13.20)
Obliquity – symmetry index 95.80 (84.80, 98.10)
Obliquity - left - range 7.50 (5.70, 10.40)
Obliquity - right - range 80.00 (5.80, 10.50)
Rotation - symmetry index 96.70 (85.70, 98.10)
Rotation - left - range 10.30 (6.90, 13.30)
Rotation - right - range 10.50 (6.90, 13.70)
Table 4. Descriptive statistics of counter-movement jump (CMJ) parameters reported as the median and interquartile range (IQR).
CMJ Parameters N = 100
Median (IQR)
CMJ - flight height (cm) 17.20 (14.20, 24.30)
CMJ – take-off force (kN) 1.11 (0.92, 1.40)
CMJ - impact force (kN) 1.35 (1.05, 1.69)
Take-off speed (m/s) 2.12 (1.85, 2.48)
CMJ - peak speed (m/s) 2.24 (1.99, 2.58)
CMJ - average speed concentric phase (m/s) 1.23 (1.08, 1.41)
CMJ - maximum concentric power (kW) 2.19 (1.67, 2.94)
CMJ - average concentric power (kW) 1.02 (0.85, 1.41)
Table 5. Descriptive statistics of counter-movement jump with arms thrust (CMJAT) jump parameters reported as the median and interquartile range (IQR).
CMJAT Parameters N = 100
Median (IQR)
CMJAT - flight height (cm) 19.60 (15.90, 27.70)
CMJAT – take-off force (kN) 1.15 (0.95, 1.55)
CMJAT - impact force (kN) 1.45 (1.11, 1.95)
CMJAT – take-off speed (m/s) 2.15 (1.94, 2.45)
CMJAT - peak speed (m/s) 2.27 (2.09, 2.53)
CMJAT - average speed concentric phase (m/s) 1.23 (1.12, 1.39)
CMJAT - maximum concentric power (kW) 2.11 (1.76, 3.34)
CMJAT - average concentric power (kW) 1.08 (0.89, 1.53)
Table 6. Spearman correlation coefficient (r) and p-values (p) between CVA, lateral translation head sagittal, AHT coronal, and lateral angulation head (first row), and each of the gait parameters (first column).
Gait Parameters CVA Lateral translationhead AHT Lateral angulation head
r p r P r p r p
Cadence 0.51* < 0.001 -0.74* < 0.001 -0.51* < 0.001 -0.27* 0.006
Speed (m/s) 0.52* < 0.001 -0.46* < 0.001 -0.44* < 0.001 -0.37* < 0.001
Symmetry index 0.54* < 0.001 -0.70* < 0.001 0.02 0.854 -0.31* 0.003
%Left stride length (%height) 0.43* < 0.001 -0.42* < 0.001 -0.48* < 0.001 -0.31* 0.003
%Right stride length (%height) 0.51* < 0.001 -0.51* < 0.001 -0.46* < 0.001 -0.32* 0.01
Left propulsion index 0.54* < 0.001 -0.36* 0.001 -0.47* < 0.001 -0.36* < 0.001
Right propulsion index 0.55* < 0.001 -0.29* 0.015 -0.39* 0.001 -0.39* < 0.001
Tilt - symmetry index 0.57* < 0.001 -0.51* < 0.001 -0.62* < 0.001 -0.45* < 0.001
Tilt - left – range 0.58* < 0.001 -0.21* 0.004 -0.81* < 0.001 -0.37* < 0.001
Tilt - right - range 0.54* < 0.001 -0.23* 0.004 -0.47* < 0.001 -0.26* 0.011
Obliquity – symmetry index 0.56* < 0.001 -0.06* < 0.001 -0.75* < 0.001 -0.40* < 0.001
Obliquity - Left - Range 0.45* < 0.001 -0.49* < 0.001 -0.65* < 0.001 -0.26* 0.011
Obliquity - right – Range 0.54* < 0.001 -0.25* 0.005 -0.64* < 0.001 -0.25* 0.011
Rotation - symmetry Index 0.52* < 0.001 -0.69* < 0.001 -0.27* 0.010 -0.43* < 0.001
Rotation - left - range 0.46* < 0.001 -0.33* 0.001 -0.42* < 0.001 -0.10 0.3
Rotation - right - range 0.46* < 0.001 -0.24* 0.005 -0.41* < 0.001 -0.26* 0.011
*Indicates a statistically significant correlation (p < 0.05).
Table 7. Spearman correlation coefficient (r) and p-values (p) between CVA, lateral translation head, AHT, and lateral angulation head (first row), and each of the CMJ parameters (first column).
Physical Performance Skills CVA Lateral translationhead AHT Lateral angulation head
r p r p r p r p
CMJ - flight height (cm) 0.41* < 0.001 -0.39* < 0.001 -0.44* < 0.001 -0.37* < 0.001
CMJ – take-off force (kN) 0.39* < 0.001 -0.40* < 0.001 -0.65* < 0.001 -0.38* < 0.001
CMJ - impact force (kN) 0.24 0.052 -0.48* < 0.001 -0.55* < 0.001 -0.39* < 0.001
Take-off speed (m/s) 0.39* < 0.001 -0.43* < 0.001 -0.49* < 0.001 -0.38* < 0.001
CMJ - peak speed (m/s) 0.38* < 0.001 -0.42* < 0.001 -0.49* < 0.001 -0.40* < 0.001
CMJ - average speed concentric phase (m/s) 0.41* < 0.001 -0.42* < 0.001 -0.57* < 0.001 -0.40* < 0.001
CMJ - maximum Concentric Power (kW) 0.27* 0.03 -0.31* 0.003 -0.41* < 0.001 -0.40* < 0.001
CMJ - average concentric power (kW) 0.52* < 0.001 -0.54* < 0.001 -0.48* < 0.001 -0.39* < 0.001
*Indicates a statistically significant correlation (p < 0.05).
Disclaimer/Publisher’s Note: The statements, opinions and data contained in all publications are solely those of the individual author(s) and contributor(s) and not of MDPI and/or the editor(s). MDPI and/or the editor(s) disclaim responsibility for any injury to people or property resulting from any ideas, methods, instructions or products referred to in the content.
Copyright: This open access article is published under a Creative Commons CC BY 4.0 license, which permit the free download, distribution, and reuse, provided that the author and preprint are cited in any reuse.
Prerpints.org logo

Preprints.org is a free preprint server supported by MDPI in Basel, Switzerland.

Subscribe

© 2024 MDPI (Basel, Switzerland) unless otherwise stated