Submitted:
10 July 2023
Posted:
11 July 2023
You are already at the latest version
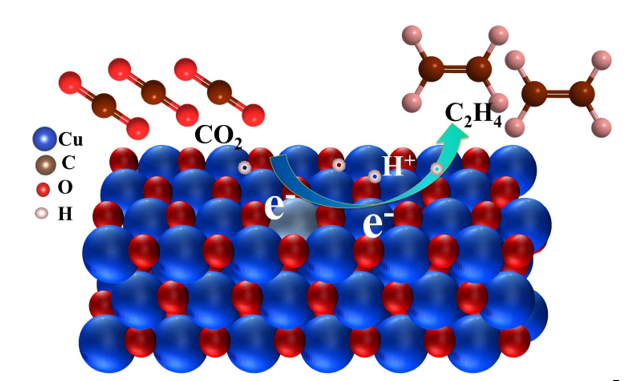
Abstract
Keywords:
1. Introduction
2. Results
2.1. Morphology and structure analysis
2.2. Electrocatalytic CO2RR perfomances
2.3. DFT Computations
3. Materials and Methods
3.1. Preparation of Al-Cu2O nanocrystals
3.2. Preparation of Al-Cu2O coated carbon paper electrode
3.3. Electrochemical measurements
3.4. Product analysis
4. Conclusions
Acknowledgments
Conflicts of Interest
References
- Alli, Y. A.; Oladoye, P. O.; Ejeromedoghene, O.; Bankole, O. M.; Alimi, O. A.; Omotola, E. O.; Olanrewaju, C. A.; Philippot, K.; Adeleye, A. S.; Ogunlaja, A. S. , Nanomaterials as catalysts for CO2 transformation into value-added products: A review. Sci Total Enviro. 2023, 868, 161547. [Google Scholar] [CrossRef] [PubMed]
- Zhao, M.; Gu, Y.; Gao, W.; Cui, P.; Tang, H.; Wei, X.; Zhu, H.; Li, G.; Yan, S.; Zhang, X.; Zou, Z., Atom vacancies induced electron-rich surface of ultrathin Bi nanosheet for efficient electrochemical CO2 reduction. Appl. Catal. B: Environ. 2020, 266, 118625. [CrossRef]
- Feng, X.; Zou, H.; Zheng, R.; Wei, W.; Wang, R.; Zou, W.; Lim, G.; Hong, J.; Duan, L.; Chen, H. , Bi2O3/BiO2 Nanoheterojunction for Highly Efficient Electrocatalytic CO2 Reduction to Formate. Nano Lett. 2022, (4), 1656–1664. [Google Scholar] [CrossRef]
- Yang, Y.; He, A.; Yang, M.; Zou, Q.; Li, H.; Liu, Z.; Tao, C.; Du, J., Selective electroreduction of CO2 to ethanol over a highly stable catalyst derived from polyaniline/CuBi2O4. Catalysis Science & Technology. 2021, 11, 5908–5916.
- Sakamoto, N.; Nishimura, Y. F.; Nonaka, T.; Ohashi, M.; Ishida, N.; Kitazumi, K.; Kato, Y.; Sekizawa, K.; Morikawa, T.; Arai, T. , Self-assembled Cuprous Coordination Polymer as a Catalyst for CO2 Electrochemical Reduction into C2 Products. ACS Catal. 2020, (18), 10412–10419. [Google Scholar] [CrossRef]
- Liu, B.; Yao, X.; Zhang, Z.; Li, C.; Zhang, J.; Wang, P.; Zhao, J.; Guo, Y.; Sun, J.; Zhao, C. , Synthesis of Cu2O Nanostructures with Tunable Crystal Facets for Electrochemical CO2 Reduction to Alcohols. ACS Appl Mater Interfaces. 2021, (33), 39165–39177. [Google Scholar] [CrossRef]
- Zhou, X.; Shan, J.; Chen, L.; Xia, B. Y.; Ling, T.; Duan, J.; Jiao, Y.; Zheng, Y.; Qiao, S. Z. , Stabilizing Cu2+ Ions by Solid Solutions to Promote CO2 Electroreduction to Methane. J Am Chem Soc. 2022, (5), 2079–2084. [Google Scholar] [CrossRef] [PubMed]
- Dong, W.; Zhang, N.; Li, S.; Min, S.; Peng, J.; Liu, W.; Zhan, D.; Bai, H. , A Mn single atom catalyst with Mn–N2O2 sites integrated into carbon nanosheets for efficient electrocatalytic CO2 reduction. J Mater Cheme A. 2022, (20), 10892–10901. [Google Scholar] [CrossRef]
- Clark, E. L.; Ringe, S.; Tang, M.; Walton, A.; Hahn, C.; Jaramillo, T. F.; Chan, K.; Bell, A. Influence of Atomic Surface Structure on the Activity of Ag for the Electrochemical Reduction of CO2 to CO. ACS Catal. 2019, (5), 4006–4014. [Google Scholar] [CrossRef]
- Wang, Q.; Liu, K.; Hu, K.; Cai, C.; Li, H.; Li, H.; Herran, M.; Lu, Y.-R.; Chan, T.-S.; Ma, C. J. Attenuating metal-substrate conjugation in atomically dispersed nickel catalysts for electroreduction of CO2 to CO. Nat Commun. 2022, (1), 6082. [Google Scholar] [CrossRef] [PubMed]
- Duan, Y. X.; Zhou, Y. T.; Yu, Z.; Liu, D. X.; Wen, Z.; Yan, J. M.; Jiang, Q. J. Boosting production of HCOOH from CO2 electroreduction via Bi/CeOx. Angew Chem Int Ed Engl. 2021, (16), 8798–8802. [Google Scholar] [CrossRef] [PubMed]
- Koh, J. H.; Won, D. H.; Eom, T.; Kim, N.-K.; Jung, K. D.; Kim, H.; Hwang, Y. J.; Min, B. K. Facile CO2 electro-reduction to formate via oxygen bidentate intermediate stabilized by high-index planes of Bi dendrite catalyst. ACS Catal. 2017, (8), 5071–5077. [Google Scholar] [CrossRef]
- Li, D.; Huang, L.; Tian, Y.; Liu, T.; Zhen, L.; Feng, Y. Facile synthesis of porous Cu-Sn alloy electrode with prior selectivity of formate in a wide potential range for CO2 electrochemical reduction. Appl. Catal. B Environ. 2021, 292, 120119. [Google Scholar] [CrossRef]
- Grace, A. N.; Choi, S. Y.; Vinoba, M.; Bhagiyalakshmi, M.; Chu, D. H.; Yoon, Y.; Nam, S. C.; Jeong, S. K. Electrochemical reduction of carbon dioxide at low overpotential on a polyaniline/Cu2O nanocomposite based electrode. Applied Energy. 2014, 120, 85–94. [Google Scholar] [CrossRef]
- Boutin, E.; Wang, M.; Lin, J. C.; Mesnage, M.; Mendoza, D.; Lassalle-Kaiser, B.; Hahn, C.; Jaramillo, T. F.; Robert, M. J. A. C. I. E. , Aqueous electrochemical reduction of carbon dioxide and carbon monoxide into methanol with cobalt phthalocyanine. Angew.Chem.Int.Ed. 2019, (45), 16172–16176. [Google Scholar] [CrossRef]
- Ren, D.; Deng, Y.; Handoko, A. D.; Chen, C. S.; Malkhandi, S.; Yeo, B. S. J. Selective electrochemical reduction of carbon dioxide to ethylene and ethanol on copper (I) oxide catalysts. ACS Catal. 2015, (5), 2814–2821. [Google Scholar] [CrossRef]
- Yuan, J.; Yang, M.-P.; Zhi, W.-Y.; Wang, H.; Wang, H.; Lu, J.-X. Efficient electrochemical reduction of CO2 to ethanol on Cu nanoparticles decorated on N-doped graphene oxide catalysts. J. CO2 Util. 2019, 33, 452–460. [Google Scholar] [CrossRef]
- Iyengar, P.; Huang, J.; De Gregorio, G. L.; Gadiyar, C.; Buonsanti, R. Size dependent selectivity of Cu nano-octahedra catalysts for the electrochemical reduction of CO2 to CH4. Chem Commun (Camb). 2019, (60), 8796–8799. [Google Scholar] [CrossRef]
- Chu, S.; Kang, C.; Park, W.; Han, Y.; Hong, S.; Hao, L.; Zhang, H.; Lo, T. W. B.; Robertson, A. W.; Jung, Y.; Han, B.; Sun, Z. Single atom and defect engineering of CuO for efficient electrochemical reduction of CO2to C2H4. SmartMat. 2022, (1), 194–205. [Google Scholar] [CrossRef]
- Luo, H.; Li, B.; Ma, J. G.; Cheng, P. , Surface Modification of Nano-Cu2 O for Controlling CO2 Electrochemical Reduction to Ethylene and Syngas. Angew Chem Int Ed Engl. 2022, (11), e202116736. [Google Scholar]
- Tan, X.; Yu, C.; Zhao, C.; Huang, H.; Yao, X.; Han, X.; Guo, W.; Cui, S.; Huang, H.; Qiu, J. J. Interfaces, Restructuring of Cu2O to Cu2O@ Cu-metal–organic frameworks for selective electrochemical reduction of CO2. ACS Appl. Mater. Interfaces. 2019, (10), 9904–9910. [Google Scholar] [CrossRef]
- Cao, S.; Chen, H.; Han, T.; Zhao, C.; Peng, L. J. Rose-like Cu2O nanoflowers via hydrothermal synthesis and their gas sensing properties. Materials Lett. 2016, 180, 135–139. [Google Scholar] [CrossRef]
- Gao, Y.; Wu, Q.; Liang, X.; Wang, Z.; Zheng, Z.; Wang, P.; Liu, Y.; Dai, Y.; Whangbo, M. H.; Huang, B. , Cu2O Nanoparticles with Both 100 and 111 Facets for Enhancing the Selectivity and Activity of CO2 Electroreduction to Ethylene. Adv Sci (Weinh) 2020, (6), 1902820. [Google Scholar] [CrossRef]
- Fu, W.; Liu, Z.; Wang, T.; Liang, J.; Duan, S.; Xie, L.; Han, J.; Li, Q. J. Engineering, Promoting C2+ production from electrochemical CO2 reduction on shape-controlled cuprous oxide nanocrystals with high-index facets. ACS Sustainable Chem. Eng. 2020, (40), 15223–15229. [Google Scholar] [CrossRef]
- Luo, T.; Liu, K.; Fu, J.; Chen, S.; Li, H.; Hu, J.; Liu, M. J. Tandem catalysis on adjacent active motifs of copper grain boundary for efficient CO2 electroreduction toward C2 products. Journal of Energy Chemistry 2022, 70, 219–223. [Google Scholar] [CrossRef]
- Wang, Y.; Lou, Z.; Niu, W.; Ye, Z.; Zhu, L. J. Optimization of photoelectrochemical performance in Pt-modified p-Cu2O/n-Cu2O nanocomposite. Nanotechnology 2018, (14), 145402. [Google Scholar] [CrossRef]
- Feng, Y.; Li, Z.; Liu, H.; Dong, C.; Wang, J.; Kulinich, S. A.; Du, X. J. Laser-prepared CuZn alloy catalyst for selective electrochemical reduction of CO2 to ethylene. Langmuir 2018, (45), 13544–13549. [Google Scholar] [CrossRef]
- Chen, C.; Sun, X.; Yan, X.; Wu, Y.; Liu, M.; Liu, S.; Zhao, Z.; Han, B. J. G. strategy to control the grain boundary density and Cu+/Cu0 ratio of Cu-based catalysts for efficient electroreduction of CO2 to C2 products. Green Chem. 2020, (5), 1572–1576. [Google Scholar] [CrossRef]
- Luo, H.; Li, B.; Ma, J. G.; Cheng, P. J. Surface Modification of Nano-Cu2O for Controlling CO2 Electrochemical Reduction to Ethylene and Syngas. Angew Chemie. 2022, (11), e202116736. [Google Scholar]
- Shang, L.; Lv, X.; Shen, H.; Shao, Z.; Zheng, G. , Selective carbon dioxide electroreduction to ethylene and ethanol by core-shell copper/cuprous oxide. J Colloid Interface Sci. 2019, 552, 426–431. [Google Scholar] [CrossRef]
- Ning, H.; Wang, X.; Wang, W.; Mao, Q.; Yang, Z.; Zhao, Q.; Song, Y.; Wu, M. , Cubic Cu2O on nitrogen-doped carbon shells for electrocatalytic CO2 reduction to C2H4. Carbon 2019, 146, 218–223. [Google Scholar] [CrossRef]
- Chang, X.; Wang, T.; Zhao, Z. J.; Yang, P.; Greeley, J.; Mu, R.; Zhang, G.; Gong, Z.; Luo, Z.; Chen, J. J. Tuning Cu/Cu2O interfaces for the reduction of carbon dioxide to methanol in aqueous solutions. Angew.Chem.Int.E. 2018, (47), 15415–15419. [Google Scholar] [CrossRef]
- Qiu, Y.-L.; Zhong, H.-X.; Zhang, T.-T.; Xu, W.-B.; Li, X.-F.; Zhang, H.-M. Copper Electrode Fabricated via Pulse Electrodeposition: Toward High Methane Selectivity and Activity for CO2 Electroreduction. ACS Catal. 2017, (9), 6302–6310. [Google Scholar] [CrossRef]
- Zheng, Y.; Zhang, L.; Guan, J.; Qian, S.; Zhang, Z.; Ngaw, C. K.; Wan, S.; Wang, S.; Lin, J.; Wang, Y. J. Engineering, Controlled synthesis of Cu0/Cu2O for efficient photothermal catalytic conversion of CO2 and H2O. ACS Sustainable Chem. Eng. 2021, (4), 1754–1761. [Google Scholar] [CrossRef]
- Wang, S.; Kou, T.; Varley, J. B.; Akhade, S. A.; Weitzner, S. E.; Baker, S. E.; Duoss, E. B.; Li, Y. J. Cu2O/CuS nanocomposites show excellent selectivity and stability for formate generation via electrochemical reduction of carbon dioxide. ACS Materials Lett. 2020, (1), 100–109. [Google Scholar] [CrossRef]
- Lv, X.-W.; Liu, Y.; Hao, R.; Tian, W.; Yuan, Z.-Y. Urchin-like Al-doped Co3O4 nanospheres rich in surface oxygen vacancies enable efficient ammonia electrosynthesis. ACS Appl. Mater. Interfaces. 2020, (15), 17502–17508. [Google Scholar] [CrossRef]
- Sun, B.; Dai, M.; Cai, S.; Cheng, H.; Song, K.; Yu, Y.; Hu, H. J. Challenges and strategies towards copper-based catalysts for enhanced electrochemical CO2 reduction to multi-carbon products. Fuel 2023, 332, 126114. [Google Scholar] [CrossRef]
- Li, Y. C.; Wang, Z.; Yuan, T.; Nam, D.-H.; Luo, M.; Wicks, J.; Chen, B.; Li, J.; Li, F.; De Arquer, F. P. G. Binding site diversity promotes CO2 electroreduction to ethanol. J Am Chem Soc. 2019, (21), 8584–8591. [Google Scholar] [CrossRef]
- Yang, R.; Wu, Z.; Tang, D.; Xing, Y.; Ren, Y.; Li, F.; Li, X. , Synthesis of Cu2O crystals with negative surface curvature at various positions via Al3+ ions inducing. Materials Lett. 2014, 117, 211–213. [Google Scholar] [CrossRef]


Disclaimer/Publisher’s Note: The statements, opinions and data contained in all publications are solely those of the individual author(s) and contributor(s) and not of MDPI and/or the editor(s). MDPI and/or the editor(s) disclaim responsibility for any injury to people or property resulting from any ideas, methods, instructions or products referred to in the content. |
© 2023 by the authors. Licensee MDPI, Basel, Switzerland. This article is an open access article distributed under the terms and conditions of the Creative Commons Attribution (CC BY) license (http://creativecommons.org/licenses/by/4.0/).


