Preprint
Article

Catalytic Pyrolysis of Waste Low-Density Polyethylene (LDPE) Carry Bags to Fuels: Experimental and Exergy Analyses

Altmetrics

Downloads

188

Views

87

Comments

0

A peer-reviewed article of this preprint also exists.

Submitted:

10 July 2023

Posted:

11 July 2023

You are already at the latest version

Alerts
Abstract
Plastics are highly beneficial for the day-to-day activities of human beings; however, their decomposition is limited due to their strong covalent bonding. The concept of degradation of these big molecules into smaller ones or monomers was attempted by several researchers in the preceding decades with limited success. Pyrolysis is one of the ideas used to convert plastics into fuel, rather than small molecules, compared to the crowded structure of polymers. Among these plastics, low-density polyethylene (LDPE) is largely used as carry bags throughout the world, and, herein, the results of catalytic pyrolysis of the conversion of LDPE into fuel are reported. Different dosages of zinc oxide (ZnO) were used as a catalyst to do the pyrolysis at a specific temperature in a batch reactor specially designed at our laboratory. 0.6 g of ZnO was found to be the optimal dosage for a 50 g waste LDPE batch to get the maximum oil yield. The yielded oil was analyzed chemically through Fourier transform infrared spectroscopy (FTIR) and Reformulyzer M4 Hydrocarbon Group Type Analyzer. Evaluation of physical and chemical exergy along with exergetic efficiency of the process was done.
Keywords: 
Subject: Chemistry and Materials Science  -   Polymers and Plastics

1. Introduction

Plastics have an important role in everybody’s life these days. Many of the household items that we come across in our daily life are made up of plastics. They are mainly packaging materials for foods and beverages, various types of containers, toys, decorating materials, household items, automobile components, construction materials, and, so on. Most of these items are disposable in nature, which means we discard these items after their intended use and these materials pile up as a major component in the municipal solid waste (MSW) stream. Annually 2.01 billion tons of municipal solid wastes are generated of which 33% are not managed in an environmentally safe manner [1]. Nearly 70% of MSW ends up in landfills and dump sites, 19% is recycled and 11% is used for energy recovery [2]
Responsible use of these materials will help to preserve our environment because it takes hundreds of years for the natural degradation of plastics. All the commodity plastics are recyclable and safe disposal at designated collection bins is essential. The littering of plastic packaging items, especially carry bags, creates a big menace to the environment. Around 300 million plastic bags are found in the Atlantic Ocean alone [3]. These bags are very dangerous for marine life and aquatic species, especially for those of the mammalian variety. The most common victim is the sea turtles because they eat debris and jellyfish. Even if they survive after swallowing the waste plastics, their digestion system will be affected, and eventually die a slow death because of toxicity or intestinal blockage [4]. As a result, one species will die at an abnormal rate; every other living organism in the waterway will be impacted.
Another problem with the littering of waste plastic carry bags is the effect on animals in the forest. Improper digestion of plastic waste has the potential to kill an animal in the forest every three months [5]. The plastic waste accumulates in the municipal sewage systems and leads to blockages the drainage and in turn, can act as a breeding ground for the insects that cause infectious diseases [6].
In the Kingdom of Saudi Arabia (KSA), it was reported that 64–72 M tons of solid waste was produced annually and it is predicted to reach 125 M by 2031 [7]. The majority of this MSW is disposed of in landfills or offsites after generous recycling by the informal sector. They recycle only paper cardboard included in MSW. Two of the key performance indicators (KPIs) of Vision 2030 of KSA specifically address the need for increased recycling of MSW in the country [8].
The various strategies adopted for properly disposing of plastics in MSW are mechanical recycling, incineration, pyrolysis, gasification, and anaerobic conversion [9]. Pyrolysis is considered an economically favorable process for converting MSW into fuels with many operational and environmental benefits. The plastic components in the MSW stream have a rich combustible composition, which can be easily converted to carbonaceous fuels by the process of pyrolysis [10]. Pyrolysis is defined as a thermal process in which controlled thermal degradation of long-chain polymeric materials takes place in an inert atmosphere in the presence or absence of a suitable catalyst. The former process is known as thermal pyrolysis, whereas, the latter is known as catalytic pyrolysis. Various catalysts were employed for the pyrolysis of waste plastics such as zeolites, red mud, silica-alumina mixture, Fe2O3, Al2O3, etc [11,12,13,14]. The reduction in the overall process energy requirements and improvements in the quality of the product fuels are the major advantages of catalytic pyrolysis [15] The oil produced from pyrolysis of waste plastics can be used in combustion engines, burners, and in less to produce thermal energy due to its high calorific values [10,16,17,18]. As an alternative to the landfilling process, the pyrolysis process contributes to the reduction of carbon monoxide (CO) and carbon dioxide (CO2) emissions. As pyrolysis takes place in the presence of inert gases, it eliminates the formation of dioxins, which are produced at high temperatures in an oxygen atmosphere [19].
In the case of energy-intensive processes such as pyrolysis of LDPE at high temperatures, it is always necessary to develop the process that is the most energy efficient [20]. This can be achieved by performing the exergy analysis of the process at different operating conditions. In the past, only a few attempts have been made to look at the thermodynamic or exergetic efficiency of the pyrolysis processes. Chaudhary et. al. investigated the effect of pyrolysis process temperature on the exergy efficiency and concluded that the exergy of pyro-gas increased with the increase in temperature [21]. They found out that higher temperatures have a beneficial effect on pyro-gas exergy. Their calculations revealed exergy efficiency in the 59.2% - 91.1% range. They used the temperature range of 3000C – 6000C. They considered the effect of temperature only and did not consider the effect of the amount of catalyst. Wang et. al. investigated the energy and exergy efficiency of rice husk pyrolysis at the temperature range of 800 – 10000C [22]. They estimated energy and exergy efficiencies in the range of 64.57 – 72.68% and 52.93 – 60.64% respectively. Zhang et al. analyzed the pyrolysis of plastic waste in a rotary kiln with a heat carrier [23]. They considered the heat carrier loading impact on the heat and mass transfer in the process as well as on the energy and exergy efficiencies. They calculated the exergy and energy efficiencies in the range of 60.9 – 67.3% and 59.4 – 66.0% respectively. Rajkumar and Somsundaram reported kinetics and pyrolysis of residual tyres They reported kinetics parameters at 450-500oC without the use of any catalyst [24]. They also estimated the amount of exergy and energy but did not elaborate on the process efficiency. Huang et. al., focused on estimating the chemical exergy of six types of plastic wastes [25]. They developed a model to predict the chemical exergy of multi-component plastic wastes with an error of less than 5%. The model input was the high heating value for the plastic wastes.
Overall, the research literature to improve LDPE catalytic pyrolysis is still evolving. Further work such as the use of different types of catalysts, to reduce pyrolysis temperature, and estimation of related energy efficiency is highly desirable. In the present investigation, pyrolysis of waste plastic carry bags was carried out in the presence of a zinc oxide (ZnO) catalyst to study its effect on the overall process. In addition to thermal pyrolysis, three experimental runs were made with varying amounts of ZnO catalysts that is, 0.5g, 0.6g, and 0.7g. Moreover, exergy analyses for each pyrolysis case (with or without a catalyst) were conducted to determine the thermodynamic efficiency of the process. Process Simulation Software ASPEN Plus v.11.0 was used to extract and simulate thermodynamic properties of pyrolysis raw material and products.

2. Experimental

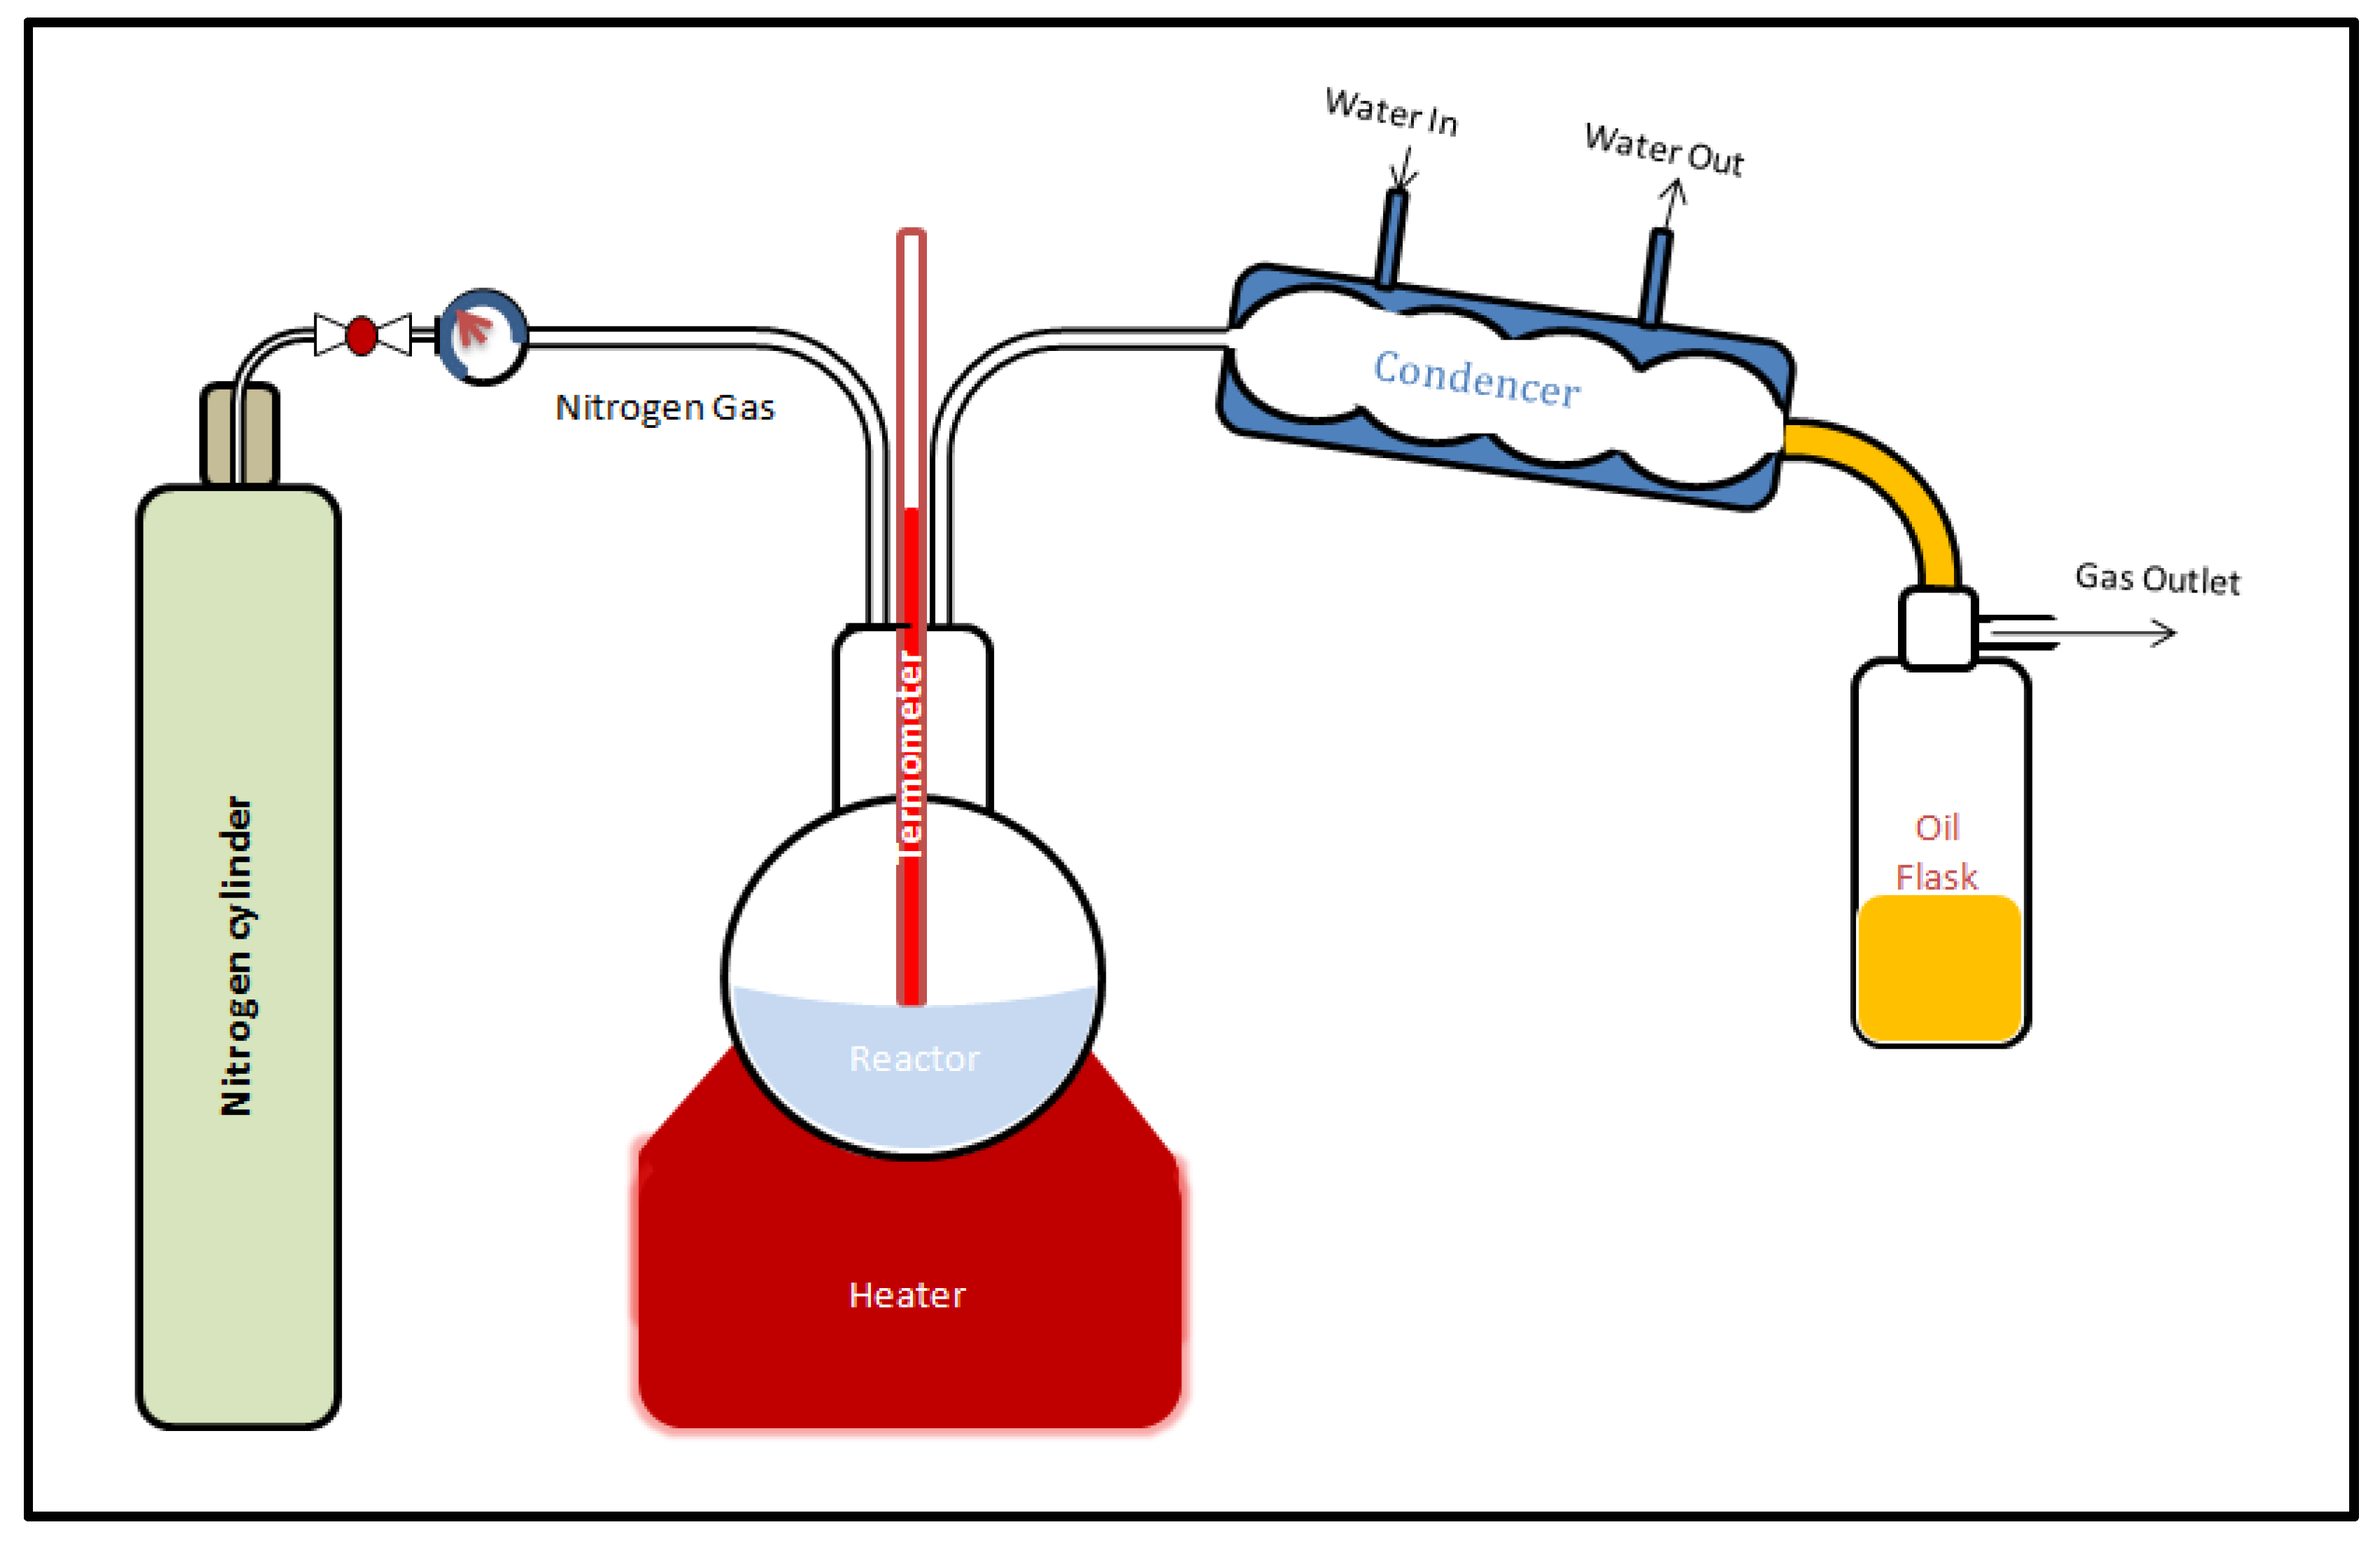
Waste plastic carry bags was collected and cut into square pieces approximately 3 cm in size and washed well in water to remove any dirt and other impurities. The washed samples were dried in a hot air oven at 600C for 24 hours before the pyrolysis experiments. The amount of waste carry bag material used for the pyrolysis process (batch size) was fixed as 50 g. A block flow diagram for the pyrolysis process starting with the collection stage is shown in Figure 1. Shredded plastic waste material was fed into a round bottom flask. Nitrogen gas was supplied to the flask at a rate of 30 ml/minute to create an inert atmosphere. The temperature chosen for the experiment was 3000C, which was supplied with the help of an electric heater (Electrothermal UK, power 170W, 230V). After melting the feed, the vapor was allowed to pass through a condenser. The condensate was collected in the oil flask. A schematic of the experimental setup is given in Figure 2.
The first trial of the experiment was carried out as thermal pyrolysis (without using a catalyst). ZnO (Analytical grade, Merck) was used as the catalyst for catalytic pyrolysis. The various catalyst dosages used for catalytic pyrolysis were 0.5 g, 0.6 g, and 0.7g for a batch size of 50g waste carry bags. The pyrolysis time was fixed as 2 hours for all sets of experiments.

2.1. Characterization

A Fourier Transform Infrared spectrometer (FTIR, Nicolet iS5, Thermo Scientific, USA) was used to characterize the waste carry bags and the oil obtained after pyrolysis. 32 scans were done with a resolution of 4 cm-1. The oil obtained after pyrolysis was analyzed using Reformulyzer M4 Hydrocarbon Group Type Analyser (PAC, USA). This analysis is useful to measure the n-/iso-Paraffin content and detection of possible aromatic or naphthenic components in the liquid product according to ASTM D6839.

2.2. Exergy analysis

Exergy analysis is a tool that can be used to isolate and improve process conditions that contribute to lower efficiency. In this method, together with energy and mass balances the exergy destruction or loss of work potential is determined across a system [26,27,28]. The higher the exergy destruction the lower is the thermodynamic efficiency of the system or process. Thus, if the system’s actual exergy decrease is much higher than the thermodynamic exergy decrease then there is room for improvement.
Exergy can be evaluated by doing exergy balance on a given process which may be continuous, semi-continuous, or batch. In our case the pyrolysis of LDPE was semi-continuous. Hence the exergy balance, around the flask as a control volume, can be written as:
Δ ξ Δ t = ξ o u t ξ d e s t r o y e d
Where ξ is the exergy in Joules. The extra destruction term is because conversely to entropy the exergy is always destroyed during the process.
The term on the left-hand side indicates the change in the exergy of the system with time. In our case, the time of exergy change lasted for 30 minutes when the LDPE was put in the flask and heated for 30 minutes.
It should be noted that the exergy change of the system, is due to heat transfer from the electric heater (130W) and the exergy of the LDPE. The exergy due to heat transfer is determined by the following formula:
ξ h e a t _ t r a n s f e r = ( 1 T o T ) Q
Where To is the environment temperature and T is the temperature of the heating source.
Now the first term on the right-hand side is the exergy of the pyrolysis products leaving the flask and the second term on the right-hand side is the exergy destroyed during the process.
In the pyrolysis process where nuclear, magnetic, and surface tension effects are unavailable, the exergy associated with mass ‘ ξ ‘ is usually taken as the sum of kinetic, potential, physical, mixing, and chemical exergies [29].
ξ = ξ k e + ξ p e + ξ p h + ξ c h + ξ M
In LDPE pyrolysis the changes in kinetic, potential, and mixing exergies can also be ignored [30]. The contributions of physical and chemical exergies are important because of significant temperature and decomposition reactions effects and are discussed next.

2.2.1. Physical exergy ( ξ ph )

The physical exergy is written as the exergy due to temperature and pressure effects and is determined as follows:
ξ T , P p h = ( h h d ) ( s s d ) T d
Where h is the enthalpy, s is the entropy and d represents the dead state of 25oC and 1 atm.

2.2.2. Chemical exergy ( ξ ch )

The exergy of chemical compounds according to their standard states or the most stable states available is defined as the chemical exergy. Here the stable states are referred to as species available at normal temperature and pressure in air, seawater, or lithospheric solids [31]. In a reaction, if the affinity of reactants and products are known and it is done under standard conditions the calculation of chemical exergy is easy. If the chemical exergy of a chemical species is calculated under standard conditions, it can be utilized to calculate the chemical exergy at other temperatures and pressures.
The chemical exergy of organic molecules, as is the case of LDPE pyrolysis, can be estimated by using the correlations available in the literature [32]. We used the correlation developed by Rant [33].

2.2.3. Process exergetic/thermodynamic efficiency

Exergetic efficiency can be defined in several ways. It is dependent on raw materials, fuel, and product exergies as envisaged in the current work [34]. The fuel exergy is important and it is the measure of product exergy. It includes heat transfer thereby helping to increase the temperature of the system studied. On the other hand, product exergy comprises exergies associated with all the streams leaving the system such as gas, oil, wax, and carbon residue. Thus we write exergy efficiency or second law efficiency as follows [35]:
λ I I = E x e r g y   R e c o v e r e d E x e r g y   E x p e n d e d = E x e r g y   o f   P r o d u c t s E x e r g y   ( R a w   M a t e r i a l + H e a t ) = 1 E x e r g y   D e s t r o y e d E x e r g y   E x p e n d e d

3. Results and discussion

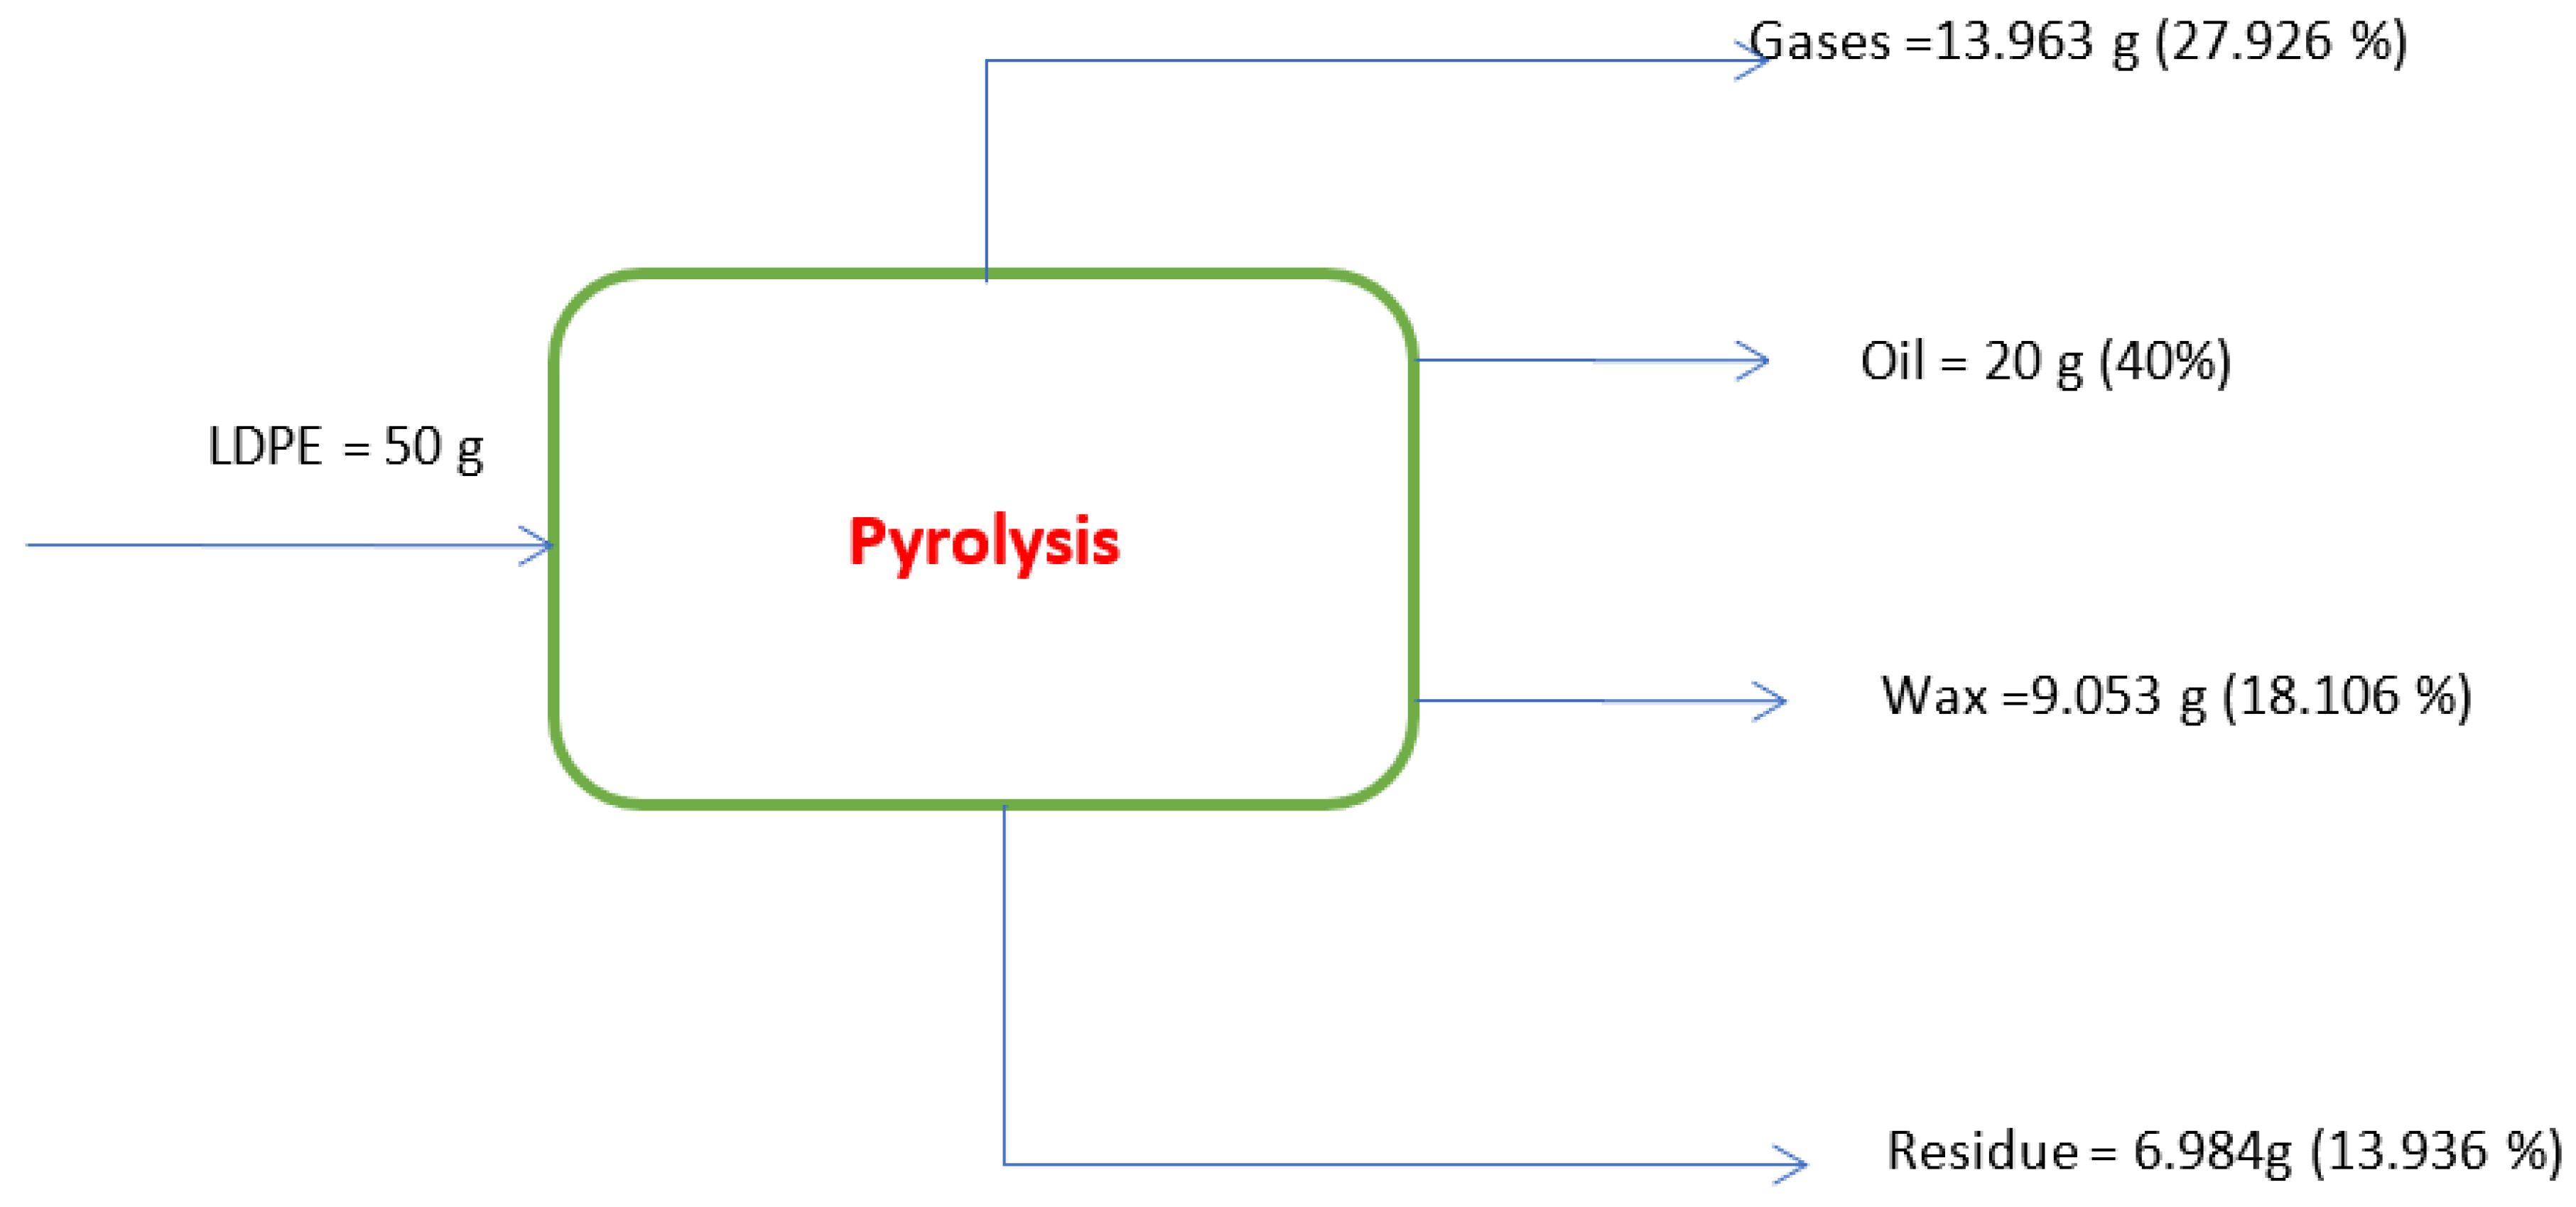
The pyrolysis process was carried out with and without a catalyst. Initially, the thermal pyrolysis of 50g of the waste plastic yielded about 20 g of pyrolysis oil, 9.053 g of wax, and about 6.984 g of residue remained inside the round bottom flask. This shows that about 13.963 g were the losses, which was the gaseous product (not collected) of the pyrolysis. The mass balance for the process is shown in Figure 3.
To understand the effect of ZnO as a catalyst for the pyrolysis process, experiments were carried out under similar conditions of thermal pyrolysis, with three different catalyst dosages (0.5g 0.6g, and 0.7g). The thermal process was compared with the catalytic process and the products obtained as a percentage are given in Table 1. It can be seen that the highest yield of pyrolysis oil (67.31%) was obtained with a catalyst dosage of 0.6 g with little wax formation. Similar results of little wax formation are reported by others also. Uthpalani et al used recycled LDPE and PP and converted them into oil through a batch reactor [36]. They reported that LDPE produced a small amount of wax while PP resulted in no wax formation. Another recent report also showed the elimination of wax formation while using a catalyst for the conversion of waste plastics to oil through pyrolysis [37].

3.1. FTIR spectroscopy

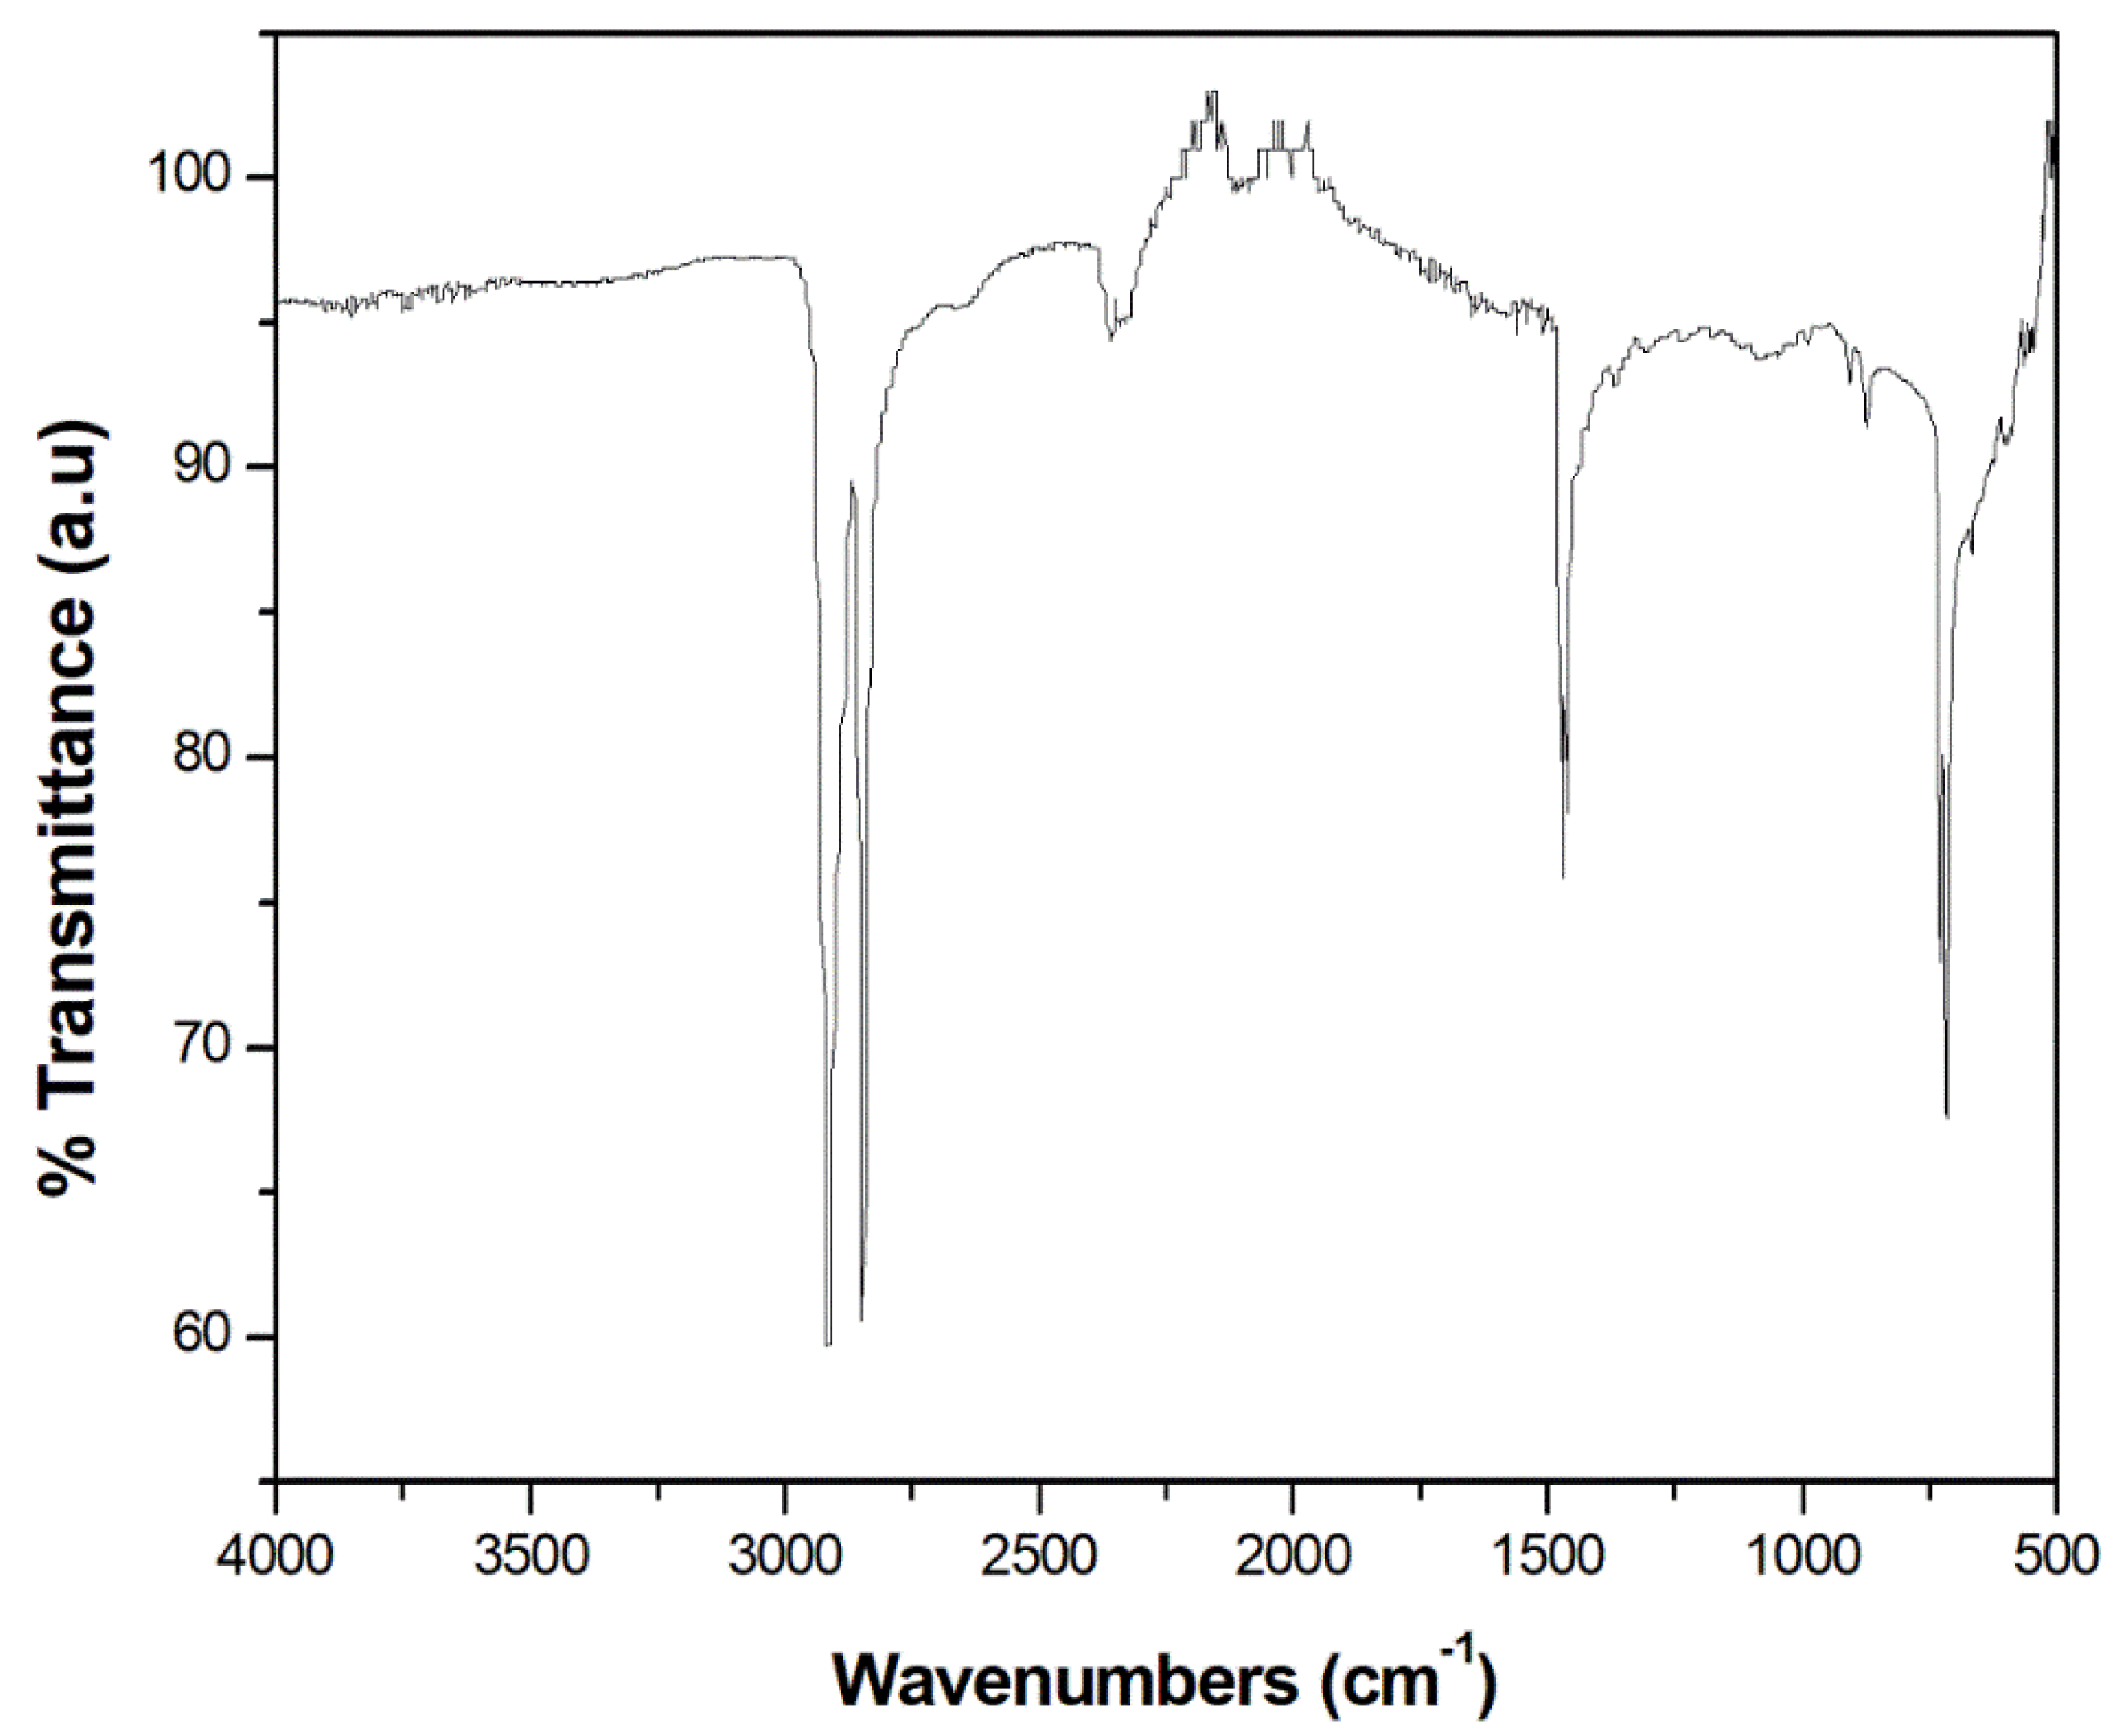
FTIR is a powerful characteristic tool to understand the functional groups present in plastics as well as the oil produced from them. The IR spectra for the waste plastic carry bares are shown in Figure 4. The spectra show the characteristic peaks for polyethylene such as asymmetric C-H stretch of methylene groups at 2910 cm-1 and symmetric stretch of methylene groups at 2850 cm-1. The peak corresponding to CH2 rocking can be seen at 710 cm-1, whereas the peak at 1471 cm-1 can be attributed to the bending vibrations of the methylene group in polyethylene.
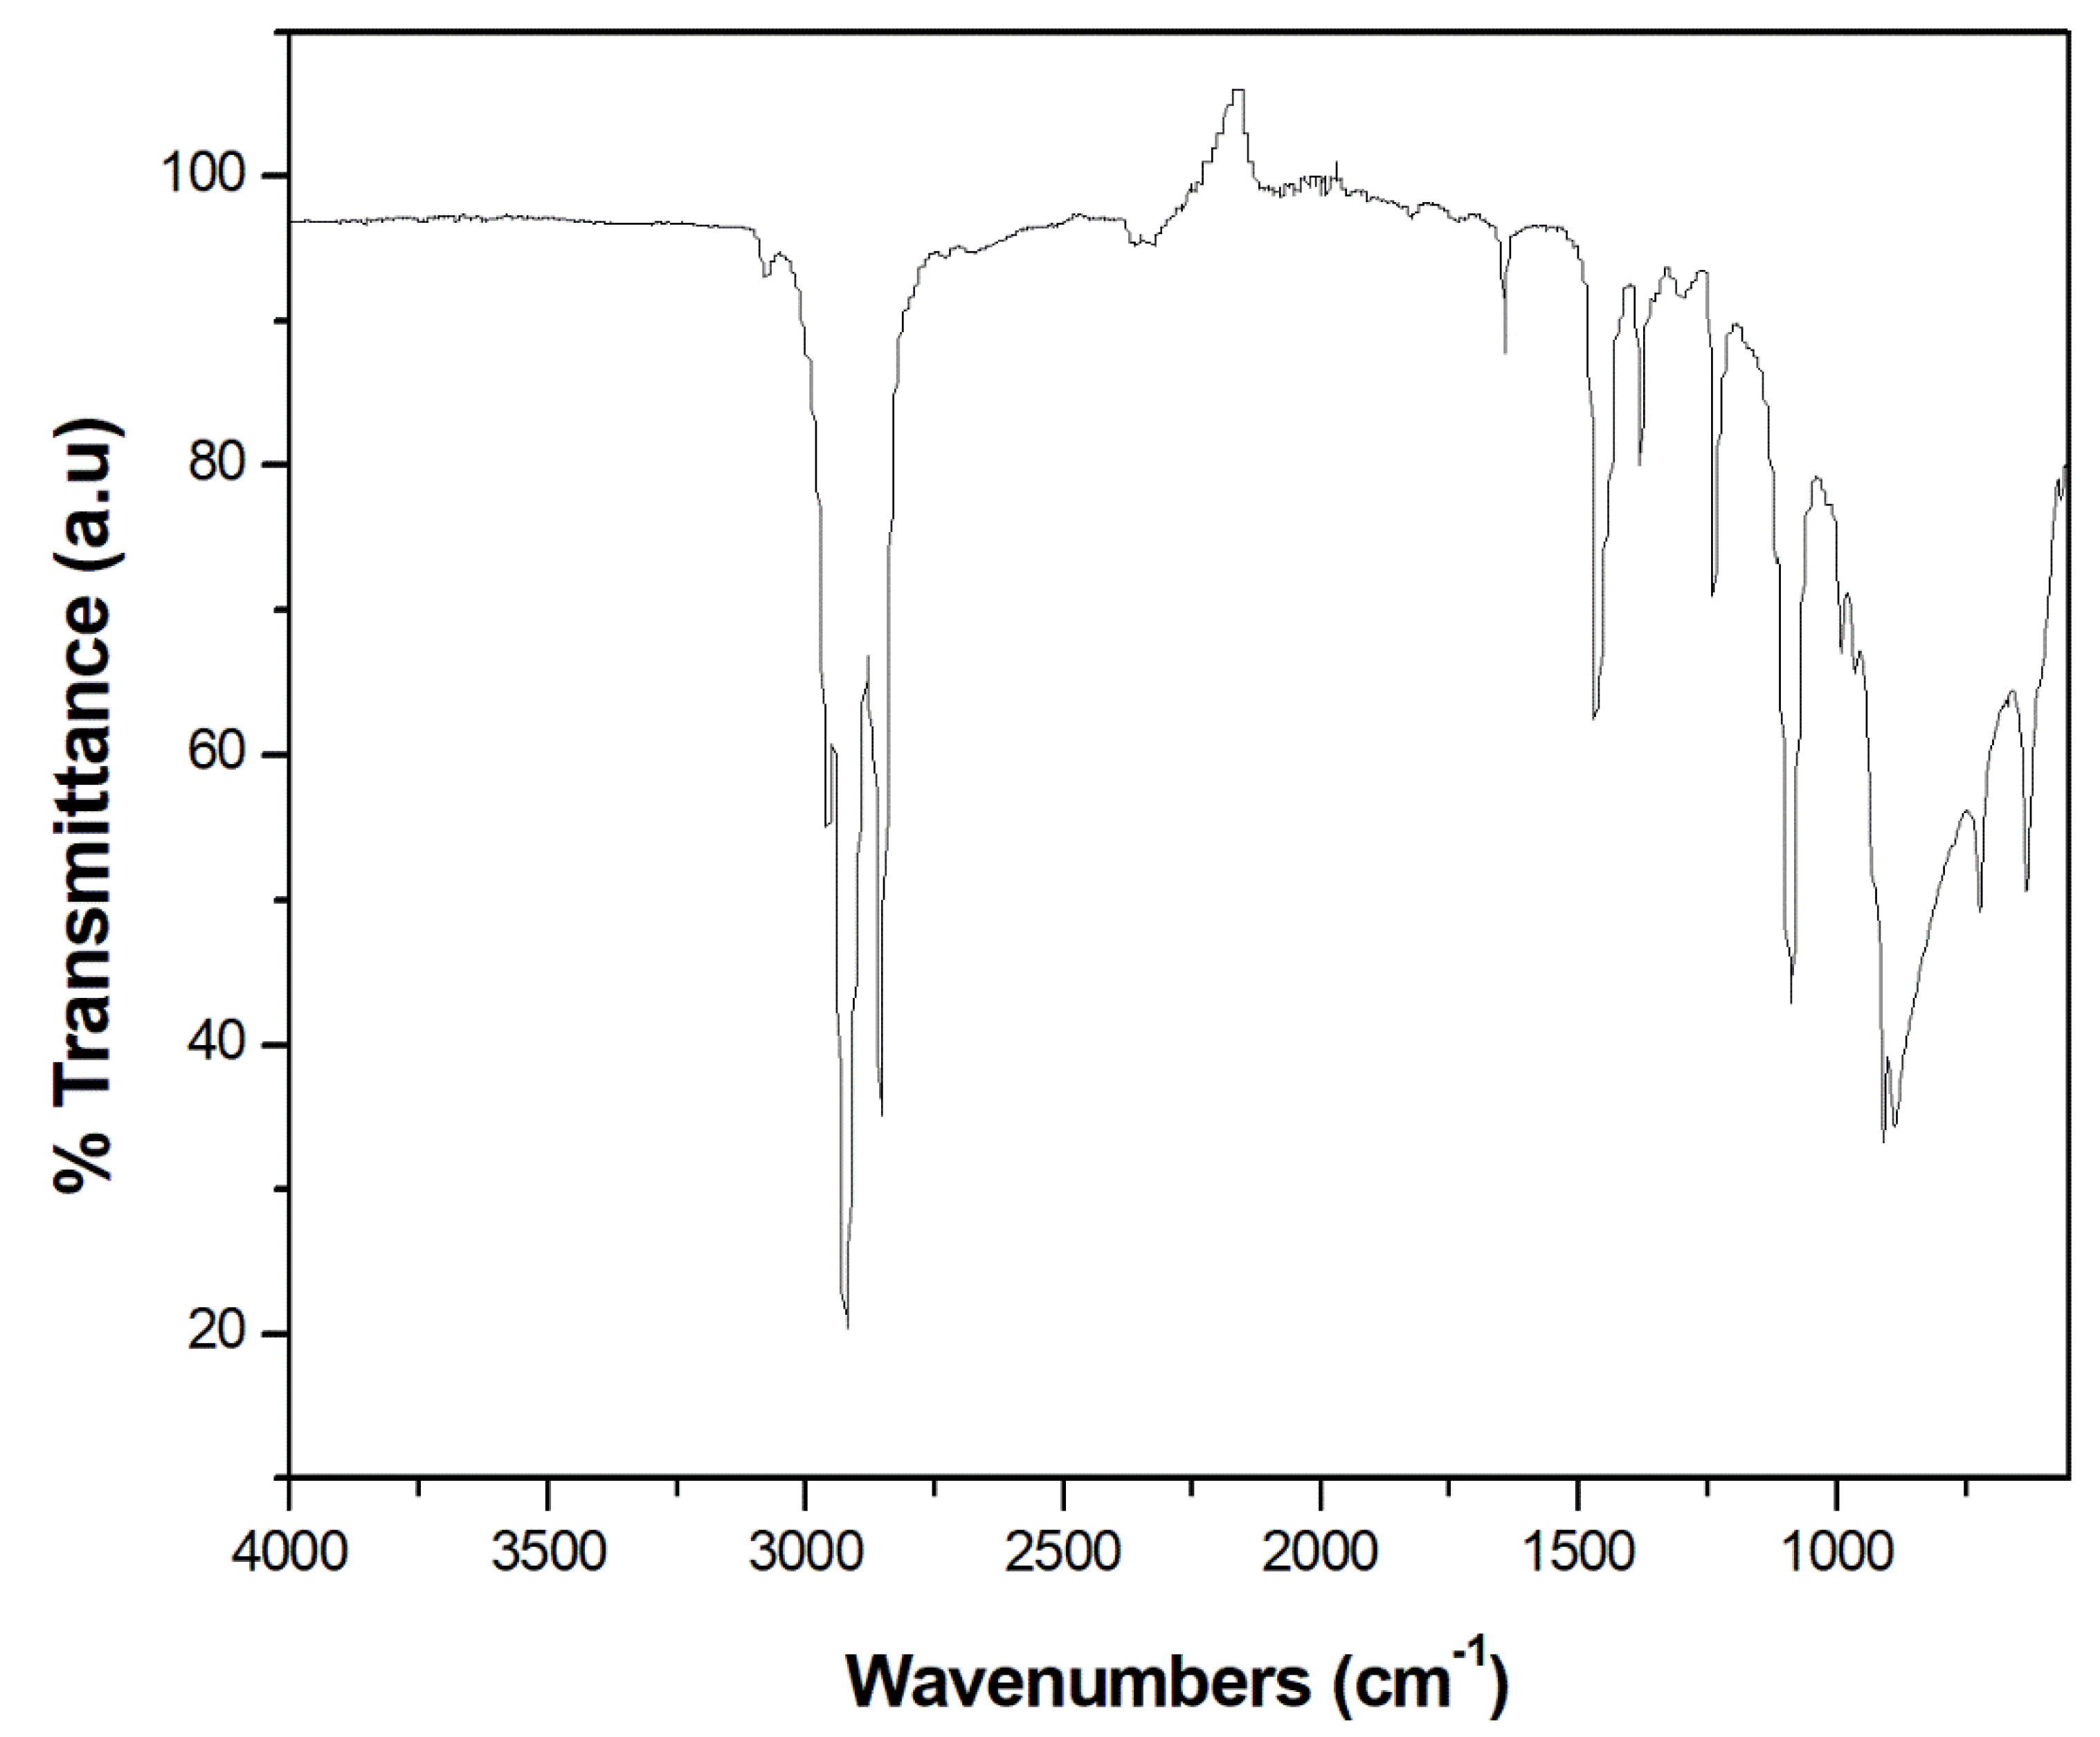
The IR spectra of the pyrolysis oil obtained with 0.6g of catalyst for the pyrolysis process are shown in Figure 5. The different peaks and functional groups assigned are given in Table 2. The results showed strong peaks at wavelengths around 2956, 2852, 2922, and 2954 cm−1 due to C–H stretching belonging to alkanes. The bands around 1465 cm−1 correspond to the C-H bending vibration of the methyl groups present in alkanes. The presence of aromatic compounds is confirmed by the presence of the absorption bands at 630 cm−1, 721 cm−1, and 887 cm−1 which can be attributed to C-H out-of-plane bending vibrations [37]. –C-H out-of-plane bending vibration of vinyl groups or alkenes is shown at 908 cm−1 [38]. From the peaks assignment, it is clear that the product obtained by the pyrolysis consists of low molecular weight alkanes most probably in the diesel and gasoline range with some alkenes and aromatic compounds.

3.2. Oil parameters

The key findings from hydrocarbon group type analysis (as per Test Methods ASTM D5443, ASTM D6839) are;
🠶
Calorific Value: 43150 J/kg
🠶
Carbon Ratio: 86.75 %
🠶
Hydrogen Ratio: 13.25 %
🠶
Research Octane No. : 80.41
🠶
Motor Octane No. : 66.84
The calorific value (43150 J/kg of the pyrolysis oil obtained in the present investigation is closely matching with the value reported by other research groups [39,40]. The carbon and hydrogen ratios of the oil are 86.75 and 13.25% respectively. Al-Salem et al reported recently that the pyrolysis of LDPE around 6000C yields similar results [41]. In the present investigation, the experiments were done at a relatively lower temperature. The research octane number (RON) and motor octane number (MON) of the pyrolysis oil were 80.41 and 66.84 respectively. From the FTIR studies it is concluded that the majority of the compounds obtained were of linear saturated materials. Therefore, the reported values of RON and MON are matching. Moreover, the composition summary of various hydrocarbons present in the oil is given in Table 3.
The analysis shows that saturates and aromatics are the major components present in the oil product obtained from pyrolysis.

3.3. Exergy analysis

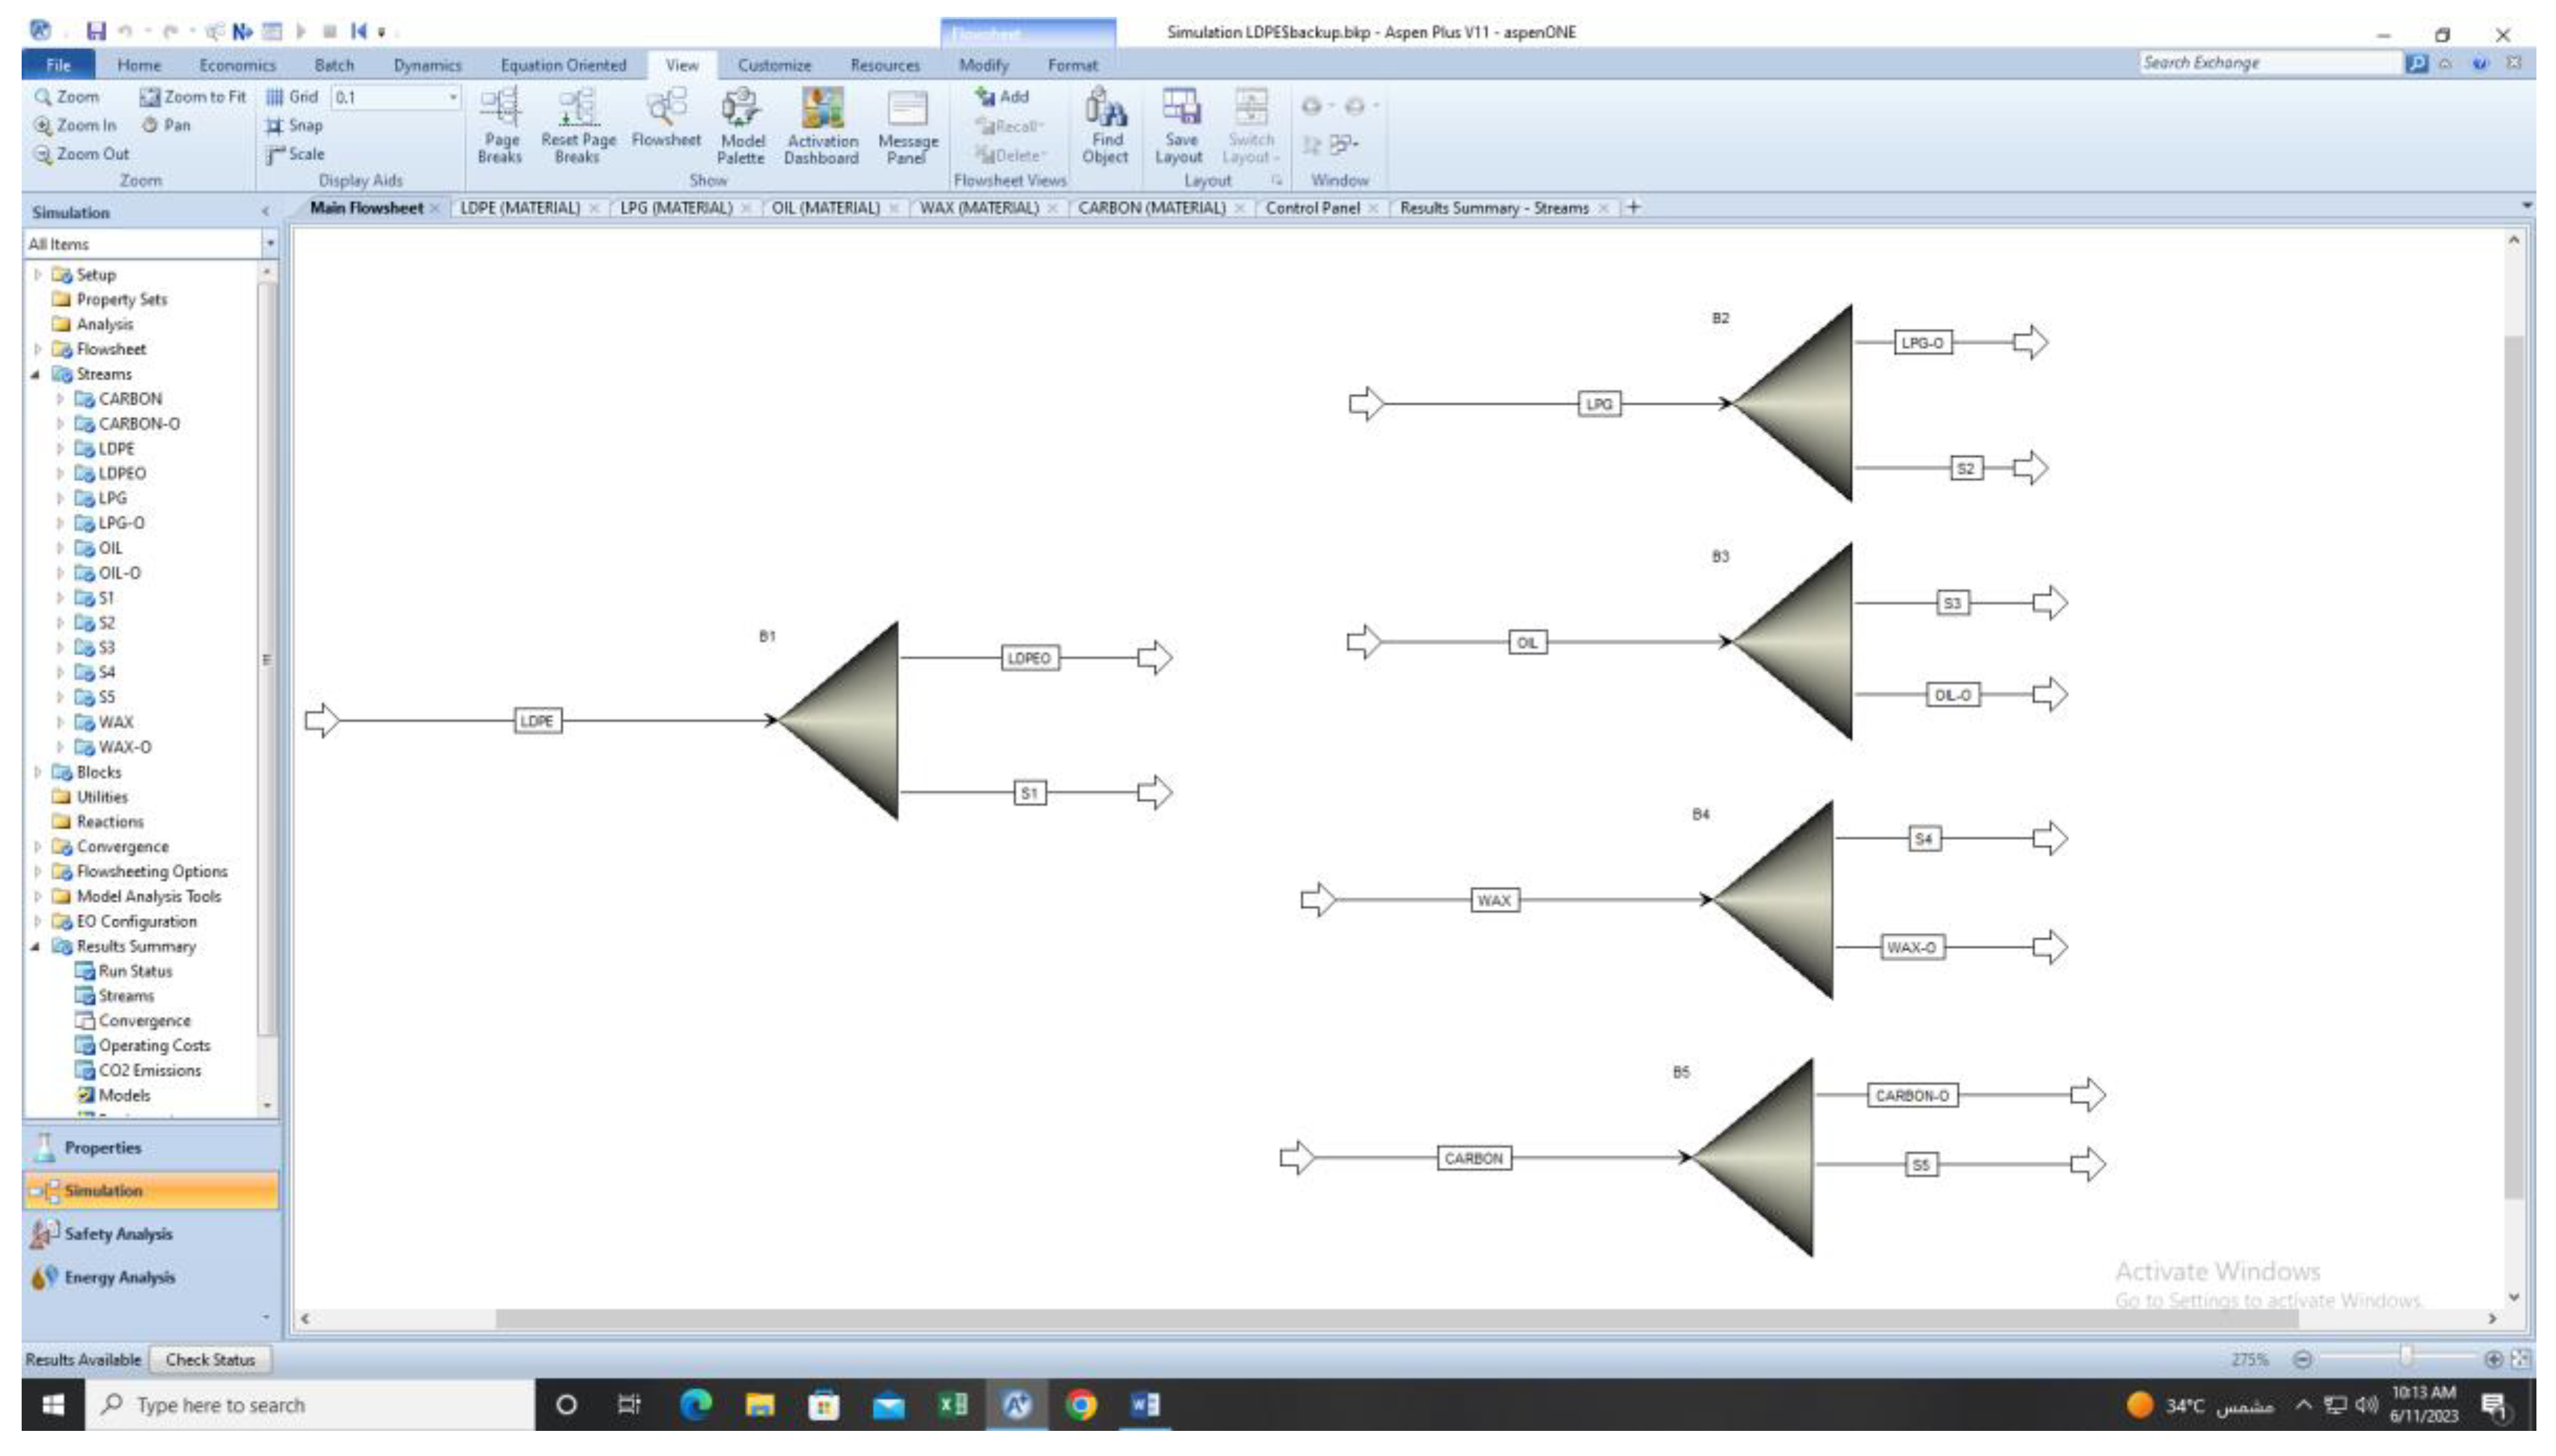
We used ASPEN Plus v.11 to calculate the physical exergy of the raw material LDPE and the products LPG, OIL, Wax, and Carbon Residue. The thermodynamic method used was Peng-Robinson. In ASPEN Plus stand-alone streams cannot be processed without linking them to an equipment. To circumvent this issue we connected the streams to a splitter with 0 split fraction so that the input and one of the output streams remained the same (Figure 6).
The calculated physical and chemical exergies for each component at different catalysts amounts are given in Table 4. As far as chemical exergy is concerned we used the correlations developed by Rant [33]. He correlated chemical exergy to the lower heating value (LHV) of the compound. It should be noted that the physical exergy and the chemical exergy values of LDPE and the electric heater remained fixed and were estimated to be 1.65 J, 2.23x10⁶, and 0.15x10⁶ J respectively. The exergy values for the catalyst have been ignored.
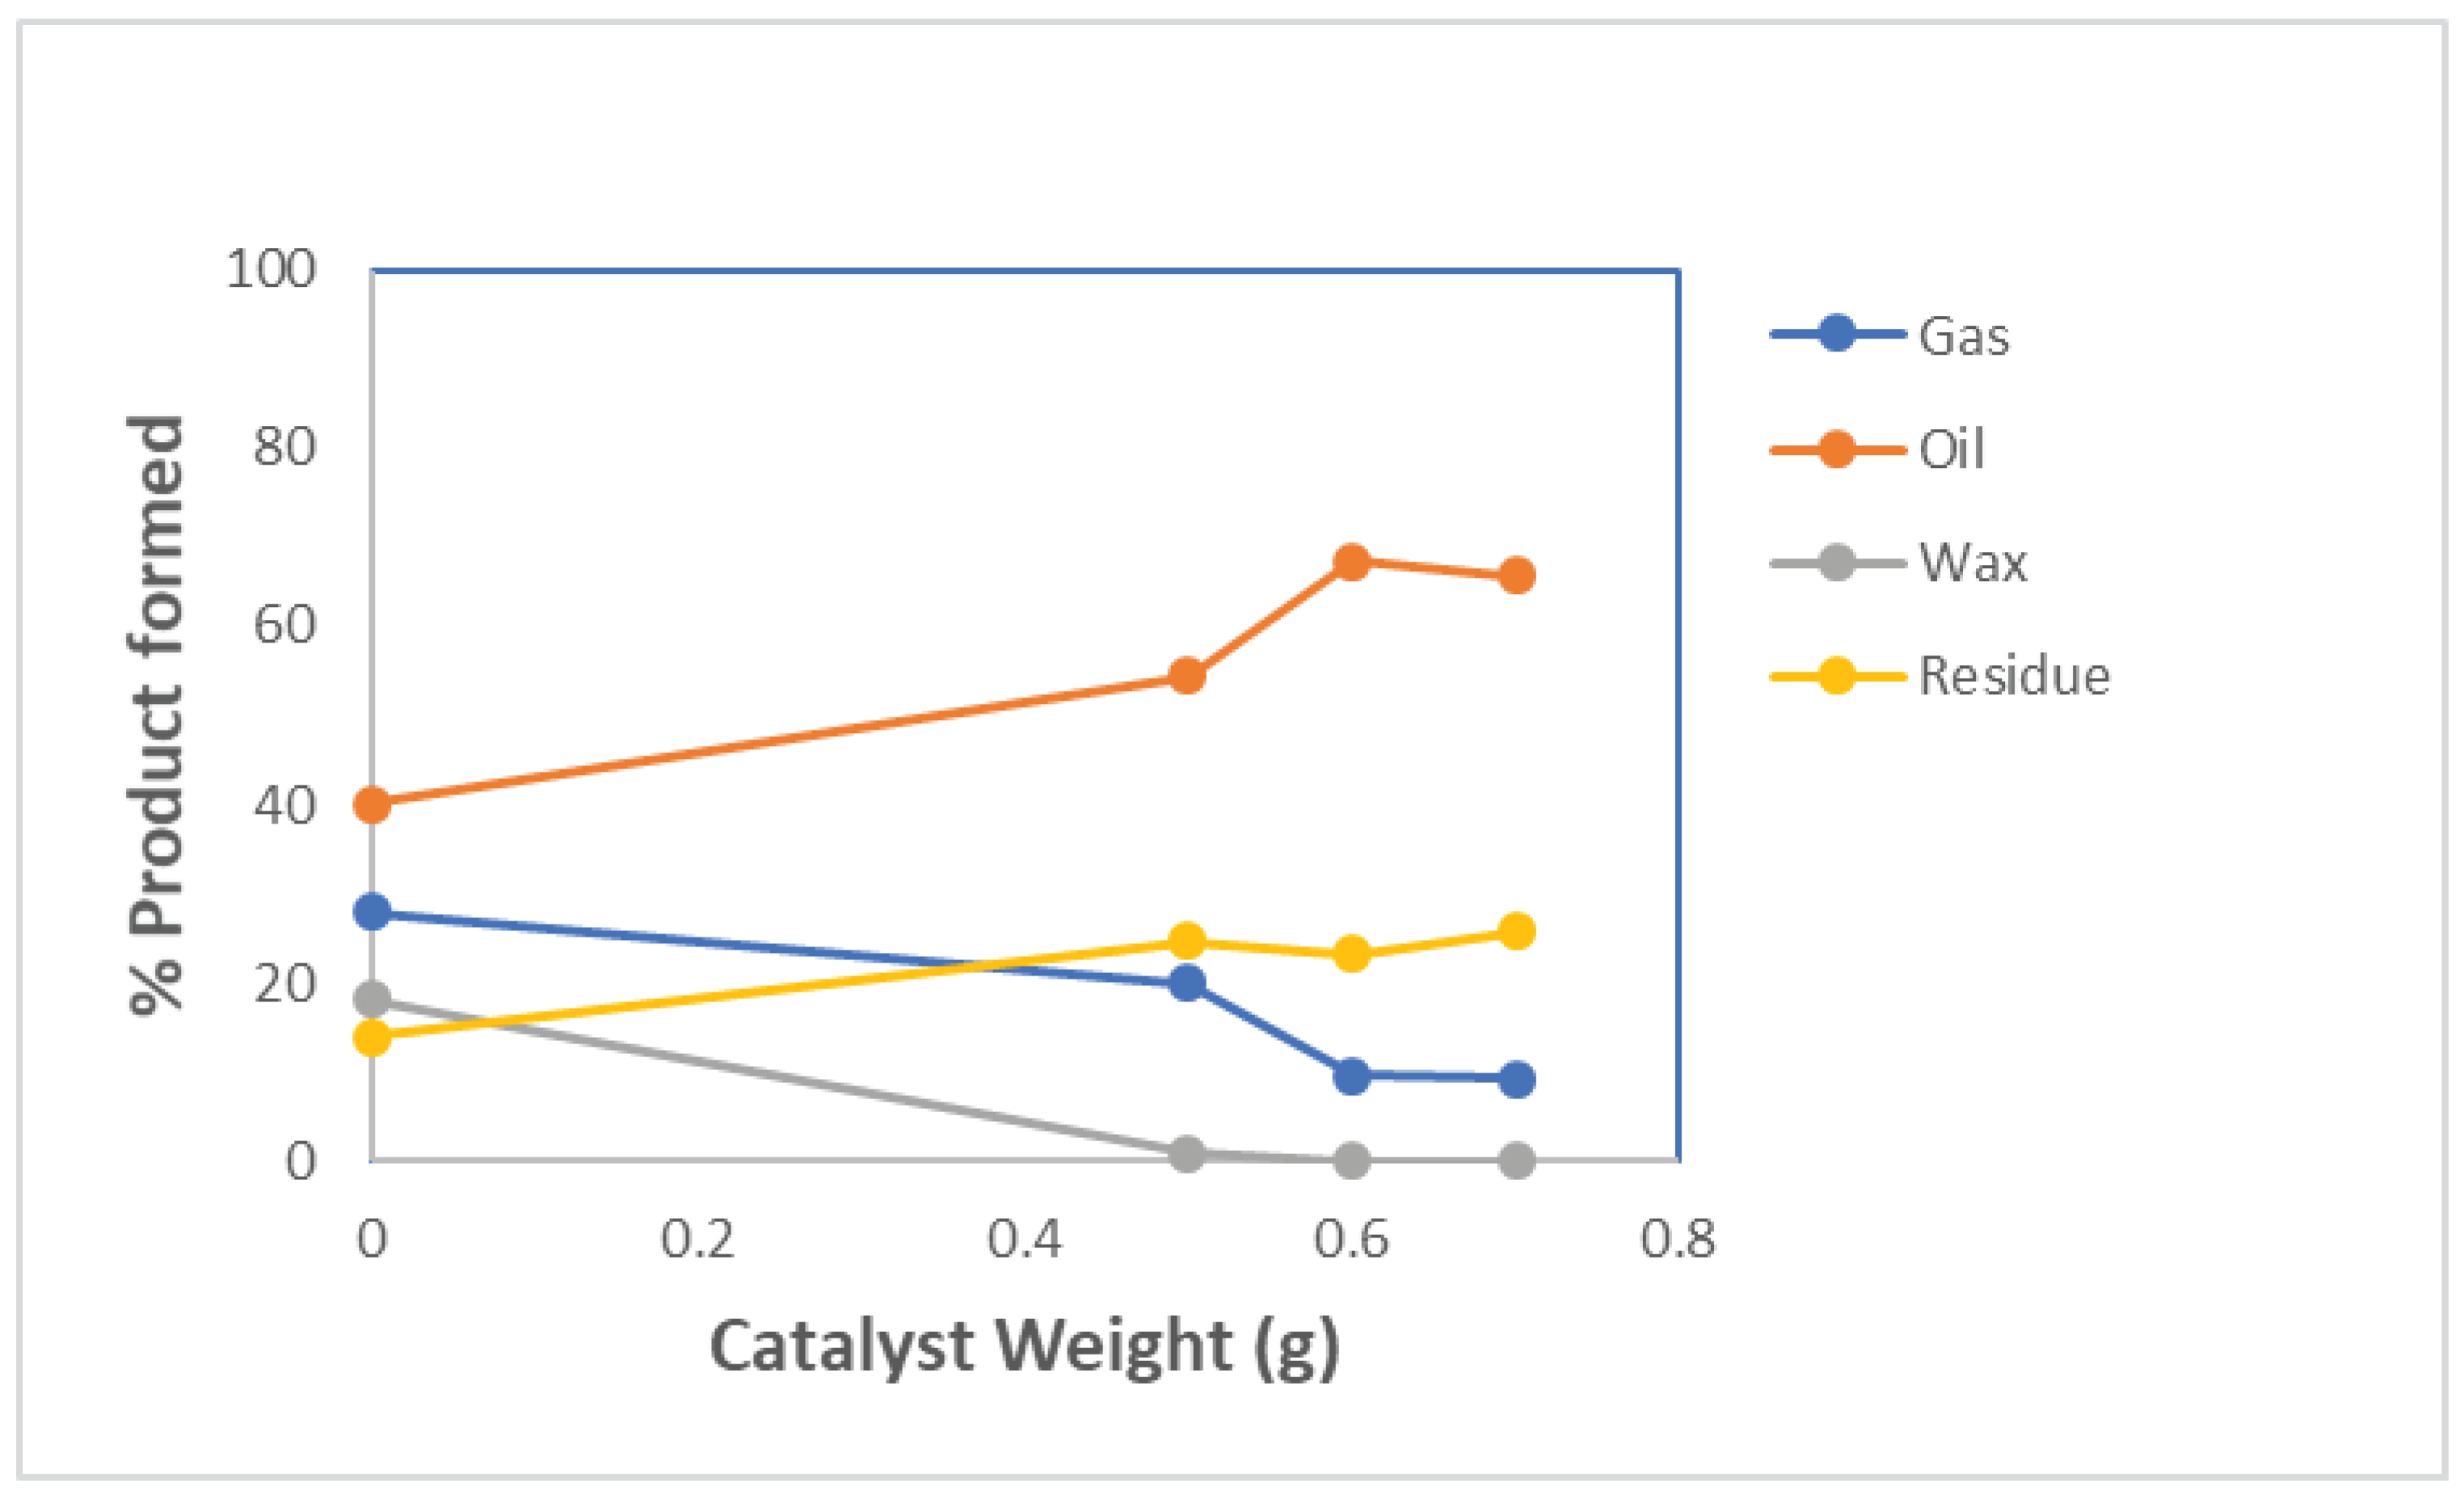
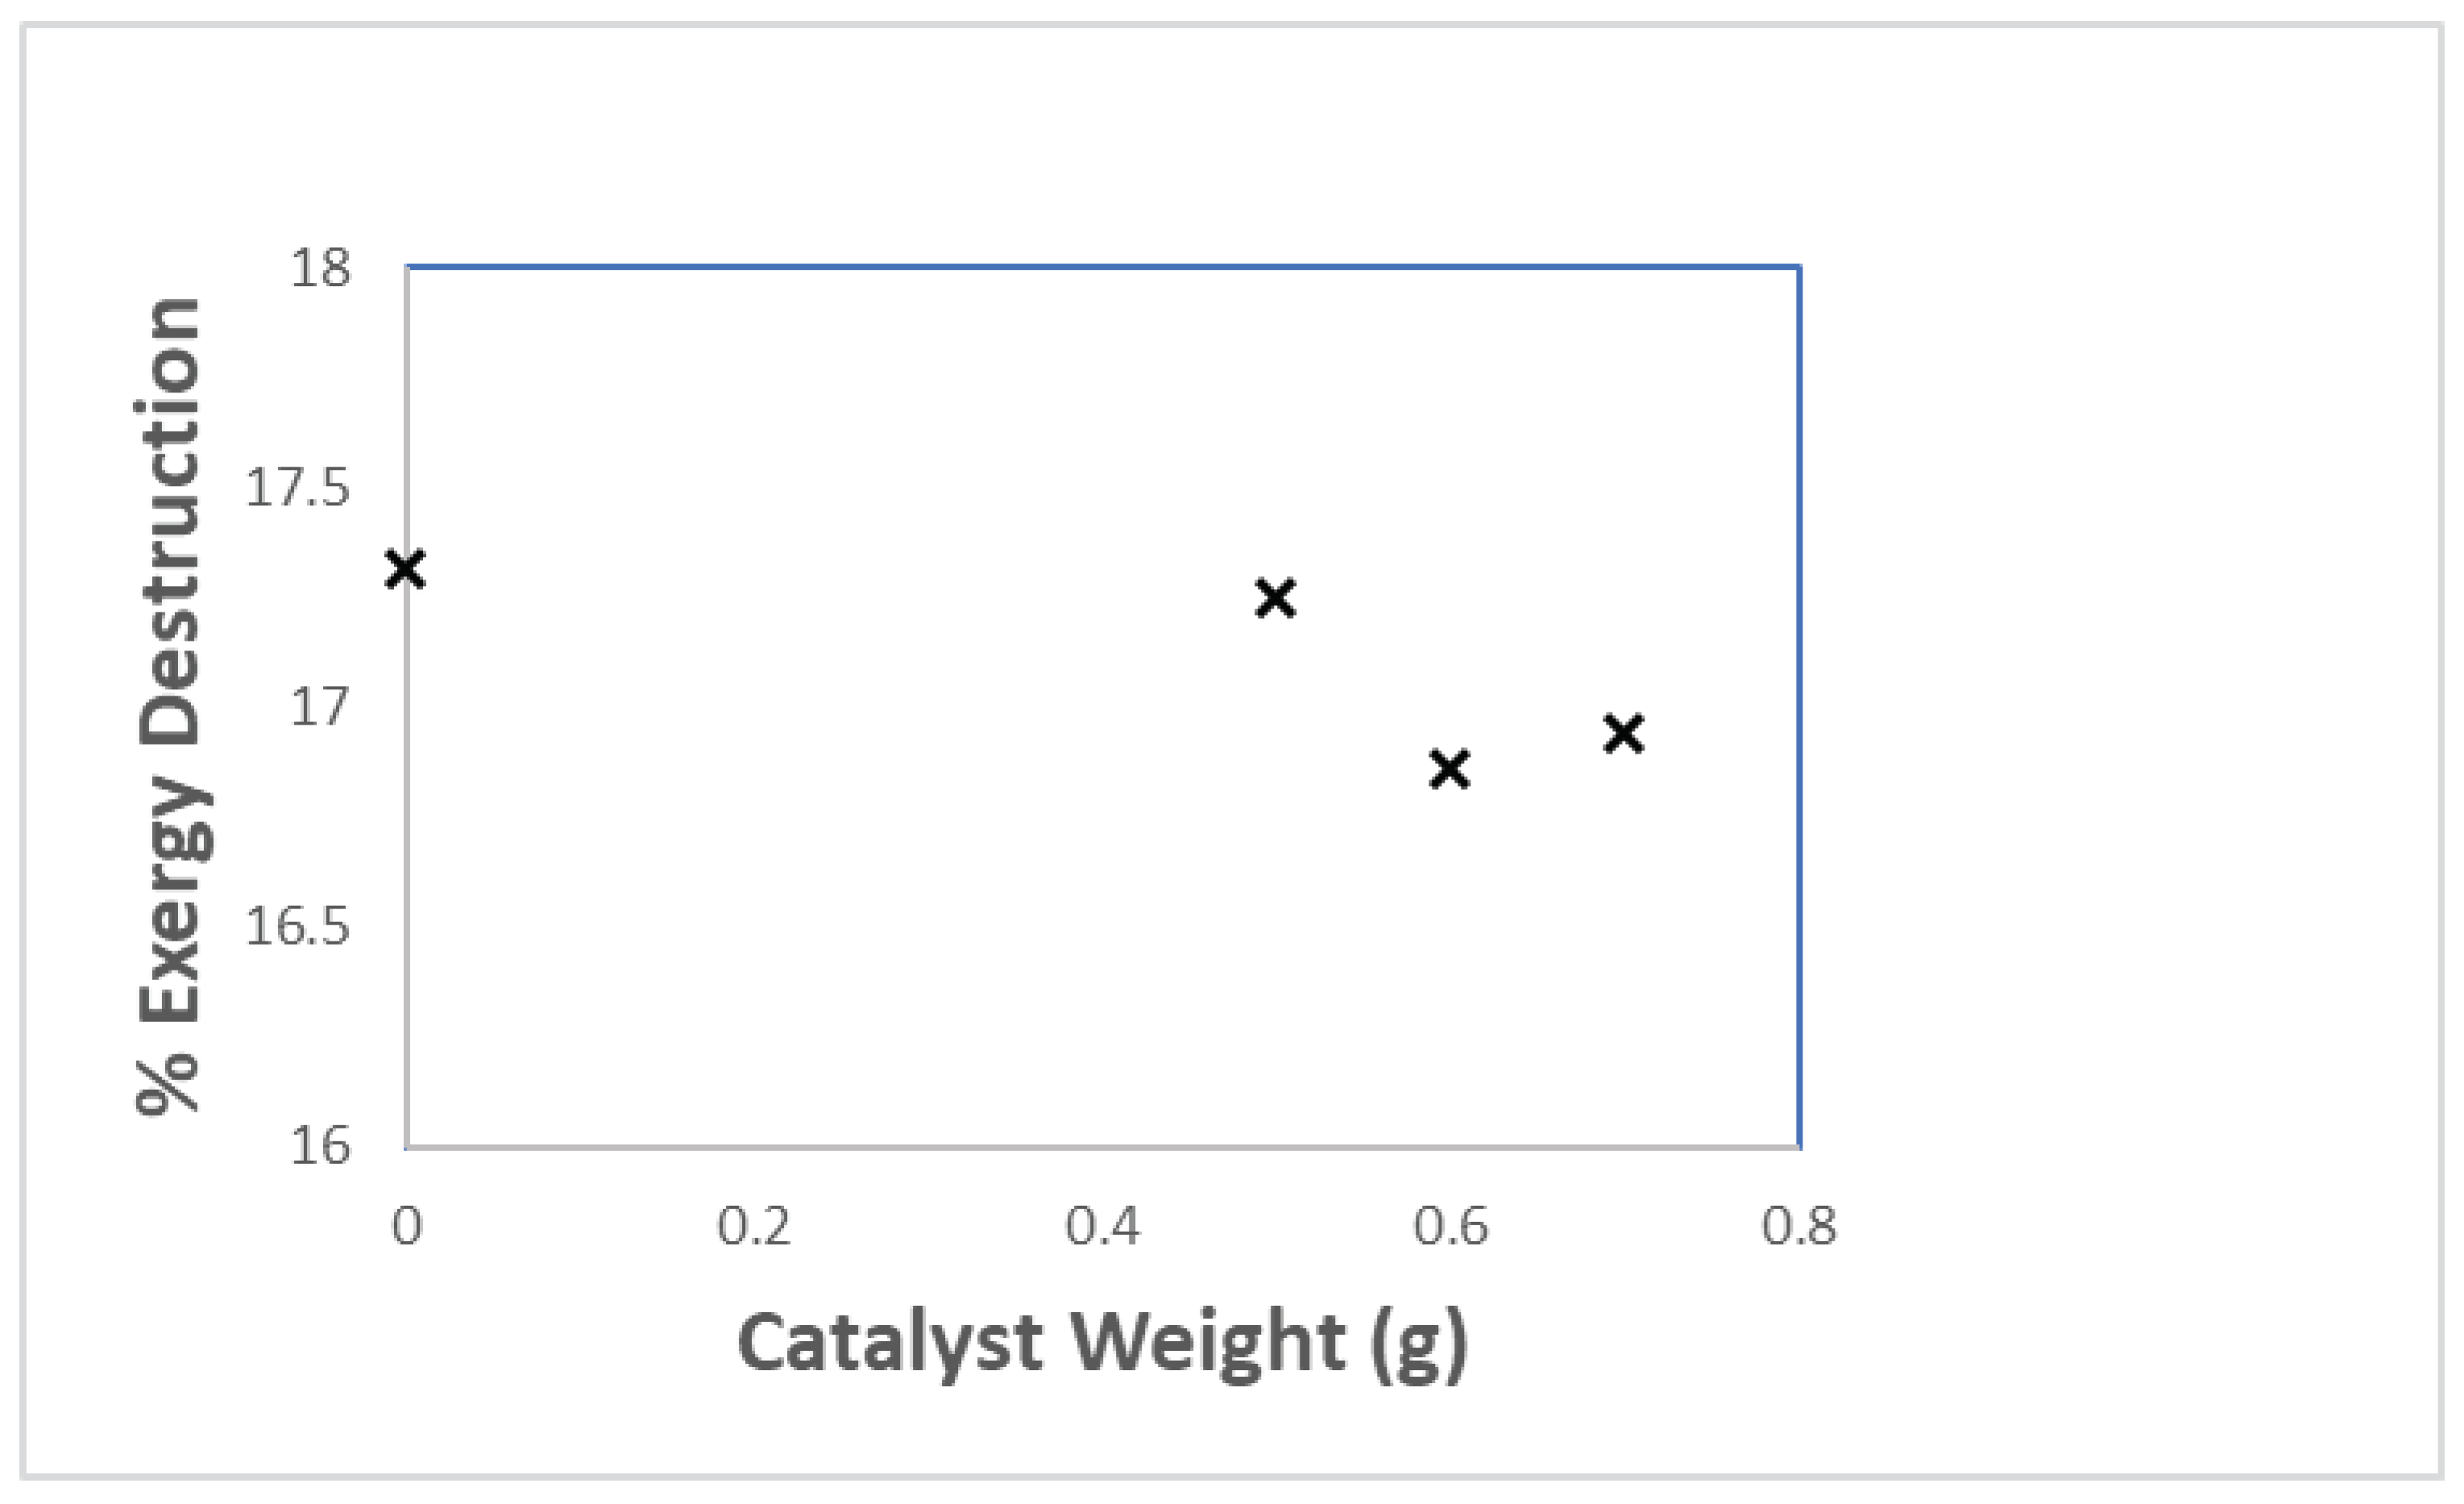
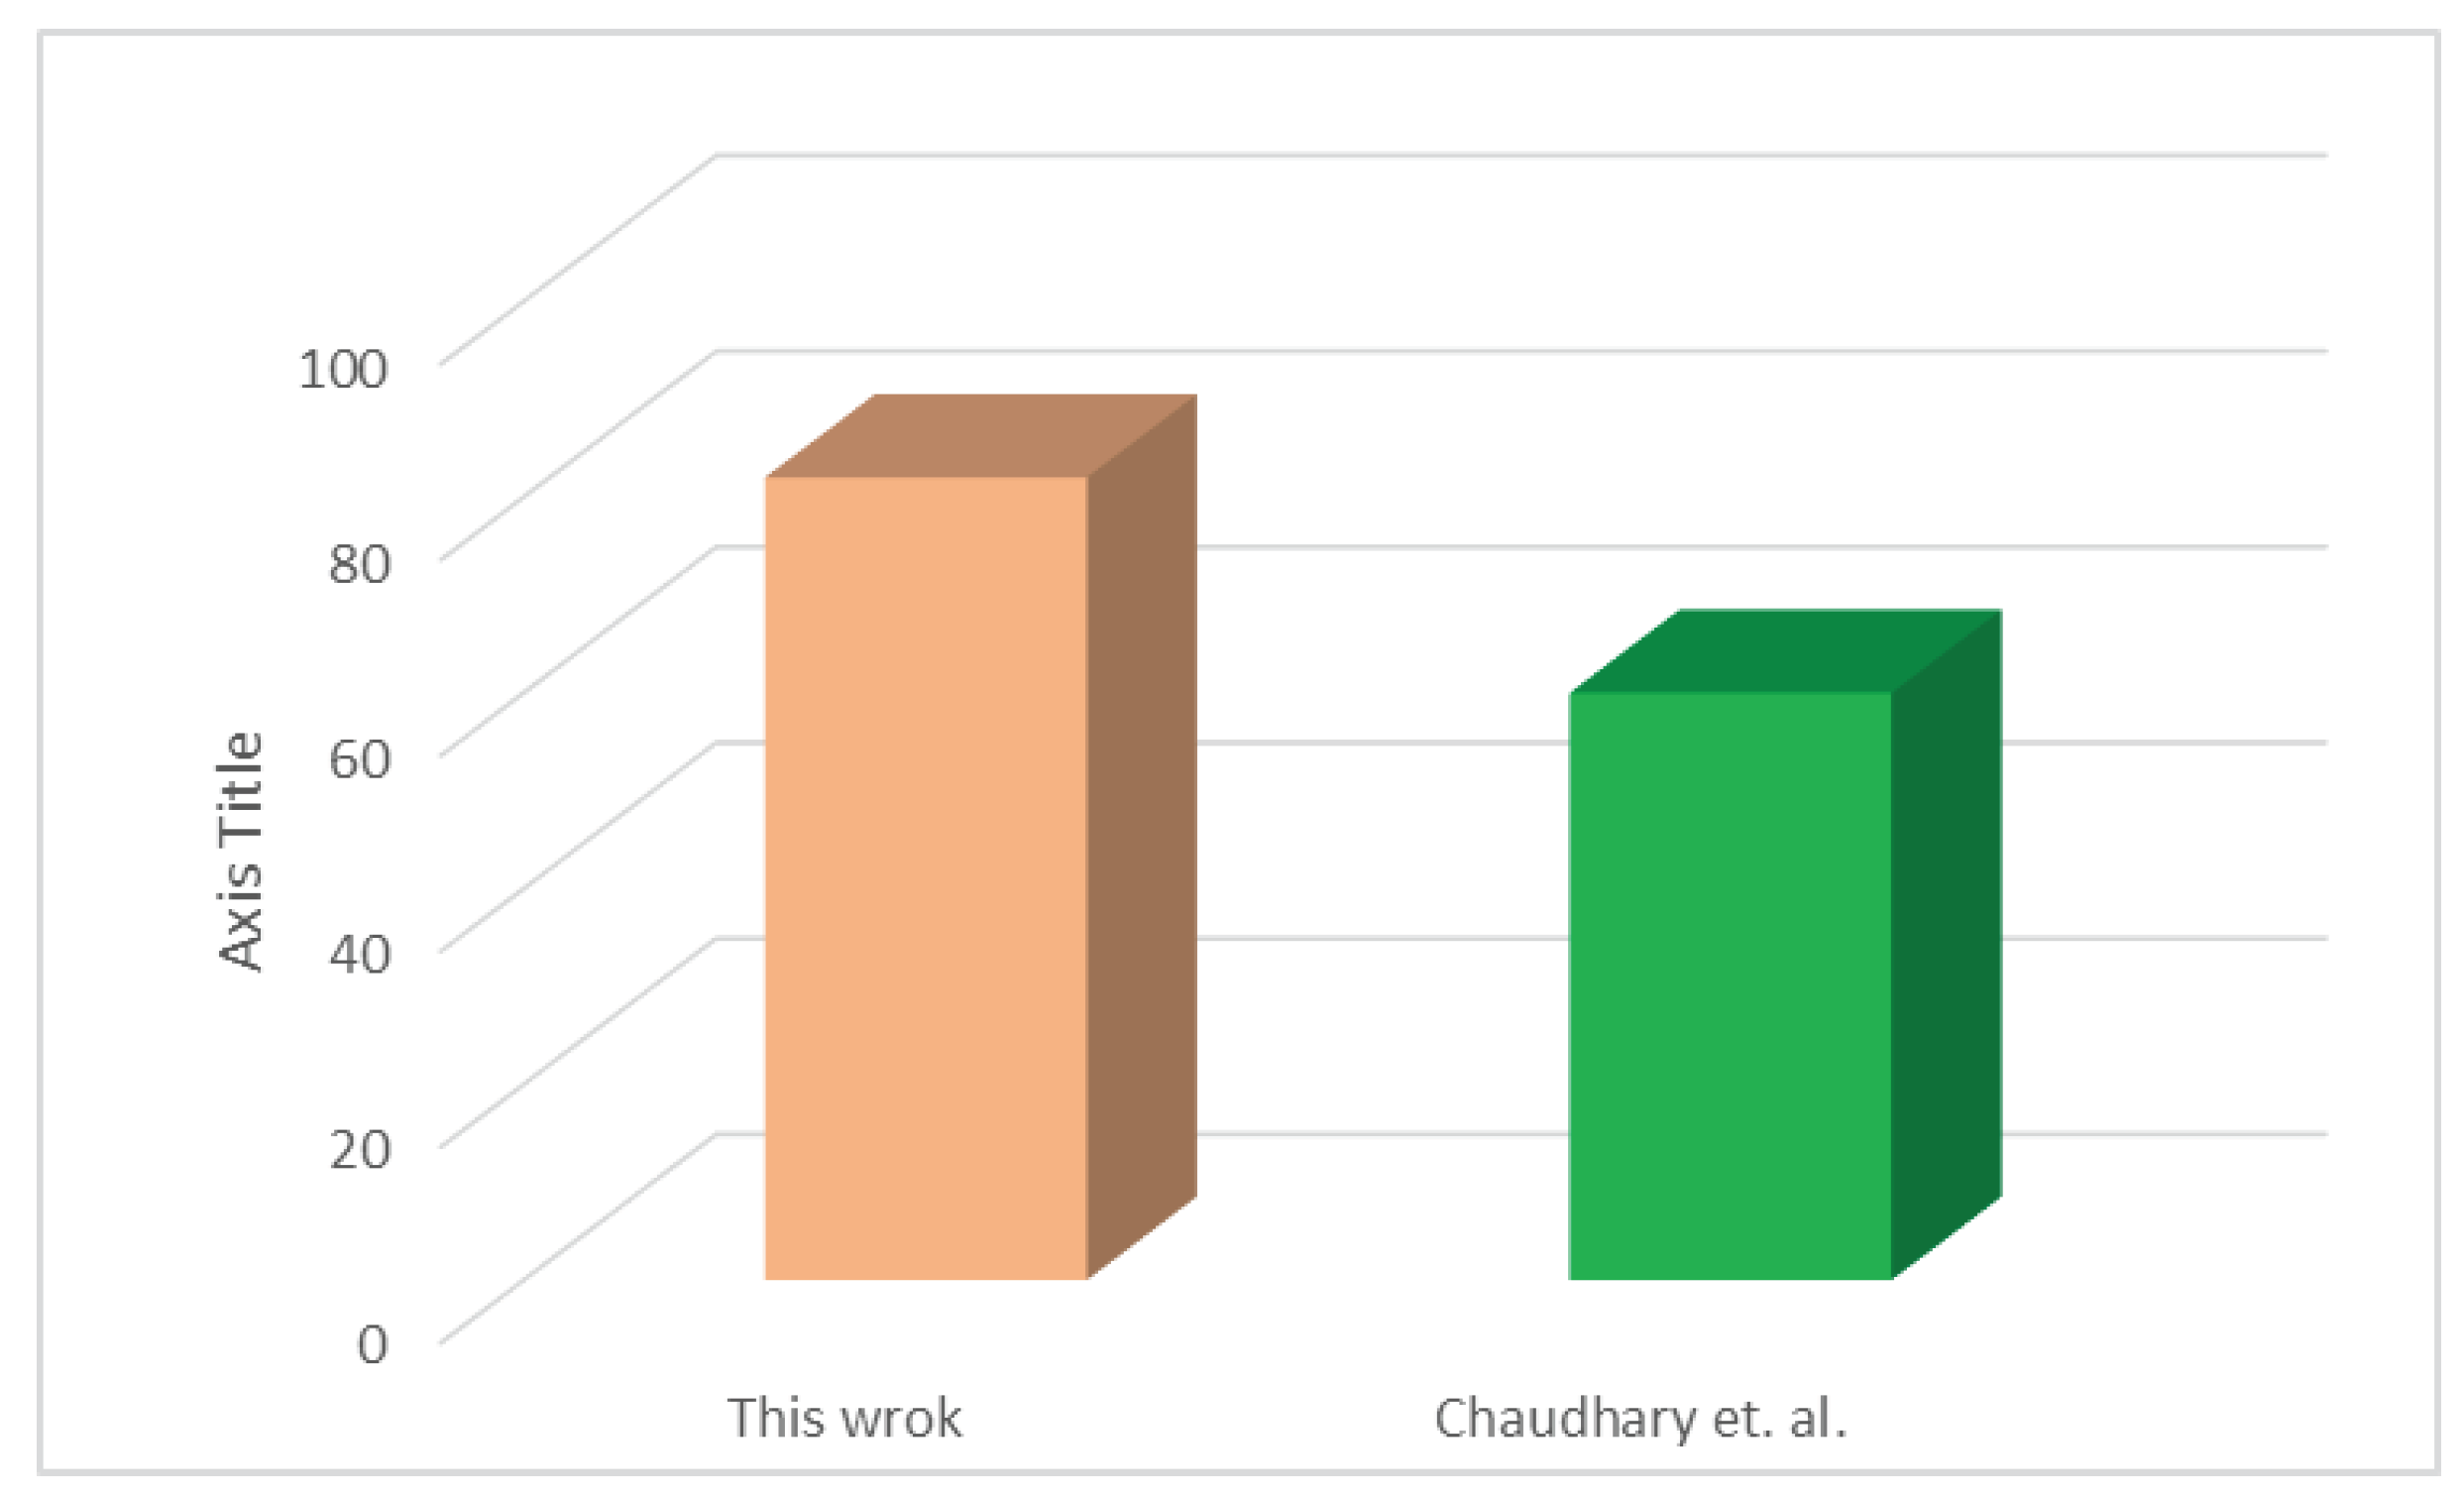
The product distribution concerning catalyst amount at 300oC is shown in Figure 7. As it can be seen that higher amount of catalyst ZnO favors the formation of oil and residue whereas the production of wax and gas decreases. Figure 8 shows exergy destruction as a function of catalyst weight. A slight increase in the exergy efficiency as catalyst weight is increased should be noted. It may be because, at higher catalyst amounts, products with higher exergy values are formed. Our calculations show exergy efficiency to be around 82% compared to 60% reported by Chaudhary et al., [13] at 3000C (see Figure 9). This might be due to the different catalysts used. This indicates that ZnO is more energy efficient than MgO, ZSM-5, and activated charcoal. However, further experiments at different temperatures are needed to validate our argument.

4. Conclusion

The described experiments and the results is a small and significant step to curb the menace of plastic solid wastes which are degrading the environment and human life worryingly and to utilize them for generating low-cost fuel for transportation and other applications. The reverse of polymerization is a challenging area of research and so far no noteworthy results were reported by the scientific community. This work adopted a catalytic pyrolysis technique with zinc oxide for the decomposition of low-density polyethylene into small fractions. The obtained products were characterized by various techniques like spectroscopy and composition analysis. The technique achieved the conversion of plastic into 67% of oil. The process has to be streamlined to limit the production of wax and gas so that the efficiency could be increased to 90% or so. The exergy analysis revealed that compared to other catalysts ZnO shows improved process efficiency. However, further experiments at different temperatures are required to validate our claim.

Funding

This research did not receive any specific grant from funding agencies in the public, commercial, or not-for-profit sectors.

Conflicts of Interest

The authors declare that they have no known competing financial interests or personal relationships that could have appeared to influence the work reported in this paper.

References

  1. Worldbank The world bank.
  2. Nanda, S.; Berruti, F. Municipal solid waste management and landfilling technologies: a review. Environ. Chem. Lett. 2021, 19, 1433–1456. [Google Scholar] [CrossRef]
  3. Battsetseg, B.; Sukhbaatar, S.; Oyunchimeg, T. CURRENT STATUS AND PROSPECTS OF PLASTIC AND PLASTIC BAG WASTE RECYCLING.
  4. Moon, Y.; Shim, W.J.; Han, G.M.; Jeong, J.; Cho, Y.; Kim, I.-H.; Kim, M.-S.; Lee, H.-R.; Hong, S.H. What type of plastic do sea turtles in Korean waters mainly ingest? Quantity, shape, color, size, polymer composition, and original usage. Environ. Pollut. 2022, 298, 118849. [Google Scholar] [CrossRef] [PubMed]
  5. Durak, S.G. Investigation and evaluation of the effect to environmental pollution of plastic shopping bags. Türk Bilim. Derlemeler Derg. 2016, 20–24.
  6. Suleman, R.; Amjad, A.; Ismail, A.; Javed, S.; Ghafoor, U.; Fahad, S. Impact of plastic bags usage in food commodities: An irreversible loss to environment. Environ. Sci. Pollut. Res. 2022, 29, 49483–49489. [Google Scholar] [CrossRef] [PubMed]
  7. Khan, Z.A.; Chowdhury, S.R.; Mitra, B.; Mozumder, M.S.; Elhaj, A.I.; Salami, B.A.; Rahman, M.M.; Rahman, S.M. Analysis of industrial symbiosis case studies and its potential in Saudi Arabia. J. Clean. Prod. 2023, 385, 135536. [Google Scholar] [CrossRef]
  8. AL-KALALI, A.; AL-AHMADI, M.A.; AL-BASSAM1, A.M.; RIYADH, S.A. MUNICIPAL SOLID WASTE MANAGEMENT IN SAUDI ARABIA: DRIVERS FOR IMPLEMENTING A CIRCULAR ECONOMY APPROACH. Integr. Waste Manag. Circ. Econ. 2023, 139. [Google Scholar]
  9. Tiwari, R.; Azad, N.; Dutta, D.; Yadav, B.R.; Kumar, S. A critical review and future perspective of plastic waste recycling. Sci. Total Environ. 2023, 163433. [Google Scholar] [CrossRef]
  10. Sasikumar, C.; Kannan, R.; Senthilkumar, C.; Sarweswaran, R.; Nagaraja, M.; Sundaresan, R. Pyrolysis of plastic waste for a better environmental system. Mater. Today Proc. 2022, 64, 1679–1684. [Google Scholar] [CrossRef]
  11. Mishra, R.; Kumar, A.; Singh, E.; Kumar, S. Recent research advancements in catalytic pyrolysis of plastic waste. ACS Sustain. Chem. Eng. 2023, 11, 2033–2049. [Google Scholar] [CrossRef]
  12. Yang, R.; Jan, K.; Chen, C.; Chen, W.; Wu, K.C. Thermochemical conversion of plastic waste into fuels, chemicals, and value-added materials: A critical review and outlooks. ChemSusChem 2022, 15, e202200171. [Google Scholar] [CrossRef]
  13. Gezginci, H. Pyrolysıs of polymers.
  14. Charitopoulou, M.A.; Alexopoulou, E.; Alexiou, P.; Achilias, D.S. Current Topics in Plastic Recycling. In Waste Material Recycling in the Circular Economy-Challenges and Developments; IntechOpen, 2021 ISBN 1839696818.
  15. Miandad, R.; Barakat, M.A.; Aburiazaiza, A.S.; Rehan, M.; Nizami, A.S. Catalytic pyrolysis of plastic waste: A review. Process Saf. Environ. Prot. 2016, 102, 822–838. [Google Scholar] [CrossRef]
  16. Antelava, A.; Jablonska, N.; Constantinou, A.; Manos, G.; Salaudeen, S.A.; Dutta, A.; Al-Salem, S.M. Energy potential of plastic waste valorization: a short comparative assessment of pyrolysis versus gasification. Energy & Fuels 2021, 35, 3558–3571. [Google Scholar]
  17. Islam, M.K.; Khatun, M.S.; Arefin, M.A.; Islam, M.R.; Hassan, M. Waste to energy: An experimental study of utilizing the agricultural residue, MSW, and e-waste available in Bangladesh for pyrolysis conversion. Heliyon 2021, 7, e08530. [Google Scholar] [CrossRef] [PubMed]
  18. Jahirul, M.I.; Rasul, M.G.; Schaller, D.; Khan, M.M.K.; Hasan, M.M.; Hazrat, M.A. Transport fuel from waste plastics pyrolysis–A review on technologies, challenges and opportunities. Energy Convers. Manag. 2022, 258, 115451. [Google Scholar] [CrossRef]
  19. Al-Salem, S.M.; Antelava, A.; Constantinou, A.; Manos, G.; Dutta, A. A review on thermal and catalytic pyrolysis of plastic solid waste (PSW). J. Environ. Manage. 2017, 197, 177–198. [Google Scholar] [CrossRef] [PubMed]
  20. Peng, Y.; Wang, Y.; Ke, L.; Dai, L.; Wu, Q.; Cobb, K.; Zeng, Y.; Zou, R.; Liu, Y.; Ruan, R. A review on catalytic pyrolysis of plastic wastes to high-value products. Energy Convers. Manag. 2022, 254, 115243. [Google Scholar] [CrossRef]
  21. Chaudhary, A.; Lakhani, J.; Dalsaniya, P.; Chaudhary, P.; Trada, A.; Shah, N.K.; Upadhyay, D.S. Slow pyrolysis of low-density Poly-Ethylene (LDPE): A batch experiment and thermodynamic analysis. Energy 2023, 263, 125810. [Google Scholar] [CrossRef]
  22. Wang, X.; Lv, W.; Guo, L.; Zhai, M.; Dong, P.; Qi, G. Energy and exergy analysis of rice husk high-temperature pyrolysis. Int. J. Hydrogen Energy 2016, 41, 21121–21130. [Google Scholar] [CrossRef]
  23. Zhang, Y.; Ji, G.; Ma, D.; Chen, C.; Wang, Y.; Wang, W.; Li, A. Exergy and energy analysis of pyrolysis of plastic wastes in rotary kiln with heat carrier. Process Saf. Environ. Prot. 2020, 142, 203–211. [Google Scholar] [CrossRef]
  24. Rajkumar, P.; Somasundaram, M. Pyrolysis of residual tyres: Exergy and kinetics of pyrogas. South African J. Chem. Eng. 2022, 42, 53–60. [Google Scholar] [CrossRef]
  25. Huang, Y.W.; Chen, M.Q.; Li, Q.H.; Xing, W. A critical evaluation on chemical exergy and its correlation with high heating value for single and multi-component typical plastic wastes. Energy 2018, 156, 548–554. [Google Scholar] [CrossRef]
  26. Hernandez, A.G.; Cullen, J.M. Exergy: A universal metric for measuring resource efficiency to address industrial decarbonisation. Sustain. Prod. Consum. 2019, 20, 151–164. [Google Scholar] [CrossRef]
  27. Szargut, J. Exergy method: technical and ecological applications; WIT press, 2005; Vol. 18; ISBN 1853127531.
  28. Bejan, A.; Tsatsaronis, G.; Moran, M.J. Thermal design and optimization; John Wiley & Sons, 1995; ISBN 0471584673.
  29. Kotas, T.J. The exergy method of thermal plant analysis; Paragon Publishing, 2012; ISBN 1908341890.
  30. Ahmed Al Ghamdi, I.M. Exergy analysis of a seawater reverse osmosis plant in Jeddah, Saudi Arabia.
  31. Sato, N. Chemical energy and exergy: an introduction to chemical thermodynamics for engineers; Elsevier, 2004; ISBN 044451645X.
  32. Michalakakis, C.; Fouillou, J.; Lupton, R.C.; Gonzalez Hernandez, A.; Cullen, J.M. Calculating the chemical exergy of materials. J. Ind. Ecol. 2021, 25, 274–287. [Google Scholar] [CrossRef]
  33. Rant, Z. Towards the estimation of specific exergy of fuels. Allg. Wärmetech 1961, 10, 172–176. [Google Scholar]
  34. Blanco-Marigorta, A.M.; Lozano-Medina, A.; Marcos, J.D. A critical review of definitions for exergetic efficiency in reverse osmosis desalination plants. Energy 2017, 137, 752–760. [Google Scholar] [CrossRef]
  35. Cengel, Y.A.; Boles, M.A.; Kanoğlu, M. Thermodynamics: an engineering approach; McGraw-hill New York, 2011; Vol. 5;
  36. Uthpalani, P.G.I.; De Silva, D.S.M.; Weerasinghe, V.P.A.; Premachandra, J.K.; Sarathchandra, T. V Pyrolysis of waste LDPE and waste PP plastics into fuel oil in a low-cost, lab-scale pyrolyzing unit. J. Sci. Univ. Kelaniya 2023, 16. [Google Scholar] [CrossRef]
  37. Abnisa, F. Enhanced Liquid Fuel Production from Pyrolysis of Plastic Waste Mixtures Using a Natural Mineral Catalyst. Energies 2023, 16, 1224. [Google Scholar] [CrossRef]
  38. Krieg, T.; Mazzon, C.; Gómez-Sánchez, E. Material analysis and a visual guide of degradation phenomena in historical synthetic polymers as tools to follow ageing processes in industrial heritage collections. Polymers (Basel). 2022, 14, 121. [Google Scholar] [CrossRef] [PubMed]
  39. Devaraj, J.; Robinson, Y.; Ganapathi, P. Experimental investigation of performance, emission and combustion characteristics of waste plastic pyrolysis oil blended with diethyl ether used as fuel for diesel engine. Energy 2015, 85, 304–309. [Google Scholar] [CrossRef]
  40. Thahir, R.; Altway, A.; Juliastuti, S.R. Production of liquid fuel from plastic waste using integrated pyrolysis method with refinery distillation bubble cap plate column. Energy reports 2019, 5, 70–77. [Google Scholar] [CrossRef]
  41. Al-Salem, S.M.; Chandrasekaran, S.R.; Dutta, A.; Sharma, B.K. Study of the fuel properties of extracted oils obtained from low and linear low density polyethylene pyrolysis. Fuel 2021, 304, 121396. [Google Scholar] [CrossRef]
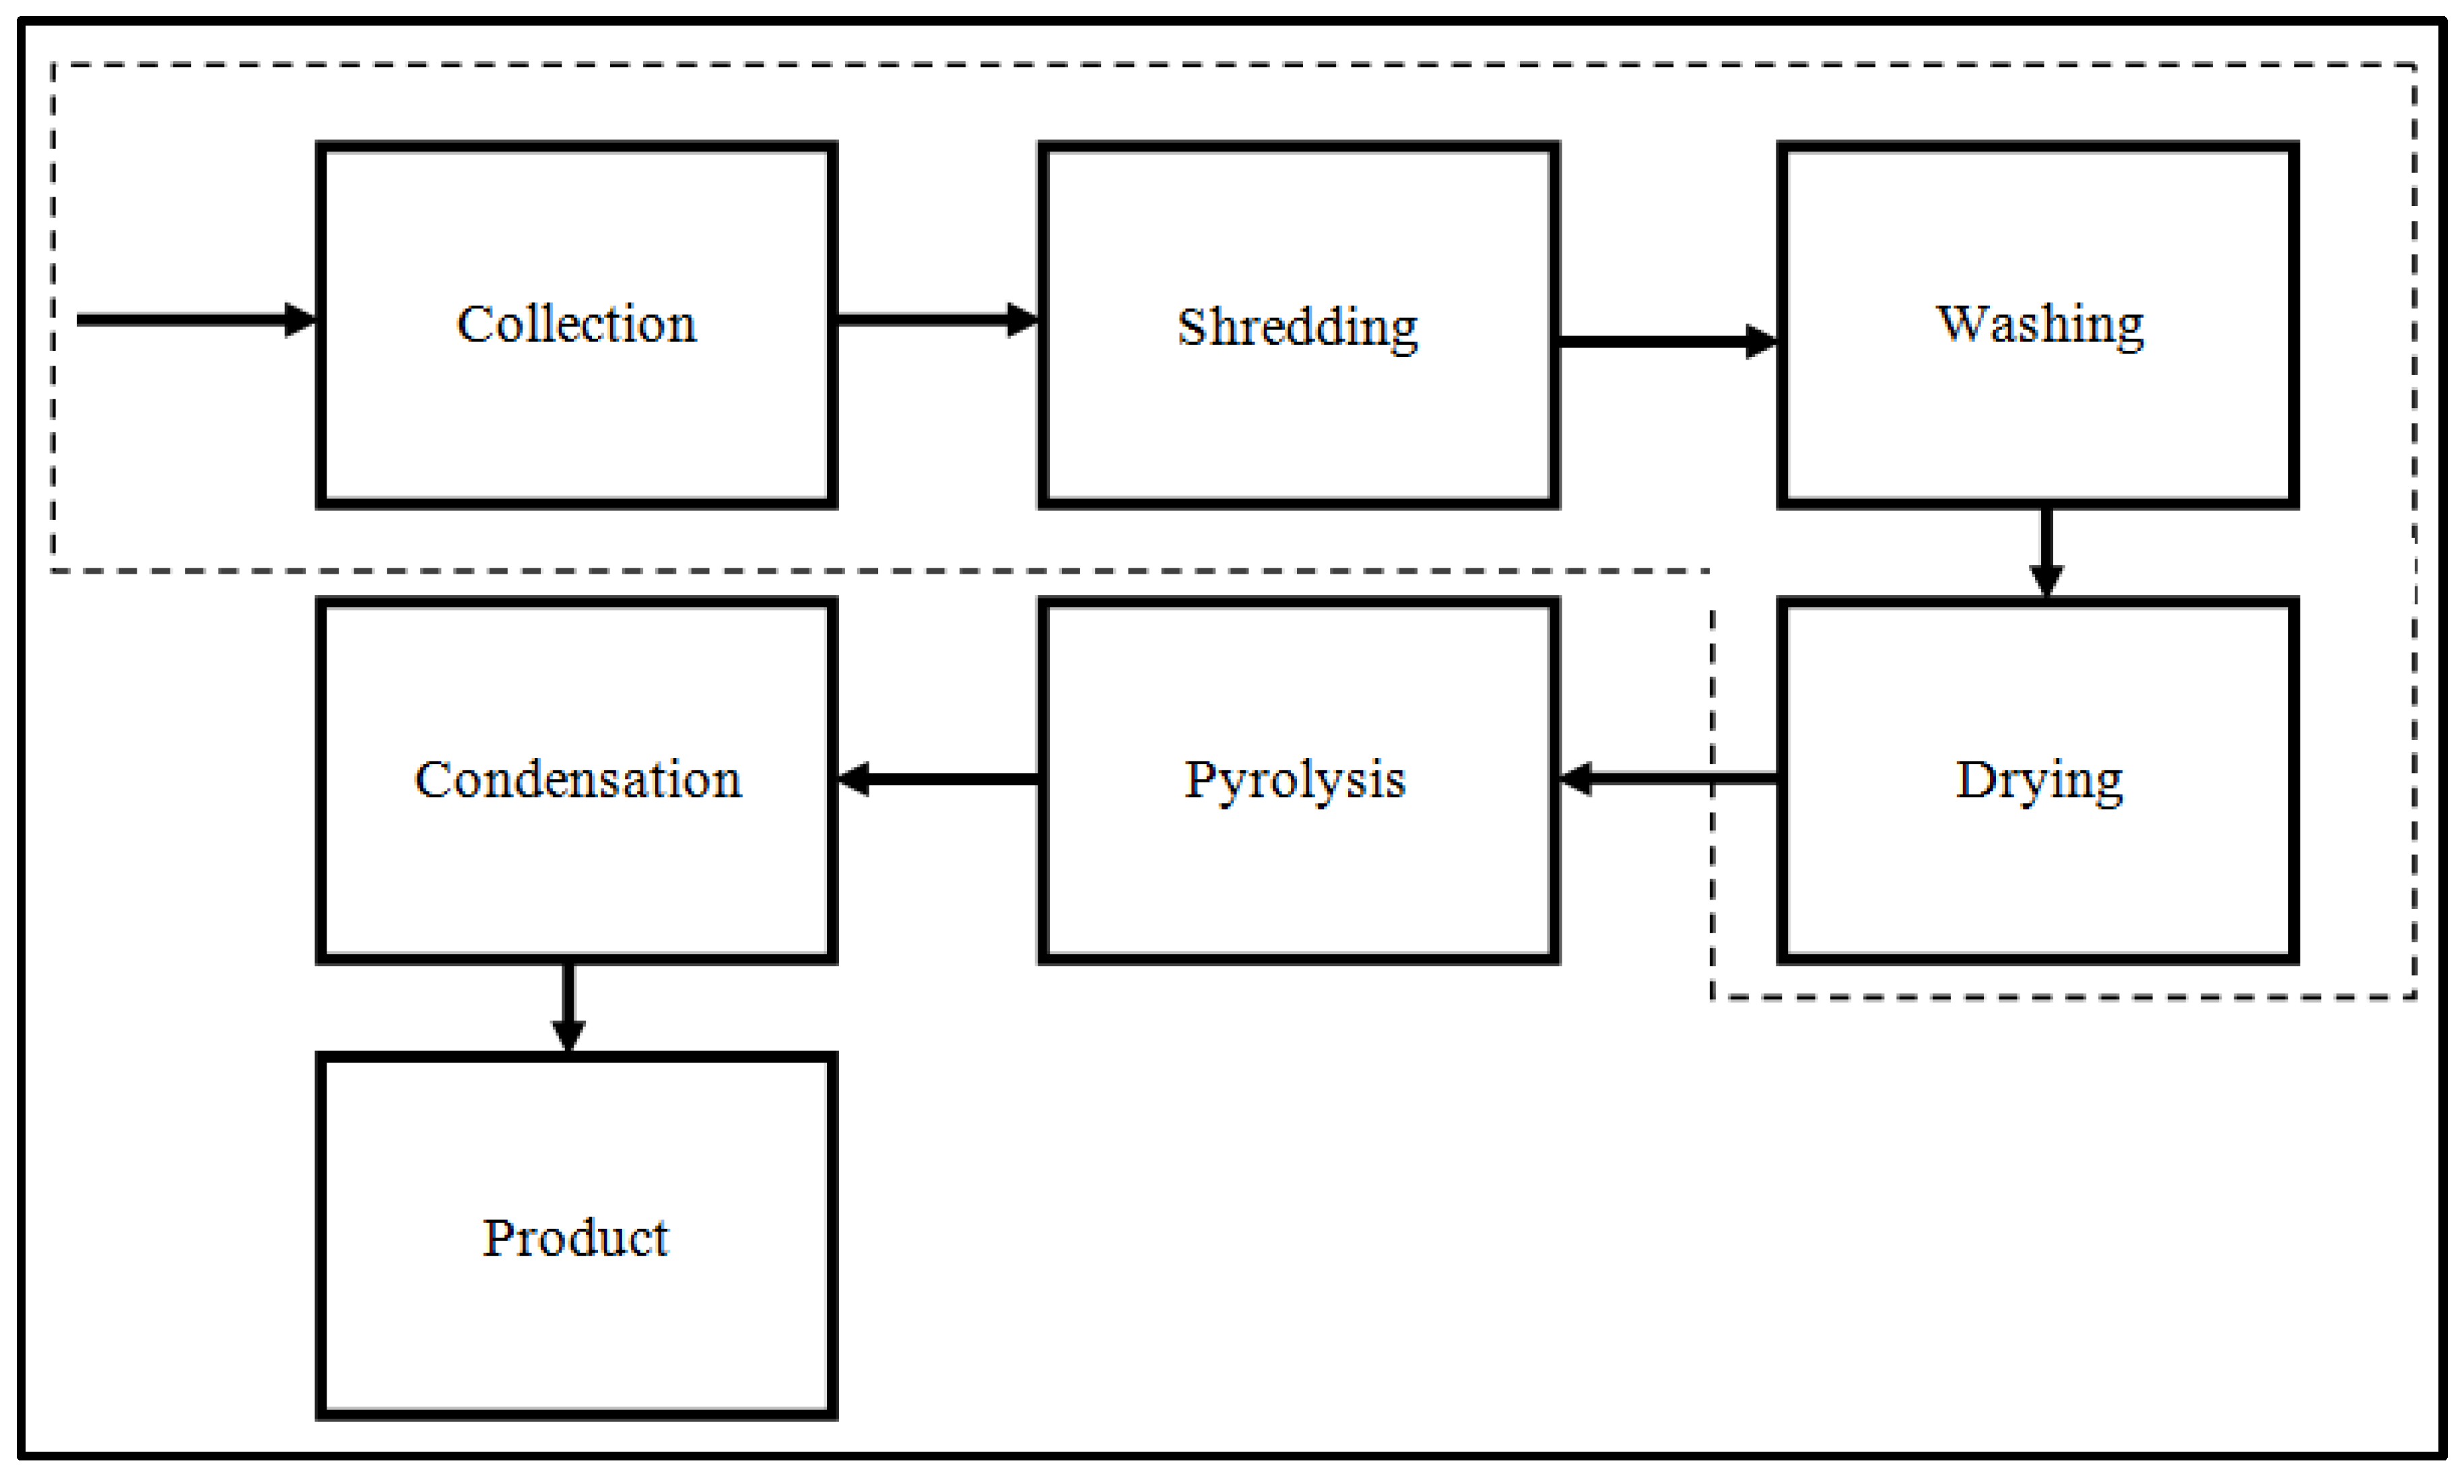
Figure 1. Block Flow Diagram of Pyrolysis Process.
Preprints 79118 g001
Figure 2. Schematic of the experimental set-up.
Preprints 79118 g002
Figure 3. Mass balance for the thermal pyrolysis.
Preprints 79118 g003
Figure 4. FTIR spectra of waste carry bags.
Preprints 79118 g004
Figure 5. FTIR spectra of oil from waste carry bags with 0.6g catalyst.
Preprints 79118 g005
Figure 6. Aspen One Plus v.11 flowsheet simulations to extract physical exergies of components.
Preprints 79118 g006
Figure 7. Production distribution as a function of catalyst weight.
Preprints 79118 g007
Figure 8. Exergy destruction as a function of catalyst weight.
Preprints 79118 g008
Figure 9. Exergetic efficiency of ZnO (this work) with other catalysts [13].
Preprints 79118 g009
Table 1. Effect of catalyst on the pyrolysis product.
Weight of Catalyst(g) Gas (%) Oil (%) Wax (%) Residue (%)
0 27.926 40 18.106 13.936
0.5 20.008 54.434 0.858 24.7
0.6 9.546 67.31 0 23.144
0.7 9.322 65 0 25.678
Table 2. IR Peaks Assignment.
Wave number (cm-1) Type of vibration Nature of functional group
3076 =C-H stretching Aromatics
2956, 2954 -C-H stretching Alkane
2922 -C-H stretching Alkane
2852 -C-H stretching Alkane
1641 -C=C stretching Alkene/ fingerprint region for phenyl ring substitution overtone
1465 -C=C stretching Alkanes with methyl groups with C-H bending vibration
1377 -C-H scissoring and bending Alkane
1236 -CH2 group bending Alkane
1088 In-plane deformation Aromatics
991 -C-H out-of-plane vibration Alkane
908 =C-H bending Alkene
887 -C-H out of plane bending Alkene
721 -C-H rock Alkene
630 -CH=CH2 twisting vibration Alkene
Table 3. Composition of the liquid product from pyrolysis.
Component % (w/w) % (v/v)
Benzene 0.06 0.06
Saturates 41.36 43.54
Olefins 18.66 20.30
Aromatics 39.98 36.16
Table 4. Exergy analysis of the conversion of LDPE to oil with varying amounts of ZnO catalyst.
Physical exergy (kJ) Chemical exergy (kJ) Total exergy (kJ)
Catalyst loading (g) Catalyst loading (g) Catalyst loading (g)
0 0.5 0.6 0.7 0 0.5 0.6 0.7 0 0.5 0.6 0.7
gas 2.744 1.960 0.931 0.912 605.150 432.25 205.319 200.996 607.894 434.210 206.25 201.908
oil 6.098 8.309 10.260 10.016 846.300 1153.084 1423.9 1390.048 852.398 1161.0 1434.16 1400.064
wax 1.952 0.093 0 0 302.922 14.393 0 0 304.874 14.486 0 0
carbon 5.310 9.414 8.864 9.819 197.380 349.888 329.44 364.94 202.690 359.302 338.304 374.759
Disclaimer/Publisher’s Note: The statements, opinions and data contained in all publications are solely those of the individual author(s) and contributor(s) and not of MDPI and/or the editor(s). MDPI and/or the editor(s) disclaim responsibility for any injury to people or property resulting from any ideas, methods, instructions or products referred to in the content.
Copyright: This open access article is published under a Creative Commons CC BY 4.0 license, which permit the free download, distribution, and reuse, provided that the author and preprint are cited in any reuse.
Prerpints.org logo

Preprints.org is a free preprint server supported by MDPI in Basel, Switzerland.

Subscribe

© 2024 MDPI (Basel, Switzerland) unless otherwise stated