Submitted:
10 July 2023
Posted:
11 July 2023
You are already at the latest version
Abstract
Keywords:
1. Introduction
2. Results
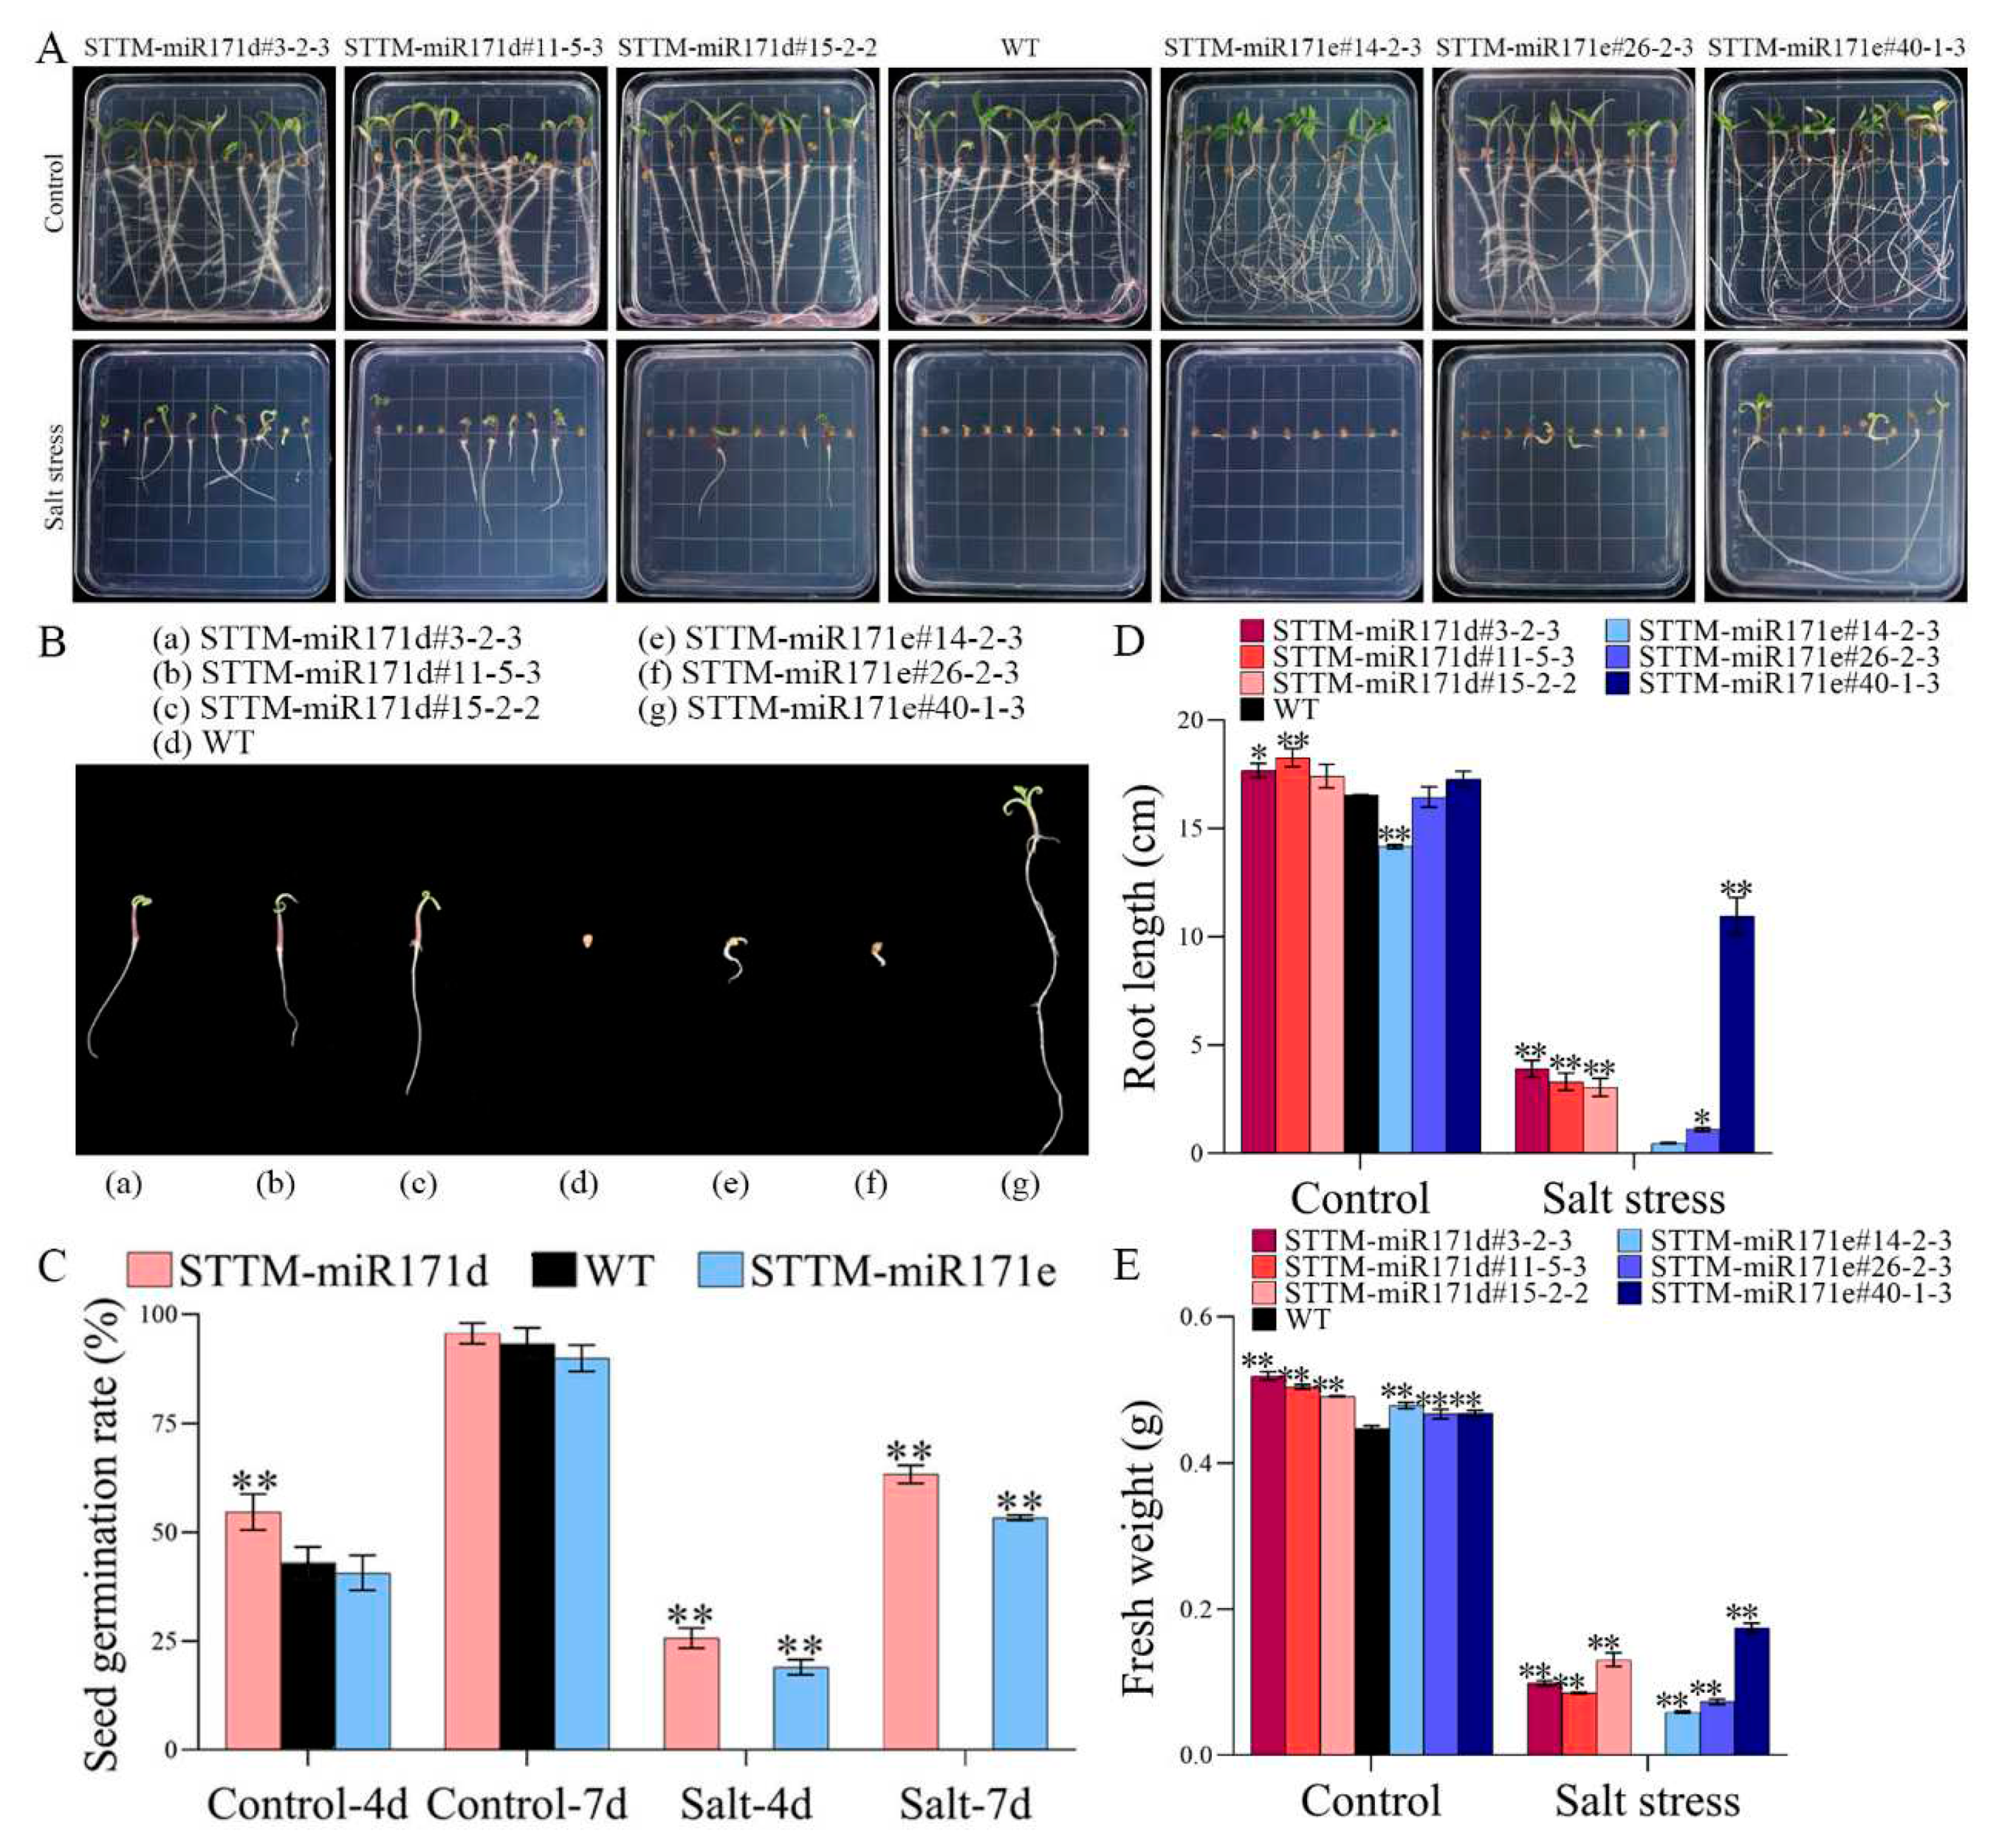
2.1. Seed germination under salt stress
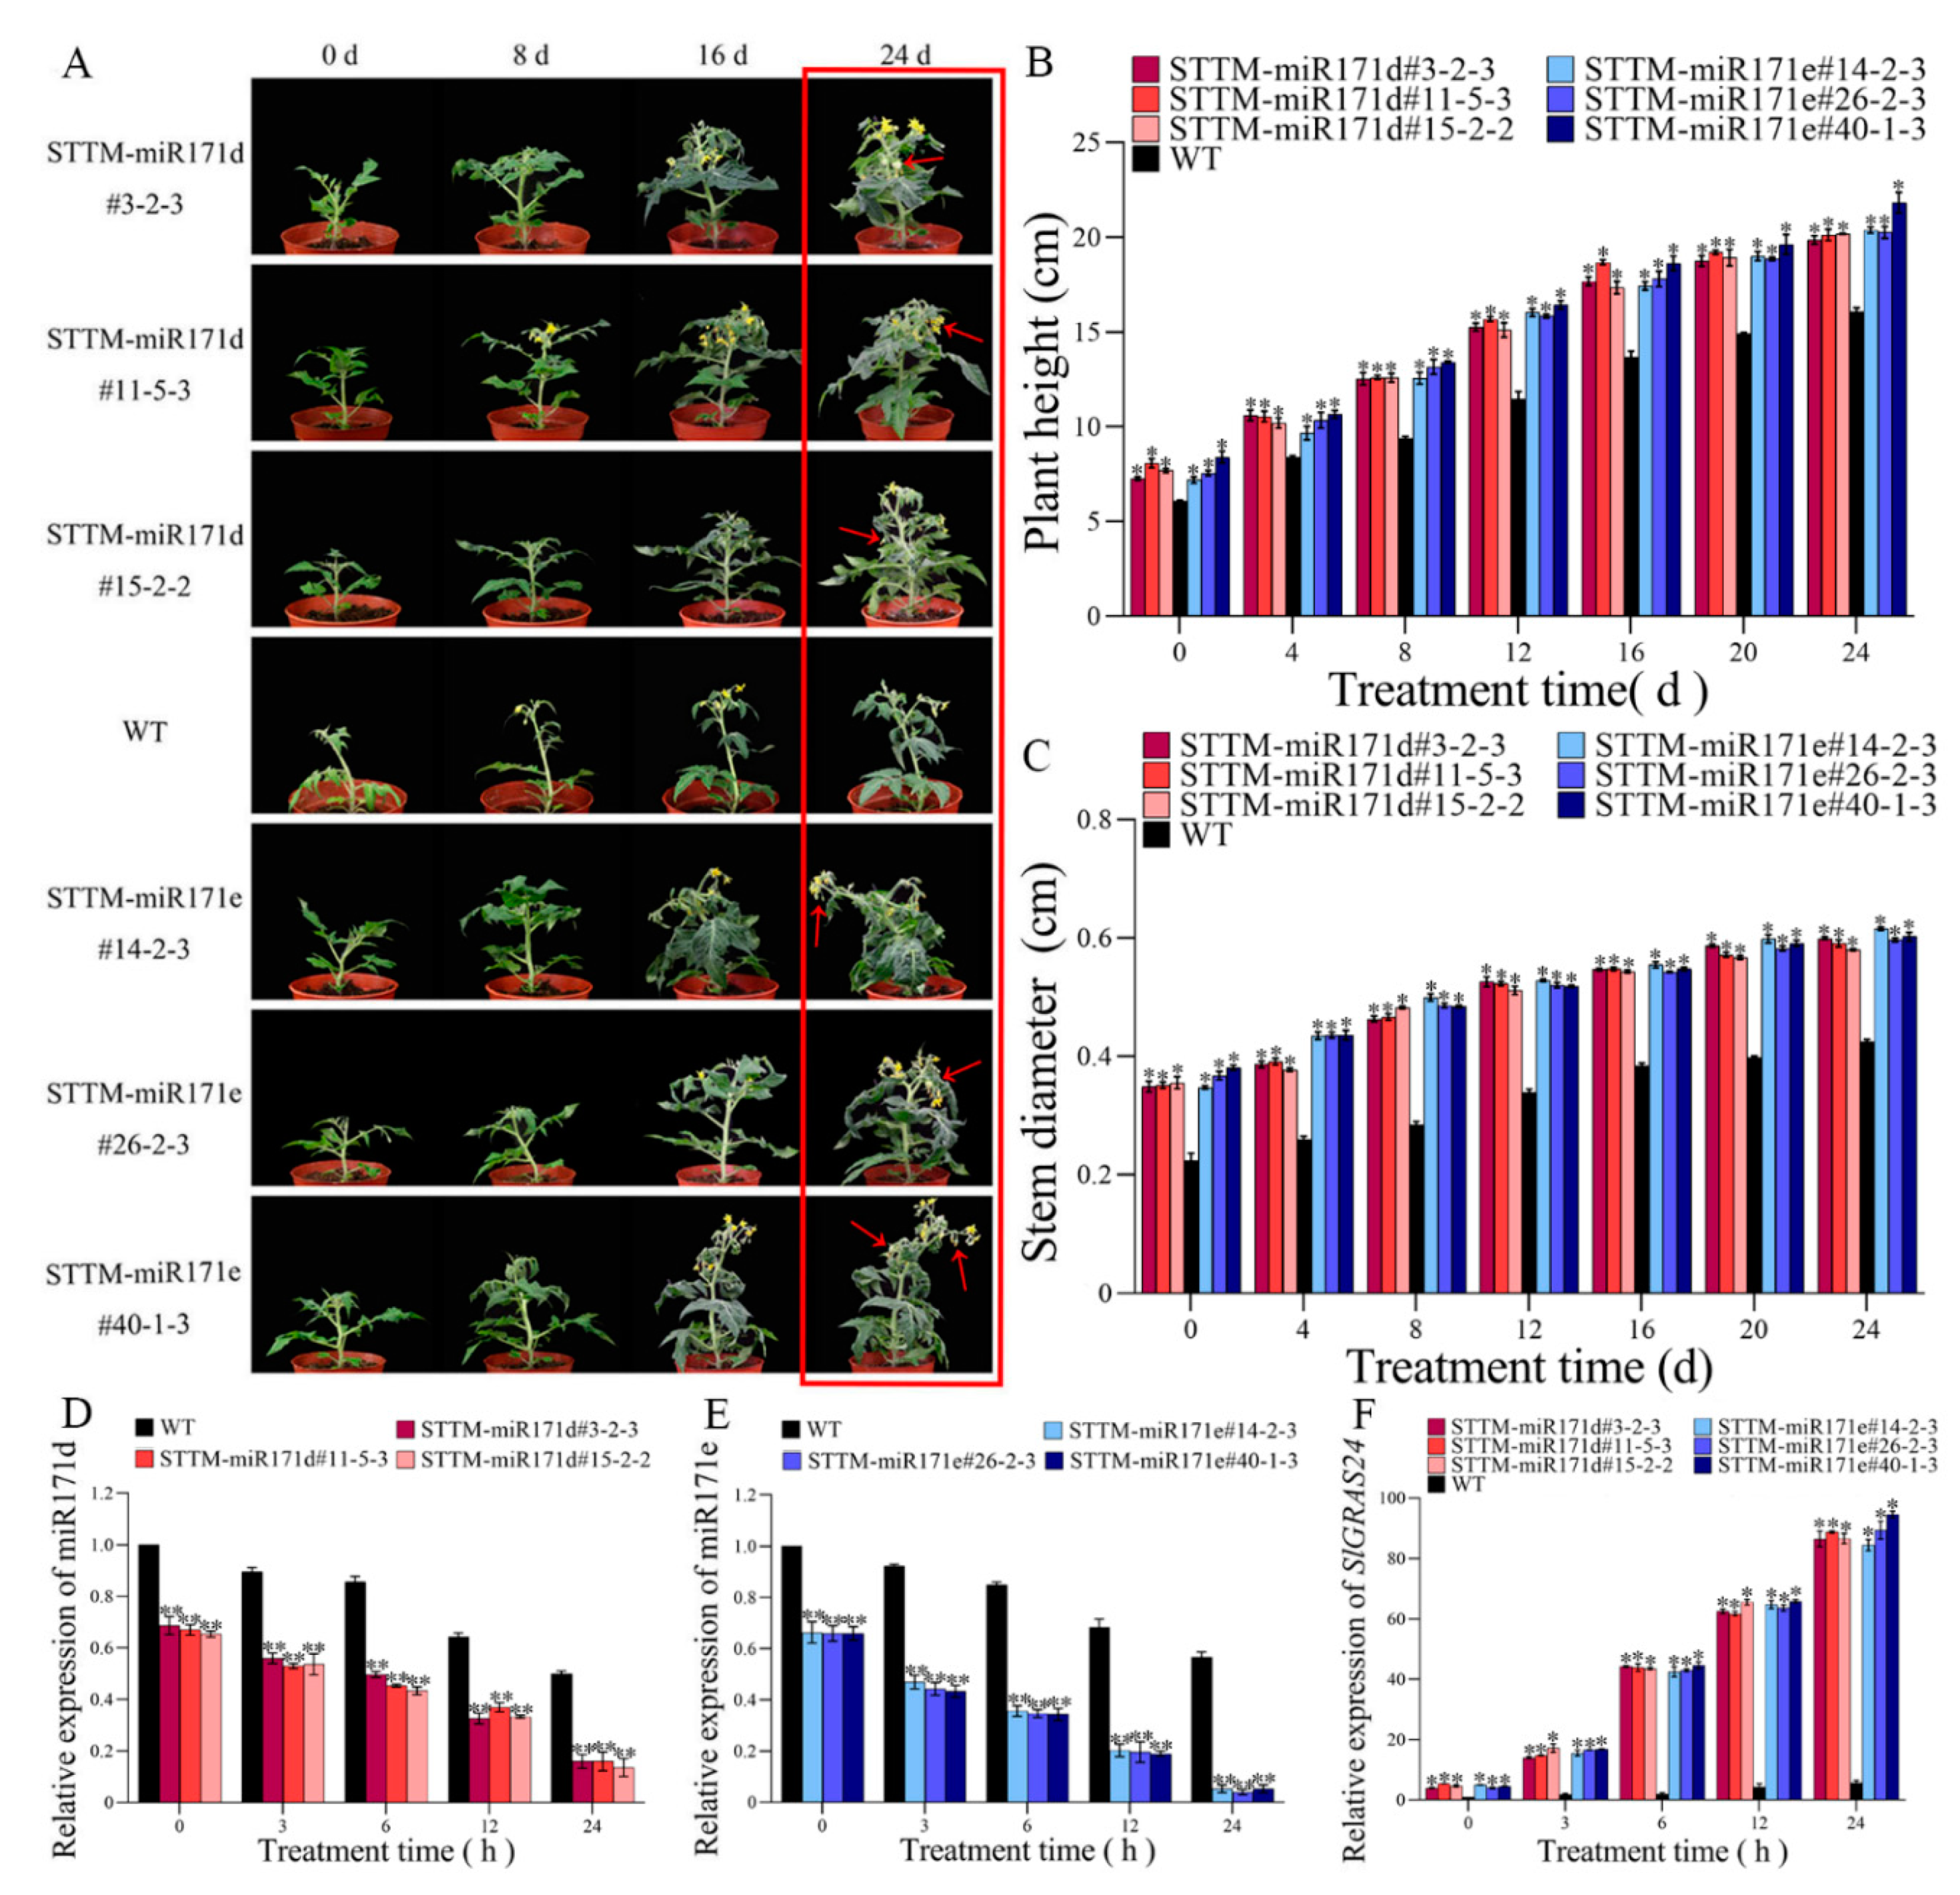
2.2. Plant growth under salt stress
2.3. Expression level of miR171d/e and SlGRAS24
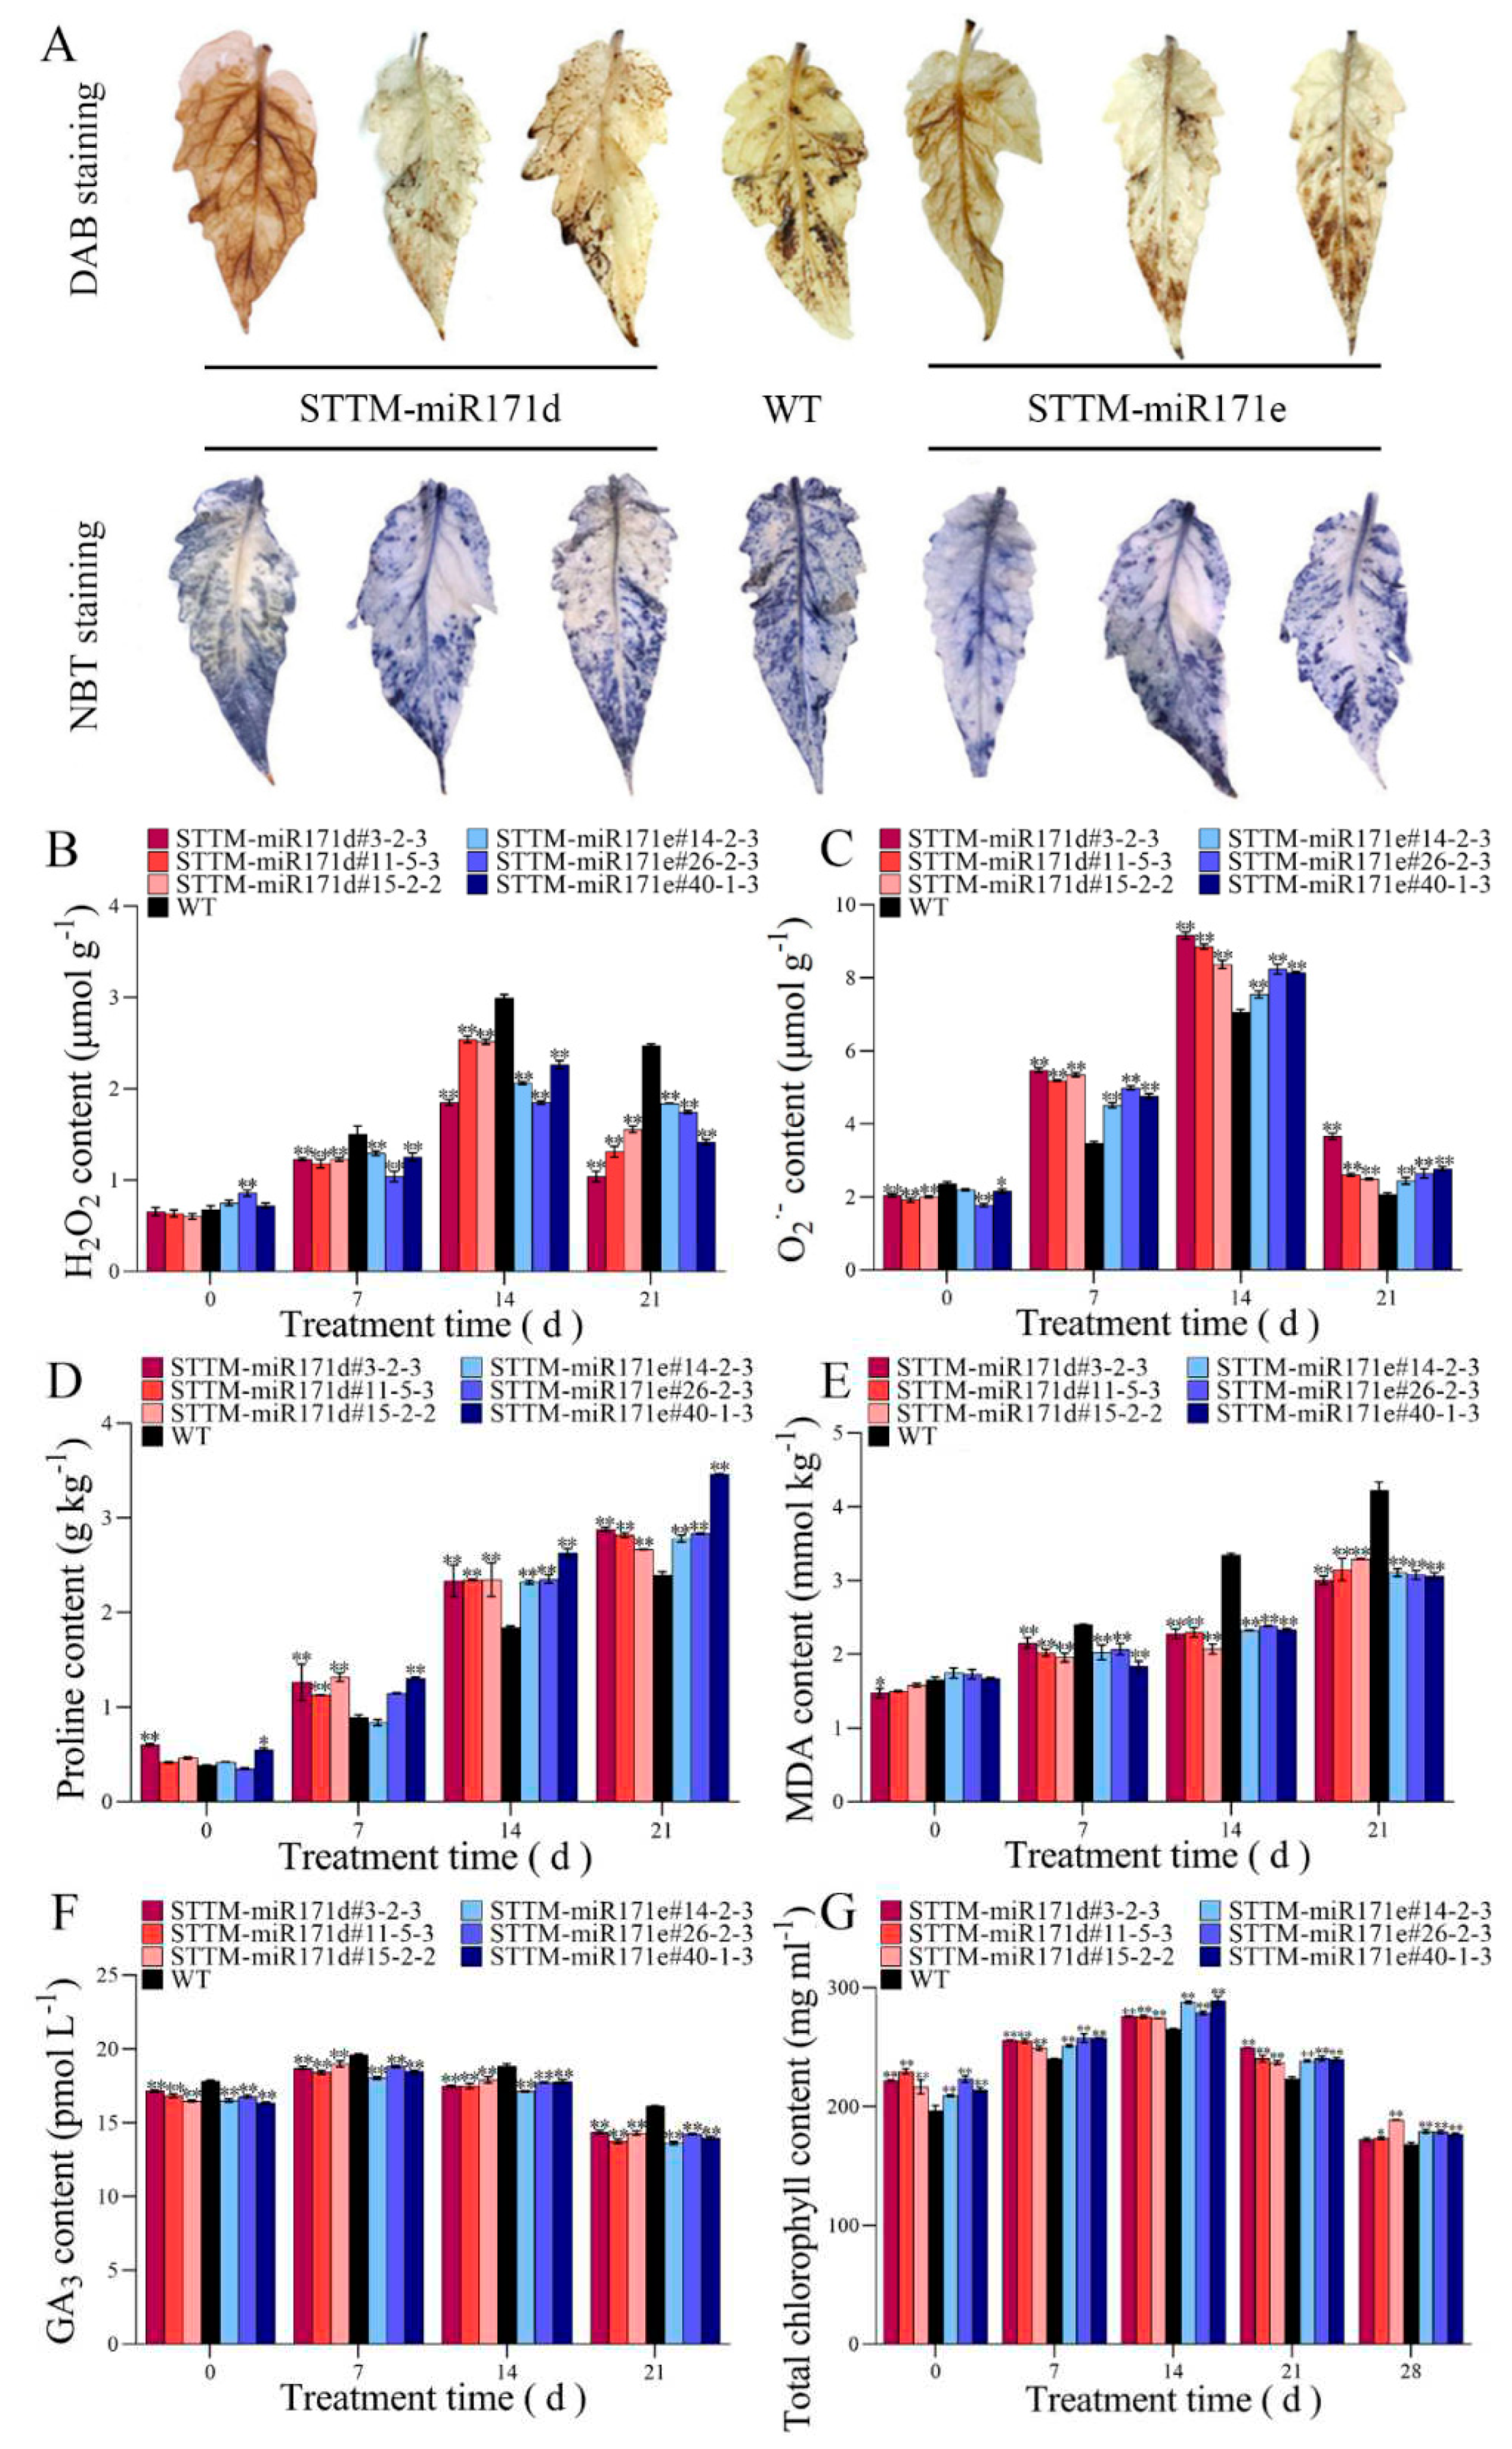
2.4. Histochemical detection and ROS accumulation
2.5. The content of proline, malondialdehyde (MDA), GA3 and total chlorophyll
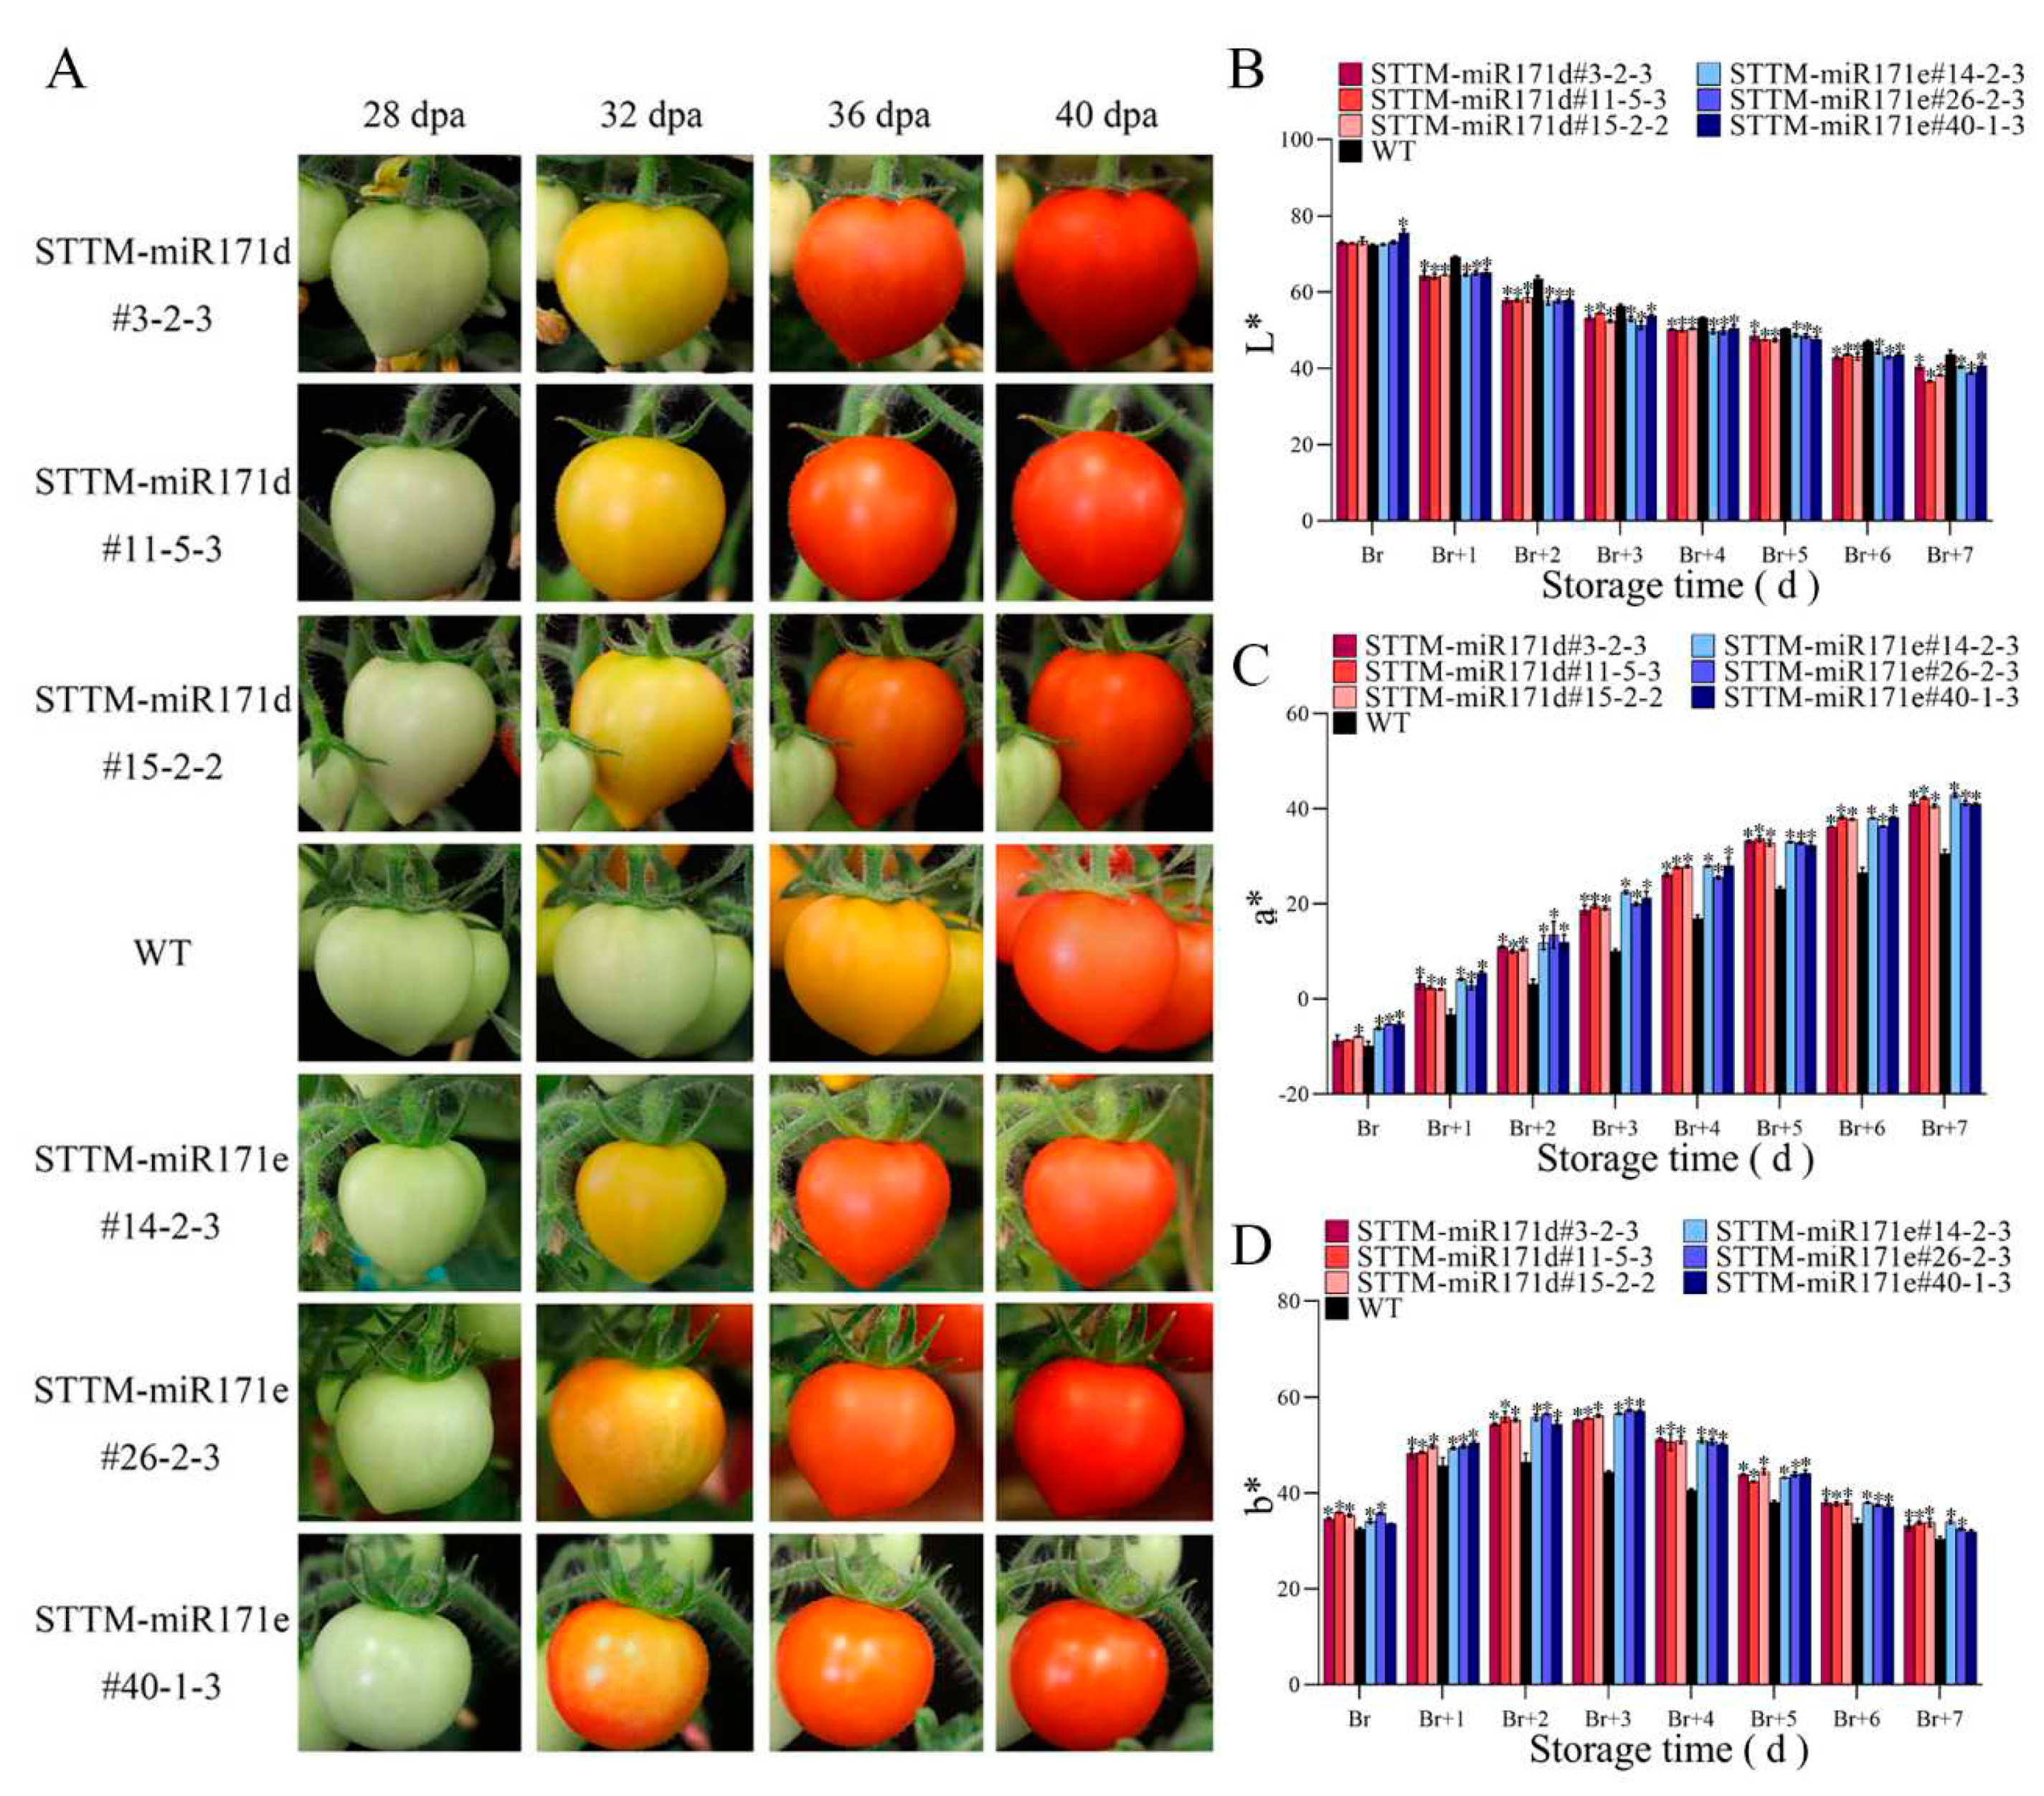
2.6. Color evaluation
2.7. Fruit quality evaluation
3. Discussion
4. Materials and Methods
4.1. Transformation of tomato plant
4.2. Plant materials and growth conditions
4.3. RNA extraction and quantitative real-time PCR analysis
4.4. ROS accumulation
4.5. Determination of proline, MDA, GA3 and chlorophyll
4.6. Fruit color measurement
4.7. Fruit quality evaluation
4.8. Fruit quality evaluation
5. Conclusions
Supplementary Materials
Author Contributions
Funding
Institutional Review Board Statement
Informed Consent Statement
Data Availability Statement
Conflicts of Interest
References
- Meng, X.; Cai, J.; Deng, L.; Li, G.; Sun, J.; Han, Y.; Dong, T.; Liu, Y.; Xu, T.; Liu, S.; Li, Z.; Zhu, M. SlSTE1 promotes abscisic acid-dependent salt stress-responsive pathways via improving ion homeostasis and reactive oxygen species scavenging in tomato. J. Integr. Plant Biol. 2020, 62, 1942–1966. [Google Scholar] [CrossRef] [PubMed]
- Devkar, V.; Thirumalaikumar, V.P.; Xue, G.P.; Vallarino, J.G.; Tureckova, V.; Strnad, M.; Fernie, A.R.; Hoefgen, R.; Mueller-Roeber, B.; Balazadeh, S. Multifaceted regulatory function of tomato SlTAF1 in the response to salinity stress. New Phytol. 2020, 225, 1681–1698. [Google Scholar] [CrossRef]
- Schwarz, D.; Thompson, A.J.; Klaering, H.P. Guidelines to use tomato in experiments with a controlled environment. Front Plant Sci. 2014, 5, 625. [Google Scholar] [CrossRef] [PubMed]
- Foolad, M.R. Recent advances in genetics of salt tolerance in tomato. Plant Cell Tiss. Org. Cult. 2004, 76, 101–119. [Google Scholar] [CrossRef]
- Cherian, S.; Figueroa, C.R.; Nair, H. 'Movers and shakers' in the regulation of fruit ripening: a cross-dissection of climacteric versus non-climacteric fruit. J. Exp. Bot. 2014, 65, 4705–4722. [Google Scholar] [CrossRef] [PubMed]
- Voinnet, O. Origin, biogenesis, and activity of plant microRNAs. Cell 2009, 136, 669–687. [Google Scholar] [CrossRef]
- Xu, X.; Ma, X.; Lei, H.; Yin, L.; Shi, X.; Song, H. MicroRNAs play an important role in the regulation of strawberry fruit senescence in low temperature. Postharvest Biol. Technol. 2015, 108, 39–47. [Google Scholar] [CrossRef]
- Phookaew, P.; Netrphan, S.; Sojikul, P.; Narangajavana, J. Involvement of miR164- and miR167-mediated target gene expressions in responses to water deficit in cassava. Biol. Plantarum. 2014, 58, 469–478. [Google Scholar] [CrossRef]
- Shi, X.; Jiang, F.; Wen, J.; Wu, Z. Overexpression of Solanum habrochaites microRNA319d (sha-miR319d) confers chilling and heat stress tolerance in tomato (S. lycopersicum). BMC Plant Biol. 2019, 19, 214. [Google Scholar] [CrossRef]
- Zhao, K.; Song, H.; Wang, Z.; Xing, Z.; Tian, J.; Wang, Q.; Meng, L.; Xu, X. Knockdown of Sly-miR164a by short tandem target mimic (STTM) enhanced postharvest chilling tolerance of tomato fruit under low temperature storage. Postharvest Biol. Technol. 2022, 187, 111872. [Google Scholar] [CrossRef]
- Axtell, M.J.; Bowman, J.L. Evolution of plant microRNAs and their targets. Trends Plant Sci. 2008, 13, 343–349. [Google Scholar] [CrossRef] [PubMed]
- Schulze, S.; Schaefer, B.N.; Parizotto, E.A.; Voinnet, O.; Theres, K. LOST MERISTEMS genes regulate cell differentiation of central zone descendants in Arabidopsis shoot meristems. Plant J. 2010, 64, 668–678. [Google Scholar] [CrossRef]
- Liu, Y.; Huang, W.; Xian, Z.; Hu, N.; Lin, D.; Ren, H.; Chen, J.; Su, D.; Li, Z. Overexpression of SIGRAS40 in tomato enhances tolerance to abiotic stresses and influences auxin and gibberellin signaling. Front Plant Sci. 2017, 8, 1659. [Google Scholar] [CrossRef]
- Li, C.; Dong, S.; Liu, X.; Bo, K.; Miao, H.; Beckles, D.M.; Zhang, S.; Gu, X. Genome-Wide characterization of cucumber (Cucumis sativus L.) GRAS genes and their response to various abiotic stresses. Horticulturae 2020, 6, 110. [Google Scholar] [CrossRef]
- Ni, L.; Wang, Z.; Liu, X.; Wu, S.; Hua, J.; Liu, L.; Yin, Y.; Li, H.; Gu, C. Genome-wide study of the GRAS gene family in Hibiscus hamabo Sieb. et Zucc and analysis of HhGRAS14-induced drought and salt stress tolerance in Arabidopsis. Plant Sci. 2022, 319, 111260. [Google Scholar] [CrossRef]
- Zhou, S.; Hu, Z.; Li, F.; Yu, X.; Naeem, M.; Zhang, Y.; Chen, G. Manipulation of plant architecture and flowering time by down-regulation of the GRAS transcription factor SlGRAS26 in Solanum lycopersicum. Plant Sci. 2018, 271, 81–93. [Google Scholar] [CrossRef] [PubMed]
- Engstrom, E.M.; Andersen, C.M.; Gumulak-Smith, J.; Hu, J.; Orlova, E.; Sozzani, R.; Bowman, J.L. Arabidopsis homologs of the petunia HAIRY MERISTEM gene are required for maintenance of shoot and root indeterminacy. Plant Physiol. 2011, 155, 735–750. [Google Scholar] [CrossRef]
- Weiss, D.; Ori, N. Mechanisms of cross talk between gibberellin and other hormones. Plant Physiol. 2007, 144, 1240–1246. [Google Scholar] [CrossRef]
- Huang, W.; Xian, Z.; Kang, X.; Tang, N.; Li, Z. Genome-wide identification, phylogeny and expression analysis of GRAS gene family in tomato. BMC Plant Biol. 2015, 15, 209. [Google Scholar] [CrossRef]
- Huang, W.; Peng, S.; Xian, Z.; Lin, D.; Hu, G.; Yang, L.; Ren, M.; Li, Z. Overexpression of a tomato miR171 target gene SlGRAS24 impacts multiple agronomical traits via regulating gibberellin and auxin homeostasis. Plant Biotechnol. J. 2017, 15, 472–488. [Google Scholar] [CrossRef]
- Xing, Z.T.; Huang, T.S.; Zhao, K.Y.; Meng, L.H.; Song, H.M.; Zhang, Z.K.; Xu, X.B.; Liu, S.B. Silencing of Sly-miR171d increased the expression of GRAS24 and enhanced postharvest chilling tolerance of tomato fruit. Front Plant Sci, 2022, 13, 1006940. [Google Scholar] [CrossRef] [PubMed]
- Zhao, K.; Chen, R.; Duan, W.; Meng, L.; Song, H.; Wang, Q.; Li, J.; Xu, X. Chilling injury of tomato fruit was alleviated under low-temperature storage by silencing Sly-miR171e with short tandem target mimic technology. Front Nutr. 2022, 9, 906227. [Google Scholar] [CrossRef] [PubMed]
- Krishna, R.; Karkute, S.G.; Ansari, W.A.; Jaiswal, D.K.; Verma, J.P.; Singh, M. Transgenic tomatoes for abiotic stress tolerance: status and way ahead. 3 Biotech. 2019, 9, 143. [Google Scholar] [CrossRef]
- Wai, A.H.; Naing, A.H.; Lee, D.J.; Chang, K.K.; Chung, M.Y. Molecular genetic approaches for enhancing stress tolerance and fruit quality of tomato. Plant Biotechnol. Rep. 2020, 14, 515–537. [Google Scholar] [CrossRef]
- Yang, Y.; Guo, Y. Elucidating the molecular mechanisms mediating plant salt-stress responses. New Phytol. 2018, 217, 523–539. [Google Scholar] [CrossRef]
- Al-Harbi, A.R.; Wahb-Allah, M.A.; Abu-Muriefah, S.S. Salinity and nitrogen level affects germination, emergence, and seedling growth of tomato. Int. J. Veg. Sci. 2008, 14, 380–392. [Google Scholar] [CrossRef]
- Zhu, J.K. Abiotic stress signaling and responses in plants. Cell 2016, 167, 313–324. [Google Scholar] [CrossRef]
- Xu, N.; Chu, Y.; Chen, H.; Li, X.; Wu, Q.; Jin, L.; Wang, G.; Huang, J. Rice transcription factor OsMADS25 modulates root growth and confers salinity tolerance via the ABA-mediated regulatory pathway and ROS scavenging. PLoS Genet. 2018, 14, e1007662. [Google Scholar] [CrossRef]
- Llanes, A.; Andrade, A.; Masciarelli, O.; Alemano, S.; Luna, V. Drought and salinity alter endogenous hormonal profiles at the seed germination phase. Seed Sci. Res. 2016, 26, 1–13. [Google Scholar] [CrossRef]
- Ge, L.; Yang, X.; Liu, Y.; Tang, H.; Wang, Q.; Chu, S.; Hu, J.; Zhang, N.; Shi, Q. Improvement of Seed Germination under Salt Stress via Overexpressing Caffeic Acid O-methyltransferase 1 (SlCOMT1) in Solanum lycopersicum L. Int. J. Mol. Sci. 2023, 24, 734. [Google Scholar] [CrossRef]
- Moore, K.; Roberts, L.J. Measurement of lipid peroxidation. Free Radical Res. 1998, 28, 659–671. [Google Scholar] [CrossRef]
- Kant, P.; Kant, S.; Gordon, M.; Shaked, R.; Barak, S. STRESS RESPONSE SUPPRESSOR1 and STRESS RESPONSE SUPPRESSOR2, two DEAD-box RNA helicases that attenuate Arabidopsis responses to multiple abiotic stresses. Plant Physiol. 2007, 145, 814–830. [Google Scholar] [CrossRef]
- Fahad, S.; Hussain, S.; Matloob, A.; Khan, F.A.; Khaliq, A.; Saud, S.; Hassan, S.; Shan, D.; Khan, F.; Ullah, N.; Faiq, M.; Khan, M.R.; Tareen, A.K.; Khan, A.; Ullah, A.; Ullah, N.; Huang, J.L. Phytohormones and plant responses to salinity stress: a review. Plant Growth Regul. 2015, 75, 391–404. [Google Scholar] [CrossRef]
- Colebrook, E.H.; Thomas, S.G.; Phillips, A.L.; Hedden, P. The role of gibberellin signalling in plant responses to abiotic stress. J. Exp. Biol. 2014, 217, 67–75. [Google Scholar] [CrossRef] [PubMed]
- Miceli, A.; Vetrano, F.; Moncada, A. Effects of foliar application of gibberellic acid on the salt tolerance of tomato and sweet pepper transplants. Horticulturae 2020, 6, 93. [Google Scholar] [CrossRef]
- Yu, Z.; Duan, X.; Luo, L.; Dai, S.; Ding, Z.; Xia, G. How plant hormones mediate salt stress responses. Trends Plant Sci. 2020, 25, 11. [Google Scholar] [CrossRef] [PubMed]
- Okada, K.; Ito, T.; Fukazawa, J.; Takahashi, Y. Gibberellin induces an increase in cytosolic Ca2+ via a DELLA-independent signaling pathway. Plant Physiol. 2017, 175, 1536–1542. [Google Scholar] [CrossRef]
- Achard, P.; Renou, J.P.; Berthome, R.; Harberd, N.P.; Genschik, P. Plant DELLAs restrain growth and promote survival of adversity by reducing the levels of reactive oxygen species. Curr. Biol. 2008, 18, 656–660. [Google Scholar] [CrossRef] [PubMed]
- Apel, K.; Hirt, H. Reactive oxygen species: metabolism, oxidative stress, and signal transduction. Annu. Rev. Plant Biol. 2004, 55, 373–399. [Google Scholar] [CrossRef] [PubMed]
- Achard, P.; Cheng, H.; De Grauwe, L.; Decat, J.; Schoutteten, H.; Moritz, T.; Van Der Straeten, D.; Peng, J.; Harberd, N.P. Integration of plant responses to environmentally activated phytohormonal signals. Science 2006, 311, 91–94. [Google Scholar] [CrossRef] [PubMed]
- Wang, Y.; Gong, X.; Liu, W.; Kong, L.; Si, X.; Guo, S.; Sun, J. Gibberellin mediates spermidine-induced salt tolerance and the expression of GT-3b in cucumber. Plant Physiol. Bioch. 2020, 152, 147–156. [Google Scholar] [CrossRef] [PubMed]
- Massaretto, I.L.; Albaladejo, I.; Purgatto, E.; Flores, F.B.; Plasencia, F.; Egea-Fernandez, J.M.; Bolarin, M.C.; Egea, I. Recovering tomato landraces to simultaneously improve fruit yield and nutritional quality against salt stress. Front Plant Sci. 2018, 9, 1778. [Google Scholar] [CrossRef]
- Koleška, I.; Hasanagić, D.; Todorović, V.; Murtić, S.; Maksimović, I. Grafting influence on the weight and quality of tomato fruit under salt stress. Ann. Appl. Biol. 2018, 172, 187–196. [Google Scholar] [CrossRef]
- Galli, V.; Messias, R.D.S.; Perin, E.C.; Borowski, J.M.; Bamberg, A.L.; Rombaldi, C.V. Mild salt stress improves strawberry fruit quality. LWT-Food Sci. Technol. 2016, 73, 693–699. [Google Scholar] [CrossRef]
- Huang, Y.; Tang, R.; Cao, Q.; Bie, Z. Improving the fruit yield and quality of cucumber by grafting onto the salt tolerant rootstock under NaCl stress. Sci. Hortic. 2009, 122, 26–31. [Google Scholar] [CrossRef]
- Gough, C.; Hobson, G.E. A comparison of the productivity, quality, shelf-life characteristics and consumer reaction to the crop from cherry tomato plants grown at different levels of salinity. J. Hortic. Sci. 1990, 65, 431–439. [Google Scholar] [CrossRef]
- Hasegawa, P.M.; Bressan, R.A.; Zhu, J.K.; Bohnert, H.J. Plant cellular and molecular responses to high salinity. Ann. Rev. Plant Phys. 2000, 51, 463–499. [Google Scholar] [CrossRef]
- Grattan, S.R.; Grieve, C.M. Salinity-mineral nutrient relations in horticultural crops. Sci. Hortic. 1998, 78, 127–157. [Google Scholar] [CrossRef]
- De Pascale, S.; Maggio, A.; Fogliano, V.; Ambrosino, P.; Ritieni, A. Irrigation with saline water improves carotenoids content and antioxidant activity of tomato. J. Hortic. Sci. Biotechnol. 2001, 7, 447–453. [Google Scholar] [CrossRef]
- Petersen, K.K.; Willumsen, J.; Kaack, K. Composition and taste of tomatoes as affected by increased salinity and different salinity sources. J. Hortic. Sci. Biotechnol. 1998, 73, 205–15. [Google Scholar] [CrossRef]
- Hernández-Fuentes, A.D.; López-Vargas, E.R.; Pinedo-Espinoza, J.M.; Campos-Montiel, R.G.; Valdés-Reyna, J.; Juárez-Maldonado, A. Postharvest behavior of bioactive compounds in tomato fruits treated with Cu nanoparticles and NaCl stress. Appl. Sci. 2017, 7, 980. [Google Scholar] [CrossRef]
- Rice-Evans, C.A.; Miller, N.J.; Paganga, G. Structure-antioxidant activity relationships of flavonoids and phenolic acids. Free Radical Bio. Med. 1996, 20, 933–956. [Google Scholar] [CrossRef] [PubMed]
- Klunklin, W.; Savage, G. Effect on quality characteristics of tomatoes grown under well-watered and drought stress conditions. Foods 2017, 6, 56. [Google Scholar] [CrossRef]
- Martí, R.; Leiva-Brondo, M.; Lahoz, I.; Campillo, C.; Cebolla-Cornejo, J.; Roselló, S. Polyphenol and L-ascorbic acid content in tomato as influenced by high lycopene genotypes and organic farming at different environments. Food Chem. 2018, 239, 148–156. [Google Scholar] [CrossRef] [PubMed]
- Pinedo-Guerrero, Z.H.; Hernández-Fuentes, A.D.; Ortega-Ortiz, H.; Benavides-Mendoza, A.; Cadenas-Pliego, G.; Juárez-Maldonado, A. Cu nanoparticles in hydrogels of chitosan-PVA affects the characteristics of post-harvest and bioactive compounds of jalapeño pepper. Molecules 2017, 22, 926. [Google Scholar] [CrossRef]
- Kedare, S.B.; Singh, R.P. Genesis and development of DPPH method of antioxidant assay. J. Food Sci. Tech. 2011, 48, 412–22. [Google Scholar] [CrossRef]
- Yan, J.; Gu, Y.; Jia, X.; Kang, W.; Pan, S.; Tang, X.; Chen, X.; Tang, G. Effective small RNA destruction by the expression of a short tandem target mimic in Arabidopsis. Plant Cell 2012, 24, 415–427. [Google Scholar] [CrossRef] [PubMed]
- Tian, J.X.; Xie, S.Y.; Zhang, P.; Wang, Q.; Li, J.K.; Xu, X.B. Attenuation of postharvest peel browning and chilling injury of banana fruit by Astragalus polysaccharides. Postharvest Biol. Technol. 2022, 184, 111783. [Google Scholar] [CrossRef]
- Hu, W.; Huang, C.; Deng, X.; Zhou, S.; Chen, L.; Li, Y.; Wang, C.; Ma, Z.; Yuan, Q.; Wang, Y.; Cai, R.; Liang, X.; Yang, G.; He, G. TaASR1, a transcription factor gene in wheat, confers drought stress tolerance in transgenic tobacco. Plant Cell Environ. 2013, 36, 1449–1464. [Google Scholar] [CrossRef]
- Duan, W.; Ngaffo Mekontso, F.; Li, W.; Tian, J.; Li, J.; Wang, Q.; Xu, X. Alleviation of postharvest rib-edge darkening and chilling injury of carambola fruit by brassinolide under low temperature storage. Sci. Hortic. 2022, 299, 110015. [Google Scholar] [CrossRef]
- Zhu, M.; Chen, G.; Zhou, S.; Tu, Y.; Wang, Y.; Dong, T.; Hu, Z. A new tomato NAC (NAM/ATAF1/2/CUC2) transcription factor, SlNAC4, functions as a positive regulator of fruit ripening and carotenoid accumulation. Plant Cell Physiol. 2014, 55, 119–135. [Google Scholar] [CrossRef] [PubMed]
- Fish, W.W.; Perkins-Veazie, P.; Collins, J.K.A. A quantitative assay for lycopene that utilizes reduced volumes of organic solvents. J. Food Compos. Anal. 2002, 15, 309–317. [Google Scholar] [CrossRef]
- Wan, X.; Wang, Z.Q.; Duan, W.H.; Huang, T.S.; Song, H.M.; Xu, X.B. Knockdown of Sly-miR164a enhanced plant salt tolerance and improved preharvest and postharvest fruit nutrition of tomato. Int J Mol Sci, 2023, 24, 4639. [Google Scholar] [CrossRef]
- Wang, Z.Q.; Pu, H.L.; Shan, S.S.; Zhang, P.; Li, J.K.; Song, H.M.; Xu, X.B. Melatonin enhanced chilling tolerance and alleviated peel browning of banana fruit under low temperature storage. Postharvest Biol. Technol. 2021, 179, 111571. [Google Scholar] [CrossRef]
| Individual organic acid (mg g-1 FW) | |||||||
|---|---|---|---|---|---|---|---|
| Quinic acid | Shikimic acid | Pyruvate | Acetic acid | Citric acid | Malic acid | ||
| Control | STTM-miR171d | 0.0657±0.0043a | 0.0076±0.0003b | 0.1375±0.0005 a | 0.0334±0.0018a | 0.1119±0.0106b | 0.0381±0.0093b |
| WT | 0.0324±0.0018c | 0.0081±0.0009b | 0.1055±0.0108b | 0.023±0.0025b | 0.1486±0.0289ab | 0.035±0.0093b | |
| STTM-miR171e | 0.0585±0.0057b | 0.0112±0.0005a | 0.0897±0.0102c | 0.0347±0.0013a | 0.1534±0.0325a | 0.0657±0.0015a | |
| Salt stress | STTM-miR171d | 0.0369±0.0011b | 0.014±0.0002a | 0.0503±0.0006c | 0.0503±0.0017a | 0.1994±0.004a | 0.0935±0.0029a |
| WT | 0.0555±0.0066a | 0.0082±0.0003c | 0.1486±0.0012a | 0.0335±0.0028b | 0.1293±0.0107b | 0.0488±0.0019c | |
| STTM-miR171e | 0.0377±0.0065b | 0.0111±0.0023b | 0.0665±0.0105b | 0.0469±0.0065a | 0.1969±0.0313a | 0.0698±0.0173b | |
| Br+4 d | STTM-miR171d | 0.0476±0.0036b | 0.0026±0.0003b | 0.1063±0.0039b | 0.035±0.0016a | 0.1299±0.006b | 0.0445±0.0025ab |
| WT | 0.0253±0.0047c | 0.0048±0.0011a | 0.0789±0.0098c | 0.0236±0.0026b | 0.0629±0.0283c | 0.0516±0.0231a | |
| STTM-miR171e | 0.0579±0.0059a | 0.0035±0.0004ab | 0.1374±0.0042a | 0.0267±0.0008b | 0.1367±0.0103a | 0.032±0.0038b | |
| Br+7 d | STTM-miR171d | 0.0769±0.0302a | 0.0036±0.0006b | 0.1269±0.0073a | 0.0242±0.0014b | 0.1537±0.0132b | 0.0512±0.0083ab |
| WT | 0.0358±0.0114c | 0.0082±0.0003a | 0.1236±0.0002a | 0.0325±0.0015a | 0.154±0.0045b | 0.06±0.0117a | |
| STTM-miR171e | 0.0521±0.0007b | 0.0086±0.0011a | 0.0873±0.0094b | 0.0351±0.0009a | 0.2452±0.0374a | 0.0445±0.0052b | |
Disclaimer/Publisher’s Note: The statements, opinions and data contained in all publications are solely those of the individual author(s) and contributor(s) and not of MDPI and/or the editor(s). MDPI and/or the editor(s) disclaim responsibility for any injury to people or property resulting from any ideas, methods, instructions or products referred to in the content. |
© 2023 by the authors. Licensee MDPI, Basel, Switzerland. This article is an open access article distributed under the terms and conditions of the Creative Commons Attribution (CC BY) license (http://creativecommons.org/licenses/by/4.0/).


