Submitted:
11 July 2023
Posted:
12 July 2023
You are already at the latest version
Abstract
Keywords:
1. Introduction
2. Materials and Methodology
2.1. Experimental Groups
2.2. Behavioural Studies
2.2.1. Open Field Test
2.2.2. Elevated Plus Maze
2.2.3. Light and Dark Test
2.2.4. Rotarod Test
2.2.5. Statistical Analysis:
3. Results
3.1. Physical Development
3.2. Double Hit and Multi-Hit Exposure of Lipopolysaccharide and Deltamethrin Induced Hyperactivity and Low Anxious Behaviour in Protein Malnourished Rats
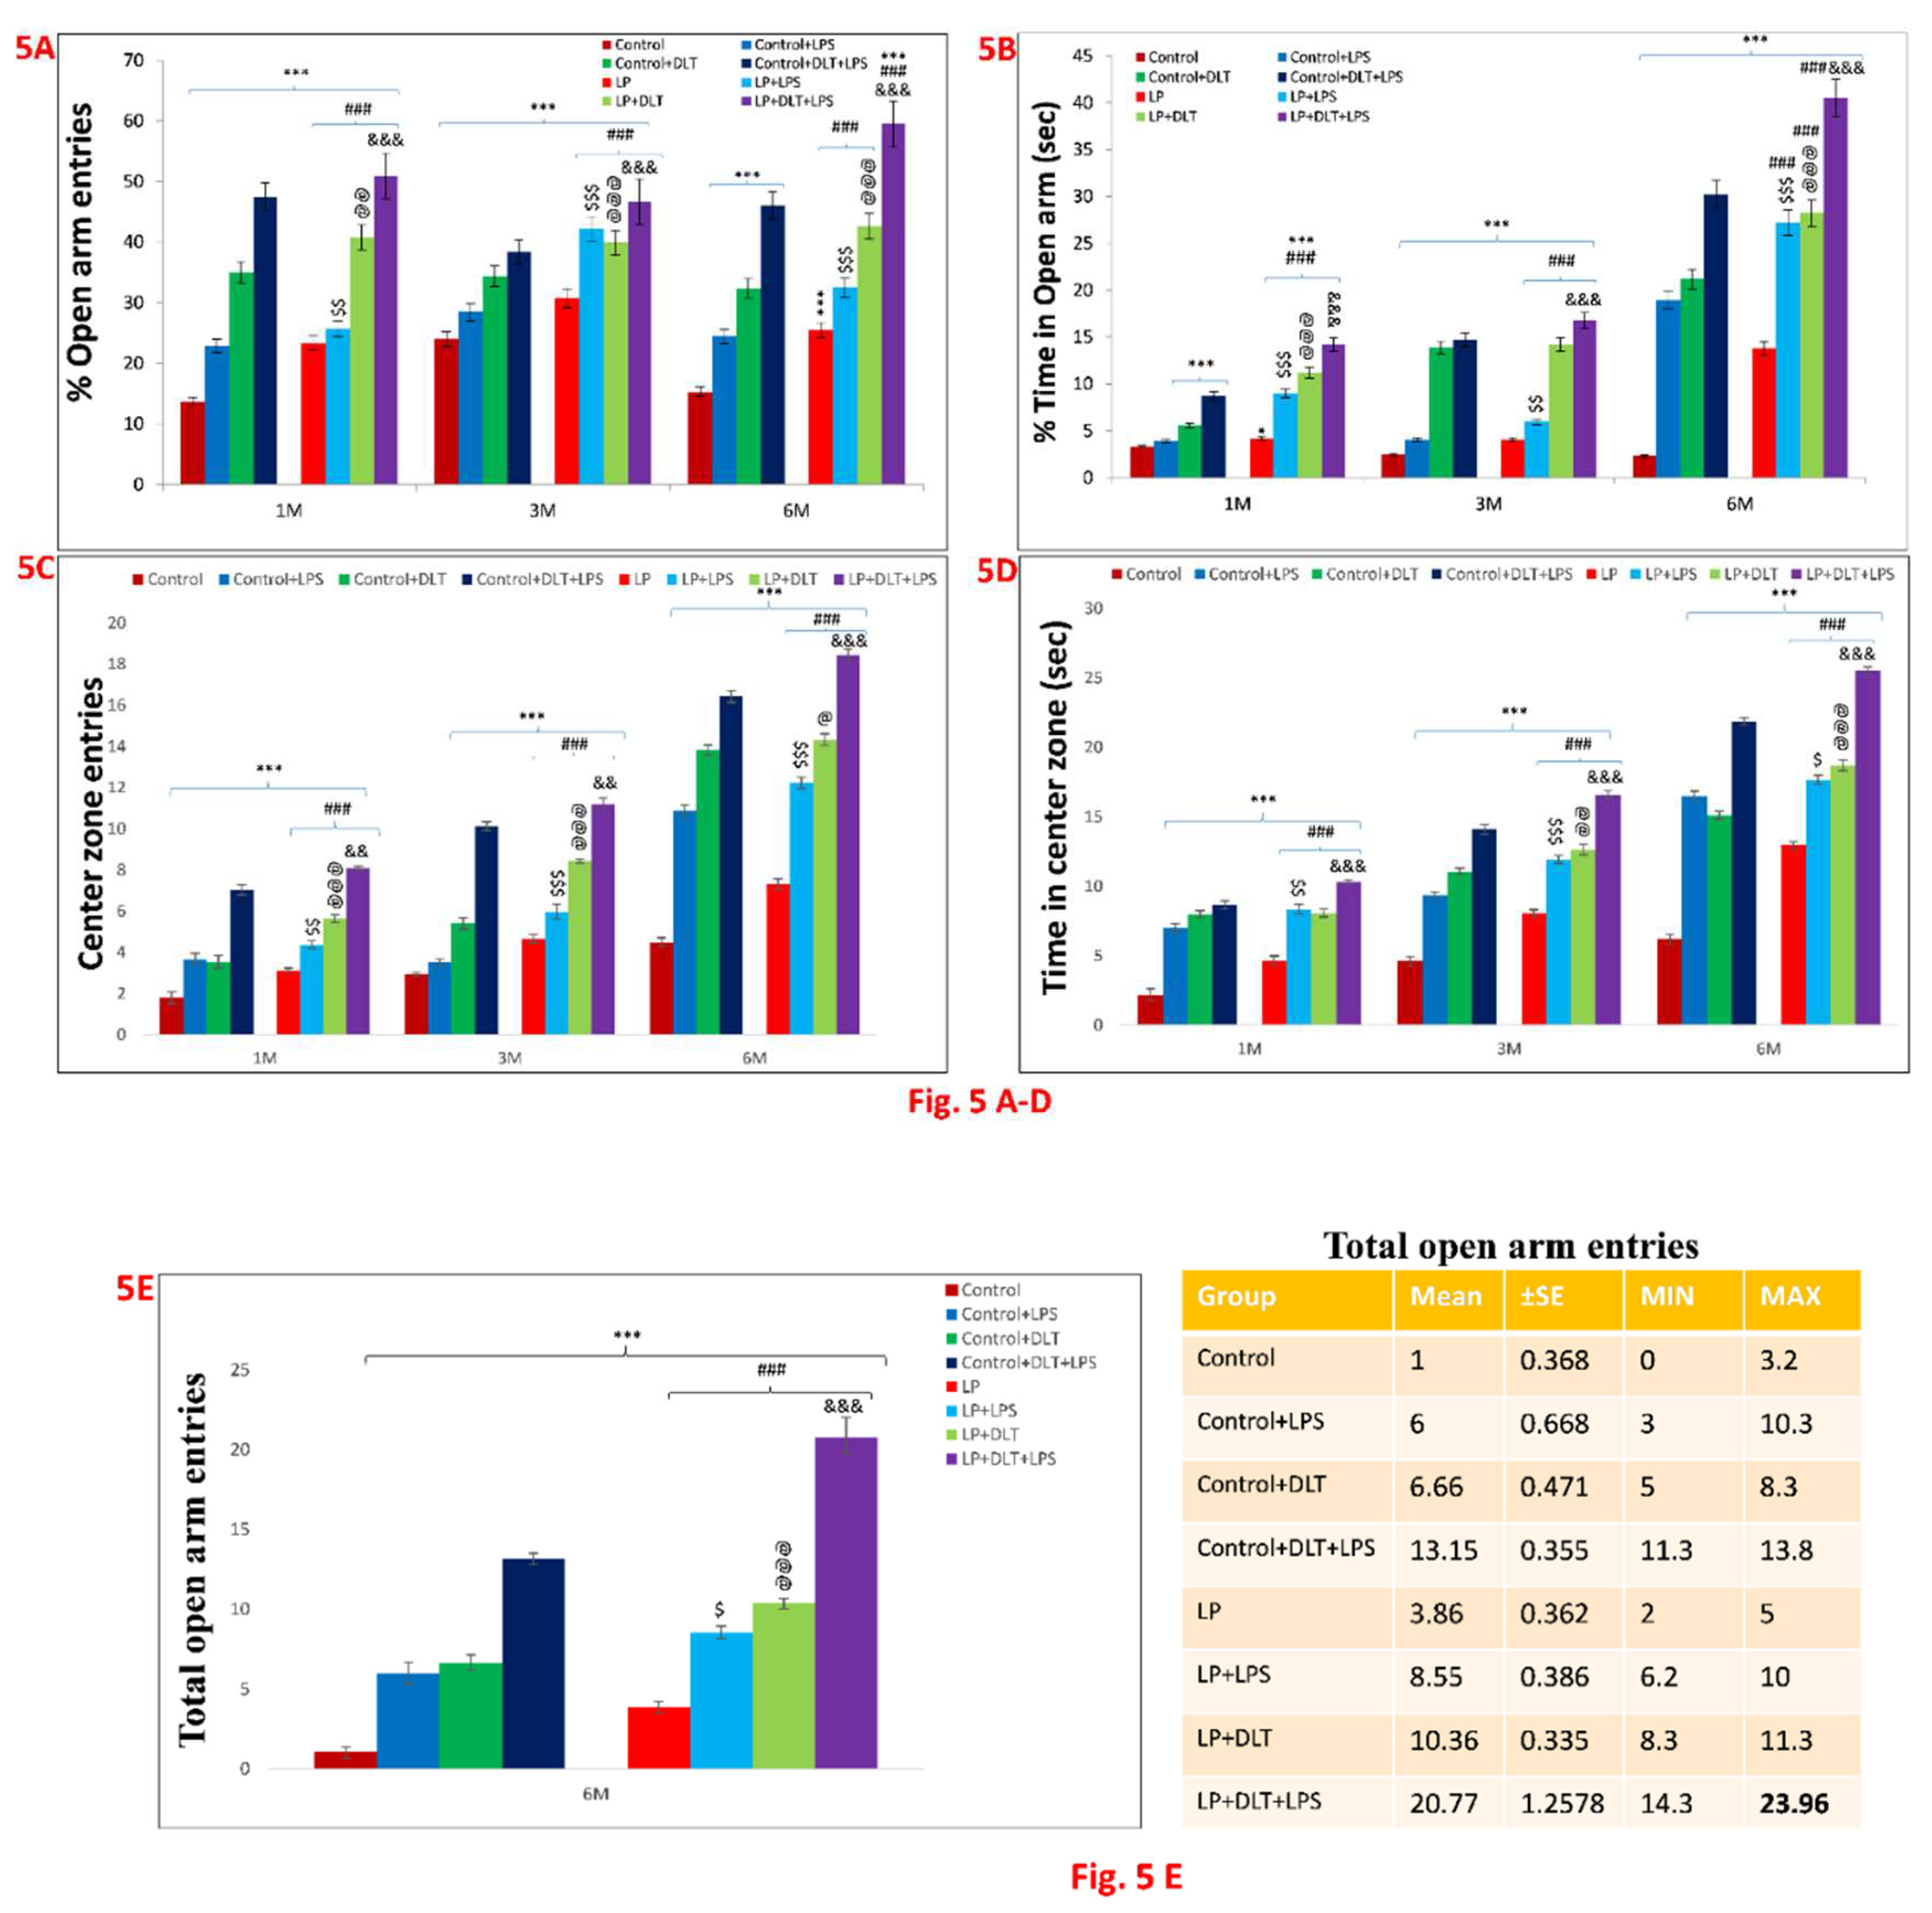
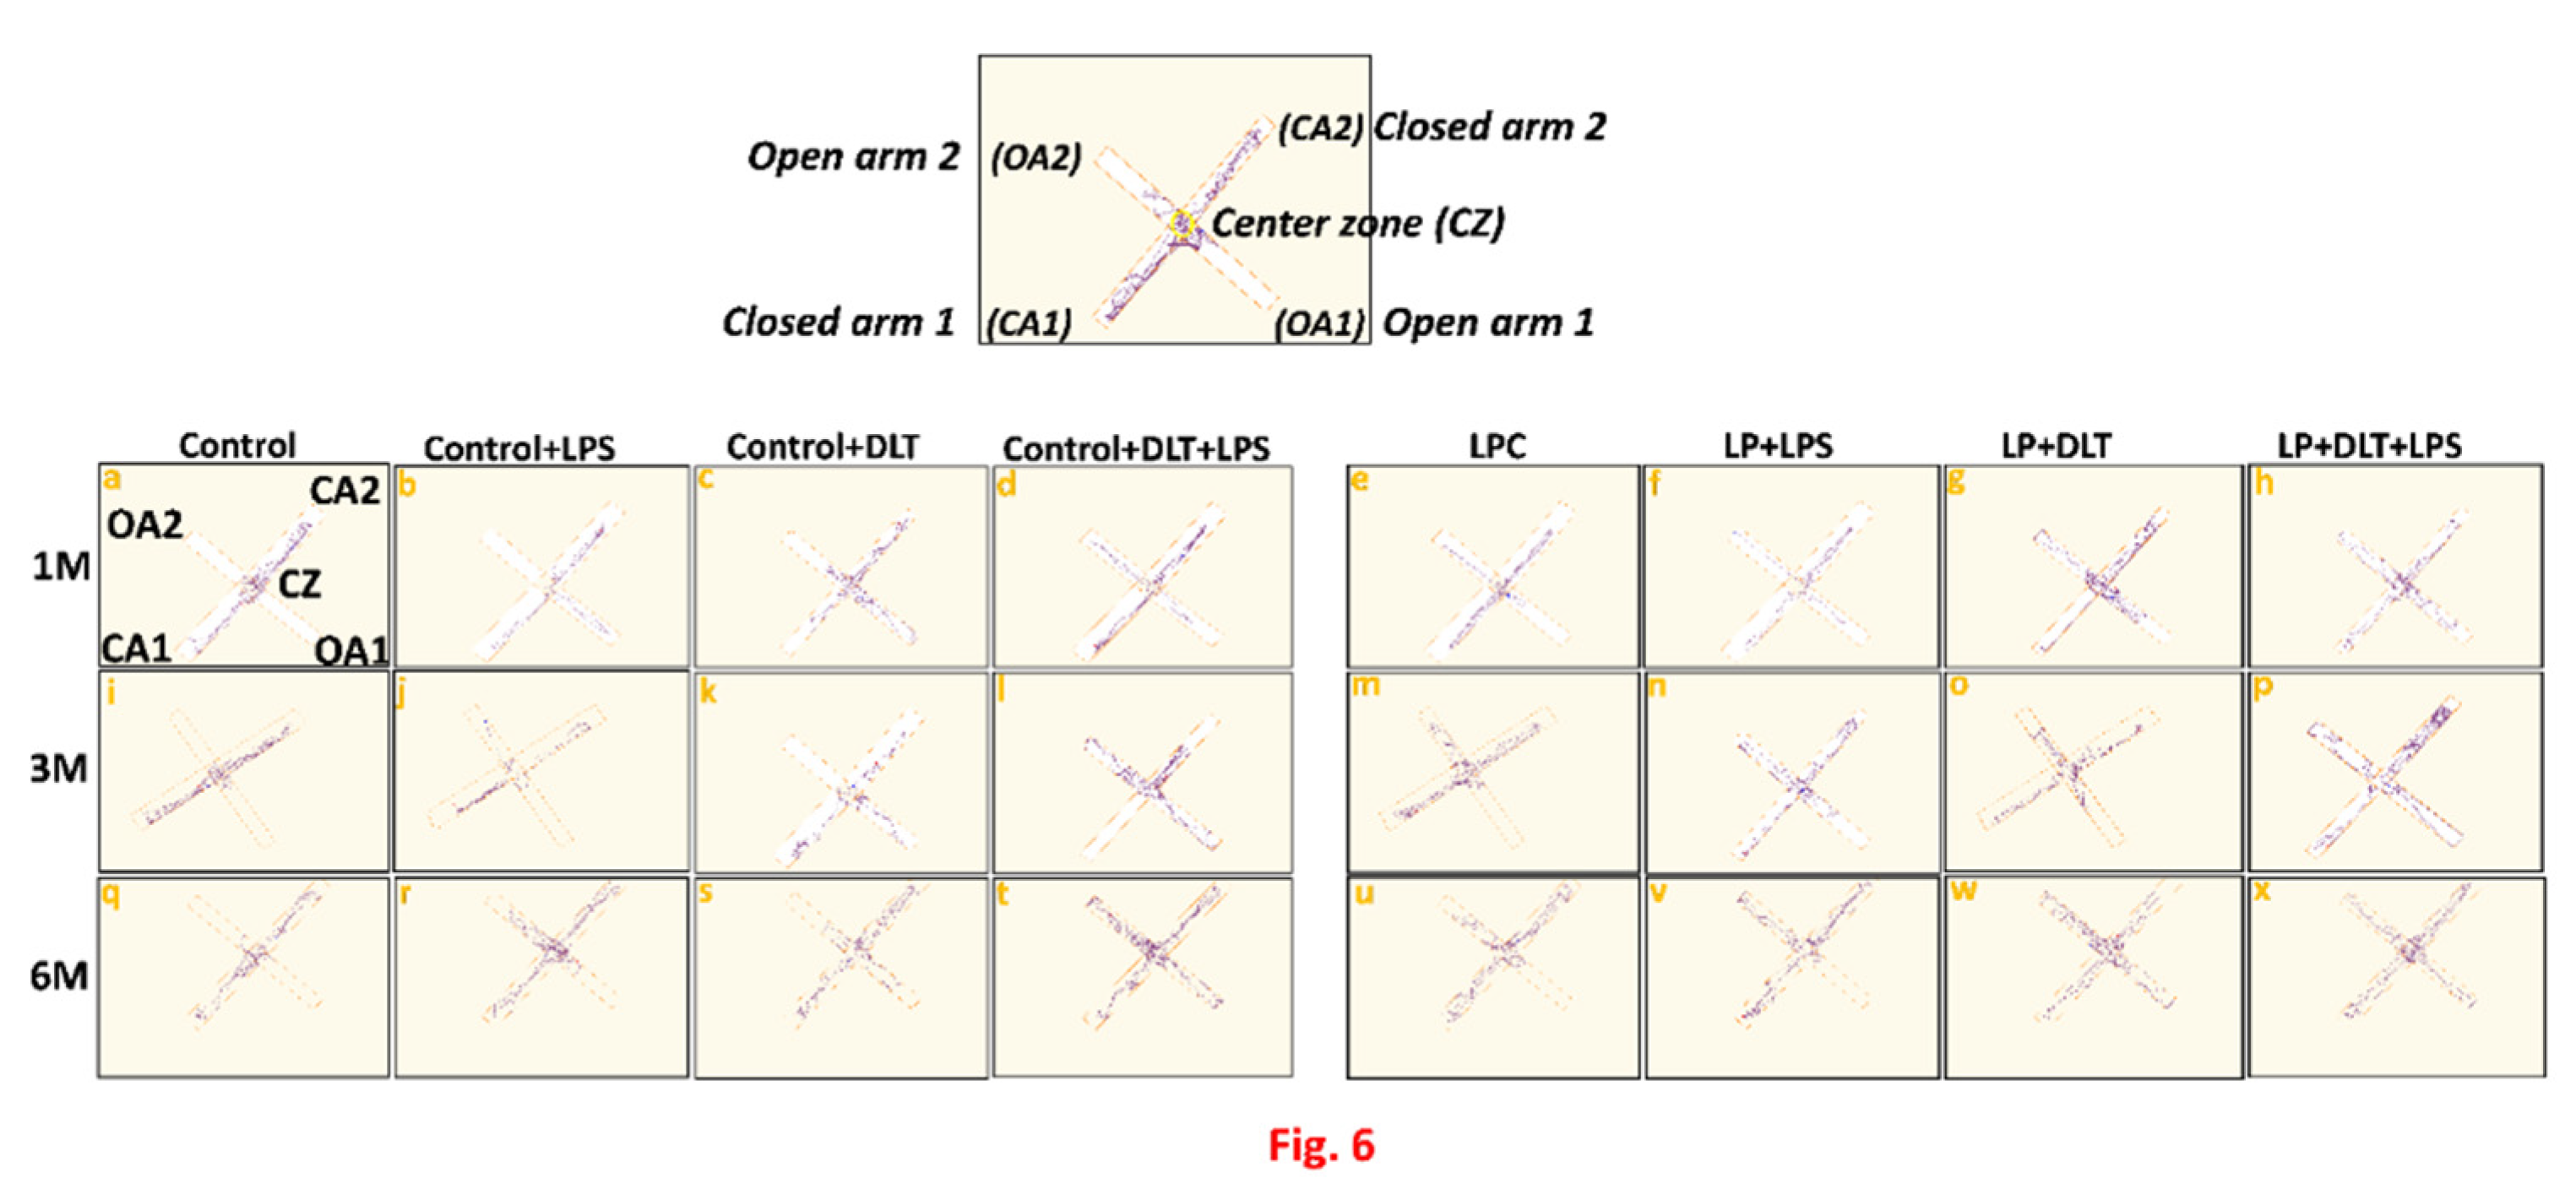
3.3. Elevated Plus Maze Test (EPM) Revealed Low Anxiety Phenotype in Protein Malnourished Rats Treated with Lipopolysaccharide and Deltamethrin
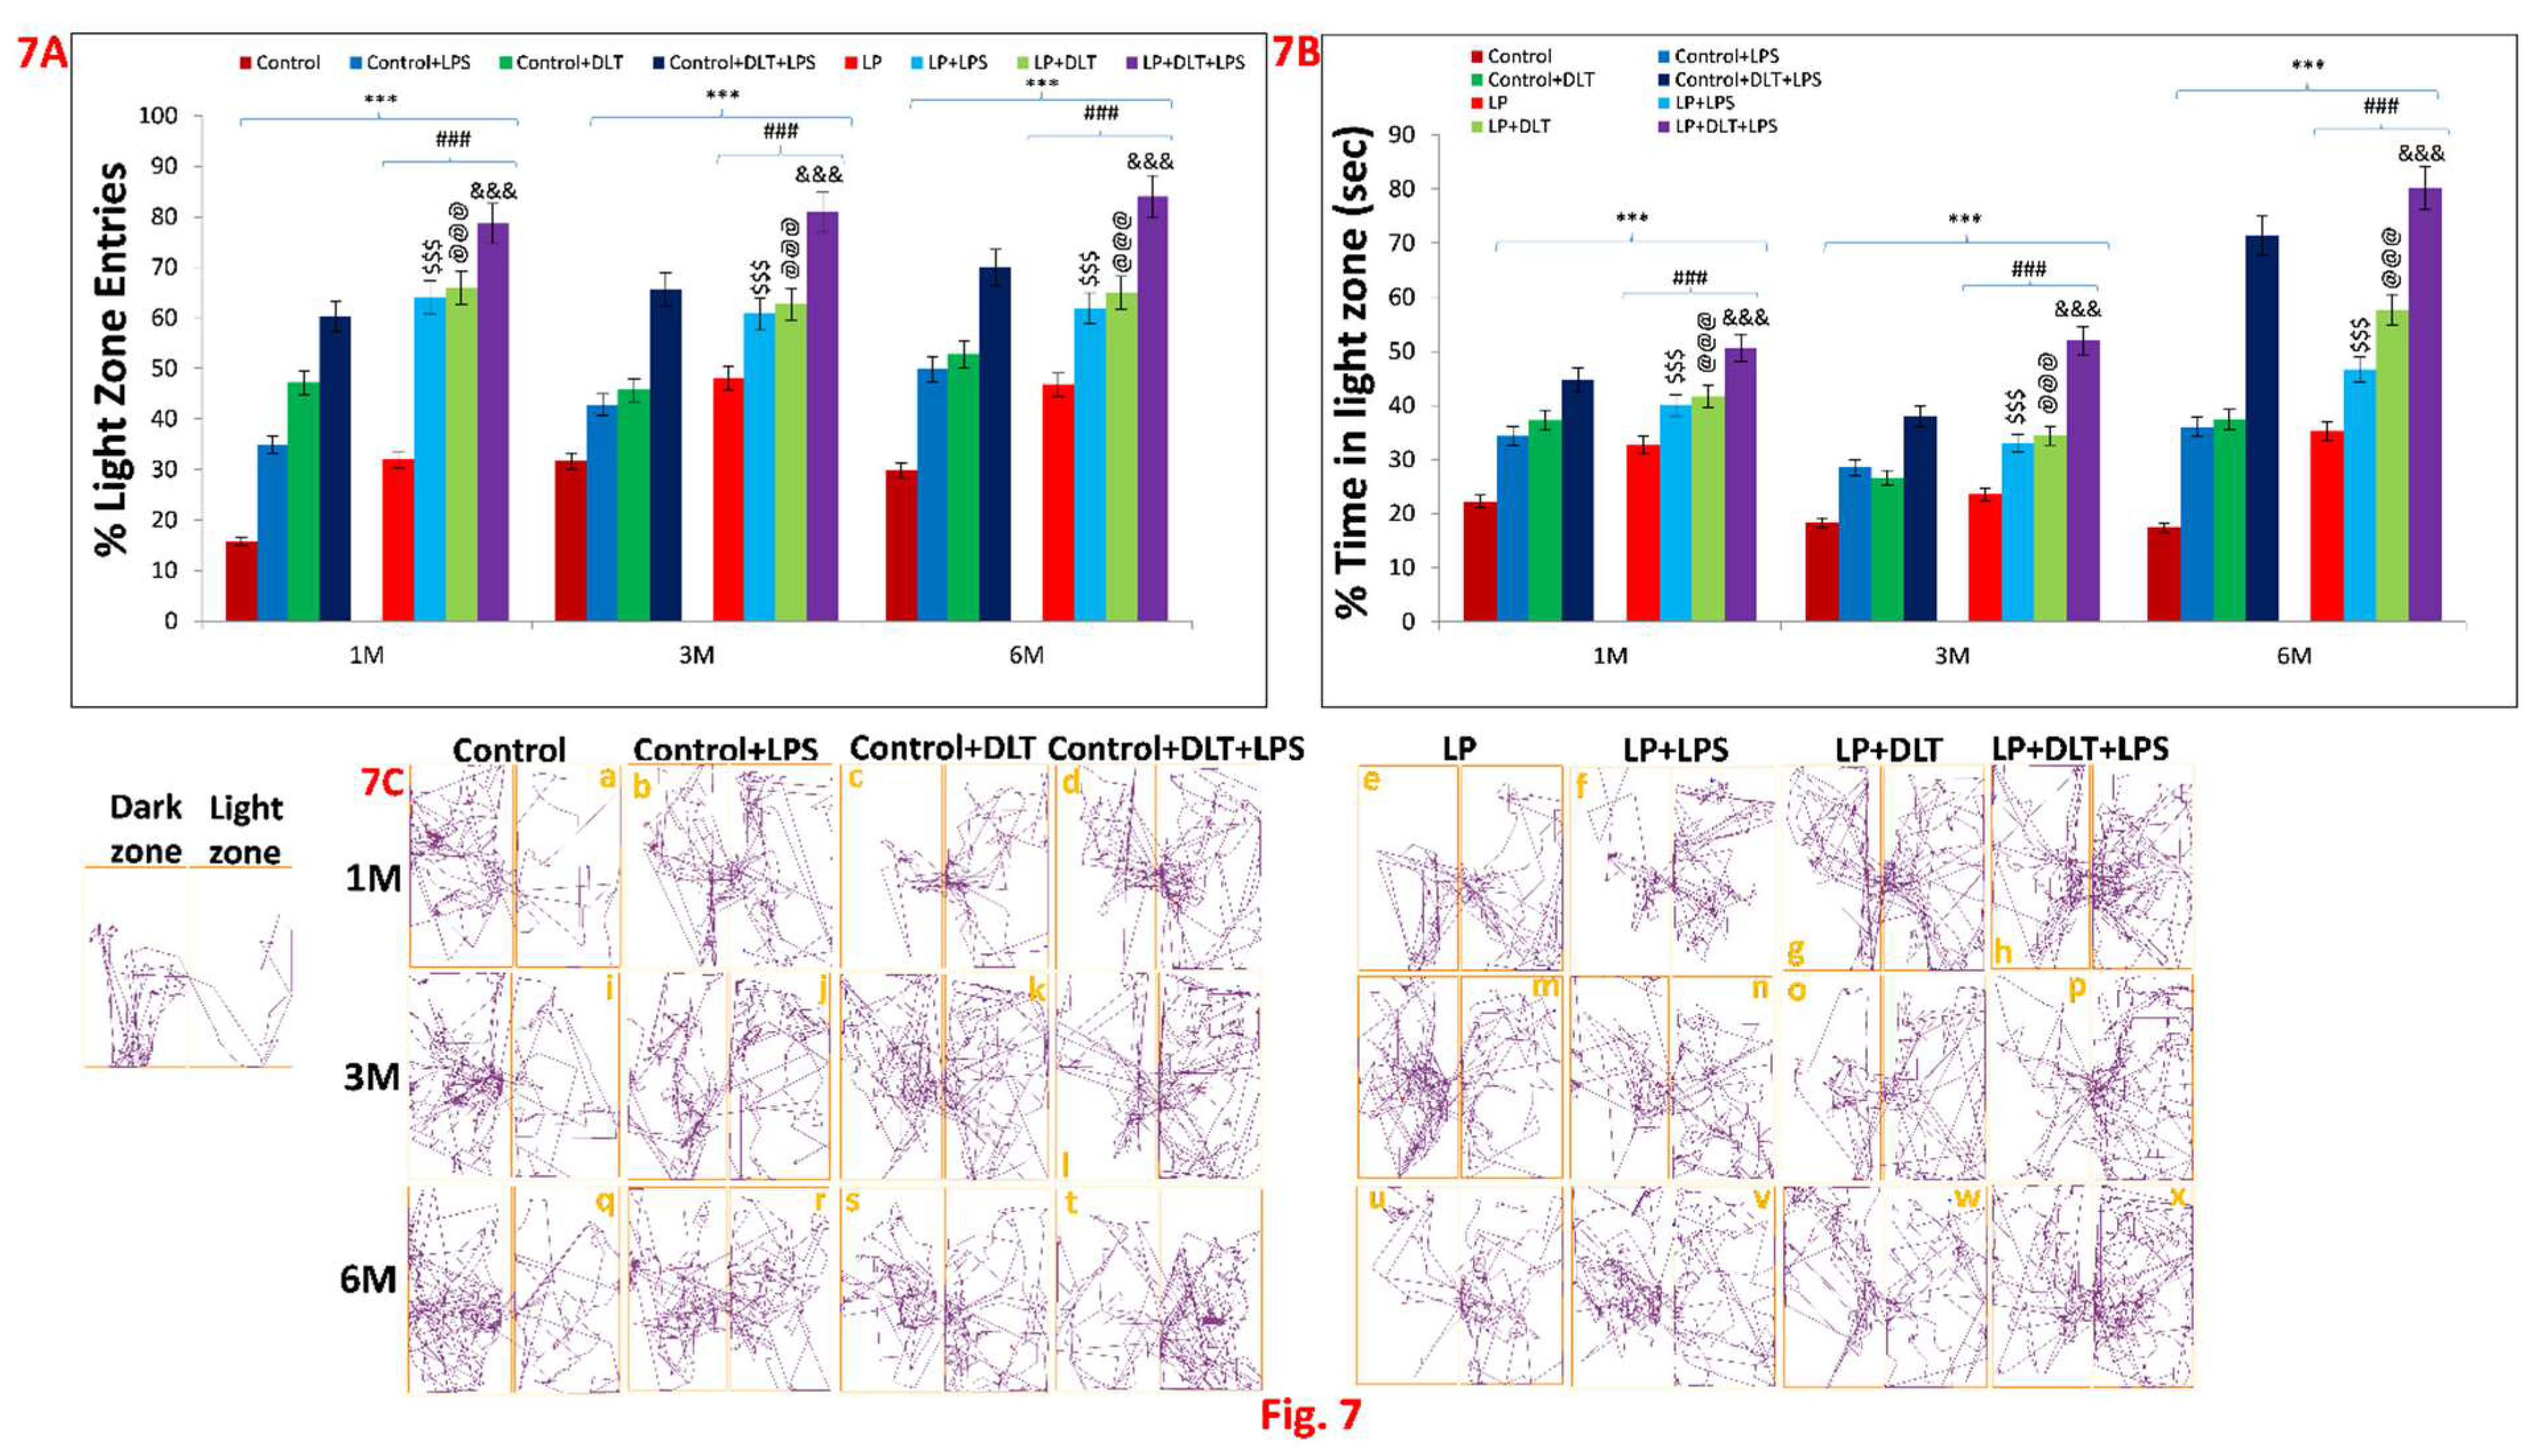
3.4. Light and Dark Box Test also Revealed the Low Anxiety Behaviour in Protein Malnourished Rats Treated with LPS and DLT
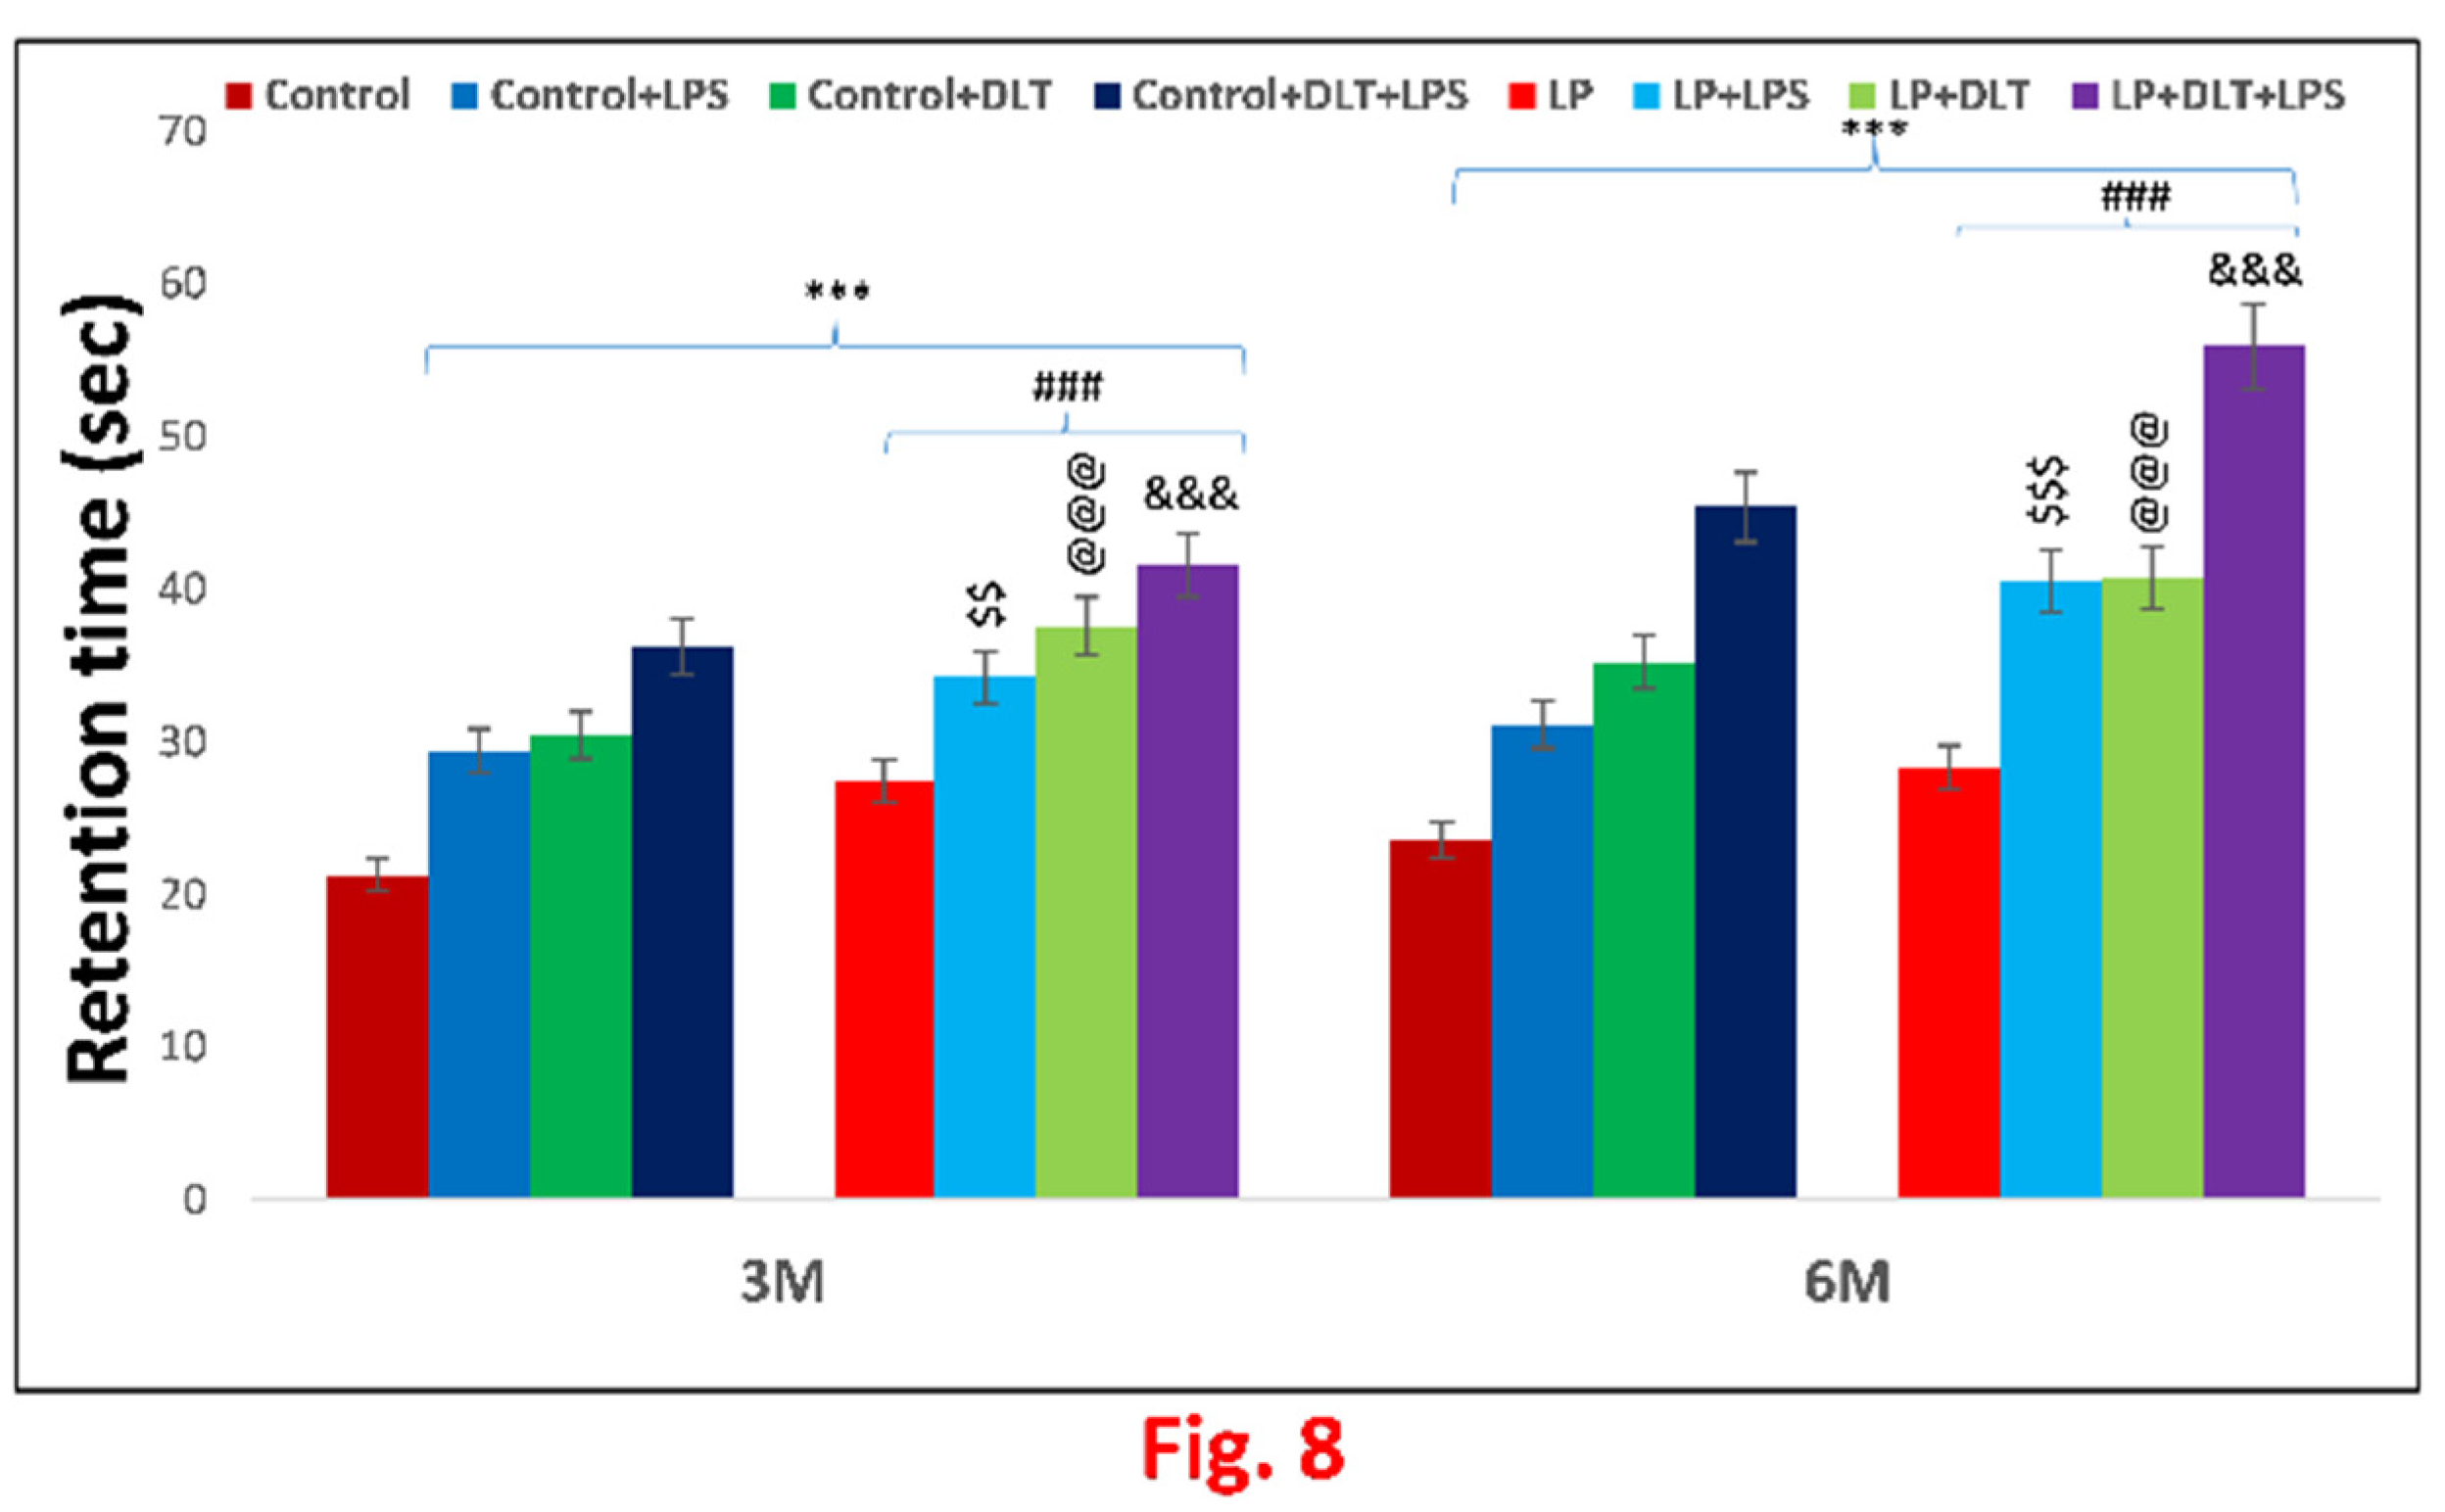
3.5. Cumulative Exposure of LPS and DLT to Protein Malnourished (Multi-Hit) Rats Resulted in Hyperlocomotion and Motor Impulsivity Phenotype
4. Discussion
5. Conclusion
Author Contributions
Institutional Review Board Statement
Acknowledgements
Conflicts of Interest
Abbreviations
References
- Nestler, E.J., Hyman, S.E., 2010. Animal models of neuropsychiatric disorders. Nat. Neurosci. 13(10), 1161-1169. [CrossRef]
- Nelson III, C.A., Gabard-Durnam, L.J., 2020. Early adversity and critical periods: neurodevelopmental consequences of violating the expectable environment. Trends Neurosci. 43(3), 133-143. [CrossRef]
- Eyles, D.W., 2021. How do established developmental risk-factors for schizophrenia change the way the brain develops? Transl. Psychiatry. 11(1), 1-15. [CrossRef]
- Stolp, H., Neuhaus, A., Sundramoorthi, R., Molnár, Z., 2012. The long and the short of it: gene and environment interactions during early cortical development and consequences for long-term neurological disease. Front. Psychiatry. (3), 50. [CrossRef]
- Milbocker, K.A., Campbell, T.S., Collins, N., Kim, S., Smith, I.F., Roth, T.L., Klintsova, A.Y., 2021. Glia-driven brain circuit refinement is altered by early-life adversity: Behavioral outcomes. Front. Behav. Neurosci. 2(15), 15:786234. [CrossRef]
- Sarkar, T., Patro, N., Patro, I.K., 2020. Neuronal changes and cognitive deficits in a multi-hit rat model following cumulative impact of early life stressors. Biol. Open. 9(9), bio054130. [CrossRef]
- Onaolapo, O.J., Onaolapo, A.Y., 2021. Nutrition, nutritional deficiencies, and schizophrenia: An association worthy of constant reassessment. World J. Clin. Cases. 9(28), 8295. [CrossRef]
- Sarkar, T., Patro, N., Patro, I.K., 2019. Cumulative multiple early life hits-a potent threat leading to neurological disorders. Brain Res. Bull. 147, 58-68. [CrossRef]
- Teissier, A., Le Magueresse, C., Olusakin, J., Andrade da Costa, B.L., De Stasi, A.M., Bacci, A., Imamura, Kawasawa, Y., Vaidya, V.A., Gaspar, P., 2020. Early-life stress impairs postnatal oligodendrogenesis and adult emotional behaviour through activity-dependent mechanisms. Mol. Psychiatry. 25(6), 1159-1174. [CrossRef]
- Smith, S.E., Li, J., Garbett, K., Mirnics, K., Patterson, P.H., 2007. Maternal immune activation alters fetal brain development through interleukin-6. J. Neurosci. 27(40), 10695-10702. [CrossRef]
- Dammann, O., Kuban, K.C., Leviton, A., 2002. Perinatal infection, fetal inflammatory response, white matter damage, and cognitive limitations in children born preterm. Ment. retard. dev. disabil. res. rev. 8(1), 46-50. [CrossRef]
- Koponen, H., Rantakallio, P., Veijola, J., Jones, P., Jokelainen, J., Isohanni, M., 2004. Childhood central nervous system infections and risk for schizophrenia, Eur Arch Psychiatry Clin Neurosci. 254(1) (2004), 9-13, . [CrossRef]
- Miller, B.J., Culpepper, N., Rapaport, M.H., Buckley, P., 2013. Prenatal inflammation and neurodevelopment in schizophrenia: a review of human studies. Prog. Neuropsychopharmacol. Biol. Psychiatry. (42), 92-100. [CrossRef]
- Akdeniz C., Tost H., Streit, F., Haddad, L., Wüst, S., Schäfer, A., Schneider, M., Rietschel, M., Kirsch, P., Meyer-Lindenberg, A., 2014. Neuroimaging evidence for a role of neural social stress processing in ethnic minority–associated environmental risk. JAMA psychiatry. 71(6), 672-680. [CrossRef]
- Uher, R., 2014. Gene–environment interactions in severe mental illness. Front. Psychiatry. (5), 48. [CrossRef]
- Georgieff, M.K., Ramel, S.E., Cusick, S.E., 2018. Nutritional influences on brain development. Acta Paediatr. 107(8), 1310-1321. [CrossRef]
- Cortés-Albornoz, M.C., García-Guáqueta, D.P., Velez-van-Meerbeke, A., Talero- Gutiérrez, C., 2021. Maternal nutrition and neurodevelopment: A scoping review. Nutrients. 13(10), 3530. [CrossRef]
- Alamy, M., Bengelloun, W.A., 2012. Malnutrition and brain development: an analysis of the effects of inadequate diet during different stages of life in rat, Neurosci. Biobehav. Rev. 36(6), 1463-1480. [CrossRef]
- Naik, A.A., Patro, N., Seth, P., Patro, I.K., 2017. Intra-generational protein malnutrition impairs temporal astrogenesis in rat brain. Biol. Open. 6(7), 931-942. [CrossRef]
- Patro, N., Naik, A.A., Patro, I.K., 2019. Developmental changes in oligodendrocyte genesis, myelination, and associated behavioral dysfunction in a rat model of intra-generational protein malnutrition. Mol. Neurobiol. 56(1), 595-610. [CrossRef]
- Reyes-Castro, L.A., Rodriguez, J.S., Charco, R., Bautista, C.J., Larrea, F., Nathanielsz, P.W., Zambrano, E., 2012. Maternal protein restriction in the rat during pregnancy and/or lactation alters cognitive and anxiety behaviors of female offspring. Int. J. Dev. Neurosci. 30(1), 39-45. [CrossRef]
- Naik, A.A., Patro, I.K. Patro, N., 2015. Slow physical growth, delayed reflex ontogeny, and permanent behavioral as well as cognitive impairments in rats following intra-generational protein malnutrition. Front. Neurosci. 9, 446. [CrossRef]
- Sinha, S., Patro, N., Tiwari, P.K., Patro, I.K., 2020. Maternal Spirulina supplementation during pregnancy and lactation partially prevents oxidative stress, glial activation and neuronal damage in protein malnourished F1 progeny. Neurochem. Int. (141), 104877. [CrossRef]
- Smith, B.L., Reyes, T.M., 2017. Offspring neuroimmune consequences of maternal malnutrition: potential mechanism for behavioral impairments that underlie metabolic and neurodevelopmental disorders. Front. Neuroendocrinol. (47), 109-122. [CrossRef]
- Eyles, D.W., Dean, A.J., 2016. Maternal nutritional deficiencies and schizophrenia: Lessons from animal models with a focus on developmental vitamin D deficiency. In Handbook of Behavioral Neuroscience (Vol. 23, pp. 243-264). Elsevier.
- Laus, M.F., Vales, L.D.M.F., Costa, T.M.B., Almeida, S.S., 2011. Early postnatal protein-calorie malnutrition and cognition: a review of human and animal studies. Int. J. Environ. Res. Public Health. 8(2) (2011), 590-612. [CrossRef]
- Françolin-Silva, A.L., da Silva Hernandes, A., Fukuda, M.T.H., Valadares, C.T., Almeida, S.S., 2006. Anxiolytic-like effects of short-term postnatal protein malnutrition in the elevated plus-maze test. Behav. Brain Res. 173(2), 310-314. [CrossRef]
- Walson, J.L., Berkley, J.A., 2018. The impact of malnutrition on childhood infections. Curr. Opin. Infect. Dis. 31(3), 231. [CrossRef]
- Meyer, U. 2014. Prenatal poly (i: C) exposure and other developmental immune activation models in rodent systems. Biol. Psychiatry, 75(4), 307-315. [CrossRef]
- Sarkar, T., Patro, N., Patro, I.K., 2022. Perinatal exposure to synergistic multiple stressors leads to cellular and behavioral deficits mimicking Schizophrenia-like pathology. Biol. Open. 11(3), bio058870. [CrossRef]
- Eyles, D.W., 2021. How do established developmental risk-factors for schizophrenia change the way the brain develops? Transl. Psychiatry. 11(1), 1-15. [CrossRef]
- Guan, Z., Fang, J., 2006. Peripheral immune activation by lipopolysaccharide decreases neurotrophins in the cortex and hippocampus in rats. Brain Behav. Immun. 20(1), 64-71. [CrossRef]
- Zhang, X.Y., Liang, J., Chen, D.C., Xiu, M.H., De Yang, F., Kosten, T.A., Kosten, T.R., 2012. Low BDNF is associated with cognitive impairment in chronic patients with schizophrenia. Psychopharmacology Berl. 222(2), 277-284. [CrossRef]
- Smith, J.A., Das, A., Ray, S.K., Banik, N.L., 2012. Role of pro-inflammatory cytokines released from microglia in neurodegenerative diseases. Brain Res. Bull. 87(1), 10-20. [CrossRef]
- Zhao, J., Bi, W., Xiao, S., Lan, X., Cheng, X., Zhang, J., Lu, D., Wei, W., Wang, Y., Li, H., Fu, Y., 2019. Neuroinflammation induced by lipopolysaccharide causes cognitive impairment in mice. Scientific reports, 9(1), 1-12. [CrossRef]
- Chamera, K., Trojan, E., Szuster-Głuszczak, M., Basta-Kaim, A., 2020. The potential role of dysfunctions in neuron-microglia communication in the pathogenesis of brain disorders. Curr. Neuropharmacol. 18(5), 408-430. [CrossRef]
- Vogelzangs, N., De Jonge, P., Smit, J.H., Bahn, S., Penninx, B.W., 2016. Cytokine production capacity in depression and anxiety. Transl. Psychiatry. 6(5), e825-e825. [CrossRef]
- Gaspersz, R., Lamers, F., Kent, J.M., Beekman, A.T., Smit, J.H., van Hemert, A.M., Schoevers, R.A., Penninx, B.W., 2017. Anxious distress predicts subsequent treatment outcome and side effects in depressed patients starting antidepressant treatment. J. Psychiatr. Res. 84, 41-48. [CrossRef]
- Casida, J.E., Quistad, G.B., 1998. Golden age of insecticide research: past, present, or future? Annu. Rev. Entomol. 43 1-16, . [CrossRef]
- Pitzer, E.M., Sugimoto, C., Gudelsky, G.A., Huff Adams, C.L., Williams, M.T., Vorhees, C.V., 2019. Deltamethrin exposure daily from postnatal day 3–20 in Sprague-Dawley rats causes long-term cognitive and behavioral deficits. Toxicol. Sci. 169(2), 511-523. [CrossRef]
- Pitzer, E.M., Williams, M.T., Vorhees, C.V., 2021. Effects of pyrethroids on brain development and behavior: Deltamethrin. Neurotoxicol Teratol. (87), 106983. [CrossRef]
- Patro, N., Shrivasta va, M., Tripathi, S., Patro, I.K., 2009. S100β upregulation: a possible mechanism of deltamethrin toxicity and motor coordination deficits. Neurotoxicol Teratol. 31(3), 169-176. [CrossRef]
- Chen, N.N., Luo, D.J., Yao, X.Q., Yu, C., Wang, Y., Wang, Q., Wang, J.Z., Liu, G.P., 2012. Pesticides induce spatial memory deficits with synaptic impairments and an imbalanced tau phosphorylation in rats. J. Alzheimer’s Dis. 30(3), 585-594. [CrossRef]
- Hossain, M.M., Belkadi, A., Al-Haddad, S., Richardson, J.R., 2020. Deltamethrin exposure inhibits adult hippocampal neurogenesis and causes deficits in learning and memory in mice. Toxicological Sciences, 178(2), 347-357. [CrossRef]
- Islam, M.S., Azim, F., Saju, H., Zargaran, A., Shirzad, M., Kamal, M., Fatema, K., Rehman, S., Azad, M.M., Ebrahimi-Barough, S., 2021. Pesticides and Parkinson’s disease: Current and future perspective. J. Chem. Neuroanat. 115,101966. [CrossRef]
- Li, Y., Fang, R., Liu, Z., Jiang, L., Zhang, J., Li, H., Liu, C. and Li, F., 2021. The association between toxic pesticide environmental exposure and Alzheimer’s disease: A scientometric and visualization analysis. Chemosphere. 263,128238. [CrossRef]
- Kamel, F., Umbach, D.M., Bedlack, R.S., Richards, M., Watson, M., Alavanja, M.C., Blair, A., Hoppin, J.A., Schmidt, S., Sandler, D.P., 2012. Pesticide exposure and amyotrophic lateral sclerosis. Neurotoxicology. 33(3), 457-462. [CrossRef]
- Parrón, T., Requena, M., Hernández, A.F., Alarcón, R., 2011. Association between environmental exposure to pesticides and neurodegenerative diseases. Toxicol. Appl. Pharmacol. 256(3), 379-385. [CrossRef]
- Xue, Z., Li, X., Su, Q., Xu, L., Zhang, P., Kong, Z., Xu, J., Teng, J., 2013. Effect of synthetic pyrethroid pesticide exposure during pregnancy on the growth and development of infants. Asia Pac J Public Health. 25(4_suppl), 72S-79S. [CrossRef]
- Sinha, S., Patro, N. and Patro, I.K., 2020. Amelioration of neurobehavioral and cognitive abilities of F1 progeny following dietary supplementation with Spirulina to protein malnourished mothers. Brain Behav. Immun. 85, 69-87. [CrossRef]
- Prado, E.L., Dewey, K.G., 2014. Nutrition and brain development in early life. Nutr. Rev. 72(4), 267-284. [CrossRef]
- Hoeijmakers, L., Lucassen, P.J., Korosi, A., 2015. The interplay of early-life stress, nutrition, and immune activation programs adult hippocampal structure and function. Front. Mol. Neurosci. (7), 103. [CrossRef]
- Monk, C., Lugo-Candelas, C., Trumpff, C., 2019. Prenatal developmental origins of future psychopathology: mechanisms and pathways. Annu Rev Clin Psychol. 15, 317. [CrossRef]
- Bayer, T.A., Falkai, P., Maier, W., 1999. Genetic and non-genetic vulnerability factors in schizophrenia: the basis of the two hit hypothesis. J. Psychiatr. 33(6), 543-8. [CrossRef]
- Maynard, T.M., Sikich, L., Lieberman, J.A., LaMantia, A.S., 2001. Neural development, cell-cell signaling, and the “two-hit” hypothesis of schizophrenia. Schizophr. Bull. 27(3), 457-476. [CrossRef]
- Cardoso, F.L., Herz, J., Fernandes, A., Rocha, J., Sepodes, B., Brito, M.A., McGavern, D.B., Brites, D., 2015. Systemic inflammation in early neonatal mice induces transient and lasting neurodegenerative effects. J. Neuroinflammation. 12(1) (2015), 1-18. [CrossRef]
- Dobner, J., Kaser, S., 2018. Body mass index and the risk of infection-from underweight to obesity. Clin. Microbiol. Infect. 24(1) (2018), 24-28. [CrossRef]
- Malik, S., Spencer, S.J., 2019. Early life stress and metabolism. Curr Opin Behav Sci. 28, 25-30. [CrossRef]
- Spencer, S.J., 2013. Perinatal programming of neuroendocrine mechanisms connecting feeding behavior and stress. Front. Neurosci. 7, 109. [CrossRef]
- Peña, C.J., Smith, M., Ramakrishnan, A., Cates, H.M., Bagot, R.C., Kronman, H.G., Patel, B., Chang, A.B., Purushothaman, I., Dudley, J. and Morishita, H., 2019. Early life stress alters transcriptomic patterning across reward circuitry in male and female mice. Nat.Commun.10(1), 5098. [CrossRef]
- Surkan, P.J., Ettinger, A.K., Hock, R.S., Ahmed, S., Strobino, D.M. and Minkovitz, C.S., 2014. Early maternal depressive symptoms and child growth trajectories: a longitudinal analysis of a nationally representative US birth cohort. BMC pediatrics, 14(1), 1-8. http://www.biomedcentral.com/1471-2431/14/185.
- Danese, A., Lewis, S. J., 2017. Psychoneuroimmunology of early-life stress: the hidden wounds of childhood trauma? Neuropsychopharmacology. 42(1), 99-114. [CrossRef]
- Tizard, I., 2008. Sickness behavior, its mechanisms and significance. Anim. Health Res. Rev. 9(1), 87-99. [CrossRef]
- Shattuck, E.C., Muehlenbein, M.P., 2015. Human sickness behavior: ultimate and proximate explanations. Am. J. Phys. Anthropol. 157(1), 1-18. [CrossRef]
- Nemzek, J.A., Hugunin, K., Opp, M.R., 2008. Modeling sepsis in the laboratory: merging sound science with animal well-being, Comp. Med. 58(2), 120-128.
- Bay-Richter, C., Janelidze, S., Hallberg, L., Brundin, L., 2011. Changes in behaviour and cytokine expression upon a peripheral immune challenge. Behav. Brain Res. 222(1), 193-199. [CrossRef]
- Jones, P.B., Rantakallio, P., Hartikainen, A.L., Isohanni, M., Sipila, P., 1998. Schizophrenia as a long-term outcome of pregnancy, delivery, and perinatal complications: a 28-year follow-up of the 1966 north Finland general population birth cohort, Am. J. Psychiatry. 155(3), 355-364. [CrossRef]
- Wahlbeck, K., Forsén, T., Osmond, C., Barker, D.J., Eriksson, J.G., 2001. Association of schizophrenia with low maternal body mass index, small size at birth, and thinness during childhood. Arch. Gen. Psychiatry. 58(1), 48-52. [CrossRef]
- Hatch, B., Healey, D.M., Halperin, J.M., 2014. Associations between birth weight and attention-deficit/hyperactivity disorder symptom severity: indirect effects via primary neuropsychological functions. J Child Psychol Psychiatry. 55(4), 384-392. [CrossRef]
- Kim, J.H., Kim, J.Y., Lee, J., Jeong, G.H., Lee, E., Lee, S., Lee, K.H., Kronbichler, A., Stubbs, B., Solmi, M., Koyanagi, A., 2020. Environmental risk factors, protective factors, and peripheral biomarkers for ADHD: an umbrella review. Lancet Psychiatry. 7(11), 955-970. [CrossRef]
- Seibenhener, M.L., Wooten, M.C., 2015. Use of the open field maze to measure locomotor and anxiety-like behavior in mice. JoVE (Journal of Visualized Experiments), (96), p.e52434. [CrossRef]
- Lezak, K. R., Missig, G., Carlezon Jr, W. A., 2017. Behavioral methods to study anxiety in rodents. Dialogues Clin. Neurosci. 19(2), 181-191. https://doi 10.31887/DCNS.2017.19.2/wcarlezon.
- La-Vu, M., Tobias, B.C., Schuette, P.J., Adhikari, A., 2020. To approach or avoid: an introductory overview of the study of anxiety using rodent assays. Front. Behav. Neurosci. (14), 145. [CrossRef]
- Bilkei-Gorzo, A., Racz, I., Michel, K., Zimmer, A., 2002. Diminished anxiety-and depression-related behaviors in mice with selective deletion of the Tac1 gene. J. Neurosci. 22(22) (2002), 10046-10052. [CrossRef]
- Pawlak, C.R., Ho, Y.J., Schwarting, R.K., 2008. Animal models of human psychopathology based on individual differences in novelty-seeking and anxiety. Neurosci. Biobehav. Rev. 32(8), 1544-1568. [CrossRef]
- Monterosso, J., Ainslie, G., 1999. Beyond discounting: possible experimental models of impulse control. J. Psychopharmacol. 146(4), 339-347. [CrossRef]
- Arce, E., Santisteban, C., 2006. Impulsivity: a review. Psicothema. 18 (2) 213-220.
- Ralph, R.J., Paulus, M.P., Fumagalli, F., Caron, M.G., Geyer, M.A., 2001. Prepulse inhibition deficits and perseverative motor patterns in dopamine transporter knock-out mice: differential effects of D1 and D2 receptor antagonists. J. Neurosci. 21(1), 305-313. [CrossRef]
- Kalueff, A.V., Stewart, A.M., Song, C., Berridge, K.C., Graybiel, A.M., Fentress, J.C., 2016. Neurobiology of rodent self-grooming and its value for translational neuroscience. Nat. Rev. Neurosci. 17(1), 45-59. [CrossRef]
- Kalueff, A.V., Tuohimaa, P., 2005. The grooming analysis algorithm discriminates between different levels of anxiety in rats: potential utility for neurobehavioural stress research. J. Neurosci. Methods. 143(2), 169-177. [CrossRef]
- Denmark, A., Tien, D., Wong, K., Chung, A., Cachat, J., Goodspeed, J., Grimes, C., Elegante, M., Suciu, C., Elkhayat, S., Bartels, B., 2010. The effects of chronic social defeat stress on mouse self-grooming behavior and its patterning. Behav. Brain Res. 208(2), 553-559. [CrossRef]
- Joel, D., 2006. Current animal models of obsessive compulsive disorder: a critical review. Prog. Neuropsychopharmacol, Biol. Psychiatry, 30(3), 374-388. [CrossRef]
- Feusner, J.D., Hembacher, E., Phillips, K.A., 2009. The mouse who couldn’t stop washing: pathologic grooming in animals and humans. CNS Spectr. 14(9), 503-513. [CrossRef]
- Schmeisser, M.J., Ey, E., Wegener, S., Bockmann, J., Stempel, A.V., Kuebler, A., Janssen, A.L., Udvardi, P.T., Shiban, E., Spilker, C., Balschun, D., 2012. Autistic-like behaviours and hyperactivity in mice lacking ProSAP1/Shank2. Nature. 486(7402), 256-260. [CrossRef]
- Sungur, A.Ö., Vörckel, K.J., Schwarting, R.K., Wöhr, M., 2014. Repetitive behaviors in the Shank1 knockout mouse model for autism spectrum disorder: developmental aspects and effects of social context. J. Neurosci. Methods. (234), 92-100. [CrossRef]
- Wolff, S., Chess, S., 1964. A behavioural study of schizophrenic children, Acta Psychiatr. Scand. 40(4), 438-66. https://:10.1111/j.1600-0447.1964.tb07496.x.
- Roehr, B., 2013. American psychiatric association explains DSM-5. 346:f3591346. [CrossRef]
- Lange, K.W., 2020. Micronutrients and diets in the treatment of attention-deficit/hyperactivity disorder: chances and pitfalls. Front. Psychiatry, 11, 102. https//doi:10.3389/fpsyt.2020.00102.
- Marx, W., Moseley, G., Berk, M., Jacka, F., 2017. Nutritional psychiatry: the present state of the evidence. Proc Nutr Soc. 76(4), 427-436. [CrossRef]
- Teasdale, S.B., Müller-Stierlin, A.S., Ruusunen, A., Eaton, M., Marx, W., Firth, J., 2021. Prevalence of food insecurity in people with major depression, bipolar disorder, and schizophrenia and related psychoses: A systematic review and meta-analysis. Crit Rev Food Sci Nutr.1-18. [CrossRef]
- Almeida, S.S., Garcia, R.A., Cibien, M.M., De Araujo, M., Moreira, G., De Oliveira, L.M., 1994. The ontogeny of exploratory behaviors in early-protein-malnourished rats exposed to the elevated plus-maze test. Psychobiol. 22(4), 283-288.
- Bobyn, P.J., Corbett, D., Saucier, D.M., Noyan-Ashraf, M.H., Juurlink, B.H., Paterson, P.G., 2005. Protein-energy malnutrition impairs functional outcome in global ischemia. Exp. Neurol. 196(2), 308-315. [CrossRef]
- Péter, Z., Oliphant, M.E. and Fernandez, T.V., 2017. Motor stereotypies: a pathophysiological review. Front. Neurosci. 11(171), https:// doi: 10.3389/fnins.2017.00171.
- Ridley, R.M., 1994. The psychology of perseverative and stereotyped behaviour. Prog. Neurobiol. 44(2), 221-231. [CrossRef]
- Hoptman, M.J., Ahmed, A.O., 2016. Neural foundations of mood-induced impulsivity and impulsive aggression in schizophrenia. Curr. Behav. Neurosci. Rep. 3(3), 248-255. [CrossRef]
- van Erp, T.G., Baker, R.A., Cox, K., Okame, T., Kojima, Y., Eramo, A., Potkin, S.G., 2020. Effect of brexpiprazole on control of impulsivity in schizophrenia: a randomized functional magnetic resonance imaging study. Psychiatry Res. Neuroimaging. (301), 111085. [CrossRef]
- Grassi, G., Pallanti, S., Righi, L., Figee, M., Mantione, M., Denys, D., Piccagliani, D., Rossi, A., Stratta, P., 2015. Think twice: Impulsivity and decision making in obsessive–compulsive disorder. J. Behav. Addict. 4(4), 263-272. [CrossRef]
- Krakowski, A.D., Cost, K.T., Anagnostou, E., Lai, M.C., Crosbie, J., Schachar, R., Georgiades, S., Duku, E., Szatmari, P., 2020. Inattention and hyperactive/impulsive component scores do not differentiate between autism spectrum disorder and attention-deficit/hyperactivity disorder in a clinical sample. Mol. Autism. 11(1), 1-13. [CrossRef]
- Grimm, O., Kranz, T.M., Reif, A., 2020. Genetics of ADHD: what should the clinician know? Curr. Psychiatry Rep. 22(4), 1-8, . [CrossRef]
- Richardson, J.R., Taylor, M.M., Shalat, S.L., Guillot III, T.S., Caudle, W.M., Hossain, M.M., Mathews, T.A.S.R., Cory-Slechta, D.A., Miller, G.W., 2015. Developmental pesticide exposure reproduces features of attention deficit hyperactivity disorder. FASEB J. 29(5), 1960-1972. [CrossRef]
- Singh, K. Patro, N., Pradeepa, M., Patro, I., 2017. Neonatal lipopolysaccharide infection causes demyelination and behavioral deficits in adult and senile rat brain. Ann. Neurosci. , 24(3), 146-154. [CrossRef]
- Baghel, M.S., Singh, B., Dhuriya, Y.K., Shukla, R.K., Patro, N., Khanna, V.K., Patro, I.K., Thakur, M.K., 2018. Postnatal exposure to poly (I: C) impairs learning and memory through changes in synaptic plasticity gene expression in developing rat brain. Neurobiol. Learn. Mem. 155, 379-389. [CrossRef]
- Handley, S.L., Mithani, S., 1984. Effects of alpha-adrenoceptor agonists and antagonists in a maze-exploration model of ‘fear’-motivated behaviour. Naunyn Schmiedebergs Arch. Pharmacol. 327(1), 1-5. [CrossRef]
- Atrooz, F., Alkadhi, K.A., Salim, S., 2021. Understanding stress: Insights from rodent models, Current Research in Neurobiology, 2, 100013, . [CrossRef]
- Pellow, S., Chopin, P., File, S.E., Briley, M., 1985. Validation of open: closed arm entries in an elevated plus-maze as a measure of anxiety in the rat. J. Neurosci. Methods. 14(3), 149-167. [CrossRef]
- Komada, M., Takao, K., Miyakawa, T., 2008. Elevated plus maze for mice. J. Vis. Exp. (22), p.e1088. [CrossRef]
- Li, J., Olsen, J., Vestergaard, M., Obel, C., 2010. Attention-deficit/hyperactivity disorder in the offspring following prenatal maternal bereavement: a nationwide follow-up study in Denmark. Eur. Child Adolesc. Psychiatry. 19(10), 747-753. [CrossRef]
- Menet, J.S., Rosbash, M., 2011. When brain clocks lose track of time: cause or consequence of neuropsychiatric disorders. Curr. Opin. Neurobiol. 21(6), 849-857. [CrossRef]
- Takeuchi, H., Iba, M., Inoue, H., Higuchi, M., Takao, K., Tsukita, K., Karatsu, Y., Iwamoto, Y., Suhara, T., Miyakawa, T., Trojanowski, J.Q., 2011. P301S mutant human tau transgenic mice manifest early symptoms of human tauopathies with dementia and altered sensorimotor gating. PloS one. 6(6), e21050. [CrossRef]
- Tian, Y.H., Baek, J.H., Lee, S.Y., Jang, C.G., 2010. Prenatal and postnatal exposure to bisphenol a induces anxiolytic behaviors and cognitive deficits in mice. Synapse. 64(6), 432-439. [CrossRef]
- Crawley, J., Goodwin, F.K., 1980. Preliminary report of a simple animal behavior model for the anxiolytic effects of benzodiazepines. Pharmacol Biochem Behav. 13(2), 167-170. [CrossRef]
- Birkett, M.A., Shinday, N.M., Kessler, E.J., Meyer, J.S., Ritchie, S., Rowlett, J.K., 2011. Acute anxiogenic-like effects of selective serotonin reuptake inhibitors are attenuated by the benzodiazepine diazepam in BALB/c mice. Pharmacol. Biochem. Behav. 98(4), 544-551. [CrossRef]
- Bailey, K.R., Crawley, J.N., 2009. Anxiety-Related Behaviors in Mice, In: Buccafusco JJ, editor. Methods of Behavior Analysis in Neuroscience. 2nd ed. Boca Raton (FL): CRC Press/Taylor & Francis; 2009. Chapter 5. PMID: 21204329.
- Kulesskaya, N., Voikar, V., 2014. Assessment of mouse anxiety-like behavior in the light–dark box and open-field arena: role of equipment and procedure. Physiol. Behav. (133), 30-38. [CrossRef]
- Bourin, M., Hascoët, M., 2003. The mouse light/dark box test. Eur. J. Pharmacol. 463(1-3), 55-65. [CrossRef]
- Talukdar, P.M., Abdul, F., Maes, M., Berk, M., Venkatasubramanian, G., Kutty, B.M., Debnath, M., 2021. A proof-of-concept study of maternal immune activation mediated induction of Toll-like receptor (TLR) and inflammasome pathways leading to neuroprogressive changes and schizophrenia-like behaviours in offspring. Eur Neuropsychopharmacol. (5), 48-61. [CrossRef]
- Faraone, S.V., Mick, E., 2010. Molecular genetics of attention deficit hyperactivity disorder. Psychiatr. Clin. 33(1), 159-180. [CrossRef]
- Faraone, S.V., Larsson, H., 2019. Genetics of attention deficit hyperactivity disorder. Mol. Psychiatry. 24(4), 562-575. [CrossRef]
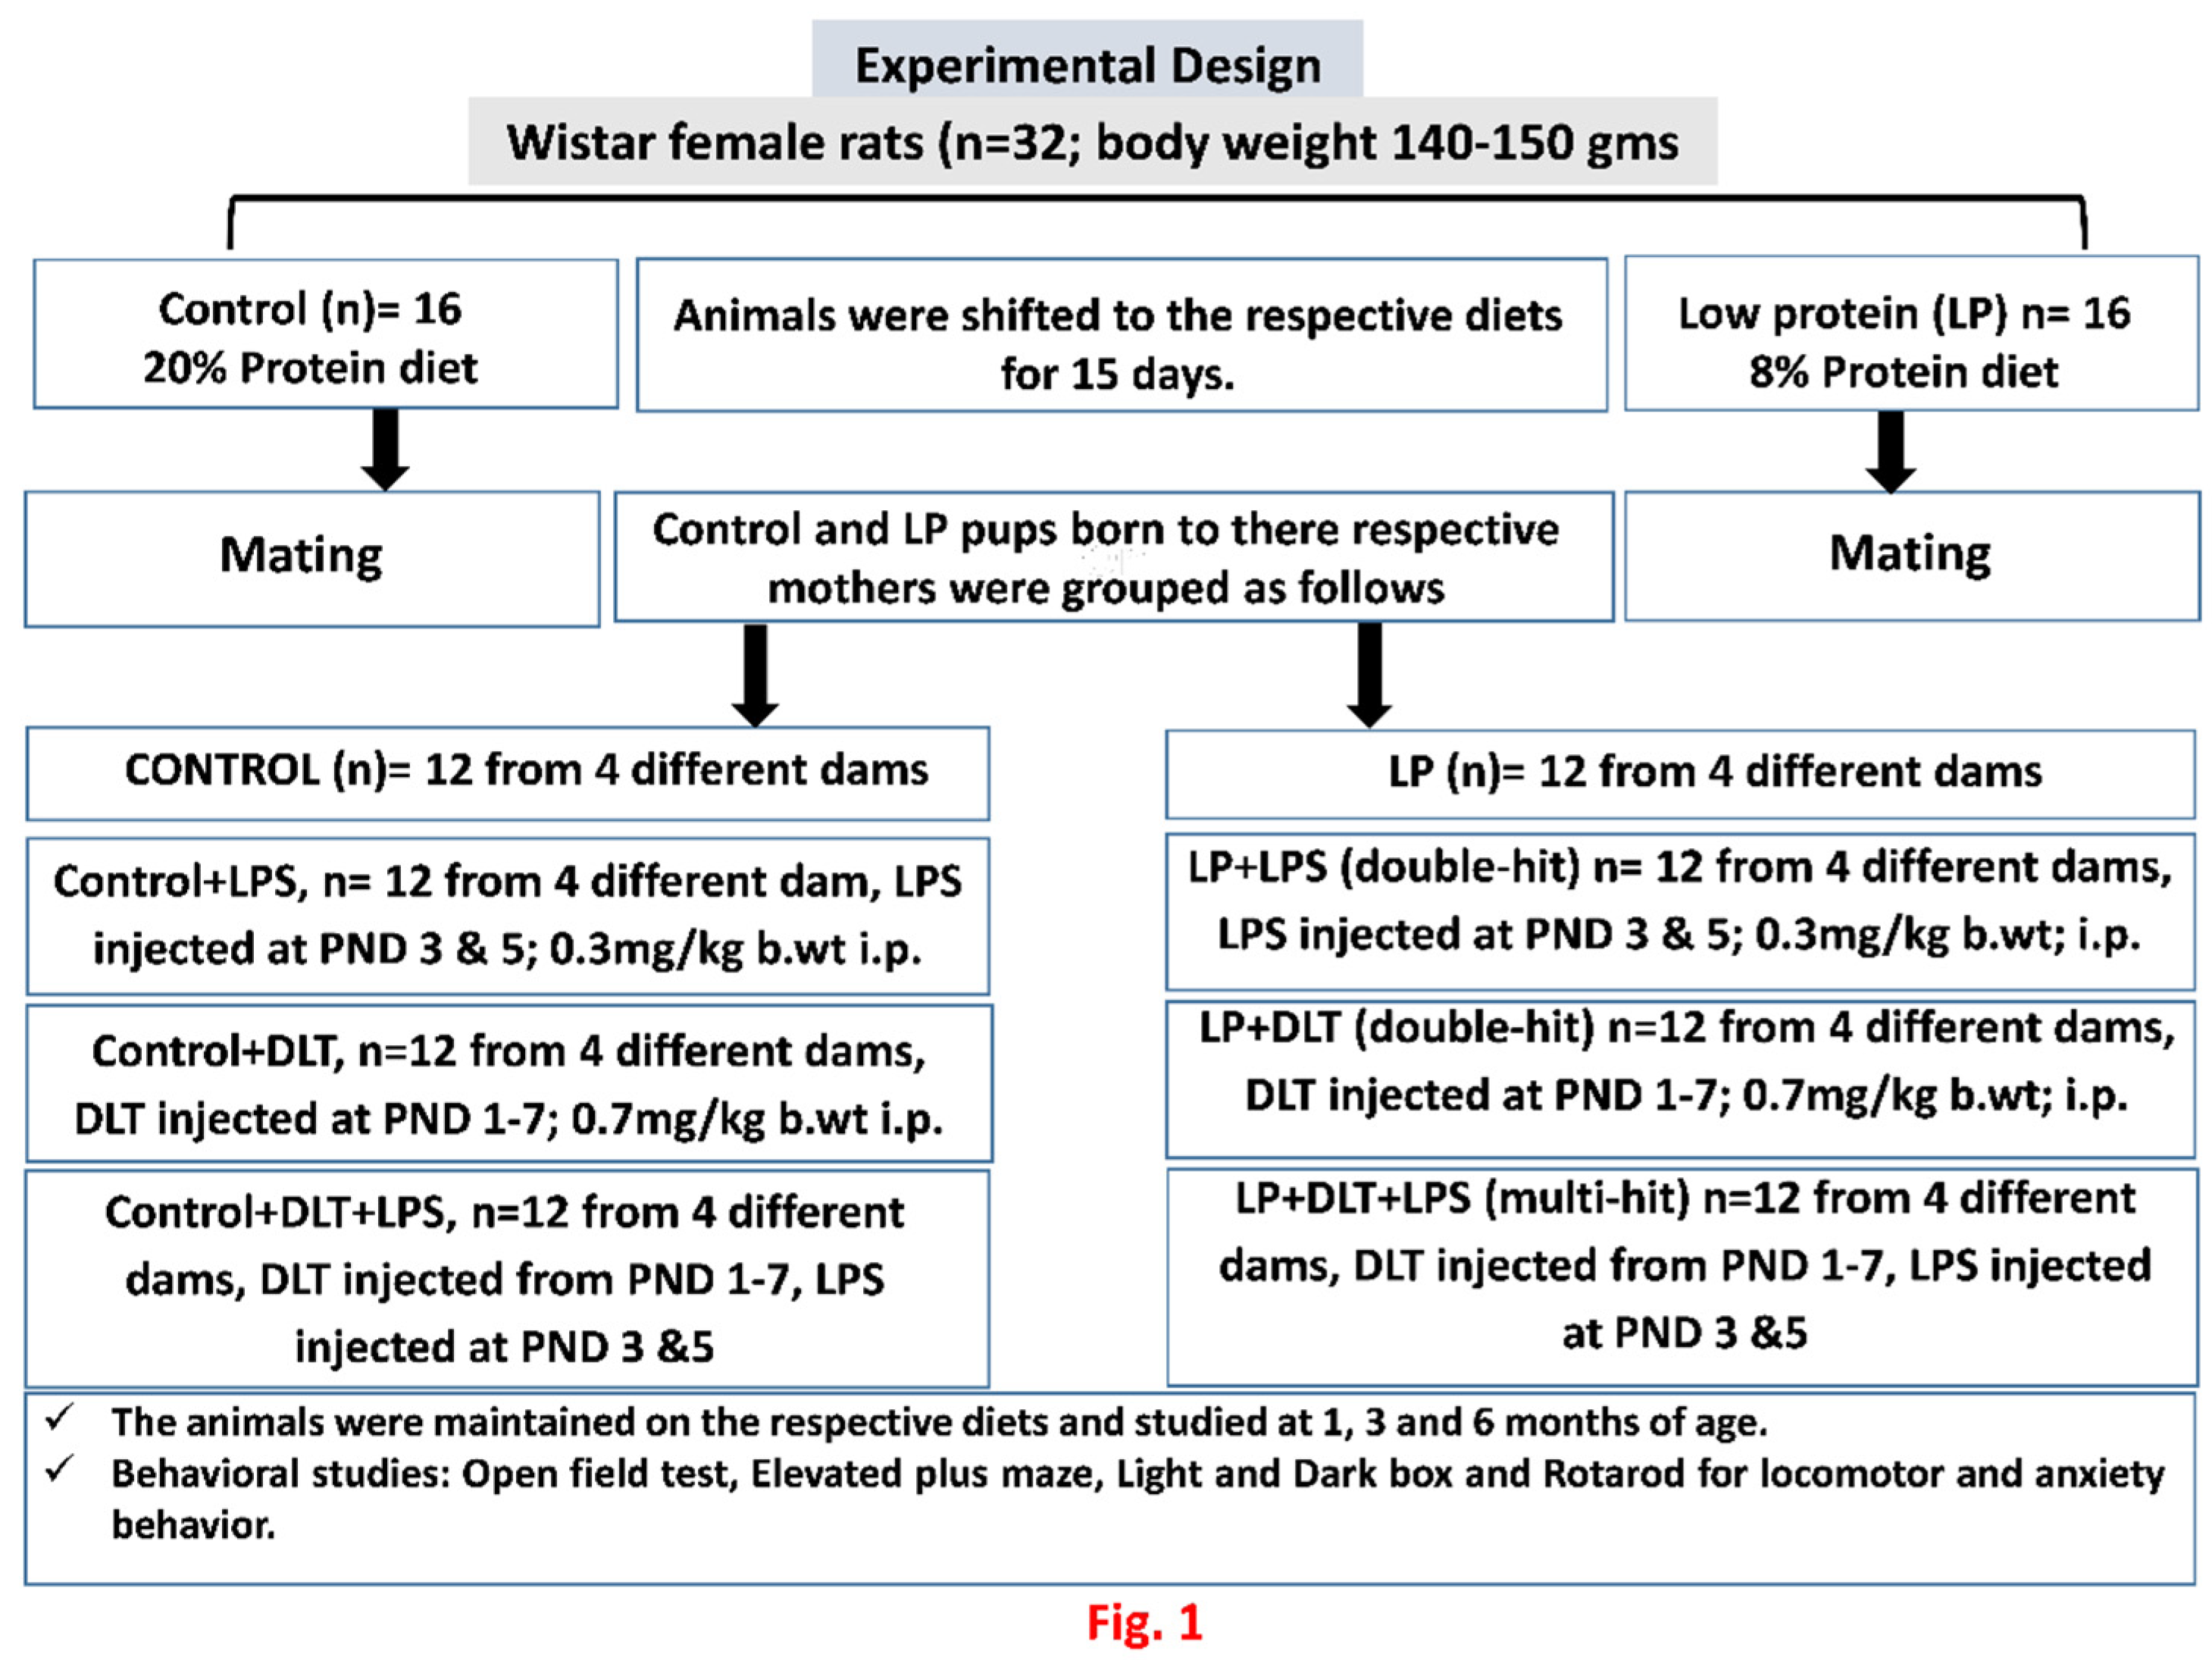
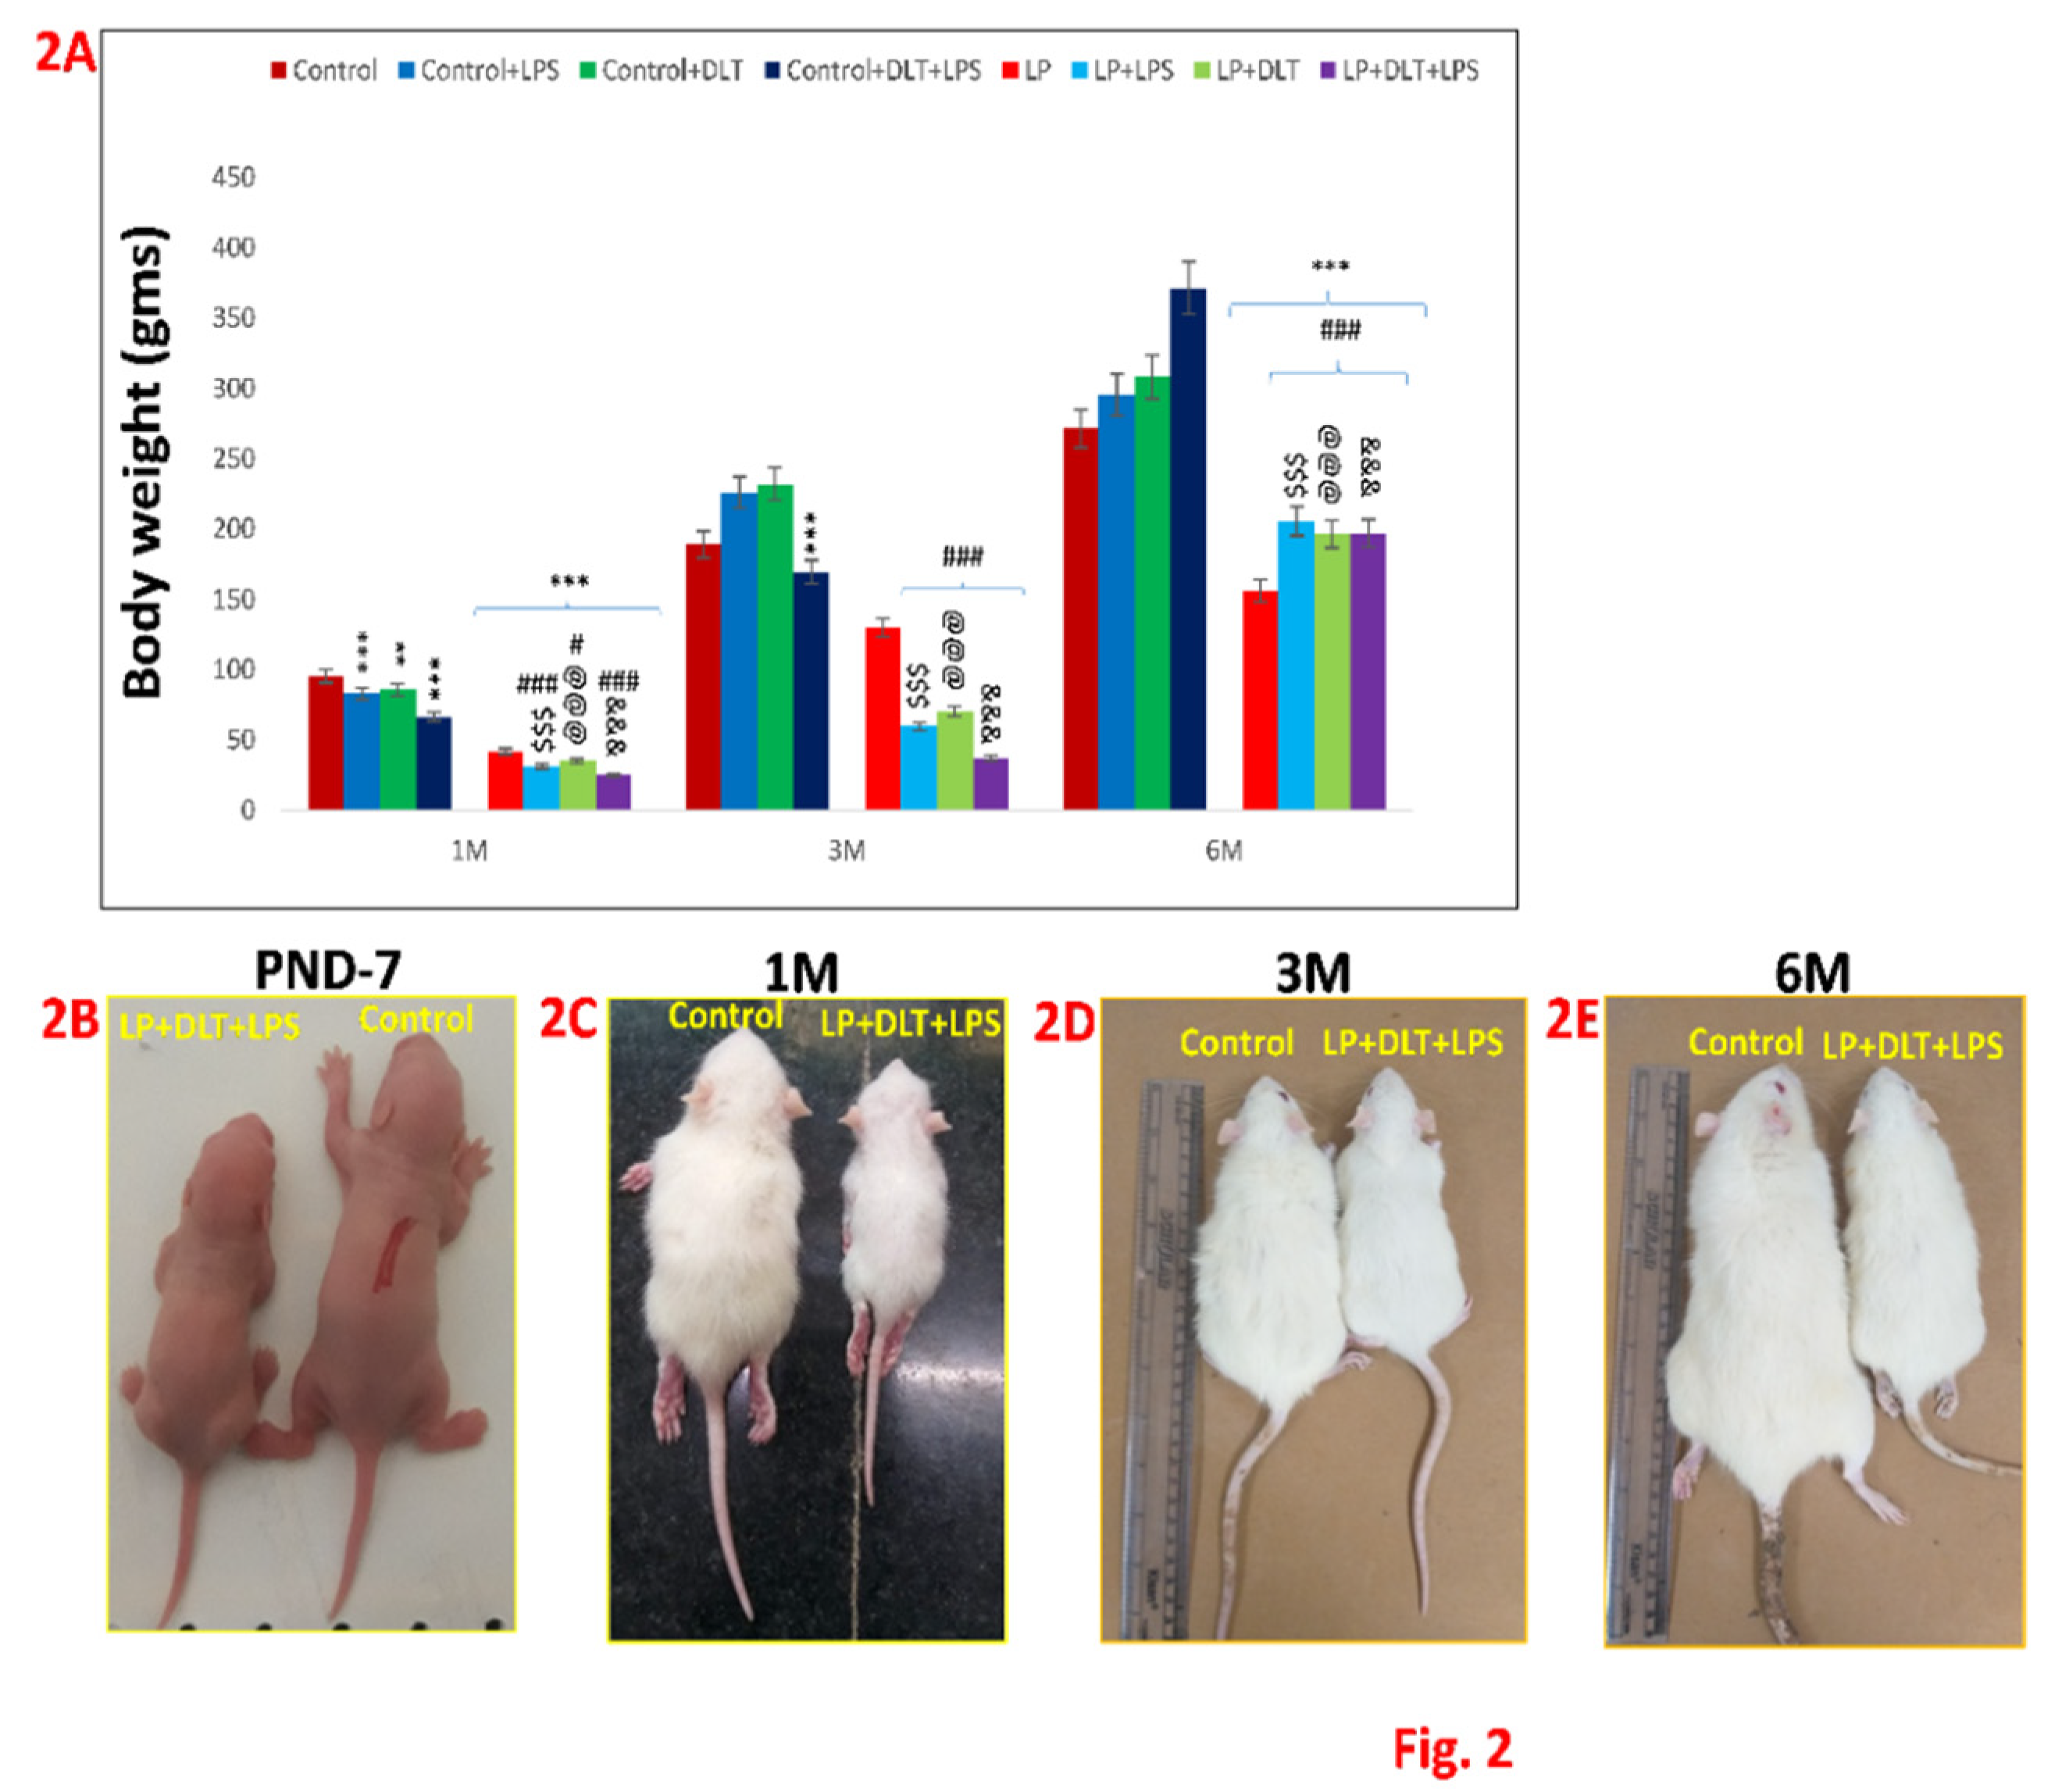
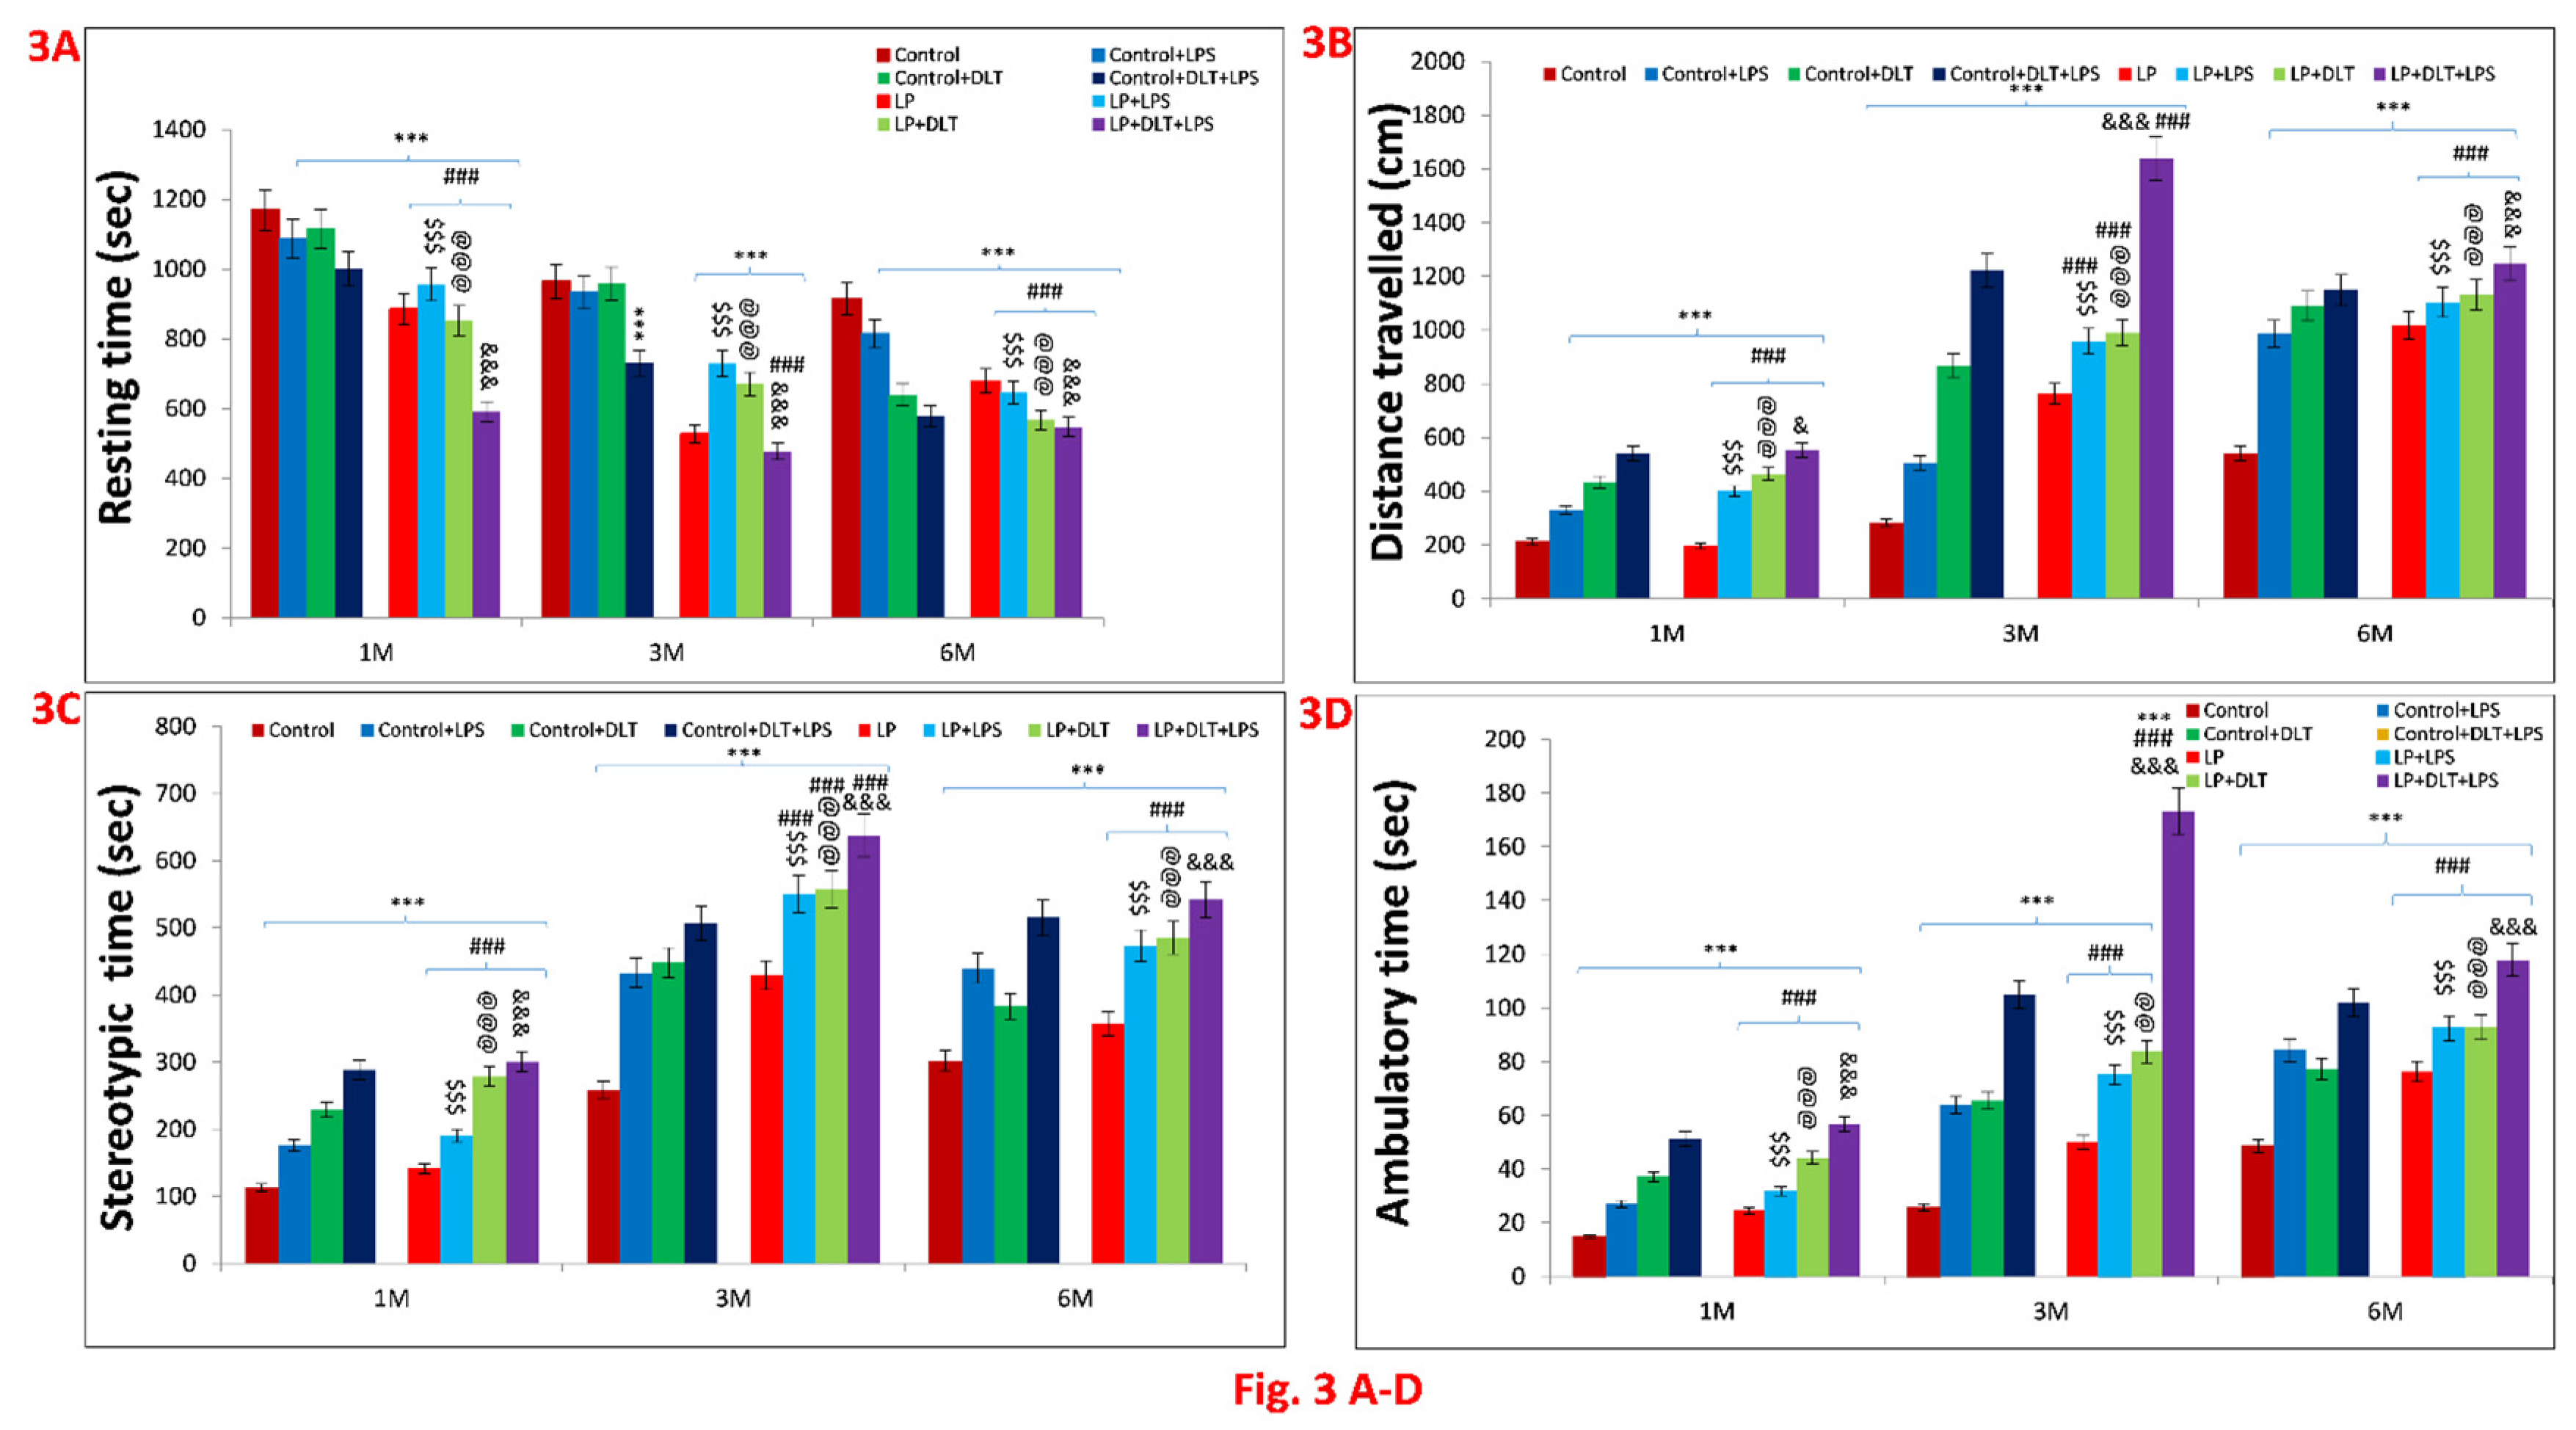
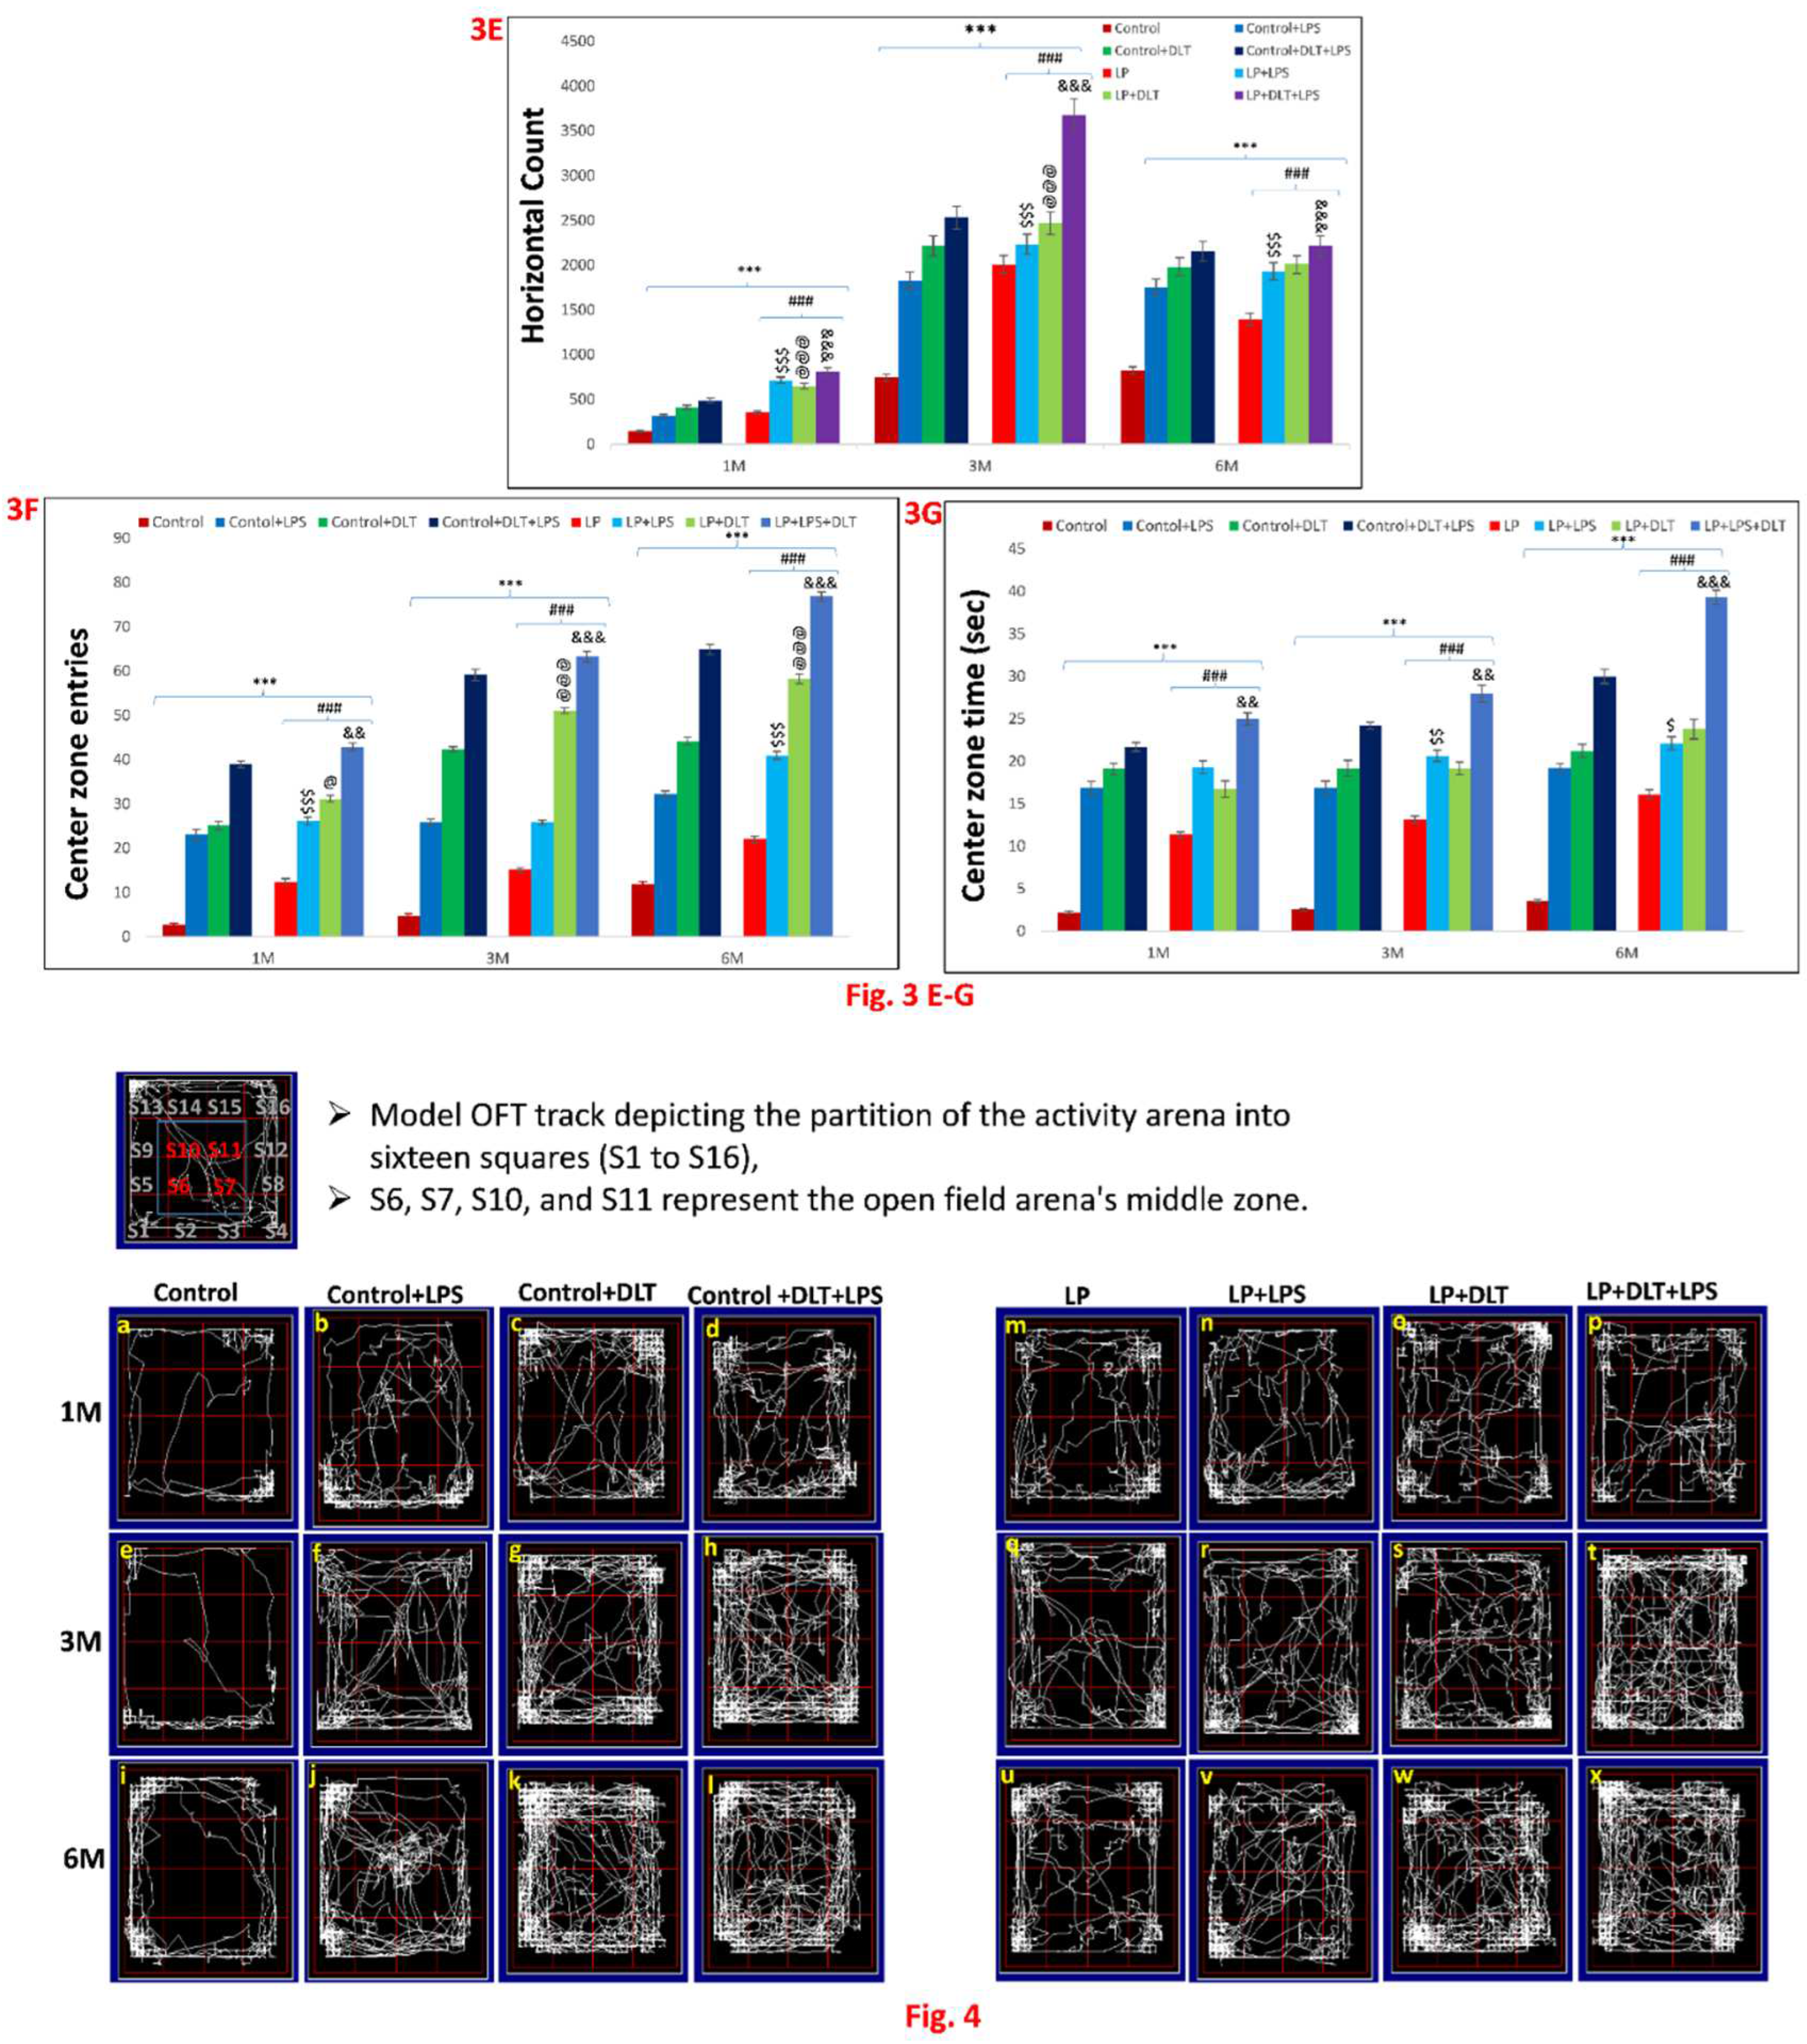
| Age | Control vs LP+LPS |
Control vs LP+DLT |
Control vs LP+LPS+DLT |
|---|---|---|---|
| 1M | [F (7,95) =25.385, p≤0.001] | [F (7,95) =23.894, p≤0.001] | [F (7,95) =27.811, p≤0.001] |
| 3M | [F (7,95) =35.895, p≤0.001] | [F (7,95) =32.917, p≤0.001] | [F (7,95) =42.173, p≤0.001] |
| 6M | [F (7,95) =14.956, p≤0.001] | [F (7,95) =17.030, p≤0.001] | [F (7,95) =16.900, p≤0.001] |
| Age | Control vs LP |
Control vs Control+LPS |
Control vs Control+DLT |
Control vs Control+DLT+LPS |
LP vs LP+LPS |
LP vs LP+DLT |
LP vs LP+DLT+LPS |
Control+LPS vs LP+LPS |
Control+DLT vs LP+DLT |
Control+DLT+LPS vs LP+DLT+LPS |
|---|---|---|---|---|---|---|---|---|---|---|
| 1M | [F (1,95) =21.125, p≤0.001] | [F (1,95) =4.952, p≤0.001] | [F (1,95) =3.951, p≤0.015] | [F (1,95) =11.425, p≤0.001] | [F (1,95) =4.261, p≤0.001] | [F (1,95) =2.769, p=0.025] | [F (1,95) =6.686, p≤0.001] | [F (1,95) =20.433, p≤0.001] | [F (1,95) =19.942, p≤0.001] | [F (1,95) =16.386, p≤0.001] |
| 3M | [F (1,95) =16.347, p≤0.001] | - | - | [F (1,95) =5.417, p≤0.001] | [F (1,95) =19.548, p≤0.001] | [F (1,95) =16.569, p≤0.001] | [F (1,95) =25.826, p≤0.001] | [F (1,95) =46.184, p≤0.001] | [F (1,95) =44.881, p≤0.001] | [F (1,95) =36.756, p≤0.001] |
| 6M | [F (1,95) =30.977, p≤0.001] | - | - | - | [F (1,95) =11.197, p≤0.001] | [F (1,95) =9.123, p≤0.001] | [F (1,95) =9.252, p≤0.001] | [F (1,95) =24.164, p≤0.001] | [F (1,95) =29.988, p≤0.001] | [F (1,95) =46.891, p≤0.001] |
| Age | Control vs LP+LPS |
Control vs LP+DLT |
Control vs LP+LPS+DLT |
|---|---|---|---|
| 1M |
[F (7,95) =28.952, p≤0.001] |
[F (7,95) =43.230, p≤0.001] |
[F (7,95) =79.067, p≤0.001] |
| 3M |
[F (7,95) =16.061, p≤0.001] |
[F (7,95) =20.097, p≤0.001] |
[F (7,95) =33.299, p≤0.001] |
| 6M | [F (7,95) =23.689, p≤0.001] | [F (7,95) =30.616, p≤0.001] | [F (7,95) =32.370, p≤0.001] |
| Age | Control vs LP |
Control vs Control+LPS |
Control vs Control+DLT |
Control vs Control+DLT+LPS |
LP vs LP+LPS |
LP vs LP+DLT |
LP vs LP+DLT+LPS |
Control+LPS vs LP+LPS |
Control+DLT vs LP+DLT |
Control+DLT+LPS vs LP+DLT+LPS |
|---|---|---|---|---|---|---|---|---|---|---|
| 1M | [F (1,95) 38.631, p≤0.001] | [F (1,95) =11.047, p≤0.001] | [F (1,95) =7.105, p≤0.015] |
[F (1,95) =25.412, p≤0.001] |
[F (1,95) =15.910, p≤0.001] | [F (1,95) =30.441, p≤0.001] | [F (1,95) =66.914, p≤0.001] | [F (1,95) =17.878, p≤0.001] | [F (1,95) =36.098, p≤0.001] | [F (1,95) =56.166, p≤0.001] |
| 3M | [F (1,95) =29.858, p≤0.001] | - | - | [F (1,95) =15.993, p≤0.001] | - | - | [F (1,95) =3.441, p≤ 0.001] | [F (1,95) =13.893, p≤0.001] | [F (1,95) =19.687, p≤0.001] | [F (1,95) =17.306, p≤0.001] |
| 6M | [F (1,95) =20.701, p≤0.001] | [F (1,95) =8.822, p≤0.001] | [F (1,95) =24.253, p≤0.001] | [F (1,95) =29.594, p≤0.001] | [F (1,95) =2.988, p= 0.008] | [F (1,95) =9.914, p≤0.001] | [F (1,95) =11.844, p≤ 0.001] | [F (1,95) =14.867, p≤0.001] | [F (1,95) =6.363, p≤0.001] | [F (1,95) =2.952, p= 0.004] |
| Age | Control vs LP+LPS |
Control vs LP+DLT |
Control vs LP+LPS+DLT |
|---|---|---|---|
| 1M | [F (7,95) =30.488, p≤0.001] | [F (7,95) =40.905, p≤0.001] | [F (7,95) =55.327 p≤0.001] |
| 3M | [F (7,95) =39.593, p≤0.001] | [F (7,95) =41.488, p≤0.001] | [F (7,95) =79.490, p≤0.001] |
| 6M | [F (7,95) =57.726, p≤0.001] | [F (7,95) =60.553, p≤0.001] | [F (7,95) =72.608, p≤0.001] |
| Age | Control vsLP | Controlvs Control+LPS | Control vs Control+DLT | ControlvsControl+DLT+LPS | LPvsLP+LPS | LPvsLP+DLT | LPvsLP+DLT+LPS | Control+LPSvs LP+LPS | Control+DLTvsLP+DLT | Control+DLT+LPSvsLP+DLT+LPS |
|---|---|---|---|---|---|---|---|---|---|---|
| 1M | [F (1,95) =2.914, p 0.005] | [F (1,95) =19.061, p≤0.001] | [F (1,95) =36.054, p≤0.001] | [F (1,95) =53.401, p≤0.001] | [F (1,95) =33.401, p≤0.001] | [F (1,95) =43.819, p≤0.001] | [F (1,95) =58.240, p≤0.001] | [F (1,95) =11.427, p≤0.001] | [F (1,95) =4.851, p≤0.001] | [F (1,95) =2.084, p=0.041] |
| 3M | [F (1,95) =28.132, p≤0.001] | [F (1,95) =13.004, p≤0.001] | [F (1,95) =34.270, p≤0.001] | [F (1,95) =55.114, p≤0.001] | [F (1,95) =11.461, p≤0.001] | [F (1,95) =13.356, p≤0.001] | [F (1,95) =51.358, p≤0.001] | [F (1,95) =26.589, p≤0.001] | F (1,95) =7.218, p≤0.001] | [F (1,95) =24.376, p≤0.001] |
| 6M | [F (1,95) =48.928,p≤ 0.001] | [F (1,95) =45.814, p≤0.001] | [F (1,95) =56.384, p≤0.001] | [F (1,95) =62.304, p≤0.001] | [F (1,95) =8.798, p≤0.001] | [F (1,95) =11.625, p≤0.001] | [F (1,95) =23.680, p≤0.001] | [F (1,95) =11.912, p≤0.001] | [F (1,95) =4.169, p≤0.001] | [F (1,95) =10.304, p≤0.001] |
| Age | Control vs LP+LPS |
Control vs LP+DLT |
Control vs LP+LPS+DLT |
|---|---|---|---|
| 1M | [F (7,95) =52.712, p≤0.001] | [F (7,95) =112.616, p≤0.001] | [F (7,95) =127.405 p≤0.001] |
| 3M | [F (7,95) =23.211, p≤0.001] | [F (7,95) =23.769, p≤0.001] | [F (7,95) =30.169, p≤0.001] |
| 6M | [F (7,95) =35.539, p≤0.001] | [F (7,95) =37.990, p≤0.001] | [F (7,95) =49.767, p≤0.001] |
| Age | Control vs LP |
Control vs Control+LPS |
Control vs Control+DLT |
Control vs Control+DLT+LPS |
LP vs LP+LPS |
LP vs LP+DLT |
LP vs LP+DLT+LPS |
Control+LPS vs LP+LPS |
Control+DLT vs LP+DLT |
Control+DLT+LPS vs LP+DLT+LPS |
|---|---|---|---|---|---|---|---|---|---|---|
| 1M | [F (1,95) =18.233, p≤0.001] | [F (1,95) =39.610, p≤0.001] | [F (1,95) =73.058, p≤0.001] | [F (1,95) =110.216, p≤0.001] | [F (1,95) =33.039, p≤0.001] | [F (1,95) =86.136, p≤0.001] | [F (1,95) =99.779, p≤0.001] | [F (1,95) =9.973, p≤0.001] | [F (1,95) =33.785, p≤0.001] | F (1,95) =8.480, p≤0.001] |
| 3M | [F (1,95) =13.590, p≤0.001] | [F (1,95) =13.829, p≤0.001] | [F (1,95) =15.065, p≤0.001] | [F (1,95) =19.783, p≤0.001] | [F (1,95) =9.621, p≤0.001] | [F (1,95) =10.179, p≤0.001] | [F (1,95) =16.529, p≤0.001] | [F (1,95) =9.381, p≤0.001] | [F (1,95) =8.704, p≤0.001] | [F (1,95) =10.386, p≤0.001] |
| 6M | [F (1,95) =11.466, p≤0.001] | [F (1,95) =28.519, p≤0.001] | [F (1,95) =16.824, p≤0.001] | [F (1,95) =44.242, p≤0.001] | [F (1,95) =24.074, p≤0.001] | [F (1,95) =26.524, p≤0.001] | [F (1,95) =38.302, p≤0.001] | [F (1,95) =7.021, p≤0.001] | [F (1,95) =21.166, p≤0.001] | [F (1,95) =5.525, p≤0.001] |
| Age | Control vs LP+LPS |
Control vs LP+DLT |
Control vs LP+LPS+DLT |
|---|---|---|---|
| 1M | [F (7,95) =11.878, p≤0.001] | [F (7,95) =20.682, p≤0.001] | [F (7,95) =29.346 p≤0.001] |
| 3M | [F (7,95) =9.254, p≤0.001] | [F (7,95) =10.855, p≤0.001] | [F (7,95) =27.597, p≤0.001] |
| 6M | [F (7,95) =17.414, p≤0.001] | [F (7,95) =17.573, p≤0.001] | [F (7,95) =27.530, p≤0.001] |
| Age | Control vs LP |
Control vs Control+LPS |
Control vs Control+DLT |
Control vs Control+DLT+LPS |
LP vs LP+LPS |
LP vs LP+DLT |
LP vs LP+DLT+LPS |
Control+LPS vs LP+LPS |
Control+DLT vs LP+DLT |
Control+DLT+LPS vs LP+DLT+LPS |
|---|---|---|---|---|---|---|---|---|---|---|
| 1M | [F (1,95) =6.847, p≤0.001] | [F (1,95) =8.594, p≤0.001] | [F (1,95) =16.244, p≤0.001] | [F (1,95) =25.573, p≤0.001] | [F (1,95) =4.997, p≤0.001] | [F (1,95) =13.834, p≤0.001] | [F (1,95) =22.498, p≤0.001] | [F (1,95) =3.284, p= 0.003] | [F (1,95) =5.031, p≤0.001] | F (1,95) =3.773, p≤0.001] |
| 3M | [F (1,95) =4.537, p≤0.001] | [F (1,95) =5.849, p≤0.001] | [F (1,95) =7.443, p≤0.001] | [F (1,95) =14.849, p≤0.001] | [F (1,95) =4.717, p≤0.001] | [F (1,95) =6.318, p≤0.001] | [F (1,95) =23.060, p≤0.001] | [F (1,95) =2.121, p= 0.037] | [F (1,95) =3.412, p= 0.001] | [F (1,95) =12.749, p≤0.001] |
| 6M | [F (1,95) =11.028, p≤0.001] | [F (1,95) =14.201, p≤0.001] | [F (1,95) =11.424, p≤0.001] | [F (1,95) =21.262, p≤0.001] | [F (1,95) =6.387, p≤0.001] | [F (1,95) =6.545, p≤0.001] | [F (1,95) =16.502, p≤0.001] | [F (1,95) =3.213, p= 0.002] | [F (1,95) =6.149, p≤0.001] | [F (1,95) =6.268, p≤0.001] |
| Age | Control vs LP+LPS |
Control vs LP+DLT |
Control vs LP+LPS+DLT |
|---|---|---|---|
| 1M | [F (7,95) =63.305, p≤0.001] | [F (7,95) =56.219, p≤0.001] | [F (7,95) =74.260 p≤0.001] |
| 3M | [F (7,95) =379.330, p≤0.001] | [F (7,95) =438.713, p≤0.001] | [F (7,95) =746.570, p≤0.001] |
| 6M | [F (7,95) =72.442, p≤0.001] | [F (7,95) =78.269, p≤0.001] | [F (7,95) =90.936, p≤0.001] |
| Age | Control vs LP |
Control vs Control+LPS |
Control vs Control+DLT |
Control vs Control+DLT+LPS |
LP vs LP+LPS |
LP vs LP+DLT |
LP vs LP+DLT+LPS |
Control+LPS vs LP+LPS |
Control+DLT vs LP+DLT |
Control+DLT+LPS vs LP+DLT+LPS |
|---|---|---|---|---|---|---|---|---|---|---|
| 1M | [F (1,95) =23.069, p≤0.001] | [F (1,95) =20.677, p≤0.001] | [F (1,95) =32.187, p≤0.001] |
[F (1,95) =41.210, p≤0.001] |
[F (1,95) =43.336, p≤0.001] | [F (1,95) =35.695, p≤0.001] | [F (7195) =55.135, p≤0.001] | [F (1,95) =47.650, p≤0.001] | [F (1,95) =28.354, p≤0.001] | [F (1,95) =38.771, p≤0.001] |
| 3M | [F (1,95) =24.846, p≤0.001] | [F (1,95) =19.705, p≤0.001] | [F (1,95) =26.677, p≤0.001] |
[F (1,95) =32.427, p≤0.001] |
[F (1,95) =4.125, p≤0.001] | [F (1,95) =8.358, p≤0.001] | [F (1,95) =30.306, p≤0.001] | [F (1,95) =7.338, p≤0.001] | [F (1,95) =4.600, p≤0.001] | [F (1,95) =20.797, p≤0.001] |
| 6M | [F (1,95) =37.229, p≤0.001] | [F (1,95) 60.865, p≤0.001] | [F (1,95) =75.750, p≤0.001] | [F (1,95) =85.633, p≤0.001] | [F (1,95) =35.213, p≤0.001] | [F (1,95) =39.288, p≤0.001] | [F (1,95) =53.707, p≤0.001] | [F (1,95) =11.577, p≤0.001] | - | [F (1,95) =3.896, p≤0.001] |
| Age | Control vs LP+LPS |
Control vs LP+DLT |
Control vs LP+LPS+DLT |
|---|---|---|---|
| 1M | [F (7,95) =19.513, p≤0.001] | [F (7,95) =23.682, p≤0.001] | [F (7,95) =33.439 p≤0.001] |
| 3M | [F (7,95) =19.025, p≤0.001] | [F (7,95) =41.747, p≤0.001] | [F (7,95) =52.746, p≤0.001] |
| 6M | [F (7,95) =22.483, p≤0.001] | [F (7,95) =35.849, p≤0.001] | [F (7,95) =50.219, p≤0.001] |
| Age | Control vs LP |
Control vs Control+LPS |
Control vs Control+DLT |
Control vs Control+DLT+LPS |
LP vs LP+LPS |
LP vs LP+DLT |
LP vs LP+DLT+LPS |
Control+LPS vs LP+LPS |
Control+DLT vs LP+DLT |
Control+DLT+LPS vs LP+DLT+LPS |
|---|---|---|---|---|---|---|---|---|---|---|
| 1M | [F (1,95) =8.089, p≤0.001] | [F (1,95) =16.928, p≤0.001] | [F (1,95) =18.679, p≤0.001] | [F (1,95) =30.187, p≤0.001] | [F (1,95) =11.424, p≤0.001] | [F (1,95) =15.594, p≤0.001] | [F (1,95) =25.350, p≤0.001] | [F (1,95) =2.585, p=0.012] | [F (1,95) =5.003, p≤0.001] | [F (1,95) =3.252, p=0.002] |
| 3M | [F (1,95) =9.377, p≤0.001] | [F (1,95) =19.025, p≤0.001] | [F (1,95) =33.903, p≤0.001] | [F (1,95) =49.051, p≤0.001] | [F (1,95) =14.517, p≤0.001] | [F (1,95) =32.370, p≤0.001] | [F (1,95) =43.370, p≤0.001] | [F (1,95) =4.869, p≤0.001] | [F (1,95) =7.845, p≤0.001] | [F (1,95) =3.697, p≤0.001] |
| 6M | [F (1,95) =7.881, p≤0.001] | [F (1,95) =15.761, p≤0.001] | [F (1,95) =24.955, p≤0.001] | [F (1,95) =41.025, p≤0.001] | [F (1,95) =14.602, p≤0.001] | [F (1,95) =27.968, p≤0.001] | [F (1,95) =42.339, p≤0.001] | [F (1,95) =6.722, p≤0.001] | [F (1,95) =10.894, p≤0.001] | [F (1,95) =9.194, p≤0.001] |
| Age | Control vs LP+LPS |
Control vs LP+DLT |
Control vs LP+LPS+DLT |
|---|---|---|---|
| 1M | [F (7,95) =18.531, p≤0.001] | [F (7,95) =15.732, p≤0.001] | [F (7,95) =24.720 p≤0.001] |
| 3M | [F (7,95) =18.608, p≤0.001] | [F (7,95) =17.114, p≤0.001] | [F (7,95) =26.103, p≤0.001] |
| 6M | [F (7,95) =17.300, p≤0.001] | [F (7,95) =18.887, p≤0.001] | [F (7,95) =33.352, p≤0.001] |
| Age | Control vs LP |
Control vs Control+LPS |
Control vs Control+DLT |
Control vs Control+DLT+LPS |
LP vs LP+LPS |
LP vs LP+DLT |
LP vs LP+DLT+LPS |
Control+LPS vs LP+LPS |
Control+DLT vs LP+DLT |
Control+DLT+LPS vs LP+DLT+LPS |
|---|---|---|---|---|---|---|---|---|---|---|
| 1M | [F (1,95) =9.893, p≤0.001] | [F (1,95) =15.937, p≤0.001] | [F (1,95) =18.531, p≤0.001] | [F (1,95) =24.720, p≤0.001] | [F (1,95) =8.638, p≤0.001] | [F (1,95) =5.839, p≤0.001] | [F (1,95) =14.824, p≤0.001] | - | [F (1,95) =2.572, p=0.048] | [F (1,95) =3.606, p=0.005] |
| 3M | [F (1,95) =10.855, p≤0.001] | [F (1,95) =14.778, p≤0.001] | [F (1,95) =17.114, p≤0.001] | [F (1,95) =26.1031, p≤0.001] | [F (1,95) =7.753, p≤0.001] | [F (1,95) =6.259, p≤0.001] | [F (1,95) =15.248, p≤0.001] | [F (1,95) =3.830, p=0.002] | - | [F (1,95) =3.858, p=0.002] |
| 6M | [F (1,95) =11.701, p≤0.001] | [F (1,95) =14.194, p≤0.001] | [F (1,95) =16.460, p≤0.001] | [F (1,95) =33.352, p≤0.001] | [F (1,95) =5.599, p≤0.001] | [F (1,95) =7.186, p≤0.001] | [F (1,95) =21.651, p≤0.001] | [F (1,95) =2.706, p=0.042] | - | [F (1,95) =8.679, p≤0.001] |
| Age | Control vs LP+LPS |
Control vs LP+DLT |
Control vs LP+LPS+DLT |
|---|---|---|---|
| 1M | [F (7,95) =8.049, p≤0.001] | [F (7,95) =12.819, p≤0.001] | [F (7,95) =19.974 p≤0.001] |
| 3M | [F (7,95) =23.156, p≤0.001] | [F (7,95) =16.259, p≤0.001] | [F (7,95) =23.156, p≤0.001] |
| 6M | [F (7,95) =9.237, p≤0.001] | [F (7,95) =14.676, p≤0.001] | [F (7,95) =23.732, p≤0.001] |
| Age | Control vs LP |
Control vs Control+LPS |
Control vs Control+DLT |
Control vs Control+DLT+LPS |
LP vs LP+LPS |
LP vs LP+DLT |
LP vs LP+DLT+LPS |
Control+LPS vs LP+LPS |
Control+DLT vs LP+DLT |
Control+DLT+LPS vs LP+DLT+LPS |
|---|---|---|---|---|---|---|---|---|---|---|
| 1M | [F (1,95) =4.562, p≤0.001] | [F (1,95) =4.339, p≤0.001] | [F (1,95) =10.084, p≤0.001] | [F (1,95) =15.952, p≤0.001] | [F (1,95) =3.487, p=0.010] | [F (1,95) =8.257, p≤0.001] | [F (1,95) =15.412, p≤ 0.001] | [F (1,95) =3.710, p=009] | [F (1,95) =2.735, p=0.017] | [F (1,95) =4.022, p=0.001] |
| 3M | [F (1,95) =6.927, p≤0.001] | [F (1,95) =4.553, p≤0.001] | [F (1,95) =10.596, p≤0.001] | [F (1,95) =14.716, p≤0.001] | [F (1,95) =11.578, P≤0.001] | [F (1,95) =9.332, p≤0.001] | [F (1,95) =16.229, p≤0.001] | [F (1,95) =13.952, p≤0.001] | [F (1,95) =5.664, p≤0.001] | [F (1,95) =8.441, p≤0.001] |
| 6M | [F (1,95) =5.431, p=0.001] | [F (1,95) =4.894, p≤0.001] | [F (1,95) =9.152, p≤0.001] | [F (1,95) =23.732, p≤0.001] | [F (1,95) =3.806, p =0.001] | [F 1,95) =9.245, p≤0.001] | [F (1,95) =18.301, p≤0.001] | [F (1,95) =4.344, p≤0.001] | [F (1,95) =5.524, p=≤0.001] | [F (1,95) =7.197, p≤0.001] |
| Age | Control vs LP+LPS |
Control vs LP+DLT |
Control vs LP+LPS+DLT |
|---|---|---|---|
| 1M | [F (7,95) =20.987, p≤0.001] | [F (7,95) =29.663, p≤0.001] | [F (7,95) =41.150 p≤0.001] |
| 3M | [F (7,95) =30.792, p≤0.001] | [F (7,95) =103.914, p≤0.001] | [F (7,95) =126.484, p≤0.001] |
| 6M | [F (7,95) =12.004, p≤0.001] | [F (7,95) =12.755, p≤0.001] | [F (7,95) =18.094, p≤0.001] |
| Age | Control vs LP |
Control vs Control+LPS |
Control vs Control+DLT |
Control vs Control+DLT+LPS |
LP vs LP+LPS |
LP vs LP+DLT |
LP vs LP+DLT+LPS |
Control+LPS vs LP+LPS |
Control+DLT vs LP+DLT |
Control+DLT+LPS vs LP+DLT+LPS |
|---|---|---|---|---|---|---|---|---|---|---|
| 1M | [F (1,95) =3.573, p=0.004] | - | [F (1,95) =8.545, p≤0.001] | [F (1,95) =20.334, p≤0.001] | [F (1,95) =17.414, p≤0.001] | [F (1,95) =26.091, p≤0.001] | [F (1,95) =37.577, p≤ 0.001] | [F (1,95) =18.738, p≤0.001] | [F (1,95) =21.118, p≤0.001] | [F (1,95) =20.816, p≤0.001] |
| 3M | [F (1,95) =14.714, p≤0.001] | [F (1,95) =14.147, p≤0.001] | [F (1,95) =101.005, p≤0.001] | [F (1,95) =108.576, p≤0.001] | [F (1,95) =16.506, p p≤0.001] | [F (1,95) =89.628, p p≤0.001] | [F (1,95) =112.198, p≤0.001] | [F (1,95) =16.644, p≤0.001] | - | [F (1,95) =17.908, p≤0.001] |
| 6M | [F (1,95) =5.454, p≤0.001] | [F (1,95) =7.897, p≤0.001] | [F (1,95) =8.960, p≤0.001] | [F (1,95) =13.212, p≤0.001] | [F (1,95) =6.550, p = p≤0.001] | [F (1,95) =7.301, p≤0.001] | [F (1,95) =12.650, p≤0.001] | [F (1,95) =4.107, p≤0.001] | [F (1,95) =3.795, p=0.002] | [F (1,95) =4.883, p≤0.001] |
| Age | Control vs LP+LPS |
Control vs LP+DLT |
Control vs LP+LPS+DLT |
|---|---|---|---|
| 1M | [F (7,95) =8.948, p≤0.001] | [F (7,95) =11.968, p≤0.001] | [F (7,95) =19.565 p≤0.001] |
| 3M | [F (7,95) =8.635, p≤0.001] | [F (7,95) =17.375, p≤0.001] | [F (7,95) =26.115, p≤0.001] |
| 6M | [F (7,95) =21.089, p≤0.001] | [F (7,95) =27.725, p≤0.001] | [F (7,95) =13.933, p≤0.001] |
| Age | Control vs LP |
Control vs Control+LPS |
Control vs Control+DLT |
Control vs Control+DLT+LPS |
LP vs LP+LPS |
LP vs LP+DLT |
LP vs LP+DLT+LPS |
Control+LPS vs LP+LPS |
Control+DLT vs LP+DLT |
Control+DLT+LPS vs LP+DLT+LPS |
|---|---|---|---|---|---|---|---|---|---|---|
| 1M | [F (1,95) =4.059, p=0.001] | [F (1,95) =5.828, p≤0.001] | [F (1,95) =5.412, p≤0.001] | [F (1,95) =16.339, p≤0.001] | [F (1,95) =4.889, p≤0.001] | [F (1,95) =7.909, p≤0.001] | [F (1,95) =15.507, p≤ 0.001] | [F (1,95) =3.120, p=0.013] | [F (1,95) =6.556, p≤0.001] | [F (1,95) =3.226, p =0.011] |
| 3M | [F (1,95) =5.477, p≤0.001] | - | [F (1,95) =7.793, p≤0.001] | [F (1,95) =22.744, p≤0.001] | [F (1,95) =3.158, p=0.009] | [F (1,95) =11.898, p≤0.001] | [F (1,95) =20.638, p≤ 0.001] | [F (1,95) =6.740, p≤0.001] | [F (1,95) =9.582, p≤0.001] | [F (1,95) =3.371, p =0.006] |
| 6M | [F (1,95) =7.635, p≤0.001] | [F (1,95) =17.362, p p≤0.001] | [F (1,95) =25.452, p≤0.001] | [F (1,95) =32.543, p≤0.001] | [F (1,95) =13.453, p≤0.001] | [F (1,95) =20.089, p≤0.001] | [F (1,95) =30.361, p≤ 0.001] | [F (1,95) =3.727, p≤0.001] | [F (1,95) =2.273, p=0.026] | [F (1,95) =5.454, p≤0.001] |
| Age | Control vs LP+LPS |
Control vs LP+DLT |
Control vs LP+LPS+DLT |
|---|---|---|---|
| 1M | [F (7,95) =13.816, p≤0.001] | [F (7,95) =13.262, p≤0.001] | [F (7,95) =18.227 p≤0.001] |
| 3M | [F (7,95) =16.950, p≤0.001] | [F (7,95) =18.527, p≤0.001] | [F (7,95) =27.690, p≤0.001] |
| 6M | [F (7,95) =25.785, p≤0.001] | [F (7,95) =28.142, p≤0.001] | [F (7,95) =43.407, p≤0.001] |
| Age | Control vs LP |
Control vs Control+LPS |
Control vs Control+DLT |
Control vs Control+DLT+LPS |
LP vs LP+LPS |
LP vs LP+DLT |
LP vs LP+DLT+LPS |
Control+LPS vs LP+LPS |
Control+DLT vs LP+DLT |
Control+DLT+LPS vs LP+DLT+LPS |
|---|---|---|---|---|---|---|---|---|---|---|
| 1M | [F (1,95) =5.534, p≤0.001] | [F (1,95) =10.791, p≤0.001] | [F (1,95) =13.037, p≤0.001] | [F (1,95) =14.542, p≤0.001] | [F (1,95) =8.282, p≤0.001] | [F (1,95) =7.728, p≤0.001] | [F (1,95) =12.693, p≤ 0.001] | [F (1,95) =3.025, p=0.031] | - | [F (1,95) =3.684, p =0.004] |
| 3M | [F (1,95) =7.918, p≤0.001] | [F (1,95) =10.902, p≤0.001] | [F (1,95) =14.933, p≤0.001] | [F (1,95) =21.890, p≤0.001] | [F (1,95) =9.032, p≤0.001] | [F (1,95) =10.609, p≤0.001] | [F (1,95) =19.772, p≤ 0.001] | [F (1,95) =6.048, p≤ 0.001] | [F (1,95) =3.594, p=0.003] | [F (1,95) =5.800, p≤ 0.001] |
| 6M | [F (1,95) =15.265, p≤0.001] | [F (1,95) =23.219, p≤0.001] | [F (1,95) =20.098, p≤0.001 | [F (1,95) =35.273, p≤0.001] | [F (1,95) =10.521, p≤0.001] | [F (1,95) =12.878, p≤0.001] | [F (1,95) =28.142, p≤ 0.001] | [F (1,95) =2.566, p=0.025] | [F (1,95) =8.044, p≤ 0.001] | [F (1,95) =8.134, p≤ 0.001] |
| Age | Control vs LP+LPS |
Control vs LP+DLT |
Control vs LP+LPS+DLT |
|---|---|---|---|
| 1M | [F (7,95) =11.996, p≤0.001] | [F (7,95) =12.475, p≤0.001] | [F (7,95) =15.620 p≤0.001] |
| 3M | [F (7,95) =9.523, p≤0.001] | [F (7,95) =10.163, p≤0.001] | [F (7,95) =16.124, p≤0.001] |
| 6M | [F (7,95) =11.723, p≤0.001] | [F (7,95) =12.827, p≤0.001] | [F (7,95) =19.761, p≤0.001] |
| Age | Control vs LP |
Control vs Control+LPS |
Control vs Control+DLT |
Control vs Control+DLT+LPS |
LP vs LP+LPS |
LP vs LP+DLT |
LP vs LP+DLT+LPS |
Control+LPS vs LP+LPS |
Control+DLT vs LP+DLT |
Control+DLT+LPS vs LP+DLT+LPS |
|---|---|---|---|---|---|---|---|---|---|---|
| 1M | [F (1,95) =4.020, p=0.001] | [F (1,95) =4.722, p≤0.001] | [F (1,95) =7.770, p≤0.001] | [F (1,95) =11.052, p≤0.001] | [F (1,95) =7.976, p≤0.001] | [F (1,95) =8.455, p≤0.001] | [F (1,95) =11.599, p≤ 0.001] | [F (1,95) =7.274, p≤0.001] | [F (1,95) =4.705, p≤0.001] | [F (1,95) =4.567, p≤ 0.001] |
| 3M | [F (1,95) =5.345, p≤0.001] | [F (1,95) =3.643, p=0.004] | [F (1,95) =4.558, p≤0.001] | [F (1,95) =11.094, p≤0.001] | [F (1,95) =4.178, p≤0.001] | [F (1,95) =4.817, p≤0.001] | [F (1,95) =10.779, p≤0.001] | [F (1,95) =5.880, p≤0.001] | [F (1,95) =5.605, p≤0.001] | [F (1,95) =5.030, p≤0.001] |
| 6M | [F (1,95) =6.172, p≤0.001] | [F (1,95) =7.316, p≤0.001] | [F (1,95) =8.367, p≤0.001] | [F (1,95) =14.752, p≤0.001] | [F (1,95) =5.551, p≤0.001] | [F (1,95) =6.655, p≤0.001] | [F (1,95) =13.619, p≤0.001] | [F (1,95) =4.408, p≤0.001] | [F (1,95) =4.460, p≤0.001] | [F (1,95) =5.039, p≤0.001] |
| Age | Control vs LP+LPS |
Control vs LP+DLT |
Control vs LP+LPS+DLT |
|---|---|---|---|
| 1M | [F (7,95) =8.413, p≤0.001] | [F (7,95) =9.659, p≤0.001] | [F (7,95) =9.511 p≤0.001] |
| 3M | [F (7,95) =9.121, p≤0.001] | [F (7,95) =10.434, p≤0.001] | [F (7,95) =13.099, p≤0.001] |
| 6M | [F (7,95) =13.8112, p≤0.001] | [F (7,95) =20.132, p≤0.001] | [F (7,95) =67.694, p≤0.001] |
| Age | Control vs LP |
Control vs Control+LPS |
Control vs Control+DLT |
Control vs Control+DLT+LPS |
LP vs LP+LPS |
LP vs LP+DLT |
LP vs LP+DLT+LPS |
Control+LPS vs LP+LPS |
Control+DLT vs LP+DLT |
Control+DLT+LPS vs LP+DLT+LPS |
|---|---|---|---|---|---|---|---|---|---|---|
| 1M | [F (1,95) =4.856, p≤0.001] | [F (1,95) =4.287, p≤0.001] | [F (1,95) =5.543, p≤0.001] | [F (1,95) =9.548, p≤0.001] | [F (1,95) =3.557, p≤0.001] | [F (1,95) =4.265, p≤0.001] | [F (1,95) =8.956, p≤0.001] | [F (1,95) p≤0.001=4.124] | [F (1,95) =3.578, p≤0.001] | [F (1,95) =4.265, p≤0.001] |
| 3M | [F (1,95) =4.480, p≤0.001] | [F (1,95) =5.040.467, p≤0.001] | [F (1,95) =6.210, p≤0.001] | [F (1,95) =12.388, p≤0.001 | [F (1,95) =5.180, p≤0.001] | [F (1,95) =5.954, p≤0.001] | [F (1,95) =15.652, p≤0.001] | [F (1,95) =4.619, p p≤0.001] | [F (1,95) =4.224, p≤0.001] | [F (1,95) =7.744, p≤0.001] |
| 6M | [F (1,95) =5.798, p≤0.001] | [F (1,95) =6.054, p≤0.001] | [F (1,95) =6.490, p≤0.001] | [F (1,95) =17.577, p≤0.001] | [F (1,95) =3.713, p≤0.001] | [F (1,95) =7.301, p≤0.001] | [F (1,95) =16.261, p≤0.001] | [F (1,95) =3.457, p≤0.001] | [F (1,95) =6.607, p≤0.001] | [F (1,95) =4.482, p≤0.001] |
| Age | Control vs LP+LPS |
Control vs LP+DLT |
Control vs LP+LPS+DLT |
|---|---|---|---|
| 3M | [F (7,95) =8.476, p≤0.001] | [F (7,95) =10.659, p≤0.001] | [F (7,95) =13.238, p≤0.001] |
| 6M | [F (7,95) =14.982, p≤0.001] | [F (7,95) =14.755, p≤0.001] | [F (7,95) =28.235, p≤0.001] |
| Age | Control vs LP |
Control vs Control+LPS |
Control vs Control+DLT |
Control vs Control+DLT+LPS |
LP vs LP+LPS |
LP vs LP+DLT |
LP vs LP+DLT+LPS |
Control+LPS vs LP+LPS |
Control+DLT vs LP+DLT |
Control+DLT+LPS vs LP+DLT+LPS |
|---|---|---|---|---|---|---|---|---|---|---|
| 3M | [F (1,95) =3.542, p≤0.001] | [F (1,95) =4.801, p≤0.001] | [F (1,95) =5.486, p≤0.001] | [F (1,95) =9.791, p≤0.001] | [F (1,95) =4.447, p≤0.001] | [F (1,95) =6.630, p= 0.001] | [F (1,95) =9.209, p≤ 0.001] | [F (1,95) =3.175, p= 0.002] | [F (1,95) =4.666, p≤0.001] | [F (1,95) =3.447, p= 0.001] |
| 6M | [F (1,95) =4.431, p≤0.001] | [F (1,95) =7.044, p≤0.001] | [F (1,95) =10.955, p≤0.001] | [F (1,95) =20.354, p≤0.001] | [F (1,95) =11.616, p≤0.001] | [F (1,95) =11.373, p≤0.001] | [F (1,95) =25.811, p≤0.001] | [F (1,95)) =9.003, p≤0.001] | [F (1,95) =4.849, p≤0.001] | [F (1,95) =9.888, p≤0.001] |
Disclaimer/Publisher’s Note: The statements, opinions and data contained in all publications are solely those of the individual author(s) and contributor(s) and not of MDPI and/or the editor(s). MDPI and/or the editor(s) disclaim responsibility for any injury to people or property resulting from any ideas, methods, instructions or products referred to in the content. |
© 2023 by the authors. Licensee MDPI, Basel, Switzerland. This article is an open access article distributed under the terms and conditions of the Creative Commons Attribution (CC BY) license (http://creativecommons.org/licenses/by/4.0/).


