4.1. Cora dataset
The Cora dataset (
https://relational.fit.cvut.cz/dataset/CORA) is a well-known and extensively used dataset in the fields of machine learning and natural language processing, specifically for studying citation networks. The dataset consists of a collection of scientific research papers primarily from the computer science domain covering various subfields, including machine learning, artificial intelligence, databases, and information retrieval. Each paper in the dataset is represented by a bag-of-words feature vector, which indicates the presence or absence of specific words within the document. In addition to the textual data, the Cora dataset provides information about citation links between the documents to establish connections among the papers, allowing us to study citation patterns and investigate techniques for citation network analysis.
The Cora dataset contains 2,708 scientific publications categorized into seven classes. With a total of 5,429 links, the dataset’s citation network captures the connections between these publications. Each publication is additionally represented by a binary word vector consisting of 0s and 1s, indicating the presence or absence of words from a dictionary. This dictionary comprises 1,433 different words.
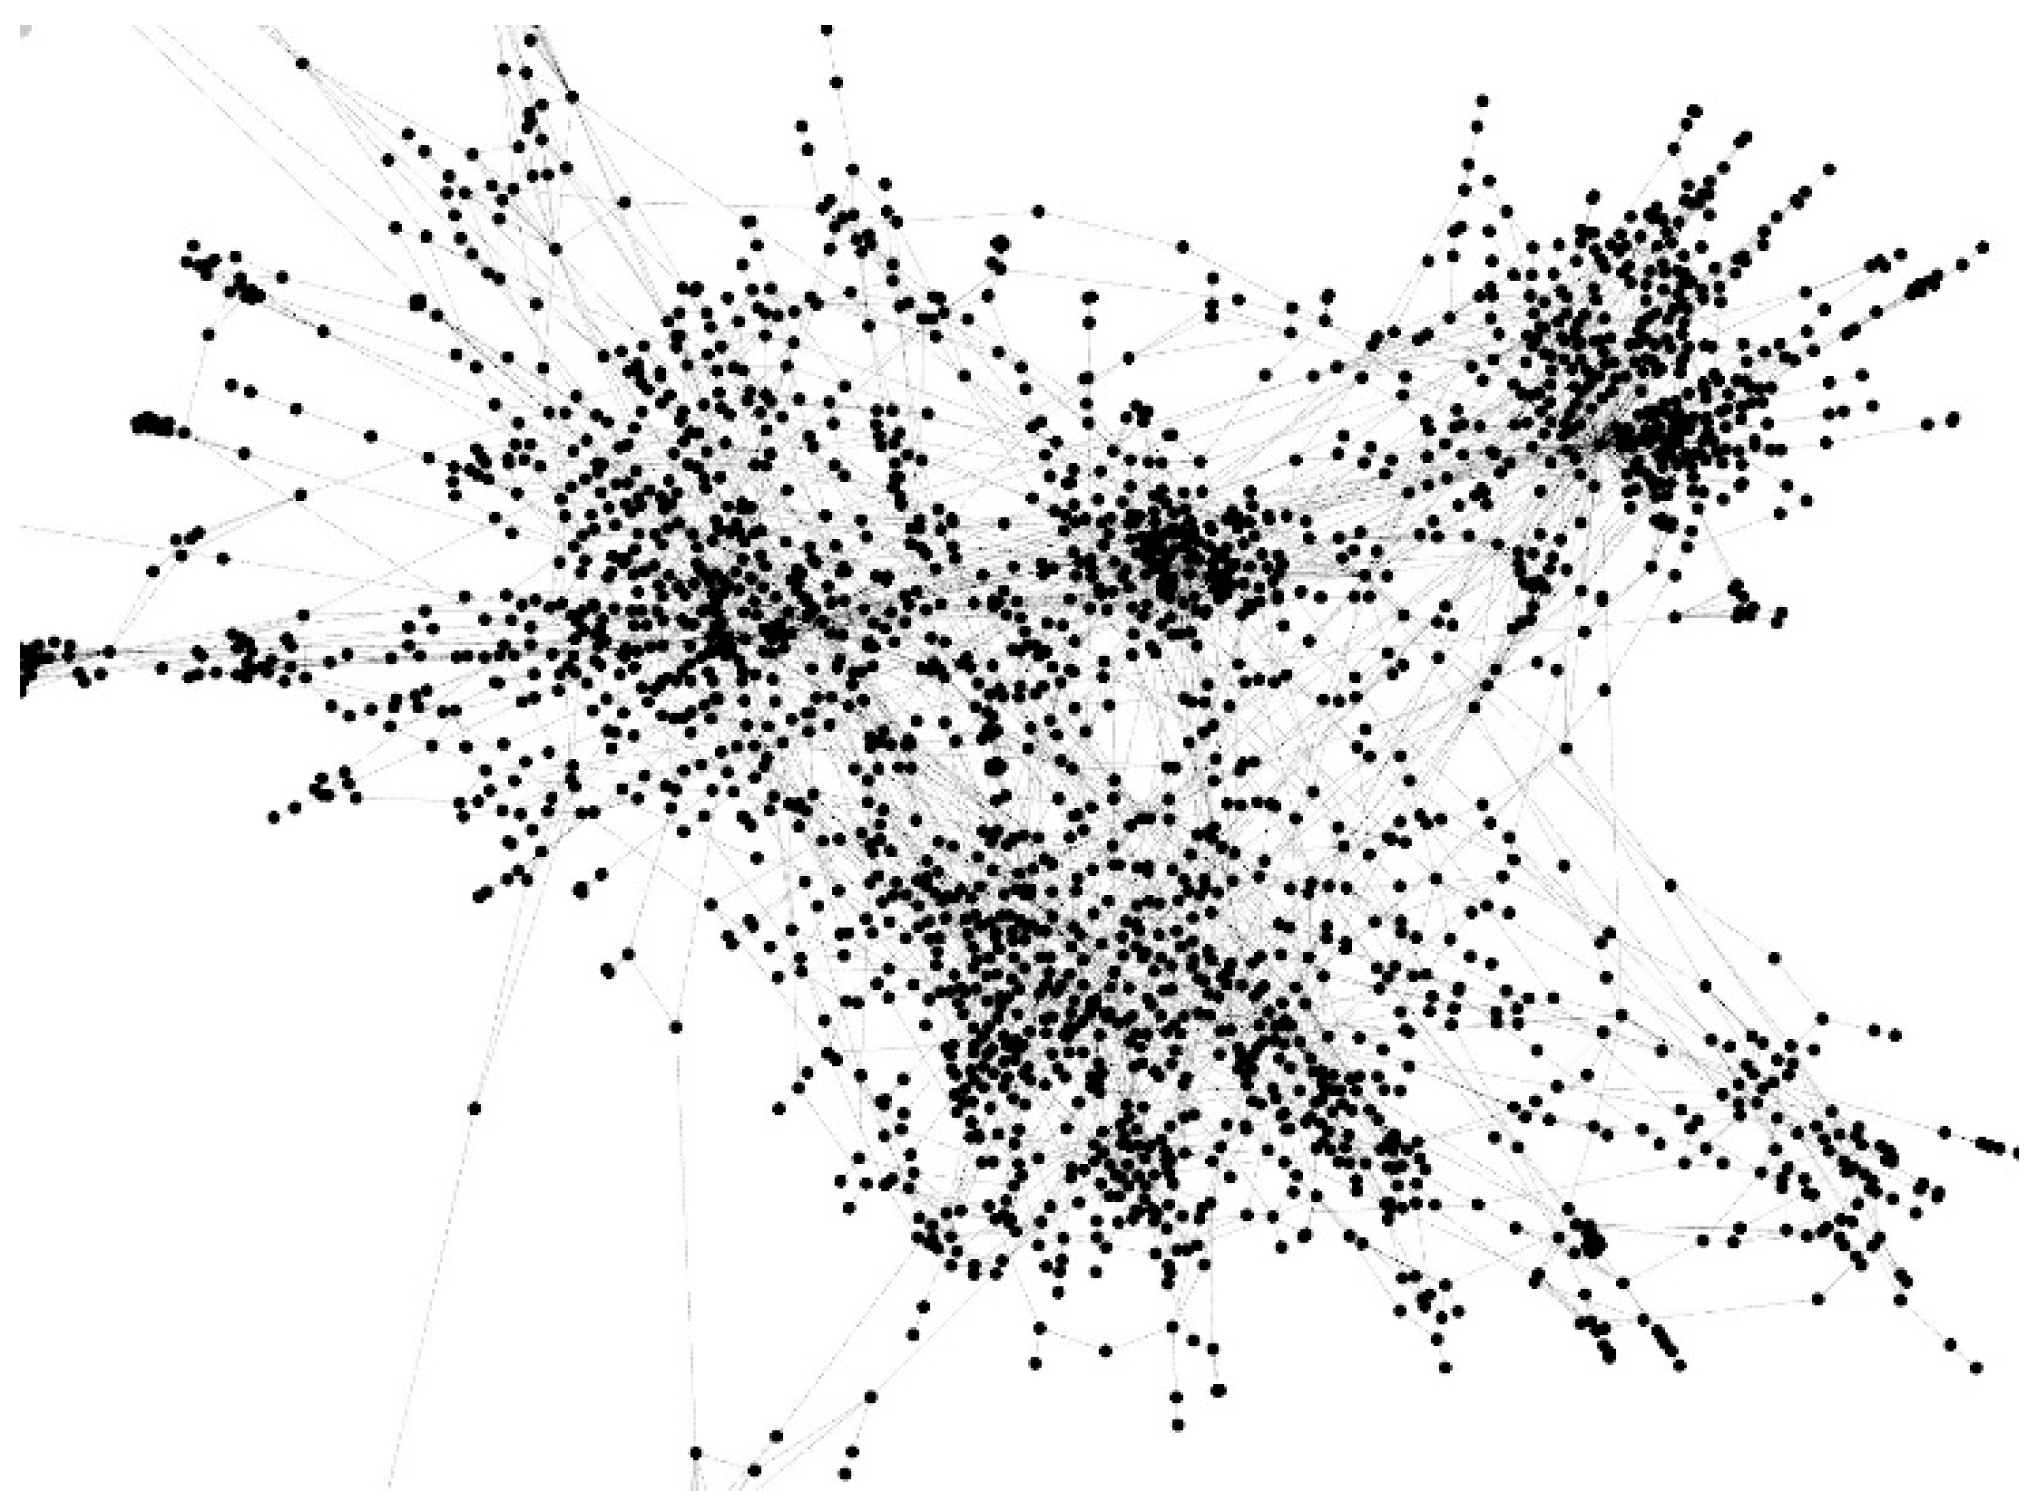
Figure 1.
Partial visualization of the CORA dataset.
Figure 1.
Partial visualization of the CORA dataset.
In order to investigate the structure of the dataset, a set of numerical experiments was performed involving various Fr values (30, 40, and 50) and Tr values (0.05, 0.1, and 0.2) across 100 iterations. It is worth mentioning that the use of such small thresholds does not yield conclusive evidence for the existence of the required connecting edges. Just like in statistical hypothesis testing, when the similarity falls below these critical values, it signifies the rejection of the hypothesis that such edges are present. However, it does not offer substantial evidence to confirm the presence of a connecting edge. Therefore, connections that collapse below these thresholds are deemed questionable and suggest possible manipulation.
Experiments are performed with a specified set of parameters.
- ✓
p=1.
- ✓
q=1.
- ✓
Nwalk = 200.
- ✓
Lwalk = 30.
- ✓
d= 64.
- ✓
N_iter = 100.
- ✓
Fr – 30/40/50 %.
- ✓
S – the cosine similarity.
- ✓
Tr – 0.05 / 0.1 / 0.2.
Recall that cosine similarity is a metric used to measure the similarity between two vectors in a vector space. It calculates the cosine of the angle between the vectors, providing a value that indicates their degree of similarity. The range of cosine similarity is from -1 to 1, where a value of 1 indicates identical vectors, 0 indicates no similarity, and -1 indicates entirely different vectors. To compute cosine similarity, the dot product of the two vectors is divided by the product of their magnitudes or norms. This normalization ensures that the similarity measure is independent of the vectors’ lengths and only depends on their directions. The concept of cosine similarity finds applications in various fields, such as natural language processing, information retrieval, and data mining. It allows quantifying the similarity between vectors or documents based on their relative orientations in a multi-dimensional space.
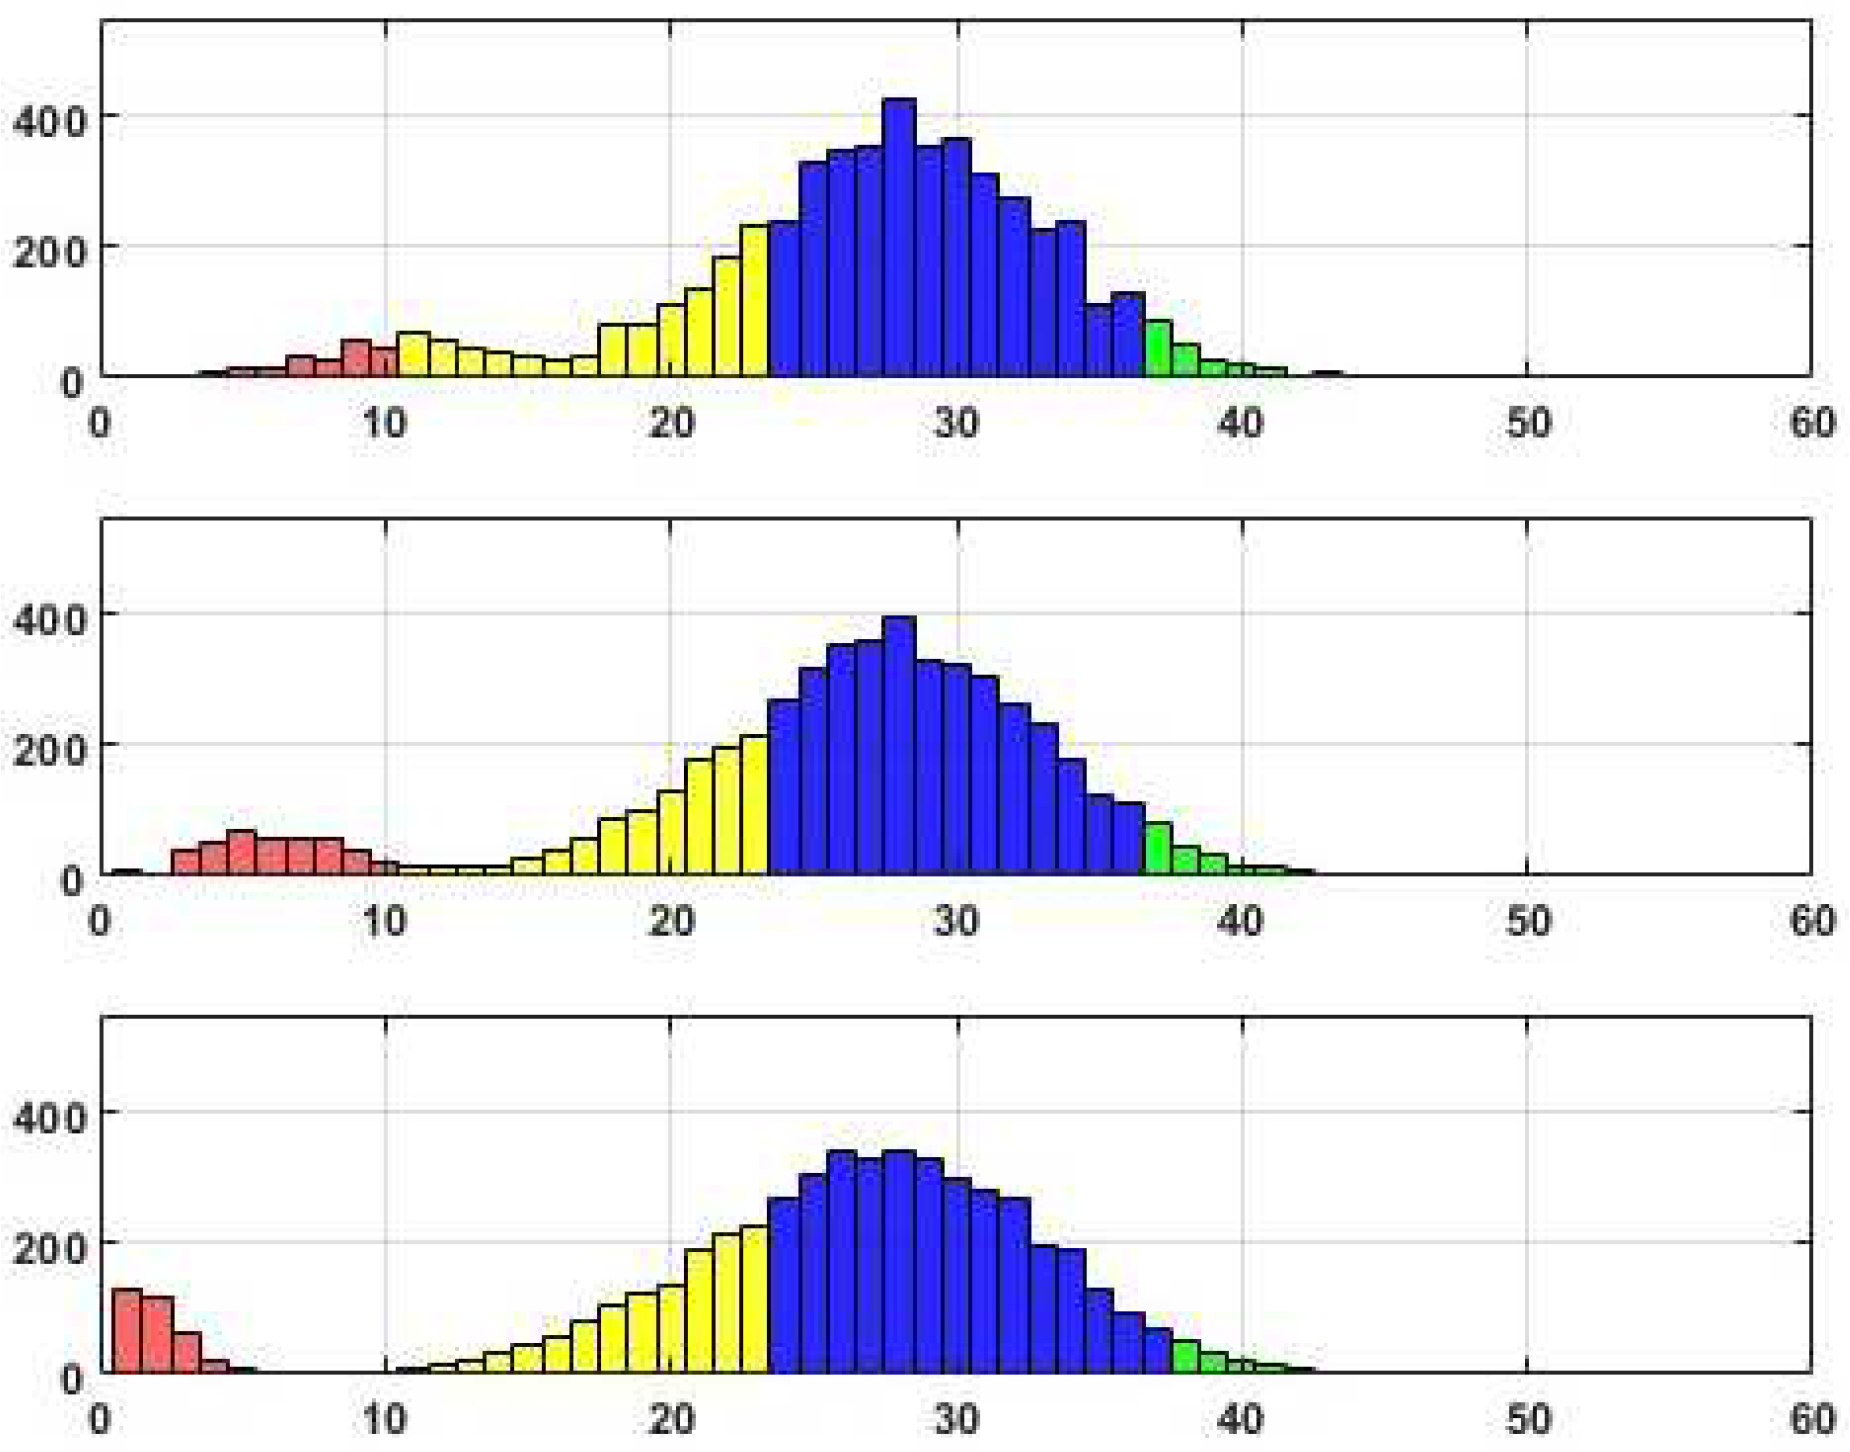
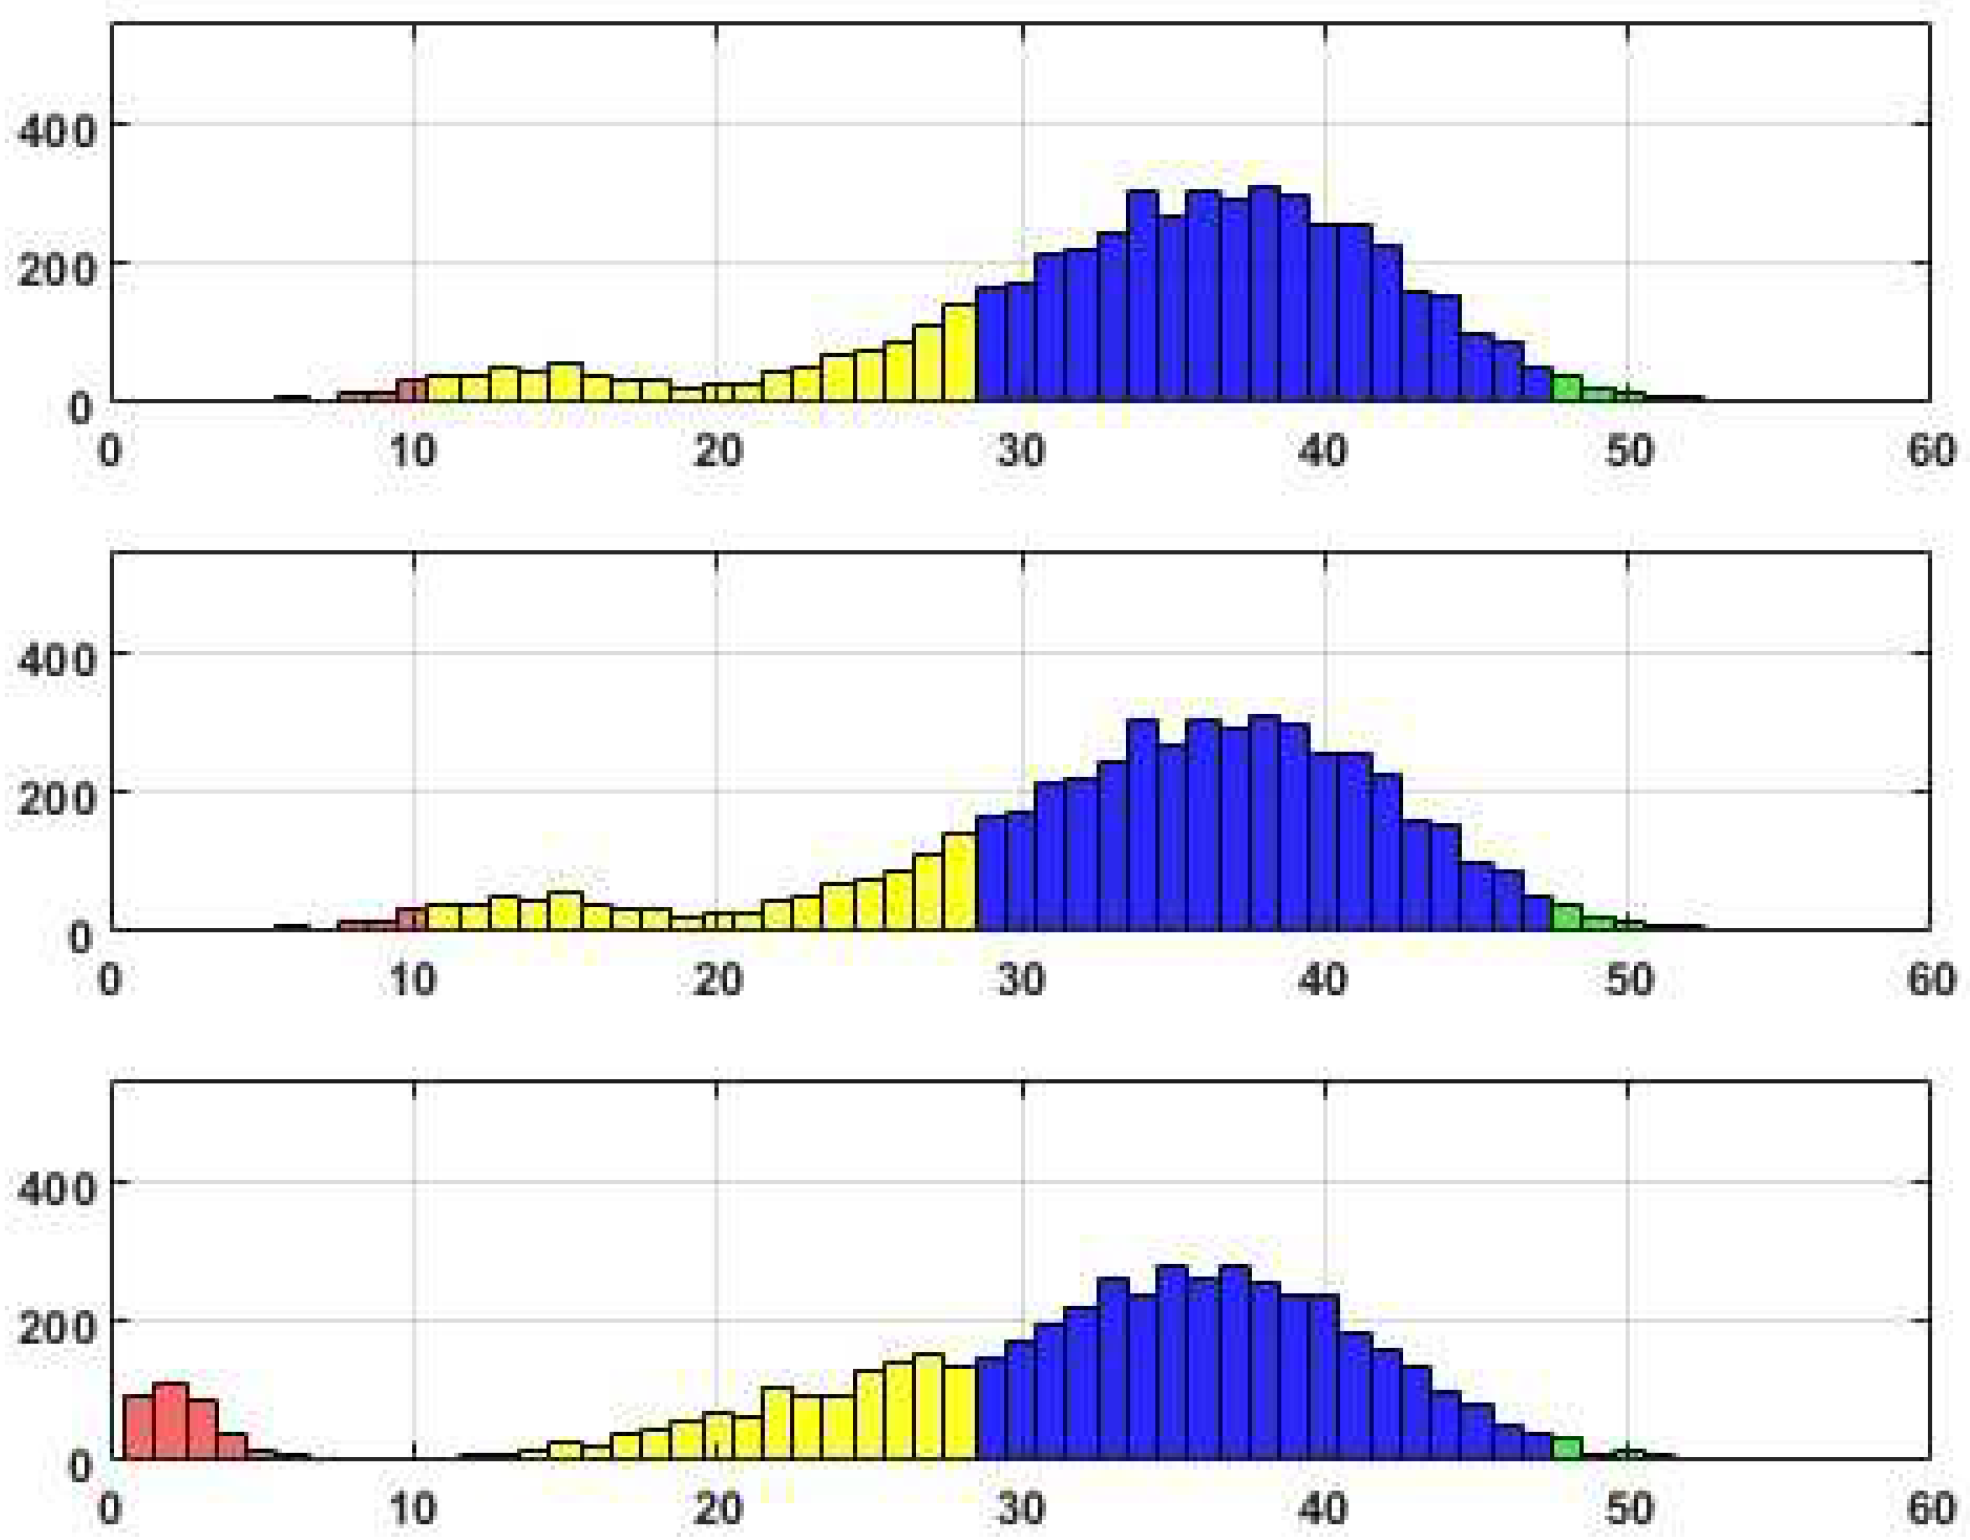
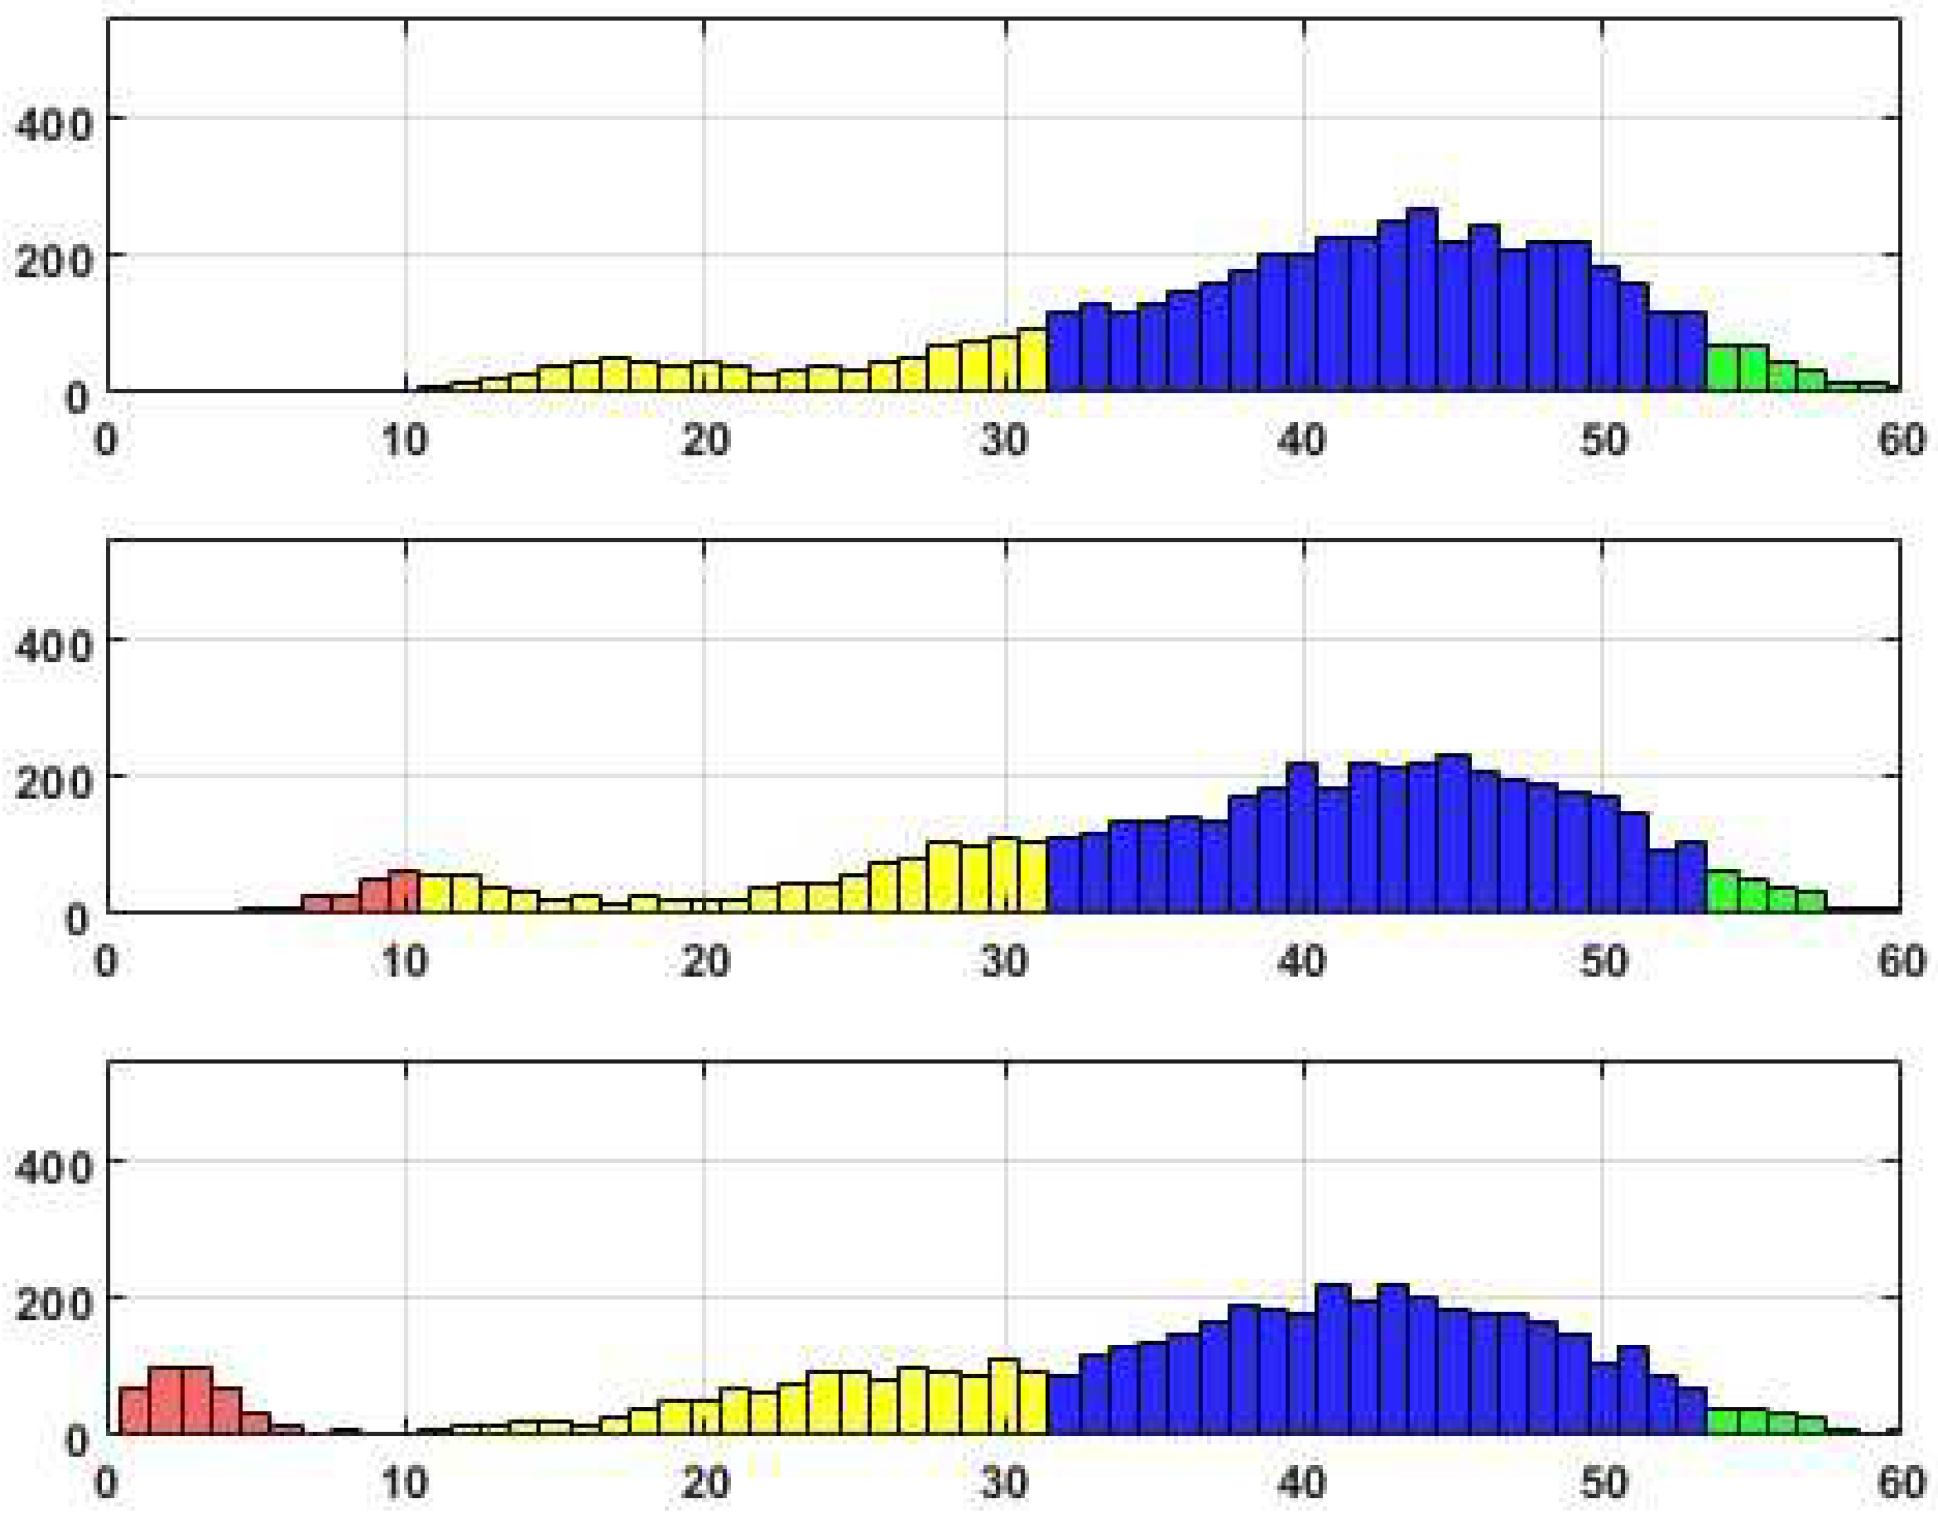
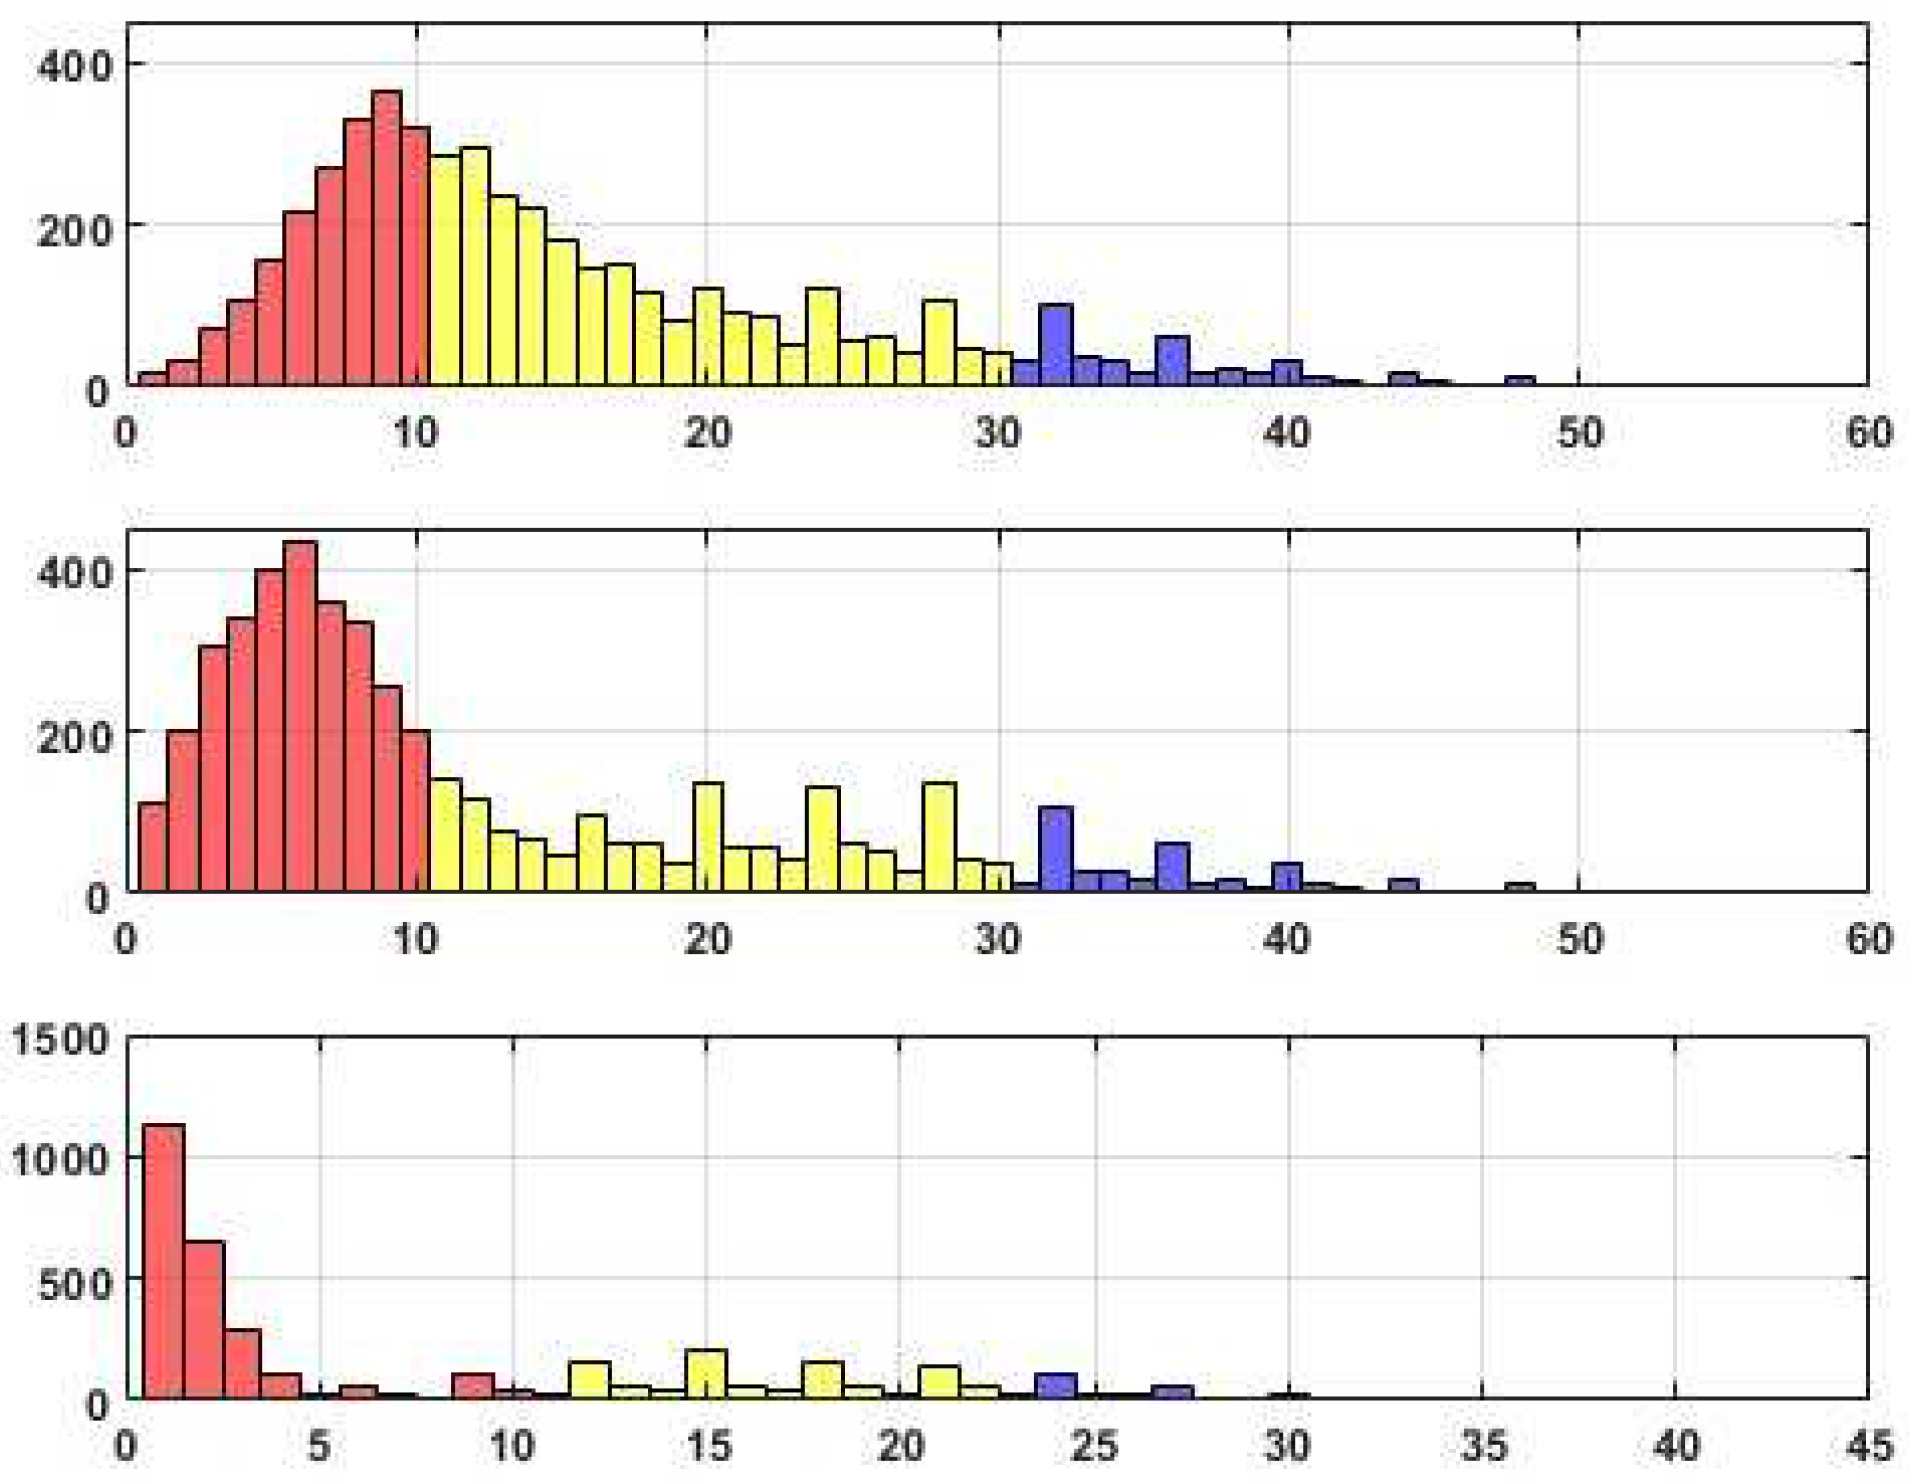
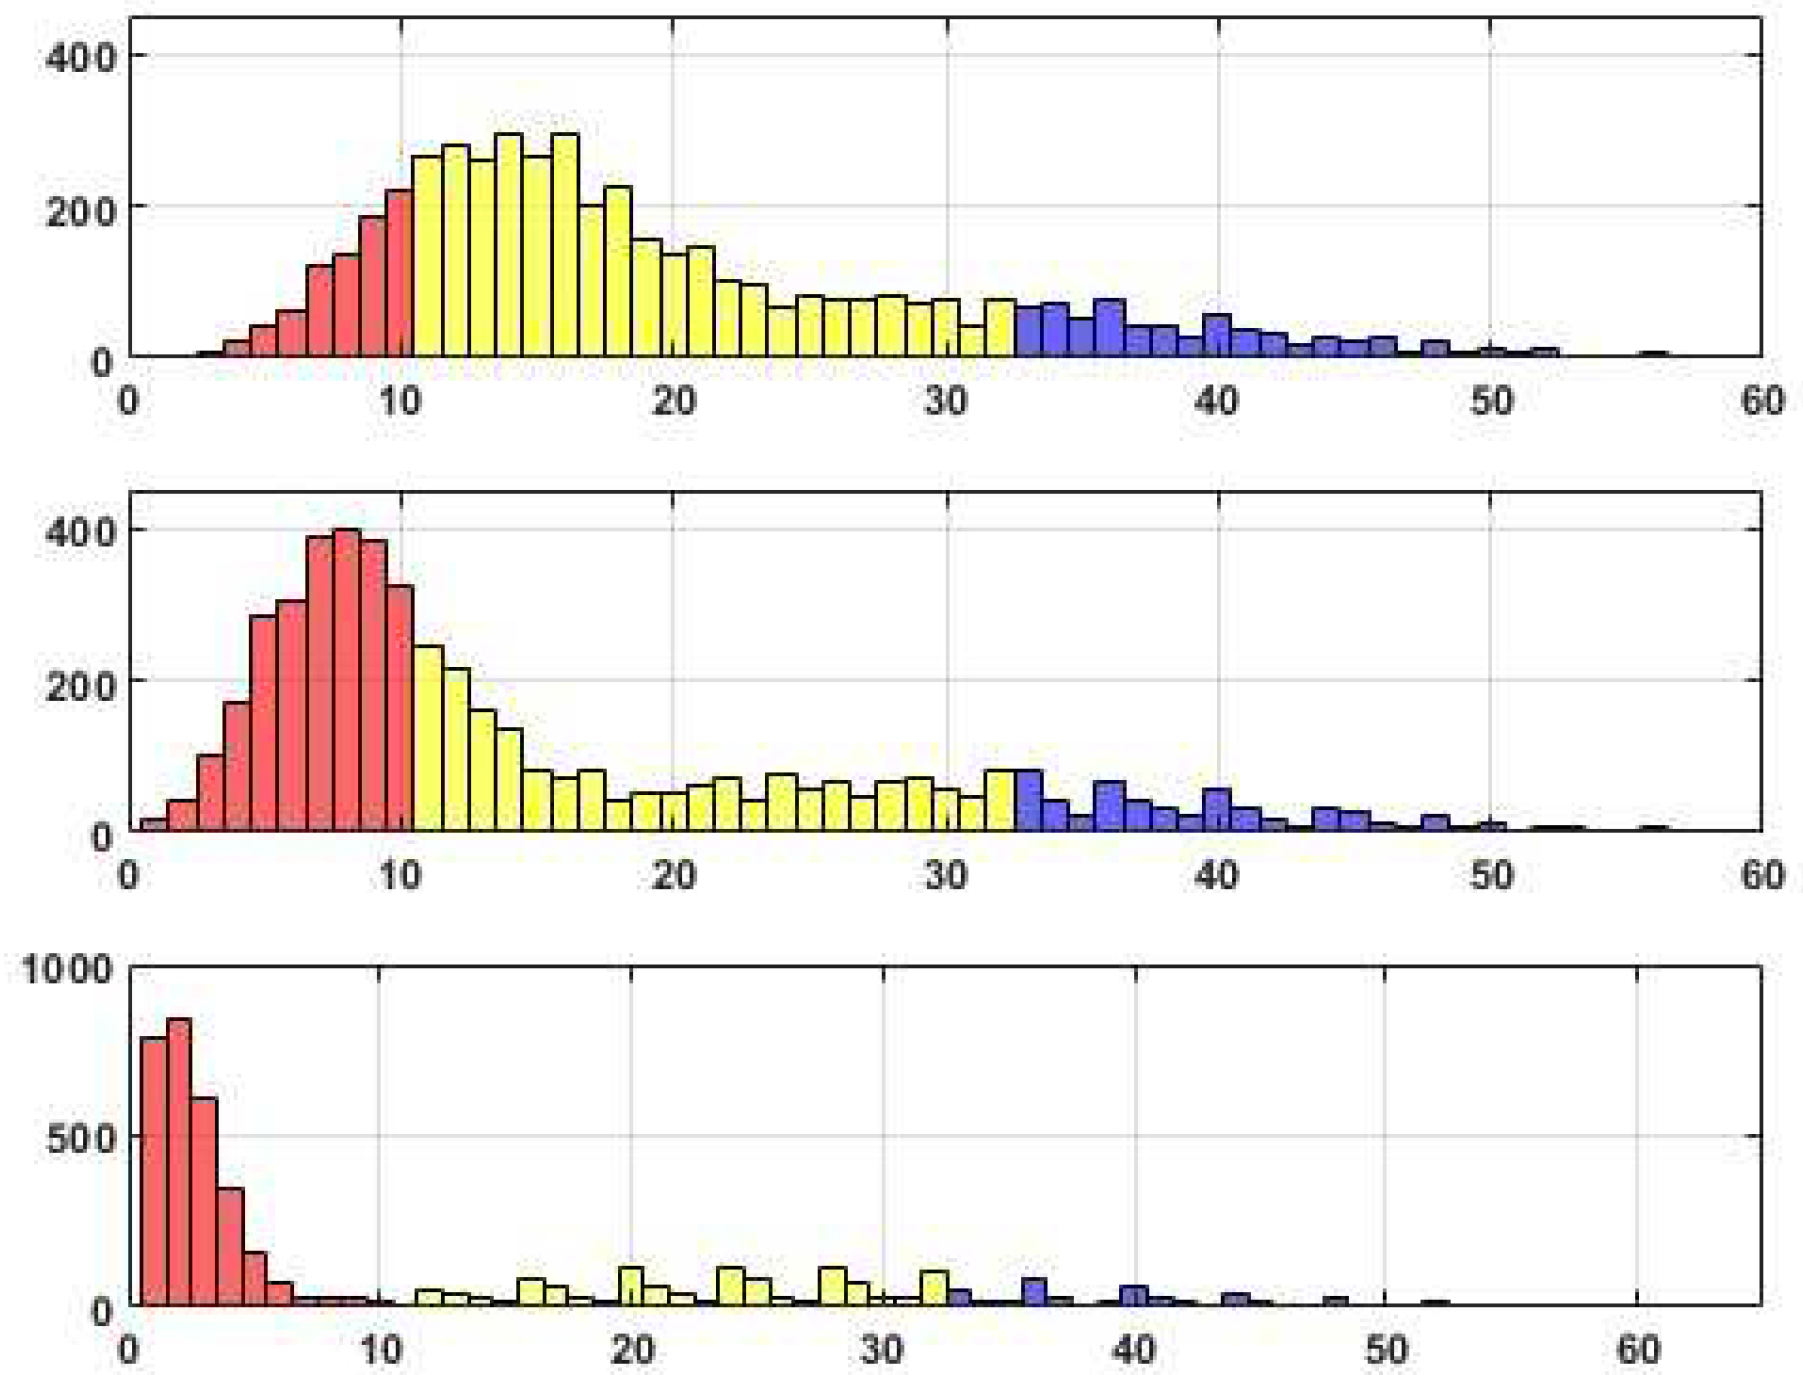
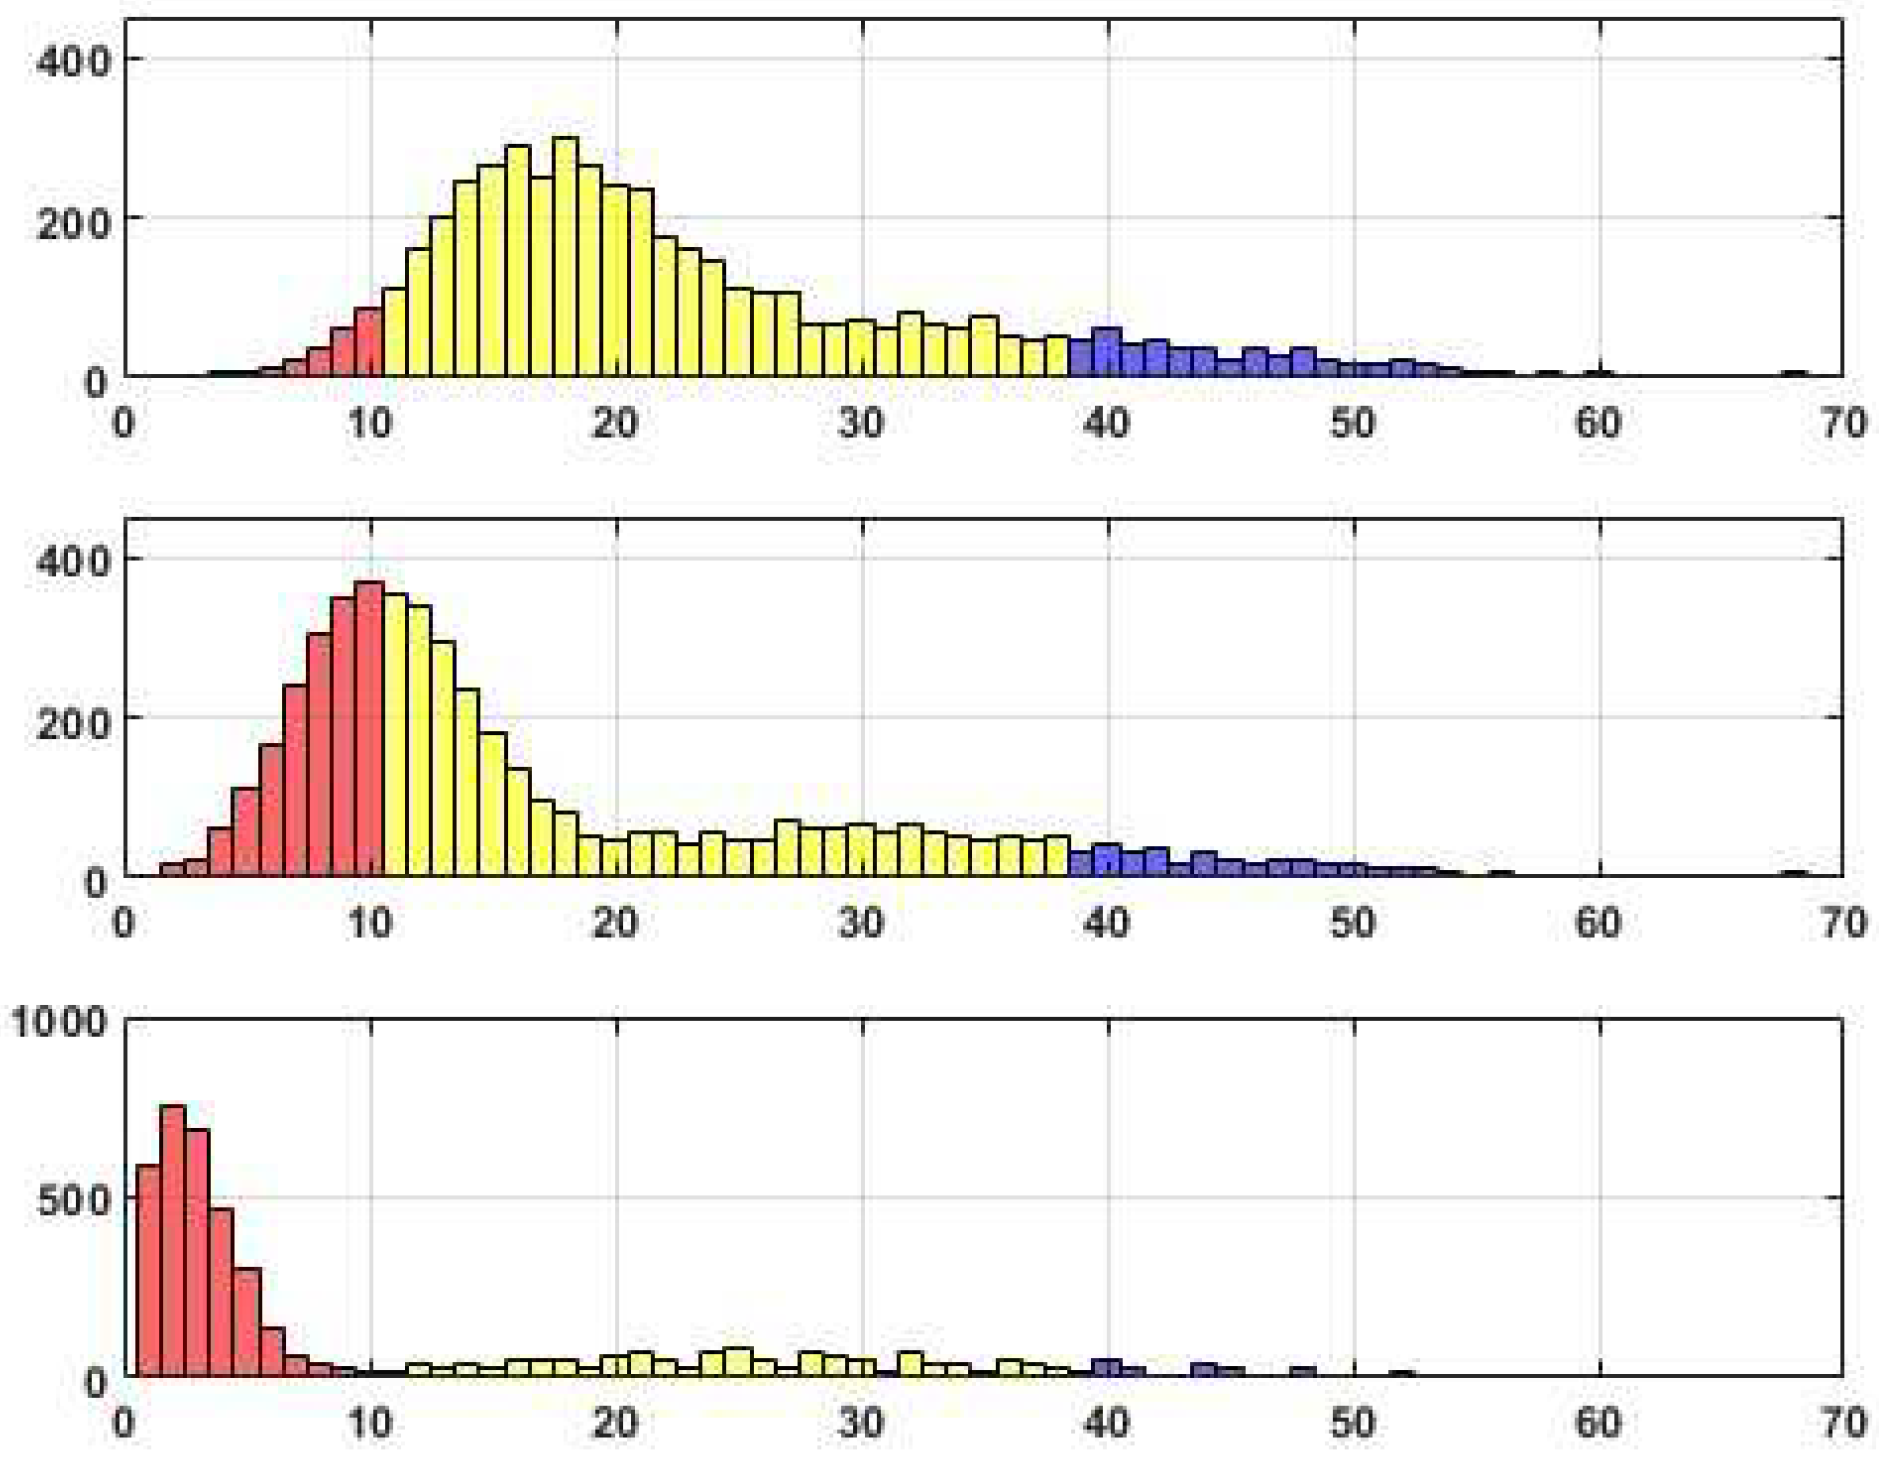
We have prepared three sets of histograms to illustrate the distributions of the scores obtained during the experiments. Each set includes three histograms, so the upper histogram represents the scores achieved with a threshold of
Tr=0.05, the middle histogram corresponds to
Tr=0.1, and the last histogram represents
Tr=0.2. In the visual depiction, the section in red corresponds to upper bound 10. The next interval’s upper bound, highlighted in yellow, is at half the maximum Reconstructed edges. The subsequent intervals, marked in blue and green, represent the upper bounds of the intervals based on the maximum number minus 10 and the maximum number of reconstructed edges, respectively.
Figure 3,
Figure 4 and Figure 5 display histograms that illustrate the distributions of edges within these categories. Accompanying tables provide additional detailed information regarding the edges’ allocation across the categories.
Figure 2.
Distributions of edge recovering for the CORA dataset for Fr=30%.
Figure 2.
Distributions of edge recovering for the CORA dataset for Fr=30%.
Table 1.
Distributions of edge recovering for the CORA dataset for Fr=30%.
Table 1.
Distributions of edge recovering for the CORA dataset for Fr=30%.
| |
Frequencies |
|
Mean |
Median |
| 0.04 |
0.22 |
0.72 |
0.02 |
26.57 |
28.00 |
| 0.08 |
0.21 |
0.69 |
0.02 |
25.79 |
27.00 |
| 0.07 |
0.24 |
0.66 |
0.03 |
24.96 |
27.00 |
Figure 3.
Distributions of edge recovering for the CORA dataset for Fr=40%.
Figure 3.
Distributions of edge recovering for the CORA dataset for Fr=40%.
Table 2.
Distributions of edge recovering for the CORA dataset for Fr=40%.
Table 2.
Distributions of edge recovering for the CORA dataset for Fr=40%.
| |
Frequencies |
|
Mean |
Median |
| 0.01 |
0.19 |
0.77 |
0.02 |
33.96 |
35.00 |
| 0.01 |
0.19 |
0.77 |
0.02 |
33.96 |
35.00 |
| 0.07 |
0.23 |
0.68 |
0.01 |
30.86 |
33.00 |
Figure 4.
Distributions of edge recovering for the CORA dataset for Fr=50%.
Figure 4.
Distributions of edge recovering for the CORA dataset for Fr=50%.
Table 3.
Distributions of edge recovering for the CORA dataset for Fr=50%.
Table 3.
Distributions of edge recovering for the CORA dataset for Fr=50%.
| |
Frequencies |
|
Mean |
Median |
| 0.00 |
0.18 |
0.77 |
0.05 |
40.04 |
42.00 |
| 0.04 |
0.21 |
0.71 |
0.04 |
37.98 |
40.00 |
| 0.08 |
0.24 |
0.66 |
0.03 |
35.24 |
38.00 |
Upon analyzing the histograms and tables obtained for various Fr values, a noticeable similarity between them becomes apparent. This finding suggests the presence of a consistent underlying structure within the dataset that remains resilient to permutations. It is worth noting that approximately 20% of the total edges (citations) fail to withstand the distortion procedure adequately. These edges, which exhibit high sensitivity to data transformation, do not align with the stable inner structure of the core system. Consequently, the corresponding citations may be considered suspicious and potentially manipulated.
Alternatively, it is worth noting that a distinct set of edges exhibits consistent behavior when subjected to perturbations, resulting in their high probability of being accurately reconstructed. These connections, in fact, constitute a stable core within the data, comprising a substantial number of critical edges that encompass these connections.
The tables provided below showcase 15 distinct sets of specific edges that consistently emerge across various parameter combinations, demonstrating the behavior discussed earlier. It is important to note that there is a significant overlap or intersection between these sets, indicating a strong association among the identified edges. Furthermore, the following table presents the top 15 highly reconstructed edges for all removed fractions (30%, 40%, and 50%) and all similarity thresholds, along with their corresponding average counts. The edges that successfully reconstructed each iteration are visually highlighted in red.
Table 4.
The top 15 highly reconstructed edges.
Table 4.
The top 15 highly reconstructed edges.
| Edge |
30 |
40 |
50 |
Average Count |
| |
0.05 |
0.1 |
0.2 |
0.05 |
0.1 |
0.2 |
0.05 |
0.1 |
0.2 |
30 |
40 |
50 |
| (116553, 116545) |
√ |
√ |
√ |
√ |
√ |
√ |
X |
X |
X |
46.3 |
49.6 |
51.6 |
| (559804, 73162) |
√ |
√ |
√ |
√ |
√ |
√ |
√ |
X |
X |
44.3 |
50.6 |
53.6 |
| (17476, 6385) |
√ |
√ |
√ |
√ |
√ |
√ |
√ |
√ |
√ |
44 |
55 |
62 |
| (96335, 3243) |
√ |
√ |
√ |
√ |
√ |
√ |
√ |
√ |
√ |
44 |
53 |
55.6 |
| (582343, 4660) |
√ |
√ |
√ |
√ |
√ |
√ |
√ |
√ |
√ |
44 |
50 |
56 |
| (6639, 22431) |
√ |
√ |
√ |
√ |
√ |
√ |
√ |
√ |
√ |
43.3 |
53 |
60.3 |
| (78511, 78557) |
√ |
√ |
√ |
√ |
√ |
√ |
√ |
√ |
√ |
43.3 |
50 |
58.6 |
| (1104379, 13885) |
√ |
√ |
√ |
√ |
√ |
X |
√ |
X |
X |
42.6 |
50 |
52.6 |
| (39126, 31483) |
√ |
√ |
√ |
√ |
√ |
√ |
√ |
√ |
√ |
42.6 |
51.3 |
56 |
| (10177, 27606) |
√ |
√ |
√ |
√ |
√ |
√ |
√ |
√ |
√ |
42.3 |
53 |
58 |
| (1129683, 608326) |
√ |
√ |
√ |
X |
X |
X |
X |
X |
X |
42.3 |
45.3 |
49.6 |
| (38829, 1116397) |
√ |
√ |
√ |
X |
X |
X |
X |
X |
X |
40.3 |
44.6 |
38.6 |
| (1107567, 12165) |
√ |
√ |
√ |
√ |
√ |
√ |
√ |
√ |
√ |
42.3 |
57 |
60 |
| (287787, 634975) |
√ |
√ |
√ |
√ |
√ |
√ |
X |
X |
X |
42 |
50.3 |
50.6 |
| (643221, 644448) |
√ |
√ |
√ |
√ |
√ |
√ |
√ |
√ |
X |
42 |
49.3 |
54.3 |
The following table presents obtainable papers’ titles. Please take note that due to the incompleteness of the CORA dataset, certain ID’s do not have corresponding names available. These cases are represented as "--" in the information provided below.
Table 5.
The titles of the top 15 highly reconstructed edges.
Table 5.
The titles of the top 15 highly reconstructed edges.
| Edge |
Name of ID 1 |
Name of ID 2 |
| (116553, 116545) |
A survey of intron research in genetics. |
Duplication of coding segments in genetic programming. |
| (559804, 73162) |
On the testability of causal models with latent and instrumental variables. |
Causal diagrams for experimental research. |
| (17476, 6385) |
Markov games as a framework for multi-agent reinforcement learning. |
Multi-agent reinforcement learning: independent vs. |
| (96335, 3243) |
Geometry in learning. |
A system for induction of oblique decision trees. |
| (582343, 4660) |
Transferring and retraining learned information filters. |
Context-sensitive learning methods for text categorization. |
| (6639, 22431) |
Stochastic Inductive Logic Programming. |
An investigation of noise-tolerant relational concept learning algorithms. |
| (78511, 78557) |
Genetic Algorithms and Very Fast Reannealing: A Comparison. |
Application of statistical mechanics methodology to term-structure bond-pricing models. |
| (1104379, 13885) |
-- |
Learning controllers for industrial robots. |
| (39126, 31483) |
Toward optimal feature selection. |
Induction of selective bayesian classifiers. |
| (10177, 27606) |
Learning in the presence of malicious errors. |
Statistical queries and faulty PAC oracles. |
| (1129683, 608326) |
-- |
A sampling-based heuristic for tree search. |
| (38829, 1116397) |
From Design Experiences to Generic Mechanisms: Model-Based Learning in Analogical Design. |
-- |
| (1107567, 12165) |
-- |
Slonim. The power of team exploration: Two robots can learn unlabeled directed graphs. |
| (287787, 634975) |
A User-Friendly Workbench for Order-Based Genetic Algorithm Research, |
Reducing disruption of superior building blocks in genetic algorithms. |
| (643221, 644448) |
Minorization conditions and convergence rates for Markov chain Monte Carlo. |
G.O. and Sahu, S.K. (1997) Adaptive Markov chain Monte Carlo through regeneration. |
4.2. Pubmed-Diabetes dataset
The term "Pubmed-Diabetes dataset" commonly refers to a compilation of scientific articles concerning diabetes that can be found in the PubMed database. PubMed is an extensive online resource managed by the National Center for Biotechnology Information (NCBI) and the U.S. National Library of Medicine, housing various biomedical literature, including research papers, reviews, and scholarly publications. In our research, we utilized the dgl.data.PubmedGraphDataset() function from the Deep Graph Library (DGL) to retrieve and load the Pubmed-Diabetes dataset. This function is a component of the Deep Graph Library (DGL) that facilitates the retrieval and loading of the Pubmed-Diabetes dataset consisting of scientific articles focusing on diabetes, which are sourced from the PubMed database. Designed specifically for this dataset, the function enables researchers to conveniently access and analyze the interconnected information present within these articles
During our analysis, we randomly chose a subset of 5201 edges from the dataset. Interestingly, we observed that among these selected edges, 4867 edges were connected. This discovery offers valuable insights into the interconnectedness within the chosen portion of the PubMed-Diabetes dataset, representing a random sample accounting for 10% of the original dataset. An analysis of such a sample dataset can be conducted similarly to the analysis performed on the CORA dataset.
In line with previous discussions, histograms in
Figure 6,
Figure 7 and
Figure 8 showcase the distributions of edges across these specific categories. Corresponding tables provide detailed supplementary information regarding the allocation of edges within each category.
Figure 6.
Distributions of edge recovering for the PubMed dataset for Fr=30%.
Figure 6.
Distributions of edge recovering for the PubMed dataset for Fr=30%.
Table 6.
Distributions of edge recovering for the PubMed dataset for Fr=30%.
Table 6.
Distributions of edge recovering for the PubMed dataset for Fr=30%.
| |
Frequencies |
|
Mean |
Median |
| 0.39 |
0.52 |
0.09 |
0.00 |
15.26 |
12.00 |
| 0.61 |
0.31 |
0.08 |
0.00 |
12.36 |
8.00 |
| 0.64 |
0.26 |
0.09 |
0.00 |
6.57 |
2.00 |
Figure 7.
Distributions of edge recovering for the PubMed dataset for Fr=40%.
Figure 7.
Distributions of edge recovering for the PubMed dataset for Fr=40%.
Table 7.
Distributions of edge recovering for the PubMed dataset for Fr=40%.
Table 7.
Distributions of edge recovering for the PubMed dataset for Fr=40%.
| |
Frequencies |
|
Mean |
Median |
| 0.17 |
0.69 |
0.14 |
0.00 |
19.56 |
16.00 |
| 0.49 |
0.39 |
0.11 |
0.00 |
15.45 |
11.00 |
| 0.65 |
0.26 |
0.09 |
0.00 |
10.42 |
3.00 |
Figure 8.
Distributions of edge recovering for the PubMed dataset for Fr=50%.
Figure 8.
Distributions of edge recovering for the PubMed dataset for Fr=50%.
Table 8.
Distributions of edge recovering for the PubMed dataset for Fr=50%.
Table 8.
Distributions of edge recovering for the PubMed dataset for Fr=50%.
| |
Frequencies |
|
Mean |
Median |
| 0.05 |
0.84 |
0.11 |
0.00 |
23.17 |
20.00 |
| 0.34 |
0.58 |
0.08 |
0.00 |
17.72 |
13.00 |
| 0.67 |
0.27 |
0.06 |
0.00 |
11.22 |
4.00 |
The observed sensitivity of the dataset to the considered perturbations highlights the need for careful parameter selection. Notably, the results indicate that the dataset is exceptionally responsive when the similarity threshold (Tr) is set to 0.05. This setting consistently produces suitable outcomes for Fr values of 0.3 or 0.4, indicating a robust relationship between the selected threshold and the desired results. However, when Fr is increased to 0.5, the optimal choice for the similarity threshold becomes slightly more nuanced. In this case, both Tr values of 0.05 and 0.1 provide favorable results, suggesting a broader range of acceptable thresholds. Nevertheless, it is essential to note that despite achieving desirable outcomes, the expected core associated with the reconstructed edges appears to be of inferior quality compared to other cases. This finding implies that the reliability and relevance of the reconstructed edges within this particular subset may be questionable and should be treated with caution.
It is important to note that the results discussed so far are based on analyzing a subset of the dataset, representing only 10% of the entire collection. This limited sample size may have implications for the generalizability and reliability of the findings. Therefore, it is crucial to interpret the results within the context of this subset and exercise caution when drawing broader conclusions about the entire dataset.
The obtained results corroborate the previous findings concerning the CORA dataset. Specifically, a consistent pattern emerges where around one-third (or possibly slightly more, considering the lower fraction of the first category) of the edges demonstrate instability and lack relevance. This consistency between the results obtained for both datasets suggests a common underlying characteristic regarding the reliability of the edges. It indicates that a significant portion of the connections within citation datasets may be less trustworthy or subject to potential manipulation.
