
You are currently viewing a beta version of our website. If you spot anything unusual, kindly let us know.
Preprint
Article
Measurement Uncertainty Analysis of the Stitching Linear-Scan Method for the Measurable Dimension of Small Cylinders
Altmetrics
Downloads
79
Views
16
Comments
0
A peer-reviewed article of this preprint also exists.

This version is not peer-reviewed
Abstract
To verify the reliability of the proposed stitching linear scan method for roundness measurement of small cylindrical workpieces, measurement uncertainties of the workpieces with various dimension are conducted. The cross-sectional circle of a cylindrical workpiece is divided into several equal arcs to be measured. Thus, the arc profile can be characterized according to the measured arcs. The roundness profile of the cylindrical part can be obtained by stitching these arc profiles together. Firstly, the measurement uncertainty of the workpiece with a diameter 1.5 mm and length 5.8 mm is evaluated to be 0.095 μm which can meet the uncertainty target of 0.1 μm. Considering the uncertainty of θx and θz which are the alignment around X-axis and Z-axis respectively changing with workpiece dimension changing, relevant uncertainties are carried out. As a result, there is no limitation with respect to workpiece diameter theoretically If the alignment can reach θz = θx = ±0.1° without considering the measurable range of the machine.
Keywords:
Subject: Engineering - Industrial and Manufacturing Engineering
1. Introduction
Fine mechanics, such as RV reducers, play a significant role in industrial robot and machine tool spindles. There are many cylindrical parts with various diameters employed in RV reducers. The performance and life of an RV reducer are affected by the quality of these cylindrical parts very much [1,2,3,4,5]. The parameter of roundness and diameter is always used to evaluate the quality of the cylindrical parts. The more precision the parameter is, the better the quality is. To enhance the quality of the cylindrical parts, precision measurement is necessary [6,7,8,9,10,11]. Conventionally, roundness measurement can be carried out by the rotary scan method with a roundness measuring machine [12,13,14,15]. In recent years, some alternative roundness measurement methods have been proposed, such as the multiple probe method and online method [16,17,18,19]. However, due to the crucial alignments (Inclination and eccentricity) of the rotary scan method, precision roundness measurement become difficult when the diameter of the measured workpiece becomes smaller. To address this issue, the stitching linear scan method is proposed [20,21,22]. In this method, the coordinates of the cross-sectional circle of the cylindrical workpiece which is attached to a round magnetic jig and mounted on a V-groove, are divided into several equal arcs to be scanned linearly by a profilometer. A set of arc coordinate data can be obtained after one linear scan on the surface of the cylindrical workpiece. The measured cylindrical workpiece is rotated by an equal angle to a new measuring position by rotating the magnetic jig and then scanned again. Another set of arc data can be obtained. Repeat the procedure by several times till the entire cross-sectional circle of the cylindrical workpiece is scanned completely, then a series of arcs can be obtained. The arc profiles, which can be characterized according to the obtained arcs, are used to stitch into a roundness profile. Through the stitching angle error compensation, overlap parts integration, and filter processing, an accurate, integral, smooth, continuous roundness profile can be obtained [20,21,22].
Although small cylindrical parts can be measured by the stitching linear scan method, the measurable range of this method hasn’t been analyzed. In this paper, measurement uncertainty is used to verify the reliability of the stitching linear scan method for the roundness measurement of small cylindrical parts with various diameters. Due to ambiguous between random error and system error, the concept of measurement uncertainty is proposed in 1993. The measured result can be reasonably and quantitively evaluated according to GUM (Guide to the Expression of Uncertainty in Measurement) which is actually an error propagation [23,24,25,26]. The measurement uncertainty is necessary for multiple disciplines, such as survey measurement uncertainty, IoT sensor uncertainty, rainfall measurement, standardized track insulation measurement, etc [27,28,29,30]. In this paper, the analysis of measurement uncertainty is presented and the measurable range of the cylindrical workpiece can be confirmed.
2. Principles and Experiment
As is known to all, the surface form of a measured workpiece can be modeled and reconstructed by coordinates. In this paper, the coordinates of the cross-sectional circle of a small cylindrical workpiece are divided into several equal arcs to be scanned by a profilometer. The diameter and center coordinates of these arcs can be fitted by the least square method. The arc profiles can be characterized according to the arc data. The roundness profile of the small cylindrical part can be obtained by stitching these arc profiles one by one in sequence.
As shown in Figure 1(a), the small cylindrical workpiece with a diameter of 1.5 mm and length of 7.8 mm is attached to the circular magnetic jig which is marked by 8 equal lines on the surface. This kind of combination is mounted on the V-groove. As shown in Figure 1(b), the stylus of the profilometer is brought to scan on the surface of the small cylindrical workpiece and return to the initial position, then the first arc coordinate data can be obtained. The small cylindrical workpiece is rotated by 45° by rotating the circular magnetic jig by one equal part. The stylus scans on the surface of the workpiece again and returns, then the second arc coordinate data can be obtained. Repeat the procedure by 7 times, then 8 arc coordinate data can be obtained. Since the maximum measuring inclination of the stylus is ±45°, only 85° arc coordinate data is extracted for the following data processing.
The 8 arc profiles with respect to the arc coordinate can be characterized by a series of data processing. An inaccurate roundness profile can be formed by stitching these 8 arc profiles together. Regarding the stitching procedure, as shown in Figure 2(a)&(b), arc profiles 1 and 2 are at the initial position. As shown in Figure 2(c), the first arc profile is kept static and the second arc profile is rotated by 45° since there is a 45° angular displacement between adjacent arc profiles according to the measuring procedure. As shown in Figure 2(d) the second arc profile is kept static, and the third arc profile is rotated by 45°, and the rest of the arc profiles are stitched in this manner. However, there are some stitching angle errors between adjacent arc profiles since the small cylindrical workpiece is rotated manually, namely, the angular displacement between adjacent arc profiles is not always 45°. Therefore, stitching angle error compensation is necessary. An accurate, integral, smooth, continuous roundness profile can be obtained after stitching error compensation, overlap part combination, and low-pass filter.
3. Measurement uncertainty analysis of the linear-scan method
3.1. Building mathematical models
The uncertainty of the proposed linear-scan measurement method was evaluated in a measurement experiment of a small cylindrical workpiece with a small diameter of 1.5 mm and a length of 7.8 mm. A mathematical model was constructed to calculate the measurement uncertainty of the diameter and roundness. The arc output (xi, zi) in the rectangular coordinate system is obtained from the scanning of the linear scanning stylus. The mathematical model for the radius calculation and the uncertainty factors arising from the measurements are shown in Figure 3(a). For the radius calculation, a perfect circle is assumed, and the center of the circle is set to the origin. The radius Ri of an arbitrary measurement point is expressed in terms of the Z-axis output zi and X-axis coordinates xi of any measurement point using the following equation.
From equation (1), the combined standard uncertainty u(Ri) of the measured arc radius is expressed as:
The uncertainty coefficients in the figure are:
(1) Uncertainty coefficient of output zi in the Z-axis direction.
u(ecalibration_Z): Uncertainty of stylus calibration in the Z-axis direction.
u(eresolution): Uncertainty due to stylus resolution.
u(erepeatt): Uncertainty of repeated measurements.
(2) Uncertainty coefficient of output xi in the X-axis direction
u(ecalibration_X): Uncertainty of stylus calibration in the X-axis direction.
u(ealignment_Z): Uncertainty due to orientation error around the Z-axis of the workpiece.
u(ealignment_X): Uncertainty due to orientation error around the X-axis of the workpiece.
In summary, the combined standard uncertainty zi of the Z-axis output and the combined standard uncertainty of the X-axis coordinate xi are expressed by the following equations (3) and (4), respectively.
For the calculation of roundness, it is assumed that there is a deviation from the approximate circle center rather than the radian of a perfect circle, and the approximate circle center is set as the origin. The radius Ri of any measurement point, the radius R0 of the vertex, and the X-axis coordinate xi are used to represent the Z-axis output zi of any measurement point with the following equation.
The radius Ri after the stitching process is calculated according to Equation (6).
Δri is the radial deviation at any measured point and Δr0 is the radial deviation at the arc apex.
Square both sides of equation (5), substitute into equations (7) and (8), and rearrange.
From Eq. (9), the combined standard uncertainty u(Δri) of the radial deviation of any measurement point can be expressed as:
The uncertainty factors shown in Figure 3(b) are similar to the radius measurement model described above. Therefore, the combined standard uncertainty zi for the Z-axis output and the combined standard uncertainty for the X-axis coordinate xi are expressed by Eq. (6) and Eq. (7), respectively. The uncertainty of the radius after the suturing process is expressed by the following equation, using the combined standard uncertainty u(Ri) of the radius obtained from Eq. (6) and the number of arc divisions N.
3.2. Measurement uncertainty evaluation
1. Uncertainty coefficient of output zi in the Z-axis direction.
The standard uncertainty of each uncertainty factor is derived using appropriate evaluation methods.
(1) Uncertainty of stylus calibration in Z-axis direction u(ecalibration_Z).
The calibration of the Form Talysurf PGI420 used was performed with the dedicated master sphere shown in Figure 4(a). The Pt value is the minimum maximum width after linear expansion of the arc measured at the known radius value shown in Figure 4(b), including shape error of the master sphere, shape error of the stylus tip diameter, electrical noise in the system, and mechanical and environmental disturbances Pt value = 0.0337μm is in the radial direction, but assuming the presence in the Z-axis and X-axis directions, respectively, and a larger estimate, the uncertainty of the stylus calibration in the Z-axis direction uncertainty can be expressed by the following equation.
(2) Uncertainty due to stylus resolution u(eresolution).
The Form Talysurf PGI420 uses a linear scanning stylus with a vertical resolution of 3.2 nm. The uncertainty due to the resolution of the stylus is considered to be a ±1.6 nm rectangular distribution, which can be determined using the Type B evaluation method by the following equation.
(3) Uncertainty of repeated measurements u(erepeat).
The results of repeated measurements using the Form Talysurf PGI420 on the cross-sectional circle of a small cylindrical workpiece with a diameter of 1.5 mm were used to estimate the uncertainty due to measurement error: The repeatability was 59.93 nm based on 10 repeated measurements, and the uncertainty of the repeated measurements can be determined using the Type A evaluation method according to the following formula.
2. Uncertainty coefficient of the x-axis coordinate xi.
(1) Uncertainty of stylus calibration in the X-axis direction u(ecalibration_X).
When picking up the output zi in the Z-axis direction as the uncertainty coefficient, it is assumed that Pt values exist in the Z-axis and X-axis directions, respectively, so the uncertainty of the stylus calibration in the X-axis direction is the same as that in the X-axis direction, expressed by the following equation.
(2) Uncertainty due to orientation error around the Z-axis of the workpiece u(ealignment_Z).
The uncertainty caused by the workpiece attitude error is calculated by establishing a mathematical model of the measurement error, and the calculated value of the measurement error is used to determine the uncertainty by B-type evaluation. Figure 5(a) shows a schematic diagram of the effect of the orientation error of a cylindrical workpiece around the Z-axis. The diameter of the workpiece is D, the radius is R, the coordinates of the acquired arc endpoints are (xedge, zedge), and the angle of the attitude error is θZ. The attitude error around the Z-axis causes the measurement result of the geometric circle of the geometric cylinder to appear as an ellipse with its main axis in the X-axis direction. An error occurs in the X-axis coordinates because an arc of φ = 85°, i.e., an arc of height h from the vertex, is extracted regardless of the workpiece diameter, as shown in Equation (17). If the error angle is ±θZ° and this error has a rectangular distribution, the uncertainty due to the posture error around the Z-axis is represented by the following equation.
In the actual measurement, the alignment of the rotary table and the scanning of the stylus were repeatedly performed so that the obtained arc length converged to the minimum and the error angle θZ was measured as small as possible. Assuming an error angle of ±1° at this point, the uncertainty due to the pose error around the Z-axis can be obtained by substituting the radius after the stitching process into equation (18) as follows.
(3) Uncertainty due to orientation error around the X-axis of the workpiece u(ealignment_Z).
Figure 5(b) shows a schematic diagram of the effect of the attitude error around the X-axis on a cylindrical workpiece. The diameter of the workpiece is D, the radius is R, the coordinates of the arc endpoints are obtained as (xedge, zedge), and the angle of the orientation error is θX. The orientation error around the X-axis causes the measurement of the geometric circle of the geometric cylinder to appear as an ellipse of the main axis in the Z-axis direction. The error in the X-axis coordinates is because the arc of height h is extracted from the vertex, just as in the case of the directional error around the Z-axis. If the error angle is ±θX° and the error has a rectangular distribution, the uncertainty caused by the positional error around the X-axis is given as follows.
In the actual measurement, the manual stage is moved in the Y-axis direction with the stylus in contact with the plane of the mounting table and aligned with the inclined stage to minimize displacement output variation. The error angle θX is measured as small as possible. Assuming that the error angle at this point is ±0.1°, the uncertainty caused by the attitude error around the X-axis is obtained by substituting the radius after the stitching process into equation (9) as follows.
Table 1 and Table 2 summarize the calculated results for each uncertainty. From these results, the combined standard uncertainty zi for the Z-axis output and the combined standard uncertainty xi for the X-axis coordinates can be expressed respectively by the following equations.
Using the calculated uncertainty, the combined standard uncertainty u(Ri) of the measured arc radius can be obtained from equation (23) as follows Substitute the combination of (xi, zi), i.e., the coordinates of the arc endpoint (xedge, zedge) = (0.50575, 0.55280), for which the u(Ri) obtained from the measurement is the maximum.
The uncertainty of the radius after the suturing process can be obtained by substituting the values obtained in equation (13) into equation (11) to obtain the following equation.
The uncertainty of the diameter measurement is twice the uncertainty of the radius.
Calculating the extended uncertainty for k=2 yields the following.
As can be seen above, the uncertainty of the diameter measurement of the 1.5 mm small cylindrical workpiece using the linear scanning method, was estimated to be ±47.24 nm, achieving a target measurement uncertainty within ±0.1 μm. Table 3 summarizes the results of the standard uncertainty.
Using the calculated uncertainty, the combined standard uncertainty u(Δri) of the radial deviation of any measured point can be obtained from Eq. (10) as follows Substituting the combination of (xi, mi), the coordinates of the endpoint of the arc (xedge, zedge) = (0.50575, 0.55280) and the radius after the stitching process, for which u obtained from the measurement u(Δri) is maximum, the following equation is obtained.
Using the same assumptions as in equations (6) and (29), the combined standard uncertainty u(Δzq) of roundness can be expressed as follows.
Substituting the uncertainty calculated in Eq. (26), the combined standard uncertainty u(Δzq) is obtained from Eq. (27), as shown in Equation (31) below.
Calculating the extended uncertainty for k= 2, the following equation is obtained.
As can be seen above, the uncertainty in the roundness measurement of a small cylindrical workpiece with a diameter of 1.5 mm was estimated to be ±95.44 nm using the linear scanning method, achieving a target measurement uncertainty of ±0.1 μm or less. Table 3 summarizes the results of the standard uncertainty.
3.3. Variation of uncertainty due to change in workpiece diameter
The purpose of calculating the measurement uncertainty when the workpiece diameter varies by simulation is to investigate the cylindrical workpiece diameter suitable for roundness measurement using a roundness measuring machine, which is a linear scanning type measurement method. Among the uncertainty coefficients described in the previous section, the uncertainty coefficient u(ealignment_Z) due to the orientation error around the workpiece Z-axis and the uncertainty coefficient u(ealignment_X) due to the orientation error around the workpiece X-axis vary significantly with the change of the workpiece diameter, while the others are considered to be almost unchanged. Using equations (13) and (14), the graphs of the uncertainty u(xi) in the x-axis coordinate as the workpiece diameter varies from 0.01 mm to 50.00 mm are shown in Figure 6(a) and (b). Figure 6(a) shows that u(ealignment_Z) increases with increasing diameter and becomes almost the same as u(xi), but the change in u(ealignment_X) is smaller. This means that u(ealignment_Z) is the dominant factor in the variation of u(xi). This is due to the setting of the attitude error angles θZ = ±1° and θX = ±0.1° considering the alignment method and stylus resolution, while θZ is estimated to be greater than θX. Figure 7(a) shows the graphs representing the variation of the extended uncertainty U(D) for diameter and the extended uncertainty U(Δzq) for roundness, created by substituting u(xi) and other standard uncertainties, which vary with workpiece diameter, showing that both U(D) and U(Δzq) increase as the workpiece diameter increases due to the effect of u(xi). increases with increasing workpiece diameter due to the effect of u(xi). Figure 7(b) shows a graph for expanding the range of workpiece diameters from 0.01 mm to 10 mm. From this graph, it can be read that the conditions under which the target measurement uncertainty within ±0.1 m of the workpiece diameter can theoretically be achieved are U(D) of 5.58 mm or less and U(Δzq) of 2.11 mm or less when the attitude error angle θZ = ±1° and θX = ±0.1°.
In the previous simulations, the attitude error angle was set to θZ = ±1° and θX = ±0.1°, but improving the alignment increases the upper limit of the workpiece diameter that satisfies the target measurement uncertainty. What has room for improvement is the attitude error angle θZ around the Z-axis. Thus, Figure 8(a) and (b) show the extended uncertainty U(D) in diameter and the extended uncertainty in roundness when the attitude angle error occurs in a rectangular distribution with θZ = ±0.1°, ±0.3°, ±0.5°, ±0.6°, ±0.7°, ±0.8°, ±0.9°, ±1°, ±1.5°, and ±2° The variation of the uncertainty U(Δzq). The upper limit of the workpiece diameter for which the target uncertainty of diameter and roundness can reach ±0.1 μm at each attitude error angle θZ is calculated from the graphs and summarized in Table 3. Table 3 shows that when measuring large-diameter cylindrical workpieces, it is desirable to make θZ as convergent as possible by more precise alignment; if it can be kept less than θZ = ±0.8°, the proposed method can cover all diameters below about 3 mm, which are difficult to measure with the rotary scanning method. The proposed method can cover all diameters less than 3 mm, which are difficult to measure with the rotational scanning method. If θZ can be further reduced, the proposed method can also be used for workpieces with larger diameters; if the alignment can reach θZ = θX = ±0.1°, the diameter limitation of the workpiece theoretically no longer exists. However, as the workpiece diameter increases, the measurement range in the Z-axis and X-axis directions expands, which increases the uncertainty and limits the measurement range of the used measuring machine, which may lead to an upper limit of the workpiece diameter.
4. Conclusions
To quantitatively assess the reliability of the stitching linear scan method for the roundness measurement of small cylindrical part with various diameters, a series of measurement uncertainties are carried out. Firstly, the measurement uncertainty of the workpiece with the diameter of 1.5 mm and length 5.8 mm is evaluated to be 0.095 μm which satisfies the target uncertainty of 0.1 μm. Since the alignment around X-axis () and Z- axis () are affected by different diameters of measured workpieces, the uncertainty caused by the alignment and should be analyzed. According to the analysis, the measurement uncertainties of the workpieces with the diameter from 0.01 mm to 50 mm are analyzed. All the error propagations are the same, except for the alignments of and , which are the position angle around X-axis and Z-axis respectively when the workpiece is mounted on the V-groove, are changing with the dimension of the workpiece changing. Evaluation results of the proposed stitching linear scan method confirm that if the position error around the Z-axis can be kept less than ±0.8°, the proposed method can cover the roundness measurement of all diameters smaller than about 3 mm. It was confirmed that the proposed method can measure the roundness of all diameters less than about 3 mm, which are difficult to evaluate with roundness measuring machines, with an uncertainty within the target value if the attitude error angle around the Z axis is kept smaller than ±0.8°. If can be further reduced, the proposed method can also be used for workpieces with larger diameters. If the alignment can reach = = ±0.1°, there is no limitation with respect to workpiece diameter theoretically. However, with the workpiece diameter increasing, the measurement displacement in the Z-axis and X-axis is increasing which can beyond the limited range of the instrument, namely, the upper limitation of the roundness measurement by the stitching linear scan method is up to the measuring range of instrument.
Author Contributions
Jiali Zhao: Methodology; Resources; Formal analysis; Writing - original draft. Liang Zhang: Investigation; Data curation; Review & editing. Dan Wu: review & editing; Project administration. Bobo Shen: Data curation; Visualization. Qiaolin Li: Investigation; Visualization.
Funding
This research was funded by the National Defense Basic Scientific Research Program of China (Grant numbers JCKY2019427D002).
Data Availability Statement
The data that support the findings of this study are available from the corresponding author upon reasonable request.
Conflicts of Interest
The authors declare no conflict of interest.
References
- Qiu Z, X.J. Review of Performance Testing of High Precision Reducers for Industrial Robots. Measurement 2021, 183, 109794. [CrossRef]
- Yu, Z.; Hao, Z. Calibration of the Angle Measurement Error Caused by the Industrial Reducer Performance Test Instrument Torsional Deformation. Sci Rep 2022, 12. [CrossRef]
- Xu, L.X.; Chen, B.K.; Li, C.Y. Dynamic Modelling and Contact Analysis of Bearing-Cycloid-Pinwheel Transmission Mechanisms Used in Joint Rotate Vector Reducers. Mech Mach Theory 2019, 137, 432–458. [CrossRef]
- Yue, H.; Wu, X.; Shi, Z.; Zhang, Y.; Ye, Y.; Zhang, L.; Fu, Y. A COMPREHENSIVE CYCLOID PIN-WHEEL PRECISION REDUCER TEST PLATFORM INTEGRATED WITH A NEW DYNAMIC MEASUREMENT METHOD OF LOST MOTION. Metrology and Measurement Systems 2022, 29. [CrossRef]
- Xie Y H, Xu L X, D.Y.Q. A Dynamic Approach for Evaluating the Moment Rigidity and Rotation Precision of a Bearing-Planetary Frame Rotor System Used in RV Reducer. Mech Mach Theory 2022, 173, 104851. [CrossRef]
- Gao, W. Precision Nanometrology; Springer Series in Advanced Manufacturing; Springer London: London, 2010; ISBN 978-1-84996-253-7. [CrossRef]
- Gao, W. Metrology; Gao, W., Ed.; Precision Manufacturing; Springer Singapore: Singapore, 2019; ISBN 978-981-10-4937-8. [CrossRef]
- Gao, W. Surface Metrology for Micro-and Nanofabrication; Elsevier: Oxford, United Kingdom, 2020; ISBN 9780128178508.
- Gao, W. Precision Nanometrology and Its Applications to Precision Nanosystems. International Journal of Precision Engineering and … 2005, 6, 14–20.
- Gao Wei, Shimizu Yuki, Kazuhiro Hane, Hitoshi Soyama, K.Adachi. Measurement and Instrumentation; 2017.
- Gao, W.; Shimizu, Y. Optical Metrology for Precision Engineering; De Gruyter, 2021; ISBN 9783110542363. [CrossRef]
- ISO 12181-1 2003 Geometrical Product Specifications (GPS)-Roundness-Part 1: Vocabulary and Parameters of Roundness.
- Taylor Hobson Ltd. A Guide to the Measurement of Roundness Introduction to Roundness.
- Taylor Hobson Ltd. Roundness Measurement Equipment | Form Measurement | Cylindricity Measuring Instrument | Roundness Tester.
- SUI, Wentao; ZHANG, D. Four Methods for Roundness Evaluation. Phys Procedia 2012, 24, 2159–2164. [CrossRef]
- Bai J, Wang Y, Wang X; et al. Three-Probe Error Separation with Chromatic Confocal Sensors for Roundness Measurement. Nanomanufacturing and Metrology. Nanomanufacturing and Metrology 2021, 4, 247–255. [CrossRef]
- Gao, W., & Kiyono, S. On-Machine Roundness Measurement of Cylindrical Workpieces by the Combined Three-Point Method. Measurement 1997, 21, 147–156. [CrossRef]
- Cai Y, Xie B, Ling S; et al. On-Line Measurement Method for Diameter and Roundness Error of Balls. Nanomanufacturing and Metrology 2020, 3, 218–227. [CrossRef]
- Gao, W.; Haitjema, H.; Fang, F.Z.; Leach, R.K.; Cheung, C.F.; Savio, E.; Linares, J.M. On-Machine and in-Process Surface Metrology for Precision Manufacturing. CIRP Annals 2019, 68, 843–866. [CrossRef]
- Chen, Y.L.; Machida, Y.; Shimizu, Y.; Matsukuma, H.; Gao, W. A Stitching Linear-Scan Method for Roundness Measurement of Small Cylinders. CIRP Annals 2018, 67, 535–538. [CrossRef]
- Li, Q.; Shimizu, Y.; Saito, T.; Matsukuma, H.; Gao, W. Measurement Uncertainty Analysis of a Stitching Linear-Scan Method for the Evaluation of Roundness of Small Cylinders. Applied Sciences (Switzerland) 2020, 10. [CrossRef]
- Li, Q.; Shimizu, Y.; Saito, T.; Matsukuma, H.; Cai, Y.; Gao, W. Improvement of a Stitching Operation in the Stitching Linear-Scan Method for Measurement of Cylinders in a Small Dimension. Applied Sciences (Switzerland) 2021, 11. [CrossRef]
- JCGM 100: 2008, Evaluation of Measurement Data—Guide to the Expression of Uncertainty in Measurement.
- Joint Committee for Guides in Metrology (JCGM) JCGM 100:2008 GUM 1995 with Minor Corrections - Evaluation of Measurement Data — Guide to the Expression of Uncertainty in Measurement; 2008; Vol. 50.
- BIPM JCGM 200:2012 International Vocabulary of Metrology – Basic and General Concepts and Associated Terms (VIM) - 2008 Version with Minor Corrections; 2012; Vol. 3.
- Xiu-Lan Wen, Yi-Bing Zhao, Dong-Xia Wang, Jun Pan: Adaptive Monte Carlo and GUM Methods for the Evaluation of Measurement Uncertainty of Cylindricity Error, Precision Engineering, 37 (2013) 856– 864. [CrossRef]
- García-Balboa, J.; Ruiz-Armenteros, A.; Rodríguez-Avi, J.; Reinoso-Gordo, J.; Robledillo-Román, J. A Field Procedure for the Assessment of the Centring Uncertainty of Geodetic and Surveying Instruments. Sensors 2018, 18, 3187. [CrossRef]
- Cofta, P.; Karatzas, K.; Orłowski, C. A Conceptual Model of Measurement Uncertainty in IoT Sensor Networks. Sensors 2021, 21, 1827. [CrossRef]
- Segovia-Cardozo, D.A.; Bernal-Basurco, C.; Rodríguez-Sinobas, L. Tipping Bucket Rain Gauges in Hydrological Research: Summary on Measurement Uncertainties, Calibration, and Error Reduction Strategies. Sensors 2023, 23, 5385. [CrossRef]
- Bhagat, S.; Bongiorno, J.; Mariscotti, A. Uncertainty of Standardized Track Insulation Measurement Methods for Stray Current Assessment. Sensors 2023, 23, 5900. [CrossRef]
Figure 1.
(a) Linear scan with a stylus; (b) Small cylinder mounted on the V-groove and scanned linearly.
Figure 1.
(a) Linear scan with a stylus; (b) Small cylinder mounted on the V-groove and scanned linearly.
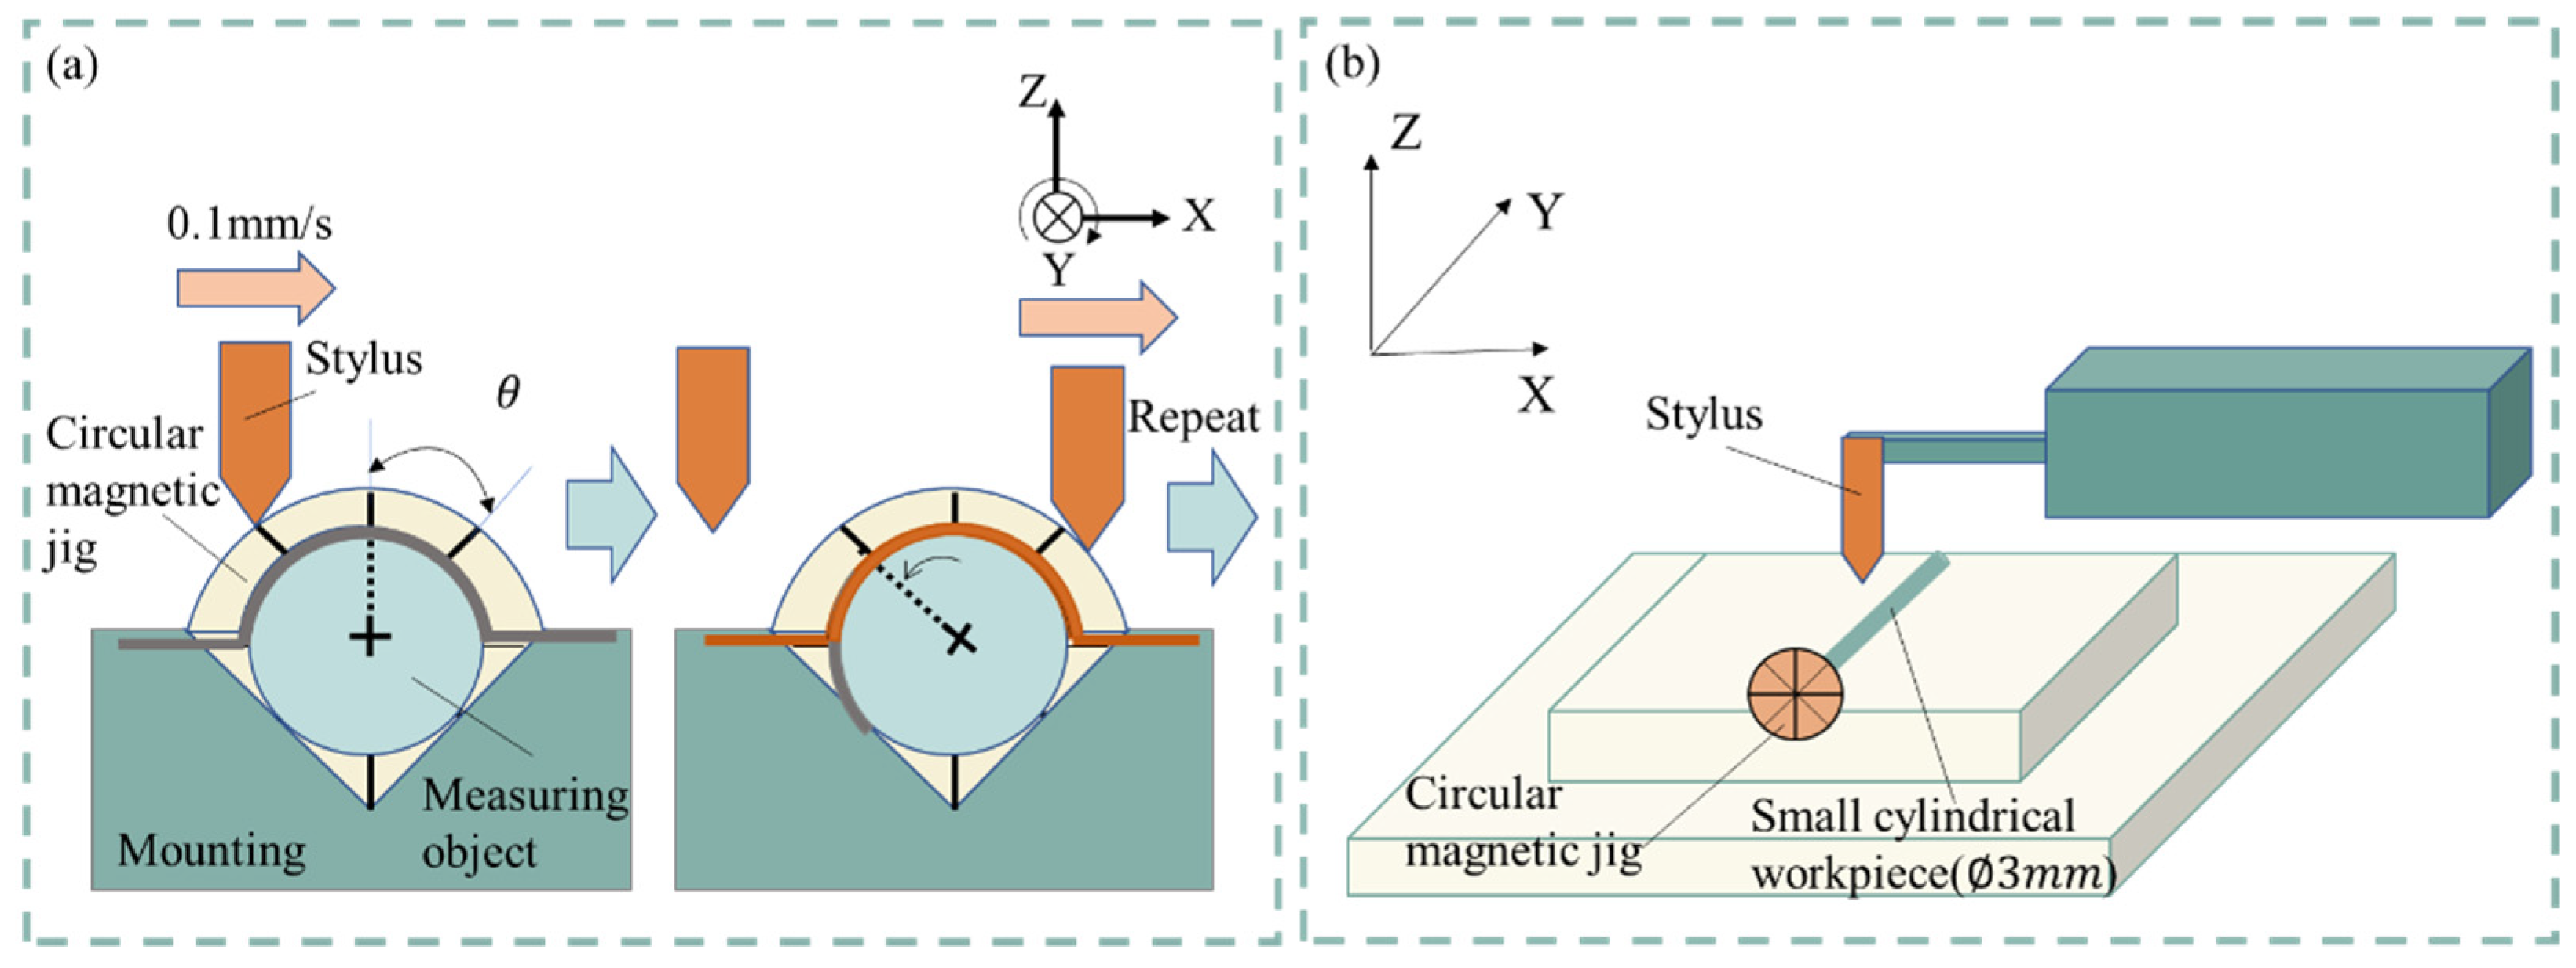
Figure 2.
The stitching procedure: (a) Profile 1; (b) Profile 2; (c) The stitching of Profiles 1&2; (d) The stitching of the rest of the arc profiles.
Figure 2.
The stitching procedure: (a) Profile 1; (b) Profile 2; (c) The stitching of Profiles 1&2; (d) The stitching of the rest of the arc profiles.
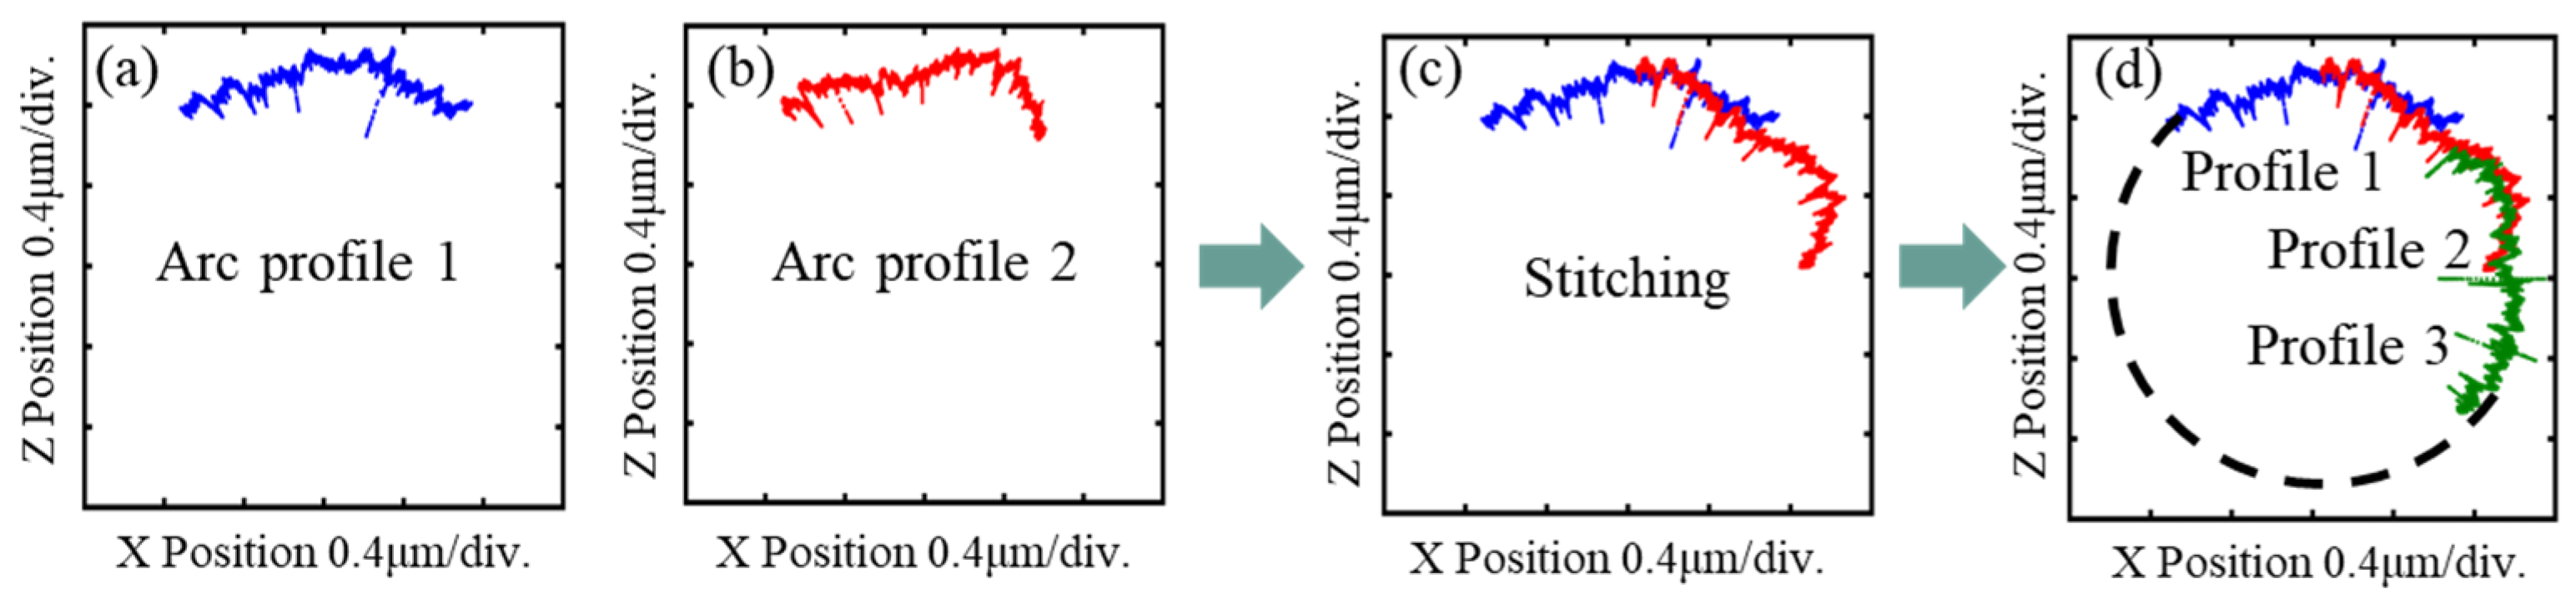
Figure 3.
(a) Schematic of the radius measurement and the uncertainty components; (b) Schematic of the roundness measurement and the uncertainty components.
Figure 3.
(a) Schematic of the radius measurement and the uncertainty components; (b) Schematic of the roundness measurement and the uncertainty components.
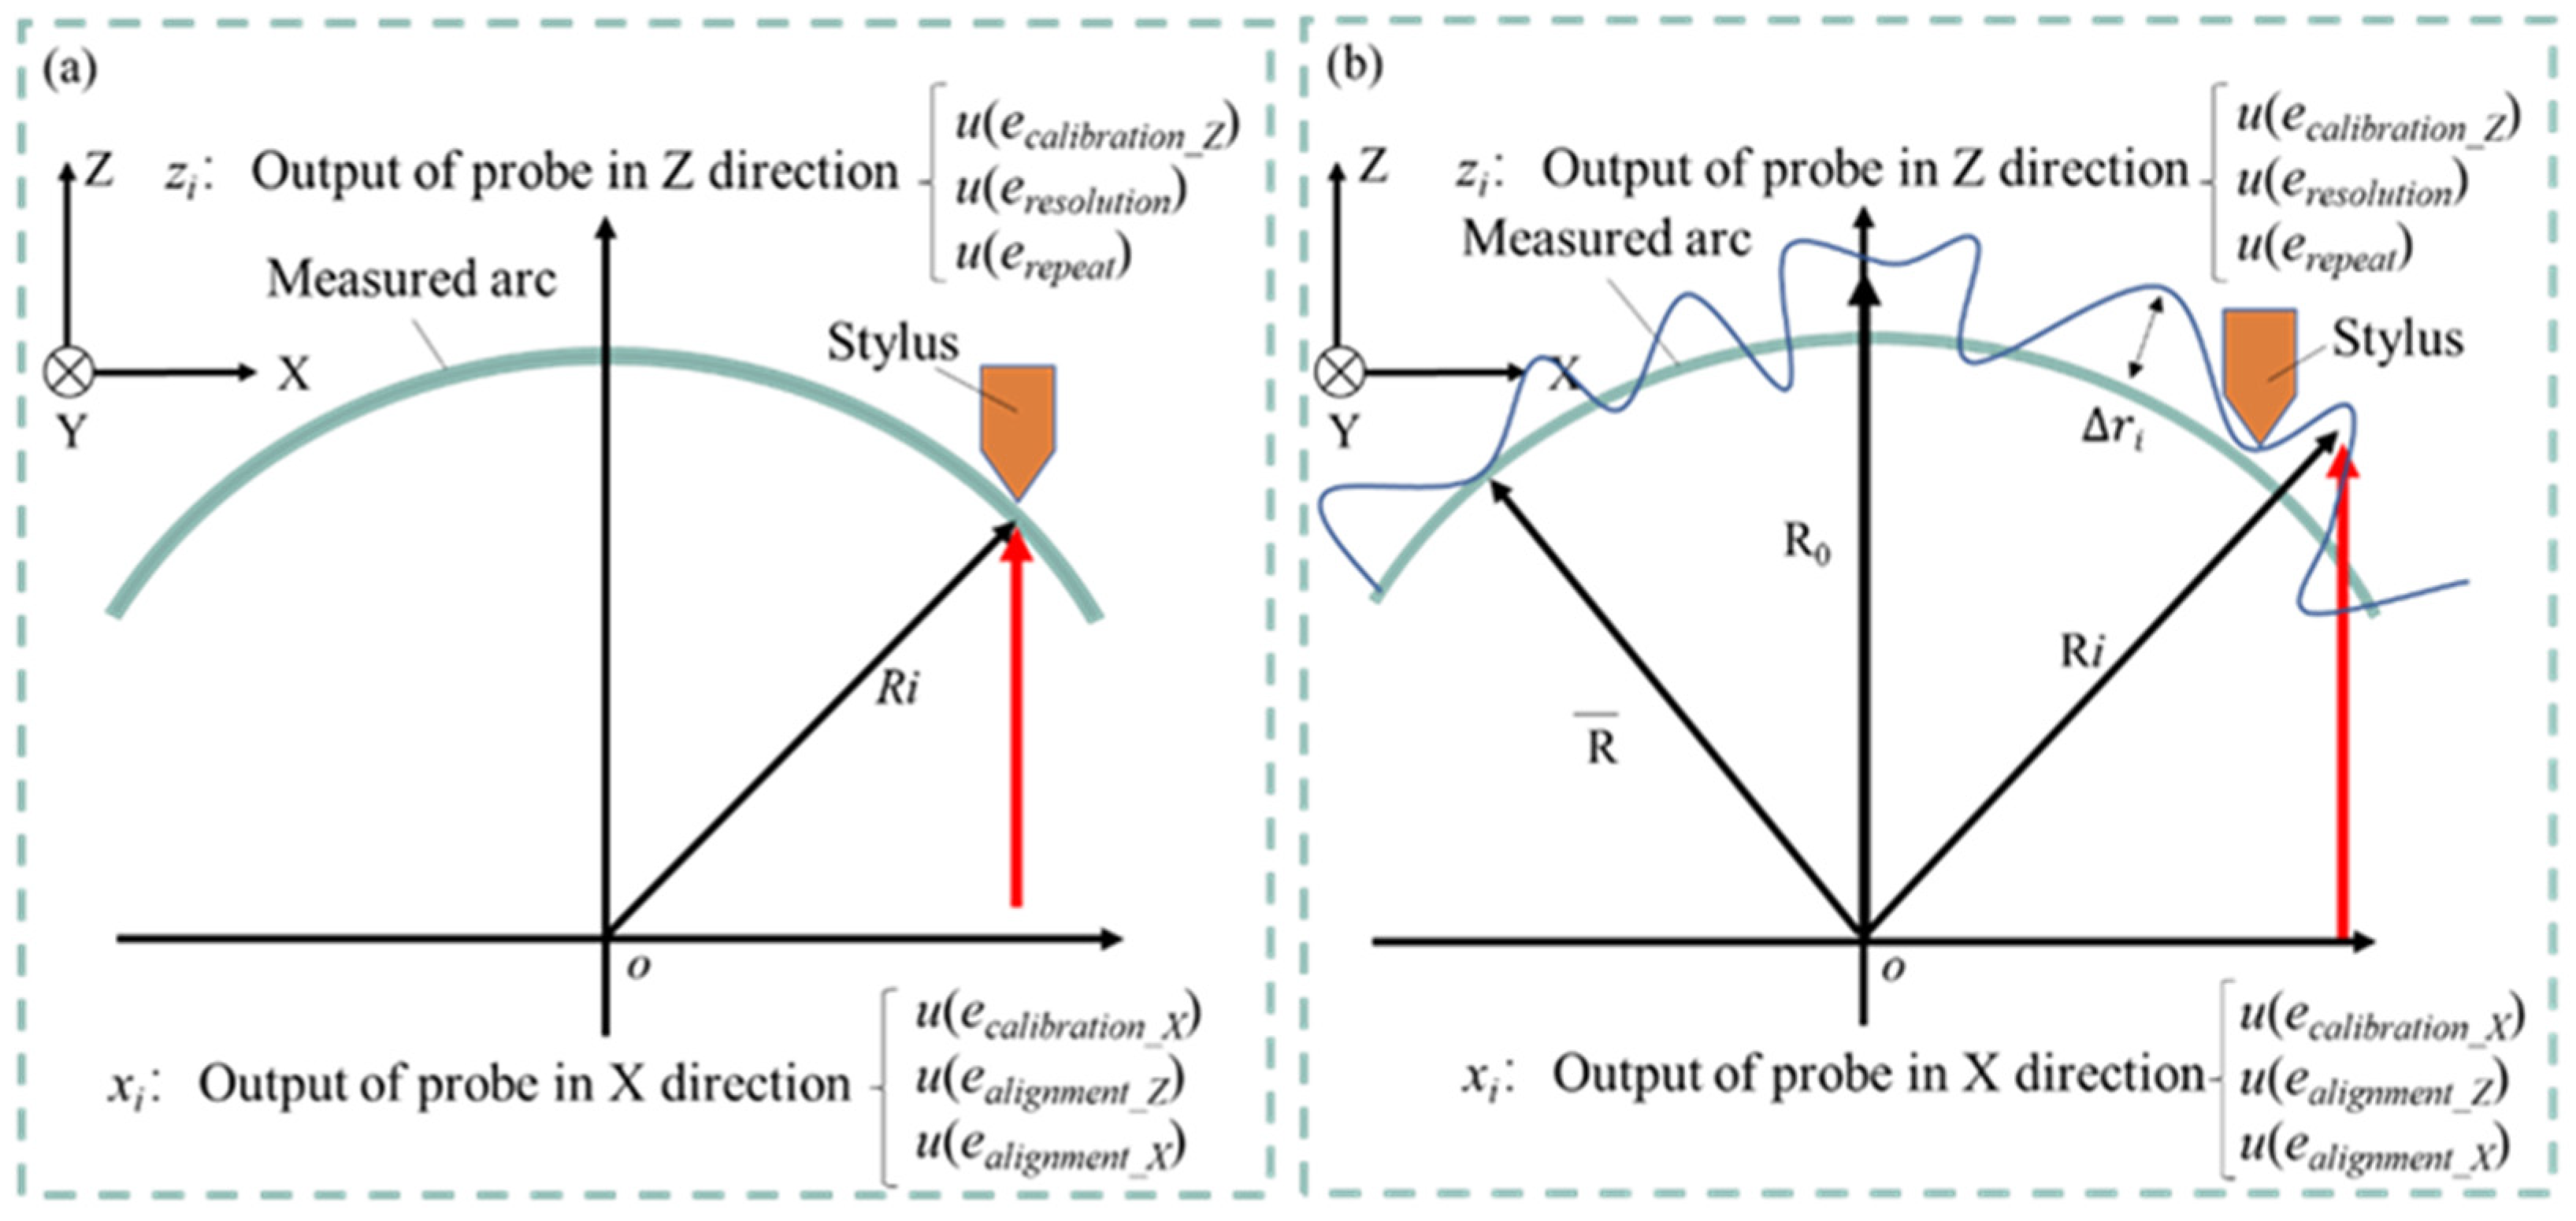
Figure 4.
(a) Standard ball; (b) Calibration Result.
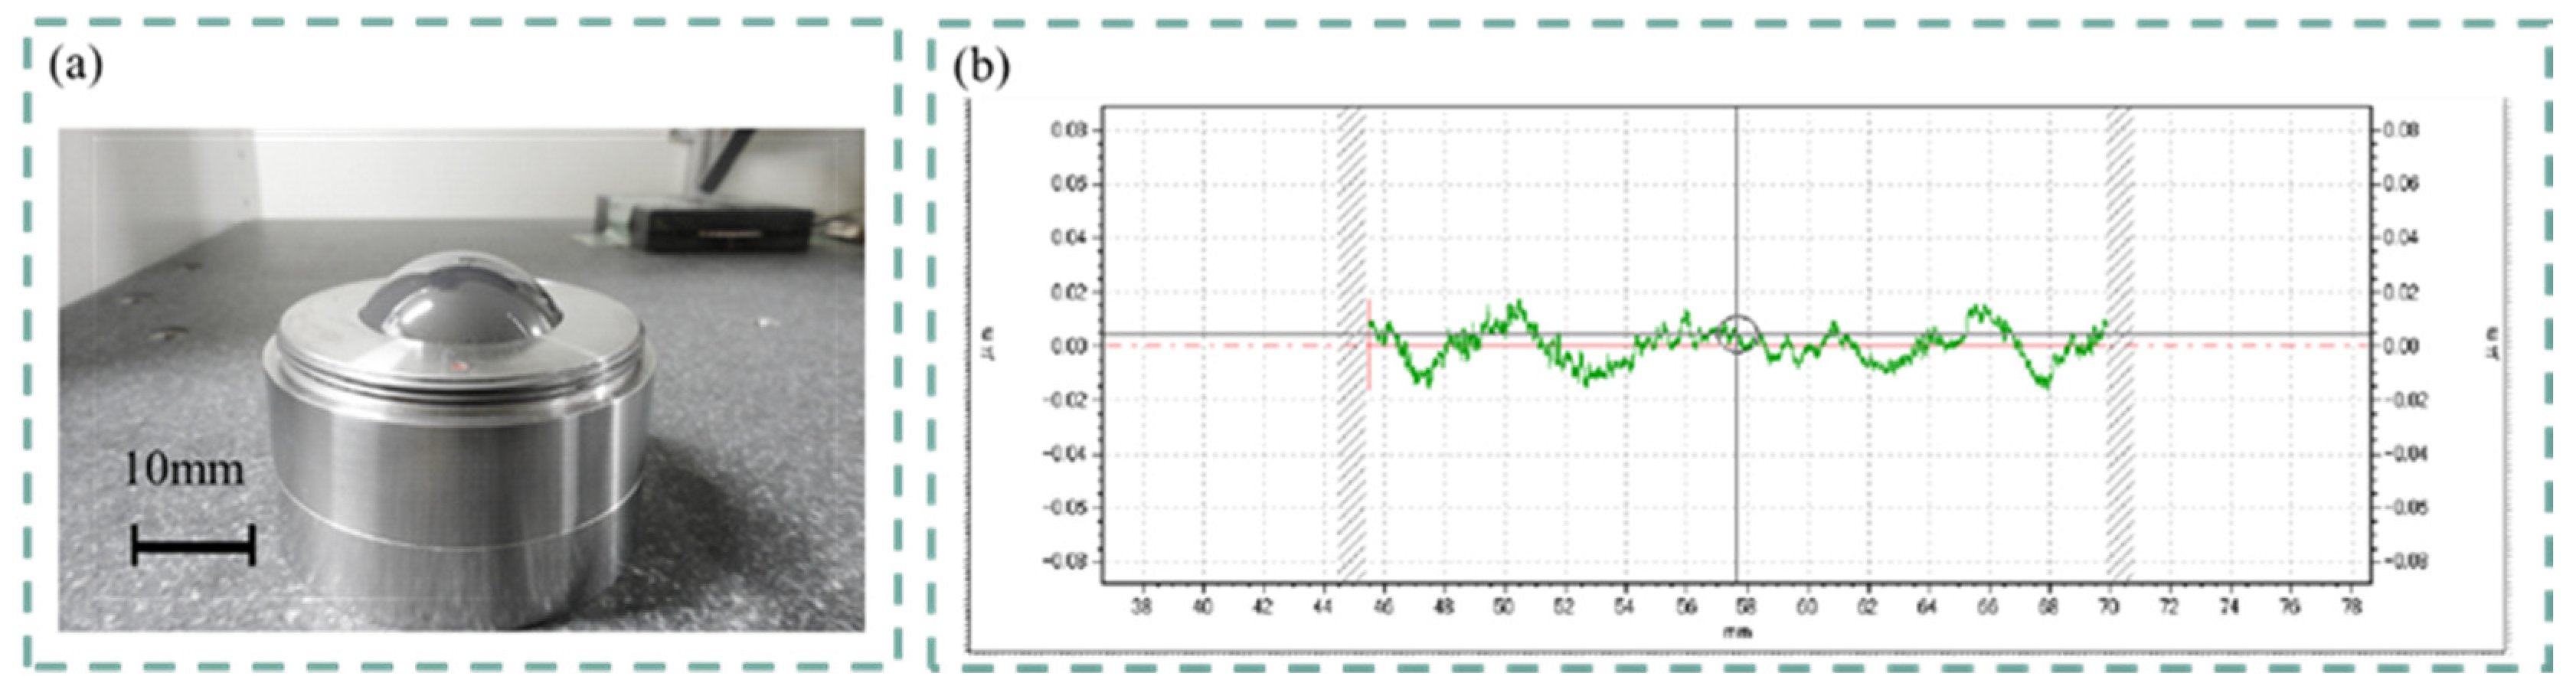
Figure 5.
(a) Influence of attitude error of roll workpiece around Z-axis; (b) Influence of attitude error of roll workpiece around X-axis.
Figure 5.
(a) Influence of attitude error of roll workpiece around Z-axis; (b) Influence of attitude error of roll workpiece around X-axis.
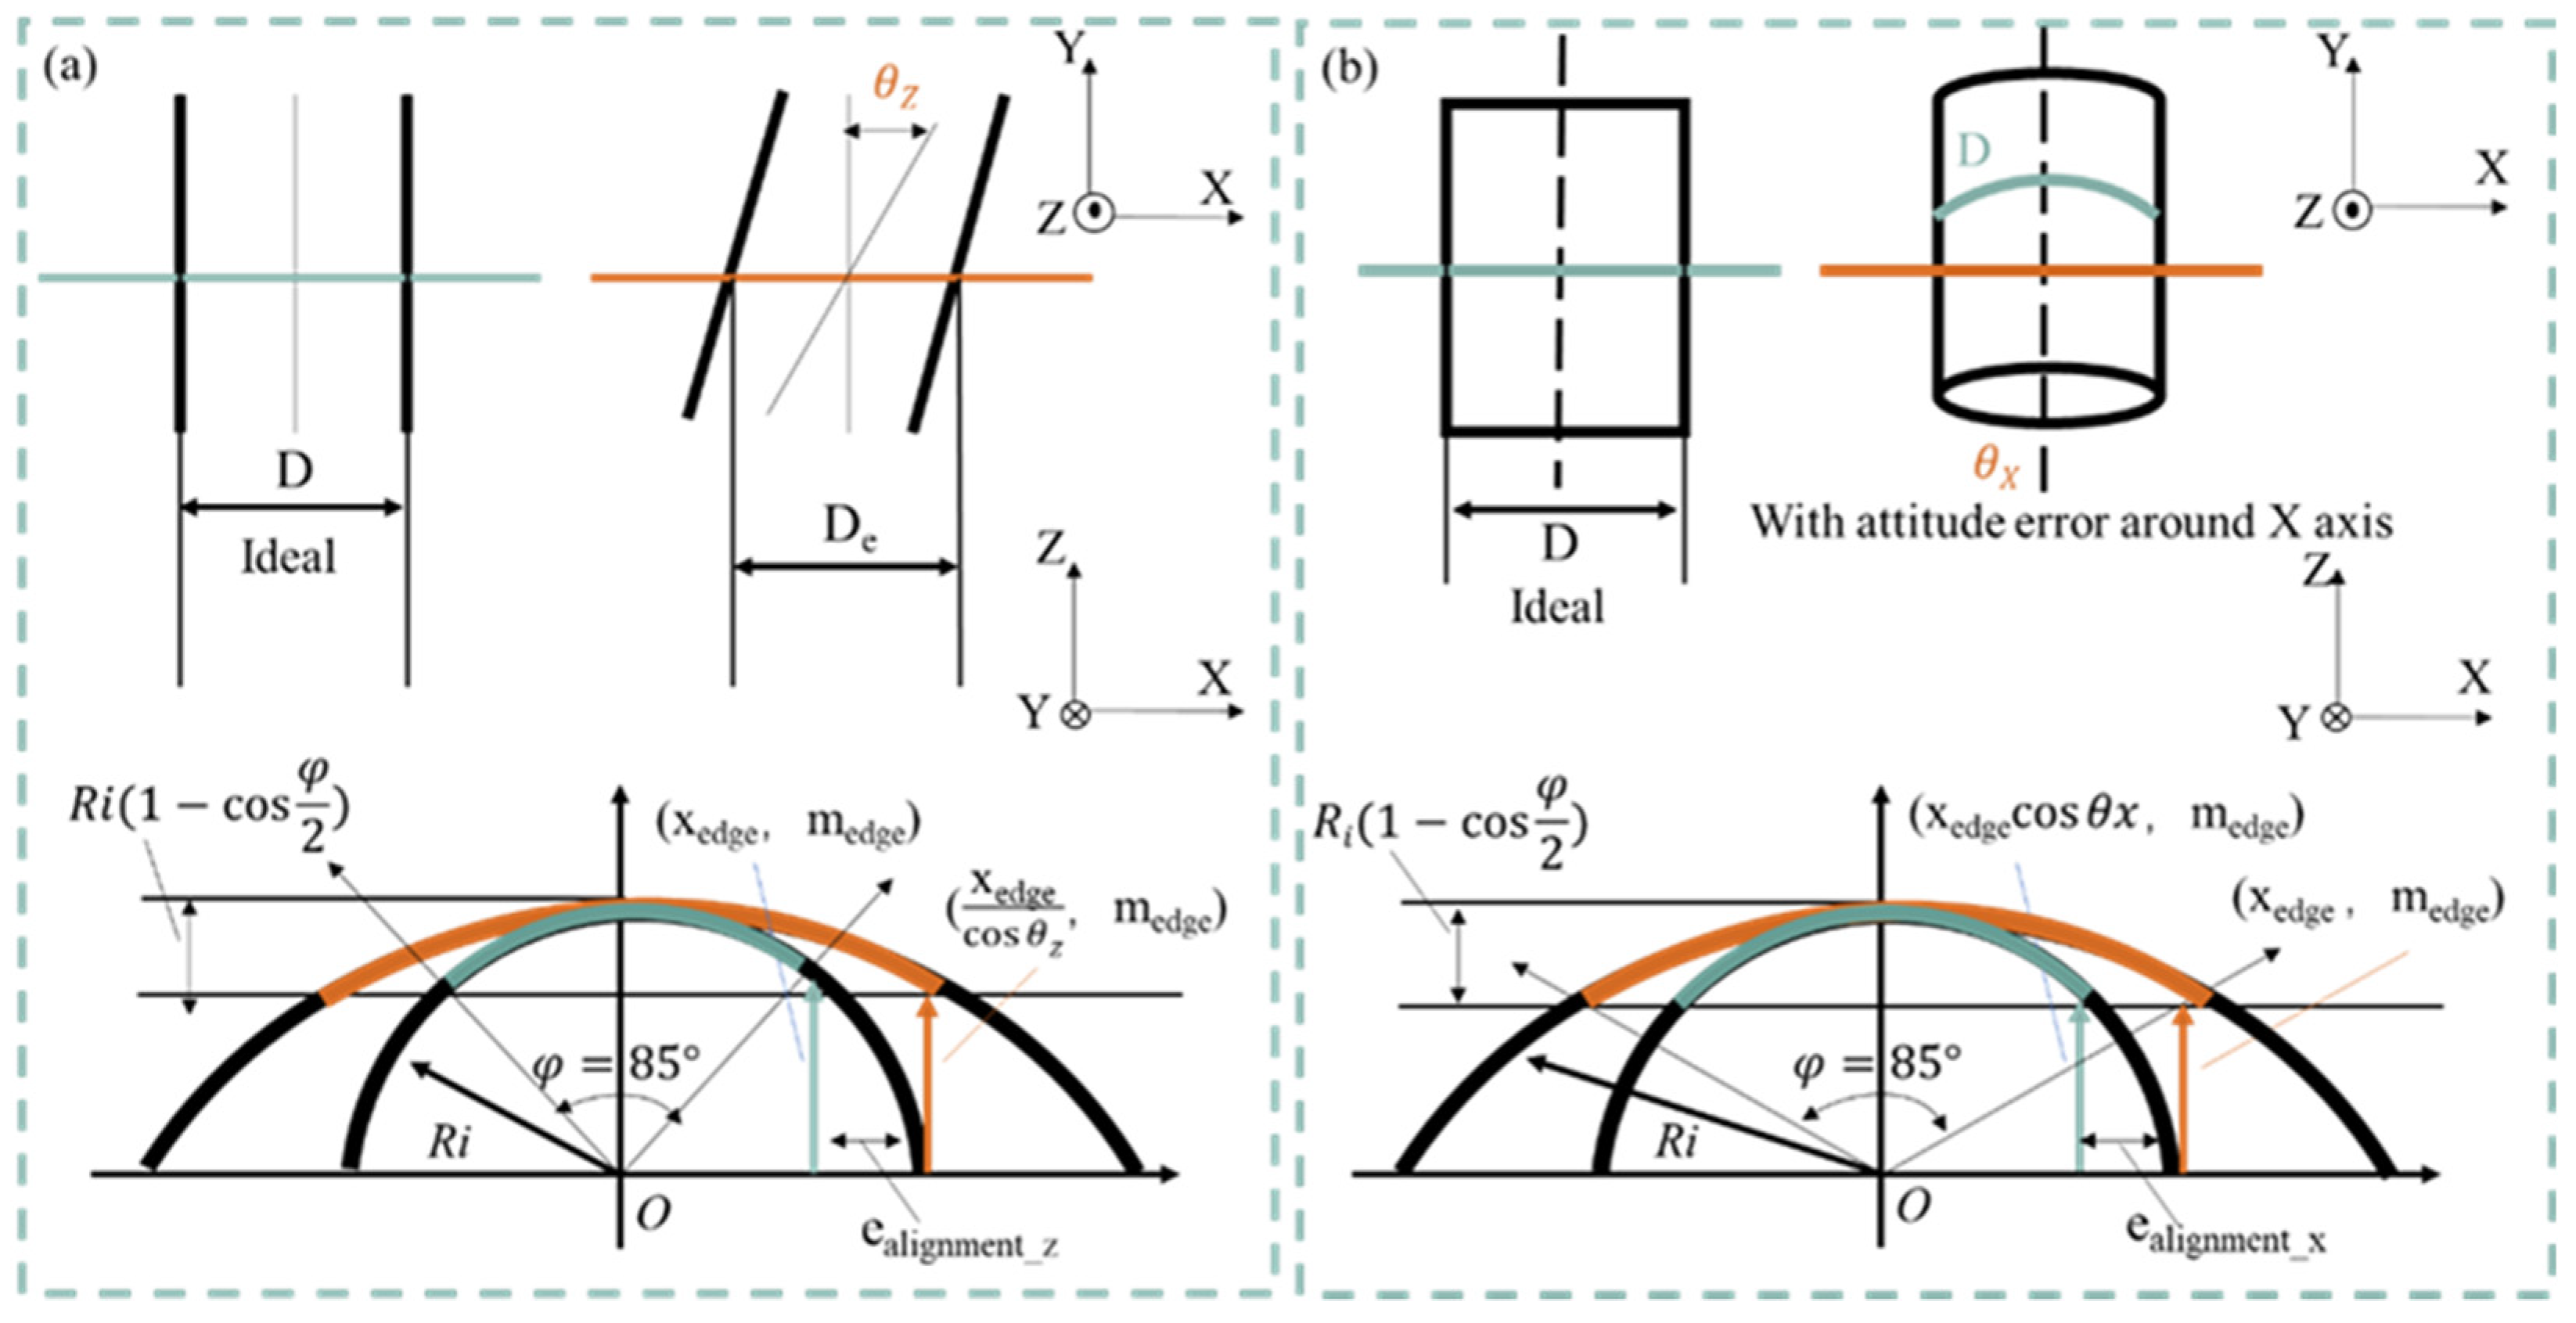
Figure 6.
Variation of u(xi) in accordance with the diameter of workpiece: (a) Influence of u(Δealignment_Z); (b) Influence of u(Δealignment_X).
Figure 6.
Variation of u(xi) in accordance with the diameter of workpiece: (a) Influence of u(Δealignment_Z); (b) Influence of u(Δealignment_X).
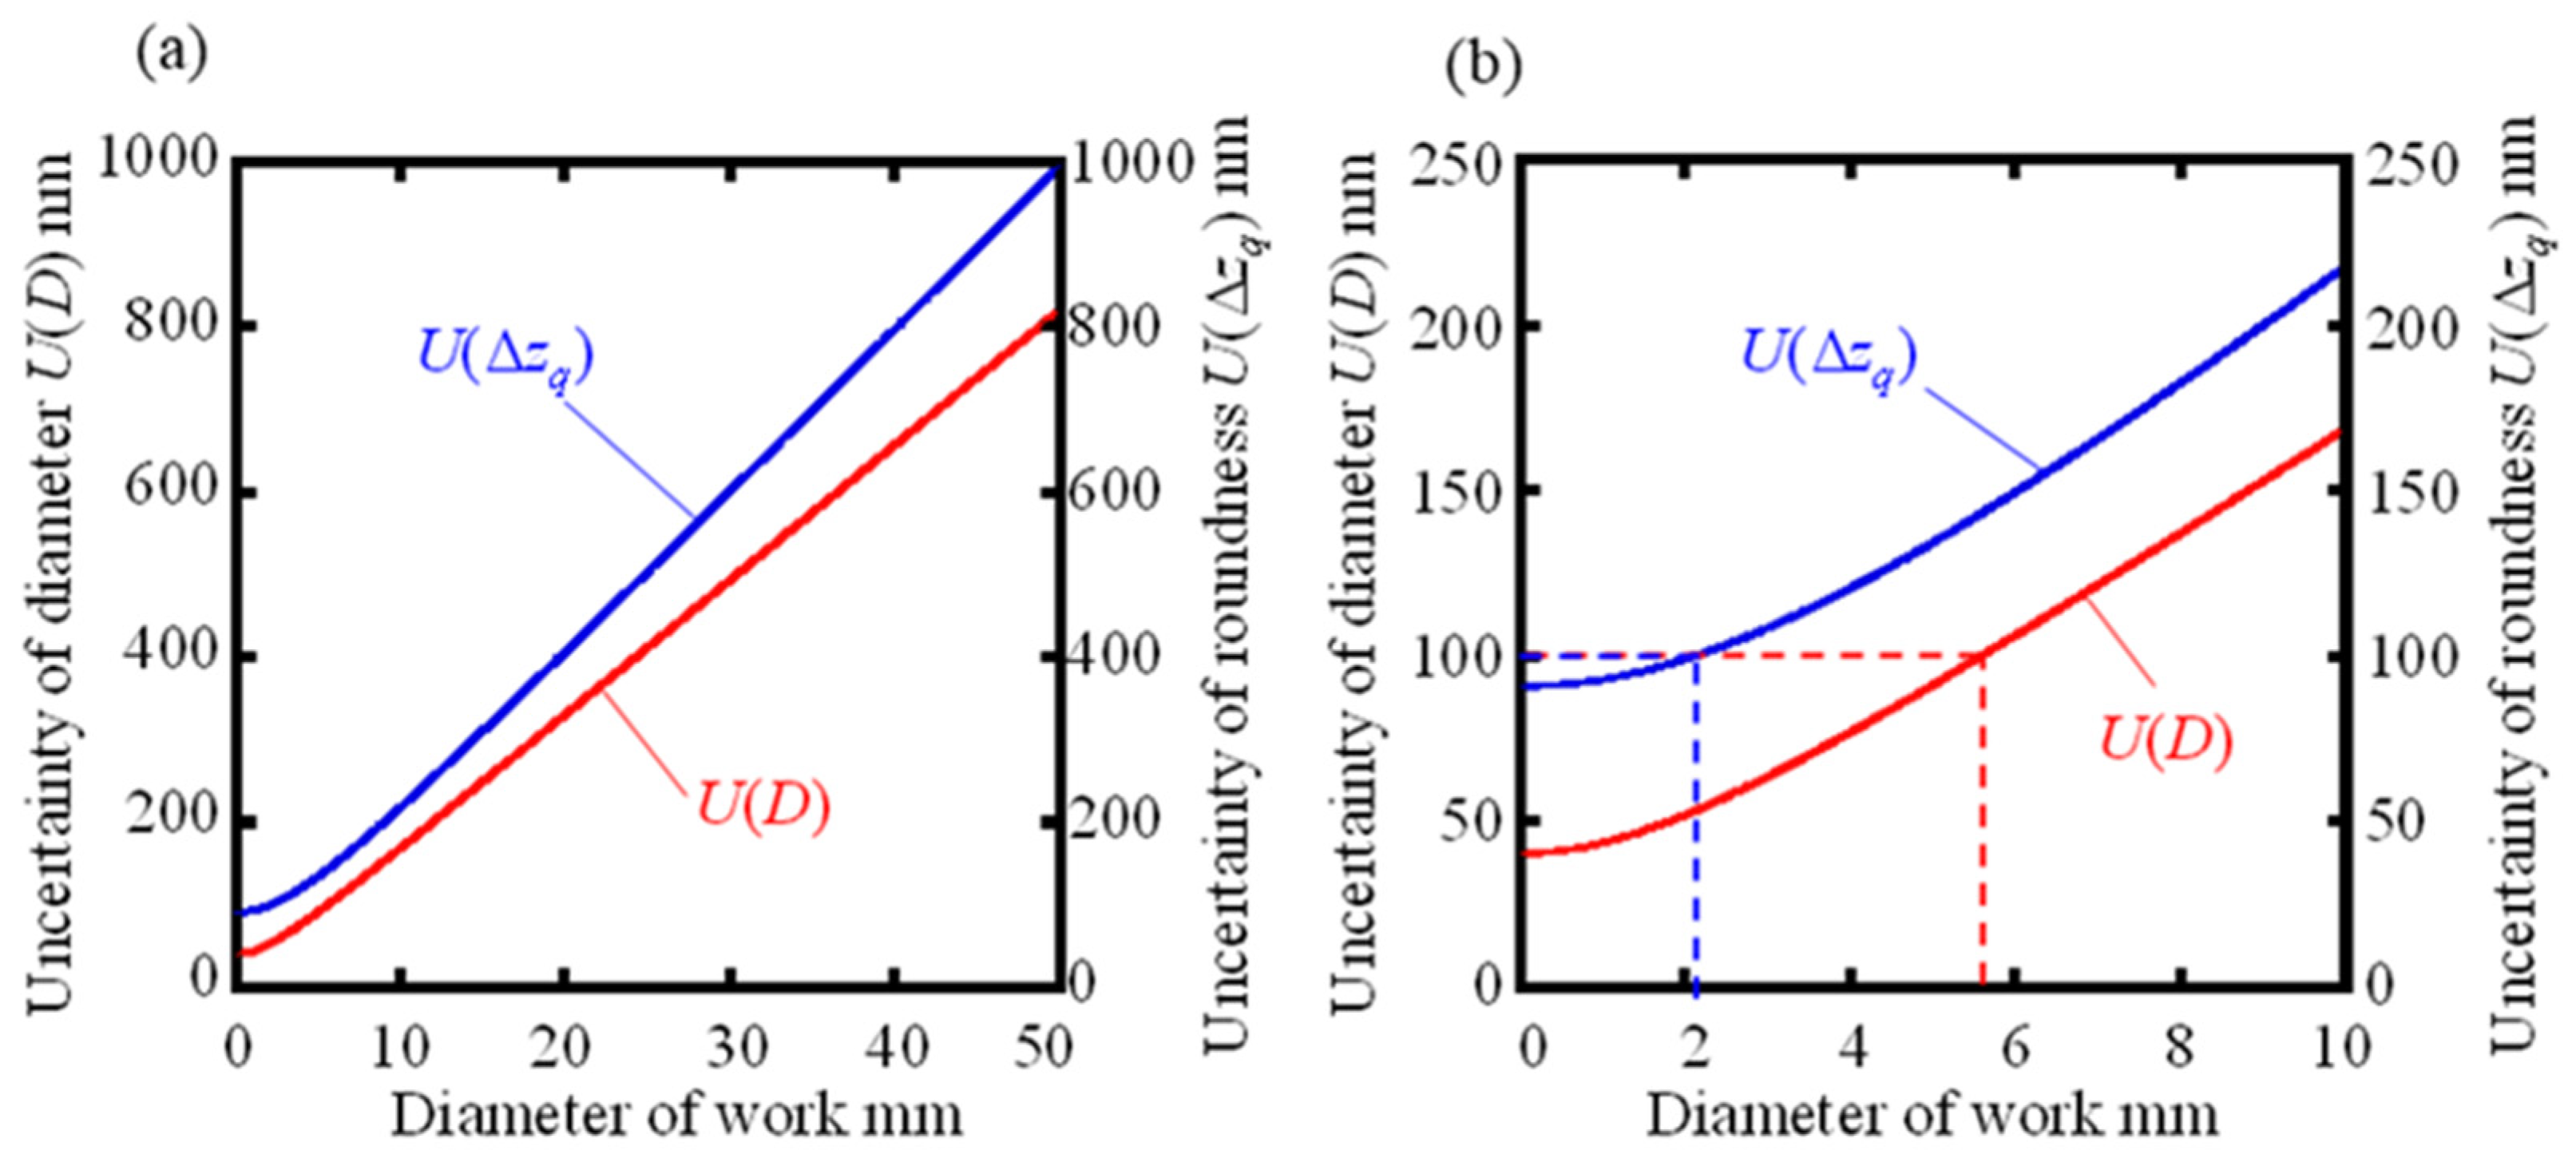
Figure 7.
Variation of U(D) and U(Δzq) accordance with diameter of workpiece: (a) Diameter ф0.01-50mm; (b) Diameter ф0.01-10mm.
Figure 7.
Variation of U(D) and U(Δzq) accordance with diameter of workpiece: (a) Diameter ф0.01-50mm; (b) Diameter ф0.01-10mm.
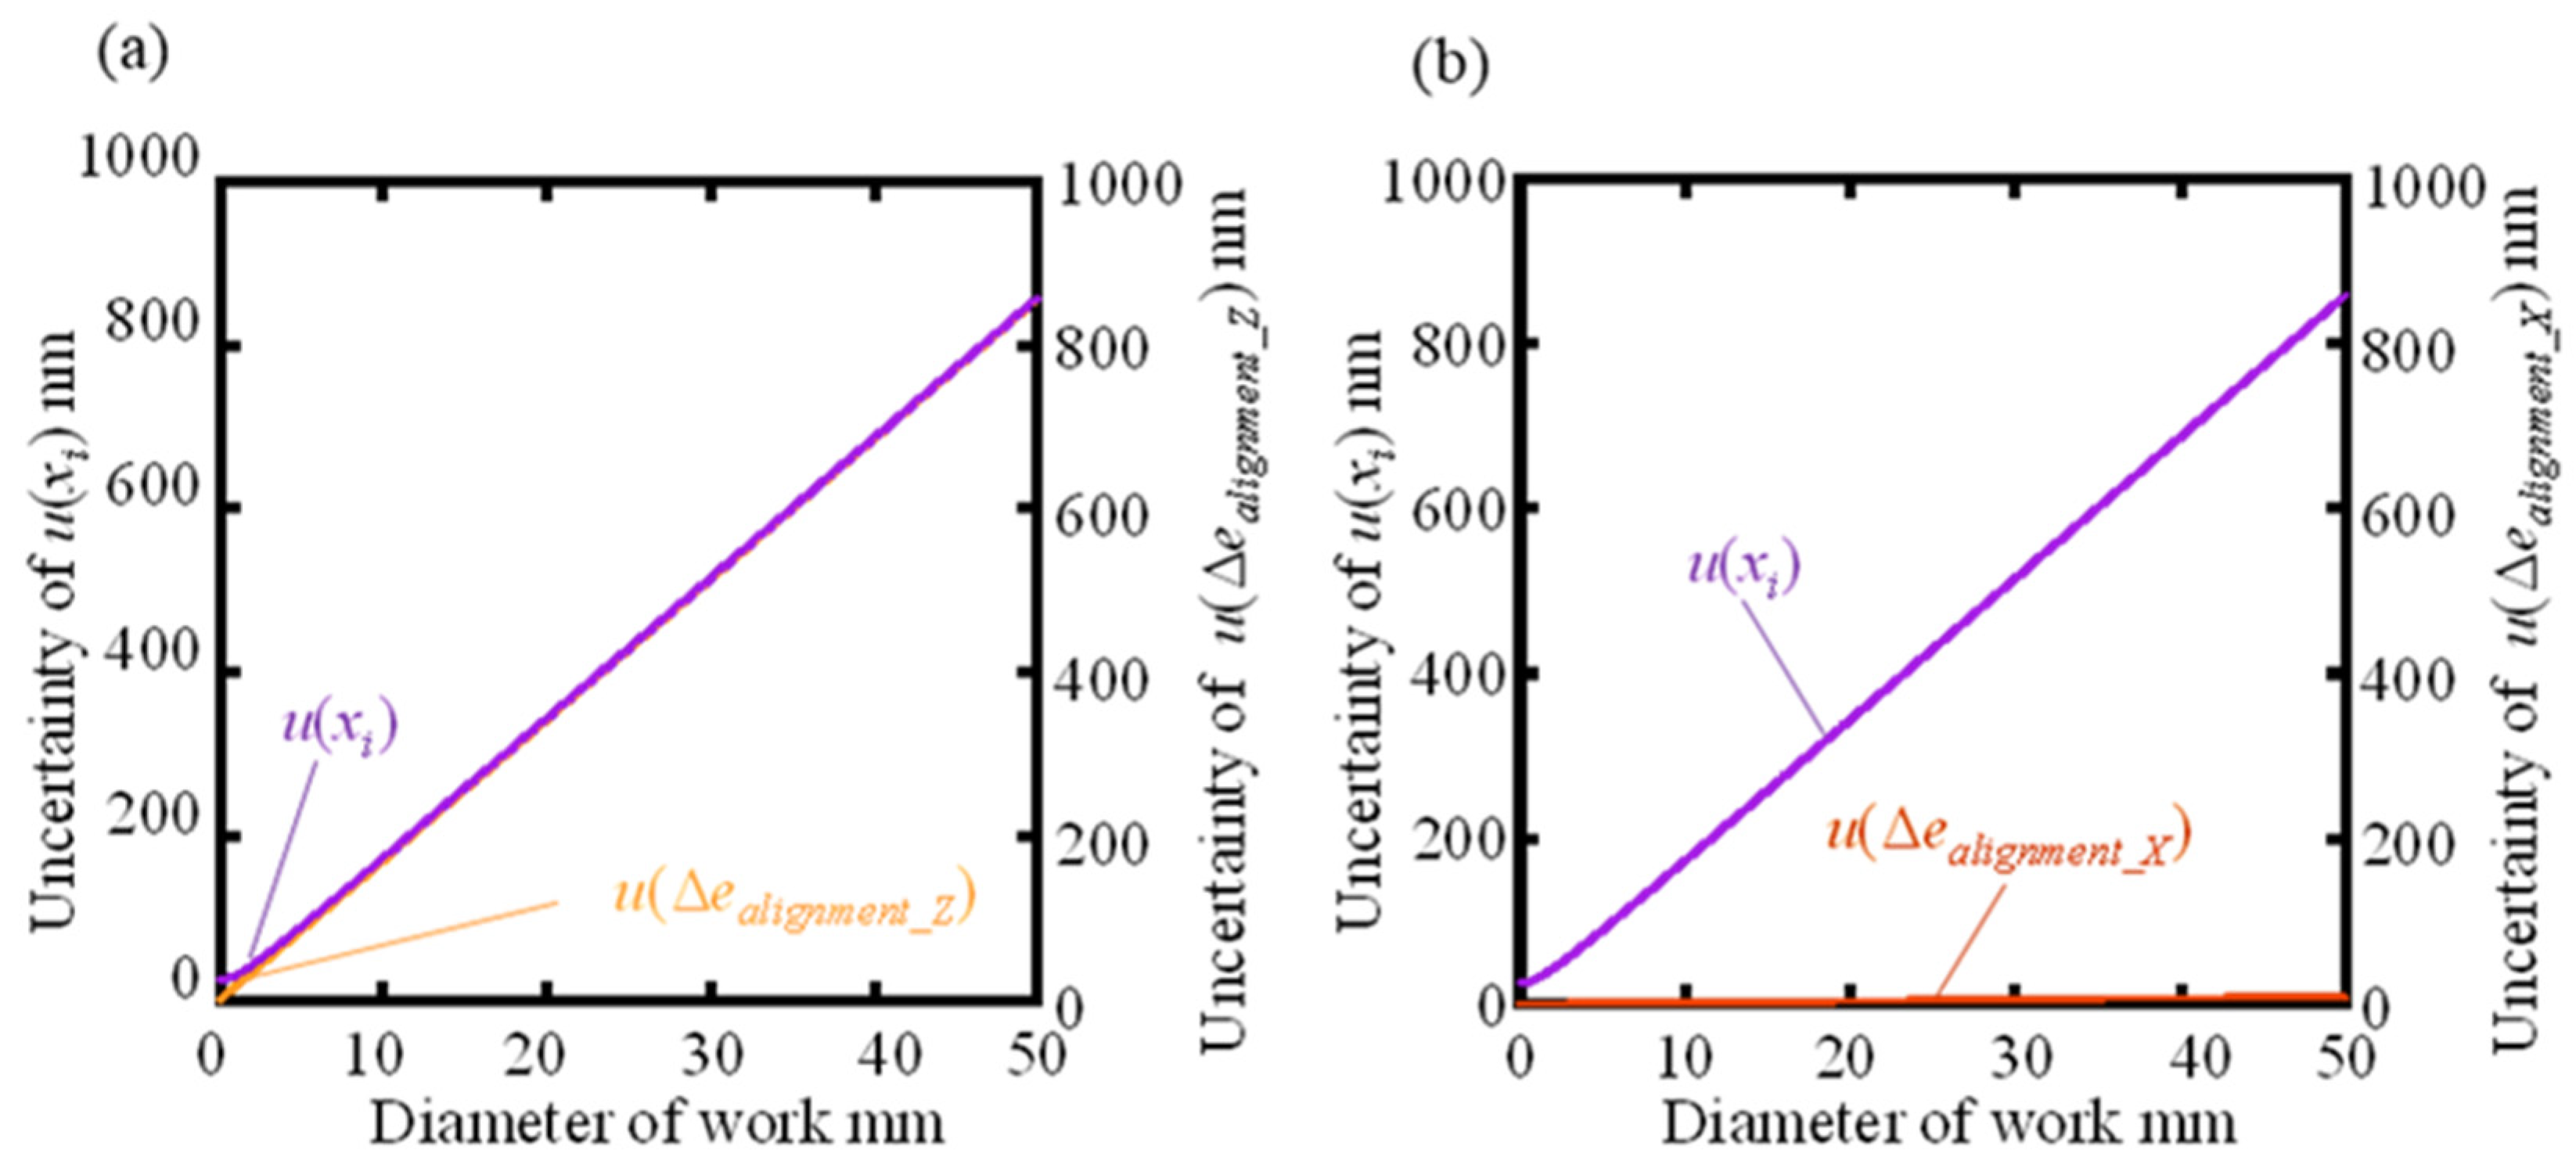
Figure 8.
(a) Variation of U(D) with a diameter of the workpiece; (b) Variation of U(Δzq) accordance with diameter of workpiece.
Figure 8.
(a) Variation of U(D) with a diameter of the workpiece; (b) Variation of U(Δzq) accordance with diameter of workpiece.
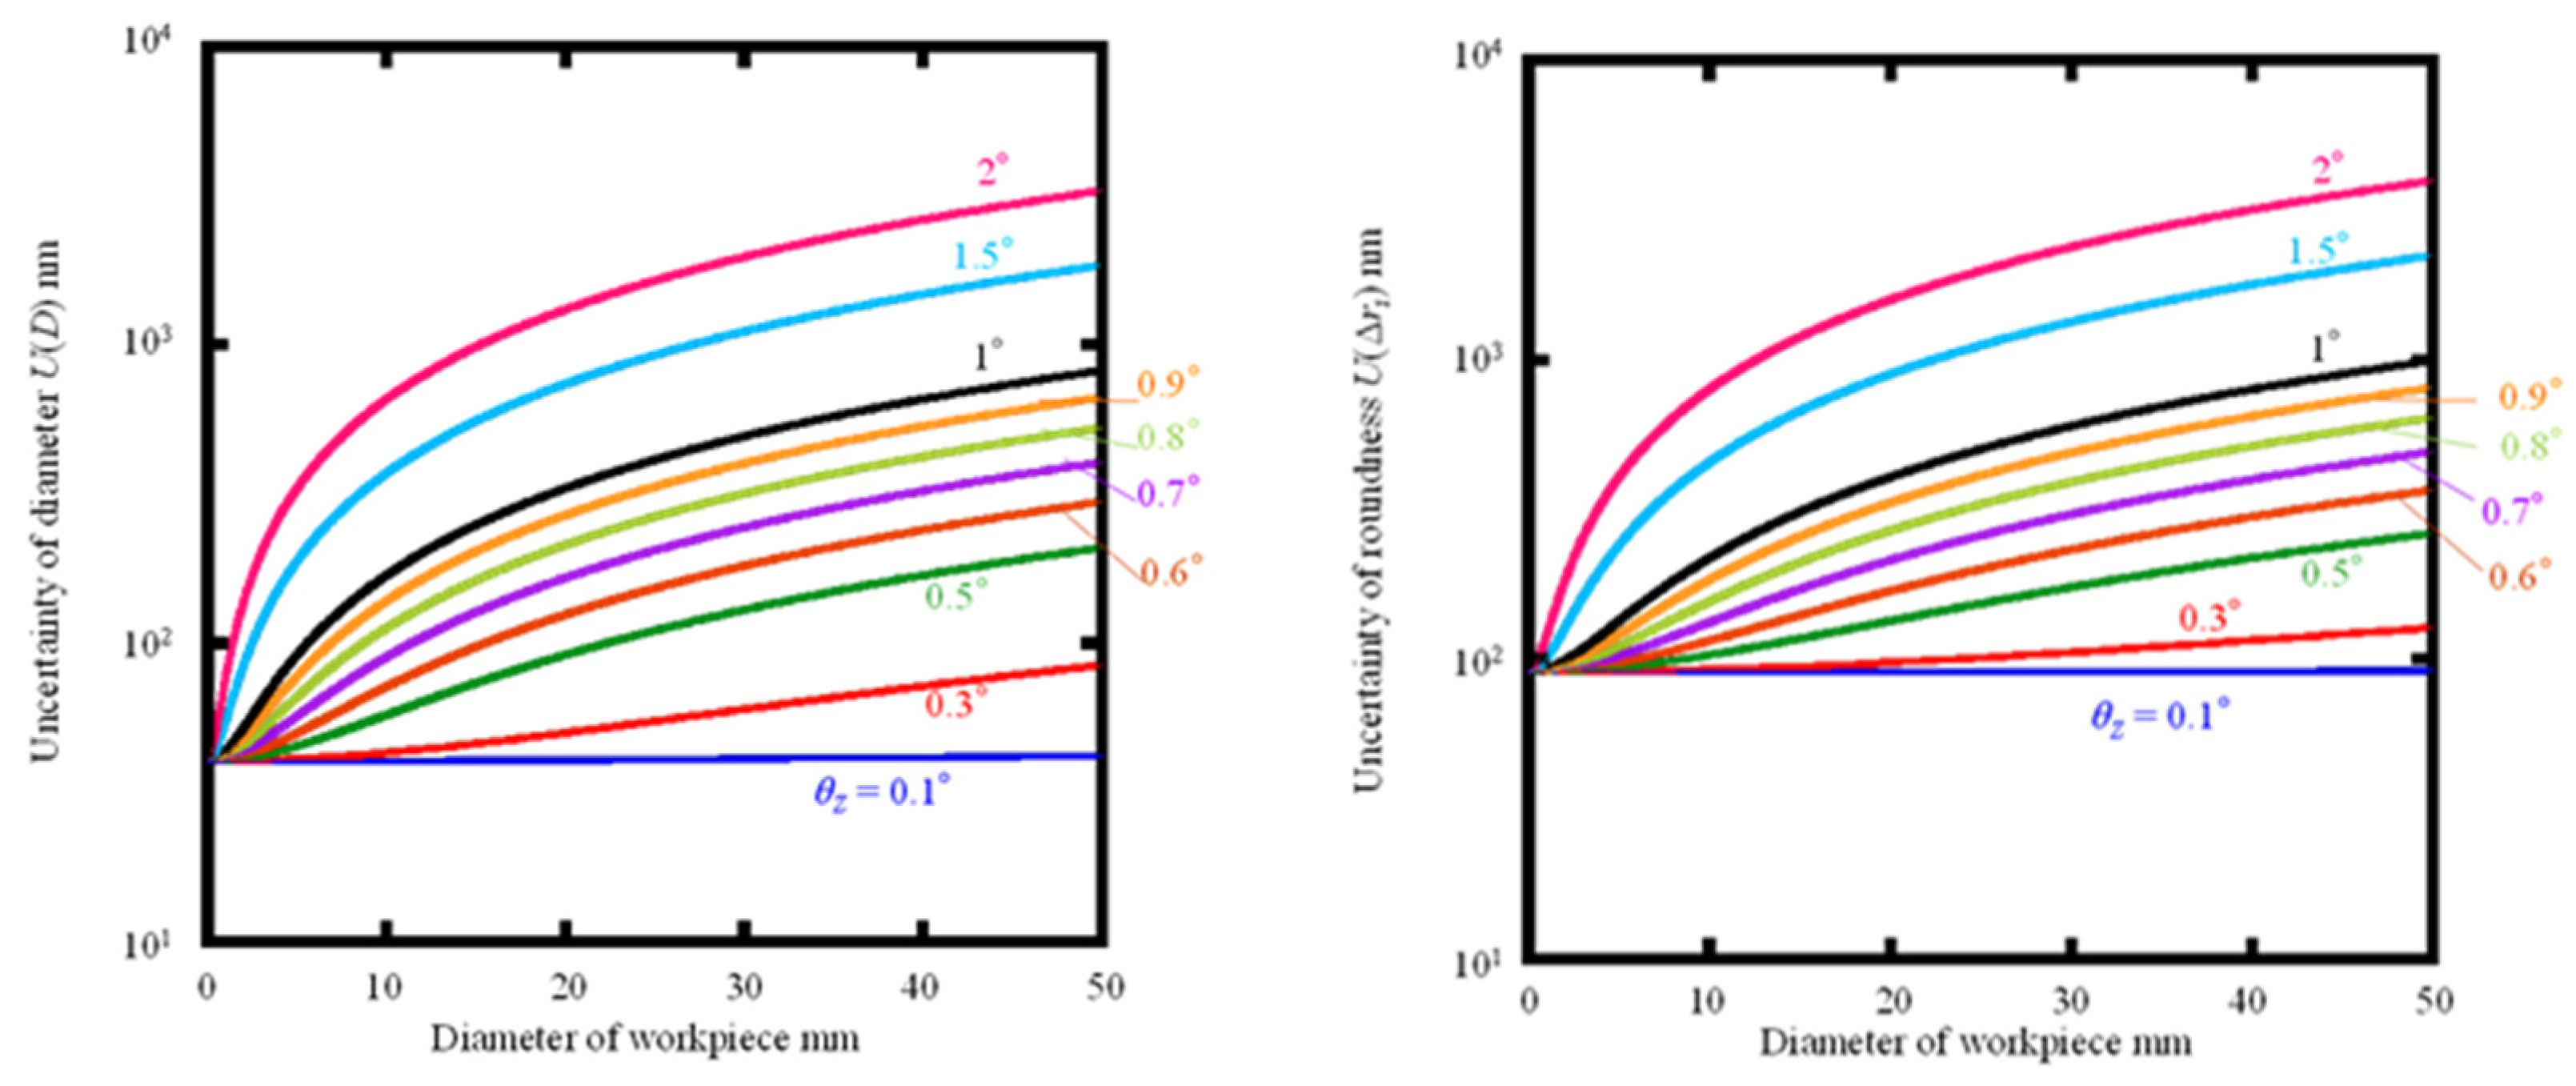

Table 1.
Uncertainty budget of the output in the Z-axis direction.
| Source of Uncertainty |
Symbol | Type | Coverage factor | Standard uncertainty | Sensitivity coefficient | |ci|×u(xi) nm |
|---|---|---|---|---|---|---|
| Calibration of probe |
u(ecalibration_Z) | A | ― | 33.7 | 1 | 33.7 |
| Resolution | u(eresolution) | B | 0.92 | 1 | 0.92 | |
| Repeatability | u(erepeat) | A | ― | 18.95 | 1 | 18.95 |
| Combined standard uncertainty |
u(zi) | ― | 38.45 | |||
Table 2.
Uncertainty budget of the X-axis coordinate.
| Source of Uncertainty |
Symbol | Type | Coverage factor | Standard uncertainty |
Sensitivity coefficient | |ci|×u(xi) nm |
|---|---|---|---|---|---|---|
| Calibration of probe |
u(ecalibration_X) | A | ― | 33.7 | 1 | 33.7 |
| Attitude error around Z-axis |
u(ealignment_Z) | B | 25.68 | 1 | 25.68 | |
| Attitude error around X-axis |
u(ealignment_X) | B | 0.26 | 1 | 0.26 | |
| Combined standard uncertainty | u(xi) | ― | 42.37 | |||
Table 3.
Uncertainty budget of diameter measurement by proposal method.
| Source of Uncertainty |
Symbol | Type | Coverage factor | Standard uncertainty | Sensitivity coefficient | |ci|×u(xi) nm |
|---|---|---|---|---|---|---|
| Output in Z-axis direction |
u(zi) | ― | ― | 38.45 | 1 | 38.45 |
| Coordinate of X-axis |
u(xi) | ― | ― | 42.37 | 1 | 42.37 |
| Combined standard uncertainty | u(Ri) | ― | 40.28 | |||
| Radius after stitching process |
― | 14.24 | ||||
| Diameter | u(D) | ― | 28.48 | |||
| Expanded uncertainty(k=2) |
U(D) | ― | 56.96 | |||
Disclaimer/Publisher’s Note: The statements, opinions and data contained in all publications are solely those of the individual author(s) and contributor(s) and not of MDPI and/or the editor(s). MDPI and/or the editor(s) disclaim responsibility for any injury to people or property resulting from any ideas, methods, instructions or products referred to in the content. |
© 2023 by the authors. Licensee MDPI, Basel, Switzerland. This article is an open access article distributed under the terms and conditions of the Creative Commons Attribution (CC BY) license (http://creativecommons.org/licenses/by/4.0/).
Copyright: This open access article is published under a Creative Commons CC BY 4.0 license, which permit the free download, distribution, and reuse, provided that the author and preprint are cited in any reuse.
Submitted:
10 July 2023
Posted:
12 July 2023
You are already at the latest version
Alerts
A peer-reviewed article of this preprint also exists.
This version is not peer-reviewed
Submitted:
10 July 2023
Posted:
12 July 2023
You are already at the latest version
Alerts
Abstract
To verify the reliability of the proposed stitching linear scan method for roundness measurement of small cylindrical workpieces, measurement uncertainties of the workpieces with various dimension are conducted. The cross-sectional circle of a cylindrical workpiece is divided into several equal arcs to be measured. Thus, the arc profile can be characterized according to the measured arcs. The roundness profile of the cylindrical part can be obtained by stitching these arc profiles together. Firstly, the measurement uncertainty of the workpiece with a diameter 1.5 mm and length 5.8 mm is evaluated to be 0.095 μm which can meet the uncertainty target of 0.1 μm. Considering the uncertainty of θx and θz which are the alignment around X-axis and Z-axis respectively changing with workpiece dimension changing, relevant uncertainties are carried out. As a result, there is no limitation with respect to workpiece diameter theoretically If the alignment can reach θz = θx = ±0.1° without considering the measurable range of the machine.
Keywords:
Subject: Engineering - Industrial and Manufacturing Engineering
1. Introduction
Fine mechanics, such as RV reducers, play a significant role in industrial robot and machine tool spindles. There are many cylindrical parts with various diameters employed in RV reducers. The performance and life of an RV reducer are affected by the quality of these cylindrical parts very much [1,2,3,4,5]. The parameter of roundness and diameter is always used to evaluate the quality of the cylindrical parts. The more precision the parameter is, the better the quality is. To enhance the quality of the cylindrical parts, precision measurement is necessary [6,7,8,9,10,11]. Conventionally, roundness measurement can be carried out by the rotary scan method with a roundness measuring machine [12,13,14,15]. In recent years, some alternative roundness measurement methods have been proposed, such as the multiple probe method and online method [16,17,18,19]. However, due to the crucial alignments (Inclination and eccentricity) of the rotary scan method, precision roundness measurement become difficult when the diameter of the measured workpiece becomes smaller. To address this issue, the stitching linear scan method is proposed [20,21,22]. In this method, the coordinates of the cross-sectional circle of the cylindrical workpiece which is attached to a round magnetic jig and mounted on a V-groove, are divided into several equal arcs to be scanned linearly by a profilometer. A set of arc coordinate data can be obtained after one linear scan on the surface of the cylindrical workpiece. The measured cylindrical workpiece is rotated by an equal angle to a new measuring position by rotating the magnetic jig and then scanned again. Another set of arc data can be obtained. Repeat the procedure by several times till the entire cross-sectional circle of the cylindrical workpiece is scanned completely, then a series of arcs can be obtained. The arc profiles, which can be characterized according to the obtained arcs, are used to stitch into a roundness profile. Through the stitching angle error compensation, overlap parts integration, and filter processing, an accurate, integral, smooth, continuous roundness profile can be obtained [20,21,22].
Although small cylindrical parts can be measured by the stitching linear scan method, the measurable range of this method hasn’t been analyzed. In this paper, measurement uncertainty is used to verify the reliability of the stitching linear scan method for the roundness measurement of small cylindrical parts with various diameters. Due to ambiguous between random error and system error, the concept of measurement uncertainty is proposed in 1993. The measured result can be reasonably and quantitively evaluated according to GUM (Guide to the Expression of Uncertainty in Measurement) which is actually an error propagation [23,24,25,26]. The measurement uncertainty is necessary for multiple disciplines, such as survey measurement uncertainty, IoT sensor uncertainty, rainfall measurement, standardized track insulation measurement, etc [27,28,29,30]. In this paper, the analysis of measurement uncertainty is presented and the measurable range of the cylindrical workpiece can be confirmed.
2. Principles and Experiment
As is known to all, the surface form of a measured workpiece can be modeled and reconstructed by coordinates. In this paper, the coordinates of the cross-sectional circle of a small cylindrical workpiece are divided into several equal arcs to be scanned by a profilometer. The diameter and center coordinates of these arcs can be fitted by the least square method. The arc profiles can be characterized according to the arc data. The roundness profile of the small cylindrical part can be obtained by stitching these arc profiles one by one in sequence.
As shown in Figure 1(a), the small cylindrical workpiece with a diameter of 1.5 mm and length of 7.8 mm is attached to the circular magnetic jig which is marked by 8 equal lines on the surface. This kind of combination is mounted on the V-groove. As shown in Figure 1(b), the stylus of the profilometer is brought to scan on the surface of the small cylindrical workpiece and return to the initial position, then the first arc coordinate data can be obtained. The small cylindrical workpiece is rotated by 45° by rotating the circular magnetic jig by one equal part. The stylus scans on the surface of the workpiece again and returns, then the second arc coordinate data can be obtained. Repeat the procedure by 7 times, then 8 arc coordinate data can be obtained. Since the maximum measuring inclination of the stylus is ±45°, only 85° arc coordinate data is extracted for the following data processing.
The 8 arc profiles with respect to the arc coordinate can be characterized by a series of data processing. An inaccurate roundness profile can be formed by stitching these 8 arc profiles together. Regarding the stitching procedure, as shown in Figure 2(a)&(b), arc profiles 1 and 2 are at the initial position. As shown in Figure 2(c), the first arc profile is kept static and the second arc profile is rotated by 45° since there is a 45° angular displacement between adjacent arc profiles according to the measuring procedure. As shown in Figure 2(d) the second arc profile is kept static, and the third arc profile is rotated by 45°, and the rest of the arc profiles are stitched in this manner. However, there are some stitching angle errors between adjacent arc profiles since the small cylindrical workpiece is rotated manually, namely, the angular displacement between adjacent arc profiles is not always 45°. Therefore, stitching angle error compensation is necessary. An accurate, integral, smooth, continuous roundness profile can be obtained after stitching error compensation, overlap part combination, and low-pass filter.
3. Measurement uncertainty analysis of the linear-scan method
3.1. Building mathematical models
The uncertainty of the proposed linear-scan measurement method was evaluated in a measurement experiment of a small cylindrical workpiece with a small diameter of 1.5 mm and a length of 7.8 mm. A mathematical model was constructed to calculate the measurement uncertainty of the diameter and roundness. The arc output (xi, zi) in the rectangular coordinate system is obtained from the scanning of the linear scanning stylus. The mathematical model for the radius calculation and the uncertainty factors arising from the measurements are shown in Figure 3(a). For the radius calculation, a perfect circle is assumed, and the center of the circle is set to the origin. The radius Ri of an arbitrary measurement point is expressed in terms of the Z-axis output zi and X-axis coordinates xi of any measurement point using the following equation.
From equation (1), the combined standard uncertainty u(Ri) of the measured arc radius is expressed as:
The uncertainty coefficients in the figure are:
(1) Uncertainty coefficient of output zi in the Z-axis direction.
u(ecalibration_Z): Uncertainty of stylus calibration in the Z-axis direction.
u(eresolution): Uncertainty due to stylus resolution.
u(erepeatt): Uncertainty of repeated measurements.
(2) Uncertainty coefficient of output xi in the X-axis direction
u(ecalibration_X): Uncertainty of stylus calibration in the X-axis direction.
u(ealignment_Z): Uncertainty due to orientation error around the Z-axis of the workpiece.
u(ealignment_X): Uncertainty due to orientation error around the X-axis of the workpiece.
In summary, the combined standard uncertainty zi of the Z-axis output and the combined standard uncertainty of the X-axis coordinate xi are expressed by the following equations (3) and (4), respectively.
For the calculation of roundness, it is assumed that there is a deviation from the approximate circle center rather than the radian of a perfect circle, and the approximate circle center is set as the origin. The radius Ri of any measurement point, the radius R0 of the vertex, and the X-axis coordinate xi are used to represent the Z-axis output zi of any measurement point with the following equation.
The radius Ri after the stitching process is calculated according to Equation (6).
Δri is the radial deviation at any measured point and Δr0 is the radial deviation at the arc apex.
Square both sides of equation (5), substitute into equations (7) and (8), and rearrange.
From Eq. (9), the combined standard uncertainty u(Δri) of the radial deviation of any measurement point can be expressed as:
The uncertainty factors shown in Figure 3(b) are similar to the radius measurement model described above. Therefore, the combined standard uncertainty zi for the Z-axis output and the combined standard uncertainty for the X-axis coordinate xi are expressed by Eq. (6) and Eq. (7), respectively. The uncertainty of the radius after the suturing process is expressed by the following equation, using the combined standard uncertainty u(Ri) of the radius obtained from Eq. (6) and the number of arc divisions N.
3.2. Measurement uncertainty evaluation
1. Uncertainty coefficient of output zi in the Z-axis direction.
The standard uncertainty of each uncertainty factor is derived using appropriate evaluation methods.
(1) Uncertainty of stylus calibration in Z-axis direction u(ecalibration_Z).
The calibration of the Form Talysurf PGI420 used was performed with the dedicated master sphere shown in Figure 4(a). The Pt value is the minimum maximum width after linear expansion of the arc measured at the known radius value shown in Figure 4(b), including shape error of the master sphere, shape error of the stylus tip diameter, electrical noise in the system, and mechanical and environmental disturbances Pt value = 0.0337μm is in the radial direction, but assuming the presence in the Z-axis and X-axis directions, respectively, and a larger estimate, the uncertainty of the stylus calibration in the Z-axis direction uncertainty can be expressed by the following equation.
(2) Uncertainty due to stylus resolution u(eresolution).
The Form Talysurf PGI420 uses a linear scanning stylus with a vertical resolution of 3.2 nm. The uncertainty due to the resolution of the stylus is considered to be a ±1.6 nm rectangular distribution, which can be determined using the Type B evaluation method by the following equation.
(3) Uncertainty of repeated measurements u(erepeat).
The results of repeated measurements using the Form Talysurf PGI420 on the cross-sectional circle of a small cylindrical workpiece with a diameter of 1.5 mm were used to estimate the uncertainty due to measurement error: The repeatability was 59.93 nm based on 10 repeated measurements, and the uncertainty of the repeated measurements can be determined using the Type A evaluation method according to the following formula.
2. Uncertainty coefficient of the x-axis coordinate xi.
(1) Uncertainty of stylus calibration in the X-axis direction u(ecalibration_X).
When picking up the output zi in the Z-axis direction as the uncertainty coefficient, it is assumed that Pt values exist in the Z-axis and X-axis directions, respectively, so the uncertainty of the stylus calibration in the X-axis direction is the same as that in the X-axis direction, expressed by the following equation.
(2) Uncertainty due to orientation error around the Z-axis of the workpiece u(ealignment_Z).
The uncertainty caused by the workpiece attitude error is calculated by establishing a mathematical model of the measurement error, and the calculated value of the measurement error is used to determine the uncertainty by B-type evaluation. Figure 5(a) shows a schematic diagram of the effect of the orientation error of a cylindrical workpiece around the Z-axis. The diameter of the workpiece is D, the radius is R, the coordinates of the acquired arc endpoints are (xedge, zedge), and the angle of the attitude error is θZ. The attitude error around the Z-axis causes the measurement result of the geometric circle of the geometric cylinder to appear as an ellipse with its main axis in the X-axis direction. An error occurs in the X-axis coordinates because an arc of φ = 85°, i.e., an arc of height h from the vertex, is extracted regardless of the workpiece diameter, as shown in Equation (17). If the error angle is ±θZ° and this error has a rectangular distribution, the uncertainty due to the posture error around the Z-axis is represented by the following equation.
In the actual measurement, the alignment of the rotary table and the scanning of the stylus were repeatedly performed so that the obtained arc length converged to the minimum and the error angle θZ was measured as small as possible. Assuming an error angle of ±1° at this point, the uncertainty due to the pose error around the Z-axis can be obtained by substituting the radius after the stitching process into equation (18) as follows.
(3) Uncertainty due to orientation error around the X-axis of the workpiece u(ealignment_Z).
Figure 5(b) shows a schematic diagram of the effect of the attitude error around the X-axis on a cylindrical workpiece. The diameter of the workpiece is D, the radius is R, the coordinates of the arc endpoints are obtained as (xedge, zedge), and the angle of the orientation error is θX. The orientation error around the X-axis causes the measurement of the geometric circle of the geometric cylinder to appear as an ellipse of the main axis in the Z-axis direction. The error in the X-axis coordinates is because the arc of height h is extracted from the vertex, just as in the case of the directional error around the Z-axis. If the error angle is ±θX° and the error has a rectangular distribution, the uncertainty caused by the positional error around the X-axis is given as follows.
In the actual measurement, the manual stage is moved in the Y-axis direction with the stylus in contact with the plane of the mounting table and aligned with the inclined stage to minimize displacement output variation. The error angle θX is measured as small as possible. Assuming that the error angle at this point is ±0.1°, the uncertainty caused by the attitude error around the X-axis is obtained by substituting the radius after the stitching process into equation (9) as follows.
Table 1 and Table 2 summarize the calculated results for each uncertainty. From these results, the combined standard uncertainty zi for the Z-axis output and the combined standard uncertainty xi for the X-axis coordinates can be expressed respectively by the following equations.
Using the calculated uncertainty, the combined standard uncertainty u(Ri) of the measured arc radius can be obtained from equation (23) as follows Substitute the combination of (xi, zi), i.e., the coordinates of the arc endpoint (xedge, zedge) = (0.50575, 0.55280), for which the u(Ri) obtained from the measurement is the maximum.
The uncertainty of the radius after the suturing process can be obtained by substituting the values obtained in equation (13) into equation (11) to obtain the following equation.
The uncertainty of the diameter measurement is twice the uncertainty of the radius.
Calculating the extended uncertainty for k=2 yields the following.
As can be seen above, the uncertainty of the diameter measurement of the 1.5 mm small cylindrical workpiece using the linear scanning method, was estimated to be ±47.24 nm, achieving a target measurement uncertainty within ±0.1 μm. Table 3 summarizes the results of the standard uncertainty.
Using the calculated uncertainty, the combined standard uncertainty u(Δri) of the radial deviation of any measured point can be obtained from Eq. (10) as follows Substituting the combination of (xi, mi), the coordinates of the endpoint of the arc (xedge, zedge) = (0.50575, 0.55280) and the radius after the stitching process, for which u obtained from the measurement u(Δri) is maximum, the following equation is obtained.
Using the same assumptions as in equations (6) and (29), the combined standard uncertainty u(Δzq) of roundness can be expressed as follows.
Substituting the uncertainty calculated in Eq. (26), the combined standard uncertainty u(Δzq) is obtained from Eq. (27), as shown in Equation (31) below.
Calculating the extended uncertainty for k= 2, the following equation is obtained.
As can be seen above, the uncertainty in the roundness measurement of a small cylindrical workpiece with a diameter of 1.5 mm was estimated to be ±95.44 nm using the linear scanning method, achieving a target measurement uncertainty of ±0.1 μm or less. Table 3 summarizes the results of the standard uncertainty.
3.3. Variation of uncertainty due to change in workpiece diameter
The purpose of calculating the measurement uncertainty when the workpiece diameter varies by simulation is to investigate the cylindrical workpiece diameter suitable for roundness measurement using a roundness measuring machine, which is a linear scanning type measurement method. Among the uncertainty coefficients described in the previous section, the uncertainty coefficient u(ealignment_Z) due to the orientation error around the workpiece Z-axis and the uncertainty coefficient u(ealignment_X) due to the orientation error around the workpiece X-axis vary significantly with the change of the workpiece diameter, while the others are considered to be almost unchanged. Using equations (13) and (14), the graphs of the uncertainty u(xi) in the x-axis coordinate as the workpiece diameter varies from 0.01 mm to 50.00 mm are shown in Figure 6(a) and (b). Figure 6(a) shows that u(ealignment_Z) increases with increasing diameter and becomes almost the same as u(xi), but the change in u(ealignment_X) is smaller. This means that u(ealignment_Z) is the dominant factor in the variation of u(xi). This is due to the setting of the attitude error angles θZ = ±1° and θX = ±0.1° considering the alignment method and stylus resolution, while θZ is estimated to be greater than θX. Figure 7(a) shows the graphs representing the variation of the extended uncertainty U(D) for diameter and the extended uncertainty U(Δzq) for roundness, created by substituting u(xi) and other standard uncertainties, which vary with workpiece diameter, showing that both U(D) and U(Δzq) increase as the workpiece diameter increases due to the effect of u(xi). increases with increasing workpiece diameter due to the effect of u(xi). Figure 7(b) shows a graph for expanding the range of workpiece diameters from 0.01 mm to 10 mm. From this graph, it can be read that the conditions under which the target measurement uncertainty within ±0.1 m of the workpiece diameter can theoretically be achieved are U(D) of 5.58 mm or less and U(Δzq) of 2.11 mm or less when the attitude error angle θZ = ±1° and θX = ±0.1°.
In the previous simulations, the attitude error angle was set to θZ = ±1° and θX = ±0.1°, but improving the alignment increases the upper limit of the workpiece diameter that satisfies the target measurement uncertainty. What has room for improvement is the attitude error angle θZ around the Z-axis. Thus, Figure 8(a) and (b) show the extended uncertainty U(D) in diameter and the extended uncertainty in roundness when the attitude angle error occurs in a rectangular distribution with θZ = ±0.1°, ±0.3°, ±0.5°, ±0.6°, ±0.7°, ±0.8°, ±0.9°, ±1°, ±1.5°, and ±2° The variation of the uncertainty U(Δzq). The upper limit of the workpiece diameter for which the target uncertainty of diameter and roundness can reach ±0.1 μm at each attitude error angle θZ is calculated from the graphs and summarized in Table 3. Table 3 shows that when measuring large-diameter cylindrical workpieces, it is desirable to make θZ as convergent as possible by more precise alignment; if it can be kept less than θZ = ±0.8°, the proposed method can cover all diameters below about 3 mm, which are difficult to measure with the rotary scanning method. The proposed method can cover all diameters less than 3 mm, which are difficult to measure with the rotational scanning method. If θZ can be further reduced, the proposed method can also be used for workpieces with larger diameters; if the alignment can reach θZ = θX = ±0.1°, the diameter limitation of the workpiece theoretically no longer exists. However, as the workpiece diameter increases, the measurement range in the Z-axis and X-axis directions expands, which increases the uncertainty and limits the measurement range of the used measuring machine, which may lead to an upper limit of the workpiece diameter.
4. Conclusions
To quantitatively assess the reliability of the stitching linear scan method for the roundness measurement of small cylindrical part with various diameters, a series of measurement uncertainties are carried out. Firstly, the measurement uncertainty of the workpiece with the diameter of 1.5 mm and length 5.8 mm is evaluated to be 0.095 μm which satisfies the target uncertainty of 0.1 μm. Since the alignment around X-axis () and Z- axis () are affected by different diameters of measured workpieces, the uncertainty caused by the alignment and should be analyzed. According to the analysis, the measurement uncertainties of the workpieces with the diameter from 0.01 mm to 50 mm are analyzed. All the error propagations are the same, except for the alignments of and , which are the position angle around X-axis and Z-axis respectively when the workpiece is mounted on the V-groove, are changing with the dimension of the workpiece changing. Evaluation results of the proposed stitching linear scan method confirm that if the position error around the Z-axis can be kept less than ±0.8°, the proposed method can cover the roundness measurement of all diameters smaller than about 3 mm. It was confirmed that the proposed method can measure the roundness of all diameters less than about 3 mm, which are difficult to evaluate with roundness measuring machines, with an uncertainty within the target value if the attitude error angle around the Z axis is kept smaller than ±0.8°. If can be further reduced, the proposed method can also be used for workpieces with larger diameters. If the alignment can reach = = ±0.1°, there is no limitation with respect to workpiece diameter theoretically. However, with the workpiece diameter increasing, the measurement displacement in the Z-axis and X-axis is increasing which can beyond the limited range of the instrument, namely, the upper limitation of the roundness measurement by the stitching linear scan method is up to the measuring range of instrument.
Author Contributions
Jiali Zhao: Methodology; Resources; Formal analysis; Writing - original draft. Liang Zhang: Investigation; Data curation; Review & editing. Dan Wu: review & editing; Project administration. Bobo Shen: Data curation; Visualization. Qiaolin Li: Investigation; Visualization.
Funding
This research was funded by the National Defense Basic Scientific Research Program of China (Grant numbers JCKY2019427D002).
Data Availability Statement
The data that support the findings of this study are available from the corresponding author upon reasonable request.
Conflicts of Interest
The authors declare no conflict of interest.
References
- Qiu Z, X.J. Review of Performance Testing of High Precision Reducers for Industrial Robots. Measurement 2021, 183, 109794. [CrossRef]
- Yu, Z.; Hao, Z. Calibration of the Angle Measurement Error Caused by the Industrial Reducer Performance Test Instrument Torsional Deformation. Sci Rep 2022, 12. [CrossRef]
- Xu, L.X.; Chen, B.K.; Li, C.Y. Dynamic Modelling and Contact Analysis of Bearing-Cycloid-Pinwheel Transmission Mechanisms Used in Joint Rotate Vector Reducers. Mech Mach Theory 2019, 137, 432–458. [CrossRef]
- Yue, H.; Wu, X.; Shi, Z.; Zhang, Y.; Ye, Y.; Zhang, L.; Fu, Y. A COMPREHENSIVE CYCLOID PIN-WHEEL PRECISION REDUCER TEST PLATFORM INTEGRATED WITH A NEW DYNAMIC MEASUREMENT METHOD OF LOST MOTION. Metrology and Measurement Systems 2022, 29. [CrossRef]
- Xie Y H, Xu L X, D.Y.Q. A Dynamic Approach for Evaluating the Moment Rigidity and Rotation Precision of a Bearing-Planetary Frame Rotor System Used in RV Reducer. Mech Mach Theory 2022, 173, 104851. [CrossRef]
- Gao, W. Precision Nanometrology; Springer Series in Advanced Manufacturing; Springer London: London, 2010; ISBN 978-1-84996-253-7. [CrossRef]
- Gao, W. Metrology; Gao, W., Ed.; Precision Manufacturing; Springer Singapore: Singapore, 2019; ISBN 978-981-10-4937-8. [CrossRef]
- Gao, W. Surface Metrology for Micro-and Nanofabrication; Elsevier: Oxford, United Kingdom, 2020; ISBN 9780128178508.
- Gao, W. Precision Nanometrology and Its Applications to Precision Nanosystems. International Journal of Precision Engineering and … 2005, 6, 14–20.
- Gao Wei, Shimizu Yuki, Kazuhiro Hane, Hitoshi Soyama, K.Adachi. Measurement and Instrumentation; 2017.
- Gao, W.; Shimizu, Y. Optical Metrology for Precision Engineering; De Gruyter, 2021; ISBN 9783110542363. [CrossRef]
- ISO 12181-1 2003 Geometrical Product Specifications (GPS)-Roundness-Part 1: Vocabulary and Parameters of Roundness.
- Taylor Hobson Ltd. A Guide to the Measurement of Roundness Introduction to Roundness.
- Taylor Hobson Ltd. Roundness Measurement Equipment | Form Measurement | Cylindricity Measuring Instrument | Roundness Tester.
- SUI, Wentao; ZHANG, D. Four Methods for Roundness Evaluation. Phys Procedia 2012, 24, 2159–2164. [CrossRef]
- Bai J, Wang Y, Wang X; et al. Three-Probe Error Separation with Chromatic Confocal Sensors for Roundness Measurement. Nanomanufacturing and Metrology. Nanomanufacturing and Metrology 2021, 4, 247–255. [CrossRef]
- Gao, W., & Kiyono, S. On-Machine Roundness Measurement of Cylindrical Workpieces by the Combined Three-Point Method. Measurement 1997, 21, 147–156. [CrossRef]
- Cai Y, Xie B, Ling S; et al. On-Line Measurement Method for Diameter and Roundness Error of Balls. Nanomanufacturing and Metrology 2020, 3, 218–227. [CrossRef]
- Gao, W.; Haitjema, H.; Fang, F.Z.; Leach, R.K.; Cheung, C.F.; Savio, E.; Linares, J.M. On-Machine and in-Process Surface Metrology for Precision Manufacturing. CIRP Annals 2019, 68, 843–866. [CrossRef]
- Chen, Y.L.; Machida, Y.; Shimizu, Y.; Matsukuma, H.; Gao, W. A Stitching Linear-Scan Method for Roundness Measurement of Small Cylinders. CIRP Annals 2018, 67, 535–538. [CrossRef]
- Li, Q.; Shimizu, Y.; Saito, T.; Matsukuma, H.; Gao, W. Measurement Uncertainty Analysis of a Stitching Linear-Scan Method for the Evaluation of Roundness of Small Cylinders. Applied Sciences (Switzerland) 2020, 10. [CrossRef]
- Li, Q.; Shimizu, Y.; Saito, T.; Matsukuma, H.; Cai, Y.; Gao, W. Improvement of a Stitching Operation in the Stitching Linear-Scan Method for Measurement of Cylinders in a Small Dimension. Applied Sciences (Switzerland) 2021, 11. [CrossRef]
- JCGM 100: 2008, Evaluation of Measurement Data—Guide to the Expression of Uncertainty in Measurement.
- Joint Committee for Guides in Metrology (JCGM) JCGM 100:2008 GUM 1995 with Minor Corrections - Evaluation of Measurement Data — Guide to the Expression of Uncertainty in Measurement; 2008; Vol. 50.
- BIPM JCGM 200:2012 International Vocabulary of Metrology – Basic and General Concepts and Associated Terms (VIM) - 2008 Version with Minor Corrections; 2012; Vol. 3.
- Xiu-Lan Wen, Yi-Bing Zhao, Dong-Xia Wang, Jun Pan: Adaptive Monte Carlo and GUM Methods for the Evaluation of Measurement Uncertainty of Cylindricity Error, Precision Engineering, 37 (2013) 856– 864. [CrossRef]
- García-Balboa, J.; Ruiz-Armenteros, A.; Rodríguez-Avi, J.; Reinoso-Gordo, J.; Robledillo-Román, J. A Field Procedure for the Assessment of the Centring Uncertainty of Geodetic and Surveying Instruments. Sensors 2018, 18, 3187. [CrossRef]
- Cofta, P.; Karatzas, K.; Orłowski, C. A Conceptual Model of Measurement Uncertainty in IoT Sensor Networks. Sensors 2021, 21, 1827. [CrossRef]
- Segovia-Cardozo, D.A.; Bernal-Basurco, C.; Rodríguez-Sinobas, L. Tipping Bucket Rain Gauges in Hydrological Research: Summary on Measurement Uncertainties, Calibration, and Error Reduction Strategies. Sensors 2023, 23, 5385. [CrossRef]
- Bhagat, S.; Bongiorno, J.; Mariscotti, A. Uncertainty of Standardized Track Insulation Measurement Methods for Stray Current Assessment. Sensors 2023, 23, 5900. [CrossRef]
Figure 1.
(a) Linear scan with a stylus; (b) Small cylinder mounted on the V-groove and scanned linearly.
Figure 1.
(a) Linear scan with a stylus; (b) Small cylinder mounted on the V-groove and scanned linearly.
Figure 2.
The stitching procedure: (a) Profile 1; (b) Profile 2; (c) The stitching of Profiles 1&2; (d) The stitching of the rest of the arc profiles.
Figure 2.
The stitching procedure: (a) Profile 1; (b) Profile 2; (c) The stitching of Profiles 1&2; (d) The stitching of the rest of the arc profiles.
Figure 3.
(a) Schematic of the radius measurement and the uncertainty components; (b) Schematic of the roundness measurement and the uncertainty components.
Figure 3.
(a) Schematic of the radius measurement and the uncertainty components; (b) Schematic of the roundness measurement and the uncertainty components.
Figure 4.
(a) Standard ball; (b) Calibration Result.
Figure 5.
(a) Influence of attitude error of roll workpiece around Z-axis; (b) Influence of attitude error of roll workpiece around X-axis.
Figure 5.
(a) Influence of attitude error of roll workpiece around Z-axis; (b) Influence of attitude error of roll workpiece around X-axis.
Figure 6.
Variation of u(xi) in accordance with the diameter of workpiece: (a) Influence of u(Δealignment_Z); (b) Influence of u(Δealignment_X).
Figure 6.
Variation of u(xi) in accordance with the diameter of workpiece: (a) Influence of u(Δealignment_Z); (b) Influence of u(Δealignment_X).
Figure 7.
Variation of U(D) and U(Δzq) accordance with diameter of workpiece: (a) Diameter ф0.01-50mm; (b) Diameter ф0.01-10mm.
Figure 7.
Variation of U(D) and U(Δzq) accordance with diameter of workpiece: (a) Diameter ф0.01-50mm; (b) Diameter ф0.01-10mm.
Figure 8.
(a) Variation of U(D) with a diameter of the workpiece; (b) Variation of U(Δzq) accordance with diameter of workpiece.
Figure 8.
(a) Variation of U(D) with a diameter of the workpiece; (b) Variation of U(Δzq) accordance with diameter of workpiece.
Table 1.
Uncertainty budget of the output in the Z-axis direction.
| Source of Uncertainty |
Symbol | Type | Coverage factor | Standard uncertainty | Sensitivity coefficient | |ci|×u(xi) nm |
|---|---|---|---|---|---|---|
| Calibration of probe |
u(ecalibration_Z) | A | ― | 33.7 | 1 | 33.7 |
| Resolution | u(eresolution) | B | 0.92 | 1 | 0.92 | |
| Repeatability | u(erepeat) | A | ― | 18.95 | 1 | 18.95 |
| Combined standard uncertainty |
u(zi) | ― | 38.45 | |||
Table 2.
Uncertainty budget of the X-axis coordinate.
| Source of Uncertainty |
Symbol | Type | Coverage factor | Standard uncertainty |
Sensitivity coefficient | |ci|×u(xi) nm |
|---|---|---|---|---|---|---|
| Calibration of probe |
u(ecalibration_X) | A | ― | 33.7 | 1 | 33.7 |
| Attitude error around Z-axis |
u(ealignment_Z) | B | 25.68 | 1 | 25.68 | |
| Attitude error around X-axis |
u(ealignment_X) | B | 0.26 | 1 | 0.26 | |
| Combined standard uncertainty | u(xi) | ― | 42.37 | |||
Table 3.
Uncertainty budget of diameter measurement by proposal method.
| Source of Uncertainty |
Symbol | Type | Coverage factor | Standard uncertainty | Sensitivity coefficient | |ci|×u(xi) nm |
|---|---|---|---|---|---|---|
| Output in Z-axis direction |
u(zi) | ― | ― | 38.45 | 1 | 38.45 |
| Coordinate of X-axis |
u(xi) | ― | ― | 42.37 | 1 | 42.37 |
| Combined standard uncertainty | u(Ri) | ― | 40.28 | |||
| Radius after stitching process |
― | 14.24 | ||||
| Diameter | u(D) | ― | 28.48 | |||
| Expanded uncertainty(k=2) |
U(D) | ― | 56.96 | |||
Disclaimer/Publisher’s Note: The statements, opinions and data contained in all publications are solely those of the individual author(s) and contributor(s) and not of MDPI and/or the editor(s). MDPI and/or the editor(s) disclaim responsibility for any injury to people or property resulting from any ideas, methods, instructions or products referred to in the content. |
© 2023 by the authors. Licensee MDPI, Basel, Switzerland. This article is an open access article distributed under the terms and conditions of the Creative Commons Attribution (CC BY) license (http://creativecommons.org/licenses/by/4.0/).
Copyright: This open access article is published under a Creative Commons CC BY 4.0 license, which permit the free download, distribution, and reuse, provided that the author and preprint are cited in any reuse.
Overall Profile Measurements of Tiny Parts with Complicated Features with the Cradle-Type Five-Axis System
Lei Liu
et al.
Sensors,
2021
Accurate Inner Profile Measurement of a High Aspect Ratio Aspheric Workpiece Using a Two-Probe Measuring System
Peng Hu
et al.
Applied Sciences,
2022
Experimental Study of the Volumetric Error Effect on the Resulting Working Accuracy—Roundness
Michal Holub
et al.
Applied Sciences,
2020


MDPI Initiatives
Important Links
© 2024 MDPI (Basel, Switzerland) unless otherwise stated