Preprint
Article

A Comprehensive Evaluation of Heavy Metal Contaminations in Soils of Ohio and West Virginia and Cucurbitaceous Vegetables Grown in Respective Farms and Implications on Human Health

Altmetrics

Downloads

208

Views

90

Comments

0

Submitted:

10 July 2023

Posted:

12 July 2023

You are already at the latest version

Alerts
Abstract
Contamination of soil and crops with heavy metals (HMs) poses a significant environmental challenge in the United States. Hence, this study aimed to assess HM contamination levels from sampled Ohio and West Virginia soils using various pollution indicators analyses, including Enrichment Factor (EF), Geo-accumulation index (lgeo), Contamination Factor (CF), and Pollution Load Index (PLI) and identify the Translocation Factor (TF) of HMs in the edible part of the vegetables and further evaluate health risks associated with dietary exposure through estimations of Estimated Daily Intake (EDI), Hazard Index (HI), Target Hazard Quotient (THQ), Cancer Risk (CR) and Target Cancer Risk (TCR) on adults and children. In this study, Fe was the most predominant contaminant, ranging from 28.41 to 67.36 g/kg in the soil. Cancer risk assessment revealed that Ni poses significant risks. Therefore, regular monitoring of metal concentrations in soil and vegetables grown in these regions might mitigate potential health hazards in the future.
Keywords: 
Subject: Environmental and Earth Sciences  -   Sustainable Science and Technology

1. Introduction

Heavy metal (HM) pollution is one of the most troublesome environmental issues that has significantly accelerated since the beginning of the industrial revolution. A wide variety of HMs are released into the environment through anthropogenic sources such as mining, smelting, metallurgy, combustion of fossil fuels, electroplating, agriculture, sewage sludge amendments, etc., [1]. HMs can be uptake by the plants from the contaminated soil, and into the organisms through the biomagnification process [2]. HMs such as Iron (Fe), Zinc (Zn), Manganese (Mn), Copper Cu, Chromium (Cr), and Selenium (Se) are classified as essential HMs for human metabolisms and involved in various biological processes at trace level. However, when these metals exceed the threshold levels, they become toxic to living forms [3,4]. In addition, HMs such as Arsenic (As), Mercury (Hg), Cadmium (Cd), and Lead (Pb) have no beneficial biological roles and are hazardous to the organisms even at lower concentrations [5,6]. Even in lower doses and prolonged exposure, these metals can induce serious health risks causing cancer, lung inflammation, liver and kidney damage, fibrosis, emphysema, and dysfunction of the enzymatic, endocrine, and immune systems [7,8,9]. The US Environmental Protection Agency (EPA) recently estimated that HM contamination posed a health threat to more than 10 million people worldwide [10].
Plants from the Cucurbitaceae family consist of several fruits and vegetables consumed worldwide. Cucurbit fruits and vegetables are pivotal in dietary and nutritional aspects, especially as sources of minerals, dietary fibers, vitamin C, thiamine, niacin, folic acid, and pyridoxine [11,12]. Moreover, these fruits and vegetables have played an important role in the ethnopharmacological and traditional medicinal systems globally, and their evidence is well established in several classic literatures [13]. Due to these nutritional and pharmaceutical benefits, consumption has increased in recent years. According to the statistics of the Food and Agriculture Organization of the United Nations [14], the consumption rate of fruits and vegetables increased to 22.4% compared to the last ten years. However, fruits and vegetables of Cucurbitaceae are the most exposed food to HM contaminations, which accumulate metals in their edible parts at quantities high enough to cause health hazards [15]. It is important to identify safer limits of the essential and non-essential HMs in the major consumable cucurbit fruits and vegetables to ensure food safety and sustainability.
Ohio and West Virginia have a long history of mining coal, oil, natural gas, etc. They are also a major hub of various industrial and production sectors supporting the economy [16]. On the other hand, these anthropogenic activities release different HMs into the environment [17,18]. The last comprehensive survey of HMs in farmlands in the United States was published in 1993 [19]. Hence, its highly essential to understand metal contamination in high environmental risk states like Ohio and West Virginia. Based on the facts stated above, the present research was to i) assess HMs contamination in farmlands from Ohio and West Virginia states through the Enrichment Factor (EF), Geo-accumulation index (lgeo), Contamination Factor (CF), and Pollution Load Index (PLI) analysis, ii) identify the bioaccumulation and Translocation Factor (TF) of HMs in the edible part of the vegetables, iii) validate the HM dynamics through correlation factor, principal component and hierarchical cluster analysis, and iv) predict health risks associated with dietary exposure through modeling using Estimated Daily Intake (EDI), total EDI (TEDI), Hazard Index (HI), Target Hazard Quotient (THQ), Cancer risk (CR) and Target Cancer Risk (TCR) on adults and children.

2. Materials and Methods

2.1. Site Description and Samples Collection

Soil samples were collected from different counties of Ohio and West Virginia (Athens, Highland, Meigs, and Mason), which are home to many mining activities and hence are highly vulnerable to HMs contamination. The geographical map of the sampled locations is presented in Figure 1. Eighty-two vegetable samples (cucrbits) were collected from the 13 sampled sites from September to November 2022 (Table S1). Simultaneously, thirteen soil samples were collected using a zig-zag pattern from the close vicinity of the roots of the same vegetable plants at a depth ranging from 5 to 15 cm. Collected soil samples were bulked to form a composite sample.

2.2. Sample Preparation and ICP – MS Analysis

Collected soil samples were air-dried at laboratory, sieved through a nylon mesh (2 mm) to remove the non-soil particles, and stored at 4 °C for further analysis. Vegetable samples were rinsed and washed with deionized water. Further, vegetables were cut into small pieces, completely oven dried at 65 – 75 °C for 24 h, powdered, sieved, and stored at 4 °C in an airtight plastic container for analysis [1]. Processed soil and vegetable samples were digested with 3:1 ratio of HCl and HNO3 through a microwave digester (MARS 6, CEM Corporation, Matthews, NC, USA). The resulting mixture was then filtered and diluted with metal-free HPLC grade water. The concentrations of HMs in the test samples were estimated through Inductively Coupled Plasma – Mass Spectrometry (ICP – MS, X – serous II, Thermo, US) [8].

2.3. Pollution Indicator Assessment

2.3.1. Enrichment Factor (EF)

The EF is a primary geochemical index used to assess the influence of natural and anthropogenic sources on HM contamination in soil. The soil samples' EF was calculated using the following formula (Eq. 1) [20].
E F = C n C r e f s a m p l e / B n B r e f b a c k g r o u n d                                                                      
where Cn referred to the concentration of metal in the soil, Cref referred to concentrations of reference elements in the soil. Similarly, Bn is referred to as the background reference value of metals and Bref as the background value of the reference element. This study used Aluminium (Al) as a reference element to calculate the EF. Reference values used for EF calculations are listed in Table S2. The EF levels are categorized as follows: (i) no or minimal enrichment (EF < 2), (ii) moderate enrichment (2 EF < 5), significant enrichment (5 EF < 20), very high enrichment (20 EF < 40) and extremely high enrichment (EF40) [21].

2.3.2. Geo-Accumulation Index (Igeo)

The Igeo comprehensively assesses HMs in the soil by comparing contemporary and pre-industrial values. This study determined the Igeo values soil samples with the following formula (Eq. 2) [22].
I g e o = l o g 2 C i 1.5 G B V              
Ci represents the measured concertation of HM in the soil, and GBV represents the HM's geochemical background value, compiled in Table S2. Based on the rate of lgeo, contamination ratios were classified into seven different classes, which include: lgeo ≤ 0 – uncontaminated, 0 < lgeo ≤ 1 – uncontaminated to moderately contaminated, 1 < lgeo ≤ 2 – moderately contaminated, 2 < lgeo ≤ 3 – moderately to heavily contaminated, 3 < lgeo ≤ 4 – heavily contaminated, 4 < lgeo ≤ 5 – heavily to extremely contaminated and Igeo ≥ 5 – extremely contaminated [22].

2.3.3. Contamination Factor (CF)

The CF of the soil samples was assessed to quantify the impact of individual HMs on the soil. The CF ratio was calculated by dividing the metal concentrations in the test soil (Ct) by the background (CRef) value (Eq. 3) [23].
C f = C t C R e f  
Metal-specific reference concentrations used for CF calculation are given in Table S2. Further, CF values are classified based on the degree of metal concentrations, as follows; if CF <1 – low contamination; if 1 ≤ CF < 3 – moderate contamination; if 3 ≤ CF < 6 – considerable contamination and if CF ≥ 6 - very high contamination [24].

2.3.4. Pollution Load Index (PLI)

The PLI is also used to determine the overall concentration of HMs in the target soil samples. The PLI was calculated based on the CF values of each metal in the soil as follows (Eq. 4) [25].
P L I = C f 1 × C f 2 C f n n        
where the Cf1 contamination factor of element 1, Cf2 contamination factor of element 2, and Cnf contamination factor of the nth element. PLI is classified as PLI < 0 – no pollution, < 0 PLI <1 – low degree of pollution, < 1 PLI <2 moderate degree of pollution, <2 PLI <4 – high degree of pollution, <4 PLI <8 – very high degree of pollution and <8 PLI <16 – extremely high degree of pollution.

2.4. Translocation Factor (TF)

The HM uptaking ability of the plants was determined by calculating the concentration of HM in test soil and plant tissues (Eq. 5) [23].
T F = C v e g C s o i l
Cveg represents the total HM concentration in the vegetable, and Csoil represents the total HM concentration in the corresponding soil where the vegetable was grown. A TF value greater than 1 indicates that the plant is potentially accumulating HM [26].

2.5. Calculation of Human Health Risk Assessment

2.5.1. EDI Assessment

The EDI of the HMs was determined by their concentrations in each sample and the daily intake of vegetables in grams. The EDI value of each HM of interest was determined with the following formula (Eq. 6) [27].
EDI = E F × E D × E I R × C M × C F B W × T A × 0.001    
where EF represents the exposure frequency, ED represents the exposure duration, EIR represents the average vegetable consumption by adults and children, CM represents the concentration of HM present in the vegetables, CF represents the concentration of conversion factor for fresh weight to dry weight, BW represents average body weight of adult and children, TA represents the average exposure duration and 0.001 represent the unit conversion factor. The comprehensive reference data employed for EDI calculation is compiled in Table S2.

2.5.2. THQ and HI Assessment

The noncarcinogenic health hazards for people who consume HM-contaminated vegetables were calculated through THQ using the following equation (Eq. 7) [27].
THQ = E D I R f D  
EDI represents the estimated daily intake of HMs in mg/day/kg body weight, and RfD means the oral reference dosage values of HMs as listed in Table S2. If THQ value is < 1, it is considered safe for the risk of noncarcinogenic effects. If THQ value >1, it is supposed that there is a chance of noncarcinogenic effects with an increasing probability as the value increases.
The HI is a vital index that assesses the likely consequences of exposure to more than one metal. The HI was calculated following equation (Eq. 8) [26].
H I = n = 1 i T H Q n ;   i = 1 ,   2 ,   3 , . . . . . . . . n      
If the HI value is <1, there is no apparent health impact; however, if HI value is >1 indicates a greater possibility of health impact.

2.5.3. CR and TCR Assessment

The CR induced by HM-contaminated vegetable ingestion was estimated following the equation (Eq. 9) [28]. Further, the target cancer risk (TCR) was calculated with the following equation (Eq. 10) [29].
C R = E D I × C P S o        
T C R = n = 1 i C R ; i = 1 ,   2 ,   3 , . . . . . . . . n                                                                                                 ( 10 )
CR represents the cancer risk over a lifetime due to specific HM intake, and CPSo represents the oral slop factor (mg/kg/day). The cancer risk is categorized as no significant health risk (CS/TCR < 1.00E-06), admissible risk (1.00E-06 < CR/TCR < 1.00E-04), and inadmissible risk (CR/TCR > 1.00E-04). The CPSo value used for CR calculation was described in Table S2, while we couldn't find the corresponding value of Cu, Fe, Mn, and Zn; hence, their cancer risk was not calculated.

2.6. Statistical Analysis

Soil and vegetable samples were collected in triplicates. The mean difference between the samples was compared using one-way ANOVA. The data analysis and statistical interpretations were conducted using SPSS 20.0 (IBM Corporation, New York, NY, USA). Further, correlation coefficient factor, Principal Component Analysis (PCA), and hierarchical cluster analysis were performed by Origin 2022 (OriginLab Corporation, Corporation, Northampton, MA, USA).

3. Results and Discussion

3.1. HM Analysis in Agricultural Soil

Soil contamination with HMs directly impacts plant growth and yield. Moreover, these contaminants are transported to the edible parts, significantly increasing food safety concerns. Hence, in this study, the concentrations of HMs in the soil samples collected from different agricultural sites in Ohio and West Virginia were analyzed through ICP – MS analysis, and results are presented in Table 1. Across the 13 sampling sites, Cd, Cu, Fe, Mn, Ni, and Zn were identified. Contents ranged from 0.13 to 2.91 µg/g of Cd, 0.016 to 0.043 g/kg of Cu, 28.41 to 67.36 g/kg of Fe, 0.42 to 1.86 g/kg of Mn, 0.018 to 0.044 g/kg of Ni, and 0.064 to 0.234 g/kg of Zn. These metals were significantly varied in HM contaminations in the study areas. Fe (67.36 g/kg) was identified as the predominant contaminant in the study area. Mn, Ni, and Zn were also identified, with concentrations of 1.8, 0.044, and 0.234 g/kg, respectively. In contrast, Cd, and Cu, were detected at less than the background levels and can be classified as the least contaminants in the study area. The descending order of HM concentrations was Fe > Mn > Zn > Ni > Cu > Cd. Higher Fe, Mn, and Ni concentrations were observed among the tested soil samples in the MS2, HI, and RS6 sampling sites, respectively. In contrast, increased Cd, Cu, and Zn concentrations in the RS3 sampling site. Our results showed that the farmlands in Meigs County might have been exposed to greater HM concentrations. These increased concentrations of HMs may affect the soil structure, plant growth, nutrient, and water uptake by impairing the primary root growth and root hair formation [30,31].

3.2. Pollution Indicators Analysis

The EF analysis is a widely employed tool for characterizing various HM derived from multiple anthropogenic activities. The EF analysis of various HM, showed an increased level of Fe (Table 2). Of 13 soil samples, EF of Fe ranged from 2.041 to 4.125, with the maximum EF of 4.125 observed at the RS1 sampling site. Conversely, the EF for Cu, Cd, Mn, Ni, and Zn ranged from 0.051 to 0.481, 0.183 to 0.533, 0.249 to 1.64, 0.137 to 0.431, and 0.247 to 0.814, respectively, indicating either no enrichment or minimal enrichment in the study areas. Understanding the sources and mechanisms of Fe accumulation would be critical for assessing the possible impact of Fe enrichment on soil health. Like EF, the 𝐼geo values exhibited high variability, ranging from uncontaminated to moderately contaminated, depending on the specific HMs analyzed (Table 2). Across all study areas, Fe showed a higher prevalence than other analyzed HMs. Sampling sites RS2, RS4, and RS7 were uncontaminated to moderately contaminated (0 < lgeo ≤ 1) with Fe; while RS1, RS3, RS5, RS6, NM1, NM2, MS1, MS3, and HI sites were moderately contaminated with Fe (1 < lgeo ≤ 2). Noteably, site MS2 was identified as moderate to heavily contaminated (2 < lgeo ≤ 3) in terms of Fe level. On the other hand, five sampling sites (RS1, RS3, RS5, MS1, and MS3) were polluted with Mn, ranging from uncontaminated to moderately contaminated, and two sampling sites (RS6 and HI) were moderately contaminated. Further, sampling sites RS3, RS6, and MS2 were uncontaminated to moderately contaminated with Cu, while RS3 and RS6 were uncontaminated to moderately contaminated with Zn.
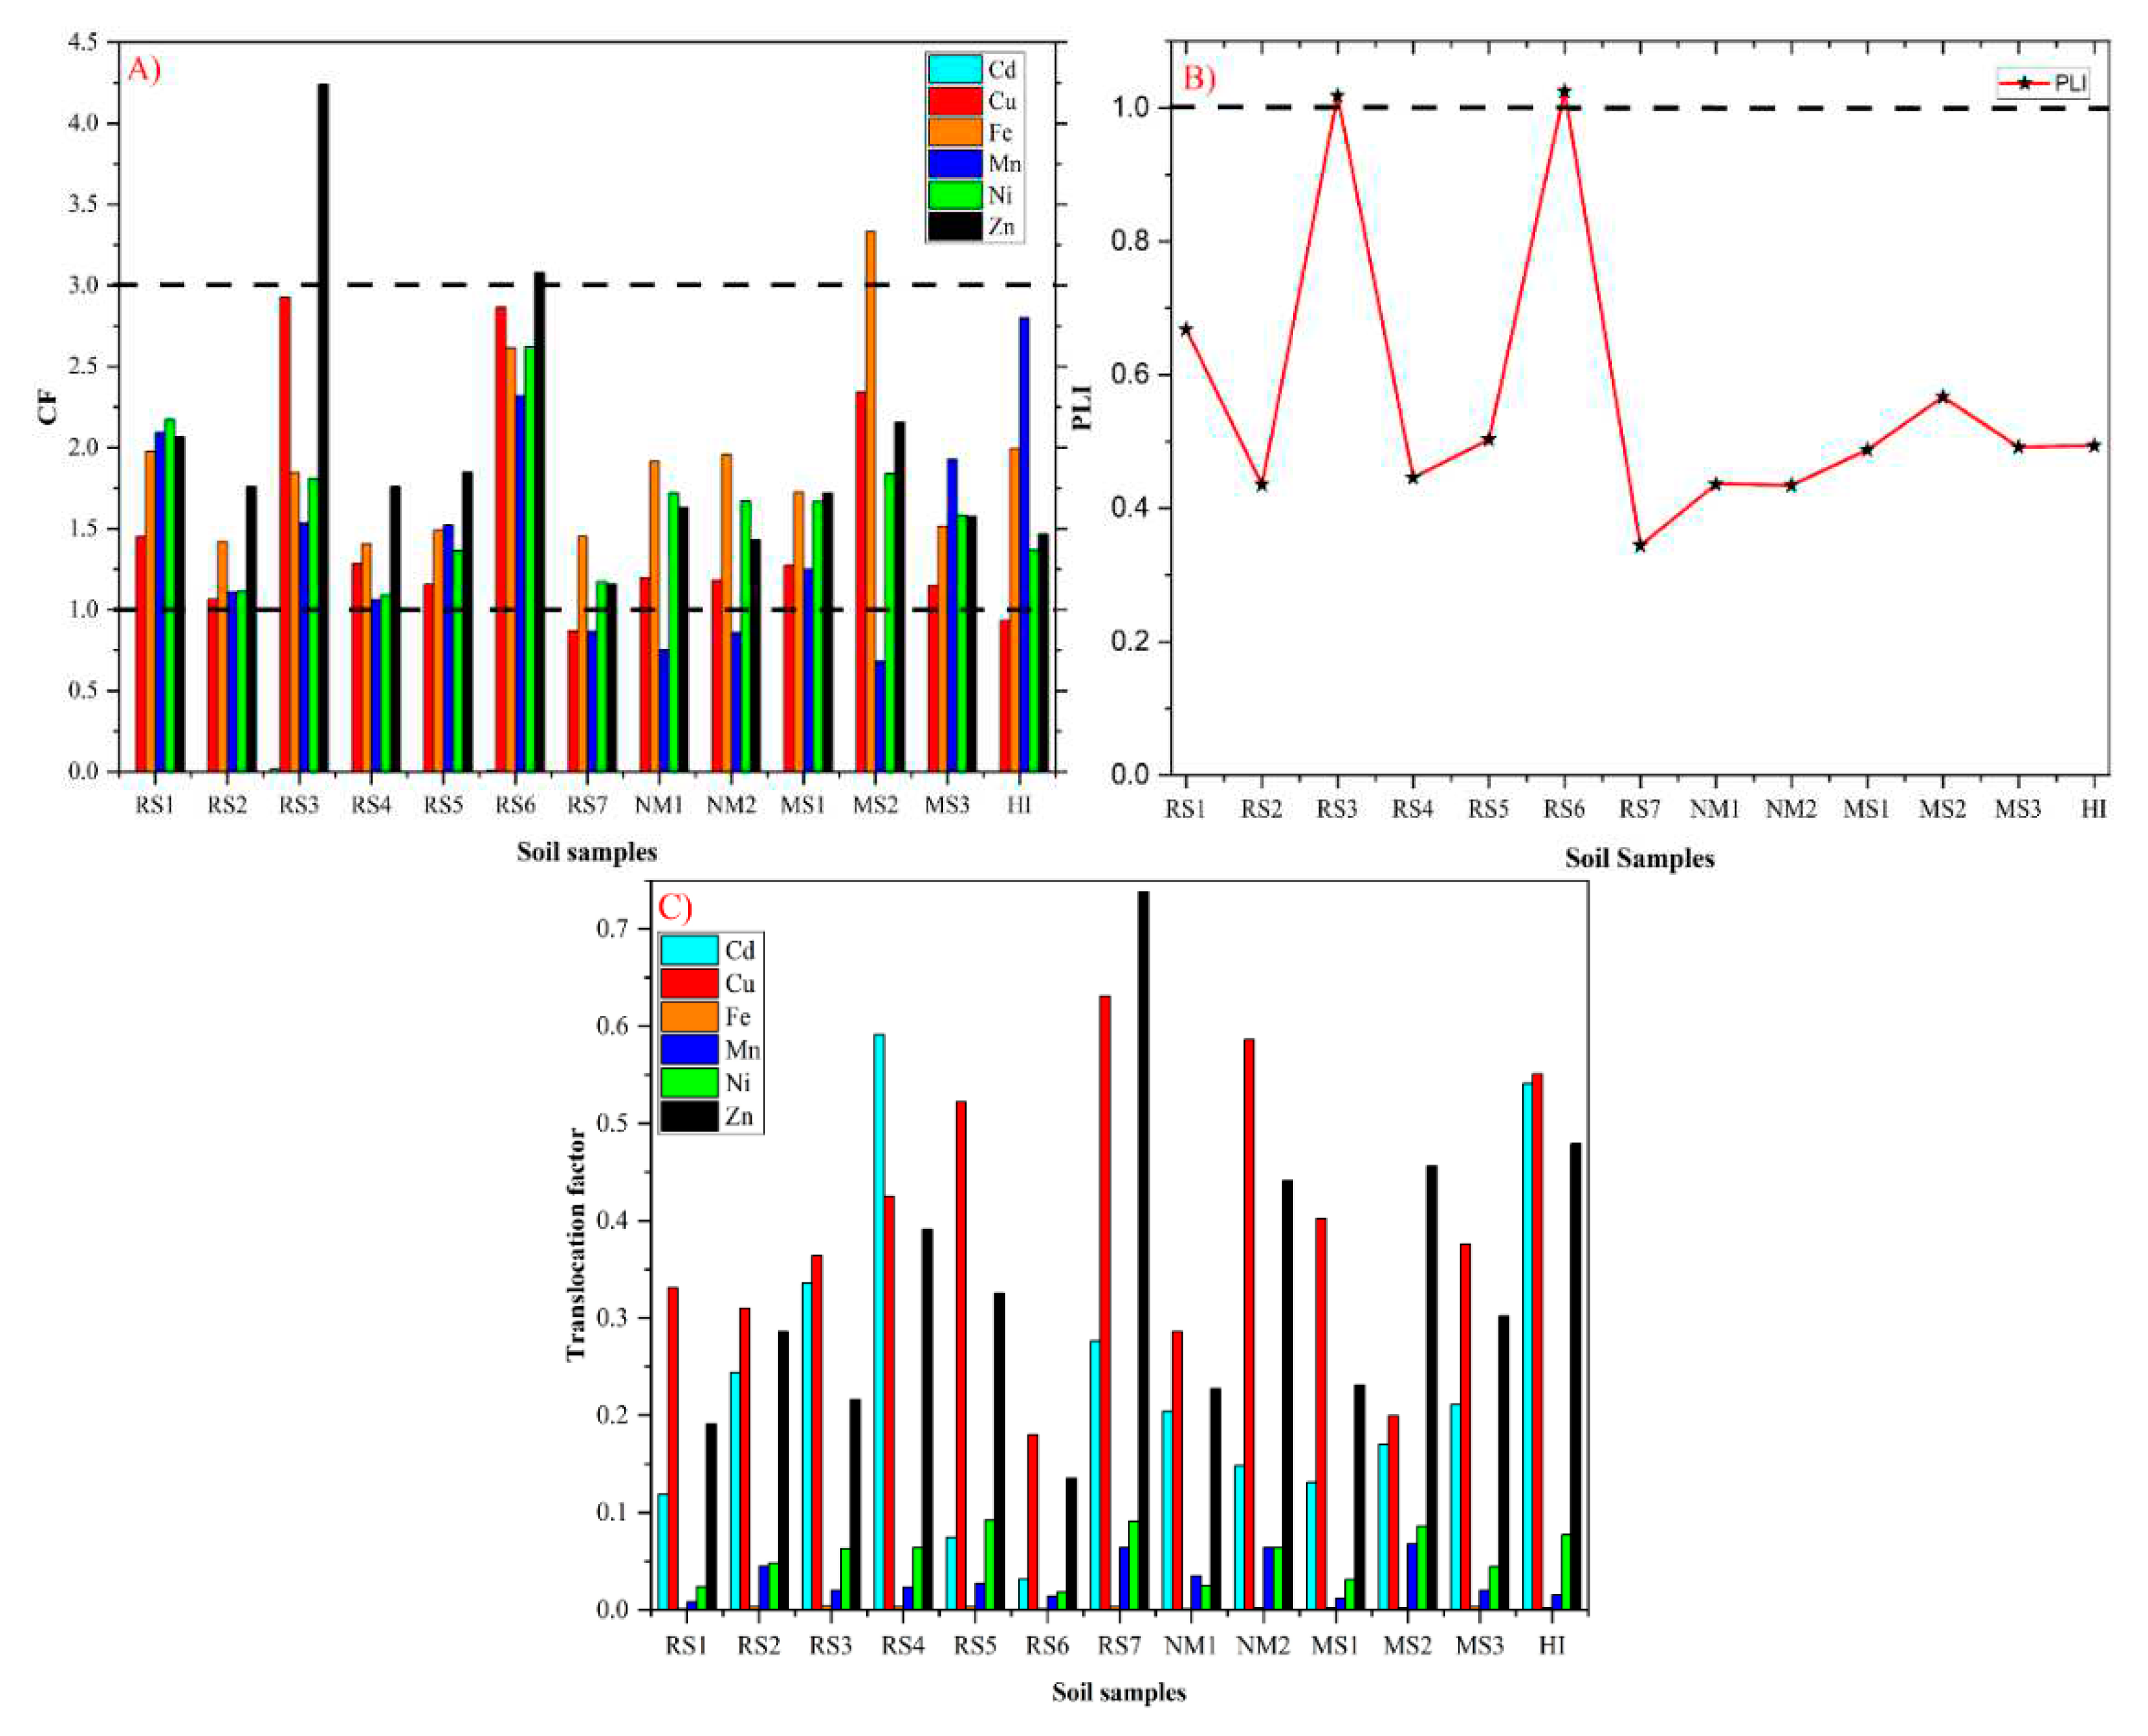
In addition to the EF and Igeo indices, the CF is also a useful indicator for comparing the HM contamination in the soil. The distribution pattern of CF values revealed significant variations among the analyzed metals, ranging from 0.017 to 0.08, 0.87 to 2.34, 1.40 to 2.80, 0.68 to 2.80, 1.08 to 2.61, and 1.15 to 4.23 for Cd, Cu, Fe, Mn, Ni, and Zn, respectively (Figure 2A). The sampling sites, namely RS1, RS2, RS3, RS4, RS5, RS6, MS1, and MS3, were moderately contaminated (CF>1) with Cu, Fe, Mn, Ni, and Zn. These values indicated that the soil's Cu, Fe, Mn, Ni, and Zn levels exceeded background levels, signifying a certain degree of contamination in the study area. Moreover, the CF values for Fe in the MS2 site and Zn in the RS3 and RS6 sites were higher (3≤CF<6), indicating the considerable contamination of respective HMs in the study areas. Collectively, all the above pollution indicator analyses revealed contamination of Fe, Mn and Zn, which may source from various anthropogenic activities such as agrochemical, mining, geological weathering, mineralization, and parent material characteristics [32,33]. Additionally, substantial quantities of Ni and Cu metals were also found, indicating their contribution to overall pollution levels. Understanding the sources and mechanisms of these HMs' enrichment are critical for assessing the possible impact on soil health [31]. Moreover, these parameters can aid in planning risk mitigation strategies for HM contamination to minimize health hazards. Further, the overall contamination levels in the study areas were assessed through PLI analysis, which provided an important metric for evaluating the pollution load and highlighting areas of concern. In this study, most sampling sites exhibited PLI ranging from 0 to 1, except for the RS3 and RS6 sites which exceeded the limit (Figure 2B). The RS3 and RS6 sites were classified as polluted, with PLI values of 1.017 and 1.024, respectively. The elevated PLI values indicate a significant amount of HMs contributed to the overall pollution load in the areas [5].

3.3. Traces of HMs in Vegetables

Monitoring the accumulation of HM residues in agricultural products is essential for ensuring food safety. The rate of HM accumulation in plant species widely differs, even among cultivars and varieties within the same species. HM contents in cucurbit fruits and vegetables grown in different sampling sites were analyzed (Table 3). Our results showed zucchini grown in MS2 had higher concentrations of Cd (0.152 mg/kg), Fe (176.42 mg/kg), Ni (2.67 mg/kg), and Zn (54.32 mg/kg). Pumpkins cultivated in the RS6 and RS7 sites showed the highest contents of Cu (11.29 mg/kg) and Mn (37.29 mg/kg), respectively. On the other hand, among all the tested vegetable samples, squash exhibited lower contents of Cu (6.18 mg/kg), Fe (60.91 mg/kg), Ni (0.73 mg/kg), and Zn (20.46 mg/kg). Similarly, watermelon displayed lower contents of Cd (0.02 mg/kg) and Mn (10.71 mg/kg), respectively. These results indicated significant accumulation of HMs in the tested vegetable samples, which can be attributed to species variation, genetic mechanisms related to metal-specific afficinty with the root, metal bioavailability, soil pH, and nutrient availability in a specific site [34,35]. Furthermore, certain species possess efficient metal transporter systems that selectively uptake, transport, and sequester certain HMs based on their requirements, thereby regulating the entry [36]. Further, TF was estimated in this study to identify the rate of HM uptake from soil to aerial plant parts. In the present experiment, TF was less than 1, ranging from 0.074 to 0.591 for Cd, 0.18 to 0.631 for Cu, 0.002 to 0.004 for Fe, 0.08 to 0.064 for Mn, 0.018 to 0.092 for Ni, and 0.135 to 0.738 for Zn, respectively (Figure 6). Among the analyzed vegetable samples, the maximum TF values were observed in pumpkin, followed by cucumber, zucchini, watermelon, and squash. Published studies have also reported a similar trend of TF ranges for Cd, Cu, Pb, and Zn [37].

3.4. Identification of HM Contamination Source

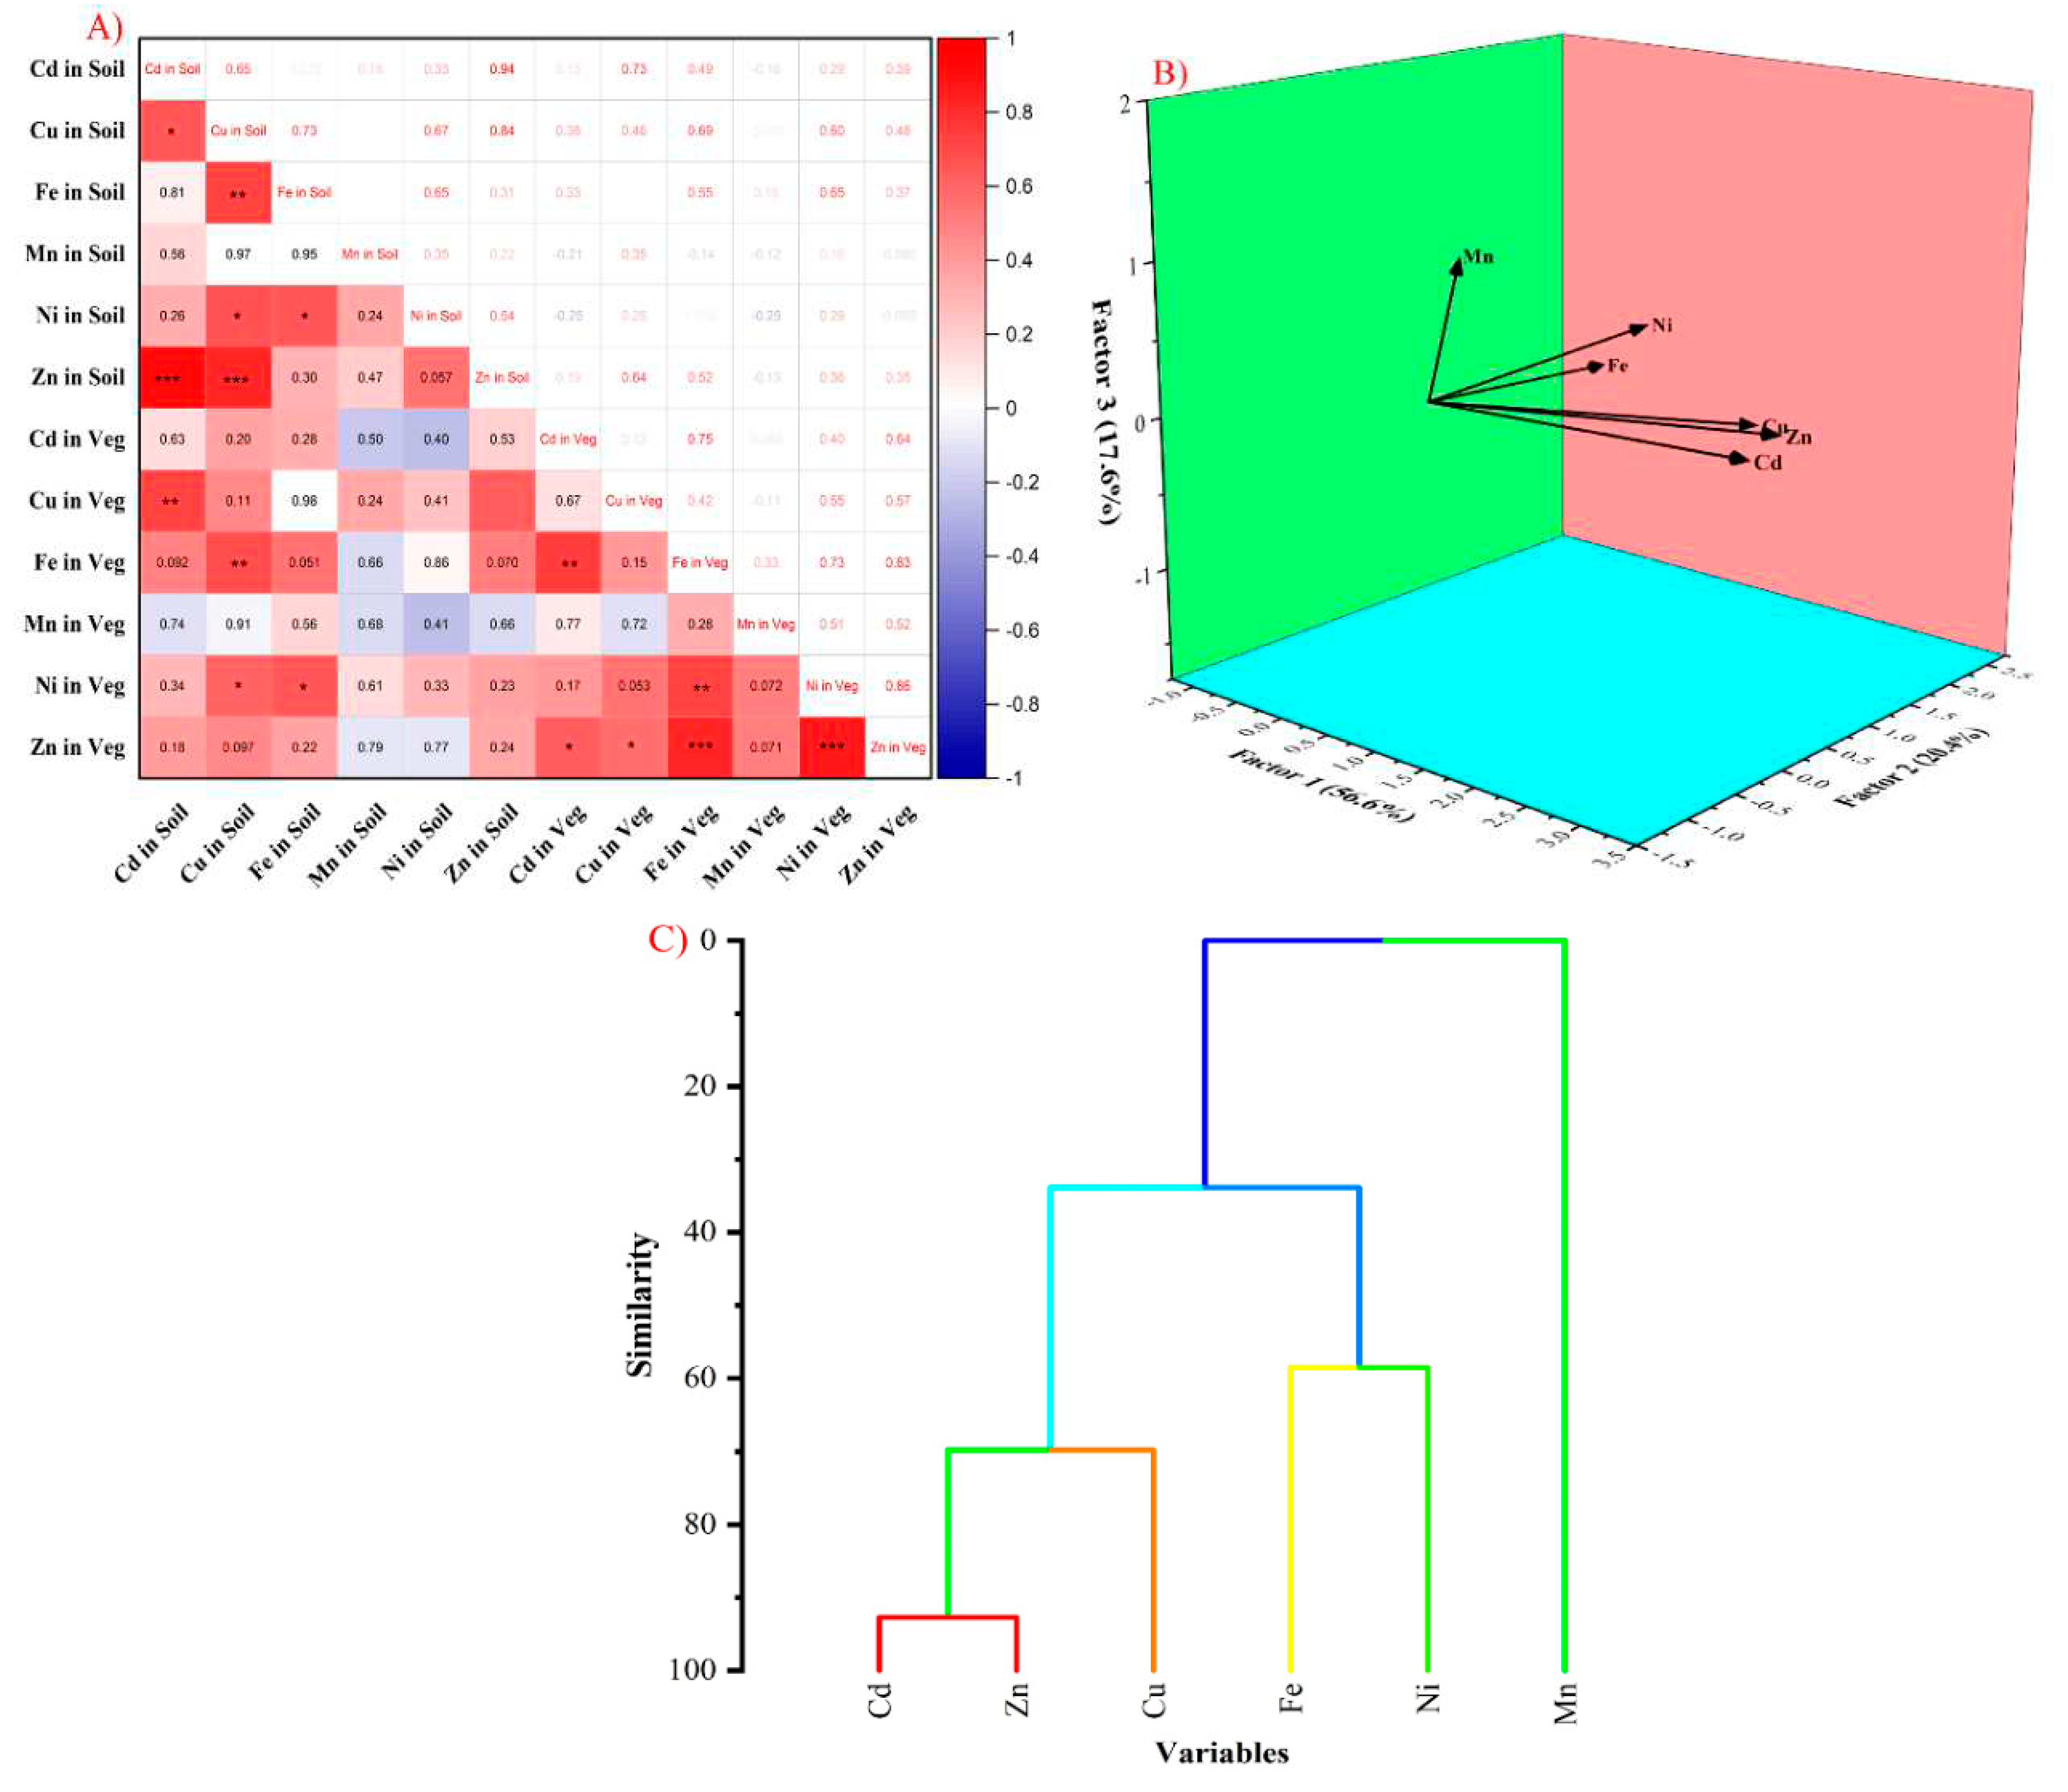
Correlation coefficients were estimated to examine the dynamics of HMs in soil-vegetable systems and gain insights into the sources of HMs in the sampling sites (Figure 7 A), which revealed a significant positive correlation between Cd and Cu (r = 0.94), and Cd and Cu with Fe (r = 0.73 and r = 0.65, respectively). Cu also positively correlated with Ni (r = 0.67) and Zn (r = 0.87). Similarly, Fe and Ni showed positive correlations with Ni (r = 0.65) and Zn (r = 0.54), respectively. Such significant positive correlations among the tested HMs suggest common mode of accumulation [5]. However, Mn did not significantly correlate with the other metals analyzed, indicating that the pattern of Mn intake and accumulation could be different from those of the other metals. Notably, Mn accumulation in the vegetable samples was negatively correlated with Mn concentrations within the soil samples. Such negative correlation coefficients could be attributed to differential sources of Mn when compared with other HMs [38]. This weak correlation and lack of a linear relationship between the concentration of HMs in soil and vegetables might affected by various environmental factors which could influence the plant uptake mechanisms [39].
In this study, a PCA was constructed using standardized forms of the dataset and analyzed through varimax rotation with Kaiser Normalization to understand HMs' sampling distribution. The multivariate PCA of HMs in the study area explained approximately 94.6% of the cumulative variance and identified three major factors for HM distribution (Figure 3B and Table S3). Cd, Cu, and Zn primarily influenced the first factor, contributing 56.6% of the total variance. The second factor was Ni and Fe, contributing 20.4% of the variance. In contrast to the first two factors, the third factor was predominantly influenced by Mn, which accounted for 17.6% of the variance and highly varied from the other tested HMs.
Further, the source of the HMs was validated through hierarchical cluster analysis (Figure 3C). This study provided insights into the grouping and associations among the HMs analyzed, shedding light on potential pollution sources and their interconnections. Similar to the PCA, Cd, and Zn were closely grouped, indicating a strong association. Cu is moderately associated with Cd and Zn, forming a subcluster within the first major cluster. The PCA and cluster analysis suggested that Cd, Zn, and Cu may share familiar sources or interact with each other through shared environmental pathways. Moreover, these HMs may originate from the same sources by applying agrochemicals during intensive agricultural activities in the study area [40]. Furthermore, Fe and Ni were grouped in the second cluster and moderately associated with the first cluster. This moderate association implies that shared pollution sources or environmental factors influence the dynamics of these metals in the soil. Sources of Fe and Ni could be attributed to various natural and anthropogenic activities, including geogenic processes, mining, atmospheric deposition, and irrigation with contaminated wastewater [41]. In contrast, Mn formed a separate third cluster and showed limited association with the other two clusters. This disassociation of Mn with other HMs concludes that the source of Mn in agriculture sights completely different from other HMs. Rollin et al. [42] suggested some possible sources of Mn entry in agricultural soil, such as mining, mineral processing, sewage sludge, and other anthropogenic emissions.

3.5. Noncarcinogenic Health Risk Assessment

Cucurbit have been an important vegetables, health risks from consuming contaminated with HMs were determined by calculating the EDI, THQ, and HI for different age groups (Figure S1). The EDI, TEDI, THQ and HI rates of consuming HMs through vegetables were lower than the maximum tolerable daily intake of each metal. In terms of the overall HM load in HI percentage, Cu contributed the most with 27.6%, followed by Mn (19.2%), Fe (17.6%), Cd (14.5%), Zn (12.9%), and Ni (8.2%) (Figure S2). While comparing the adults and children, the EDI, TEDI, THQ and HI rates were significantly higher in children, suggesting that consuming HM-contaminated vegetables poses relatively significant health risks to the younger population. Furthermore, children's nervous system is highly vulnerable to HM stress; therefore, even a relatively lower concentration of HMs in children's blood can have an irreversible impact on their mental growth and functions [21]. Within the sample set, the highest EDI, TEDI, and THQ rates were observed in zucchini, whereas the lowest rate was observed in squash.

3.6. Carcinogenic Risk

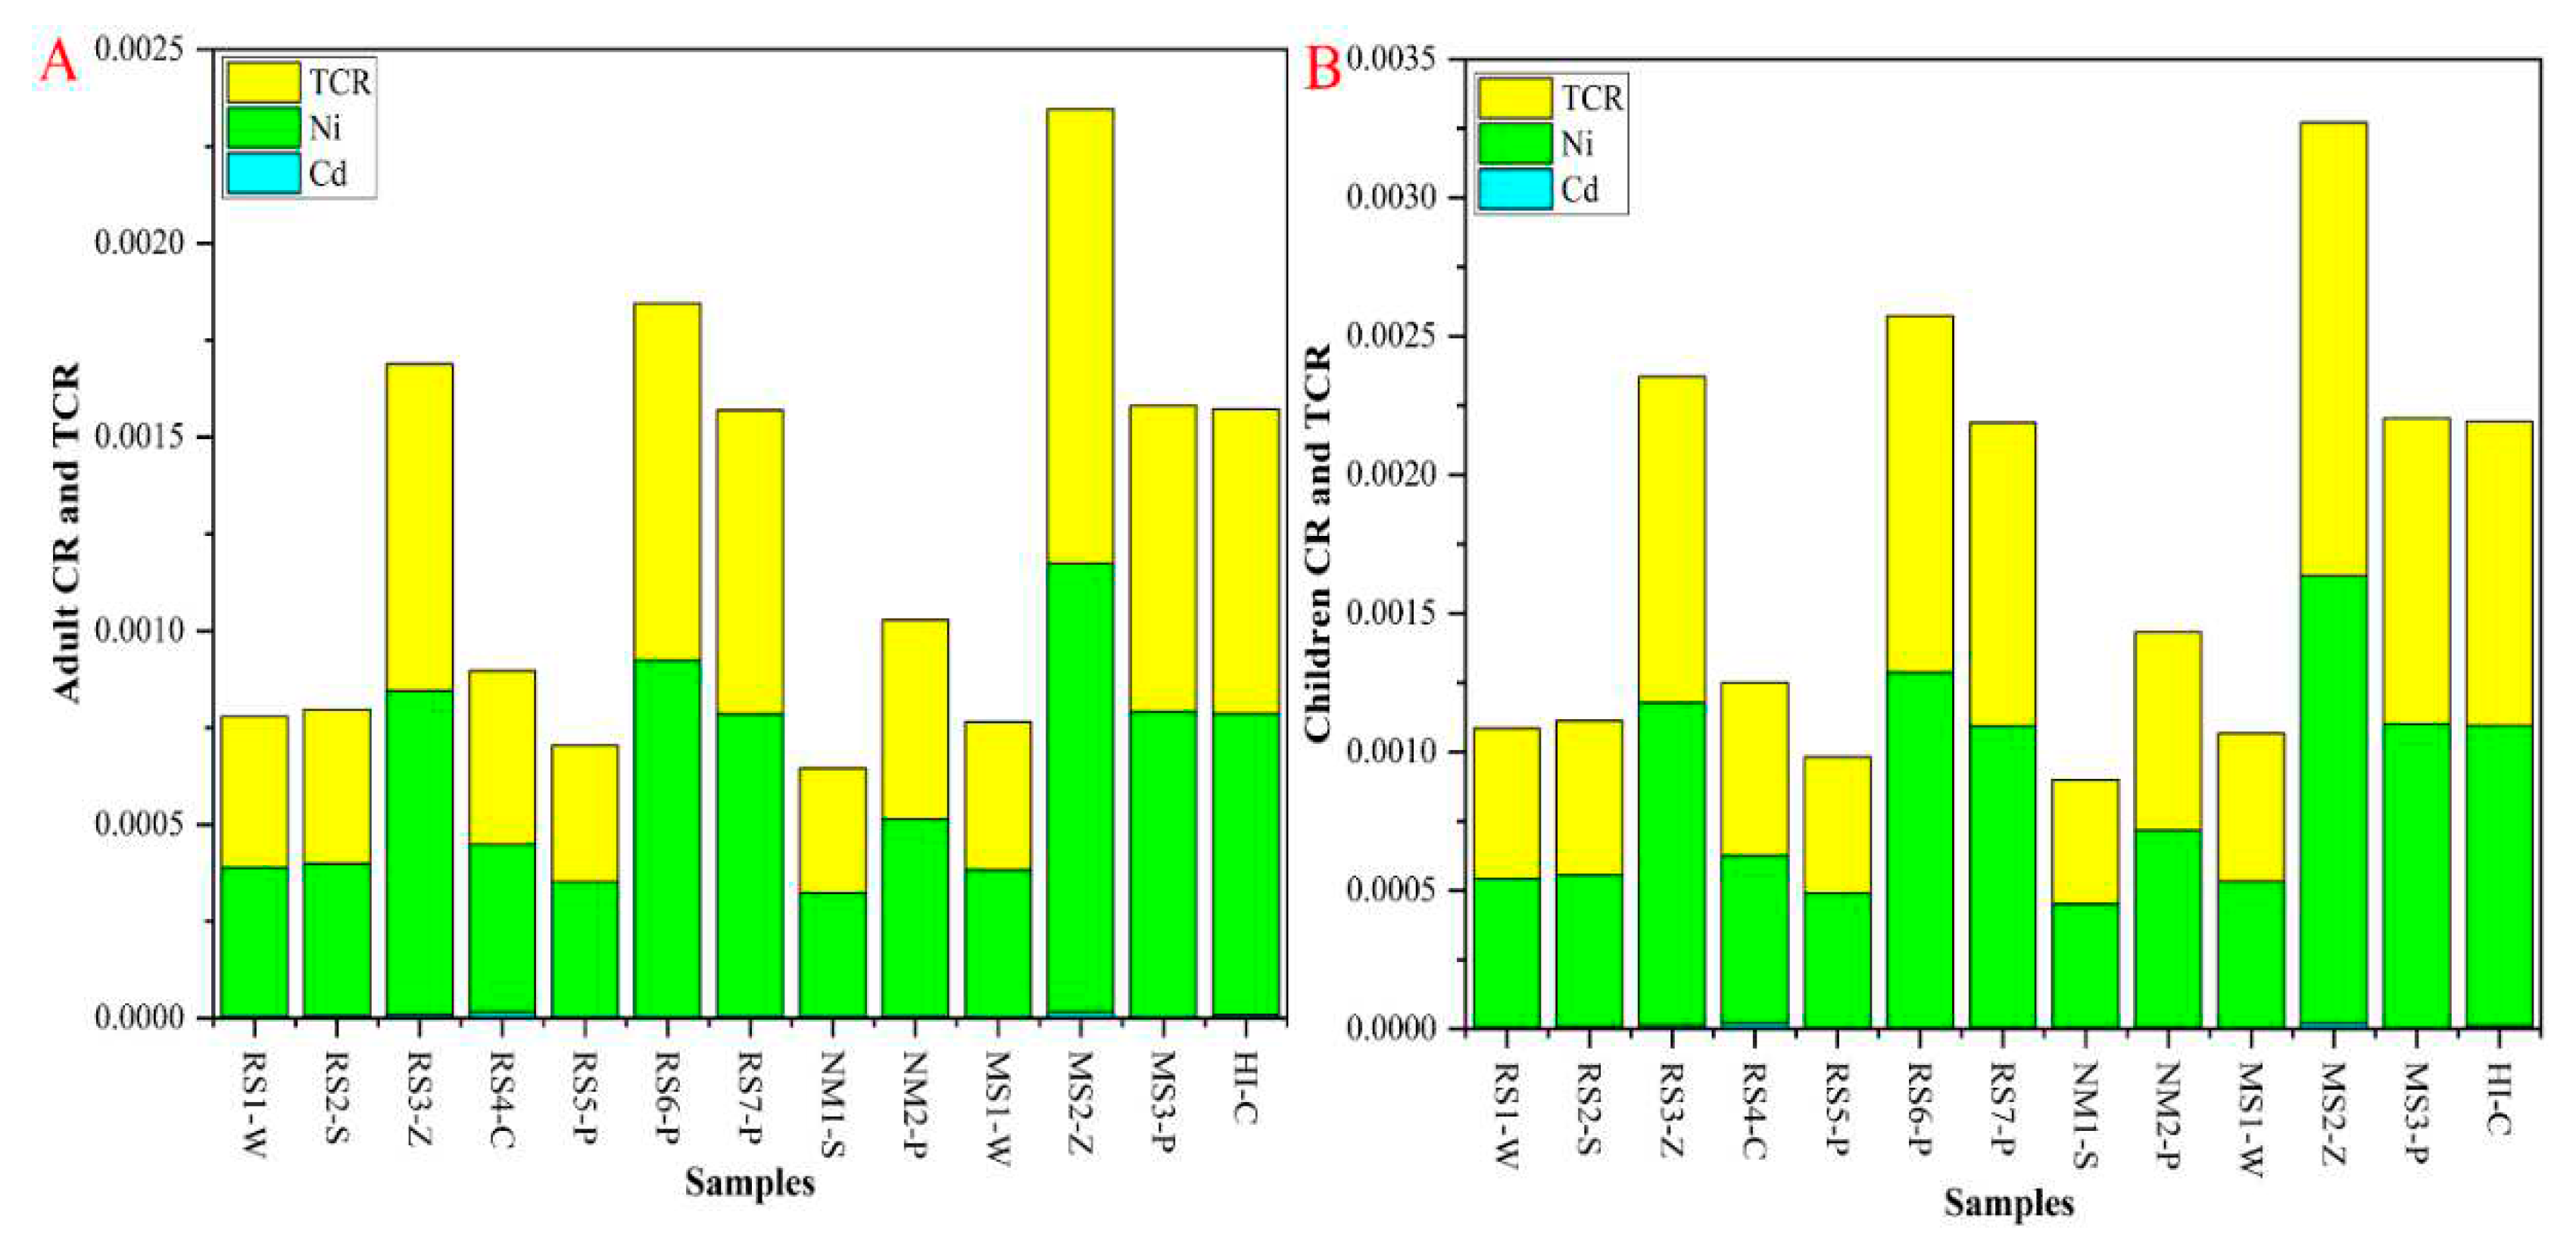
Furthermore, CR and TCR analysis validated the carcinogenic effects of consuming HM-contaminated vegetables. In this study, The CR value of Cd were within the acceptable range from 9.4962E-06 to 1.47288E-05 and from 8.241E-06 to 1.216E-05, for adults and children, respectively. On the other hand, the CR and TCR values of Ni in all the tested vegetables were higher than the permissible limit, ranging from 3.487E-4 and 1.172E-3 for adults and from 5.362E-4 and 1.286E-3 for children, respectively (Figure 4A and B). In the analyzed vegetables, the maximum CR and TCR values were observed in zucchini, followed by pumpkin, cucumber, watermelon, and squash. Prolonged consumption of vegetables contaminated with HMs poses a carcinogenic risk to human health, potentially leading to cancer [43]. Previous studies have documented a similar trend of enhanced CR and TCR rates through consuming HM-contaminated vegetables [15,26]. These carcinogenic risk results should be considered in planning and agriculture policy-making; for instance, selecting plants with low metal accumulation ability, such as squash and watermelon instead of zucchini, may help restrict the entry of metals into the food chain. Moreover, contaminated agriculture sites such as RS3 and RS6 could be used to cultivate wood and ornamental crops as an alternative to edible crops. However, it is crucial to identify the pollutant source and regulate the entry of metals into agricultural soil, which is an essential step to prevent such contamination. This would provide a significant balance between food safety and environmental protection, cost-effectively minimizing health risks.

4. Conclusion

The range of HM contamination in the major agriculture sites of Ohio and West Virginia was analyzed, revealing high levels of Fe contamination in the test soil samples. The calculated values of the HMs, obtained through various pollution indicator analyses, indicate that Cu, Fe, Mn, and Zn contaminated the study areas. Through PCA and hierarchical cluster analysis, it can be concluded that Cd, Cu, and Zn mainly accumulated from agricultural activities. In contrast, Fe, Mn, and Ni are primarily accumulated from mining and/or atmospheric deposition. The carcinogenic risk assessment indicated that the CR and TCR of Ni were higher than the allowable limit. Hence, it is strongly recommended to implement management practices and monitor HM levels in the soil and vegetables to prevent carcinogenic health risks to consumers.

Author contributions

UR and PN: conceptualization, project administration, funding acquisition, manuscript editing, supervision, KC: experimentation, data analysis, writing-original manuscript, PS and HY: sample collection and processing. All authors have read and approved the final manuscript.

Acknowledgments and Funding

Authors thankful to NASA WV EPSCoR (NASA-EPSCoR-R3-21-0051) for their financial support. The authors would like to thank Elemental Analysis Laboratory, Dept. of Chemistry Texas A&M University, for providing ICP – MS facilities.

Institutional Review Board Statement

Not applicable.

Informed Consent Statement

Not applicable.

Conflict of interest

The authors have declared no conflict of interest.

Compliance with Ethics requirements

This article does not contain any studies with human or animal subjects.

References

  1. Ahmed, S.; Fatema Tuj, Z.; Mahdi, M.M.; Nurnabi, M.; Alam, M.Z.; Choudhury, T.R. Health risk assessment for heavy metal accumulation in leafy vegetables grown on tannery effluent contaminated soil. Toxicol Rep 2022, 9, 346–355. [Google Scholar] [CrossRef] [PubMed]
  2. Manoj, S.R.; Karthik, C.; Kadirvelu, K.; Arulselvi, P.I.; Shanmugasundaram, T.; Bruno, B.; Rajkumar, M. Understanding the molecular mechanisms for the enhanced phytoremediation of heavy metals through plant growth promoting rhizobacteria: A review. J Environ Manage 2020, 254, 109779. [Google Scholar] [CrossRef] [PubMed]
  3. Aftab, K.; Iqbal, S.; Khan, M.R.; Busquets, R.; Noreen, R.; Ahmad, N.; Kazimi, S.G.T.; Karami, A.M.; Al Suliman, N.M.S.; Ouladsmane, M. Wastewater-Irrigated Vegetables Are a Significant Source of Heavy Metal Contaminants: Toxicity and Health Risks. Molecules 2023, 28. [Google Scholar] [CrossRef] [PubMed]
  4. Wang, Z.; Bao, J.; Wang, T.; Moryani, H.T.; Kang, W.; Zheng, J.; Zhan, C.; Xiao, W. Hazardous Heavy Metals Accumulation and Health Risk Assessment of Different Vegetable Species in Contaminated Soils from a Typical Mining City, Central China. Int J Environ Res Public Health 2021, 18. [Google Scholar] [CrossRef]
  5. Parvez, M.S.; Nawshin, S.; Sultana, S.; Hossain, M.S.; Rashid Khan, M.H.; Habib, M.A.; Nijhum, Z.T.; Khan, R. Evaluation of Heavy Metal Contamination in Soil Samples around Rampal, Bangladesh. ACS omega 2023. [Google Scholar] [CrossRef]
  6. Mawari, G.; Kumar, N.; Sarkar, S.; Daga, M.K.; Singh, M.M.; Joshi, T.K.; Khan, N.A. Heavy Metal Accumulation in Fruits and Vegetables and Human Health Risk Assessment: Findings From Maharashtra, India. Environ Health Insights 2022, 16, 11786302221119151. [Google Scholar] [CrossRef]
  7. Lemessa, F.; Simane, B.; Seyoum, A.; Gebresenbet, G. Analysis of the concentration of heavy metals in soil, vegetables and water around the bole Lemi industry park, Ethiopia. Heliyon 2022, 8, e12429. [Google Scholar] [CrossRef]
  8. Ali, F.; Israr, M.; Ur Rehman, S.; Azizullah, A.; Gulab, H.; Idrees, M.; Iqbal, R.; Khattak, A.; Hussain, M.; Al-Zuaibr, F.M. Health risk assessment of heavy metals via consumption of dietary vegetables using wastewater for irrigation in Swabi, Khyber Pakhtunkhwa, Pakistan. PLoS One 2021, 16, e0255853. [Google Scholar] [CrossRef]
  9. Islam, M.S.; Ahmed, M.K.; Habibullah-Al-Mamun, M.; Raknuzzaman, M.; Ali, M.M.; Eaton, D.W. Health risk assessment due to heavy metal exposure from commonly consumed fish and vegetables. Environment systems and decisions 2016, 36, 253–265. [Google Scholar] [CrossRef]
  10. Crimmins, A.; Kolian, M.; Bacanskas, L.; Rosseel, K. Climate Change Indicators in the United States 2016. 2016.
  11. Kędzierska-Kapuza, K.; Szczuko, U.; Stolińska, H.; Bakaloudi, D.R.; Wierzba, W.; Szczuko, M. Demand for Water-Soluble Vitamins in a Group of Patients with CKD versus Interventions and Supplementation-A Systematic Review. Nutrients 2023, 15. [Google Scholar] [CrossRef]
  12. Ofoedu, C.E.; Iwouno, J.O.; Ofoedu, E.O.; Ogueke, C.C.; Igwe, V.S.; Agunwah, I.M.; Ofoedum, A.F.; Chacha, J.S.; Muobike, O.P.; Agunbiade, A.O.; et al. Revisiting food-sourced vitamins for consumer diet and health needs: a perspective review, from vitamin classification, metabolic functions, absorption, utilization, to balancing nutritional requirements. PeerJ 2021, 9, e11940. [Google Scholar] [CrossRef] [PubMed]
  13. Mukherjee, P.K.; Singha, S.; Kar, A.; Chanda, J.; Banerjee, S.; Dasgupta, B.; Haldar, P.K.; Sharma, N. Therapeutic importance of Cucurbitaceae: A medicinally important family. J Ethnopharmacol 2022, 282, 114599. [Google Scholar] [CrossRef] [PubMed]
  14. Canton, H. Food and agriculture organization of the United Nations—FAO. In The Europa directory of international organizations 2021, Routledge, 2021; pp 297-305. [CrossRef]
  15. Gao, J.; Zhang, D.; Proshad, R.; Uwiringiyimana, E.; Wang, Z. Assessment of the pollution levels of potential toxic elements in urban vegetable gardens in southwest China. Sci Rep 2021, 11, 22824. [Google Scholar] [CrossRef]
  16. Lego, B.; Deskins, J.; Bowen, E.; Mullett, D.; Farnum, A.; Gilyard, S.; Kaminski, D.; Wagstaff, W. West Virginia Economic Outlook: 2020-2024. 2019.
  17. Murphy, B.P. Identification of Mined Areas that may Contribute to Water Quality Degradation at Hobet Coal Mine, West Virginia. IdeaFest: Interdisciplinary Journal of Creative Works and Research from Cal Poly Humboldt 2019, 3, 10. [Google Scholar]
  18. Aken, B.V.; Quaranta, J.D.; Mack, B.; Yu, H.; Ducatman, A.M.; Ziemkiewicz, P.F. Environmental contaminants in coal slurry intended for underground injection in the state of West Virginia. Journal of Environmental Engineering 2015, 141, 05014004. [Google Scholar] [CrossRef]
  19. Holmgren, G.; Meyer, M.; Chaney, R.; Daniels, R. Cadmium, lead, zinc, copper, and nickel in agricultural soils of the United States of America; Wiley Online Library, 1993.
  20. Ergin, M.; Saydam, C.; Baştürk, Ö.; Erdem, E.; Yörük, R. Heavy metal concentrations in surface sediments from the two coastal inlets (Golden Horn Estuary and Izmit Bay) of the northeastern Sea of Marmara. Chemical geology 1991, 91, 269–285. [Google Scholar] [CrossRef]
  21. Rezapour, S.; Siavash Moghaddam, S.; Nouri, A.; Khosravi Aqdam, K. Urbanization influences the distribution, enrichment, and ecological health risk of heavy metals in croplands. Scientific Reports 2022, 12, 3868. [Google Scholar] [CrossRef]
  22. Muller, G. Index of geoaccumulation in sediments of the Rhine River. Geojournal 1969, 2, 108–118. [Google Scholar]
  23. Antoniadis, V.; Golia, E.E.; Liu, Y.T.; Wang, S.L.; Shaheen, S.M.; Rinklebe, J. Soil and maize contamination by trace elements and associated health risk assessment in the industrial area of Volos, Greece. Environ Int 2019, 124, 79–88. [Google Scholar] [CrossRef]
  24. Rinklebe, J.; Antoniadis, V.; Shaheen, S.M.; Rosche, O.; Altermann, M. Health risk assessment of potentially toxic elements in soils along the Central Elbe River, Germany. Environ Int 2019, 126, 76–88. [Google Scholar] [CrossRef]
  25. Tomlinson, D.; Wilson, J.; Harris, C.; Jeffrey, D. Problems in the assessment of heavy-metal levels in estuaries and the formation of a pollution index. Helgoländer meeresuntersuchungen 1980, 33, 566–575. [Google Scholar] [CrossRef]
  26. Gebeyehu, H.R.; Bayissa, L.D. Levels of heavy metals in soil and vegetables and associated health risks in Mojo area, Ethiopia. PLoS One 2020, 15, e0227883. [Google Scholar] [CrossRef] [PubMed]
  27. Shaheen, N.; Ahmed, M.K.; Islam, M.S.; Habibullah-Al-Mamun, M.; Tukun, A.B.; Islam, S.; AT, M.A.R. Health risk assessment of trace elements via dietary intake of 'non-piscine protein source' foodstuffs (meat, milk and egg) in Bangladesh. Environ Sci Pollut Res Int 2016, 23, 7794–7806. [Google Scholar] [CrossRef] [PubMed]
  28. Sharma, S.; Nagpal, A.K.; Kaur, I. Heavy metal contamination in soil, food crops and associated health risks for residents of Ropar wetland, Punjab, India and its environs. Food Chem 2018, 255, 15–22. [Google Scholar] [CrossRef]
  29. Kamunda, C.; Mathuthu, M.; Madhuku, M. Health Risk Assessment of Heavy Metals in Soils from Witwatersrand Gold Mining Basin, South Africa. Int J Environ Res Public Health 2016, 13. [Google Scholar] [CrossRef]
  30. Li, G.; Kronzucker, H.J.; Shi, W. Root developmental adaptation to Fe toxicity: mechanisms and management. Plant signaling & behavior 2016, 11, e1117722. [Google Scholar] [CrossRef]
  31. Hansen, C.T.; Kleint, C.; Böhnke, S.; Klose, L.; Adam-Beyer, N.; Sass, K.; Zitoun, R.; Sander, S.G.; Indenbirken, D.; Dittmar, T. Impact of high Fe-concentrations on microbial community structure and dissolved organics in hydrothermal plumes: an experimental study. Scientific Reports 2022, 12, 20723. [Google Scholar] [CrossRef]
  32. Akhtar, S.; Luqman, M.; Farooq Awan, M.U.; Saba, I.; Khan, Z.I.; Ahmad, K.; Muneeb, A.; Nadeem, M.; Batool, A.I.; Shahzadi, M. Health risk implications of iron in wastewater soil-food crops grown in the vicinity of peri urban areas of the District Sargodha. Plos one 2022, 17, e0275497. [Google Scholar] [CrossRef]
  33. Ljung, K.; Otabbong, E.; Selinus, O. Natural and anthropogenic metal inputs to soils in urban Uppsala, Sweden. Environmental Geochemistry & Health 2006, 28. [Google Scholar] [CrossRef]
  34. Uddin, M.M.; Zakeel, M.C.M.; Zavahir, J.S.; Marikar, F.M.; Jahan, I. Heavy metal accumulation in rice and aquatic plants used as human food: A general review. Toxics 2021, 9, 360. [Google Scholar] [CrossRef]
  35. Toth, T.; Tomáš, J.; Lazor, P.; Bajčan, D.; Jomová, K. The transfer of heavy metals from contaminated soils into agricultural plants in High Tatras region. Czech J. Food Sci 2009, 27, 390–393. [Google Scholar] [CrossRef]
  36. Yan, A.; Wang, Y.; Tan, S.N.; Mohd Yusof, M.L.; Ghosh, S.; Chen, Z. Phytoremediation: a promising approach for revegetation of heavy metal-polluted land. Frontiers in Plant Science 2020, 11, 359. [Google Scholar] [CrossRef] [PubMed]
  37. Chaoua, S.; Boussaa, S.; El Gharmali, A.; Boumezzough, A. Impact of irrigation with wastewater on accumulation of heavy metals in soil and crops in the region of Marrakech in Morocco. Journal of the Saudi Society of Agricultural Sciences 2019, 18, 429–436. [Google Scholar] [CrossRef]
  38. Štofejová, L.; Fazekaš, J.; Fazekašová, D. Analysis of heavy metal content in soil and plants in the dumping ground of Magnesite Mining Factory Jelšava-Lubeník (Slovakia). Sustainability 2021, 13, 4508. [Google Scholar] [CrossRef]
  39. El Behairy, R.A.; El Baroudy, A.A.; Ibrahim, M.M.; Mohamed, E.S.; Rebouh, N.Y.; Shokr, M.S. Combination of GIS and Multivariate Analysis to Assess the Soil Heavy Metal Contamination in Some Arid Zones. Agronomy 2022, 12, 2871. [Google Scholar] [CrossRef]
  40. Proshad, R.; Islam, S.; Tusher, T.R.; Zhang, D.; Khadka, S.; Gao, J.; Kundu, S. Appraisal of heavy metal toxicity in surface water with human health risk by a novel approach: a study on an urban river in vicinity to industrial areas of Bangladesh. Toxin reviews 2021, 40, 803–819. [Google Scholar] [CrossRef]
  41. Iyama, W.A.; Okpara, K.; Techato, K. Assessment of heavy metals in agricultural soils and plant (Vernonia amygdalina Delile) in port harcourt metropolis, Nigeria. Agriculture 2021, 12, 27. [Google Scholar] [CrossRef]
  42. Röllin, H.B.; Nogueira, C. Manganese: Environmental pollution and health effects. Encyclopedia of environmental health 2011, 2, 229–242. [Google Scholar]
  43. Sharafi, K.; Mansouri, B.; Omer, A.K.; Bashardoust, P.; Ebrahimzadeh, G.; Sharifi, S.; Massahi, T.; Soleimani, H. Investigation of health risk assessment and the effect of various irrigation water on the accumulation of toxic metals in the most widely consumed vegetables in Iran. Scientific Reports 2022, 12, 20806. [Google Scholar] [CrossRef]
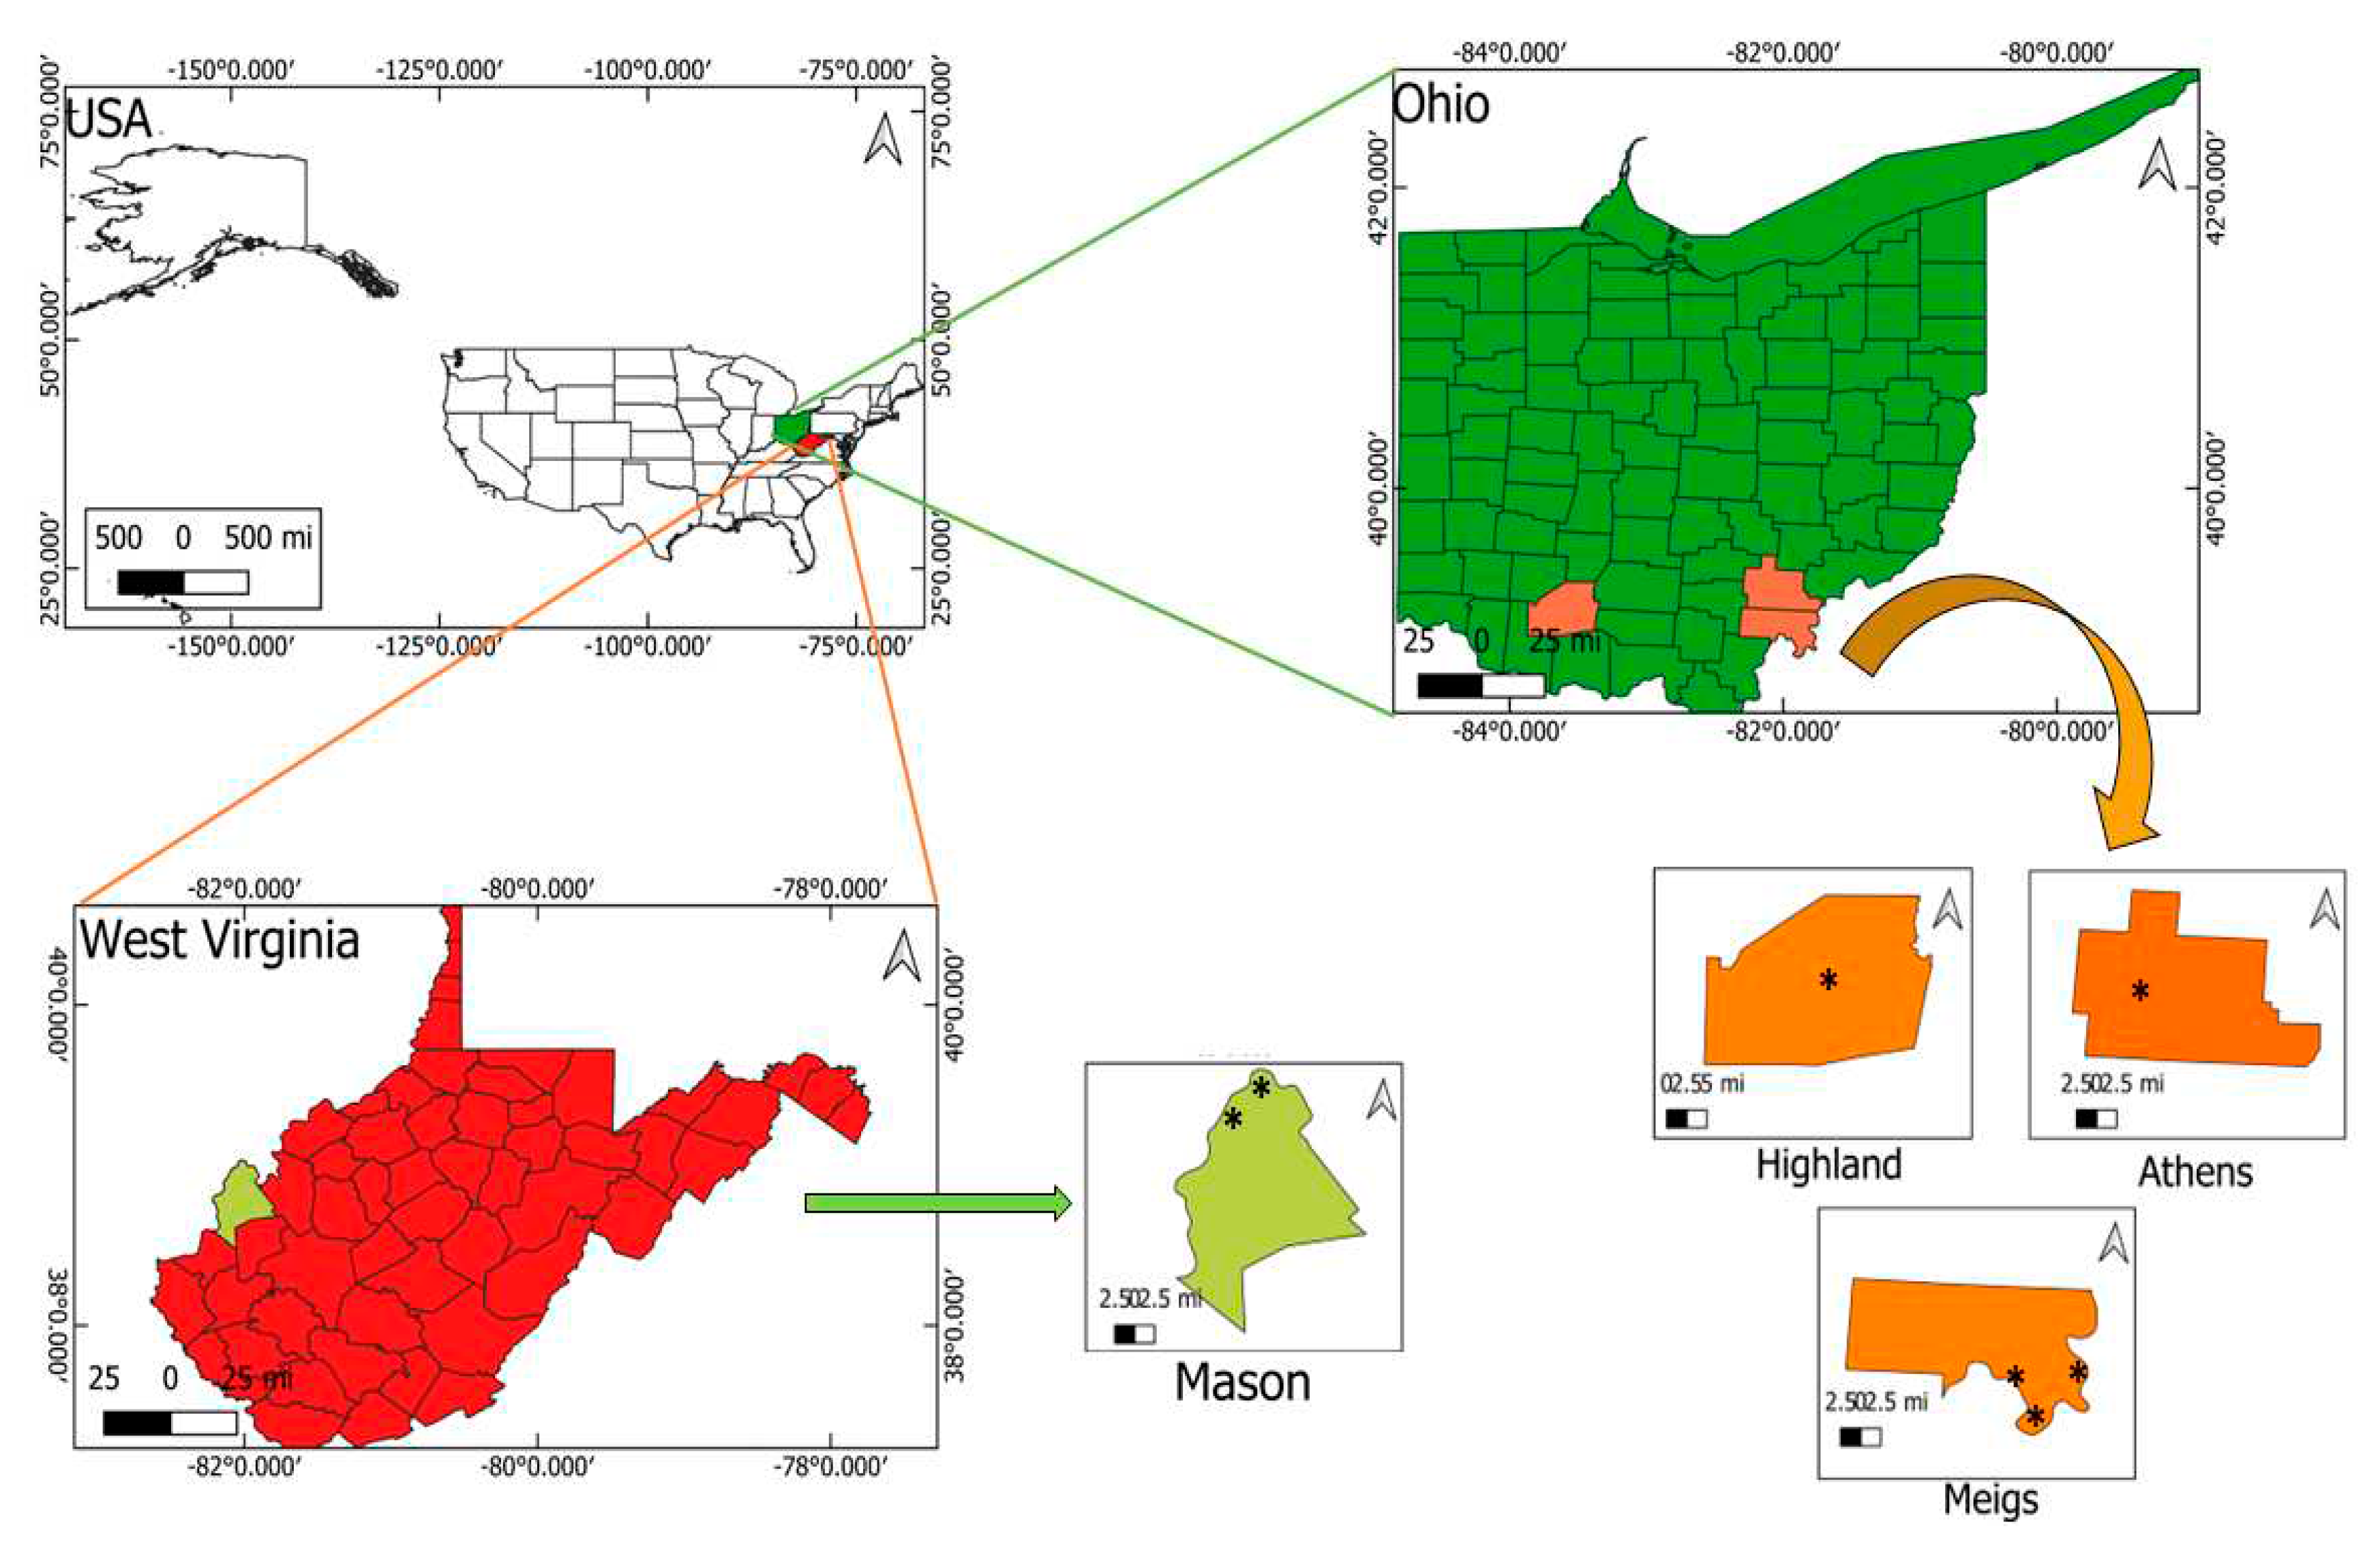
Figure 1. Map of the sampling sites.
Preprints 79060 g001
Figure 2. Pollution indicator analysis: A) CF of HMs, B) PLI of the study area, and C) TF of HMs in vegetables. The black dash indicates the HM contamination range of the soil.
Preprints 79060 g002
Figure 3. Identification of HM dynamics and sources: A) Correlation plot analysis *P< 0.05, **P< 0.01, and ***P< 0.001, B) PCA and C) hierarchical cluster analysis.
Preprints 79060 g003
Figure 4. Carcinogenic health risks assessment of HMs from the consumption of cucurbit fruit and vegetables. CR and TCR of A) adults and B) children from different vegetables.
Preprints 79060 g004
Table 1. HM concentrations from the sampled soils.
Sampling location HM concentrations (g/kg)
Cd (µg/g) Cu Fe Mn Ni Zn
RS1 0.397c 0.027b 39.96c 1.39c 0.036ab 0.114c
RS2 0.250d 0.02b 28.41d 0.737d 0.019c 0.097cd
RS3 2.91a 0.043a 37.29c 1.02d 0.03b 0.234a
RS4 0.257d 0.024b 28.41d 0.7d 0.018b 0.097cd
RS5 0.295d 0.021b 30.13d 1.01d 0.022bc 0.102c
RS6 0.992b 0.04a 52.89b 1.54b 0.044a 0.17b
RS7 0.134f 0.016bc 29.34d 0.57f 0.019c 0.064e
NM1 0.17e 0.022b 38.74c 0.5f 0.029b 0.09cd
NM2 0.17e 0.022b 39.57c 0.57f 0.028b 0.079d
MS1 0.205de 0.023b 34.88cd 0.83de 0.028b 0.095cd
MS2 0.189d 0.043a 67.36a 0.42f 0.03b 0.119c
MS3 0.203de 0.021b 30.66d 1.28cd 0.026b 0.087d
HI 0.166e 0.017bc 40.31c 1.86a 0.023bc 0.081d
Mean 0.487 0.026 38.32 0.959 0.027 0.11
Median 0.205 0.022 37.29 0.83 0.028 0.097
Mode 0.17 0.022 28.41 0.57 0.028 0.097
SD 0.761 0.009 11.08 0.44 0.007 0.045
Note: Superscripts show differences P < 0.05 level.
Table 2. EF and Igeo analysis in various agricultural fields.
Sampling location EF Igeo
Cd Cu Fe Mn Ni Zn Cd Cu Fe Mn Ni Zn
RS1 0.257 0.533 4.125 1.641 0.431 0.748 -10.88 -0.146 1.413 0.890 -1.038 -0.395
RS2 0.151 0.365 2.766 0.812 0.206 0.594 -11.55 -0.592 0.936 -0.0252 -2.003 -0.628
RS3 0.481 0.453 2.041 0.638 0.190 0.814 -8.480 0.536 1.313 0.443 -1.302 0.641
RS4 0.141 0.400 2.489 0.706 0.183 0.539 -11.51 -0.321 0.922 -0.089 -2.035 -0.628
RS5 0.127 0.283 2.076 0.796 0.156 0.446 -11.31 -0.473 1.006 0.429 -1.711 -0.556
RS6 0.372 0.461 3.160 1.052 0.300 0.645 -9.562 0.432 1.818 1.037 -0.769 0.180
RS7 0.051 0.189 1.785 0.400 0.137 0.247 -12.45 -0.880 0.967 -0.380 -1.928 -1.228
NM1 0.053 0.210 1.910 0.282 0.163 0.282 -12.10 -0.421 1.368 -0.584 -1.375 -0.736
NM2 0.056 0.224 2.106 0.347 0.171 0.267 -12.10 -0.440 1.399 -0.395 -1.416 -0.925
MS1 0.090 0.317 2.439 0.664 0.224 0.422 -11.83 -0.334 1.217 0.146 -1.421 -0.658
MS2 0.057 0.403 3.253 0.249 0.170 0.365 -11.95 0.545 2.166 -0.730 -1.279 -0.334
MS3 0.080 0.258 1.930 0.922 0.191 0.348 -11.85 -0.480 1.031 0.771 -1.495 -0.785
HI 0.057 0.183 2.216 1.170 0.144 0.283 -12.14 -0.777 1.426 1.310 -1.705 -0.888
Table 3. Concentrations of HMs in fruit and vegetable samples.
Sampling location HM concentrations (g/kg)
Cd (µg/g) Cu Fe Mn Ni Zn
RS1-W 0.047d 8.5d 80.19de 11.39d 1.05d 22.46cd
RS2-S 0.061c 6e 101.26c 34.31a 1.12d 28.92c
RS3-Z 0.098b 16.04a 160.07b 20.4c 1.4cd 50.21a
RS4-C 0.152a 10.14c 104.02c 16.28cd 1.65c 38.11b
RS5-P 0.031e 7.1e 73.07e 22.4c 0.8e 22.97cd
RS6-P 0.022ef 11.12bc 90.19d 28.0b 2.1b 33.2bc
RS7-P 0.037de 10.18c 90.02d 37.3a 1.8bc 47.3ab
NM1-S 0.035de 6.14e 61.11ef 17.62c 1.12d 20.49d
NM2-P 0.043d 8.33d 100.19c 26.45b 1.4cd 25.82c
MS1-W 0.027e 10.21c 77.8e 11.05d 1.06d 21.88cd
MS2-Z 0.152a 9.07cd 176a 31.09ab 3a 53.16a
MS3-P 0.025e 13.05b 88.14d 20.01c 1.8bc 35.7b
HI-C 0.09b 10c 108.09c 28.31b 1.4cd 38.3b
Mean 0.063 9.684 100.7 23.43 1.515 33.73
Median 0.043 10 90.6 22.4 1 33.2
Mode 0.152 10 - 11 1 22
SD 0.045 2.75 32.78 8.207 0.673 11.59
Note: Superscripts show differences P < 0.05 level. W – watermelon, S – squash, Z – zucchini, C – cucumber, and P – pumpkin.
Disclaimer/Publisher’s Note: The statements, opinions and data contained in all publications are solely those of the individual author(s) and contributor(s) and not of MDPI and/or the editor(s). MDPI and/or the editor(s) disclaim responsibility for any injury to people or property resulting from any ideas, methods, instructions or products referred to in the content.
Copyright: This open access article is published under a Creative Commons CC BY 4.0 license, which permit the free download, distribution, and reuse, provided that the author and preprint are cited in any reuse.
Prerpints.org logo

Preprints.org is a free preprint server supported by MDPI in Basel, Switzerland.

Subscribe

© 2024 MDPI (Basel, Switzerland) unless otherwise stated