1. Introduction
The tendency differs among nations, but the number of traffic deaths has been continuously rising worldwide. According to the World Health Organization's 2013 international road safety report, 1.24 million people per year die in road traffic incidents globally [
1]. This estimate has climbed to 1.35 million worldwide fatalities annually, or over 3,700 deaths each day, according to a further report that was released five years later [
2]. Moreover, in 2018 a 3% rise in the number of traffic fatalities in Germany compared to 2017 has been estimated, with 3,275 fatalities in total [
3]. Human factor remains the the main cause of most of the accidents. According to one research, human factors account for 90–95 percent of all accident incidences, with around 60 percent of those accidents directly attributable to human mistake [
4]. The human factor is viewed as an ever-important factor by the mobility and transportation sectors for increased traffic safety and decreased crash rates. Road traffic accidents and emissions cannot be successfully reduced despite better infrastructure, better vehicle design, and enhanced road communications. The various automated features of cars in today's commercial sector reflect the rapid advancement of autonomous vehicle (AV) technology in recent years [
5]. The human factor is viewed as an ever-important factor by the mobility and transportation sectors for increased traffic safety and decreased crash rates. Road traffic accidents and emissions cannot be successfully reduced despite better infrastructure, better vehicle design, and enhanced road communications. The various automated features of cars in today's commercial sector reflect the rapid advancement of autonomous vehicle (AV) technology in recent year [6, 7]. Manufacturers and experts claim that the AV guarantees greater user ease and safety for humans on numerous instances [
8]. AVs are expected to reduce traffic accidents because human error is the primary cause of most of them [
5]. Additionally, AVs provide increased road capacity, environmental friendliness, and congestion reduction [
9] By enabling platoon building, vehicle-to-vehicle (V2V), and vehicle-to-infrastructure (V2I) communications, the highway may be made more comfortable by, among other things, decreasing the number of vehicle stops at junctions [
10].
Cooperative adaptive cruise control (CACC) and adaptive cruise control (ACC) are two technologies that the auto industry considers to be very crucial and that must be used in the initial stages of developing autonomous driving and connected vehicles. It directly affects how travel experiences are. The behavior of AVs and CAVs may be successfully represented using ACC and CACC logic, respectively [
7]. Microscopic traffic simulations may be utilized with a little bit of expertise to perceive the intermediate and final phases of introduction of automation on the street with conventional cars to comprehend the impacts of AV and CAV in the present transportation system prior to real-world deployment. Effective modeling techniques are needed to assess the effects of these significant changes [7, 11]. The driving behavior settings in any traffic simulator also play crucial roles in how accurately the simulation models reflect reality. One of the numerous benefits of CAVs is that they communicate and share information with other entities, such as other cars, infrastructure, or traffic systems, which reduces response times and shortens safety headways as compared to human-driven vehicles. The capacity of the road is increased when there is little space between two subsequent road agents. Other benefits, including interacting with infrastructures to get early warnings of accidents, traffic, or natural disasters, are essential to making optimum use of travel time. To understand the influence on the actual world, these behaviors must be replicated in the simulation model [
7]. According to research in the past, it is predicted that C/AVs will improve traffic performance while reducing emissions and energy use [7, 12].
This study is predicated on the idea that autonomous cars would behave similarly to human-driven automobiles. The characteristics of driving behavior for connected and/or autonomous vehicles (C/AVs) need to be determined according to distinct driving modules, such as aggressive, normal, and safe [
13], reflecting three different human driving patterns makes it more human-like than other C/AVs. illustrating three different types of human driving behaviorVehicles will decide which parameters to follow from their permissible range in accordance with their regulating driving modules. Direct user selection of these driving modules is also possible through external connections, such as vehicle-to-vehicle (V2V), vehicle-to-infrastructure (V2I), and emergency states. These modules exhibit wildly disparate responses to roads and traffic. A safe driving module is not permitted to drop the safe distance below the authorized limits, however an aggressive driving module may have a smaller safe distance with increased acceleration, resulting in C/AVs that resemble humans [
13,
14,
15].
The research findings show how traffic, and safety aspects are influenced by C/AVs that resemble humans. Additionally, it will use a sensitivity analysis platform to visualize how various AV driving behavior parameters interact with traffic performance. Speed, delay time, and travel time have all been used to examine traffic performance. For these types of studies, PTV VISSIM and Surrogate Safety Assessment Model (SSAM) must work together to identify the number of potential conflicts from the simulated data and vehicle trajectories to understand the safety implications of C/AVs. The primary goal of this thesis is to examine how human-like C/AVs will affect mixed traffic in an urban corridor. The HV-AV-CAV ratio for three different traffic flows: peak hour traffic demand, 20% below peak hour traffic demand, and 20% above peak hour traffic demand will be examined to achieve this goal. Three different driving modules: aggressive, normal, and safe will be tested for C/AV. The second goal is to investigate how the AVs' driving behavior parameters interact with traffic performance.
The following research questions will be investigated within the framework of this study:
How will the gradual substitution of HVs with CAVs affect traffic, and safety concerns in urban environment?
What AV driving behavior factors noticeably impact traffic performance?
2. Literature Review
Both the urban motorway and the freeway benefit greatly from automation features like connectivity to other vehicles and infrastructure, emergency stop, formation of vehicle platoons, slowing down before traffic signal, and automatic driving modules [
16]. Researchers showed that in the initial stages of implementation, C/AVs should be self-driven and self-sufficient as adaptive infrastructure development will take some time to fully absorbe connectivity features [
17]. In such an early phase of development and implementation, autonomous vehicle (AV) will be ahead of connected autonomous vehicle (CAV) in terms of functionalities.
Different functions (event script files) are currently attached in the simulator to implement these C/AV features in the microscopic simulation. There are many functionalities in VISSIM 11 or later versions to explore the C/AVs [
13]. Platoon building, signal influence, V2V, and V2I connectivity are all included in VISSIM 2020 and are implemented both universally (using GUI) and exclusively (using COM) [13, 15, 18]. The Wiedermann 74 does not provide many options for customized modeling, so the standard method for modeling C/AVs can be to build modified versions of the Wiedermann 99 [
13]. In other words, the C/AVs that resemble humans are a subset of traditional driving behaviors and can be acquired with the right legal framework to correspond with various autonomous driving modules. In order to improve the automation features in the VISSIM interface, some extensively created simulator-integral and user-defined parameters are completely dedicated to match the characteristics of AV and CAV [8, 13–15, 19]. Additionally, numerous C/AV features are modeled using external script files. The calibration and validation are integral part in the microscopic traffic simulation to make realistics simulation. The one of the major challenges in the connected and/ or autonomous vehicle (C/AVs) is, there is lack of measure of effectiveness from real world to do the calibration. It is also difficult to find set of calibration parameters which matches the modeling and simulation technique for the C/AVs [13, 20, 21]. Time to time traffic performance and safety proved to be great indicator for optemistics research studies focusing C/AVs [
22]. There is also emission as indicator in many studies, but the emission calculation significantly varies over years, based on individual softwares and calculation techniques.
In summary, research methods and simulation process of autonomous vehicles differ on car following behaviours, lane changing behaviours, calibration methods and planned performance indicators etc. As lack of real-world data, autonomous vehicles are difficult to calibrate and behaviours are also unpredictable, so it is safe to consider it as human alike driving maneuvers.
3. Method
The C/AV offers a chance to enhance travel experience by the cooperation and connectivity of autonomous system. The following vehicle behaviors must be monitored to simulate such technologies in the microscopic traffic simulation: acceleration-deceleration, longitudinal, lateral, and lane gap acceptance behaviors. As CAVs can move closer together, the traffic flow can be denser, which increases capacity. The current traffic flow can be significantly influenced by special driving behaviors, CAV connectivity, and improved infrastructures (Atkins 2016). In the miniature traffic simulator, the connected and/or autonomous vehicles use their own driving modules. The three main autonomous vehicle driving modules that are currently on the research phase are examined in this study. Aggressive, safe, and cautious are the names given to the driving modules. Autonomous vehicle behaviour experts listed and derived these behaviours in several studies (Lu et al. 2021). For this study, Autnomous Level is considered as 5 as per Society of Automotive Engineers [23, 24] to see the best result in terms of autonomous communication and self-sufficent actions.
Researchers indicated These can solely and exclusively be started from the Wiedemann 99 car-following model. The driving courses taken for this study were modeled after the "CoExist" project, which was funded by Horizon 2020 (Sukennik 2018).
Aggressive: The cognizance, predictive, and safety maintenance features of the C/AVs' driving module are thought to result in smaller gaps for all types of network maneuvers. The road capacity is increased by this driving module (Sukennik 2018, Lu et al. 2021).
Safe: The C/AVs' safe driving module responds more like a human driver with additional skills and features. The ability to measure the speeds and spatial distances of other vehicles up to a certain range is one of the features (Sukennik 2018, Lu et al. 2021).
Cautious: The cautious driving module is the ideal road code follower because it consistently acts safely around all vehicles. According to Sukennik (2018), Brick wall stop distance is always guaranteed by the cautious driving module.
These C/AV features are imposed in microscopic traffic flow simulation by a separate function. This function is implemented by the VISSIM interface by requiring an absolute braking distance. This module also could perform lane change maneuvers and act in unsignalized intersections. To keep wide gaps in the road, the vehicles will be taken care of (Sukennik 2018).
Table 1 shows additional setting for the C/AVs in the PTV VISSIM interface.
To model a new vehicle model in the simulator, various microscopic traffic simulators offer various features. There are many features and a methodology to create C/AVs in the interface with the Wiedermann 99 of VISSIM. The parameters that have been adjusted to fit the driving modules of C/AVs are shown in
Table 2, along with several parameters specifically chosen for the C/AVs that were selected for this study.
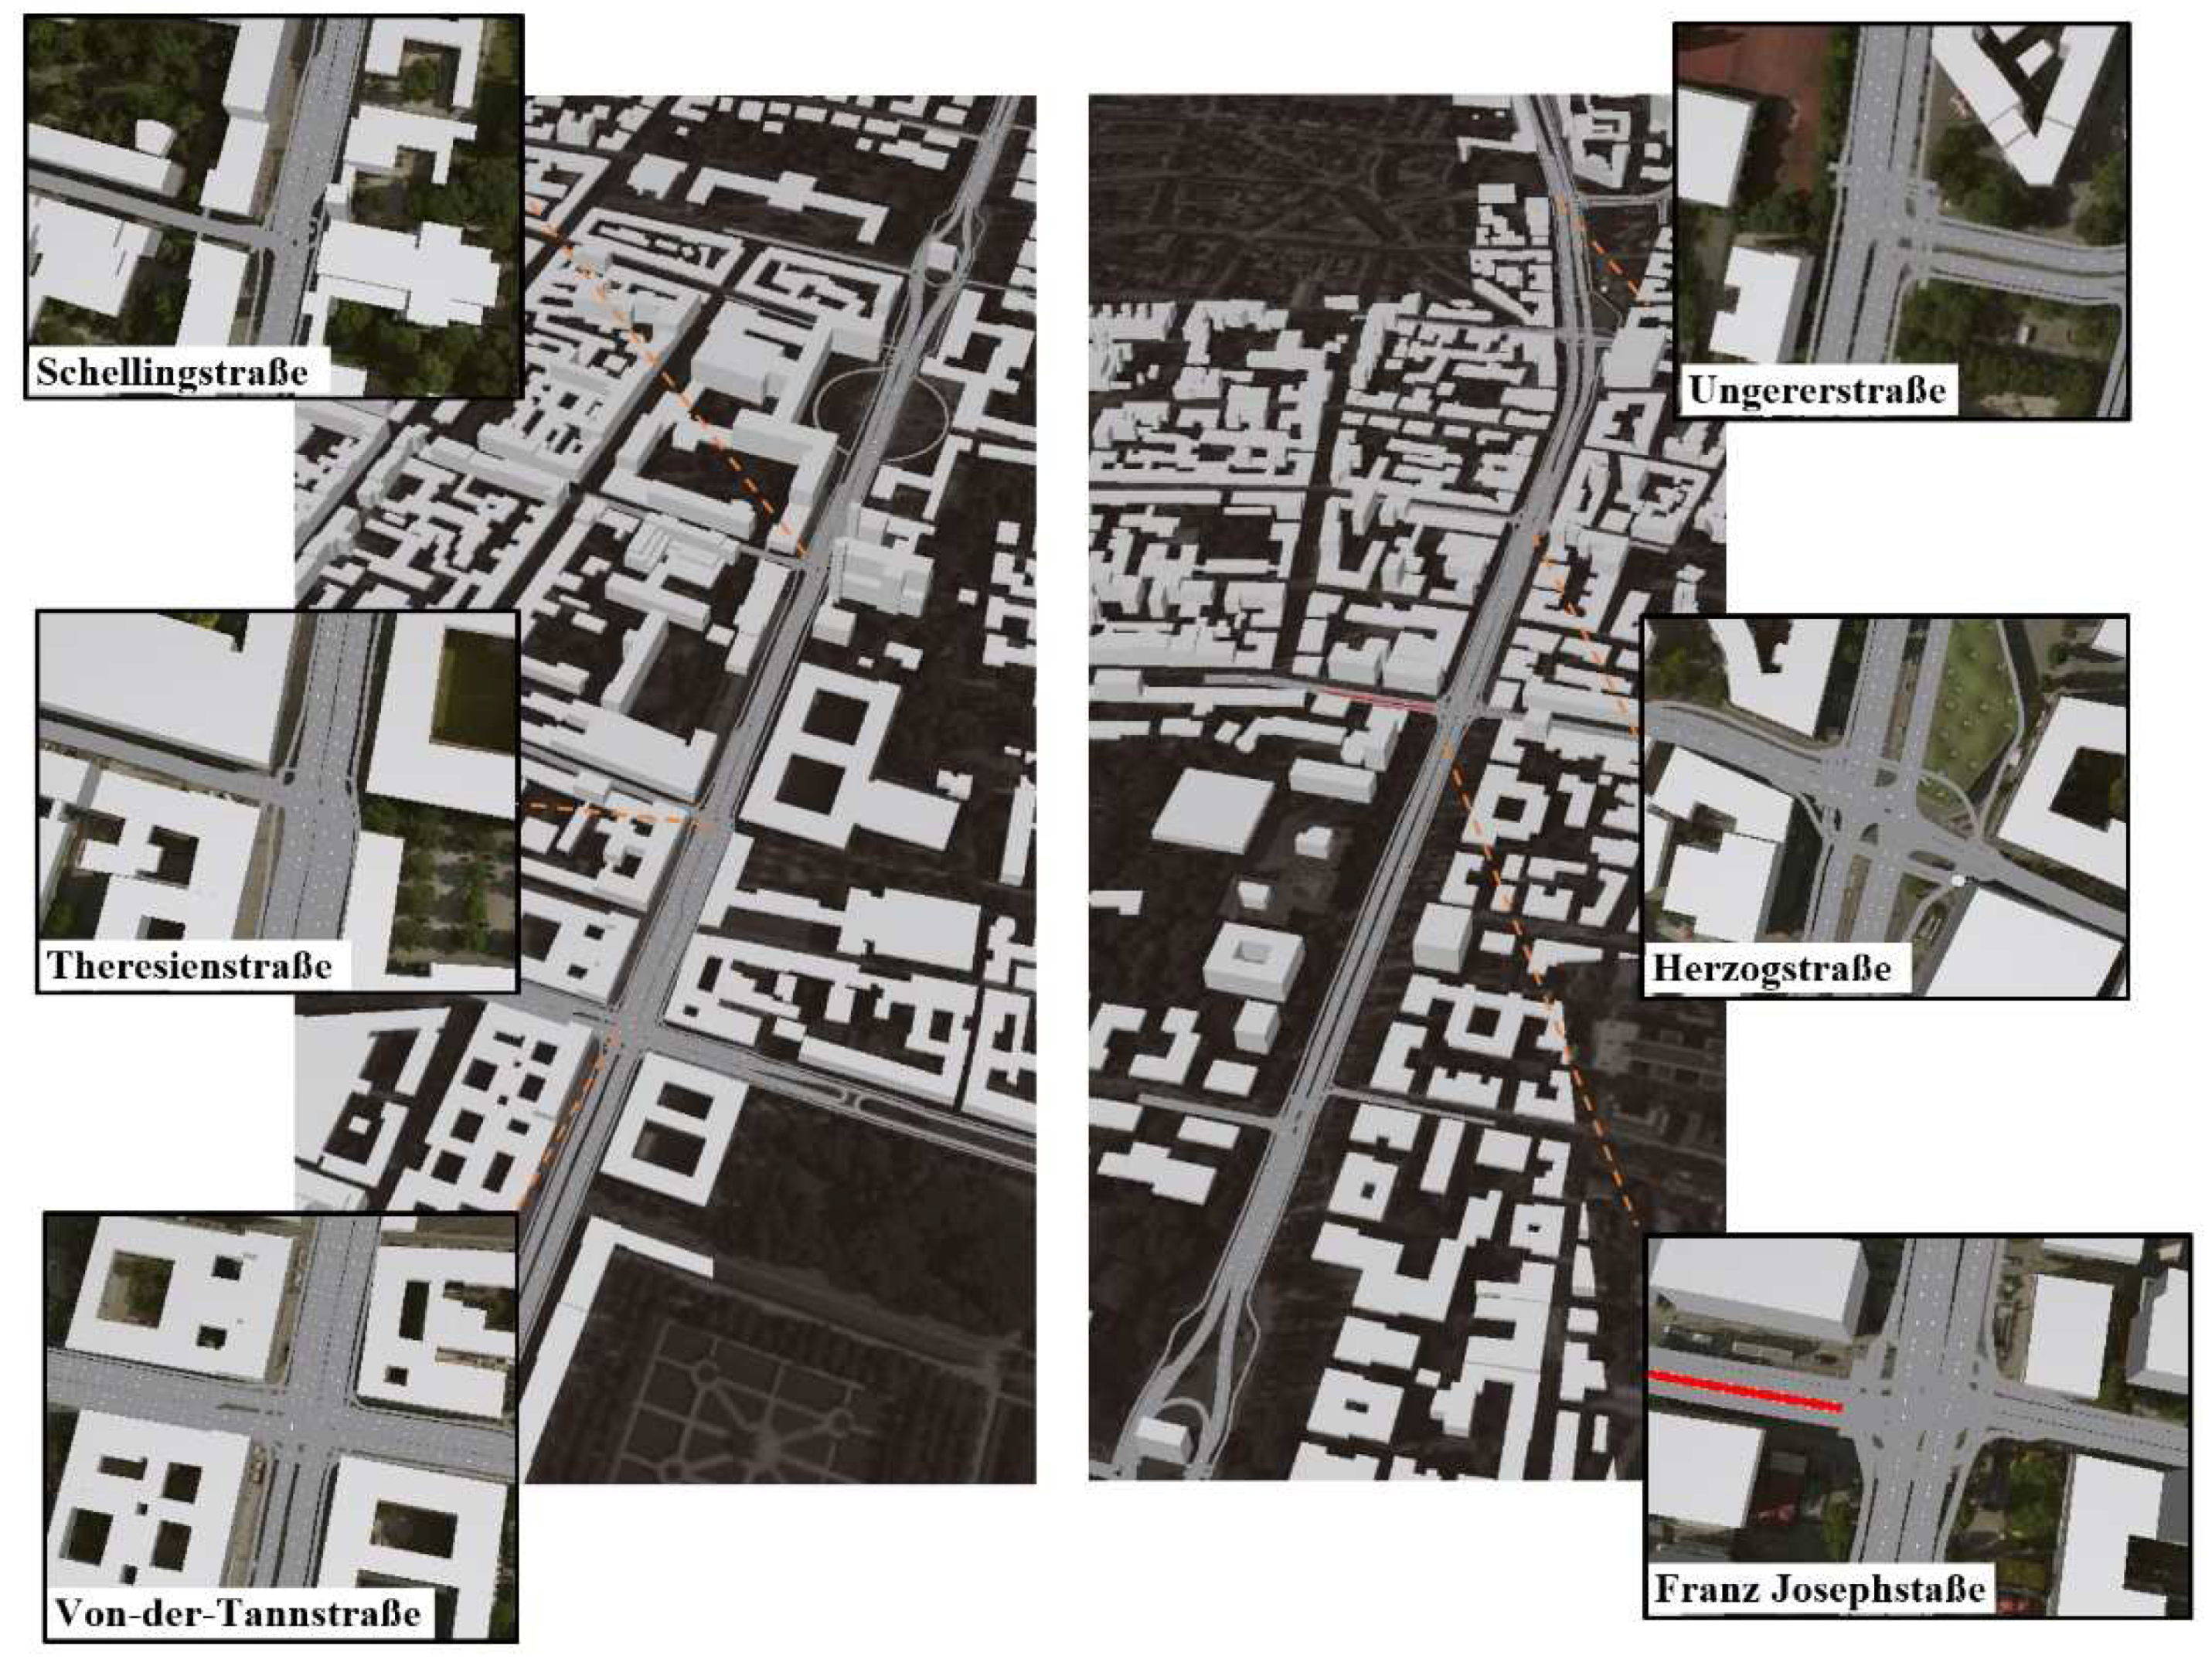
Figure 1 shows the study area which hold different sets of intersection, signs, and traffic signals to allow different manuovers possibilities by autonomous vehicle agents in the simulation. At this moment, this 3 km corridor from Munich, Ludwigstraße and Leopoldstraße urban strip, holds some great number of conflictions and detoriated road performances: higher number of stops, reduced average speed, higher travel time, higher possibility of confliction. After implementation of Autonomous technology, the site should show distinguishable results.
The research region, which includes Munich's Ludwigstraße and Leopoldstraße road axes, is a congested area with various factors that reduce traffic flow, including lane merging points, mobility hubs, and feeder side streams with increased traffic flow. Every trial situation for this area has been evaluated for this research's traffic, and safety issues, and potential reasons have been shown.
In this study, traffic performance and safety are performance indicator to measure the impact of adding human alike connected and/or autonomous vehicles in the current transportation system. The average travel time, average speed, and average delay time described the traffic performance indicator. Post-encroachment time (PET) and Time-to-collision (TTC) are used to measure the total number of conflictions. The Surrogate Safety Measure (SSM) is used to evaluate the traffic safety. The PET indicates the possible risk and the TTC describes the impending threat.
This section may be divided by subheadings. It should provide a concise and precise description of the experimental results, their interpretation, as well as the experimental conclusions that can be drawn.
3.1. Assumptions
This study assumes that the C/AVs won't be powered by a centralized processing system, meaning that each agent will be unique and respond in accordance with the state of the network. The observation and responses of other nearby vehicles will provide the vehicles with information. The network state of the entire city will not have any influence. In this study, the central traffic control system is also not included to match the human-driven vehicles and distinguish agent-based responses. Due to a lack of infrastructure (such as detectors, processors, and transmitters) required to accelerate control in a zonal pattern, sub-urban and freeways may not be suitable for the zonal traffic control system.
3.2. Performance Metrics
There are two performance Metrics which are used in this study: traffic performance and safety in terms of a possible conflict. Average travel time is defined as the ratio of the total link travel time of the network and the number of links:
Travel time of a link =
Avg. travel time =
Average Speed is defined as the ratio of the total link Speed of the network and the number of links:
Speed of a link = vi
Avg. speed = va
Average Delay Time is defined as the ratio of the total link Delay Time of the network and the number of links:
Vehicle trajectory as t
Nt is total number of trajectories demand
Average total number of conflict is the representation for Safety. Average total number is defined as the ratio of the total link total number of the network and the number of links:
Travel time of a link =
Avg. travel time =
Link =
i where

(
I is all the links in
the network)
is total number of links in the network
4. Experimental Setup
Although the initial plan was to implement parallel programming techniques in the different calibration algorithms such as Simultaneous perturbation stochastic approximation (SPSA), Finite Difference Stochastic Approximation (FDSA) and in the execution of the sensitivity analysis. It was not implemented; hence, it provides a research provision for further study. For the number of traffic agents, number of simulation and network size, a series simulation approach is economic enough from the viewpoints of the computation effort.
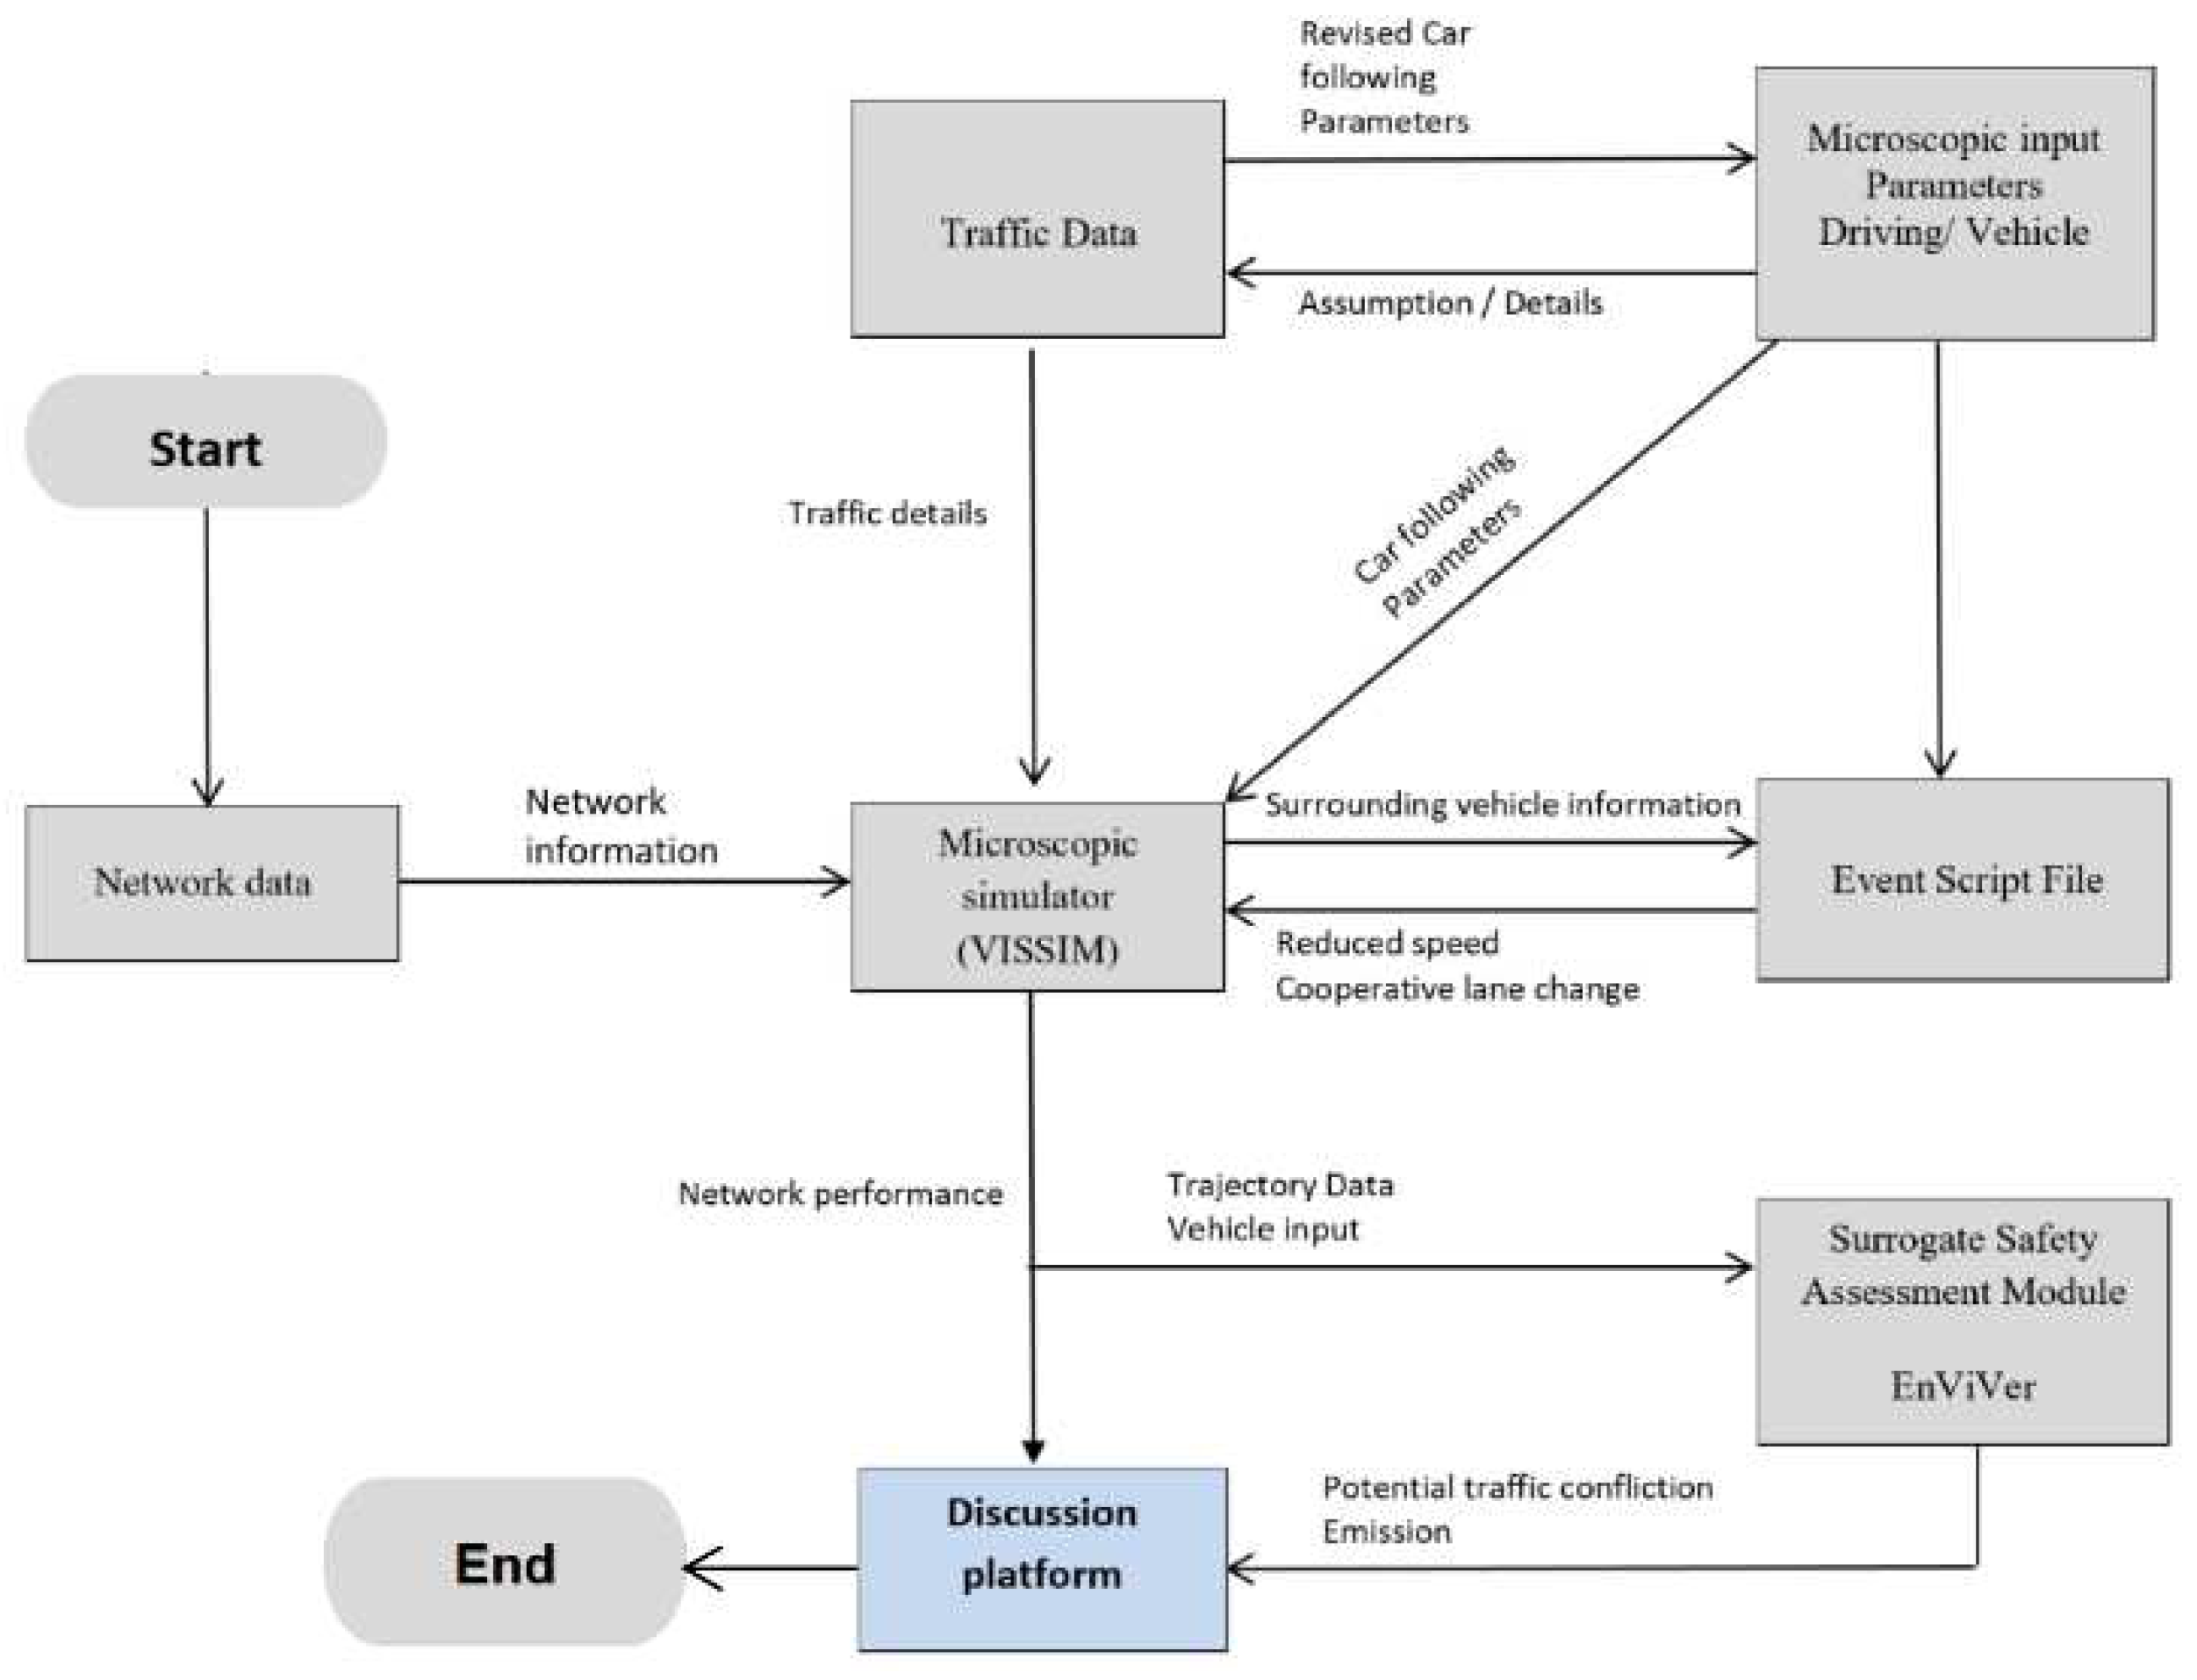
Figure 2 shows the organigram of the microscopic traffic simulation for this study that is inspired from a former study [
25]. The base demand was obtained and processed from real traffic and the network was modelled to precise enough to detail the existing infra-structure. The overall approach taken in this study is to proxy the impacts of CAVs in an existing traffic condition. The VISSIM, a microscopic traffic simulation software from PTV, has been used to perform the simulation. Moreover, SSAM have been used for additional inquires such as impact over accident. The car following models which are supplied in the VISSIM have been used to represent the human-driven vehicles for lane behaviours. To represent the C/AVs in the VISSIM interface, along with available car following behaviours, additionally the behaviours of ACC, and CACC technologies are implemented. The vehicle to vehicle (V2V) and vehicle to infrastructure (V2I) connectivity assure the reflection of real world into the model which are stored as the external control algorithm. The surrogate safety assessment module assures proper visualization of probable accidents.
The network performances which are influenced by the penetration of AVs and CAVs in the network, are derived for different traffic flows. This combinational impact of HV-AV-CAV have been studied for the mixed traffic in terms of travel time, speed, delay time. In addition to that a subset of these experiment cases, was studied to get deeper impression over the safety aspect in the network.
5. Results
5.1. CAV-AV-HV Combination
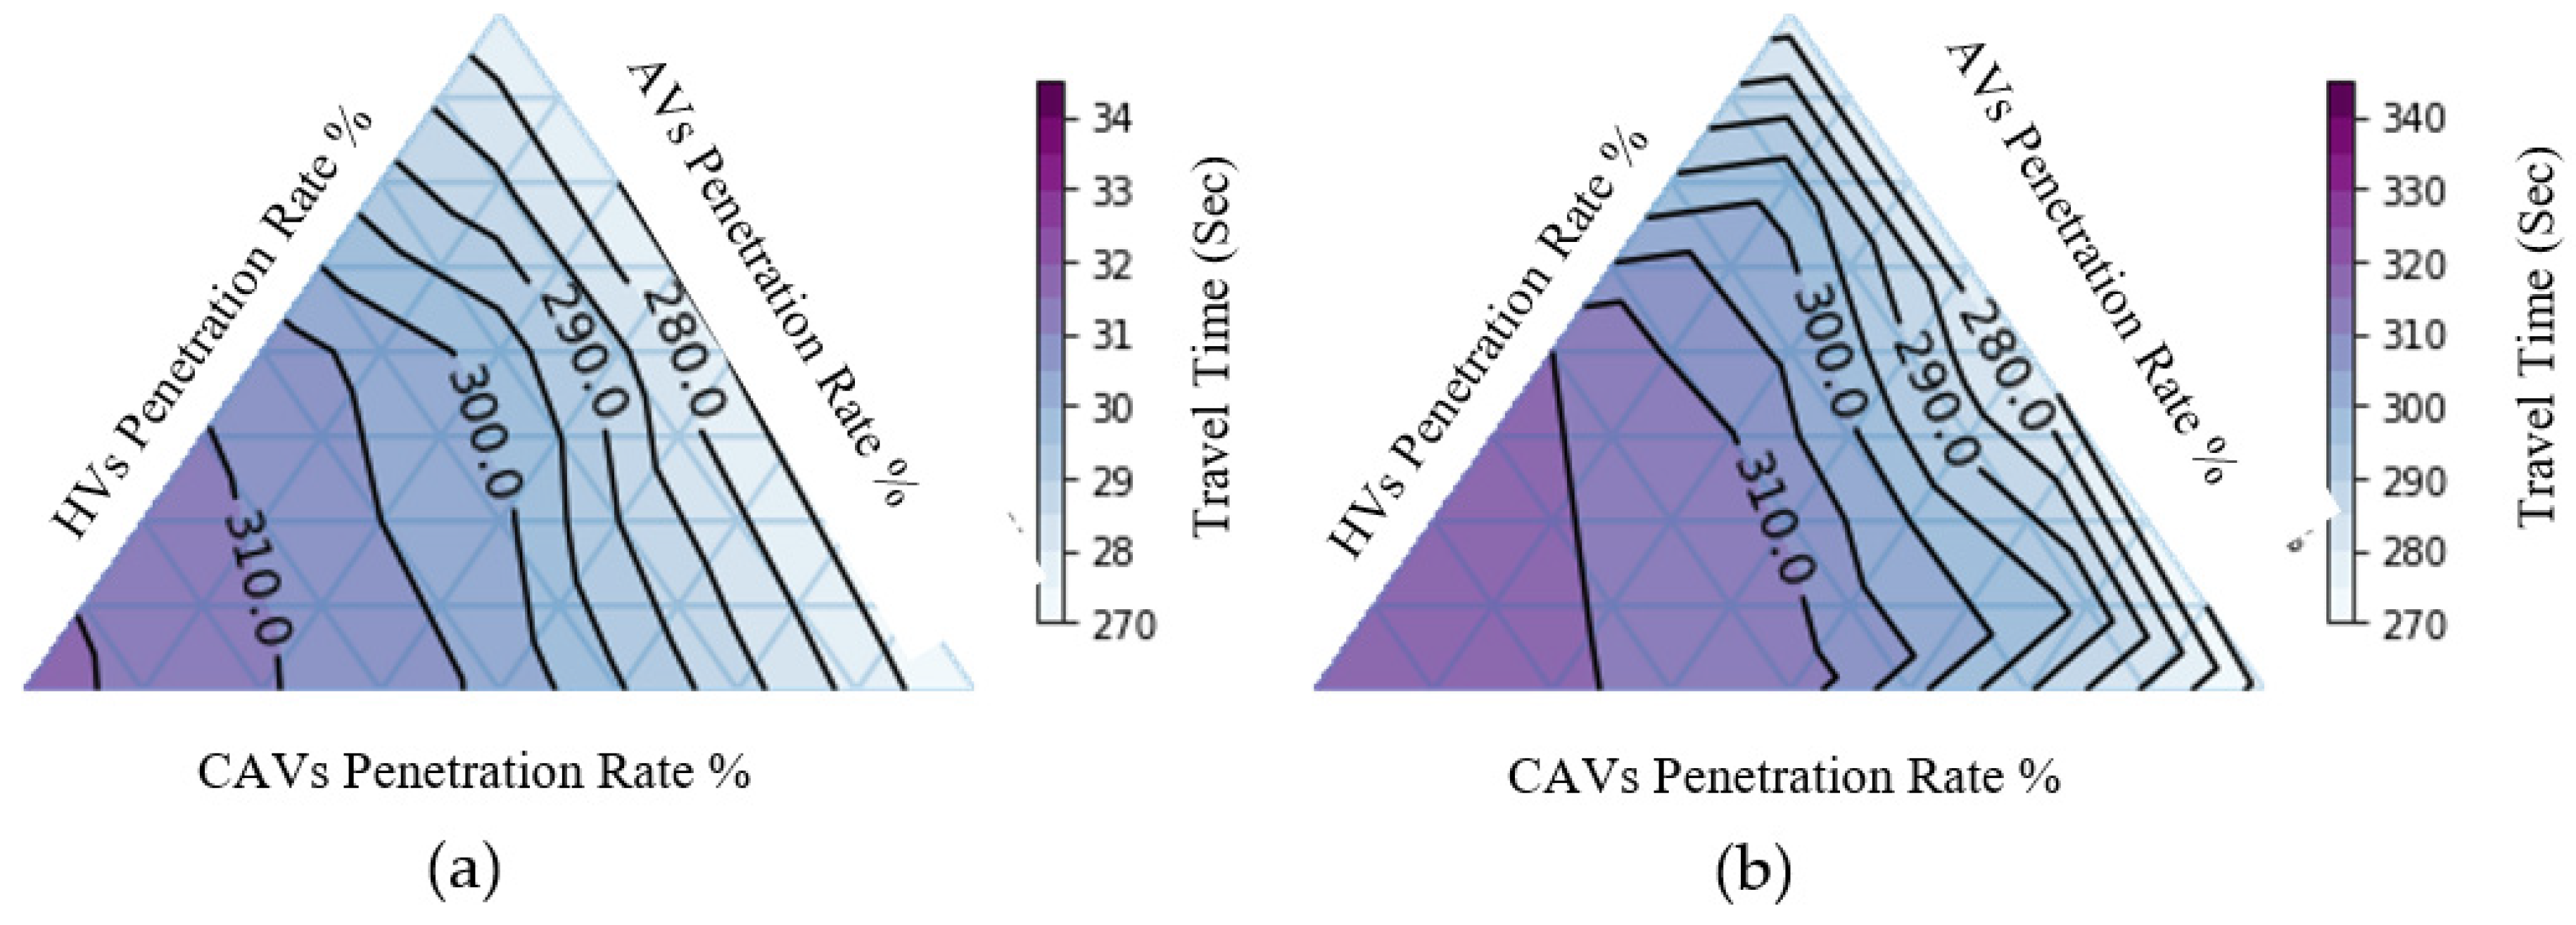
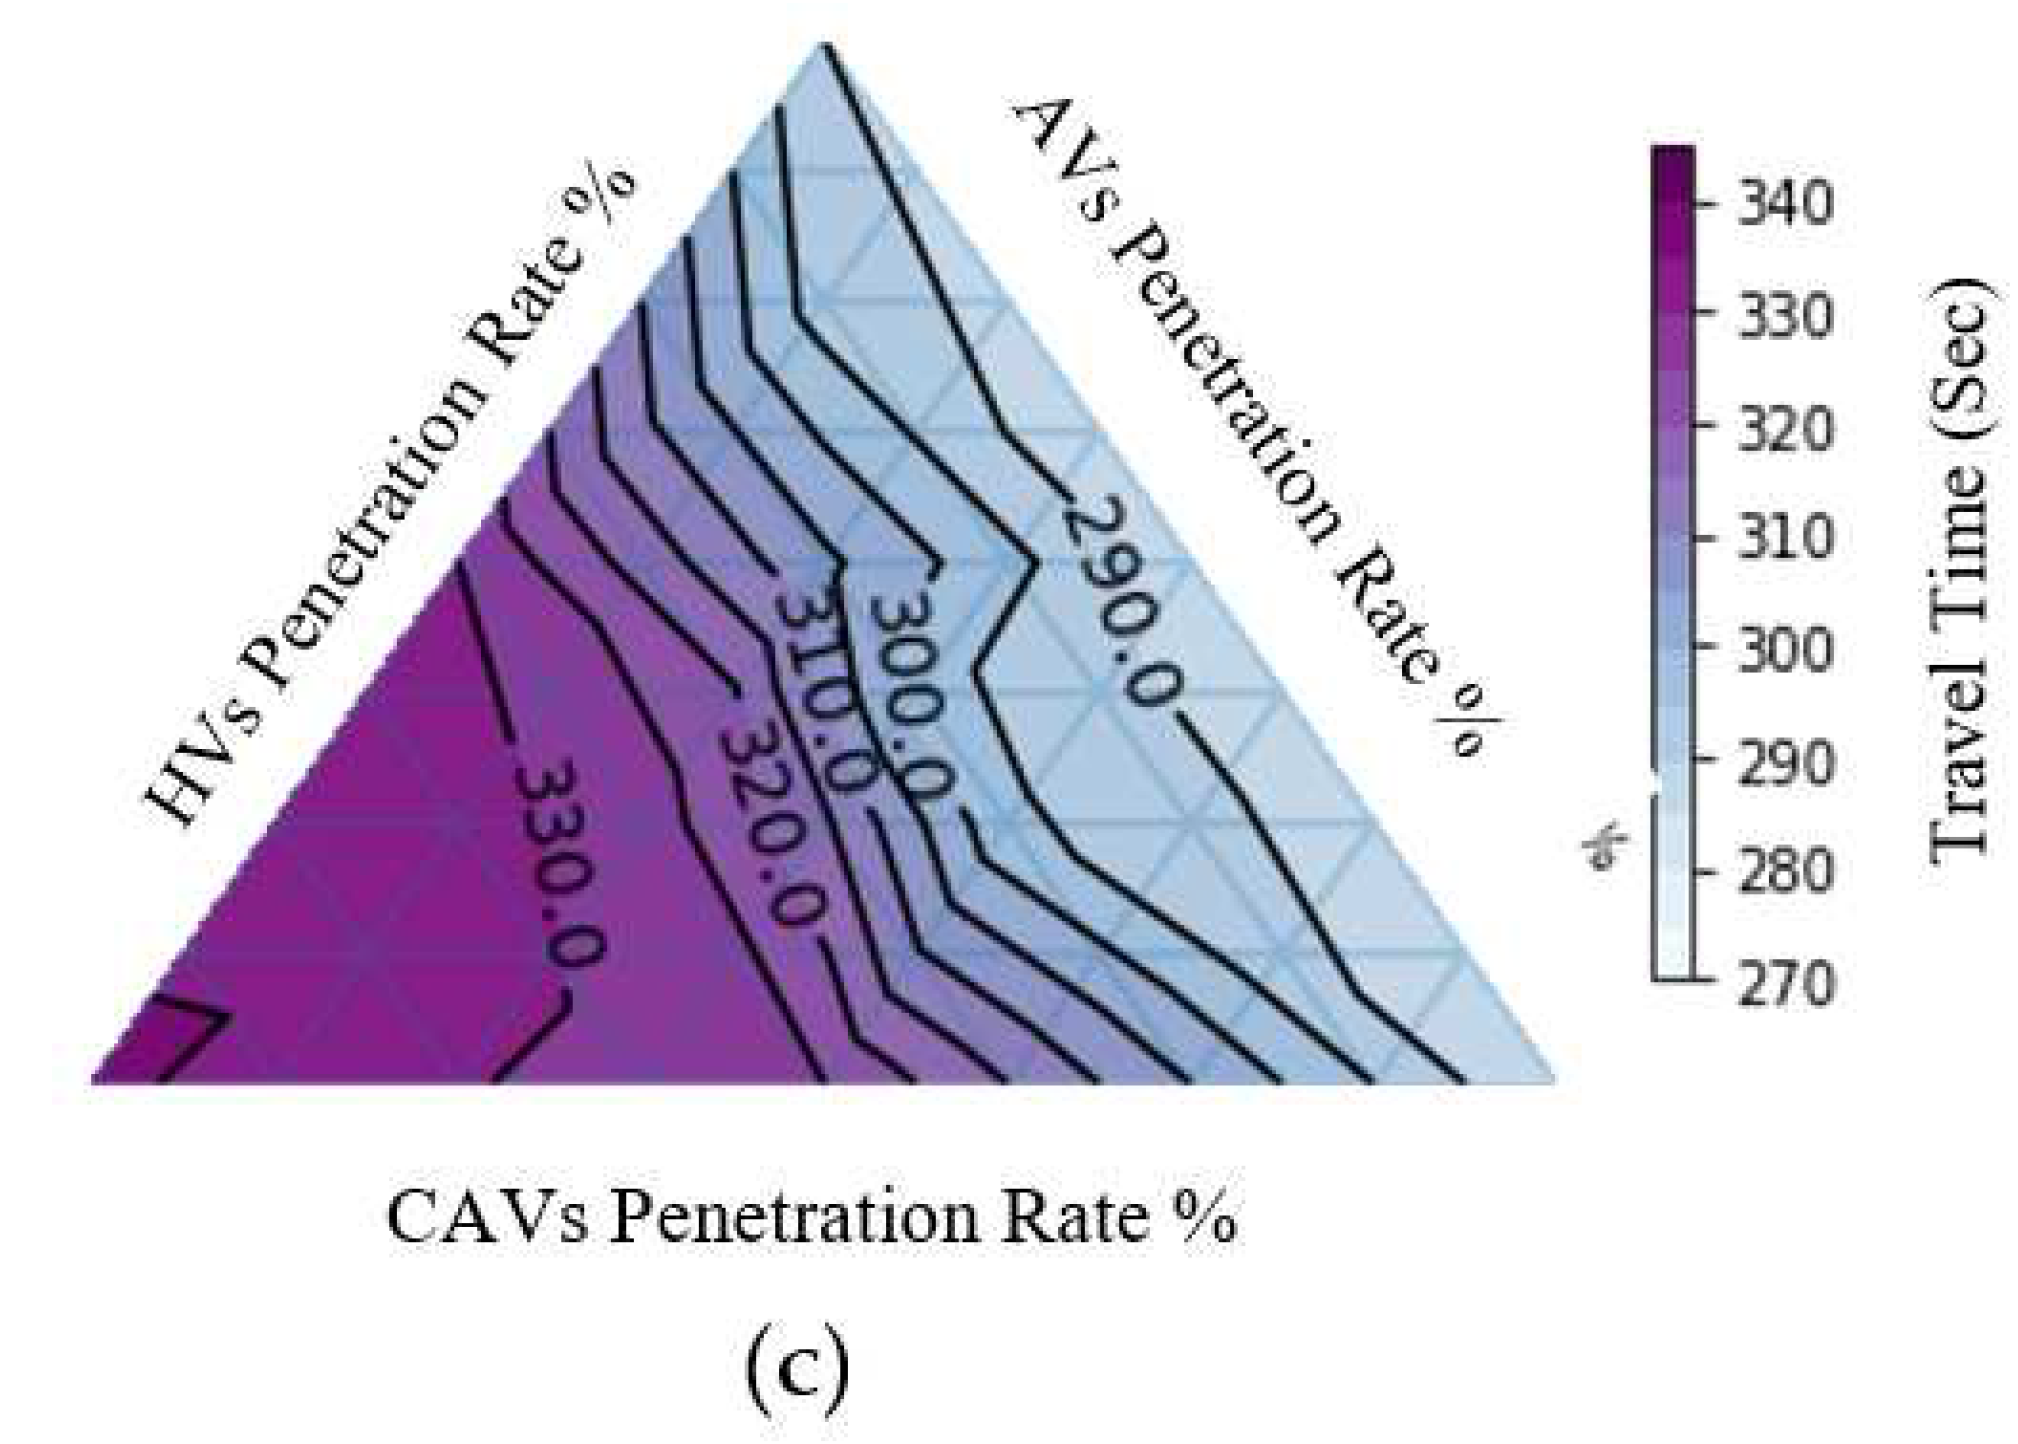
Figure 3 shows the travel time corresponding to the demand at 20% below the peak hour, at the peak hour, and at 20% above the peak hour. Each axis presents the proportion of penetration of a certain vehicle type, ranging from 0 to 1. The inner area of the ternary plot provides different possible HV-AV-CAV combinations. The plots indicate travel time changes for three traffic demand cases. The colors inside the plots depict the status of different traffic performances based on different combinations of HVs, AVs, and CAVs.
The first impression from the ternary plots for the travel time is that CAVs demonstrate better performances than AVs and HVs for different demand cases. Increasing the proportion of CAVs by a certain amount reduces travel time more quickly than when increasing the proportion of AVs by the same amount. With higher AV-CAV penetrations, network encounter lesser travel time than any of other combinations with higher penetrations of HVs. As AVs and CAVs come with diverse types of features, such as connectivity, early speed reduction and, management of distance, the traffic performance increases for higher C/AV penetrations. These additional strategies offered by C/AVs work better for peak hour demand and 20% below the peak hour than 20% above the peak hour demand case for the same study corridor. The number of interacting vehicles plays role in this phenomenon. With increasing traffic in the road, the interaction of the vehicles intensifies as the communication continuity remain stable in the network.
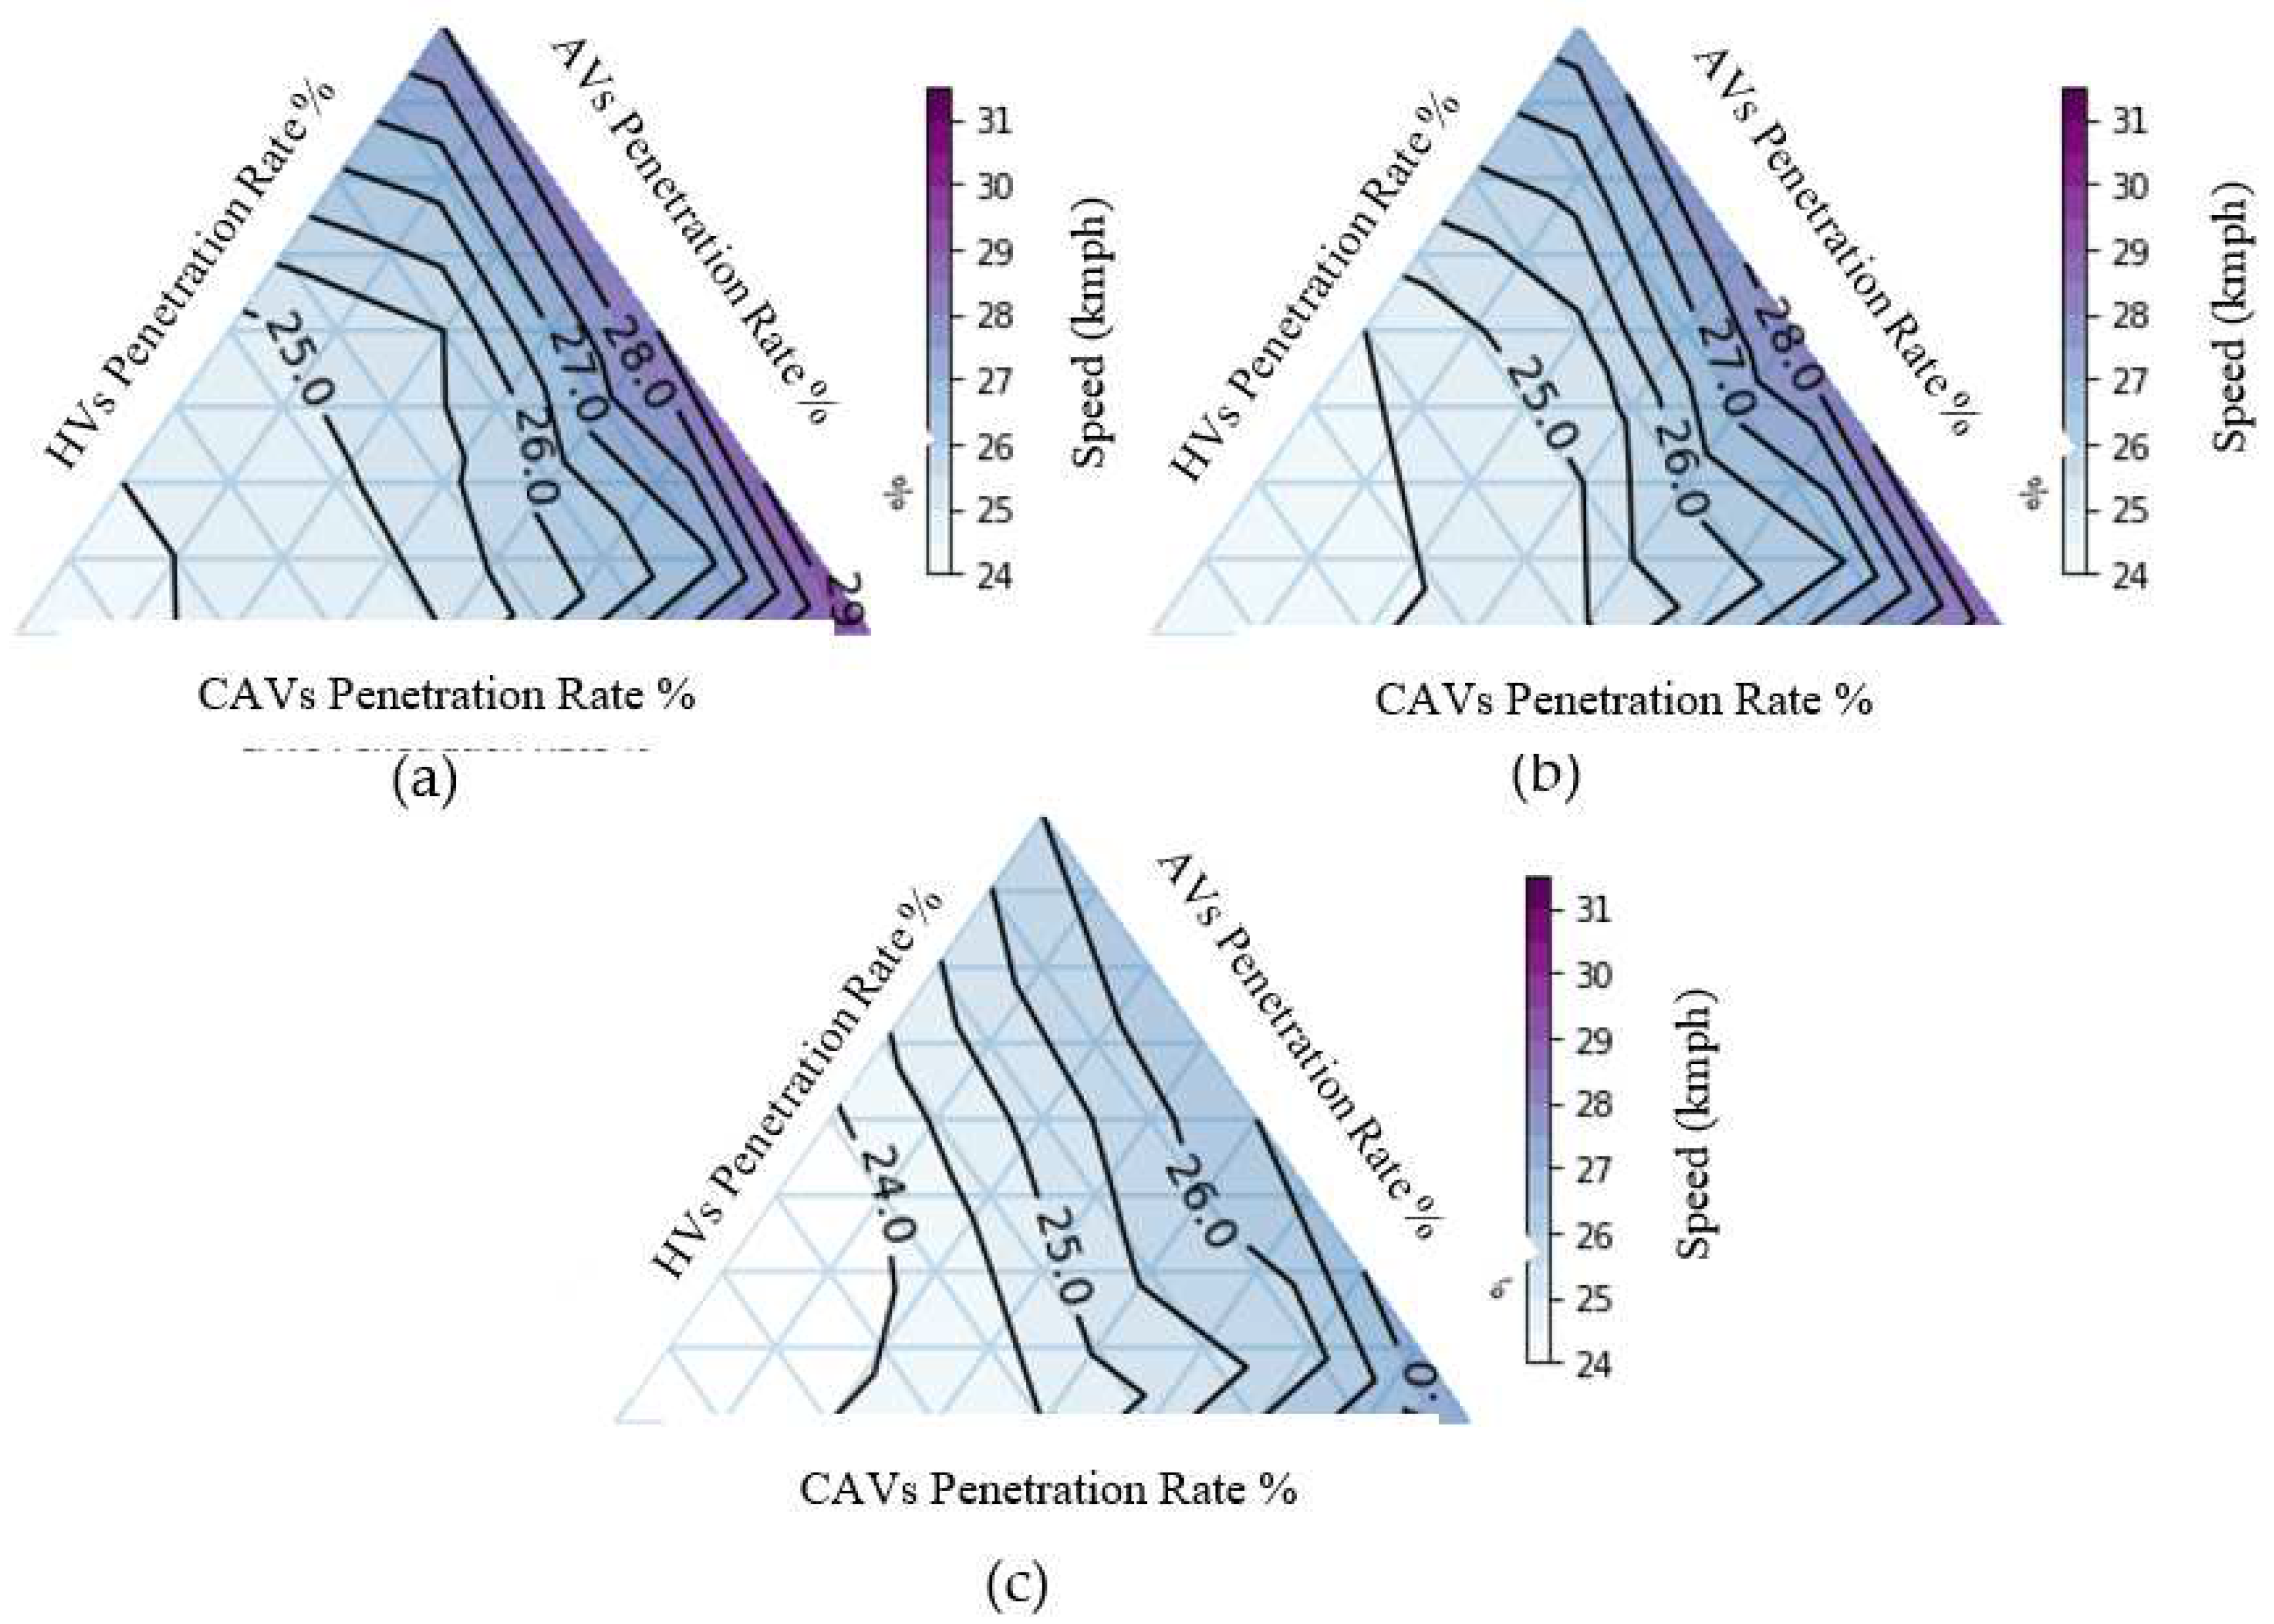
For the case of speed, shown in
Figure 4, a similar pattern can be seen for all three demands: peak hour, 20% below the peak hour and 20% above the peak hour. A higher AV-CAV penetration outperforms a higher HV-AV penetration in every possible similar combination, which can be seen in the ternary plots of
Figure 4. The cause behind improved speeds remains the same.
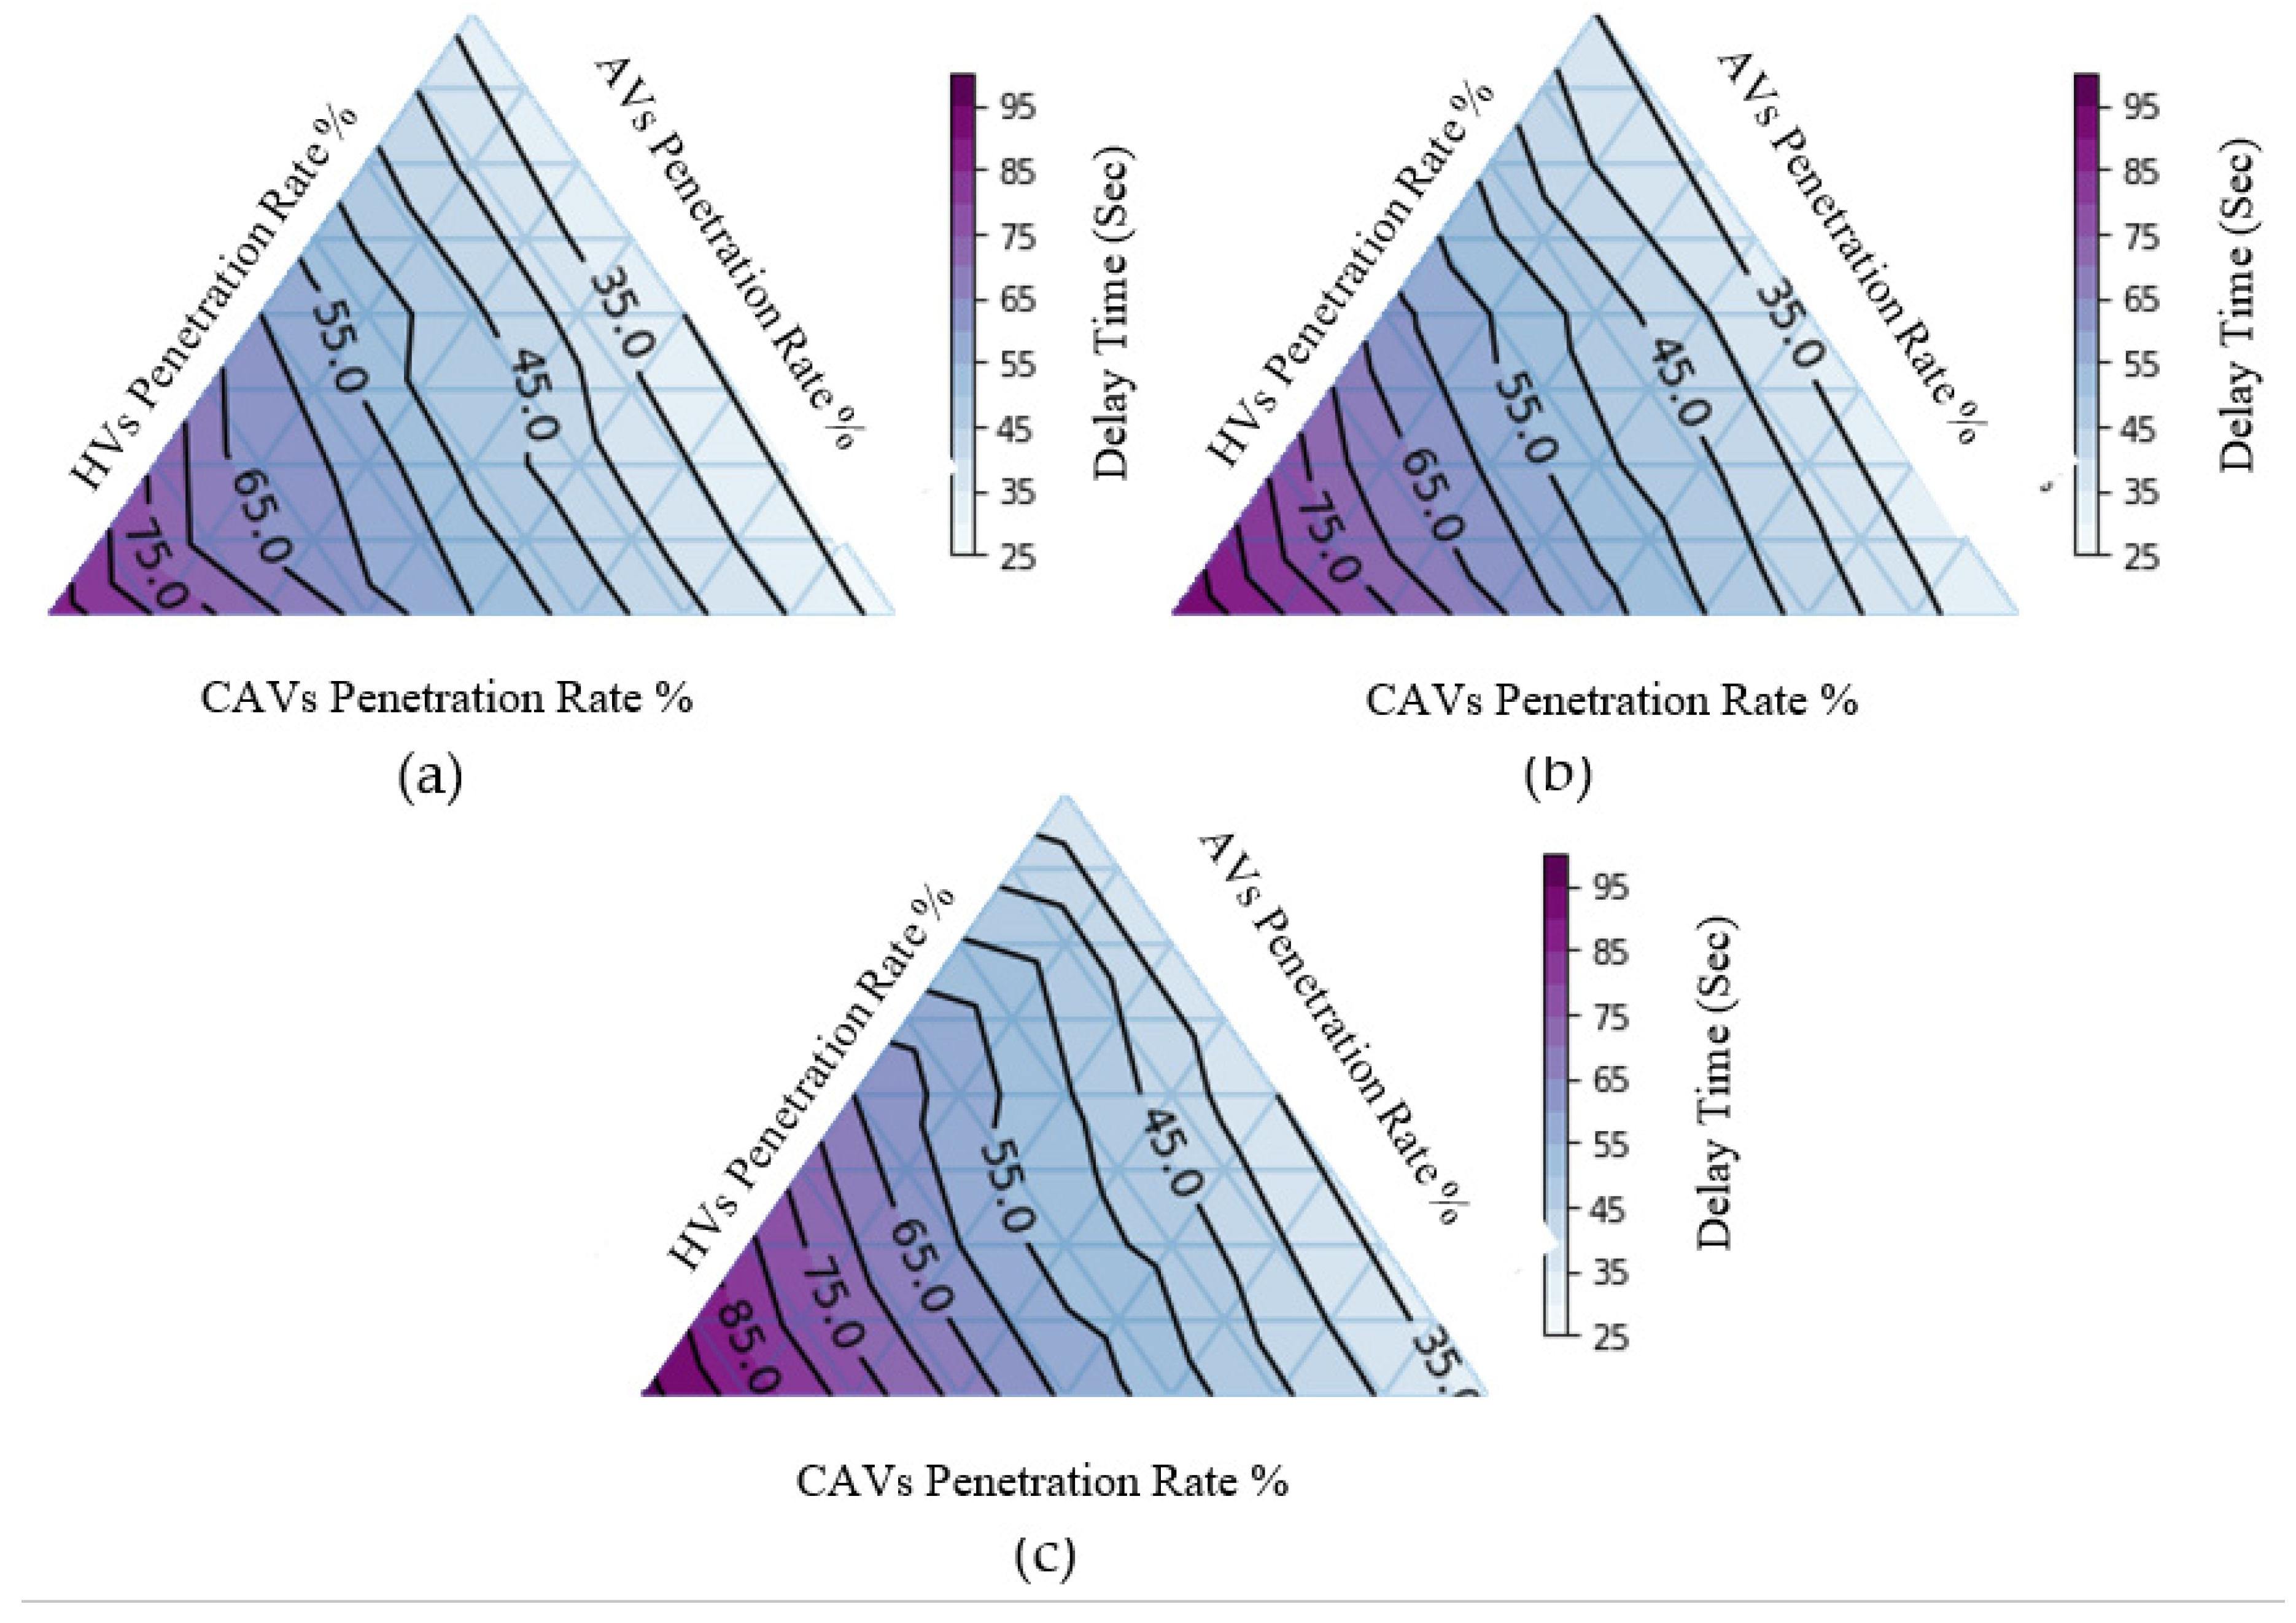
Figure 5 shows the delay time for the same scenarios mentioned above. Delay times strengthen the statements of the other performance indicators, travel time and speed as expected. Scenarios with a lower travel time and a higher speed tend to have a lower delay time and a lower number of stops [26, 27]. The delay time reduces more quickly for a higher AV-CAV penetration, as expected. The reasons of such anticipated improvements reinforce the previous two performance indicators.
Based on the above results, it can be said that introduction of automation in the network overall performs better than HVs. There are not that much of the changes for the lower amount of penetration of automation in the transportation system. Significant changes can be seen in the models once automation participation ratio reaches certain level. The normal driving module for this thesis interact optimistically positive for the travel time, speed and delay time. CAVs show better performance because additional properties CAVs conserve higher competency in the network. The ability to make platoon, slowing down to the signal and interacting with other vehicles make the CAV a strong actor in the traffic.
More automation in the network, assure higher efficiency of the automation itself because vehicles can communicate to each other and react with other intelligently. For higher number of vehicles in the network, number of interacting vehicles need to be higher but to study the variability, it was kept constant to 3. This result lowering of traffic performances again in the network for high traffic demand after reaching the yield point.
5.2. Comparison between CAVs and AVs
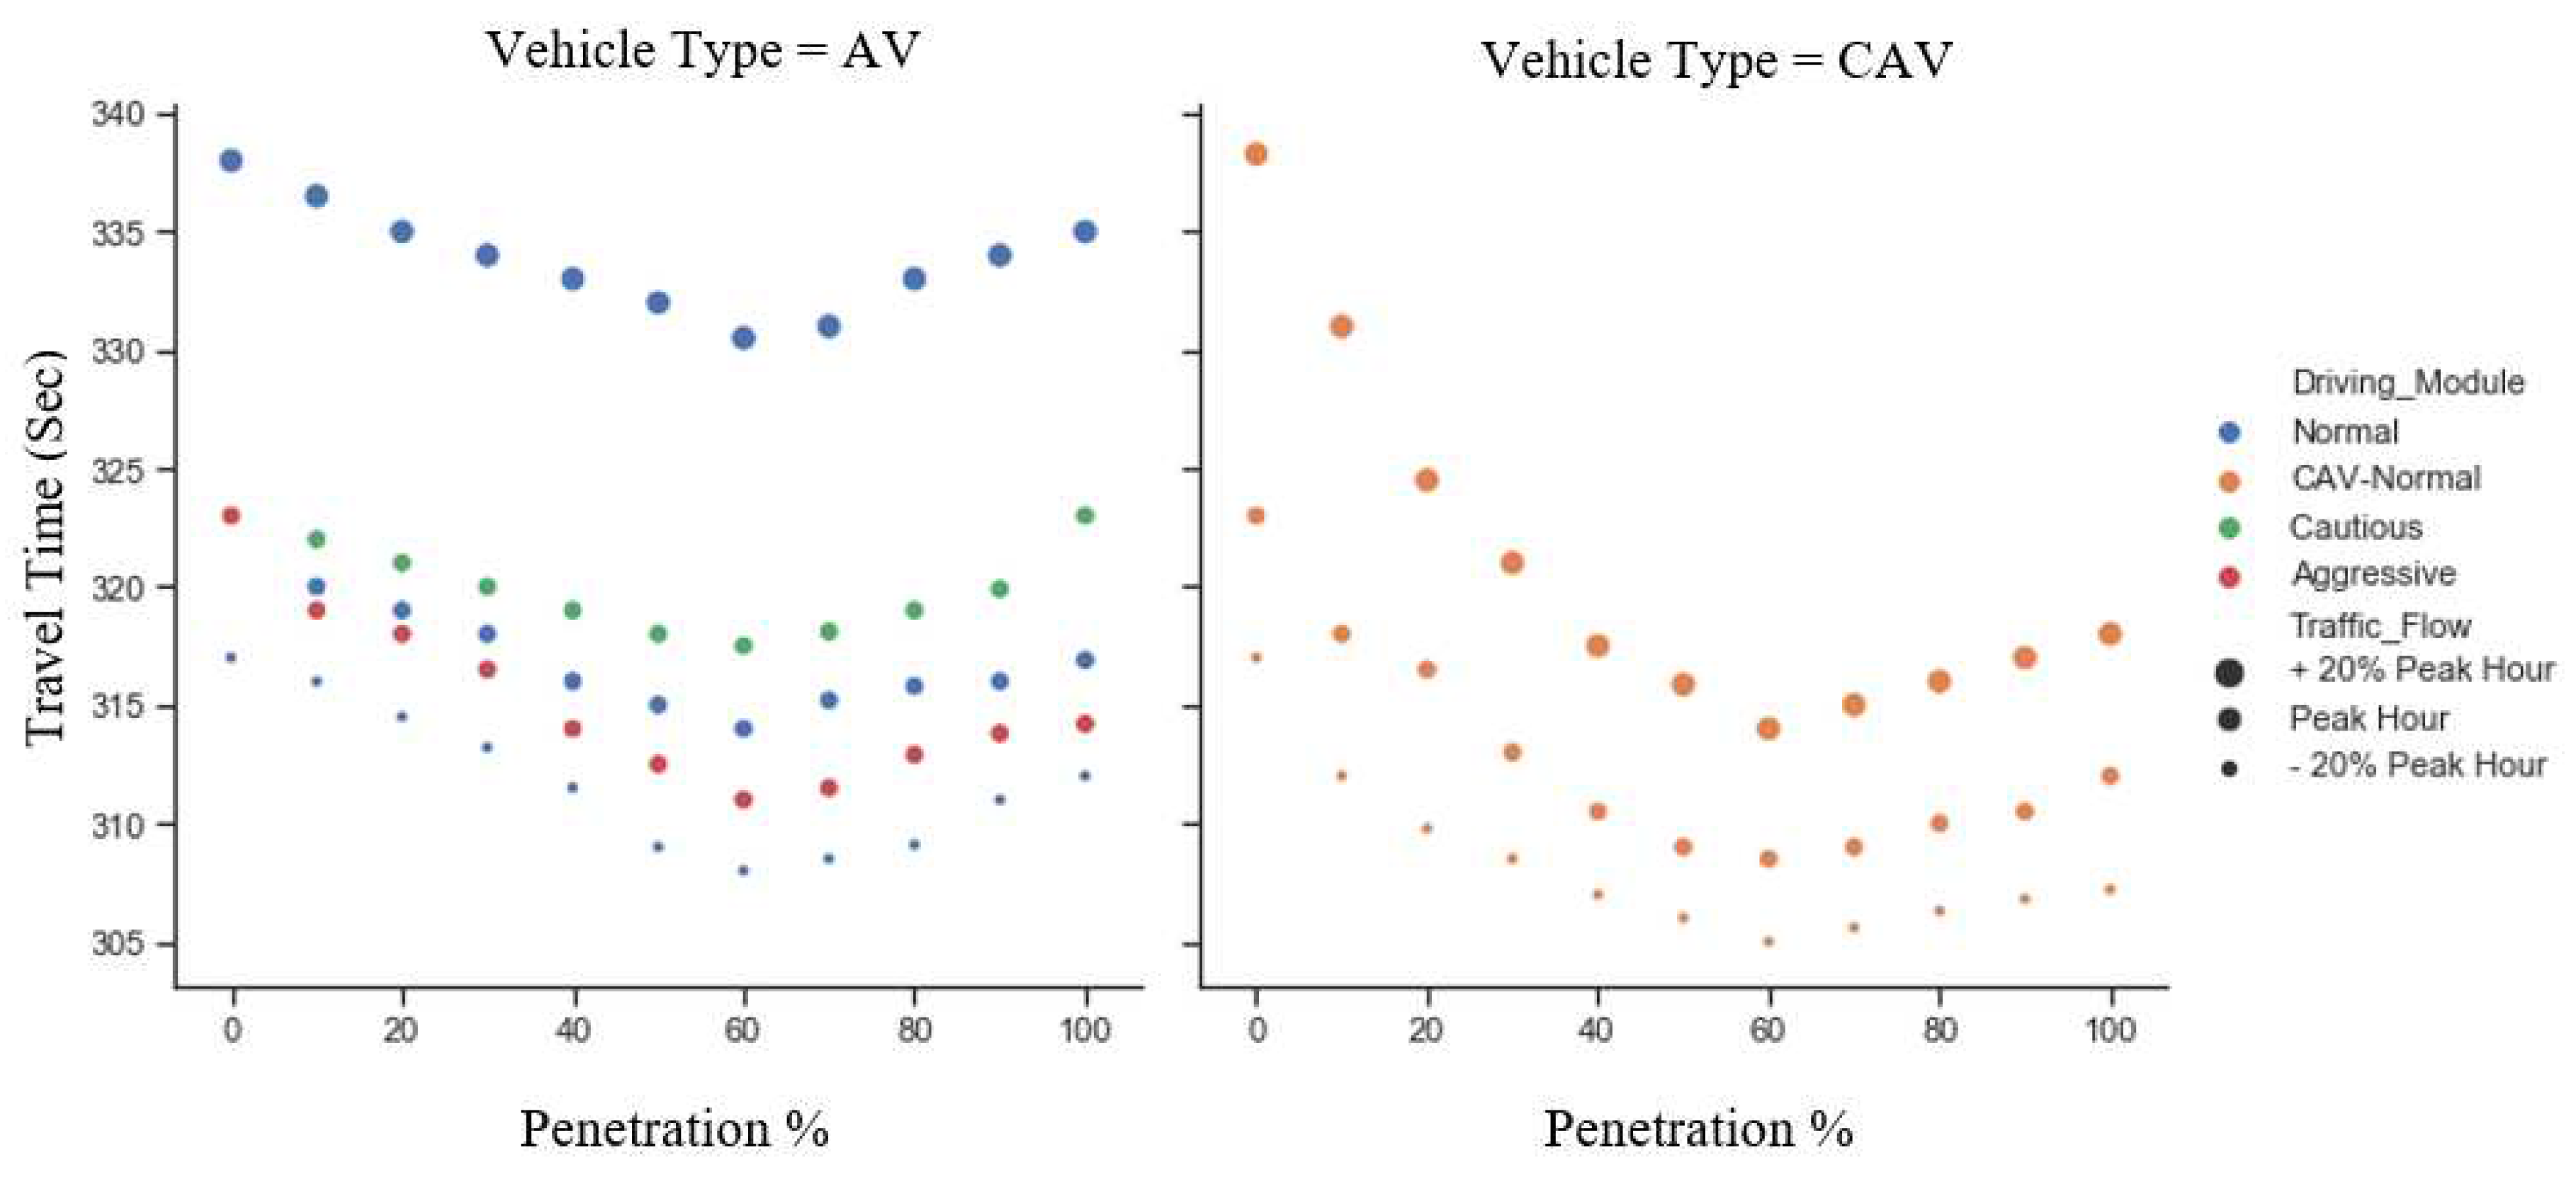
Figure 6, the travel time scatter plots of AV and CAV reinforce the conceptual gains in addition some additional information about driving modules. As CAVs have additional features than HVs and AVs, here too, the CAVs use lesser travel time in contrast to the other vehicle types. A gradual shifting of the travel time can be seen for different traffic demand cases. The lowest travel time is achieved faster for the higher demand. Availability of required number of vehicles in the network causes earlier yielding of the travel time. The travel time yields into lowest value in the range of penetration between 50- 70% C/AV penetration. This phenomenon can be connected to the fact that number of interacting vehicles play major role in the performance. If there are lots of vehicles in a segment of the network than allowable interacting vehicles, the performance ought to drop as most of them are not interacting after yielding point. In summary, with significant higher quantity of traffics, the interacting vehicles range passes the number of vehicles in the street.
Likewise, different traffic demand cases demonstrate difference in the performances, the driving modules show differences in the traffic performances as well. The cautious and aggressive driving mode illustrate higher and lower travel time respectively, than the normal driving mode. Cautious driving modes conserve the safe measures in high level which elongate the travel time than normal state. In contrary, the aggressive maintain closer gaps with surroundings and react aggressively in the intersection so travel time reduces and capacity of the segment increases for same amount of traffic demand.
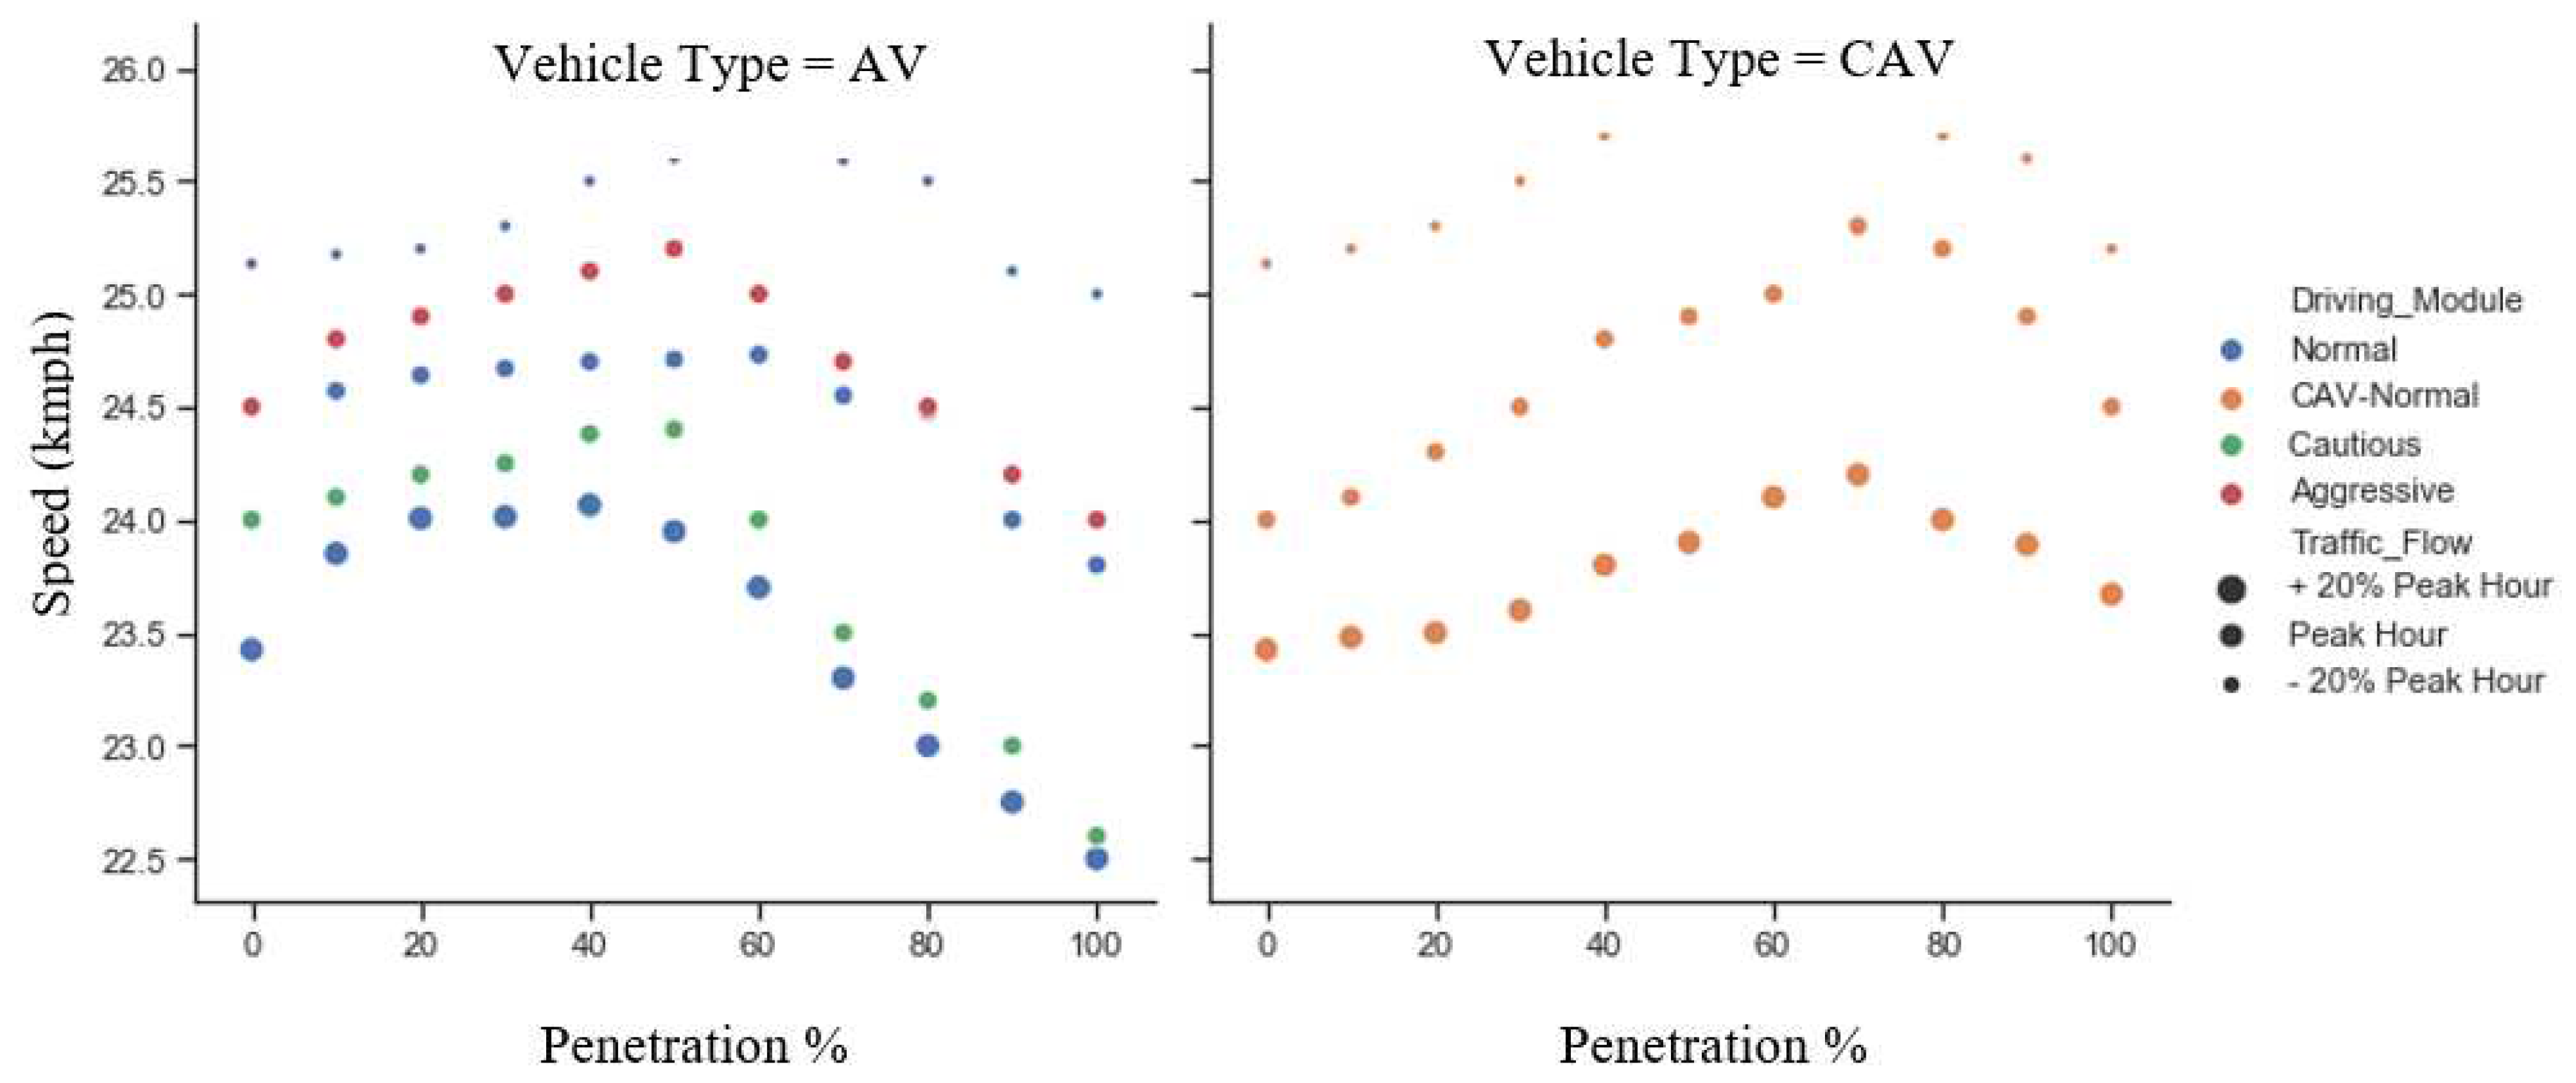
A similar trend can be experienced from the
Figure 7 for the speed as speed and travel time act together, experienced in previous section. Here too, the traffic demand cases and driving modules depict similar trend but inversely. To exhibit a concave shaped travel time plot, the speed plot needs to be a convex shaped.
The delay time is also affected similarly like previous two traffic performance indicators what can be seen in the
Figure 8. Delay time maintain similar concave shape like travel time. Automation features such as early slowing down in the intersection, collision prevention measures and connectivity of the C/AVs deduce the delay time in general and hold similar trend like its ancestors.
The safety aspect of introduction of C/AVs in the network has positive responses.
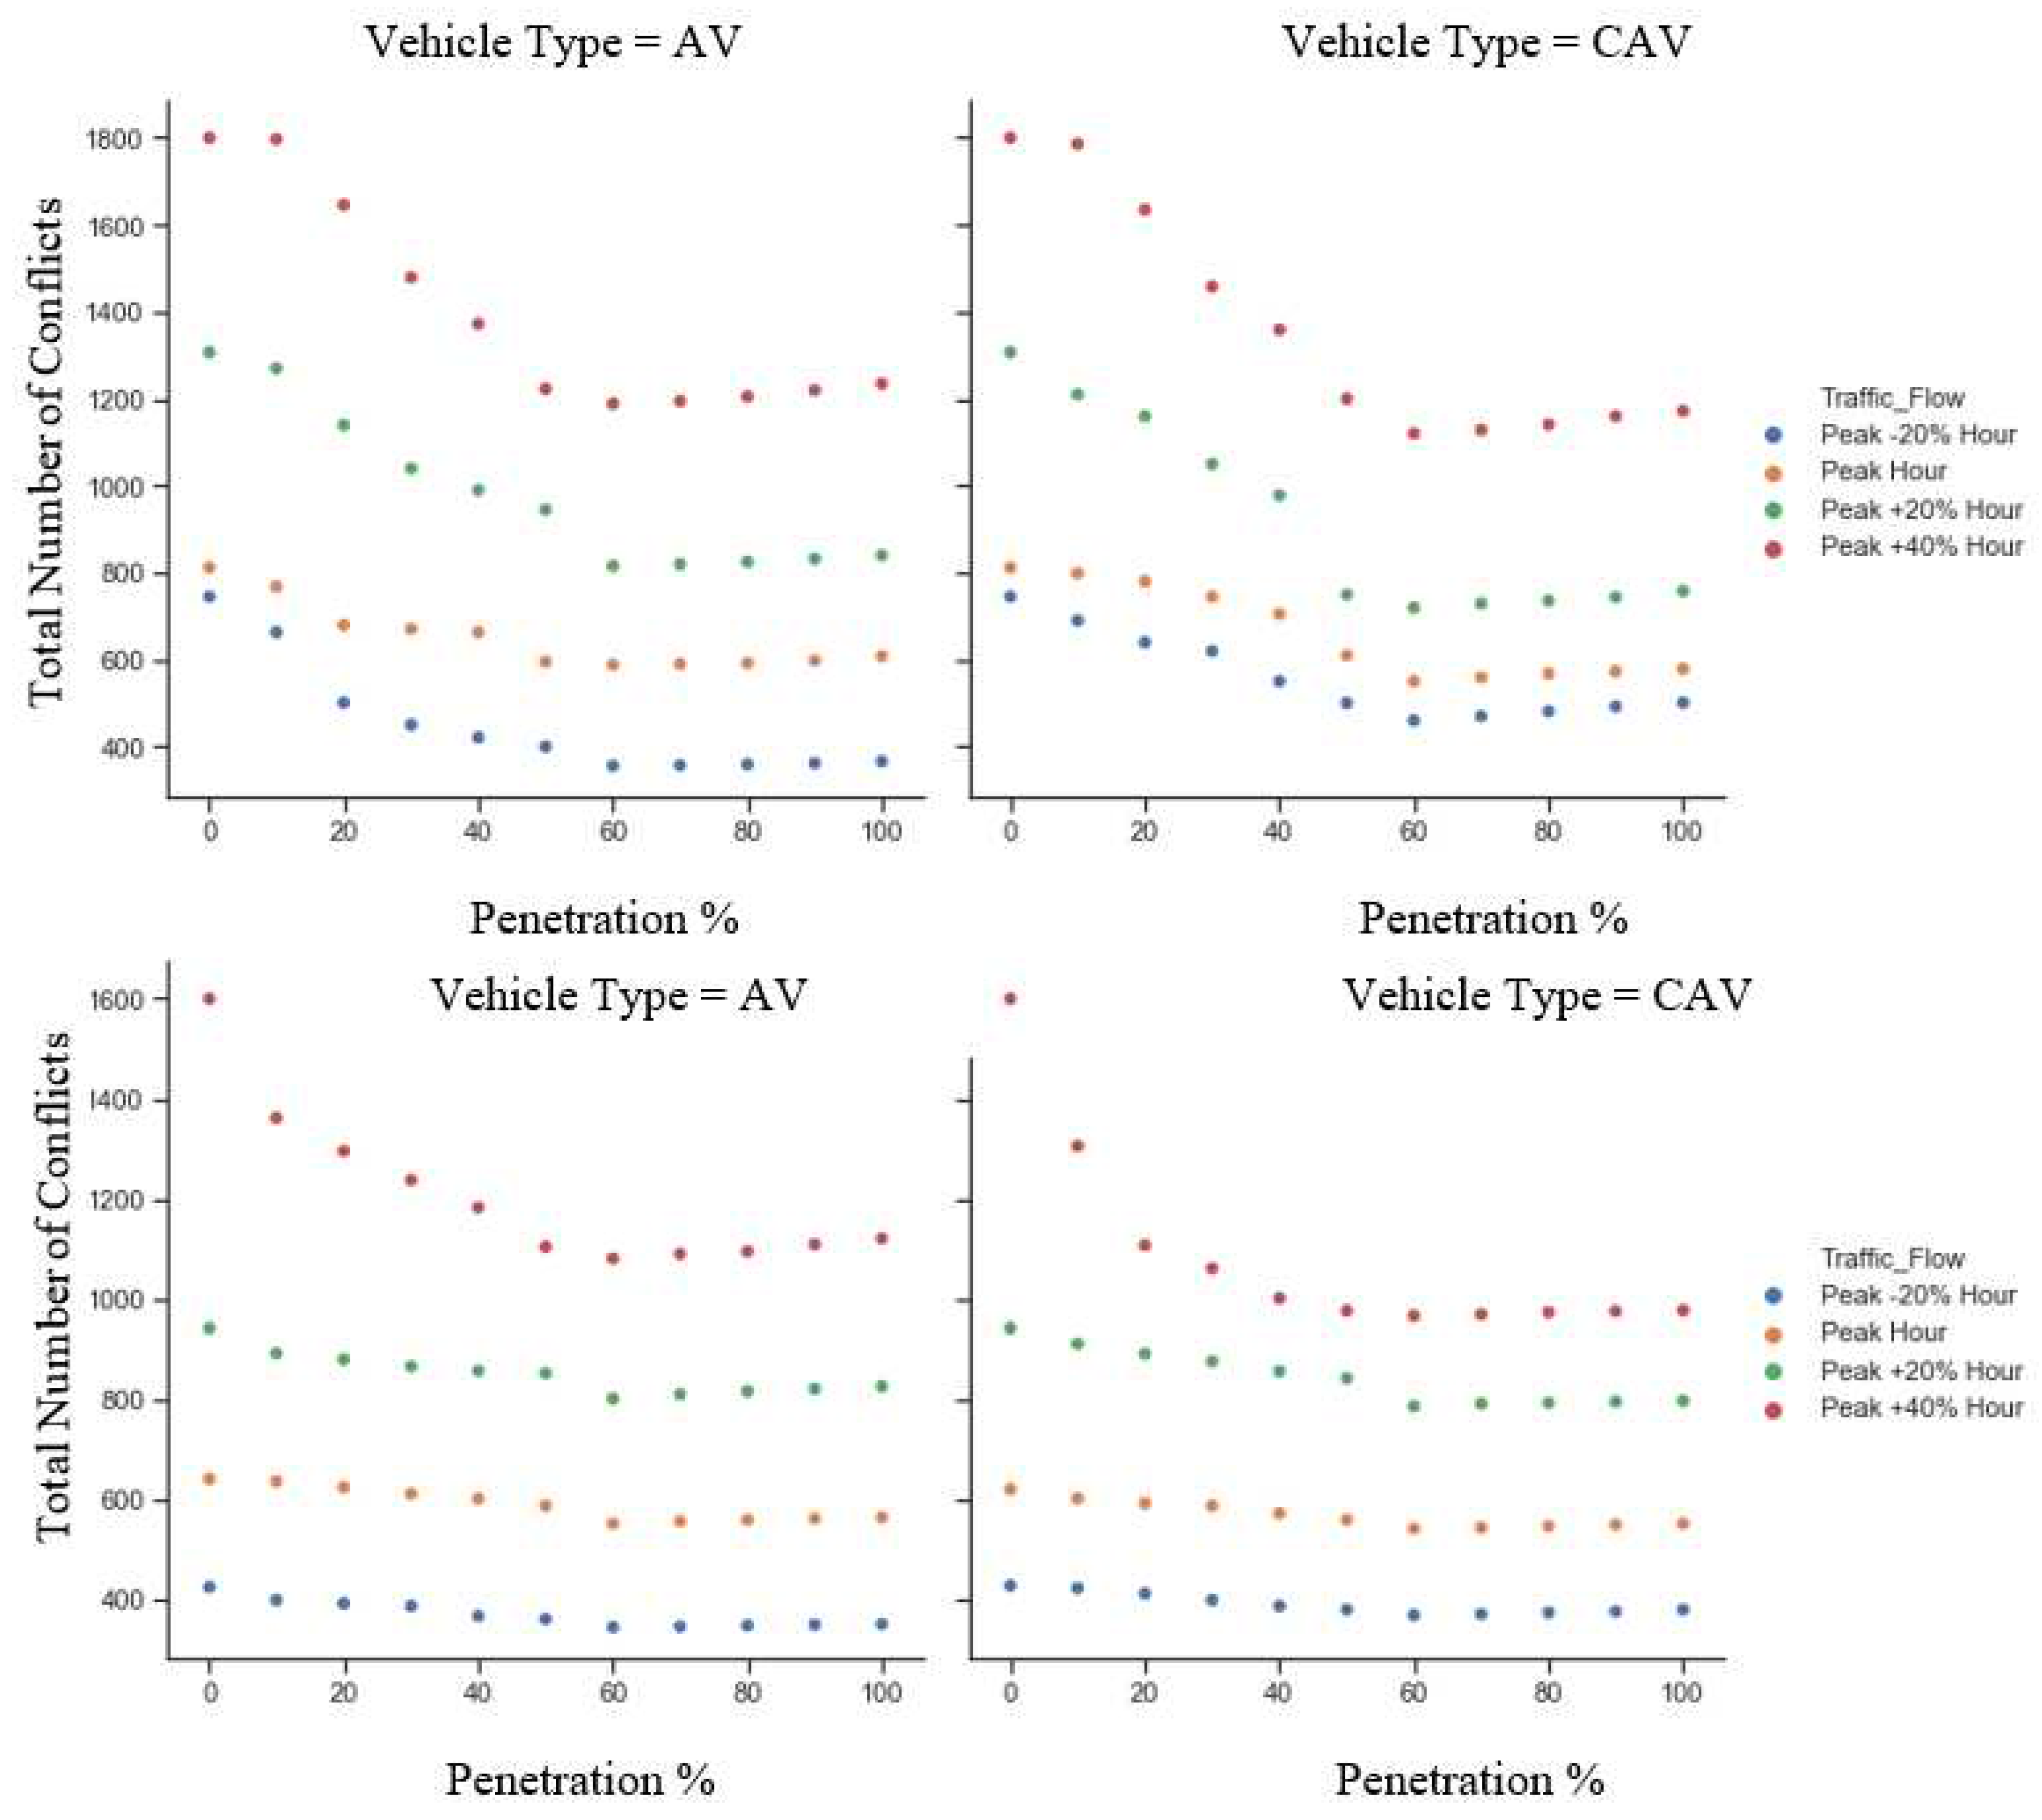
Figure 9 depicts the safety aspects in terms of total number of conflictions for different traffic demand of C/AVs. The safety can be set on for two different values of TTC, TTC = 0.75 sec and 1.5 sec as per the discussion in previous section. Some observations have been repeated as like previous performance studies, traffic performance and emission.
In first place, smaller the TTC, higher will be the number of potential conflicts in the network. For smaller TTC, the system defines more conflictions in the traffic manoeuvres. Secondly, higher the traffic demand, higher will be the total number of conflicts because vehicles confrontation each other’s in higher frequency which lead to higher possible conflictions. Thirdly, the turning point of the performances are still in the range of 50-60% and the reason of such recurrence of the trends is same as previous subsections. Lastly, the CAVs encounter relatively lesser numbers of conflicts in the network as they come with additional connectivity features.
5.3. Sensitivity Analysis
Three hundred thirty scenarios of different combinations of AVs have been investigated for eight driving parameters of autonomous vehicles which significantly impact the performance in the road traffic. The sensitivity analysis (SA) is performed in two steps, preliminary sensitivity analysis and cross-correlational sensitivity analysis. In the preliminary stage, eighty-eight scenarios are scrutinized to find the presiding driving parameters from eight driving behavior parameters. In the cross-correlational sensitivity analysis, two hundred forty-two scenarios are investigated to create the SA for the dominating parameters found from the preliminary stage. An AV penetration value of 60% is on the conservatively stable side of the simulation. A lesser number of AVs will demonstrate a lesser impact in the scenarios originated from the presence of AVs. In opposition, a higher number of AVs might bring severe changes in the real world’s driving behaviors, which can be seen in the previous sections. For higher penetration, the scenarios of mixed traffic move towards fully automation scenarios, which can be studied better with different consideration (Chen et al. 2017b). The entire SA is experimented for the peak hour demand to eliminate the effect of under or over presence of the vehicles in this controlled study corridor.
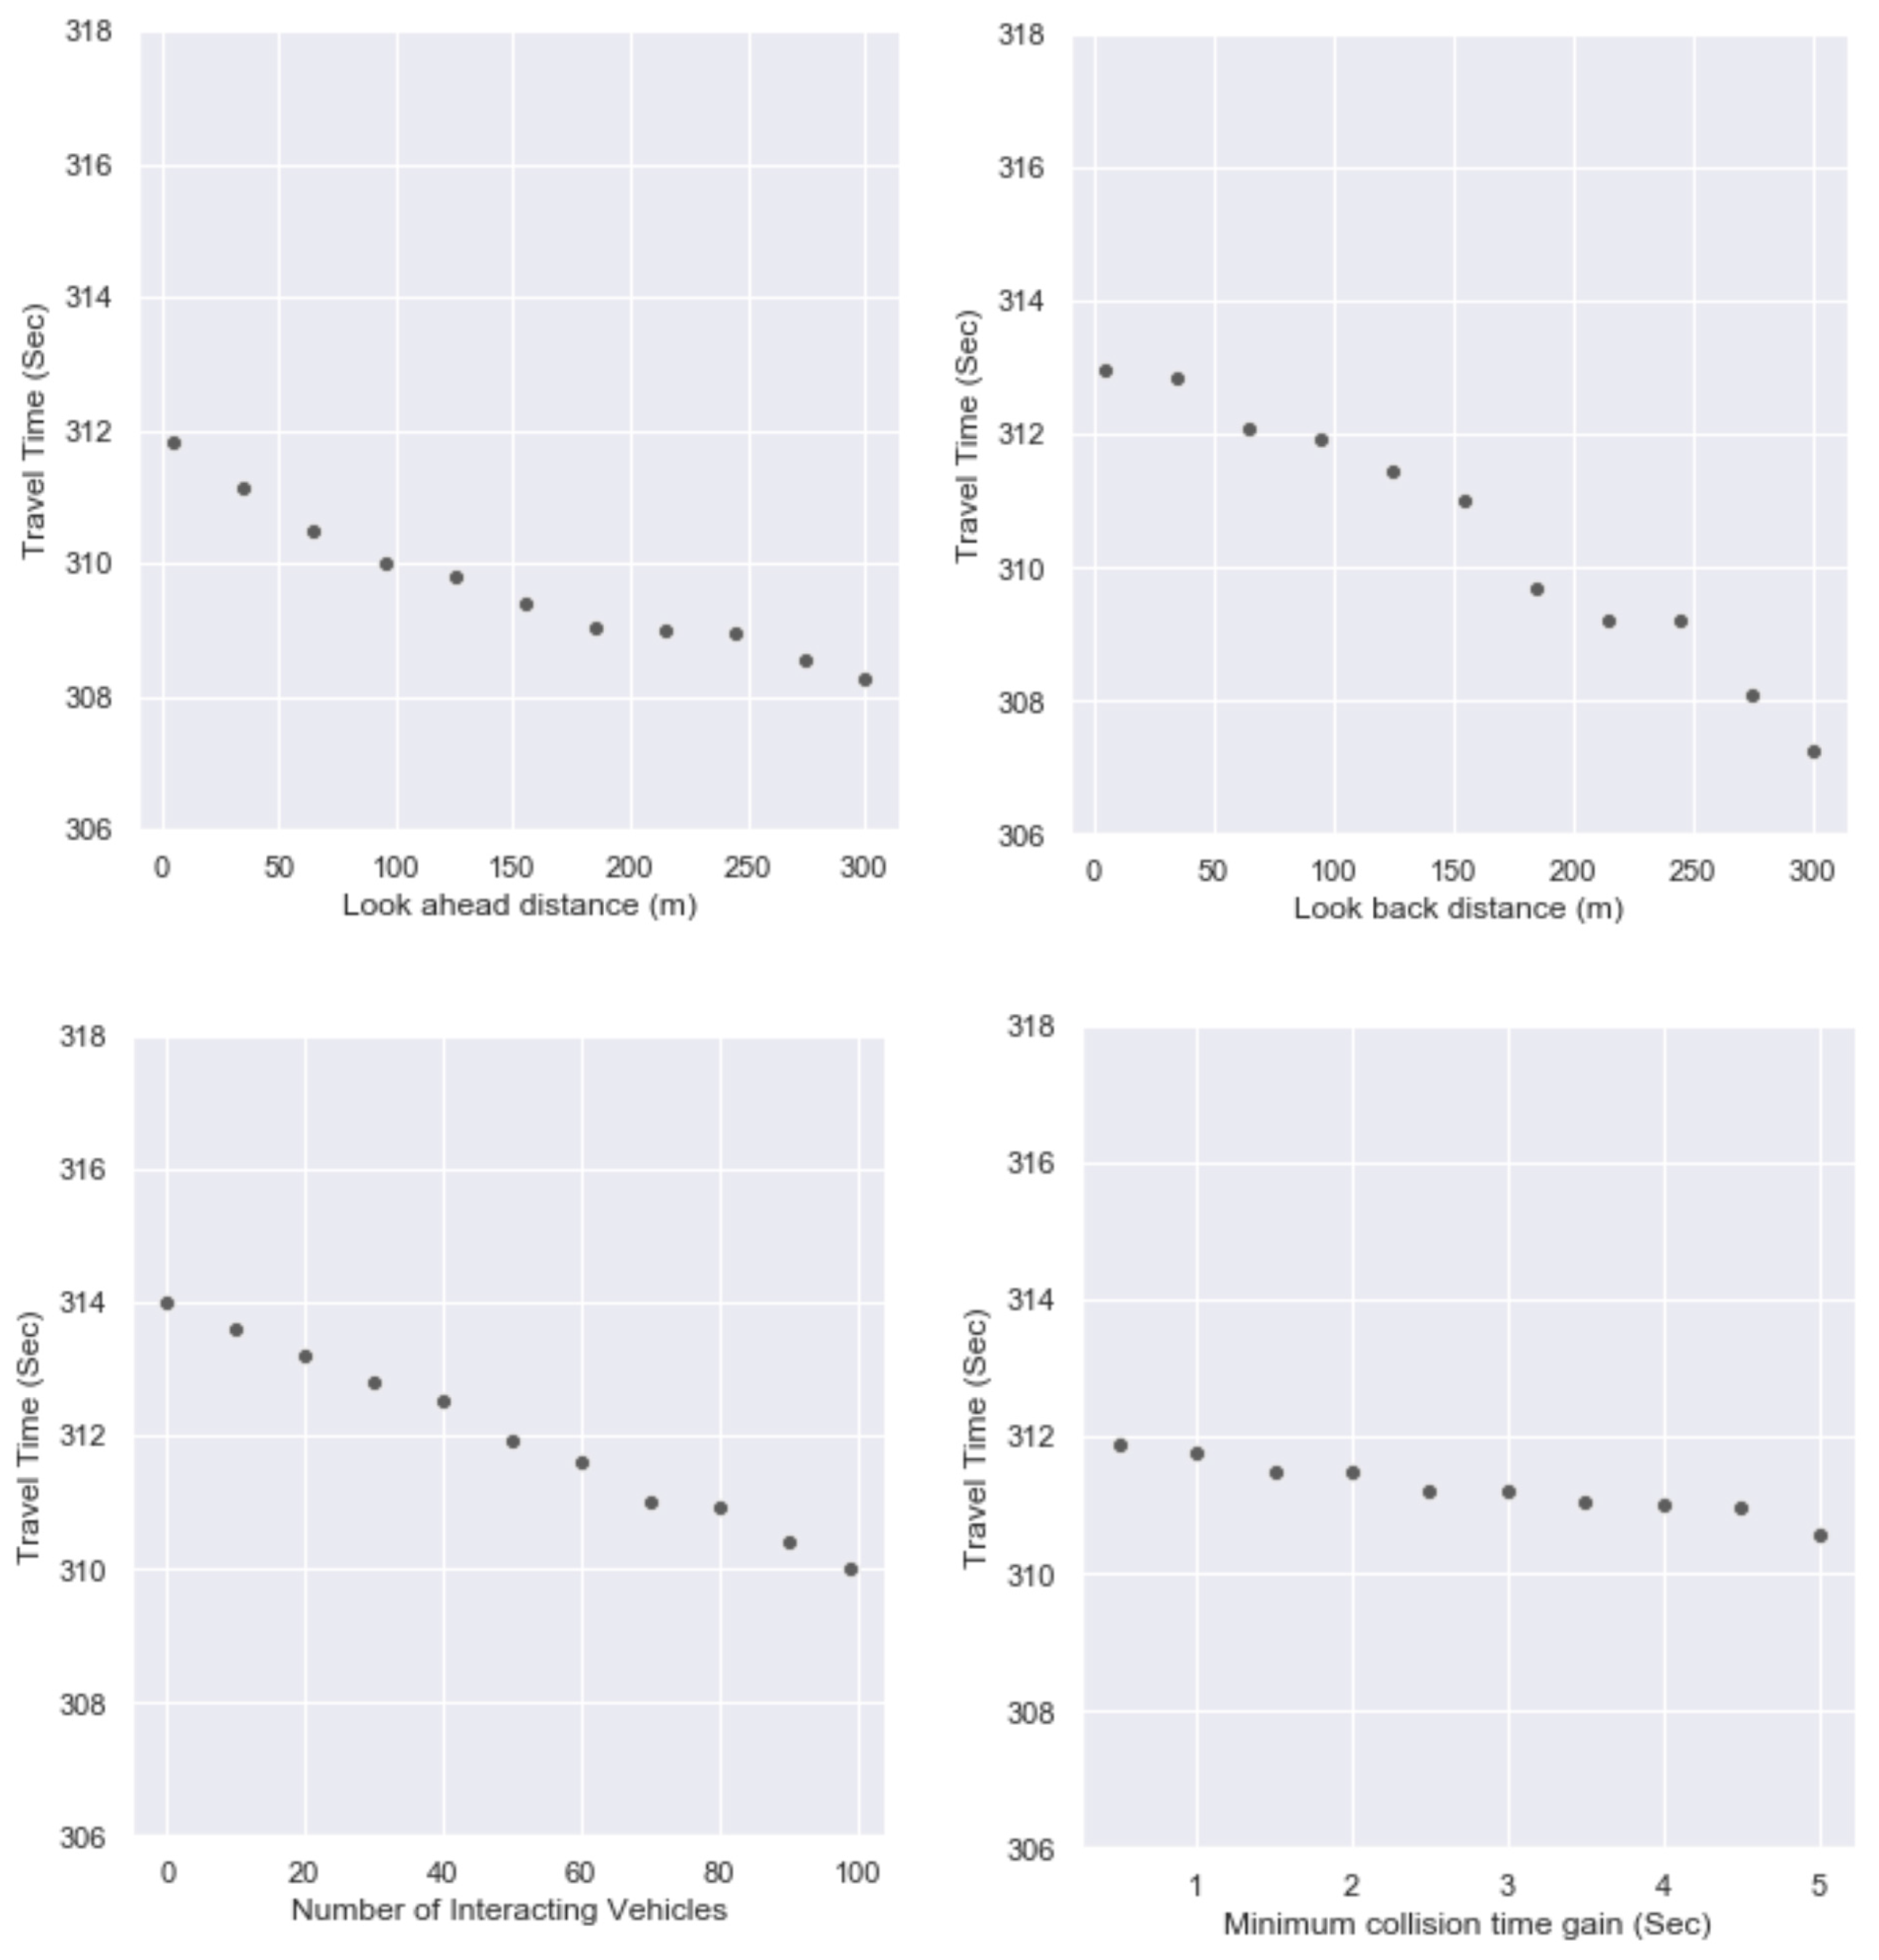
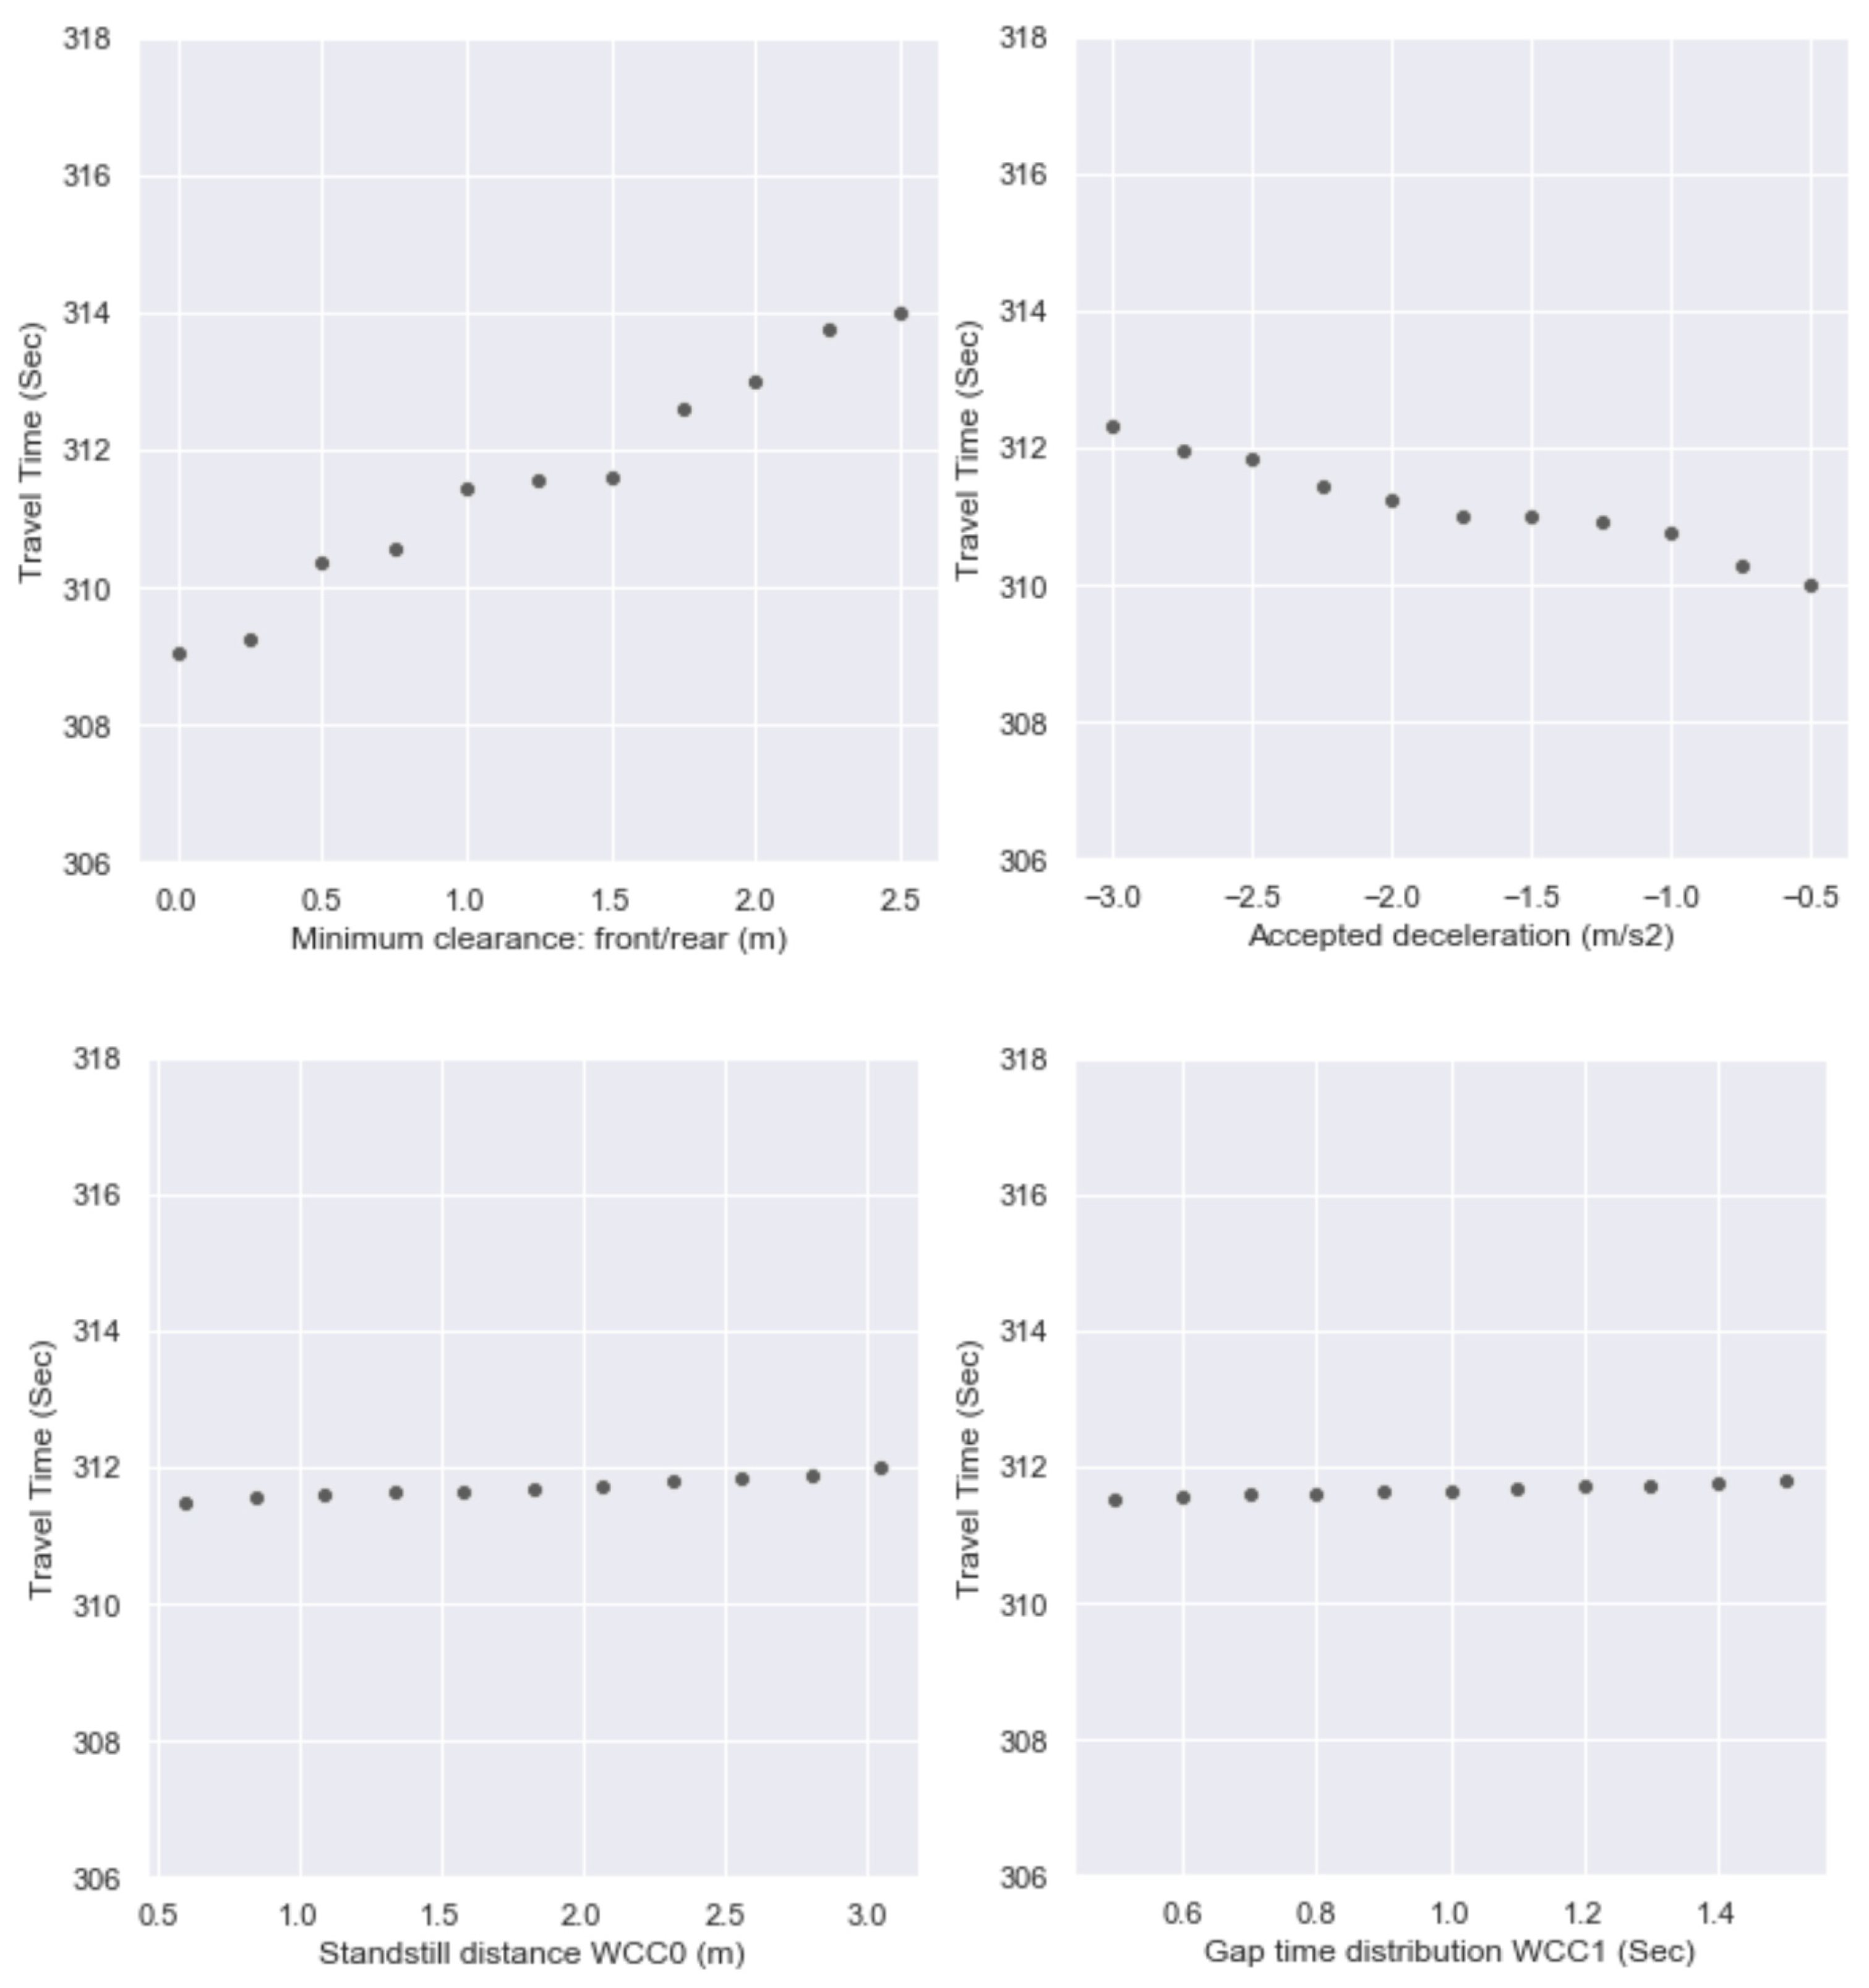
Preliminary SA has been performed for total eight driving parameters: look ahead distance, look back distance, number of interacting vehicles, minimum collision time gain, minimum clearance (front/rear), accepted deceleration, standstill distance and gap time distribution. The results of preliminary sensitivity analysis plotted in
Figure 10.
The travel time is used as performance indicator as it has shown quite distinguishable responses for this study corridor in previous sections. Two patterns of responses can be seen from the scatter plots above: proportional and inversely proportional behavior towards the performance metrics. Travel time increases proportionally in each range with each increment of minimum clearance: front/ rear or standstill distance or gap time distribution. On the other side, look ahead distance, look back distance, number of interacting vehicles, minimum collision time gain, and accepted deceleration show inversely proportional responses towards the performance indicator in each range. The look back distance, number of interacting vehicles and minimum clearance (front/rear) show domination than any other parameters, in the travel time. At this point, further sensitivity analysis can be carried out for three most influential driving parameters: number of interacting vehicles, minimum clearance (front/rear) and look back distance.
The final stage of the sensitivity analysis has been planned for two sets of driving parameters: 1. Minimum clearance (front/ rear) and number of interacting vehicles and 2. Look back distance and number of interacting vehicles. These two sets will create an experimental arrangement of two cross-correlational sensitivity analyses, where the number of interacting vehicles is presented in both setups. Two traffic performance indicators, travel time and speed, have been used to strengthen the outcomes of the SA.
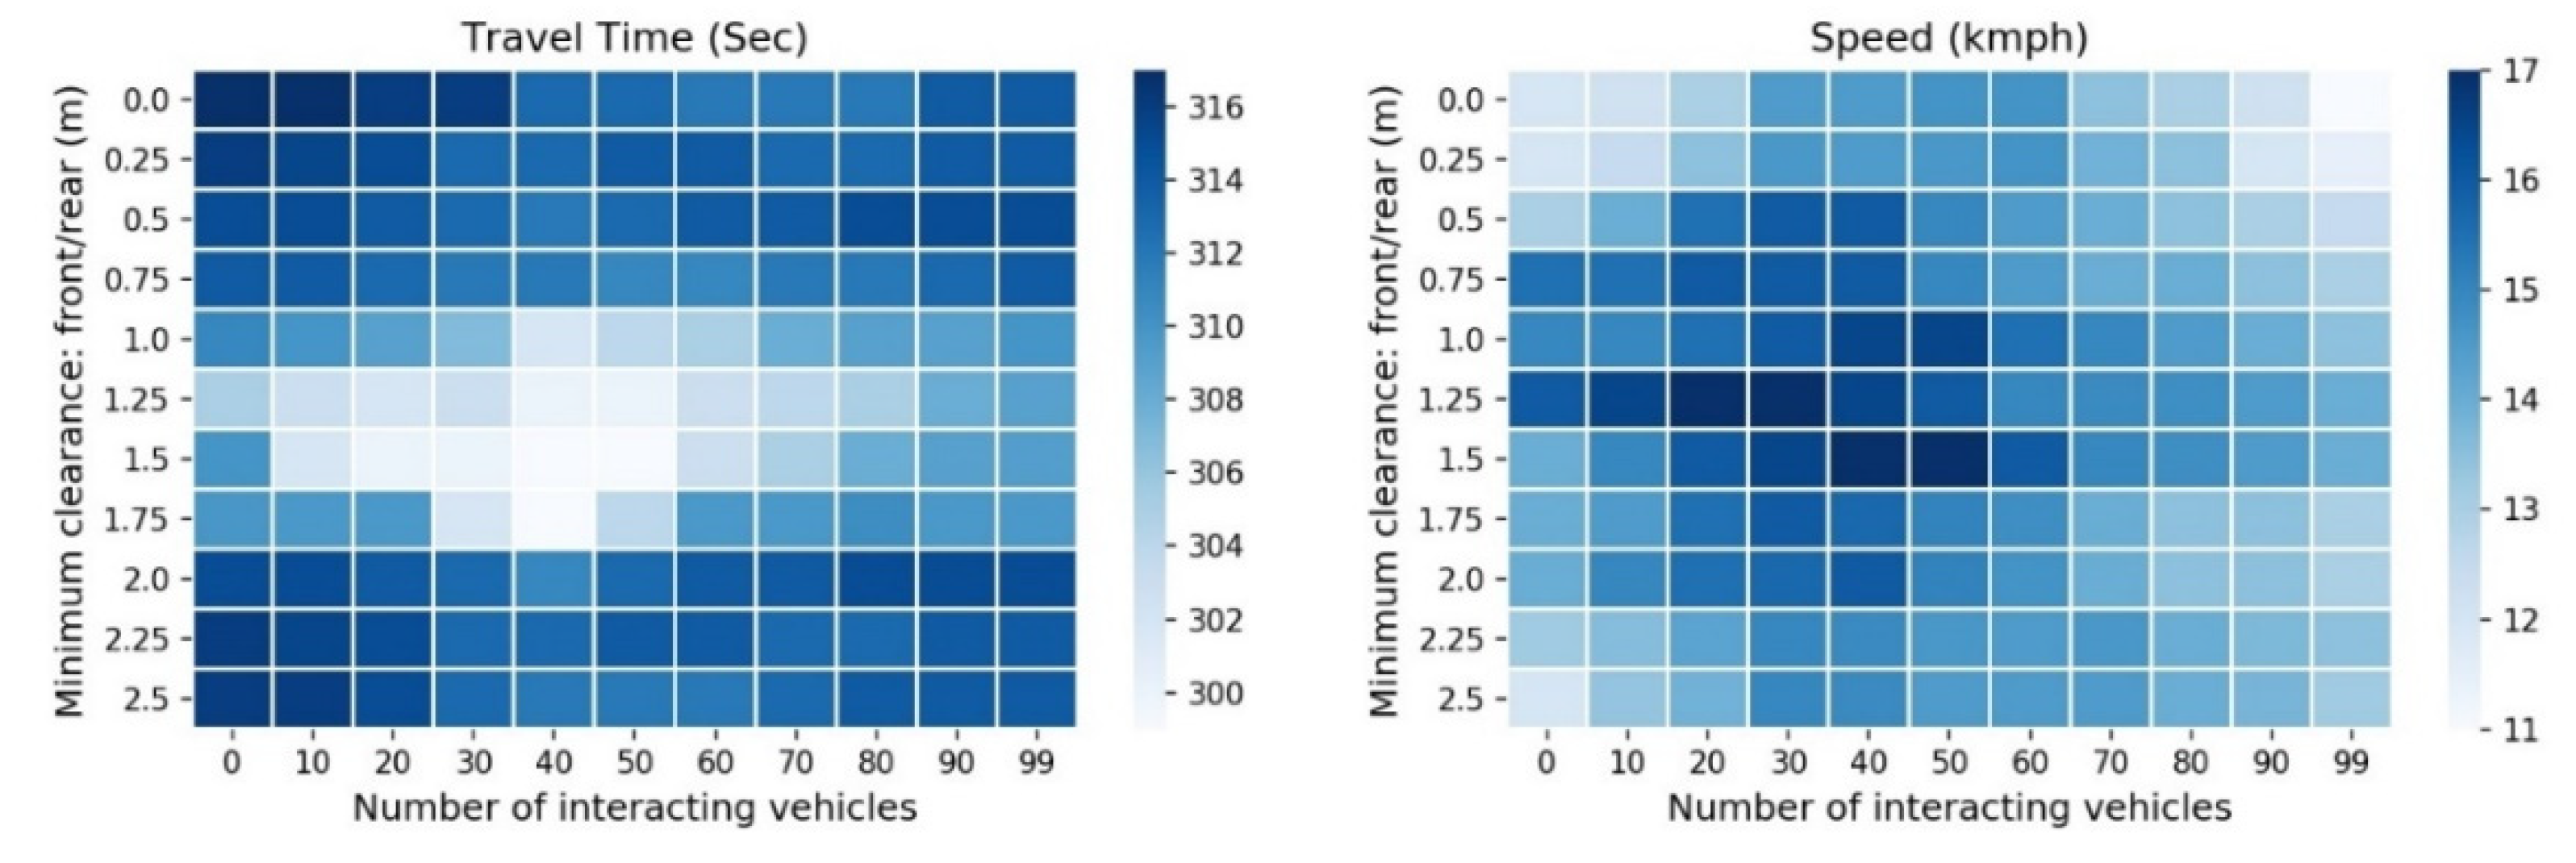
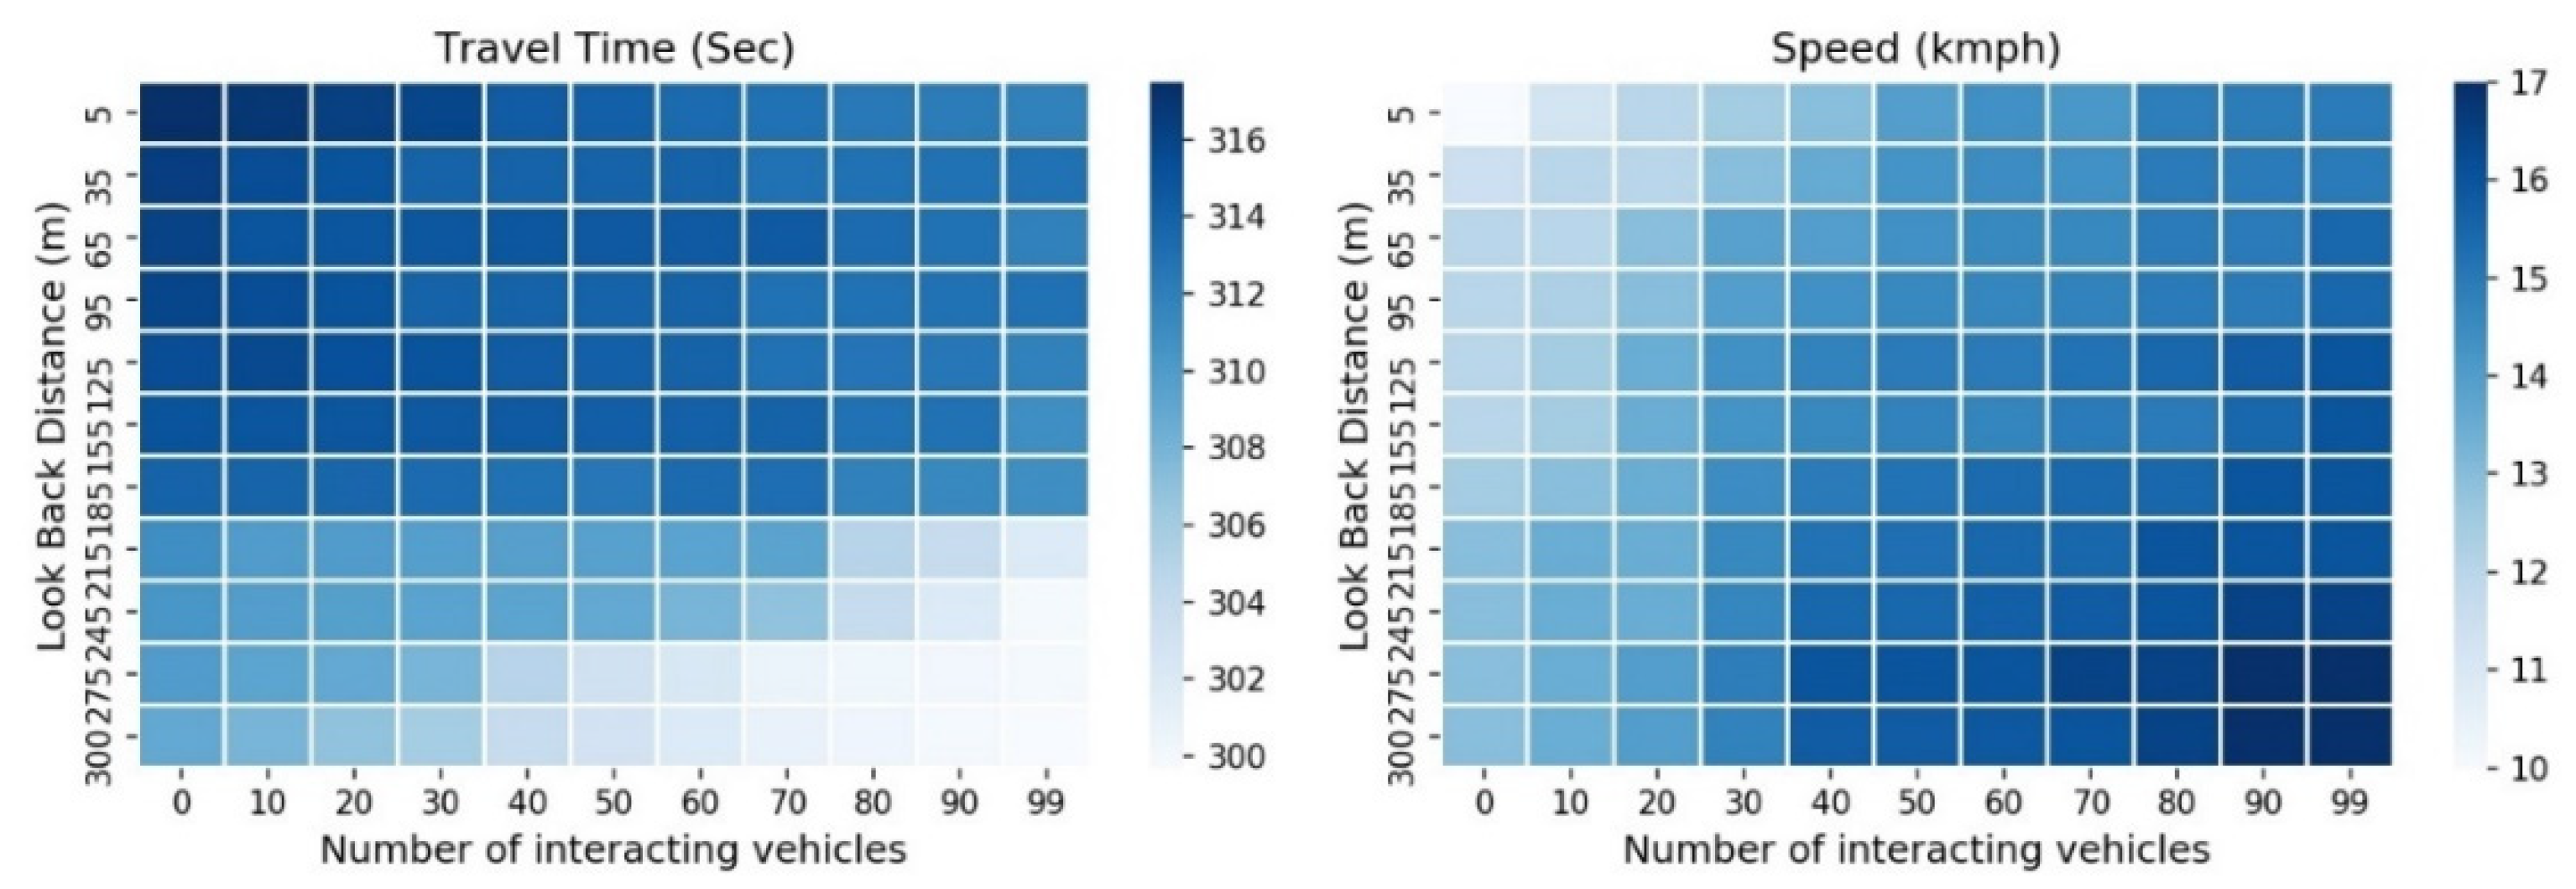
The results of the final SA are presented in
Figure 11 and
Figure 12 using a heat map. The heat map is a good demonstration for the impact study that was generated from the combination of the driving parameters. The heat map in
Figure 11 depicts how two driving parameters, one with proportional and another with in-verse proportional behavior, respond jointly in the scenarios. The lowest region of travel time, the optimum, is found in the range between 1.0 – 1.75m of minimum clearance: front/ rear and 30 – 50 of number of interacting vehicles. Similarly, the performance indicator speed becomes distinguishably high in the same range of driving parameters. This strengthens the impression of the travel time heat map.
On the contrary, the heat map in
Figure 12 depicts how two inversely proportional driving parameters correspond to one another in the scenarios. In this category of cross-correlational SA, travel time significantly decreases and speed increases for a higher number of interacting vehicles and greater look back distance.
The first goal of this research was to investigate in the impact of human-like C/AVs in the mixed traffic in the urban corridor for different driving modes and three possible traffic demand cases. The second goal was to examine in the interactions of the driving behavior parameters of the AVs in the traffic performances. The experiment has been planned to meet the goals of this study in an efficient way.
The results, from goal 1: impact study, concerning C/AVs showed improvement for the traffic performance and safety aspect of the study corridor, where CAVs slightly outperform AVs because of V2V and V2I features. Consistent increment of C/AVs share in the study corridor is found to be augmentable upto a certain limit, which displaced for different traffic demand cases. Optimum penetration levels are seen at the penetration of 60%, 50% and 70% for the peak hour demand, 20% below peak hour demand and 20% above peak hour demand, respectively. In general, average travel time and delay time of the study corridor have been decreasing, while speed and connectivity, among C/AVs, have been sharply increasing, for high penetration rates of C/AV, upto the optimum penetration. The bargaining between availability of sufficient C/AVs in the network and allowed number of interacting vehicles exhibits significant impacts in the performance. Even though the traffic demand increases, due to fixed number of interacting vehicles, performance deteriorates. Among three driving modules: nor-mal, cautious and aggressive, significant change of the performance can be seen in the out-come of this study. This change of performances is generated from driving behaviors adopted by these modules. The intensity of the performances is found to be analogous for all scenarios for every indicator: traffic performance and safety. The outcomes of the first part initiated the second part of the experimental setup by providing a choice of penetration and a driving module for further processing in the implementation of goal 2.
The results, from goal 2, concerning AVs showed significant interactions by the driving parameters in the traffic performance. A sensitivity analysis with two parts, which firstly chooses three influential driving parameters, among eight recommended driving parameters, and secondly creates cross-correlational sensitivity analysis for two pairs of combination of driving parameters, based on the substantiality seen in the preliminary stage. Pair 1 consists of minimum clearance (front/ rear) and number of interacting vehicles and pair 2 consists of look back distance and number of interacting vehicles. To obtain lowest region of travel time and highest region of speed in the performance surface of cross-correlational sensitivity heatmap, the pairs 1 and 2 outline a range of values for minimum clearance (front/ rear), look back distance, and number of interacting vehicles for 60% AV penetration of normal driving module.
The significance from the impact study and the sensitivity analysis, summarized that negative effects of the presence of the C/AVs evolved from the inability to predict the other vehicle maneuvers, missing sufficient connectivity with other vehicles and automatic risk avoidance. This scenario becomes significant while traffic demand increases in the network and participation of C/AVs is not significant in the mixed traffic. To get maximum benefits out of C/AVs, the penetration of C/AVs needed to be higher, and, at the same time, the technology/ infra-structure should support an increment in the number of interconnected vehicles.
6. Conclusion
After an effort to simulate the human alike Connected and/or autonomous vehicle (C/AVs), it became clearer that in every case C/AVs work best in 100% participation in the traffic flow and connected autonomous acts better than simple autonomous vehicle. It is because at that time the connected vehicles in a radius region behaves synchronistically. These could be advanced state of the implementation of autonomous technology but unfortunately there is a state, even in real-world, where C/AVs will get a proportion with the Human driven vehicle in the mixed traffic. This state is vulnerable in terms of traffic performance and safety, so these needs dedicated lane for the C/AVs. Safe driving mode is found to be a good solution for this time horizon until the road infrastructure and road participants are totally autonomous. Aggressive and normal mode are vulnerable for the road users and themselves as traffic performance is affected.
Acknowledgments
The authors would like to express their heartfelt gratitude to Dr. Nima Dadash-Zadeh, post-doctoral research fellow at the University of Portsmouth, for his support and guidance in this research. They are also thankful to Dr. Michalis Makridis, senior researcher at ETH Zürich (Eidgenössische Technische Hochschule Zürich) for helping to prepare the visualization.
References
- World Health Organization. WHO Global Status Report on Road Safety 2013: Supporting a Decade of Action. Geneva: World Health Organization, 2013.
- World Health Organization. WHO Global Status Report on Road Safety 2018: Summary. Geneva, World Health Organization, 2018.
- International Transport Forum. Road Safety Annual Report 2019: Germany, 2019.
- Sonja Forward. Driving Violations: Investigating Forms of Irrational Rationality, Uppsala universitet, 2008.
- Morando MM, Tian Q, Truong LT, Vu HL. Studying the Safety Impact of Autonomous Vehicles Using Simulation-Based Surrogate Safety Measures. Melbourne, VIC, Australia, Journal of Advanced Transportation, 2018.
- Alonso R. M., Ciuffo B, Makridis M, Thiel C. The r-evolution of driving: from Connected Vehicles to Coordinated Automated Road Transport (C-ART) Part I: Framework for a safe & efficient Coordinated Automated Road Transport (C-ART) system: to be published. The r-evolution of driving: from Connected Vehicles to Coordinated Automated Road Transport (C-ART). Eur. Comm. 2017;EUR 28575 EN.
- Makridis M, Mattas K, Ciuffo B, Raposo MA, Toledo T, Thiel C. Connected and Automated Vehicles on a freeway scenario. Effect on traffic congestion and network capacity. Vienna, Austria, Proceedings of 7th Transport Research Arena TRA 2018, 2018.
- Bohm F, Häger K. Introduction of Autonomous Vehicles in the Swedish Traffic System: Effects and Changes Due to the New Self-Driving Car Technology 2015.
- Pierre-Jean Rigole. Study of a Shared Autonomous Vehicles Based Mobility Solution in Stockholm. Stockholm, KTH Royal Institute of Technology, 2014.
- Li Z, Chitturi MV, Yu L, Bill AR, Noyce DA. Sustainability Effects of Next-Generation Intersection Control for Autonomous Vehicles 2015;30:342–352.
- Liu H, Xiao L, Kan X, Shladover SE, Lu X-Y, Wang M, Schakel W, van Arem B. Using Cooperative Adaptive Cruise Control (CACC) to Form High-Performance Vehicle Streams: California PATH Program, Final Report 2018.
- Mattas K, Makridis M, Hallac P, Raposo MA, Thiel C, Toledo T, Ciuffo B. Simulating deployment of connectivity and automation on the Antwerp ring road. IET Intelligent Transport Systems 2018;12:1036–1044.
- Sukennik, P. D2.5-Micro-simulation-guide-for-automated-vehicles 2018;1.0.
- Zeidler V, Sebastian B. H, Kautzsch L, Vortisch P, Weyland CM. Simulation of Autonomous Vehicles based on Wiedemann’s Car Following Model in PTV VISSIM. Washington, DC, 98th Annual Meeting of the Transportation Research Board (TRB), 2018.
- Atkins DfT. Research on the impacts of connected and autonomous vehicles on traffic flow: Stage 2: Traffic Modelling and Analysis, Technical Report, Department of Transport, 2016.
- Calvert SC, Schakel WJ, van Lint JWC. Will Automated Vehicles Negatively Impact Traffic Flow? Journal of Advanced Transportation 2017;2017:1–17.
- Parmar, R. Impact of Driverless cars on urban environment and future of mobility. Milan, Politecnico di Milano, 2018.
- PTV. VISSIM 5.30-05 User Manual 2011.
- Toledo T. Integrated Driving Behaviour Modelling. PhD Thesis 2003.
- Trommer S, Kolarova V, Fraedrich E, Kröger L, Kickhöfer B, Kuhnimhof T, Lenz B, Phleps P. Autonomous Driving: The Impact of Vehicle Automation on Mobility Behaviour, Institute for Mobility Research, 2016.
- Bagloee SA, Tavana M, Asadi M, Oliver T. Autonomous vehicles: challenges, opportunities, and future implications for transportation policies. Journal of Modern Transportation 2016;24:284–303.
- Sadid H, Qurashi M, Antoniou C. Simulation-based Optimization of Autonomous Driving Behaviors. Edited by Sadid H, Qurashi M, Antoniou C, IEEE, 2022, pp. 4101–4108.
- Shuttleworth, J. SAE Standards News: J3016 automated-driving graphic update, SAE International, 2019. https://www.sae.org/news/2019/01/sae-updates-j3016-automated-driving-graphic. Accessed 10.06.20.
- SAE International. Taxonomy and definitions for terms related to driving automation systems for on-road motor vehicles. Washington, SAE International, 2018.
- Virdi N, Grzybowska H, Waller ST, Dixit V. A safety assessment of mixed fleets with Connected and Autonomous Vehicles using the Surrogate Safety Assessment Module 2019;131:95–111.
- Aziz, MT. Comparing two different traffic simulation environments for simulating urban bicycle highway traffic - the case of SUMO and PTV VISSIM. Munich, Germany, Chair of Traffic Engineering and Control, 2018.
- Hossein, SA. Development of traffic control strategy for urban bicycle highways. Munich, Germany, Chair of Traffic Engineering and Control, 2018.
|
Disclaimer/Publisher’s Note: The statements, opinions and data contained in all publications are solely those of the individual author(s) and contributor(s) and not of MDPI and/or the editor(s). MDPI and/or the editor(s) disclaim responsibility for any injury to people or property resulting from any ideas, methods, instructions or products referred to in the content. |
© 2023 by the authors. Licensee MDPI, Basel, Switzerland. This article is an open access article distributed under the terms and conditions of the Creative Commons Attribution (CC BY) license (http://creativecommons.org/licenses/by/4.0/).


 (I is all the links in
the network)