
Submitted:
11 July 2023
Posted:
12 July 2023
You are already at the latest version
Abstract
Coronary artery disease (CAD) is a prevalent cardiovascular condition characterized by the accumulation of plaque within coronary arteries. This plaque accumulation obstructs blood flow to the heart, resulting in a heart attack. While distinct features of CAD have been identified, its causes remain largely unclear, with the exception of environmental and nutritional factors. This study aimed to investigate the connection between genetic factors and CAD, focusing on the thymidylate synthase (TS) gene, a gene involved in one-carbon metabolism. Therefore, our research targeted single nucleotide polymorphisms that could potentially impact TS gene expression and lead to dysfunction. Our findings strongly associate the TS 1100T>C and 1170A>G genotypes with CAD susceptibility. We observed that TS 1100T>C polymorphisms increased disease susceptibility in several groups, while the TS 1170A>G polymorphism displayed a decreasing trend for disease risk when interacting with clinical factors. Furthermore, our results demonstrate the potential contribution of the TS 1100/1170 haplotypes to disease susceptibility, indicating a synergistic interaction with clinical factors in disease occurrence. Based on these findings, we propose that polymorphisms in the 3'-UTR miRNA binding site of the TS gene could serve as clinically useful biomarkers for the prevention, prognosis, and management of CAD.
Keywords:
Coronary artery disease
; thymidylate synthase
; 3'-untranslated region
; genetic variants
; post-transcriptional regulation
1. Introduction
Coronary artery disease (CAD) is a vascular disorder characterized by ischemia, thrombophilia, and stenosis [1]. CAD involves the development of atherosclerotic plaques in epicardial coronary arteries [2], leading to narrowing of the coronary artery lumen and impaired antegrade myocardial blood flow. Patients who have experienced myocardial infarction (MI), undergone percutaneous coronary intervention (PCI), or received a coronary artery bypass graft are diagnosed with coronary heart disease (CHD) [3]. CAD remains the leading cause of morbidity and mortality worldwide, with an estimated 30% of adults affected by its long-term consequences. Considering the aging population and the increasing prevalence of risk factors such as obesity and diabetes, it is projected that more than 23.3 million people worldwide will succumb to acute MI, stroke, and CAD annually by 2030 (World Health Organization, 2008) [4].
In Korea, CAD exhibits a high incidence and mortality rate, prompting numerous studies on this disease [2,3,4,5]. While previous studies have proposed various causes, treatment approaches, and prognostic management strategies for CAD [5,6,7,8], the exact etiology of the disease remains elusive. Moreover, CAD manifests with varying severity, onset times, treatment responses, and prognostic outcomes among individuals, posing challenges in managing disease prognosis. Consequently, improved diagnostic methods for early CAD detection and identification of at-risk populations are crucially needed.
CAD is a complex, multifactorial, and polygenic disorder resulting from interactions between various genes and environmental factors. Several factors, such as hypertension, diabetes mellitus (DM), smoking, hyperlipidemia, and hyperhomocysteinemia, are associated with an increased risk of CAD [5]. Notably, hyperhomocysteinemia is recognized as an independent and potentially modifiable risk factor for vascular diseases. This association has been reported in numerous studies involving diverse ethnic groups [9,10,11]. Given this background, our study aimed to investigate the relationship between genetic variants of thymidylate synthase (TS), a key factor in homocysteine (Hcy) and folate metabolism, and CAD.
TS catalyzes the reductive methylation of deoxyuridine monophosphate (dUMP) by folate to produce deoxythymidine monophosphate (dTMP). It has been extensively studied in terms of its structure, function, and inhibition [12]. Typically, TS exists as a dimer composed of identical 30–35-kDa subunits. The enzyme catalyzes the reductive transfer of the methylene group from 5,10-methylene-tetrahydrofolate (5,10-MTHF) to the 5'-position of the substrate deoxyuridylic acid to form TMP and dihydrofolate (DHF) [12]. TS plays a critical role in the proliferation of cells and serves as a target for various chemotherapeutic drugs that mimic either the substrate or cofactor [13].
The TS gene belongs to the S-phase gene family, whose expression is significantly upregulated at the G1/S-phase boundary following the initiation of DNA replication. The expression of this family of genes may be coordinated through a common factor or mechanism [13,14]. Recent studies have suggested that the transcription of several S-phase genes, including DHFR and TK, may be partially controlled at the transcriptional level by the E2F family of transcription factors [15]. Previous investigations on TS mRNA regulation have focused on the insertion/deletion of nucleotides in the promoter region. Additionally, transcriptional control represents only one aspect of the regulatory mechanisms influencing the expression of numerous S-phase genes. Other levels of control include RNA processing, mRNA translation, mRNA stability, and protein stability. Each gene appears to be regulated through a unique combination of mechanisms. Despite these studies, the regulatory mechanisms of the TS gene remain largely unclear.
Therefore, our study aimed to explore disease-related TS gene polymorphisms. We investigated the association between vascular diseases, including CAD, and the TSER 2R/3R and TS 3'-UTR variants (TS 1100T>C, TS 1170A>G, and TS 1494ins/del). Furthermore, we analyzed the differences based on genetic variants in the TS 3'-UTR, focusing on synergic effect for the clinical factors of CAD.
2. Results
2.1. Clinical profiles of CAD patients and control subjects
The characteristics of CAD patients and control subjects are presented in Table 1. The CAD patient group and control group consisted of 35.8% and 36.1% males, respectively. The mean age for CAD patients and control subjects were 62.55±10.26 years and 61.44±11.52 years, respectively. Significant differences were observed in clinical factors between the CAD patients and control subjects. Specifically, there were significant differences in the levels of metabolic syndrome, BMI, hypertension, diabetes, fasting blood sugar, hyperlipidemia, HDL-C, total cholesterol, and triglyceride when comparing clinical indicators between CAD patients and control patients (P<0.05).
2.2. Genotype frequencies of TS gene polymorphisms in CAD patients and control subjects
We focused our investigations on the TSER 2R/3R, TS 1100T>C, TS 1170A>G, and TS 1494ins/del polymorphisms. Table 2 displays the genotype distributions in CAD patients and control subjects. AORs were calculated using logistic regression analysis, considering age, sex, hypertension, DM, smoking, and hyperlipidemia. The genotype frequencies of TS in the control group were consistent with the Hardy-Weinberg equilibrium expectations.
Significant differences were observed in the TS gene 3'-UTR polymorphisms TS 1100T>C and TS 1170A>G between CAD patients and control subjects. In CAD patients, the TS 1100T>C polymorphism (TT versus TC+CC: AOR=1.350, 95% CI=1.014–1.797, P=0.040) was significantly associated with an increased risk of disease compared to the control group. Conversely, the TS 1170A>G polymorphism showed a decreased occurrence risk in CAD patients (AA versus GG: AOR=0.464, 95% CI=0.242–0.889, P=0.021; AA versus AG versus GG: AOR=0.763, 95% CI=0.602–0.966, P=0.025; AA+AG versus GG: AOR=0.532, 95% CI=0.288–0.983, P=0.044) compared to the control group. Consistent with the results of the CAD, the association of the TS 1100T>C and TS 1170A>G polymorphisms with CAD is an interesting finding.
2.3. Haplotype and genotype combination analysis of TSER and TS 3’-UTR gene polymorphisms between CAD patients and control subjects
The linkage disequilibrium of TS polymorphisms at loci TSER (rs45445694), TS 1100 (rs699517), TS 1170 (rs2790), and TS 1494 (rs151264360) was examined in CAD patients and control subjects (Figure 1 and Figure S1A-B). Strong linkage disequilibrium was observed between loci TS 1100 and TS 1170 (D'=0.936, LOD=111.45, r2=0.742) between the CAD and control groups (Figure 1).
Haplotype analysis was performed for four loci (TSER/TS 1100/TS 1170/TS 1494), three loci (TSER/TS 1100/TS 1170, TSER/TS 1100/TS 1494, and TSER/TS 1170/TS 1494), and two loci (TSER/TS 1100, TSER/TS 1170, TSER/TS 1494, TS 1100/TS 1170, TS 1100/TS 1494, and TS 1170/TS 1494) associated with CAD, as presented in Table 3 and Tables S3–S5, respectively. Among the four-locus TS haplotypes, the 3R-T-G-0bp and 3R-C-A-0bp haplotypes were commonly found in CAD patients. The 3R-T-G-0bp haplotype significantly reduced the risk of CAD (OR=0.699, 95% CI=0.546–0.896, P=0.006), while the 3R-C-A-0bp haplotype significantly increased the risk of disease (OR=19.690, 95% CI=4.727–81.990, P<0.0001). In the analysis of three TS loci (Table 3), the 3R-C-0bp (TSER/TS 1100/TS 1494) and C-A-0bp (TS 1100/TS 1170/TS 1494) haplotypes were associated with CAD occurrence (OR=16.522, 95% CI=5.110–53.414, P<0.0001; OR=20.462, 95% CI=4.918–85.133, P<0.0001), while the 3R-T-G, 2R-T-A (TSER/TS 1100/TS 1170), and T-G-0bp (TS 1100/TS 1170/TS 1494) haplotypes were significantly associated with a reduced risk of CAD. Interestingly, in the haplotype analysis of two TS loci (Table 3), the 3R-G (TSER/TS 1170), T-G (TS 1100/TS 1170), C-0bp (TS 1100/TS 1494), and G-0bp (TS 1170/TS 1494) haplotypes showed a significant association with CAD risk. The C-0bp haplotype (TS 1100/TS 1494) had the highest risk effect on CAD occurrence (OR=16.551, 95% CI=5.122–53.488, P<0.0001), while the G-0bp haplotype (TS 1170/TS 1494) was most protective against CAD incidence (OR=0.671, 95% CI=0.530–0.851, P=0.001). These results of haplotype analysis also showed that continuing a significant association with CAD risk in the FDR p-value.
Genotype combination analysis was performed for TSER 2R/3R, TS 1100T>C, TS 1170A>G, and TS 1494ins/del polymorphisms, and these results showed the Table 4 and Table S6. Among genotype combination analyses, many kinds of genotype combinations in TSER/TS1170, TS 1100/TS 1170, and TS 1170/TS 1494 led to a decrease in CAD risk (Table 4). In contrast, the TC/0bp0bp genotype combination in TS 1100/TS 1494 (Table 4) is associated with a highly increased CAD risk (AOR=26.713, 95% CI=3.462–206.115, P=0.002). Interestingly, this TS 1100/1494 haplotype result is maintained in the TS 1100/TS 1494 genotype combination.
2.4. Combined effects between TS gene polymorphisms and environmental factors on CAD prevalence
We conducted stratified analyses to investigate the association between TS polymorphisms and CAD, taking into account various clinical factors including age, sex, hypertension, DM, hyperlipidemia, smoking status, plasma Hcy, and folate levels (Table S1). The TS 1100T>C polymorphism was associated with increased disease risk in the smoking group (CC versus CA+AA: AOR=2.016, 95% CI=1.159–3.507, P=0.013). On the other hand, the TS 1170A>G polymorphism was associated with a lower risk of disease in the low Hcy group (AA+AG versus GG: AOR=0.157, 95% CI=0.052–0.471, P=0.001).
We examined the interactions between the TS gene polymorphisms and environmental factors in the context of CAD (Figure 2 and Table S2). The combined effect of clinical factors and genetic polymorphisms significantly contributed to CAD. A synergistic effect was observed with plasma folate levels. In individuals with folate levels <4.85ng/ml, there was a synergistic effect between TSER 3R2R+2R2R and TS 1100TC+CC (AOR=2.250, 95% CI=1.243–4.071; AOR=2.621, 95% CI=1.585–4.333), while TS 1170 showed a synergistic effect in individuals with folate levels ≥4.85ng/ml (AOR=0.697, 95% CI=0.501–0.970). A synergistic effect with BMI values was observed in the CAD group (Figure 2). The presence of TSER 2R/3R or TS 1100T>C polymorphisms in individuals with high BMI values was associated with elevated CAD risk (TSER 2R2R+2R3R: AOR=4.210; TS 1100TC+CC: AOR=4.340) (Figure 2A and 2B). Furthermore, TS 1100TC+CC in individuals with DM was associated with elevated CAD risk (AOR=3.996) (Figure 2C). Additionally, other TS gene polymorphisms (TSER 3R2R+2R2R, TS 1100TC+CC, TS 1170AG+GG, and TS 1494 0bp6bp+6bp6bp) showed synergistic effects with multiple clinical factors (Table S2).
2.5. Baseline characteristics and genotype frequencies in CAD patients and control subjects stratified by replication groups
Baseline characteristics and genotype frequencies were compared between CAD patients and control subjects in two replication groups. A total of 844 individuals (CAD patients and control subjects) from case-control sample 1 (recruitment period: 2000 to 2006) and sample 2 (recruitment period: 2007 to 2012) were included in the analysis (Tables S7 and S8). Table S7 presents the baseline characteristics of CAD patients and control subjects in both sample groups. The CAD patients showed higher frequencies of MetS (P<0.0001, sample 1; P<0.0001, sample 2), DM (P<0.0001, sample 1; P=0.020, sample 2), and hypertension (P=0.048, sample 1; P=0.178, sample 2) compared to the controls (Table S7). Additionally, the genotype frequencies of the TS polymorphisms were significantly different between the control and CAD groups in sample 1 (Table S8).
3. Discussion
Cerebrovascular disease and cardiovascular disease share common risk factors. Particularly, stroke and CAD can mutually influence the onset of each other. Previous studies indicate that 25% of stroke patients have a medical history of CAD, and these patients are at a higher risk of experiencing semi-CAD with 30-60% presenting with symptoms of myocardial ischemia [18]. The mortality rate associated with CAD is nearly three times higher than that of stroke, underscoring the importance of screening for CAD and identifying diagnostic markers to improve prognosis [19,20]. Moreover, numerous studies have investigated the prevalence of subclinical cardiovascular disease in ischemic stroke patients using coronary computed tomographic angiography (CTA) and various surrogate markers of systemic atherosclerosis. These studies have explored the relationship between subclinical CAD and vascular risk factors [21]. Therefore, we aimed to identify associations between CAD onset and diagnostic markers. To address this objective, we recognized the necessity to investigate the onset and treatment of the disease. Based on this rationale, we comprehensively analyzed mutations in the TS gene in CAD patients and control subjects.
A recent study reported that the TSER 3R allele is associated with increased TS expression levels [20]. Therefore, it is important to understand how elevated TS expression, as influenced by 3'-UTR polymorphisms, can contribute to the occurrence and prognosis of CAD. TS plays a critical role in Hcy and folate metabolism and genetic variations in enzymes involved in this pathway can influence an individual's susceptibility to disease [23]. Studies have suggested that elevated TS expression can lead to increased Hcy levels and decreased folate levels, which in turn contribute to ischemia development [23,24]. Furthermore, plasma folate concentrations are inversely correlated with Hcy levels [25]. The role of hyperhomocysteinemia in vascular and thromboembolic disease has been extensively studied and debated, with significant vascular disease observed in individuals with markedly elevated plasma Hcy [26,27,28]. Elevated plasma Hcy is thought to increase the risk of thrombosis by causing endothelial injury in both venous and arterial vasculature [27]. Additionally, folate is essential for the de novo synthesis of purines and thymidylate, which are required for DNA replication and repair [29]. Abnormal folate status is implicated in various diseases, including cardiovascular disease, neural tube defects, cleft lip and palate, late pregnancy complications, as well as neurodegenerative and psychiatric disorders [30].
Polymorphisms in the 3'-UTR region of the TS gene can potentially affect mRNA stability and translation, leading to significant changes in gene expression. These polymorphisms can either abolish, weaken, or create binding sites for miRNAs, thereby modulating their binding activity. However, there is currently limited data available regarding the modulation of miRNA binding activity based on TS 3'-UTR polymorphisms. A study investigating the association between TS 1170A>G polymorphism and coronary heart disease risk identified miR-215 and miR-192 as potential miRNAs with binding activity [31]. This suggests that miRNAs may play a crucial role in the prevalence and progression of cardiovascular diseases, as their expression can be altered in specific genotypes [32,33,34,35]. To further understand the impact of these polymorphisms, it will be necessary to investigate the binding activity of miRNAs directly on TS 3'-UTR polymorphisms. This investigation will shed light on how these polymorphisms may influence cellular proliferation and the progression of ischemic events. Such studies may hold significant clinical implications for diseases associated with one-carbon metabolism.
In our study, we aimed to investigate the association between four TS gene polymorphisms located in the enhancer region and miRNA binding site (3'-UTR) with the prevalence and prognosis of CAD. There was a strong association between the TS 1100T>C and TS 1170A>G genotypes and susceptibility to CAD. These polymorphisms were also effective predictors of poor prognosis. Moreover, there was a synergistic effect between the TS 1170A>G polymorphism and other risk factors on CAD incidence. We observed elevated CAD prevalence when considering interactions between TSER and TS 1100T>C polymorphisms with environmental factors. Furthermore, specific haplotypes involving the TS 1100C and TS 1494 insertion alleles were significantly associated with increased CAD incidence, while the combination of the TS 1170G allele and TS 1494 insertion allele decreased CAD occurrence. To our knowledge, this is the first study providing evidence of an association between 3'-UTR polymorphisms of TS and susceptibility to CAD and its progression. Interestingly, despite the TS 1100C and TS 1170G alleles being located only 70 bp apart within the same gene, our association study revealed conflicting results in terms of their genotype effects. The TS 1100CC genotype was significantly associated with increased CAD incidence in our analysis, while the TS 1170GG genotype was associated with decreased CAD occurrence.
TS enzyme levels exhibit a significant increase in rapidly proliferating cells compared to resting cells. When resting cells are stimulated to proliferate, TS activity remains unchanged until DNA replication begins, at which point it increases by at least 10-fold during the S-phase [36]. TS mRNA content also shows a 10-fold increase as cells progress from G0 through S-phase. However, nuclear run-on transcription assays indicate minimal changes in TS gene transcription during the G1-S transition [37,38]. This suggests that regulation of TS mRNA primarily occurs at the post-transcriptional level in human and mouse cells undergoing growth stimulation. The half-life of poly(A)+ TS mRNA is approximately 8 hours in both resting and growing mouse cells [39,40,41], suggesting that mRNA stability regulation is not a critical factor. Thus, TS mRNA dysregulation profoundly affects cell proliferation and apoptosis, potentially leading to abnormalities in vascular endothelial cells and compromised blood vessel function.
Endothelial dysfunction, a precursor to cardiovascular or cerebrovascular diseases, initiates a detrimental cycle culminating in overt atherosclerosis, significant CAD, silent brain infarction (SBI), plaque rupture, and ultimately MI or ischemic stroke [44]. In addition to classic risk factors like hypertension, smoking, DM, and hypercholesterolemia, physical inactivity has emerged as an independent predictor for CAD development [24,45,46,47,48]. Therefore, the identification of genetic diagnostic markers for CAD and a comprehensive understanding of its underlying causes are crucial for effective disease management. However, the study of TS genes in the context of vascular disease remains largely unexplored. The TS gene has been extensively studied, with a focus on its implications in cancer incidence and treatment [49,50,51,52,53,54,55,56]. Particularly, there is ongoing research on pharmacogenetic activities for the development of anticancer drugs. However, limited attention has been given to the role of the TS gene in vascular-related diseases such as ischemia, thrombosis, and stenosis. Therefore, this study represents the first report on the association between the TS gene and the pathogenesis of specific vascular diseases, specifically CAD.
There are several limitations to this study. Firstly, the exact mechanism by which 3'-UTR polymorphisms in the TS gene influences CAD development remains unclear and warrants further investigation. Secondly, the control group in our study compromised individuals who sought medical attention, which may introduce biases. Future studies should consider recruiting a healthier control group with comprehensive imaging and laboratory tests to minimize potential biases in vascular factor assessment. Thirdly, our study focused on a Korean population, and therefore, the generalizability of our findings to other ethnic groups may be limited. To validate the potential of 3'-UTR variants in the TS gene as biomarkers for CAD prevention and prognosis, a larger prospective study involving diverse populations is necessary.
4. Materials and Methods
4.1. Study approval and population
The study protocols were reviewed and approved by the Institutional Review Board of CHA Bundang Medical Center in June 2000, adhering to the principles of the Declaration of Helsinki. This study recruited participants from the South Korean provinces of Seoul and Gyeonggi-do between 2000 and 2012. Informed consent was obtained from all study participants.
A total of 424 consecutive CAD patients referred from the Department of Cardiology at CHA Bundang Medical Center, CHA University, were included in the study. These patients presented with stable CAD or acute coronary syndromes, including unstable angina with or without ST-segment elevation, and had at least one coronary lesion with more than 50% stenosis in a vessel with a diameter of 2.25–4.00 mm. The screening for eligibility occurred between 2006 and 2012. There were no restrictions on the number of treated lesions, treated vessels, lesion length, or the number of stents implanted. Exclusion criteria included acute MI and a life expectancy of less than 1 year. All patients underwent coronary angiography and electrocardiography for diagnosis, which was confirmed by at least one independent experienced cardiologist.
Additionally, we selected 427 control subjects who were sex- and age-matched (±5 years) to the patient group. These control subjects were patients presenting at our hospitals during the same period for health examinations, including biochemical testing, electrocardiogram, coronary computed tomography (CT), and brain magnetic resonance imaging (MRI). Control subjects had no recent history of anginal symptoms, cerebrovascular disease, or MI. The same exclusion criteria used for the patient group were applied to the control subjects. Hypertension was defined as systolic pressure >140 mm Hg and diastolic pressure >90 mm Hg on more than one occasion, including patients currently taking hypertensive medications. DM was defined as a fasting plasma glucose level >126 mg/dL (7.0 mmol/L) and included patients taking diabetic medications. Smoking was defined as patients who were current smokers. Hyperlipidemia was defined as a high fasting serum total cholesterol level (≥240 mg/dL) or a history of treatment with an antihyperlipidemic agent. The number of control subjects (427) differs from the patient group (424) due to availability and matching criteria.
4.2. Assessment of biochemical factors
Plasma samples were collected within 49 hours of stroke onset to measure the levels of total Hcy and folate. Whole blood was collected from patients 12 hours after their last meal using tubes containing anticoagulants. Tubes were centrifuged for 15 minutes at 1000 × g to separate the plasma. Total plasma Hcy concentrations were measured using a fluorescent polarizing immunoassay with an IMx system (Abbott Laboratories, Chicago, IL, USA), while plasma folate concentrations were measured using a immunoassay kit (ACS 180; Bayer, Tarrytown, NY, USA). Levels of high-density lipoprotein-cholesterol (HDL-C) were determined using enzymatic colorimetric methods with commercial reagent sets (TBA 200FR NEO, Toshiba Medical Systems, Tokyo, Japan).
4.3. Genotyping
DNA extraction from leukocytes was conducted using a G-DEX II Genomic DNA Extraction kit (Intron Biotechnology, Seongnam, Korea) according to the manufacturer’s instructions. Genotyping of the TS gene was performed using the polymerase chain reaction-restriction fragment length polymorphism (PCR-RFLP) method, which is a cost-effective alternative to whole-genome sequencing. The TSER 2R/3R (28-bp tandem repeat) was detected using a forward primer (5'- GTG GCT CCT GCG TTT CCC CC -3') and a reverse primer (5'- GCT CCG AGC CGG CCA CAG GCA TGG CGC GG -3'). The resulting PCR products of 248-bp and 220-bp were then digested with 5U Hae III. The presence of a 113-bp fragment indicated the 2R2R genotype, while fragments of 66-bp, 47-bp, and 28-bp indicated the 2R3R genotype, and fragments of 94-bp, 47-bp, and 28-bp indicated the 3R3R genotype.
For the TS 1100T>C and TS 1170A>G genotypes, PCR-RFLP analysis was conducted using the forward primer (5’- GGT ACA ATC CGC ATC CAA CTA TTA -3’) and reverse primer (5’- CTG ATA GGT CAC GGA CAG ATT T -3’). The amplified fragment had a length of 170 bp and was digested with 5U Ban II (TS 1100T>C) or 3U Mbo II (TS 1170A>G) for 16 h at 37°C. The presence of a 170-bp fragment indicated the TT genotype for 1100T>C, while fragments of 170-bp, 108-bp, and 62-bp indicated the TC genotype, and fragments of 108-bp and 62-bp indicated the CC genotype. For TS 1170A>G, the presence of a 170-bp fragment indicated the AA genotype, fragments of 170-bp, 142-bp, and 28-bp indicated the AG genotype, and fragments of 142-bp and 28-bp indicated the GG genotype.
The TS 1494ins/del polymorphism was detected using PCR-RFLP analysis with the forward primer (5'- CAA ATC TGA GGG AGC TGA GT -3') and reverse primer (5'- CAG ATA AGT GGC AGT ACA GA -3'). The resulting 158-bp product was digested with 5U Dra I for 16 h at 37°C. The presence of a 158-bp fragment indicated the 0bp0bp genotype, fragments of 158-bp, 88-bp, and 70-bp indicated the 0bp6bp genotype, and fragments of 88-bp and 70-bp indicated the 6bp6bp genotype.
To validate the PCR-PFLP findings, 30% of the PCR assays were randomly selected and repeated. The repeated samples underwent DNA sequencing using an ABI 3730xl DNA Analyzer (Applied Biosystems, Foster City, CA, USA). The quality control samples demonstrated a 100% concordance rate.
4.4. Statistical analysis
Baseline characteristics were analyzed using chi-square tests for categorical data and Student's t-tests for continuous data to compare patient and control baseline data. The associations between TS polymorphisms and CAD incidence were estimated using adjusted odds ratios (AORs) and 95% confidence intervals (95% CIs) through multivariate logistic regression. Regression models were adjusted for age, gender, hypertension, DM, hyperlipidemia, and smoking status, as these classical risk factors for vascular abnormalities are commonly associated with CAD. GraphPad Prism 4.0 (GraphPad Software Inc., San Diego, CA, USA) and Medcalc version 12.7.1.0 (Medcalc Software, Mariakerke, Belgium) were used for statistical analyses.
Haplotypes for multiple loci were estimated using the expectation-maximization algorithm with SNPAlyze (Version 5.1; DYNACOM Co, Ltd, Yokohama, Japan). The association between TS gene polymorphisms and long-term prognosis after ischemic stroke was evaluated by tracking survival time from stroke onset to death. The p-values of the false discovery rate (FDR) were calculated when performing multiple comparisons to estimate the overall experimental error rate resulting from false-positive results[16,17]. Consequently, P-values <0.05 were considered statistically significant.
5. Conclusions
In conclusion, our study investigated the association between TSER 3R/2R, TS 1100T>C, TS 1170A>G, and TS 1494ins/del polymorphisms and the incidence and progression of CAD. Our findings demonstrated a positive correlation between these genetic variants and the occurrence of unfavorable CAD prognosis, particularly in the presence of common vascular disease risk factors such as hypertension, DM, HDL-C, Hcy, and folate. These results suggest that these TS gene polymorphisms may serve as potential biomarkers for predicting CAD susceptibility and prognosis. Further studies are needed to elucidate the underlying mechanisms and validate the clinical utility of these genetic markers in CAD prevention and personalized treatment strategies.
Supplementary Materials
The following supporting information can be downloaded at the website of this paper posted on Preprints.org. Figure S1: LD patterns of TS gene polymorphisms; Table S1: Stratified Analysis of TS gene polymorphisms for combined clinical factors in CAD patients and control subjects; Table S2: Adjusted odds ratios for CAD risk associated with TS gene polymorphisms, combined by clinical factors; Table S3: The 4 site haplotype analysis for TS gene polymorphisms in CAD patients and control subjects; Table S4: The 3 site haplotype analysis for TS gene polymorphisms CAD patients and control subjects; Table S5: The 2 site haplotype analysis for TS gene polymorphisms in CAD patients and control subjects; Table S6: Genotype combination analyses for the TS gene polymorphisms in CAD patients and controls; Table S7: Baseline characteristics between controls and stroke patients in sample 1 and 2; Table S8: Genotype frequencies of TS gene polymorphisms between CAD patients and control subjects in samples 1 and 2.
Author Contributions
Conceptualization, J.O.K. and N.K.K.; methodology, J.Y.L. and E.J.K.; validation, J.O.K., C.S.R. and I.J.K.; formal analysis, J.O.K. and C.S.R; investigation, J.O.K., C.S.R. and J.H.S.; resources, J.H.S.; data curation, J.O.K. and C.S.R; writing—original draft preparation, J.O.K.; writing—review and editing, I.J.K., J.H.S., T.S.H. and N.K.K.; visualization, J.Y.L., E.J.K. and Y.H.H; supervision, I.J.K. and N.K.K.; project administration, I.J.K. and N.K.K.; funding acquisition, I.J.K. and N.K.K. All authors have read and agreed to the published version of the manuscript.
Funding
This work was supported by a National Research Foundation of Korea (NRF) grant funded by the Korean government (NRF-2021R1G1A1094307, 2022R1F1A1064169).
Institutional Review Board Statement
The study was approved by the Institutional Review Board of CHA Bundang Medical Center (IRB number: 2013-10-114).
Informed Consent Statement
Written informed consent was obtained from all CAD patients and control subjects.
Data Availability Statement
Not applicable.
Conflicts of Interest
The authors declare no conflict of interest.
References
- Fernandez-Ortiz, A.; Fuster, V. Pathophysiology of coronary artery disease. Clin Geriatr Med 1996, 12, 1–21. [Google Scholar] [PubMed]
- Libby, P.; Theroux, P. Pathophysiology of coronary artery disease. Circulation 2005, 111, 3481–3488. [Google Scholar]
- McCullough, P.A. Coronary artery disease. Clin J Am Soc Nephrol 2007, 2, 611–616. [Google Scholar] [PubMed]
- Menees, D.S.; Bates, E.R. Evaluation of patients with suspected coronary artery disease. Coron Artery Dis 2010, 21, 386–390. [Google Scholar]
- Stolker, J.M.; Lim, M.J. Update in the management of coronary artery disease. Mo Med 2012, 109, 137–141. [Google Scholar] [PubMed]
- Perdoncin, E.; Duvernoy, C. Treatment of Coronary Artery Disease in Women. Methodist Debakey Cardiovasc J 2017, 13, 201–208. [Google Scholar] [PubMed]
- Huang, J.; Huang, S.; Li, J.; Li, M.; Gong, L.; Li, T.; Gu, L. CALM1 rs3179089 polymorphism might contribute to coronary artery disease susceptibility in Chinese male: a case-control study. Genes Genomics 2022, 44, 415–423. [Google Scholar] [PubMed]
- Liang, T.; Liang, A.; Zhang, X.; Wang, Q.; Wu, H.; He, J.; Jin, T. The association study between CYP20A1, CYP4F2, CYP2D6 gene polymorphisms and coronary heart disease risk in the Han population in southern China. Genes Genomics 2022, 44, 1125–1135. [Google Scholar]
- Lievers, K.J.; Kluijtmans, L.A.; Blom, H.J. Genetics of hyperhomocysteinaemia in cardiovascular disease. Ann Clin Biochem 2003, 40 (Pt 1), 46–59. [Google Scholar] [CrossRef]
- Kim, I.J.; Kim, S.H.; Cha, D.H.; Lim, S.W.; Moon, J.Y.; Kim, J.O.; Ryu, C.S.; Park, H.S.; Sung, J.H.; Kim, N.K. Association of COX2 -765G>C promoter polymorphism and coronary artery disease in Korean population. Genes Genomics 2019, 41, 1055–1062. [Google Scholar]
- Biselli, P.M.; Guerzoni, A.R.; de Godoy, M.F.; Eberlin, M.N.; Haddad, R.; Carvalho, V.M.; Vannucchi, H.; Pavarino-Bertelli, E.C.; Goloni-Bertollo, E.M. Genetic polymorphisms involved in folate metabolism and concentrations of methylmalonic acid and folate on plasma homocysteine and risk of coronary artery disease. J Thromb Thrombolysis 2010, 29, 32–40. [Google Scholar]
- Trinh, B.N.; Ong, C.N.; Coetzee, G.A.; Yu, M.C.; Laird, P.W. Thymidylate synthase: a novel genetic determinant of plasma homocysteine and folate levels. Hum Genet 2002, 111, 299–302. [Google Scholar] [CrossRef] [PubMed]
- Liu, J.; Schmitz, J.C.; Lin, X.; Tai, N.; Yan, W.; Farrell, M.; Bailly, M.; Chen, T.; Chu, E. Thymidylate synthase as a translational regulator of cellular gene expression. Biochim Biophys Acta 2002, 1587, 174–182. [Google Scholar] [CrossRef] [PubMed]
- Tai, N.; Schmitz, J.C.; Liu, J.; Lin, X.; Bailly, M.; Chen, T.M.; Chu, E. Translational autoregulation of thymidylate synthase and dihydrofolate reductase. Front Biosci 2004, 9, 2521–2526. [Google Scholar] [CrossRef] [PubMed]
- Farnham, P.J.; Slansky, J.E.; Kollmar, R. The role of E2F in the mammalian cell cycle. Biochim Biophys Acta 1993, 1155, 125–131. [Google Scholar]
- Chen, J.J.; Roberson, P.K.; Schell, M.J. The false discovery rate: a key concept in large-scale genetic studies. Cancer Control 2010, 17, 58–62. [Google Scholar]
- Mei, S.; Karimnezhad, A.; Forest, M.; Bickel, D.R.; Greenwood, C.M.T. The performance of a new local false discovery rate method on tests of association between coronary artery disease (CAD) and genome-wide genetic variants. PLoS One 2017, 12, e0185174. [Google Scholar]
- White, H.; Boden-Albala, B.; Wang, C.; Elkind, M.S.; Rundek, T.; Wright, C.B.; Sacco, R.L. Ischemic stroke subtype incidence among whites, blacks, and Hispanics: the Northern Manhattan Study. Circulation 2005, 111, 1327–1331. [Google Scholar] [CrossRef]
- Hartmann, A.; Rundek, T.; Mast, H.; Paik, M.C.; Boden-Albala, B.; Mohr, J.P.; Sacco, R.L. Mortality and causes of death after first ischemic stroke: the Northern Manhattan Stroke Study. Neurology 2001, 57, 2000–2005. [Google Scholar] [CrossRef]
- Touze, E.; Varenne, O.; Chatellier, G.; Peyrard, S.; Rothwell, P.M.; Mas, J.L. Risk of myocardial infarction and vascular death after transient ischemic attack and ischemic stroke: a systematic review and meta-analysis. Stroke 2005, 36, 2748–2755. [Google Scholar] [CrossRef]
- Hoshino, A.; Nakamura, T.; Enomoto, S.; Kawahito, H.; Kurata, H.; Nakahara, Y.; Ijichi, T. Clinical utility of evaluating intracranial artery stenosis and silent brain infarction to predict the presence of subclinical coronary artery disease in ischemic stroke patients. Intern Med 2008, 47, 1775–1781. [Google Scholar] [PubMed]
- Hammad, H.; Sarkar, M.; Gupta, N.; Ardalan, B.; Subbarayan, P.R. The presence of three repeats in the 5' UTR region of thymidylate synthase (TS) is associated with increased TS mRNA expression in cultured human cancer cell lines in vitro. Oncol Rep 2012, 27, 246–249. [Google Scholar] [PubMed]
- Ho, V.; Massey, T.E.; King, W.D. Effects of methionine synthase and methylenetetrahydrofolate reductase gene polymorphisms on markers of one-carbon metabolism. Genes Nutr 2013, 8, 571–580. [Google Scholar]
- Kim, O.J.; Hong, S.P.; Ahn, J.Y.; Hong, S.H.; Hwang, T.S.; Kim, S.O.; Yoo, W.; Oh, D.; Kim, N.K. Influence of combined methionine synthase (MTR 2756A > G) and methylenetetrahydrofolate reductase (MTHFR 677C > T) polymorphisms to plasma homocysteine levels in Korean patients with ischemic stroke. Yonsei Med J 2007, 48, 201–209. [Google Scholar] [PubMed]
- Brevik, A.; Vollset, S.E.; Tell, G.S.; Refsum, H.; Ueland, P.M.; Loeken, E.B.; Drevon, C.A.; Andersen, L.F. Plasma concentration of folate as a biomarker for the intake of fruit and vegetables: the Hordaland Homocysteine Study. Am J Clin Nutr 2005, 81, 434–439. [Google Scholar] [PubMed]
- McCully, K.S. Vascular pathology of homocysteinemia: implications for the pathogenesis of arteriosclerosis. Am J Pathol 1969, 56, 111–128. [Google Scholar]
- Joachim, E.; Goldenberg, N.A.; Bernard, T.J.; Armstrong-Wells, J.; Stabler, S.; Manco-Johnson, M.J. The methylenetetrahydrofolate reductase polymorphism (MTHFR c.677C>T) and elevated plasma homocysteine levels in a U.S. pediatric population with incident thromboembolism. Thromb Res 2013, 132, 170–174. [Google Scholar]
- Park, S.Y.; An, S.A.; Lee, H.B.; Kim, Y.; Kim, N.K.; Kim, S.H.; Kim, O.J.; Oh, S.H. Different impact of hyperhomocysteinemia on cerebral small vessel ischemia and cervico-cerebral atherosclerosis in non-stroke individuals. Thromb Res 2013, 131, e12-6. [Google Scholar] [CrossRef]
- Nazki, F.H.; Sameer, A.S.; Ganaie, B.A. Folate: metabolism, genes, polymorphisms and the associated diseases. Gene 2014, 533, 11–20. [Google Scholar]
- Blom, H.J.; Smulders, Y. Overview of homocysteine and folate metabolism. With special references to cardiovascular disease and neural tube defects. J Inherit Metab Dis 2011, 34, 75–81. [Google Scholar]
- Boni, V.; Bitarte, N.; Cristobal, I.; Zarate, R.; Rodriguez, J.; Maiello, E.; Garcia-Foncillas, J.; Bandres, E. miR-192/miR-215 influence 5-fluorouracil resistance through cell cycle-mediated mechanisms complementary to its post-transcriptional thymidilate synthase regulation. Mol Cancer Ther 2010, 9, 2265–2275. [Google Scholar] [PubMed]
- Wu, C.; Gong, Y.; Sun, A.; Zhang, Y.; Zhang, C.; Zhang, W.; Zhao, G.; Zou, Y.; Ge, J. The human MTHFR rs4846049 polymorphism increases coronary heart disease risk through modifying miRNA binding. Nutr Metab Cardiovasc Dis 2013, 23, 693–698. [Google Scholar] [CrossRef]
- Duan, L.; Liu, C.; Hu, J.; Liu, Y.; Wang, J.; Chen, G.; Li, Z.; Chen, H. Epigenetic mechanisms in coronary artery disease: The current state and prospects. Trends Cardiovasc Med 2018, 28, 311–319. [Google Scholar]
- Labbaf, A.; Ghaedi, H.; Alipoor, B.; Omrani, M.D.; Kazerouni, F.; Shanaki, M.; Ghaffarzadeh, M.; Pashaiefar, H.; Rahimipour, A. The pre-mir-499 Variant rs3746444 May Contribute to Coronary Artery Disease Susceptibility: a Case-Control and Meta-Analysis Study. Clin Lab 2017, 63, 587–595. [Google Scholar] [CrossRef]
- Yuan, M.; Zhan, Q.; Duan, X.; Song, B.; Zeng, S.; Chen, X.; Yang, Q.; Xia, J. A functional polymorphism at miR-491-5p binding site in the 3'-UTR of MMP-9 gene confers increased risk for atherosclerotic cerebral infarction in a Chinese population. Atherosclerosis 2013, 226, 447–452. [Google Scholar] [CrossRef]
- Navalgund, A.A.; Alifimoff, J.K.; Jakymec, A.J.; Bleyaert, A.L. Amiodarone-induced sinus arrest successfully treated with ephedrine and isoproterenol. Anesth Analg 1986, 65, 414–416. [Google Scholar]
- Jenh, C.H.; Rao, L.G.; Johnson, L.F. Regulation of thymidylate synthase enzyme synthesis in 5-fluorodeoxyuridine-resistant mouse fibroblasts during the transition from the resting to growing state. J Cell Physiol 1985, 122, 149–154. [Google Scholar]
- Ayusawa, D.; Shimizu, K.; Koyama, H.; Kaneda, S.; Takeishi, K.; Seno, T. Cell-cycle-directed regulation of thymidylate synthase messenger RNA in human diploid fibroblasts stimulated to proliferate. J Mol Biol 1986, 190, 559–567. [Google Scholar]
- Jenh, C.H.; Geyer, P.K.; Baskin, F.; Johnson, L.F. Thymidylate synthase gene amplification in fluorodeoxyuridine-resistant mouse cell lines. Mol Pharmacol 1985, 28, 80–85. [Google Scholar] [PubMed]
- Jenh, C.H.; Geyer, P.K.; Johnson, L.F. Control of thymidylate synthase mRNA content and gene transcription in an overproducing mouse cell line. Mol Cell Biol 1985, 5, 2527–2532. [Google Scholar] [PubMed]
- Ayusawa, D.; Koyama, H.; Shimizu, K.; Kaneda, S.; Takeishi, K.; Seno, T. Induction, by thymidylate stress, of genetic recombination as evidenced by deletion of a transferred genetic marker in mouse FM3A cells. Mol Cell Biol 1986, 6, 3463–3469. [Google Scholar] [PubMed]
- Linke, A.; Erbs, S.; Hambrecht, R. Effects of exercise training upon endothelial function in patients with cardiovascular disease. Front Biosci 2008, 13, 424–432. [Google Scholar] [PubMed]
- Erbs, S.; Linke, A.; Hambrecht, R. Effects of exercise training on mortality in patients with coronary heart disease. Coron Artery Dis 2006, 17, 219–225. [Google Scholar] [PubMed]
- Erbs, S.; Mobius-Winkler, S.; Linke, A.; Adams, V.; Doll, N.; Gielen, S.; Gummert, J.F.; Mohr, F.W.; Schuler, G.; Hambrecht, R. Both T-786C and G894T polymorphism of endothelial nitric oxide synthase affect in-vitro endothelium-dependent relaxation of internal mammary artery rings from patients with coronary artery disease. Eur J Cardiovasc Prev Rehabil 2006, 13, 826–831. [Google Scholar] [CrossRef]
- Park, D.W.; Yun, S.C.; Lee, S.W.; Kim, Y.H.; Lee, C.W.; Hong, M.K.; Kim, J.J.; Choo, S.J.; Song, H.; Chung, C.H.; Lee, J.W.; Park, S.W.; Park, S.J. Long-term mortality after percutaneous coronary intervention with drug-eluting stent implantation versus coronary artery bypass surgery for the treatment of multivessel coronary artery disease. Circulation 2008, 117, 2079–2086. [Google Scholar] [CrossRef]
- Jing, J.; Su, L.; Zeng, Y.; Tang, X.; Wei, J.; Wang, L.; Zhou, L. Variants in 9p21 Predicts Severity of Coronary Artery Disease in a Chinese Han Population. Ann Hum Genet 2016, 80, 274–281. [Google Scholar]
- Bae, J.; Kim, I.J.; Hong, S.H.; Sung, J.H.; Lim, S.W.; Cha, D.H.; Cho, Y.W.; Oh, D.; Kim, N.K. Association of endothelial nitric oxide synthase polymorphisms with coronary artery disease in Korean individuals with or without diabetes mellitus. Exp Ther Med 2010, 1, 719–724. [Google Scholar] [CrossRef]
- Park, H.S.; Sung, J.H.; Ryu, C.S.; Lee, J.Y.; Ko, E.J.; Kim, I.J.; Kim, N.K. The Synergistic Effect of Plasminogen Activator Inhibitor-1 (PAI-1) Polymorphisms and Metabolic Syndrome on Coronary Artery Disease in the Korean Population. J Pers Med 2020, 10. [Google Scholar] [CrossRef]
- Pullarkat, S.T.; Stoehlmacher, J.; Ghaderi, V.; Xiong, Y.P.; Ingles, S.A.; Sherrod, A.; Warren, R.; Tsao-Wei, D.; Groshen, S.; Lenz, H.J. Thymidylate synthase gene polymorphism determines response and toxicity of 5-FU chemotherapy. Pharmacogenomics J 2001, 1, 65–70. [Google Scholar]
- Villafranca, E.; Okruzhnov, Y.; Dominguez, M.A.; Garcia-Foncillas, J.; Azinovic, I.; Martinez, E.; Illarramendi, J.J.; Arias, F.; Martinez Monge, R.; Salgado, E.; Angeletti, S.; Brugarolas, A. Polymorphisms of the repeated sequences in the enhancer region of the thymidylate synthase gene promoter may predict downstaging after preoperative chemoradiation in rectal cancer. J Clin Oncol 2001, 19, 1779–1786. [Google Scholar]
- Ulrich, C.M.; Bigler, J.; Velicer, C.M.; Greene, E.A.; Farin, F.M.; Potter, J.D. Searching expressed sequence tag databases: discovery and confirmation of a common polymorphism in the thymidylate synthase gene. Cancer Epidemiol Biomarkers Prev 2000, 9, 1381–1385. [Google Scholar] [PubMed]
- Lenz, H.J.; Anderson, W.F.; Hall, F.L.; Gordon, E.M. Clinical protocol. Tumor site specific phase I evaluation of safety and efficacy of hepatic arterial infusion of a matrix-targeted retroviral vector bearing a dominant negative cyclin G1 construct as intervention for colorectal carcinoma metastatic to liver. Hum Gene Ther 2002, 13, 1515–1537. [Google Scholar] [PubMed]
- Jeon, Y.J.; Cho, S.H.; Kim, E.J.; Ryu, C.S.; Park, H.S.; Kim, J.W.; Lee, J.Y.; An, H.J.; Kim, N.K. 3'-UTR Polymorphisms in Thymidylate Synthase with Colorectal Cancer Prevalence and Prognosis. J Pers Med 2021, 11. [Google Scholar] [CrossRef] [PubMed]
- Lee, J.; Jeong, C.K.; Hong, S.P.; Chong, S.Y.; Oh, D.; Hwang, S.G.; Ahn, D.H.; Kim, S.; Han, J.H.; Kim, N.K. [Clinical significance of thymidylate synthase and methylenetetrahydrofolate reductase gene polymorphism in Korean patients with gastric cancer]. Korean J Gastroenterol 2005, 46, 32–38. [Google Scholar]
- Yim, D.J.; Kim, O.J.; An, H.J.; Kang, H.; Ahn, D.H.; Hwang, S.G.; Oh, D.; Kim, N.K. Polymorphisms of thymidylate synthase gene 5'- and 3'-untranslated region and risk of gastric cancer in Koreans. Anticancer Res 2010, 30, 2325–2330. [Google Scholar]
- Kang, S.Y.; Lee, S.J.; Hong, S.H.; Chung, Y.K.; Oh, H.S.; Kim, S.W.; Yim, D.J.; Kim, N.K. Polymorphisms of 5,10-methylenetetrahydrofolate reductase and thymidylate synthase in squamous cell carcinoma and basal cell carcinoma of the skin. Mol Med Rep 2010, 3, 741–747. [Google Scholar]
Figure 1.
LD patterns of TS gene polymorphisms. The values in the squares denote LD between single markers. The association analysis for LD block in control subjects and CAD patient exhibited strong LD block for TS 1100/1170. Dark squares indicate high r2 values and light squares indicate low r2 values. LD, linkage disequilibrium; TS, thymidylate synthase; CAD, coronary artery disease.
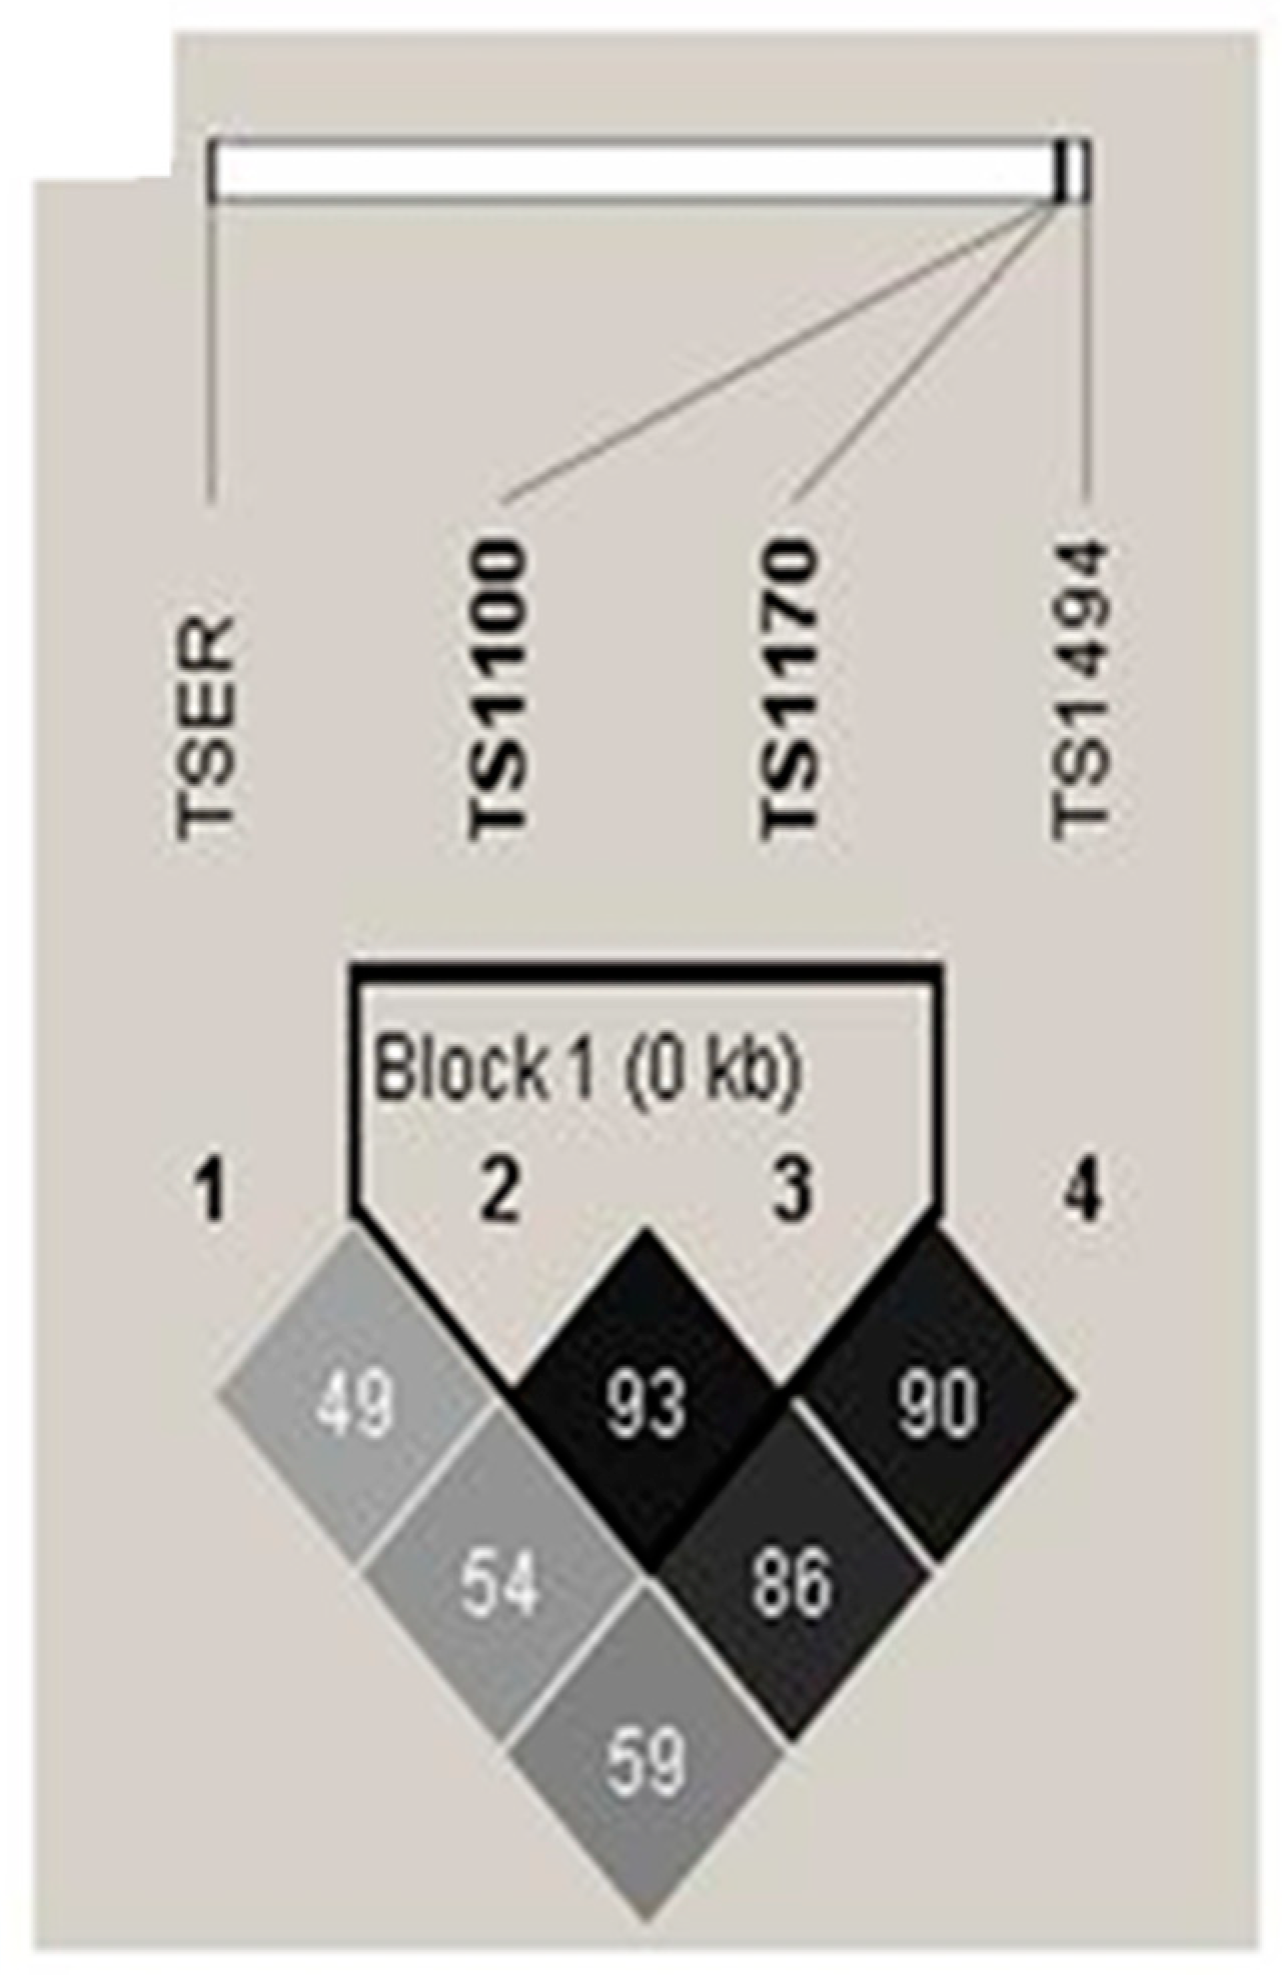
Figure 2.
The synergic effect analysis for interplay between clinical factors (body mass index values, diabetes mellitus) and TS polymorphisms in coronary artery disease prevalence. (A) TSER 2R/3R with body mass index (BMI), (B) TS 1100T>C polymorphism with BMI value, and (C) TS 1100T>C polymorphism with diabetes mellitus (DM).
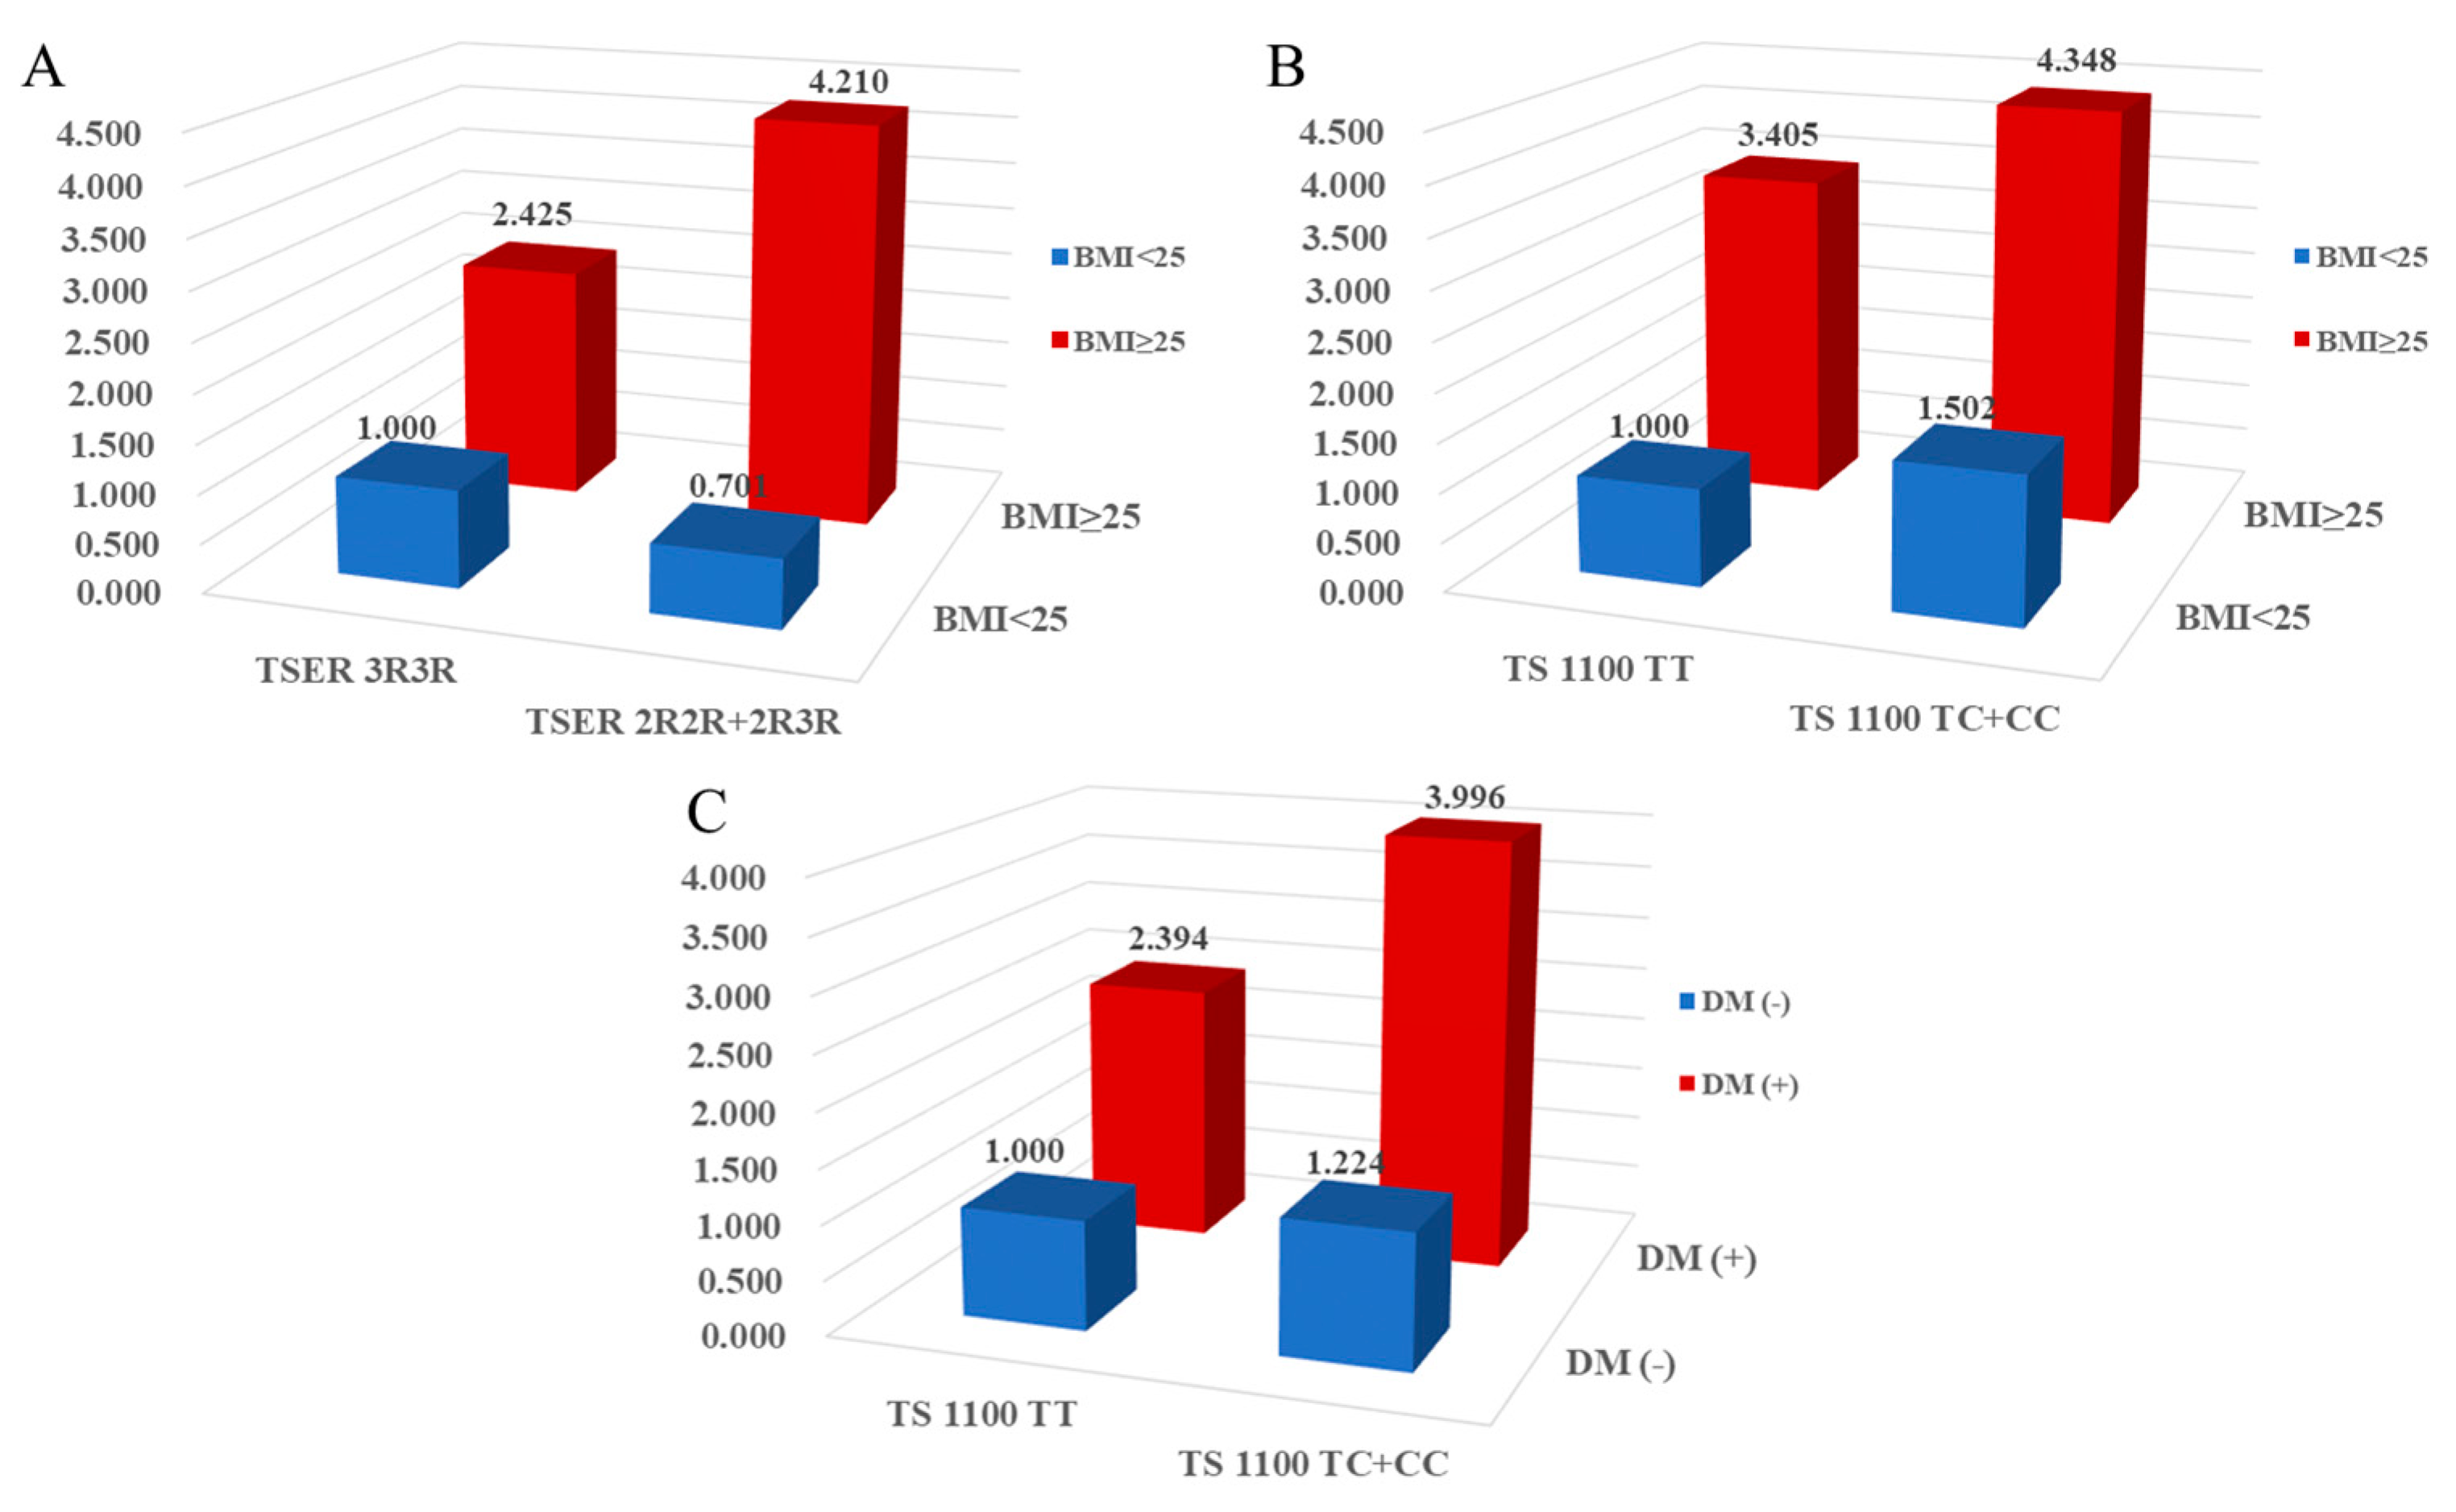

Table 1.
Baseline characteristics between controls and CAD patients.
| Characteristic | Controls | CAD patients | P |
|---|---|---|---|
| (n=427) | (n=424) | ||
| Male (n, %) | 153 (35.8) | 153 (36.1) | 0.375 |
| Age (years, mean ± SD) | 61.44±11.52 | 62.55±10.26 | 0.136 |
| Hypertension (n, %) | 171 (40.0) | 226 (57.4) | <0.0001 |
| Diabetes mellitus (n, %) | 51 (11.9) | 119 (30.2) | <0.0001 |
| Hyperlipidemia (n, %) | 97 (22.7) | 116 (29.4) | 0.028 |
| Smoking (n, %) | 136 (31.9) | 101 (25.6) | 0.049 |
| Body mass index (kg/cm2, mean ± SD) | 24.26±3.34 | 25.21±3.12 | <0.001 |
| Fasting blood sugar (mg/dL, mean ± SD) | 111.98±33.93 | 141.23±63.78 | <0.001 |
| HbA1c (%, mean ± SD) | 6.08±1.16 | 6.67±2.99 | 0.048 |
| HDL-C (mg/dl, mean ± SD) | 47.02±13.90 | 43.83±11.58 | 0.005 |
| LDL-C (mg/dl, mean ± SD) | 121.31±43.32 | 111.87±38.20 | 0.012 |
| Total cholesterol (mg/dl, mean ± SD) | 194.02±38.14 | 185.98±45.06 | 0.006 |
| Triglyceride (mg/dl, mean ± SD) | 142.16±86.73 | 155.52±97.04 | 0.037 |
| Hcy (μmol/L, mean ± SD) | 9.77±3.91 | 9.92±5.09 | 0.620 |
| Folate (nmol/L, mean ± SD) | 9.14±7.94 | 8.69±9.73 | 0.467 |
P-values were calculated by two-sided t-test for continuous variables and chi-square test for categorical variables. HDL-C, high density lipoprotein-cholesterol; LDL-C, low density lipoprotein-cholesterol; Hcy, homocysteine; HbA1c, hemoglobin A1c.
Table 2.
Genotype frequencies of TS gene polymorphisms between CAD patients and control subjects.
| Genotypes | Controls | CAD | AOR (95% CI)* | Pa | FDR-P |
|---|---|---|---|---|---|
| (n=427) | (n=424) | ||||
| TSER | |||||
| 3R3R | 296 (69.3) | 301 (71.0) | 1.000 (reference) | ||
| 2R3R | 123 (28.8) | 115 (27.1) | 0.934 (0.677-1.288) | 0.676 | 0.676 |
| 2R2R | 8 (1.9) | 8 (1.9) | 1.139 (0.401-3.236) | 0.807 | 0.807 |
| Additive model | 0.964 (0.725-1.281) | 0.800 | 0.800 | ||
| Dominant model | 0.945 (0.691-1.293) | 0.724 | 0.724 | ||
| Recessive model | 1.141 (0.398-3.271) | 0.806 | 0.826 | ||
| HWE-P | 0.240 | 0.431 | |||
| TS 1100T>C | |||||
| TT | 217 (50.8) | 194 (45.8) | 1.000 (reference) | ||
| TC | 177 (41.5) | 189 (44.6) | 1.333 (0.989-1.798) | 0.060 | 0.240 |
| CC | 33 (7.7) | 41 (9.7) | 1.344 (0.786-2.298) | 0.281 | 0.562 |
| Additive model | 1.249 (1.000-1.562) | 0.050 | 0.100 | ||
| Dominant model | 1.350 (1.014-1.797) | 0.040 | 0.158 | ||
| Recessive model | 1.230 (0.738-2.052) | 0.427 | 0.826 | ||
| HWE-P | 0.709 | 0.607 | |||
| TS 1170A>G | |||||
| AA | 211 (49.4) | 234 (55.2) | 1.000 (reference) | ||
| AG | 183 (42.9) | 172 (40.6) | 0.832 (0.618-1.121) | 0.227 | 0.454 |
| GG | 33 (7.7) | 18 (4.2) | 0.464 (0.242-0.889) | 0.021 | 0.084 |
| Additive model | 0.763 (0.602-0.966) | 0.025 | 0.100 | ||
| Dominant model | 0.773 (0.580-1.030) | 0.079 | 0.158 | ||
| Recessive model | 0.532 (0.288-0.983) | 0.044 | 0.176 | ||
| HWE-P | 0.439 | 0.084 | |||
| TS 1494ins/del | |||||
| 0bp0bp | 195 (45.7) | 211 (49.8) | 1.000 (reference) | ||
| 0bp6bp | 193 (45.2) | 174 (41.0) | 0.907 (0.673-1.223) | 0.522 | 0.676 |
| 6bp6bp | 39 (9.1) | 39 (9.2) | 0.878 (0.521-1.480) | 0.625 | 0.807 |
| Additive model | 0.934 (0.749-1.164) | 0.542 | 0.723 | ||
| Dominant model | 0.908 (0.683-1.208) | 0.508 | 0.677 | ||
| Recessive model | 0.946 (0.574-1.557) | 0.826 | 0.826 | ||
| HWE-P | 0.372 | 0.717 |
Abbreviations: AOR, adjusted odds ratio; 95% CI, 95% confidence interval; CAD, coronary artery disease; TSER, thymidylate synthase enhancer region; TS, thymidylate synthase; HWE, Hardy–Weinberg equilibrium; FDR, false discovery rate. *The AOR on the basis of risk factors such as age, gender, hypertension, diabetes mellitus, hyperlipidemia, and smoking. a P-value calculated by multivariable logistic regression. The P-value<0.05 showed the bold type in Table 2.
Table 3.
The haplotype analyses for TS gene polymorphisms in CAD patients and control subjects.
| Haplotype | Control (2n=854) | CAD (2n=848) | OR (95% CI) | Pa | FDR-P |
|---|---|---|---|---|---|
| TSER/TS1100/1170/1494 | |||||
| 3R-T-A-0bp | 0.3554 | 0.3916 | 1.000 (reference) | ||
| 3R-T-G-0bp | 0.2780 | 0.2133 | 0.699 (0.546-0.896) | 0.006 | 0.039 |
| 3R-C-A-0bp | 0.0024 | 0.0512 | 19.690 (4.727-81.990) | <0.0001 | 0.001 |
| TSER/TS1100/1170 | |||||
| 3R-T-A | 0.3781 | 0.4148 | 1.000 (Reference) | ||
| 3R-T-G | 0.2794 | 0.2132 | 0.695 (0.544 - 0.888) | 0.003 | 0.021 |
| 2R-T-A | 0.048 | 0.0307 | 0.582 (0.348 - 0.973) | 0.033 | 0.116 |
| TSER/TS1100/1494 | |||||
| 3R-T-0bp | 0.6336 | 0.6049 | 1.000 (Reference) | ||
| 3R-C-0bp | 0.0037 | 0.0550 | 16.522 (5.110 - 53.414) | <0.0001 | 0.001 |
| TSER/TS1170/1494 | |||||
| 3R-A-0bp | 0.3592 | 0.4487 | 1.000 (Reference) | ||
| 3R-A-6bp | 0.1965 | 0.1792 | 0.731 (0.560 - 0.954) | 0.021 | 0.053 |
| 3R-G-0bp | 0.2782 | 0.2109 | 0.608 (0.475 - 0.777) | <0.0001 | 0.001 |
| 2R-A-0bp | 0.0355 | 0.0231 | 0.539 (0.300 - 0.967) | 0.033 | 0.053 |
| 2R-A-6bp | 0.1173 | 0.1037 | 0.711 (0.514 - 0.983) | 0.038 | 0.053 |
| 2R-G-6bp | 0.0002 | 0.0075 | 10.51 (0.589 - 187.400) | 0.037 | 0.053 |
| TS1100/1170/1494 | |||||
| T-A-0bp | 0.392 | 0.4153 | 1.000 (Reference) | ||
| T-G-0bp | 0.287 | 0.2326 | 0.765 (0.602 - 0.973) | 0.028 | 0.098 |
| C-A-0bp | 0.0024 | 0.0509 | 20.462 (4.918 - 85.133) | <0.0001 | 0.001 |
| TSER/TS 1170 | |||||
| 3R-A | 0.5578 | 0.6302 | 1.000 (Reference) | ||
| 3R-G | 0.2794 | 0.2153 | 0.683 (0.543 - 0.858) | 0.001 | 0.003 |
| 2R-A | 0.1506 | 0.1245 | 0.732 (0.551 - 0.974) | 0.031 | 0.031 |
| 2R-G | 0.0122 | 0.0300 | 2.228 (1.059 - 4.688) | 0.017 | 0.026 |
| TS 1100/1170 | |||||
| T-A | 0.4259 | 0.4452 | 1.000 (Reference) | ||
| T-G | 0.2896 | 0.2353 | 0.780 (0.616 - 0.987) | 0.038 | 0.057 |
| C-G | 0.0020 | 0.0100 | 3.852 (0.813 - 18.261) | 0.023 | 0.057 |
| TS 1100/1494 | |||||
| T-0bp | 0.6790 | 0.6478 | 1.000 (Reference) | ||
| C-0bp | 0.0037 | 0.0550 | 16.551 (5.122 - 53.488) | <0.0001 | 0.0003 |
| TS 1170/1494 | |||||
| A-0bp | 0.3949 | 0.4715 | 1.000 (Reference) | ||
| A-6bp | 0.3135 | 0.2832 | 0.754 (0.602 - 0.946) | 0.015 | 0.015 |
| G-0bp | 0.2878 | 0.2313 | 0.671 (0.530 - 0.851) | 0.001 | 0.003 |
| G-6bp | 0.0038 | 0.0140 | 3.370 (0.943 - 12.042) | 0.014 | 0.015 |
Abbreviations: OR, odds ratio; 95% CI, 95% confidence interval; CAD, coronary artery disease; TSER, thymidylate synthase enhancer region; TS, thymidylate synthase; FDR, false discovery rate. a P-value calculated by chi-square test and fisher's exact test. The P-value<0.05 showed the bold type in Table 3, and the p-value≥0.05 was excluded in Table 3.
Table 4.
Genotype combination analyses for the TS gene polymorphisms in CAD patients and control subjects.
Table 4.
Genotype combination analyses for the TS gene polymorphisms in CAD patients and control subjects.
| Genotype combinations | Controls | CAD | AOR (95% CI) | P* |
|---|---|---|---|---|
| (n=427) | (n=424) | |||
| TSER/TS 1170A>G | ||||
| 3R3R/AA | 130 (30.4) | 164 (38.7) | 1.000 (reference) | |
| 3R3R/AG | 136 (31.9) | 122 (28.8) | 0.656 (0.461 - 0.934) | 0.020 |
| 3R3R/GG | 30 (7.0) | 15 (3.5) | 0.335 (0.162 - 0.691) | 0.003 |
| 2R3R/AA | 74 (17.3) | 65 (15.3) | 0.634 (0.405 - 0.990) | 0.045 |
| TS 1100T>C/TS 1170A>G | ||||
| TT/AA | 70 (16.4) | 86 (20.3) | 1.000 (reference) | |
| TT/AG | 114 (26.7) | 92 (21.7) | 0.593 (0.376 - 0.936) | 0.025 |
| TT/GG | 33 (7.7) | 16 (3.8) | 0.330 (0.153 - 0.708) | 0.004 |
| TS 1100T>C/TS 1494ins>del | ||||
| TT/0bp0bp | 194 (45.4) | 180 (42.5) | 1.000 (reference) | |
| TC/0bp0bp | 1 (0.2) | 21 (5.0) | 26.713 (3.462 - 206.115) | 0.002 |
| TS 1170A>G/TS 1494ins>del | ||||
| AA/0bp0bp | 57 (13.3) | 101 (23.8) | 1.000 (reference) | |
| AA/0bp6bp | 117 (27.4) | 97 (22.9) | 0.479 (0.303 - 0.755) | 0.002 |
| AA/6bp6bp | 37 (8.7) | 36 (8.5) | 0.454 (0.241 - 0.857) | 0.015 |
| AG/0bp0bp | 105 (24.6) | 94 (22.2) | 0.463 (0.292 - 0.734) | 0.001 |
| AG/0bp6bp | 76 (17.8) | 75 (17.7) | 0.539 (0.331 - 0.876) | 0.013 |
| GG/0bp0bp | 33 (7.7) | 16 (3.8) | 0.213 (0.098 - 0.462) | 0.0001 |
Abbreviation: AOR, adjusted odds ratio; 95% CI, 95% confidence interval; CAD, coronary artery disease; TS, thymidylate synthase. *Adjusted by age, sex, hypertension, diabetes mellitus, hyperlipidemia, and smoking. The P-values <0.05 showed the bold type in Table 4, and the p-value≥0.05 was excluded in Table 4.
Disclaimer/Publisher’s Note: The statements, opinions and data contained in all publications are solely those of the individual author(s) and contributor(s) and not of MDPI and/or the editor(s). MDPI and/or the editor(s) disclaim responsibility for any injury to people or property resulting from any ideas, methods, instructions or products referred to in the content. |
© 2023 by the authors. Licensee MDPI, Basel, Switzerland. This article is an open access article distributed under the terms and conditions of the Creative Commons Attribution (CC BY) license (http://creativecommons.org/licenses/by/4.0/).
Copyright: This open access article is published under a Creative Commons CC BY 4.0 license, which permit the free download, distribution, and reuse, provided that the author and preprint are cited in any reuse.


