Submitted:
11 July 2023
Posted:
12 July 2023
You are already at the latest version
Abstract
Keywords:
1. Introduction
2. Materials and Methods
2.1. Animals
2.2. Diet composition
2.3. Surgery
2.4. Confirmation of rWAT Denervation by Western Blot
2.5. Serum biochemical markers and hormones
2.6. Bone histomorphometry
2.7. Protein expression analysis
2.8. RNA extraction and Real time PCR
2.9. Statistical Analysis
3. Results
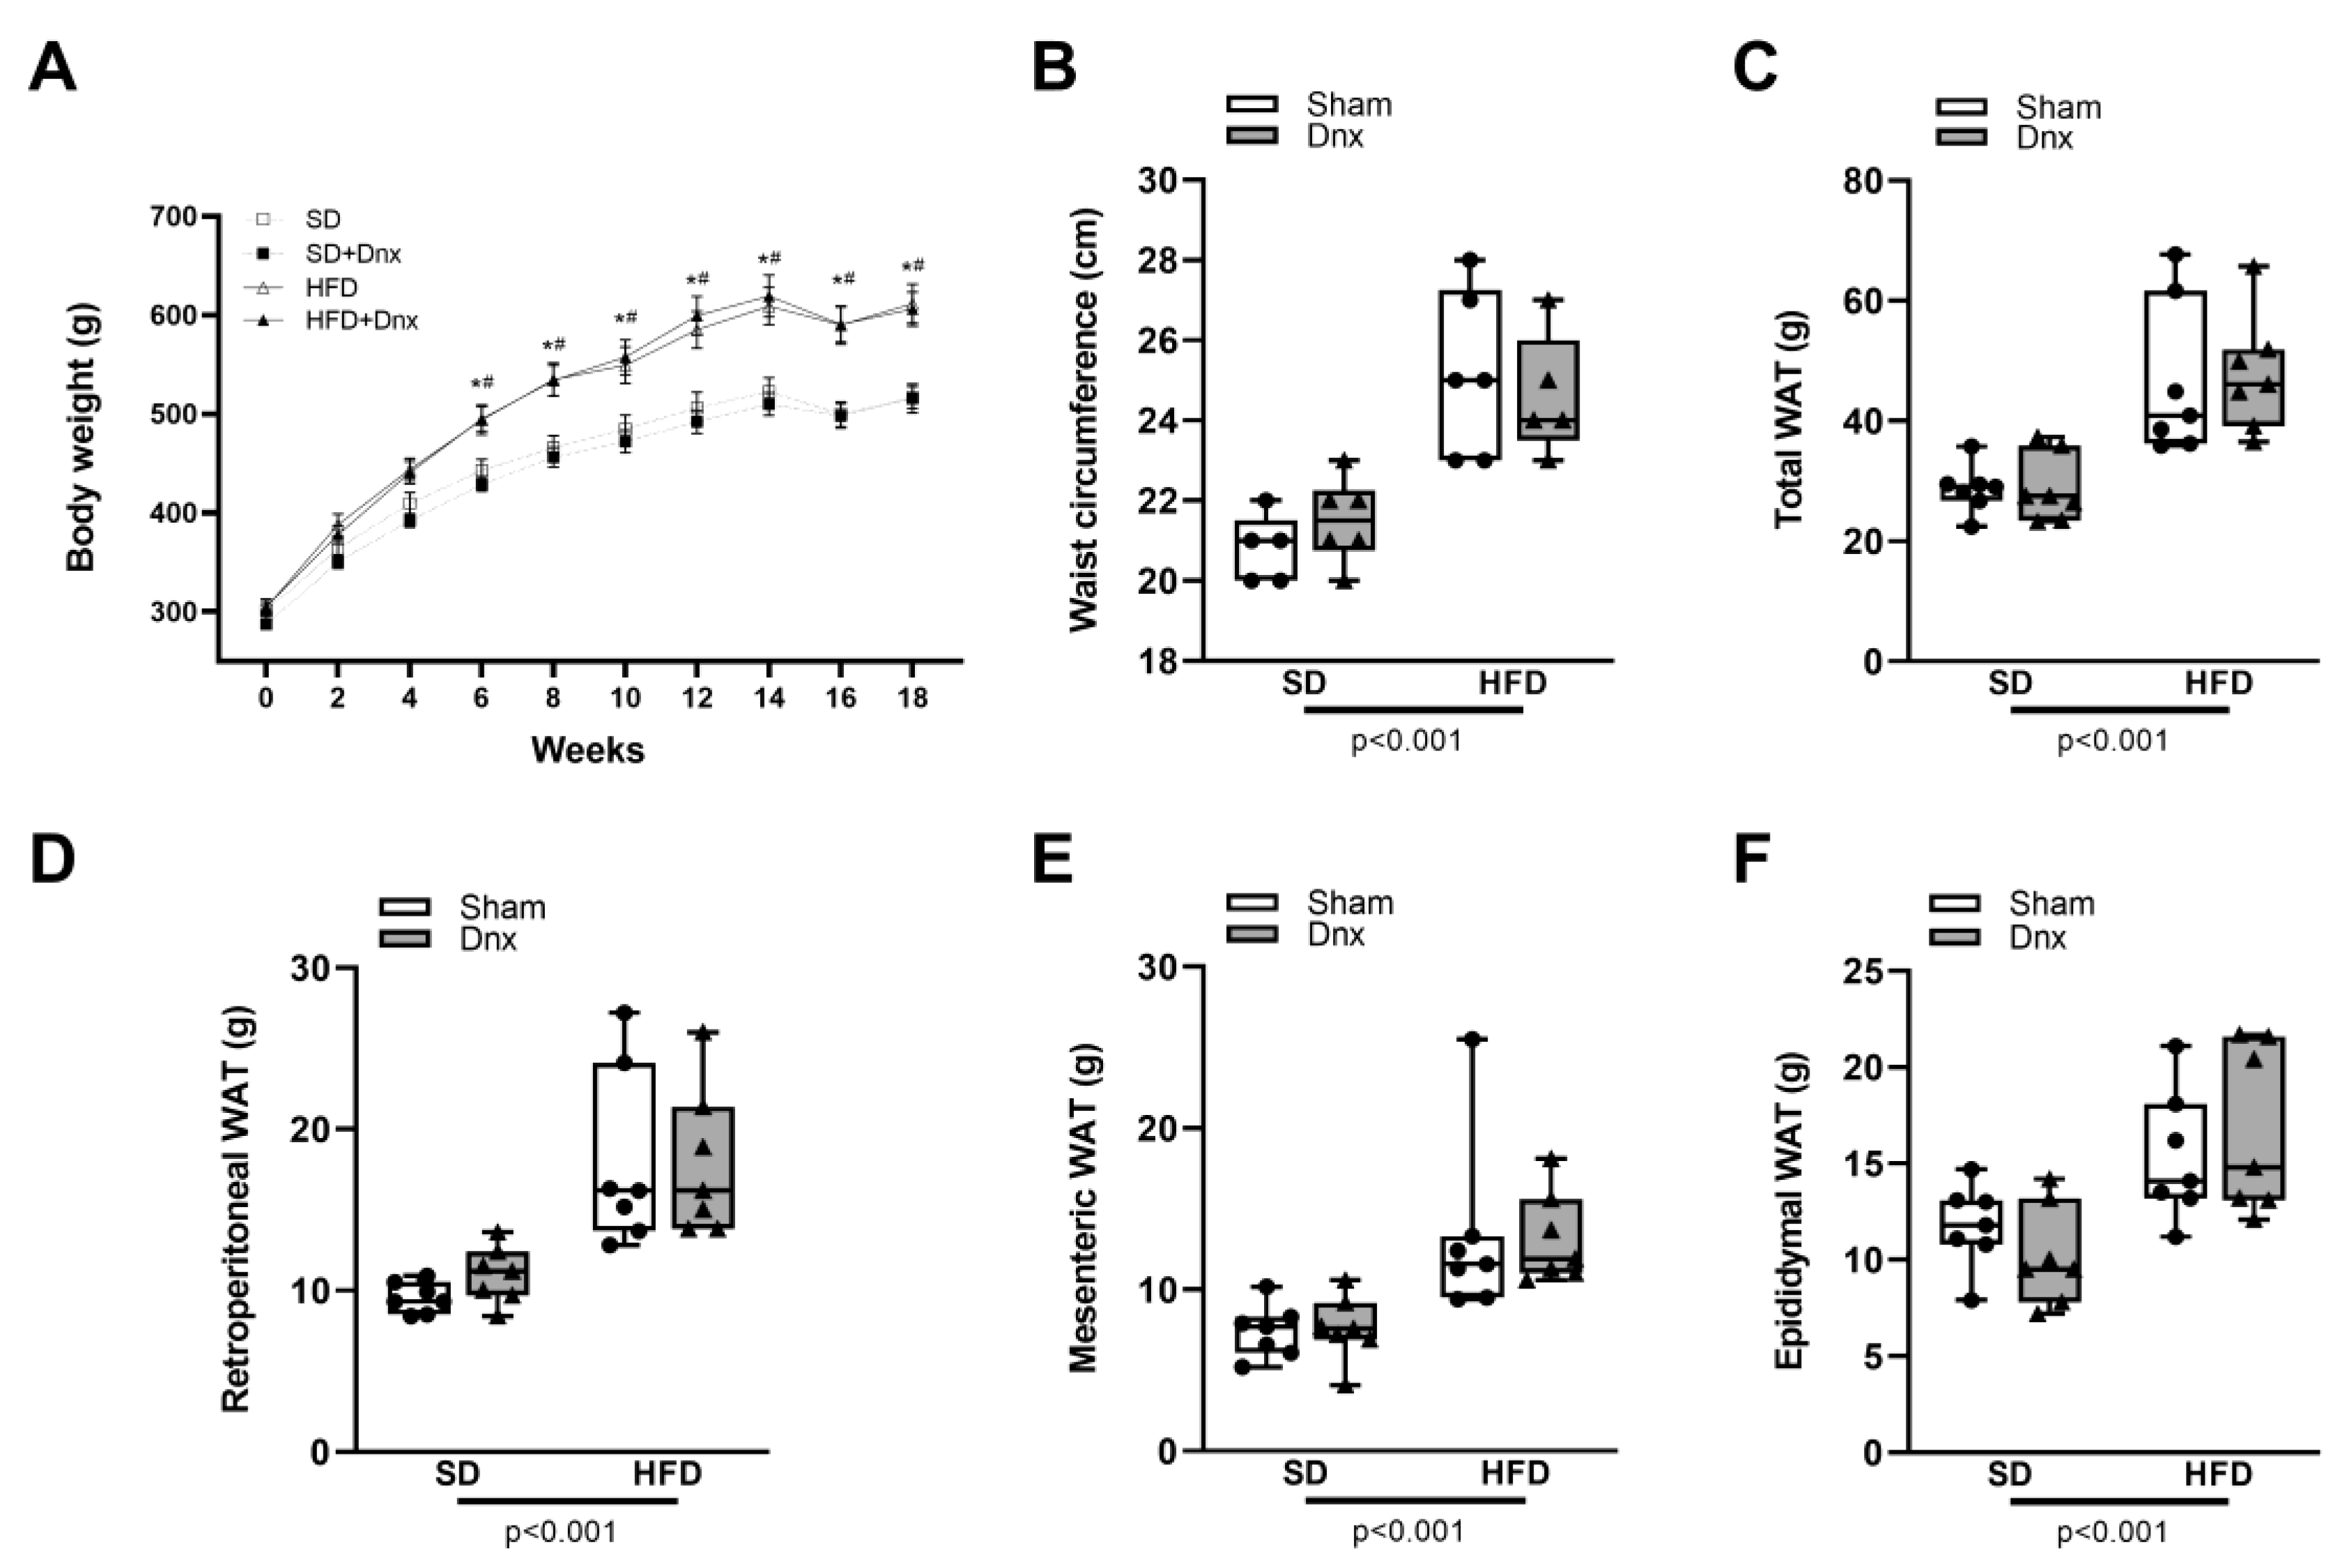
3.1. Body weight (BW), waist circumference (WC) and white adipose tissue (WAT) pads before and after Dnx
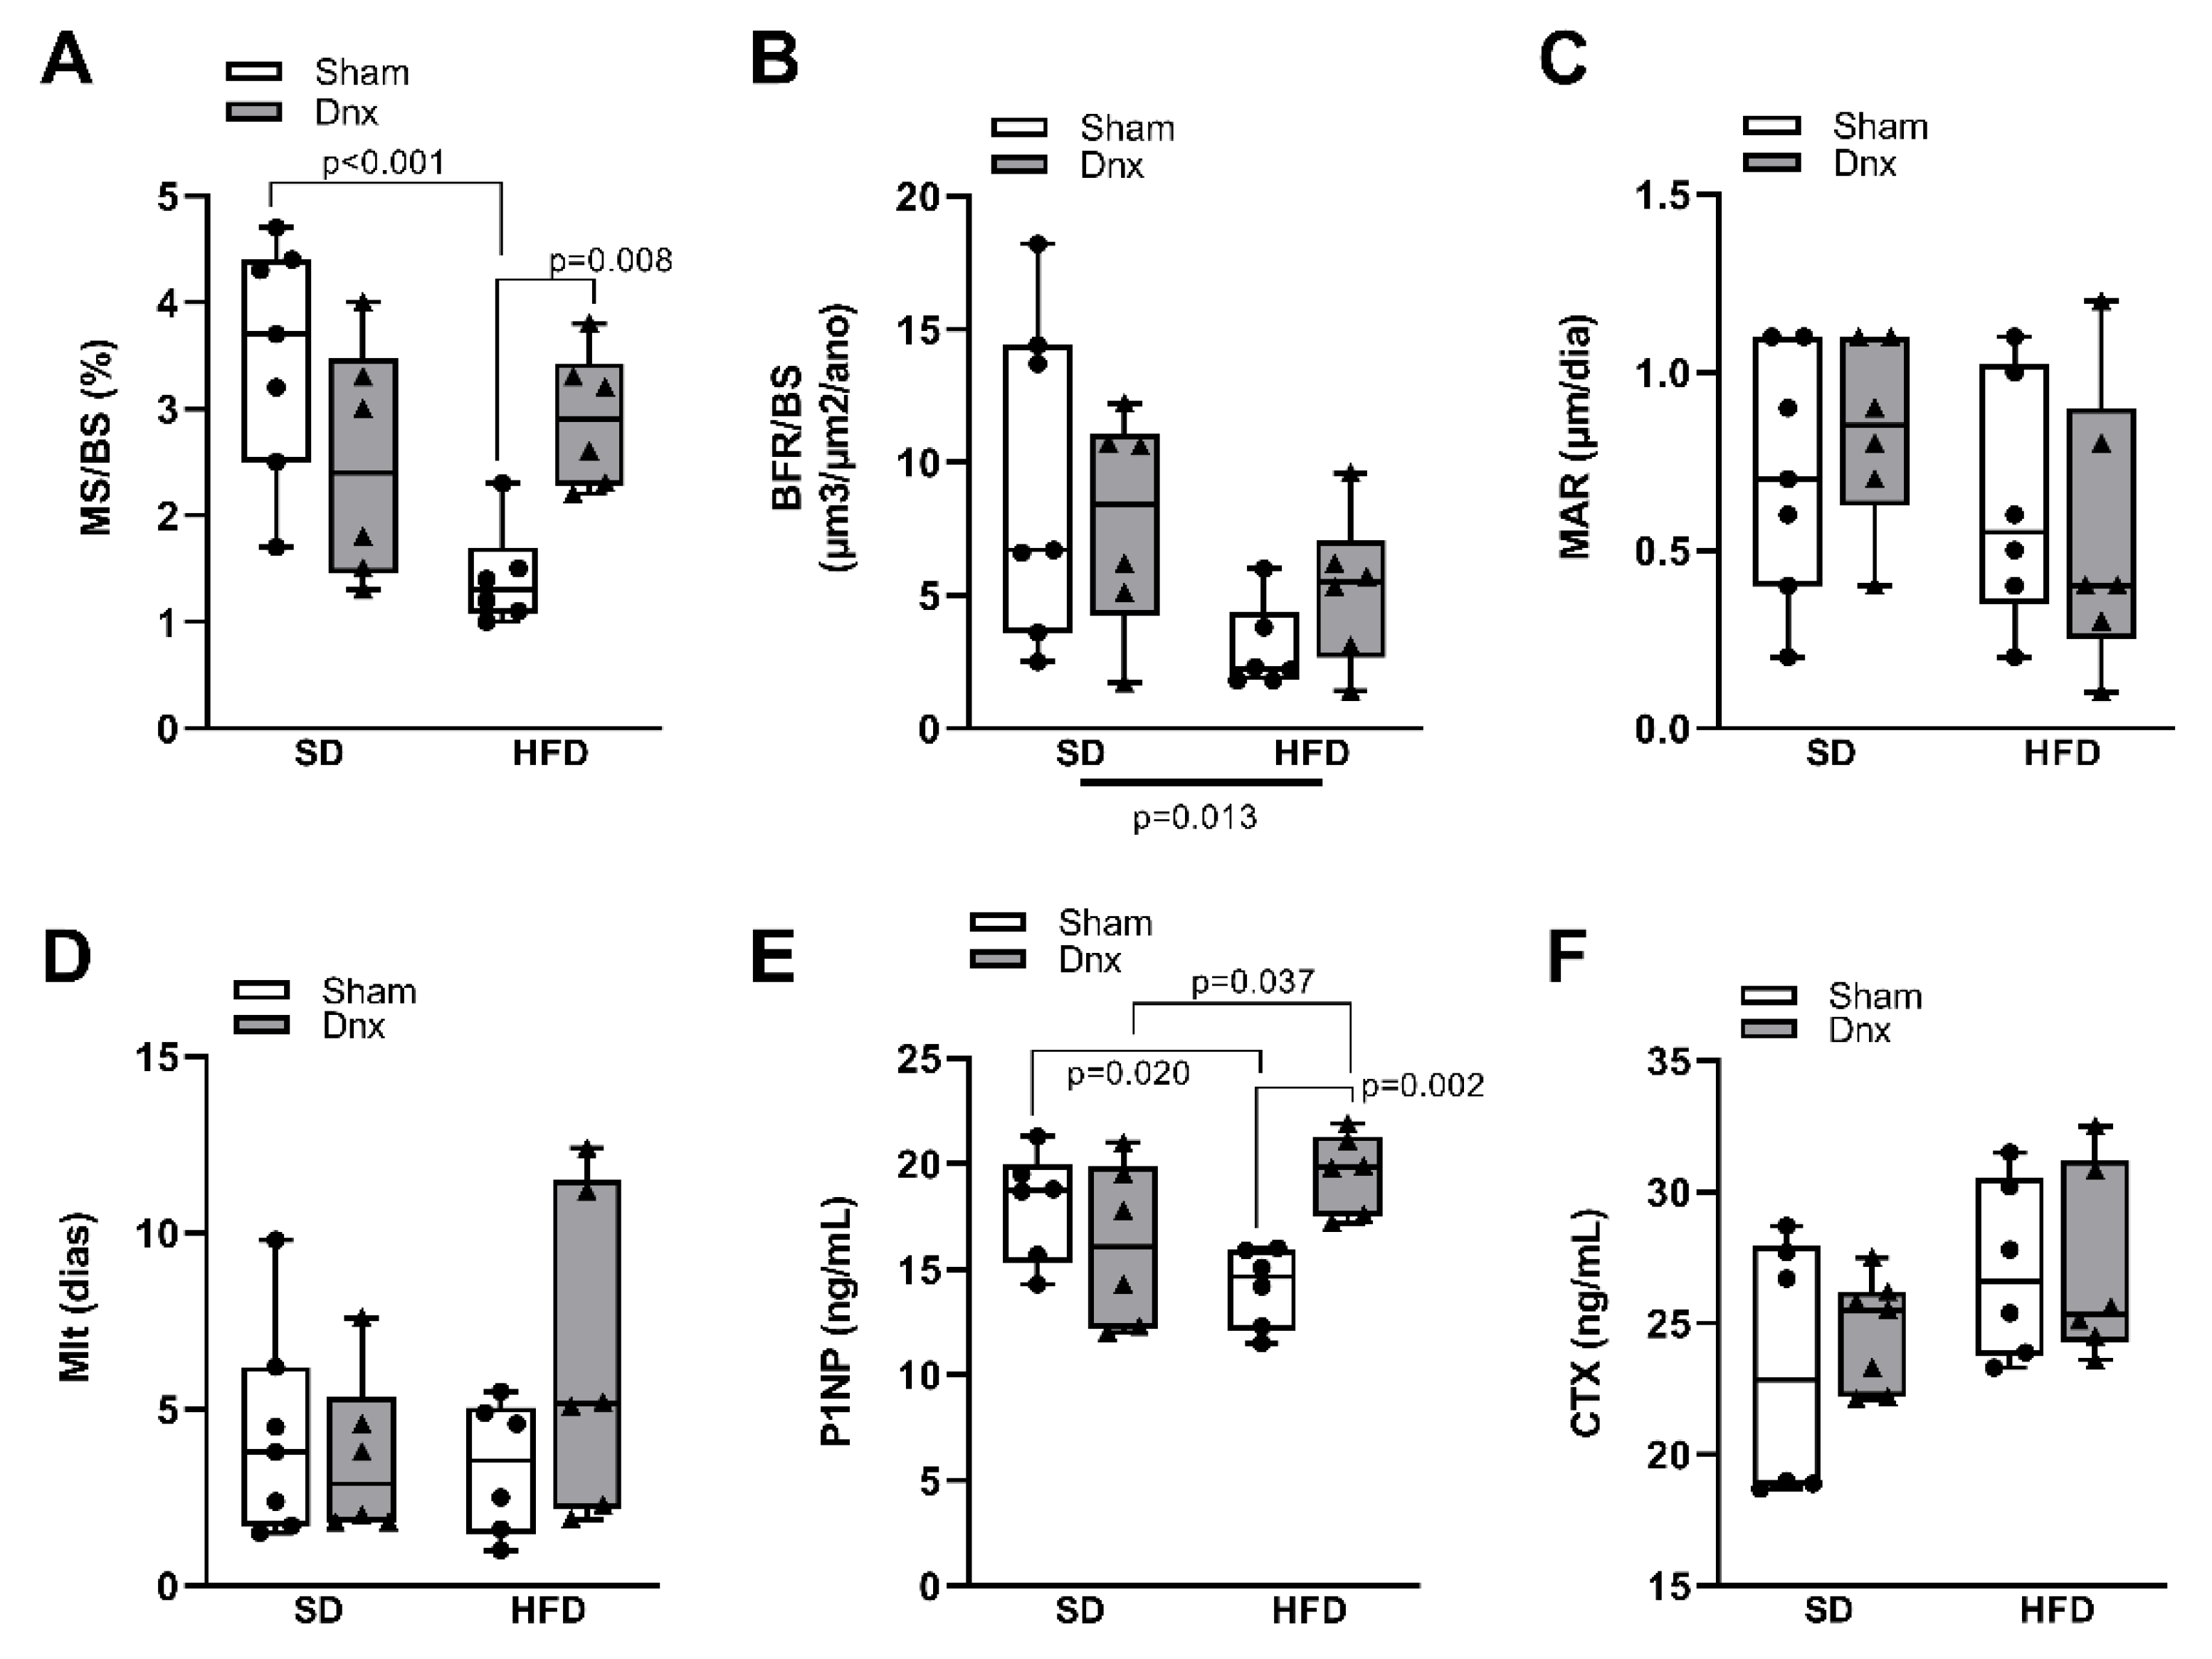
3.2. Bone histomorphometric parameters before and after Dnx
3.3. Serum bone markers before and after Dnx
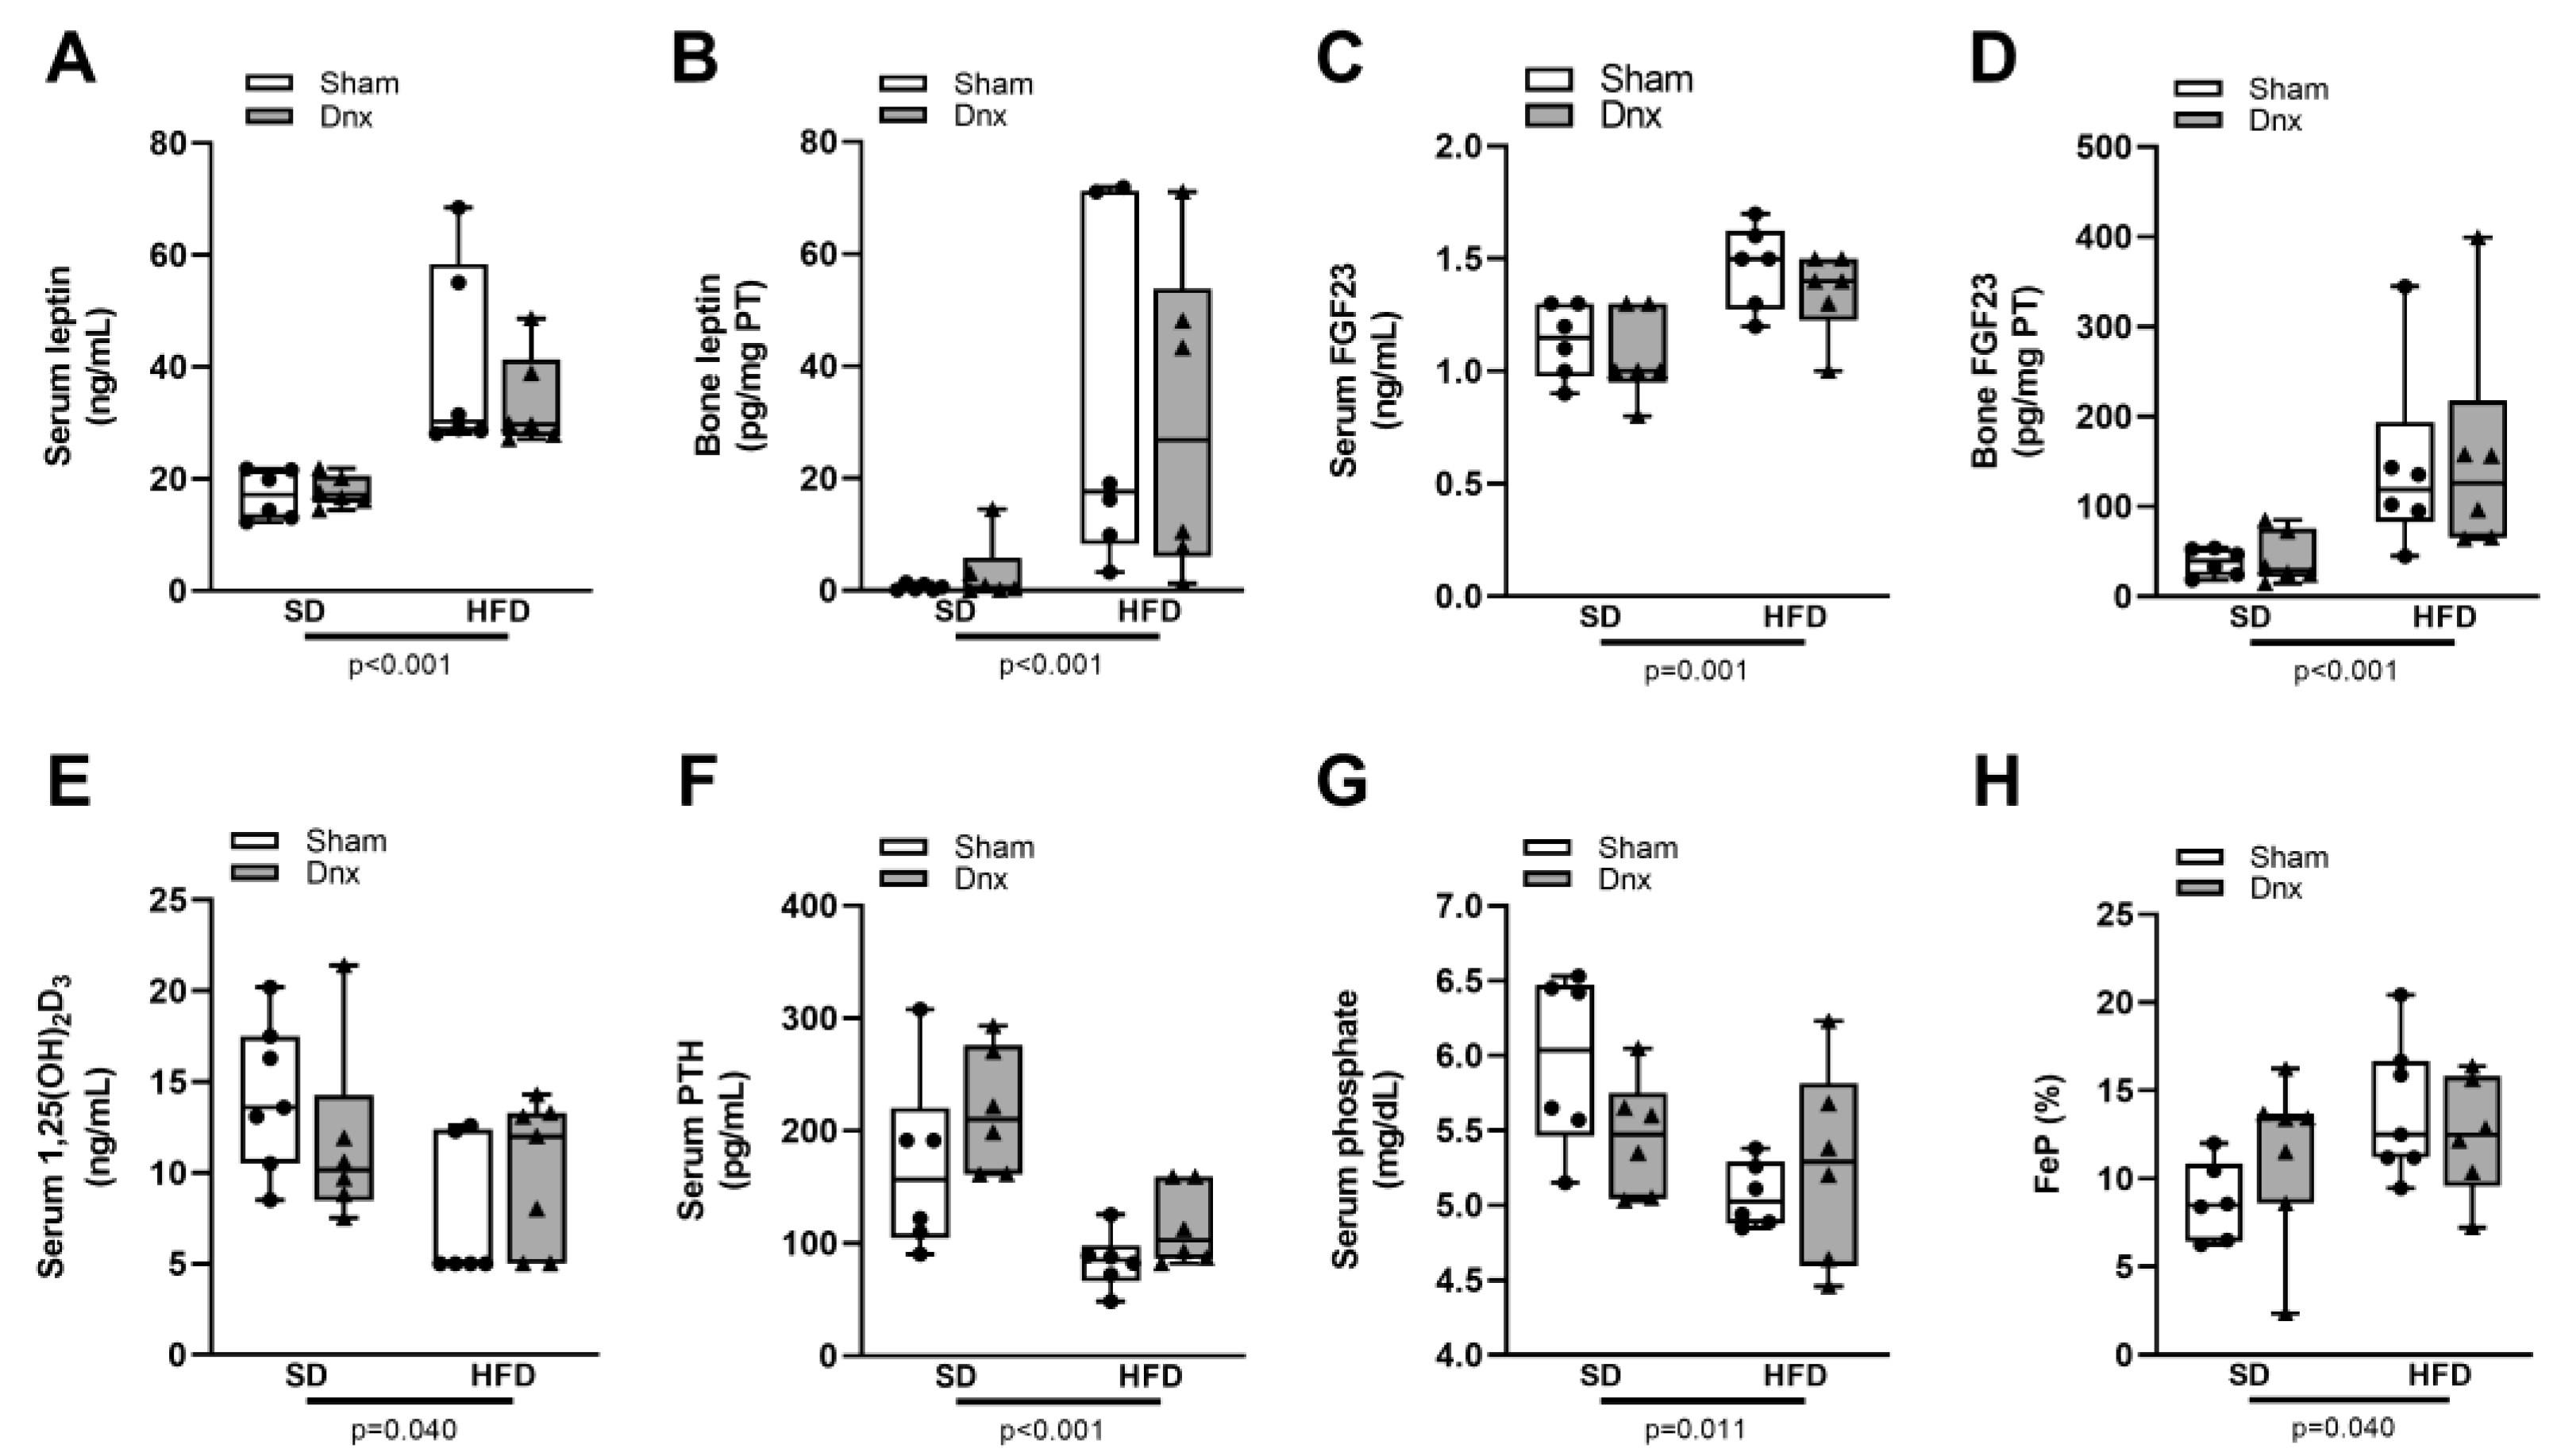
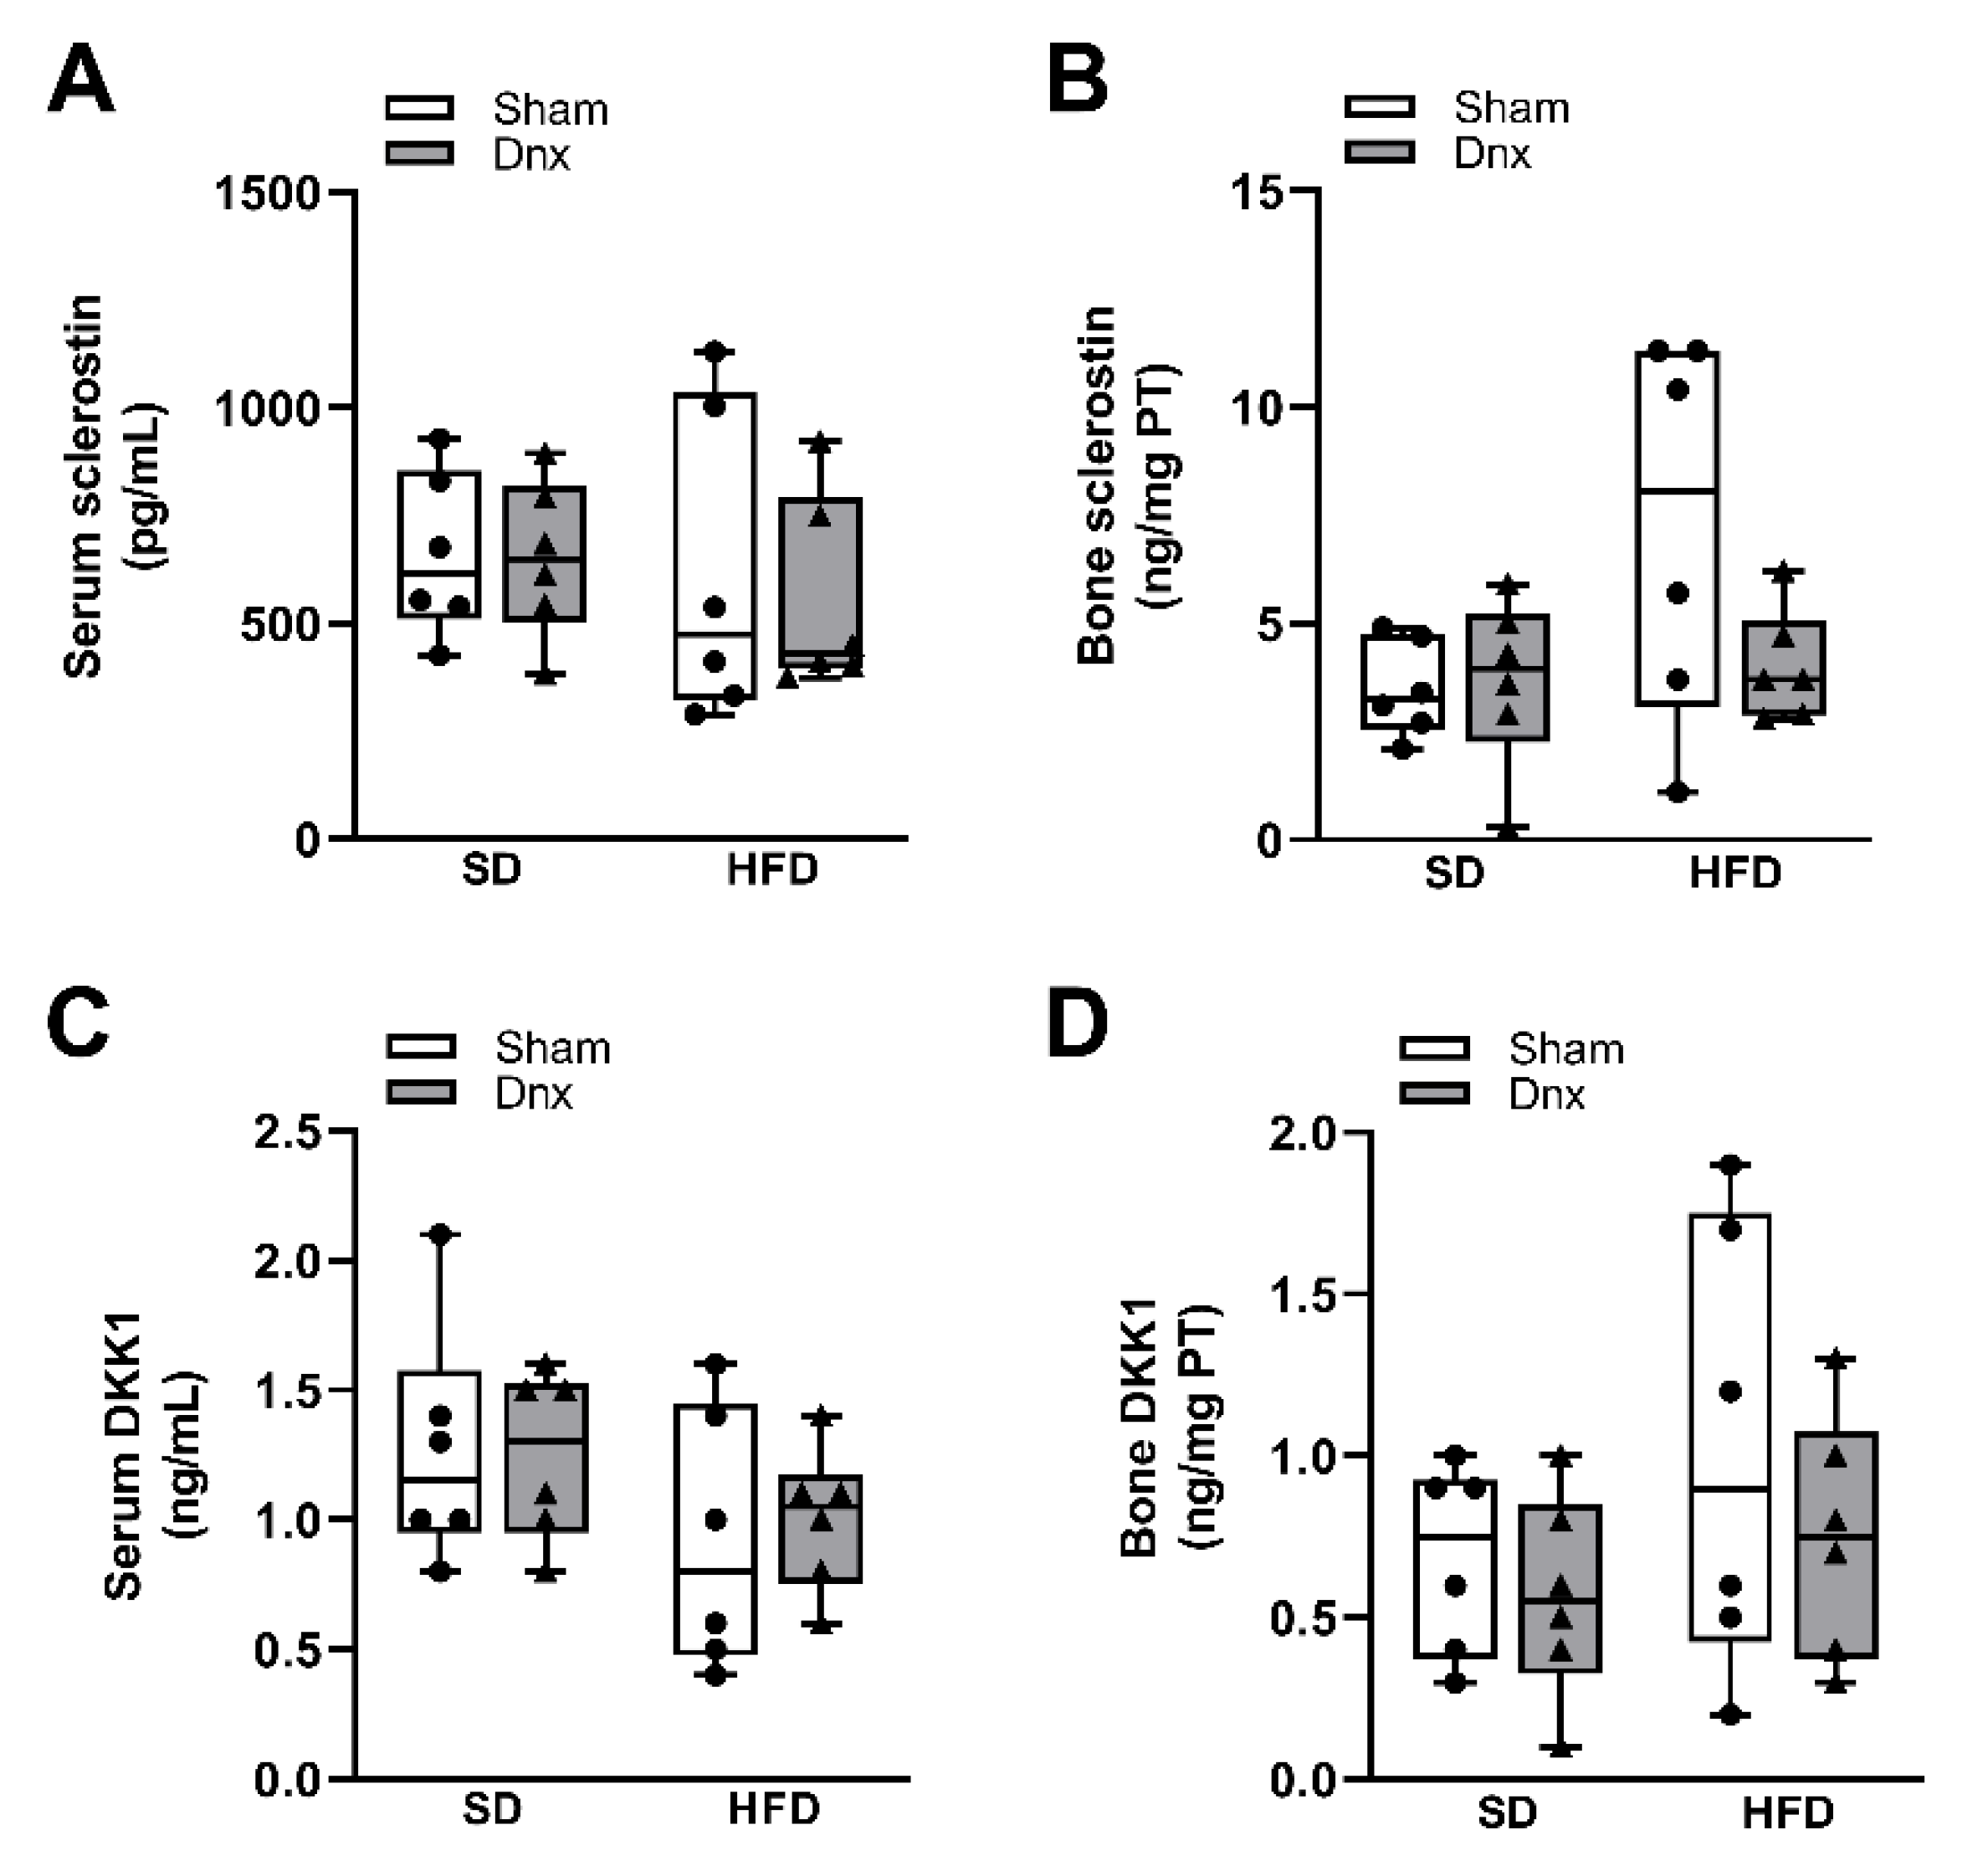
3.4. Serum and bone hormones and biochemical markers before and after Dnx
3.5. Serum and hypothalamic NPY levels before and after Dnx
4. Discussion
5. Conclusions
Supplementary Materials
Author Contributions
Funding
Institutional Review Board Statement
Data Availability Statement
Acknowledgments
Conflicts of Interest
References
- Tang, X.; Liu, G.; Kang, J.; Hou, Y.; Jiang, F.; Yuan, W.; Shi, J. Obesity and risk of hip fracture in adults: a meta-analysis of prospective cohort studies. PLoS One 2013, 8, e55077. [Google Scholar] [CrossRef]
- Johansson, H.; Kanis, J.A.; Odén, A.; McCloskey, E.; Chapurlat, R.D.; Christiansen, C.; Cummings, S.R.; Diez-Perez, A.; Eisman, J.A.; Fujiwara, S.; et al. A meta-analysis of the association of fracture risk and body mass index in women. J Bone Miner Res 2014, 29, 223–233. [Google Scholar] [CrossRef] [PubMed]
- Qiao, D.; Li, Y.; Liu, X.; Zhang, X.; Qian, X.; Zhang, H.; Zhang, G.; Wang, C. Association of obesity with bone mineral density and osteoporosis in adults: a systematic review and meta-analysis. Public Health 2020, 180, 22–28. [Google Scholar] [CrossRef] [PubMed]
- Ho-Pham, L.T.; Nguyen, U.D.; Nguyen, T.V. Association between lean mass, fat mass, and bone mineral density: a meta-analysis. The Journal of clinical endocrinology and metabolism 2014, 99. [Google Scholar] [CrossRef]
- Sutter, T.; Toumi, H.; Valery, A.; El Hage, R.; Pinti, A.; Lespessailles, E. Relationships between muscle mass, strength and regional bone mineral density in young men. PloS one 2019, 14. [Google Scholar] [CrossRef] [PubMed]
- Tencerova, M.; Frost, M.; Figeac, F.; Nielsen, T.K.; Ali, D.; Lauterlein, J.L.; Andersen, T.L.; Haakonsson, A.K.; Rauch, A.; Madsen, J.S.; et al. Obesity-Associated Hypermetabolism and Accelerated Senescence of Bone Marrow Stromal Stem Cells Suggest a Potential Mechanism for Bone Fragility. Cell Rep 2019, 27, 2050–2062e2056. [Google Scholar] [CrossRef]
- Cohen, A.; Dempster, D.W.; Recker, R.R.; Lappe, J.M.; Zhou, H.; Zwahlen, A.; Müller, R.; Zhao, B.; Guo, X.; Lang, T.; et al. Abdominal fat is associated with lower bone formation and inferior bone quality in healthy premenopausal women: a transiliac bone biopsy study. The Journal of clinical endocrinology and metabolism 2013, 98. [Google Scholar] [CrossRef]
- Grassi, G.; Biffi, A.; Seravalle, G.; Trevano, F.Q.; Dell'Oro, R.; Corrao, G.; Mancia, G. Sympathetic Neural Overdrive in the Obese and Overweight State. Hypertension (Dallas, Tex. : 1979) 2019, 74. [Google Scholar] [CrossRef] [PubMed]
- Schlienger, R.G.; Kraenzlin, M.E.; Jick, S.S.; Meier, C.R. Use of beta-blockers and risk of fractures. Jama 2004, 292, 1326–1332. [Google Scholar] [CrossRef]
- Turker, S.; Karatosun, V.; Gunal, I. Beta-blockers increase bone mineral density. Clin Orthop Relat Res 2006, 443, 73–74. [Google Scholar] [CrossRef]
- Takeda, S.; Elefteriou, F.; Levasseur, R.; Liu, X.; Zhao, L.; Parker, K.L.; Armstrong, D.; Ducy, P.; Karsenty, G. Leptin regulates bone formation via the sympathetic nervous system. Cell 2002, 111, 305–317. [Google Scholar] [CrossRef]
- Reid, I.R.; Baldock, P.A.; Cornish, J. Effects of Leptin on the Skeleton. Endocr Rev 2018, 39, 938–959. [Google Scholar] [CrossRef] [PubMed]
- Cornish, J.; Callon, K.E.; Bava, U.; Lin, C.; Naot, D.; Hill, B.L.; Grey, A.B.; Broom, N.; Myers, D.E.; Nicholson, G.C.; et al. Leptin directly regulates bone cell function in vitro and reduces bone fragility in vivo. J Endocrinol 2002, 175, 405–415. [Google Scholar] [CrossRef] [PubMed]
- Goulding, A.; Taylor, R.W. Plasma leptin values in relation to bone mass and density and to dynamic biochemical markers of bone resorption and formation in postmenopausal women. Calcif Tissue Int 1998, 63, 456–458. [Google Scholar] [CrossRef] [PubMed]
- Dimitri, P.; Rosen, C. The Central Nervous System and Bone Metabolism: An Evolving Story. Calcif Tissue Int 2017, 100, 476–485. [Google Scholar] [CrossRef]
- Ekblad, E.; Edvinsson, L.; Wahlestedt, C.; Uddman, R.; Håkanson, R.; Sundler, F. Neuropeptide Y co-exists and co-operates with noradrenaline in perivascular nerve fibers. Regul Pept 1984, 8, 225–235. [Google Scholar] [CrossRef]
- Zhang, Y.; Chen, C.Y.; Liu, Y.W.; Rao, S.S.; Tan, Y.J.; Qian, Y.X.; Xia, K.; Huang, J.; Liu, X.X.; Hong, C.G.; et al. Neuronal Induction of Bone-Fat Imbalance through Osteocyte Neuropeptide Y. Adv Sci (Weinh) 2021, e2100808. [Google Scholar] [CrossRef]
- Zoccali, C.; Ortiz, A.; Blumbyte, I.A.; Rudolf, S.; Beck-Sickinger, A.G.; Malyszko, J.; Spasovski, G.; Carriazo, S.; Viggiano, D.; Kurganaite, J.; et al. Neuropeptide Y as a risk factor for cardiorenal disease and cognitive dysfunction in chronic kidney disease: translational opportunities and challenges. Nephrol Dial Transplant 2021, 37, ii14–ii23. [Google Scholar] [CrossRef]
- Lee, N.J.; Doyle, K.L.; Sainsbury, A.; Enriquez, R.F.; Hort, Y.J.; Riepler, S.J.; Baldock, P.A.; Herzog, H. Critical role for Y1 receptors in mesenchymal progenitor cell differentiation and osteoblast activity. J Bone Miner Res 2010, 25, 1736–1747. [Google Scholar] [CrossRef]
- Parker, R.M.; Herzog, H. Regional distribution of Y-receptor subtype mRNAs in rat brain. Eur J Neurosci 1999, 11, 1431–1448. [Google Scholar] [CrossRef]
- Yu, W.; Zhu, C.; Xu, W.; Jiang, L.; Jiang, S. Neuropeptide Y1 Receptor Regulates Glucocorticoid-Induced Inhibition of Osteoblast Differentiation in Murine MC3T3-E1 Cells via ERK Signaling. Int J Mol Sci 2016, 17. [Google Scholar] [CrossRef] [PubMed]
- Baldock, P.A.; Lee, N.J.; Driessler, F.; Lin, S.; Allison, S.; Stehrer, B.; Lin, E.J.; Zhang, L.; Enriquez, R.F.; Wong, I.P.; et al. Neuropeptide Y knockout mice reveal a central role of NPY in the coordination of bone mass to body weight. PLoS One 2009, 4, e8415. [Google Scholar] [CrossRef] [PubMed]
- Panuccio, V.; Cutrupi, S.; Pizzini, P.; Mallamaci, F.; Tripepi, G.; Zoccali, C. Neuropeptide Y and markers of osteoblast activity in dialysis patients: a cross-sectional study. Am J Kidney Dis 2007, 50, 1001–1008. [Google Scholar] [CrossRef] [PubMed]
- Garcia, M.L.; Milanez, M.I.O.; Nishi, E.E.; Sato, A.Y.S.; Carvalho, P.M.; Nogueira, F.N.; Campos, R.R.; Oyama, L.M.; Bergamaschi, C.T. Retroperitoneal adipose tissue denervation improves cardiometabolic and autonomic dysfunction in a high fat diet model. Life Sci 2021, 283, 119841. [Google Scholar] [CrossRef]
- Reeves, P.G.; Nielsen, F.H.; Fahey, G.C. AIN-93 purified diets for laboratory rodents: final report of the American Institute of Nutrition ad hoc writing committee on the reformulation of the AIN-76A rodent diet. The Journal of nutrition 1993, 123. [Google Scholar] [CrossRef]
- Frasson, D.; Boschini, R.P.; Chaves, V.E.; dos Santos, M.E.S.M.; Paula Gomes, S.; Valentim, R.R.; Garófalo, M.A.R.; Navegantes, L.C.C.; Migliorini, R.H.; Kettelhut, I.C. The sympathetic nervous system regulates the three glycerol-3P generation pathways in white adipose tissue of fasted, diabetic and high-protein diet-fed rats. 2012. [Google Scholar] [CrossRef]
- Gouveia, C.H.; Jorgetti, V.; Bianco, A.C. Effects of thyroid hormone administration and estrogen deficiency on bone mass of female rats. J Bone Miner Res 1997, 12, 2098–2107. [Google Scholar] [CrossRef]
- Dempster, D.W.; Compston, J.E.; Drezner, M.K.; Glorieux, F.H.; Kanis, J.A.; Malluche, H.; Meunier, P.J.; Ott, S.M.; Recker, R.R.; Parfitt, A.M. Standardized nomenclature, symbols, and units for bone histomorphometry: a 2012 update of the report of the ASBMR Histomorphometry Nomenclature Committee. Journal of bone and mineral research : the official journal of the American Society for Bone and Mineral Research 2013, 28. [Google Scholar] [CrossRef]
- Nishi, E.E.; Lopes, N.R.; Gomes, G.N.; Perry, J.C.; Sato, A.Y.S.; Naffah-Mazzacoratti, M.G.; Bergamaschi, C.T.; Campos, R.R. Renal denervation reduces sympathetic overactivation, brain oxidative stress, and renal injury in rats with renovascular hypertension independent of its effects on reducing blood pressure. Hypertens Res 2019, 42, 628–640. [Google Scholar] [CrossRef]
- Lambert, E.; Phillips, S.; Tursunalieva, A.; Eikelis, N.; Sari, C.; Dixon, J.; Straznicky, N.; Grima, M.; Schlaich, M.; Lambert, G. Inverse association between sympathetic nervous system activity and bone mass in middle aged overweight individuals. Bone 2018, 111, 123–128. [Google Scholar] [CrossRef]
- Tencerova, M.; Figeac, F.; Ditzel, N.; Taipaleenmaki, H.; Nielsen, T.K.; Kassem, M. High-Fat Diet-Induced Obesity Promotes Expansion of Bone Marrow Adipose Tissue and Impairs Skeletal Stem Cell Functions in Mice. J Bone Miner Res 2018, 33, 1154–1165. [Google Scholar] [CrossRef]
- Boroumand, P.; Klip, A. Bone marrow adipose cells - cellular interactions and changes with obesity. J Cell Sci 2020, 133. [Google Scholar] [CrossRef]
- Wong, S.K.; Chin, K.Y.; Suhaimi, F.H.; Ahmad, F.; Ima-Nirwana, S. Effects of metabolic syndrome on bone mineral density, histomorphometry and remodelling markers in male rats. PLoS One 2018, 13, e0192416. [Google Scholar] [CrossRef]
- Kontogianni, M.D.; Dafni, U.G.; Routsias, J.G.; Skopouli, F.N. Blood leptin and adiponectin as possible mediators of the relation between fat mass and BMD in perimenopausal women. J Bone Miner Res 2004, 19, 546–551. [Google Scholar] [CrossRef]
- Ducy, P.; Amling, M.; Takeda, S.; Priemel, M.; Schilling, A.F.; Beil, F.T.; Shen, J.; Vinson, C.; Rueger, J.M.; Karsenty, G. Leptin inhibits bone formation through a hypothalamic relay: a central control of bone mass. Cell 2000, 100, 197–207. [Google Scholar] [CrossRef]
- Vilaca, T.; Evans, A.; Gossiel, F.; Paggiosi, M.; Eastell, R.; Walsh, J.S. Fat, adipokines, bone structure and bone regulatory factors associations in obesity. Eur J Endocrinol 2022. [CrossRef]
- Pasco, J.A.; Henry, M.J.; Kotowicz, M.A.; Collier, G.R.; Ball, M.J.; Ugoni, A.M.; Nicholson, G.C. Serum leptin levels are associated with bone mass in nonobese women. J Clin Endocrinol Metab 2001, 86, 1884–1887. [Google Scholar] [CrossRef]
- Vervloet, M. Renal and extrarenal effects of fibroblast growth factor 23. Nat Rev Nephrol 2019, 15, 109–120. [Google Scholar] [CrossRef]
- Tsuji, K.; Maeda, T.; Kawane, T.; Matsunuma, A.; Horiuchi, N. Leptin stimulates fibroblast growth factor 23 expression in bone and suppresses renal 1alpha,25-dihydroxyvitamin D3 synthesis in leptin-deficient mice. Journal of bone and mineral research : the official journal of the American Society for Bone and Mineral Research 2010, 25. [Google Scholar] [CrossRef]
- Wang, H.; Yoshiko, Y.; Yamamoto, R.; Minamizaki, T.; Kozai, K.; Tanne, K.; Aubin, J.E.; Maeda, N. Overexpression of fibroblast growth factor 23 suppresses osteoblast differentiation and matrix mineralization in vitro. J Bone Miner Res 2008, 23, 939–948. [Google Scholar] [CrossRef]
- Ben-Dov, I.Z.; Galitzer, H.; Lavi-Moshayoff, V.; Goetz, R.; Kuro-o, M.; Mohammadi, M.; Sirkis, R.; Naveh-Many, T.; Silver, J. The parathyroid is a target organ for FGF23 in rats. The Journal of clinical investigation 2007, 117. [Google Scholar] [CrossRef]
- Baltazi, M.; Katsiki, N.; Savopoulos, C.; Iliadis, F.; Koliakos, G.; Hatzitolios, A.I. Plasma neuropeptide Y (NPY) and alpha-melanocyte stimulating hormone (a-MSH) levels in patients with or without hypertension and/or obesity: a pilot study. Am J Cardiovasc Dis 2011, 1, 48–59. [Google Scholar] [PubMed]
- Kuo, L.E.; Kitlinska, J.B.; Tilan, J.U.; Li, L.; Baker, S.B.; Johnson, M.D.; Lee, E.W.; Burnett, M.S.; Fricke, S.T.; Kvetnansky, R.; et al. Neuropeptide Y acts directly in the periphery on fat tissue and mediates stress-induced obesity and metabolic syndrome. Nat Med 2007, 13, 803–811. [Google Scholar] [CrossRef] [PubMed]
- Matic, I.; Matthews, B.G.; Kizivat, T.; Igwe, J.C.; Marijanovic, I.; Ruohonen, S.T.; Savontaus, E.; Adams, D.J.; Kalajzic, I. Bone-specific overexpression of NPY modulates osteogenesis. J Musculoskelet Neuronal Interact 2012, 12, 209–218. [Google Scholar] [PubMed]
- Dhillon, S.S.; Belsham, D.D. Leptin differentially regulates NPY secretion in hypothalamic cell lines through distinct intracellular signal transduction pathways. Regul Pept 2011, 167, 192–200. [Google Scholar] [CrossRef] [PubMed]
- Dhillon, S.S.; McFadden, S.A.; Chalmers, J.A.; Centeno, M.L.; Kim, G.L.; Belsham, D.D. Cellular leptin resistance impairs the leptin-mediated suppression of neuropeptide Y secretion in hypothalamic neurons. Endocrinology 2011, 152, 4138–4147. [Google Scholar] [CrossRef] [PubMed]
- Yamada, T.; Katagiri, H.; Ishigaki, Y.; Ogihara, T.; Imai, J.; Uno, K.; Hasegawa, Y.; Gao, J.; Ishihara, H.; Niijima, A.; et al. Signals from intra-abdominal fat modulate insulin and leptin sensitivity through different mechanisms: neuronal involvement in food-intake regulation. Cell Metab 2006, 3, 223–229. [Google Scholar] [CrossRef]


Disclaimer/Publisher’s Note: The statements, opinions and data contained in all publications are solely those of the individual author(s) and contributor(s) and not of MDPI and/or the editor(s). MDPI and/or the editor(s) disclaim responsibility for any injury to people or property resulting from any ideas, methods, instructions or products referred to in the content. |
© 2023 by the authors. Licensee MDPI, Basel, Switzerland. This article is an open access article distributed under the terms and conditions of the Creative Commons Attribution (CC BY) license (http://creativecommons.org/licenses/by/4.0/).


