1. Introduction
Traffic accidents in which vulnerable participants such as cyclists and pedestrians are involved have been studied over time, first with the aim of reconstructing the events, followed by the establishment of empirical or mathematical models, which take into account a series of factors, regarding the throwing distance of pedestrians. In the specialized literature, extensive studies have been published by many authors, starting from the 70s. An objective of these analyzes consists in determining the design distance of the pedestrian. In [1-5] was proposed various formulas for determining throwing distances of pedestrians depending on various factors such as the impact speed, the angle of throw from the hood, the height of the center of mass of the pedestrian, the coefficient of friction between the pedestrian and the ground, the mass of the vehicle and the pedestrian, the deceleration of the vehicle at the time of impact.
In [6, 7], Eubanks, Hait and Limpert, three phases of the vehicle-pedestrian impact were identified. These are the contact phase, the flight phase (throwing through the air) and the rolling/sliding phase on the ground. According to pedestrian dynamics Five categories of vehicle − pedestrian collisions are described by [
8] and [
9]. These are wrap, forward projection, fender vault, roof vault and somersault collisions [
10]. The contact phase, with the duration of the interval between the first impact and the secondary contact, was studied by Han and Brach in 2001, who proposed the bilinear model, regarding the distance traveled by the vehicle and the pedestrian in this stage. This model takes into account the position of the center of mass in relation to the vehicle.
In [
11] it is considered that this phase lasts approximately 0.2 seconds, during which it is approximated that the pedestrian travels a distance of 2 meters, without specifying exactly which element of the body detaches last from the vehicle. In [
12] the authors break down the contact phase into two sub-phases,
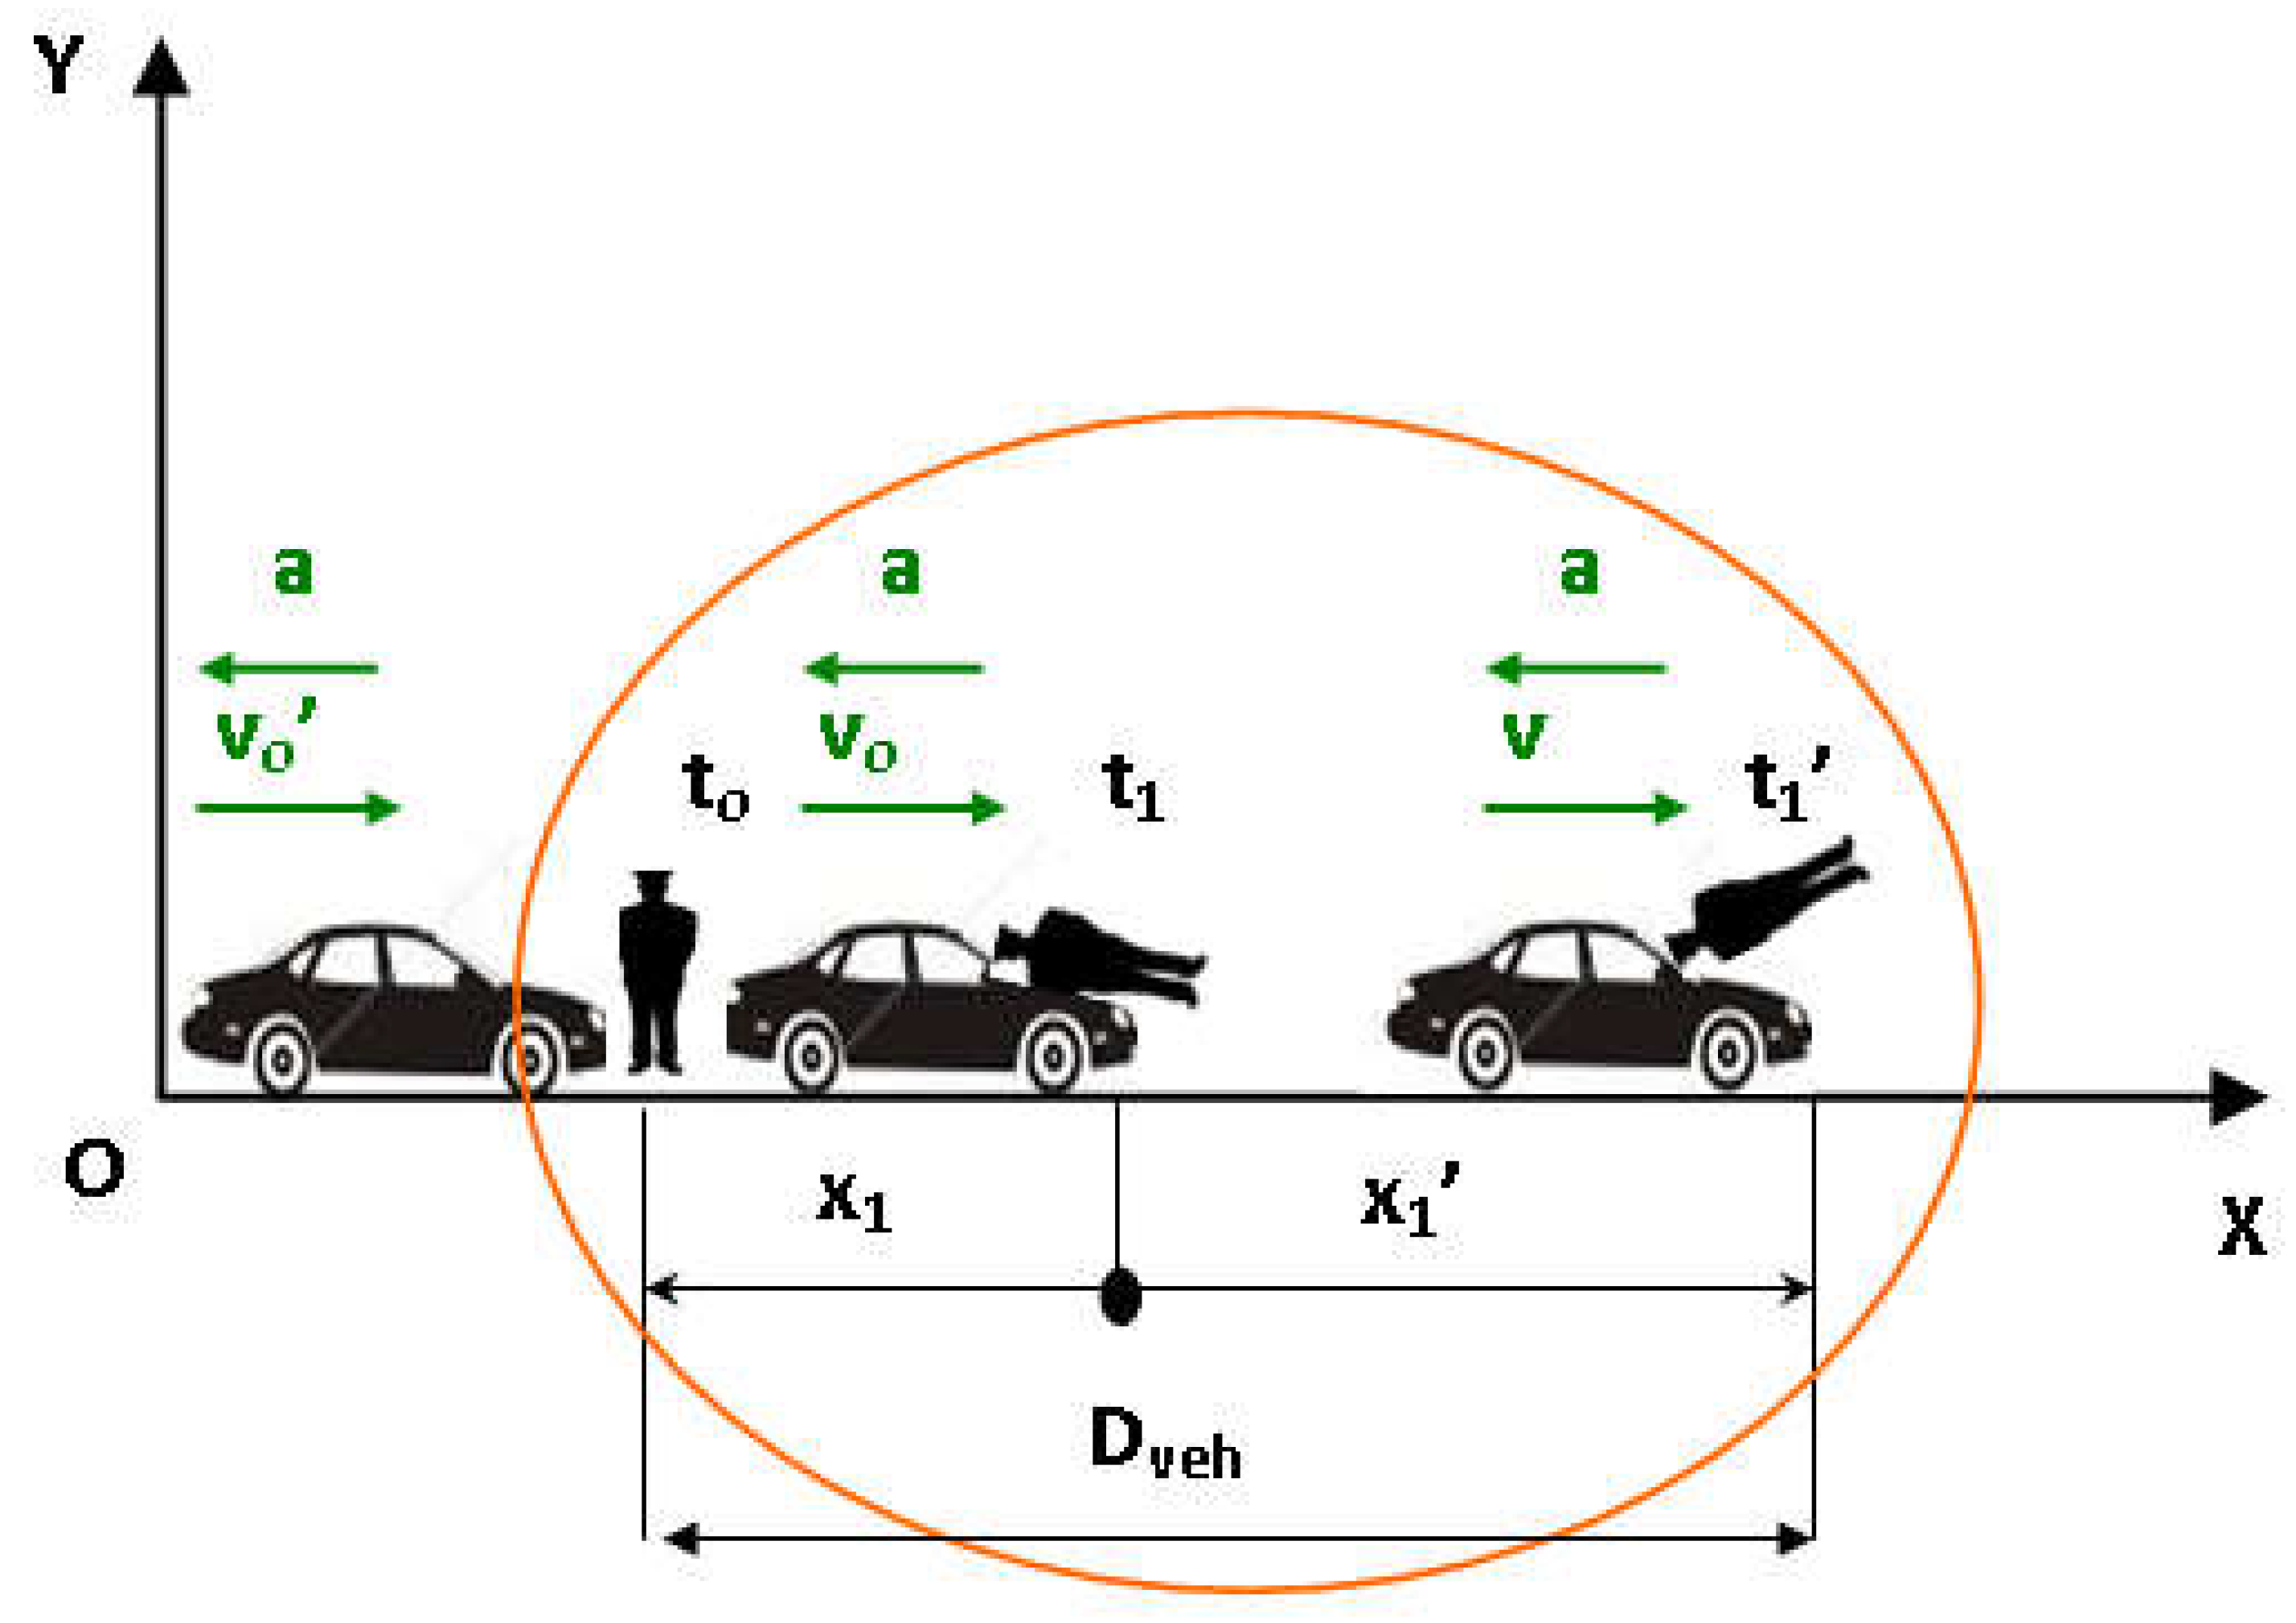
Figure 1. The first lasts from the initial impact, until the pedestrian hits his head/chest against the windshield/bonnet (secondary impact); the second extends over the period that the pedestrian remains in contact with the car, after the secondary impact, until the separation from the vehicle. The model takes into account the last element of the body that detaches from the vehicle, excluding the upper limbs of the pedestrian from the contact analysis.
This phase of contact distance influences others, a simple model is presented in
Figure 1. It is assumed that the impact between vehicle and pedestrian is plastic. In this case from conservation of momentum law it was determined, successively, in [
12] the distance where the pedestrian is in contact with vehicle.
According to those in [
12], the distances travelled by the vehicle-pedestrian in the contact phase are given in the relations (1), (2) and (3) where:
vo’: vehicle speed at the moment of the first contact with the pedestrian, m/s;
vo: speed of the vehicle-pedestrian assembly, immediately after the first contact, m/s;
v: vehicle velocity at the moment of secondary impact, m/s;
a: average brake deceleration from the moment prior to the first impact with the pedestrian, m/s2;
mv: vehicle mass, kg;
mp: pedestrian mass, kg;
t0: time at which the pedestrian is hitted by the vehicle, s;
t1: time at which the pedestrian hits the hood-windshield area with the head, s;
t1’: time at which the pedestrian is detached from vehicle, s;
x1: the space covered by the vehicle-pedestrian assembly in the sub-phase 1.1, m;
x1’: the space covered by the vehicle-pedestrian assembly in the sub-phase 1.2, m;
Dveh: the space covered by the pedestrian in the contact phase with vehicle, phase 1, m;
η: pedestrian impact factor;
In [
13] the authors, also show the existence of two sub-phases in the vehicle contact phase. In
Figure 2 a sample sequence of pedestrian kinematics at different timings and phases during the vehicle impact process: “t
0” is the first vehicle-pedestrian contact time and “t
1” is first vehicle-head impact time. Then the pedestrian moves together with the car until “t
2”, when they separate.
2. Research Motivation
Analyzing the specialized literature, in the case of vehicle-pedestrian accidents, various models/formulas have been proposed over times that break down the stages of the collision into three phases (contact with the vehicle, flying through the air and rolling on the ground) with the aim of establishing the distance of pedestrian throw. The first phase was analyzed in detail in [
12] and [
13] where the existence of two sub-phases was highlighted.
Analyzes of real collisions between vehicle and dummies, as well as modeling with especially dedicated software [14-16] were designed for the study of the contact phase between vehicle and pedestrian. This should allow specialists to more accurately investigate the circumstances of pedestrian accidents.
In this paper, we propose to improve the proposed bilinear model, by establishing a correlation regarding the distance traveled by the pedestrian in the contact phase with the vehicle, depending on the collision speed. Some of the factors that influence pedestrian kinematics will be analyzed, such as the typology of the body shape, using car models often encountered in current road traffic.
3. Research Methods
The research was conducted by simulating vehicle-pedestrian collision on a dry asphalt surface on a horizontal road section. Therefore, the research results of this stage can only be applied to traffic accidents that occur in these conditions.
In this paper, real accidents with pedestrian dummies were analyzed, with images captured with high-speed cameras and simulations performed in PC-Crash. In [
17] and [
18] the authors used the use of camera images for real accidents involving pedestrians as an accident analysis technique.
The simulations analyzed pedestrians in a walking posture, crossing in front of vehicles, perpendicular to their direction of travel. These types of accidents were also revealed in [
19]. They showed that when focusing on the distribution ratio of the cases pedestrians were crossing the roads in front of the forward moving cars it is seen that these were 67% (fatal) in daytime and 78% on nighttime. Two different cases of first contact in the leg area were analyzed, when the body weight is taken on the front leg (P1) and when it is taken on the rear leg during walking (P2),
Figure 3.
Simulation was carried out in 3D. During the simulation, collisions occurred between the car and the pedestrian at different vehicle speeds.
These were modeled by accepting the following initial data:
The types of vehicles involved in the collision were: compact class - CC, super-mini class - SMC, executive class - EC and compact SUV - CSUV;
Vehicle initial speed 5, 10, 15 and 20 m/s;
Vehicle deceleration during impact 0, 2.5, 5 and 7.5 m/s2;
Pedestrian walking perpendicular to vehicle direction with 1.4 m/s;
The coefficient of friction between vehicle and pedestrian is 0.2;
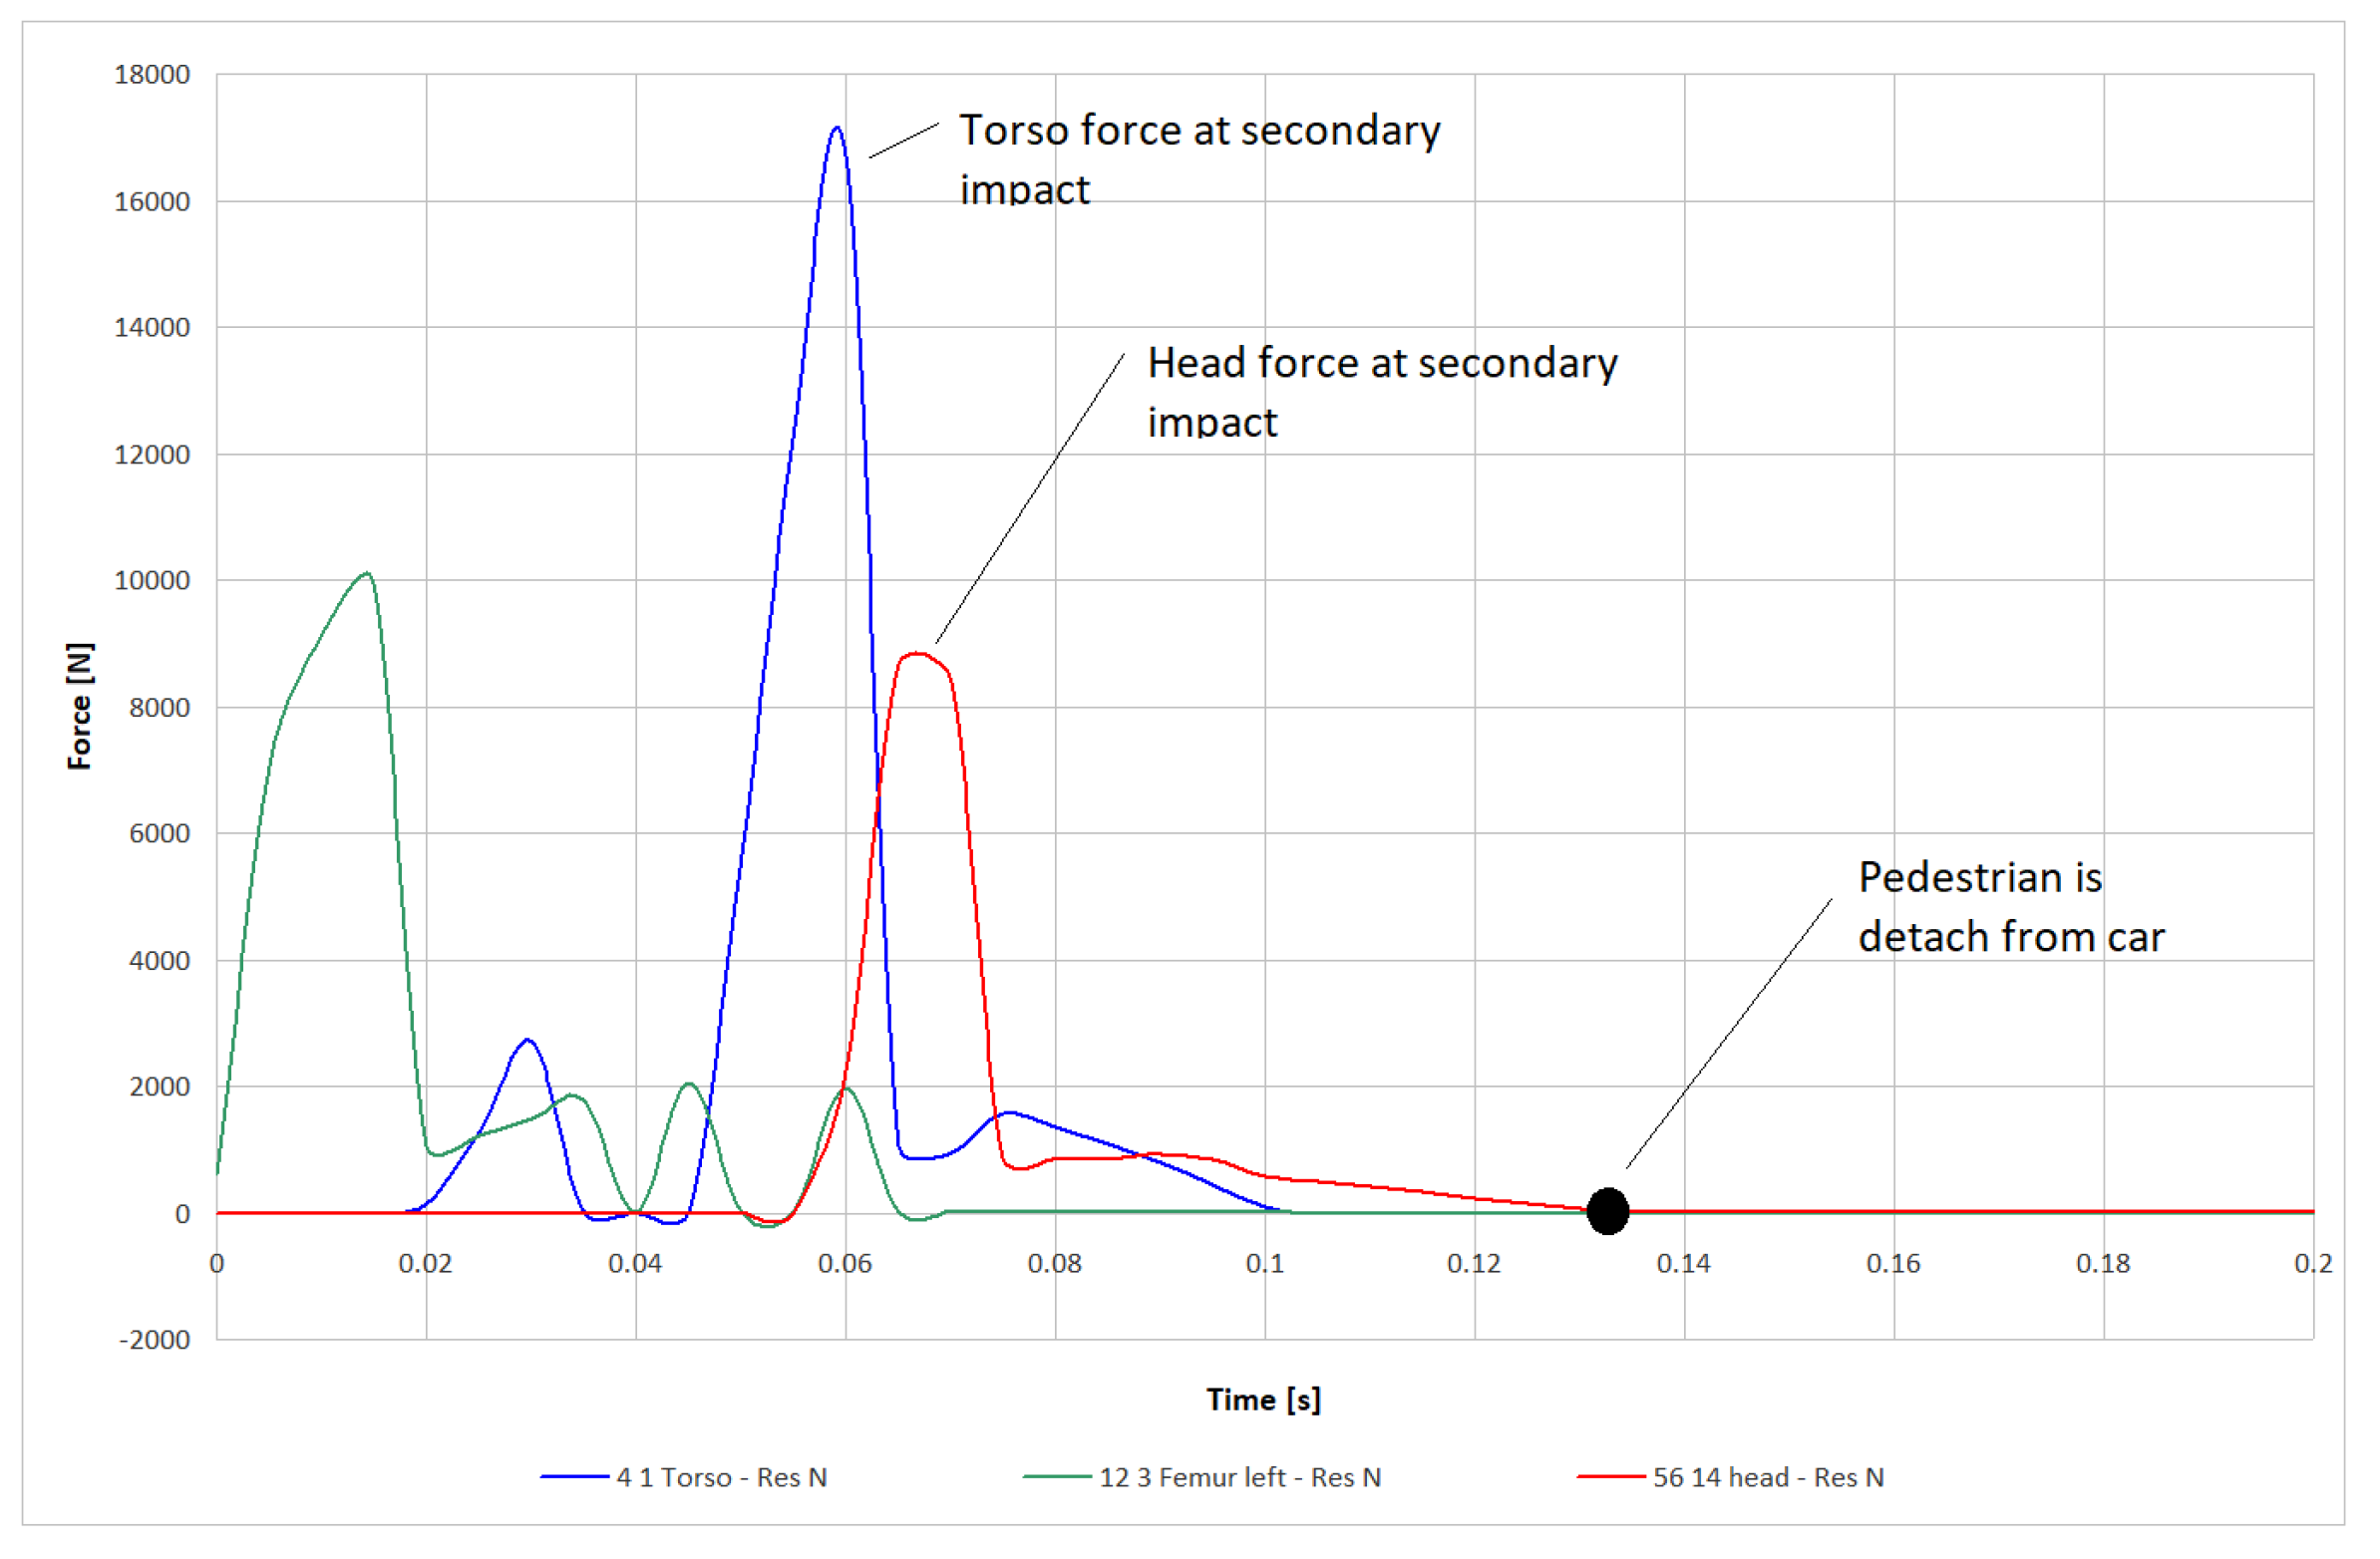
The moment when the contact force between the body segment (head/torso) and the vehicle is zero is considered to be the moment of separation from the vehicle,
Figure 4.
In [
20] various body postures were defined while walking, based on previous studies that state that the pedestrian's posture at the moment of impact has an influence on the kinematics of the impact between car and pedestrian. In [
21] Crocetta et al chose in their research, using MADYMO model, six initial stance configurations were chosen from the gait cycle defined in [
20]. In the simulations performed by the authors Impacts were performed with the pedestrian moving transversally (walking) to the vehicle at a speed of 1.4m/s. A summary of the simulations performed is given in
Table 1.
In [
22] the authors found in their study, using MADYMO ellipsoid multibody pedestrian model and real test with cadavers, performed over the speed range 20–30 kph and with three different vehicle types and pedestrian sizes, a good capacity to predict vehicle contact times.
In [
23] it is also used MADYMO ellipsoid multibody pedestrian model. Each model consists of 52 rigid bodies with an outer surface described by 64 ellipsoids. The MADYMO models have been used to study accidents reconstruction, particularly in vulnerable road users [24-26].
In [
27] Stevenson did an extensive study on the friction coefficients that occur in traffic accidents involving pedestrians. A non-linear frictional contact model in vehicle-pedestrian accidents was considered in [
28]. The study based on their model indicates that the pedestrian-ground friction coefficient is not consistent. The relationship between friction force and contact pressure is non-linear.
In [
29] authors chose in their research the friction coefficients between the pedestrian and the ground 0.6, and between the pedestrian and the vehicle 0.3.
The dummy used had the characteristics shown in
Table 1, during simulations. The moments in the main joints of the body (torso, neck, knees, ankles) were adapted to mimic the human body as closely as possible. Studies of moments in various body joints in different hypostases were done in [
30] for the knee, in [
31] for the walking posture, including the hip, knees and ankles, and in [
32] for the neck.
Body data is adjusted according to the report "International Data on Anthropometry” by Hans W. Jurgens, Ivar A. Aune and Ursula Pieper, published by the Federal Institute for Occupational Safety and Health, Dortmund, Federal Republic of Germany and a study made by various scientists in Slovakia [
33], see
Table 1.
A summary of the performed simulations is given in
Table 2. Thus 256 simulations were performed using the Multibody model from PC-Crash V13.1
4. Results
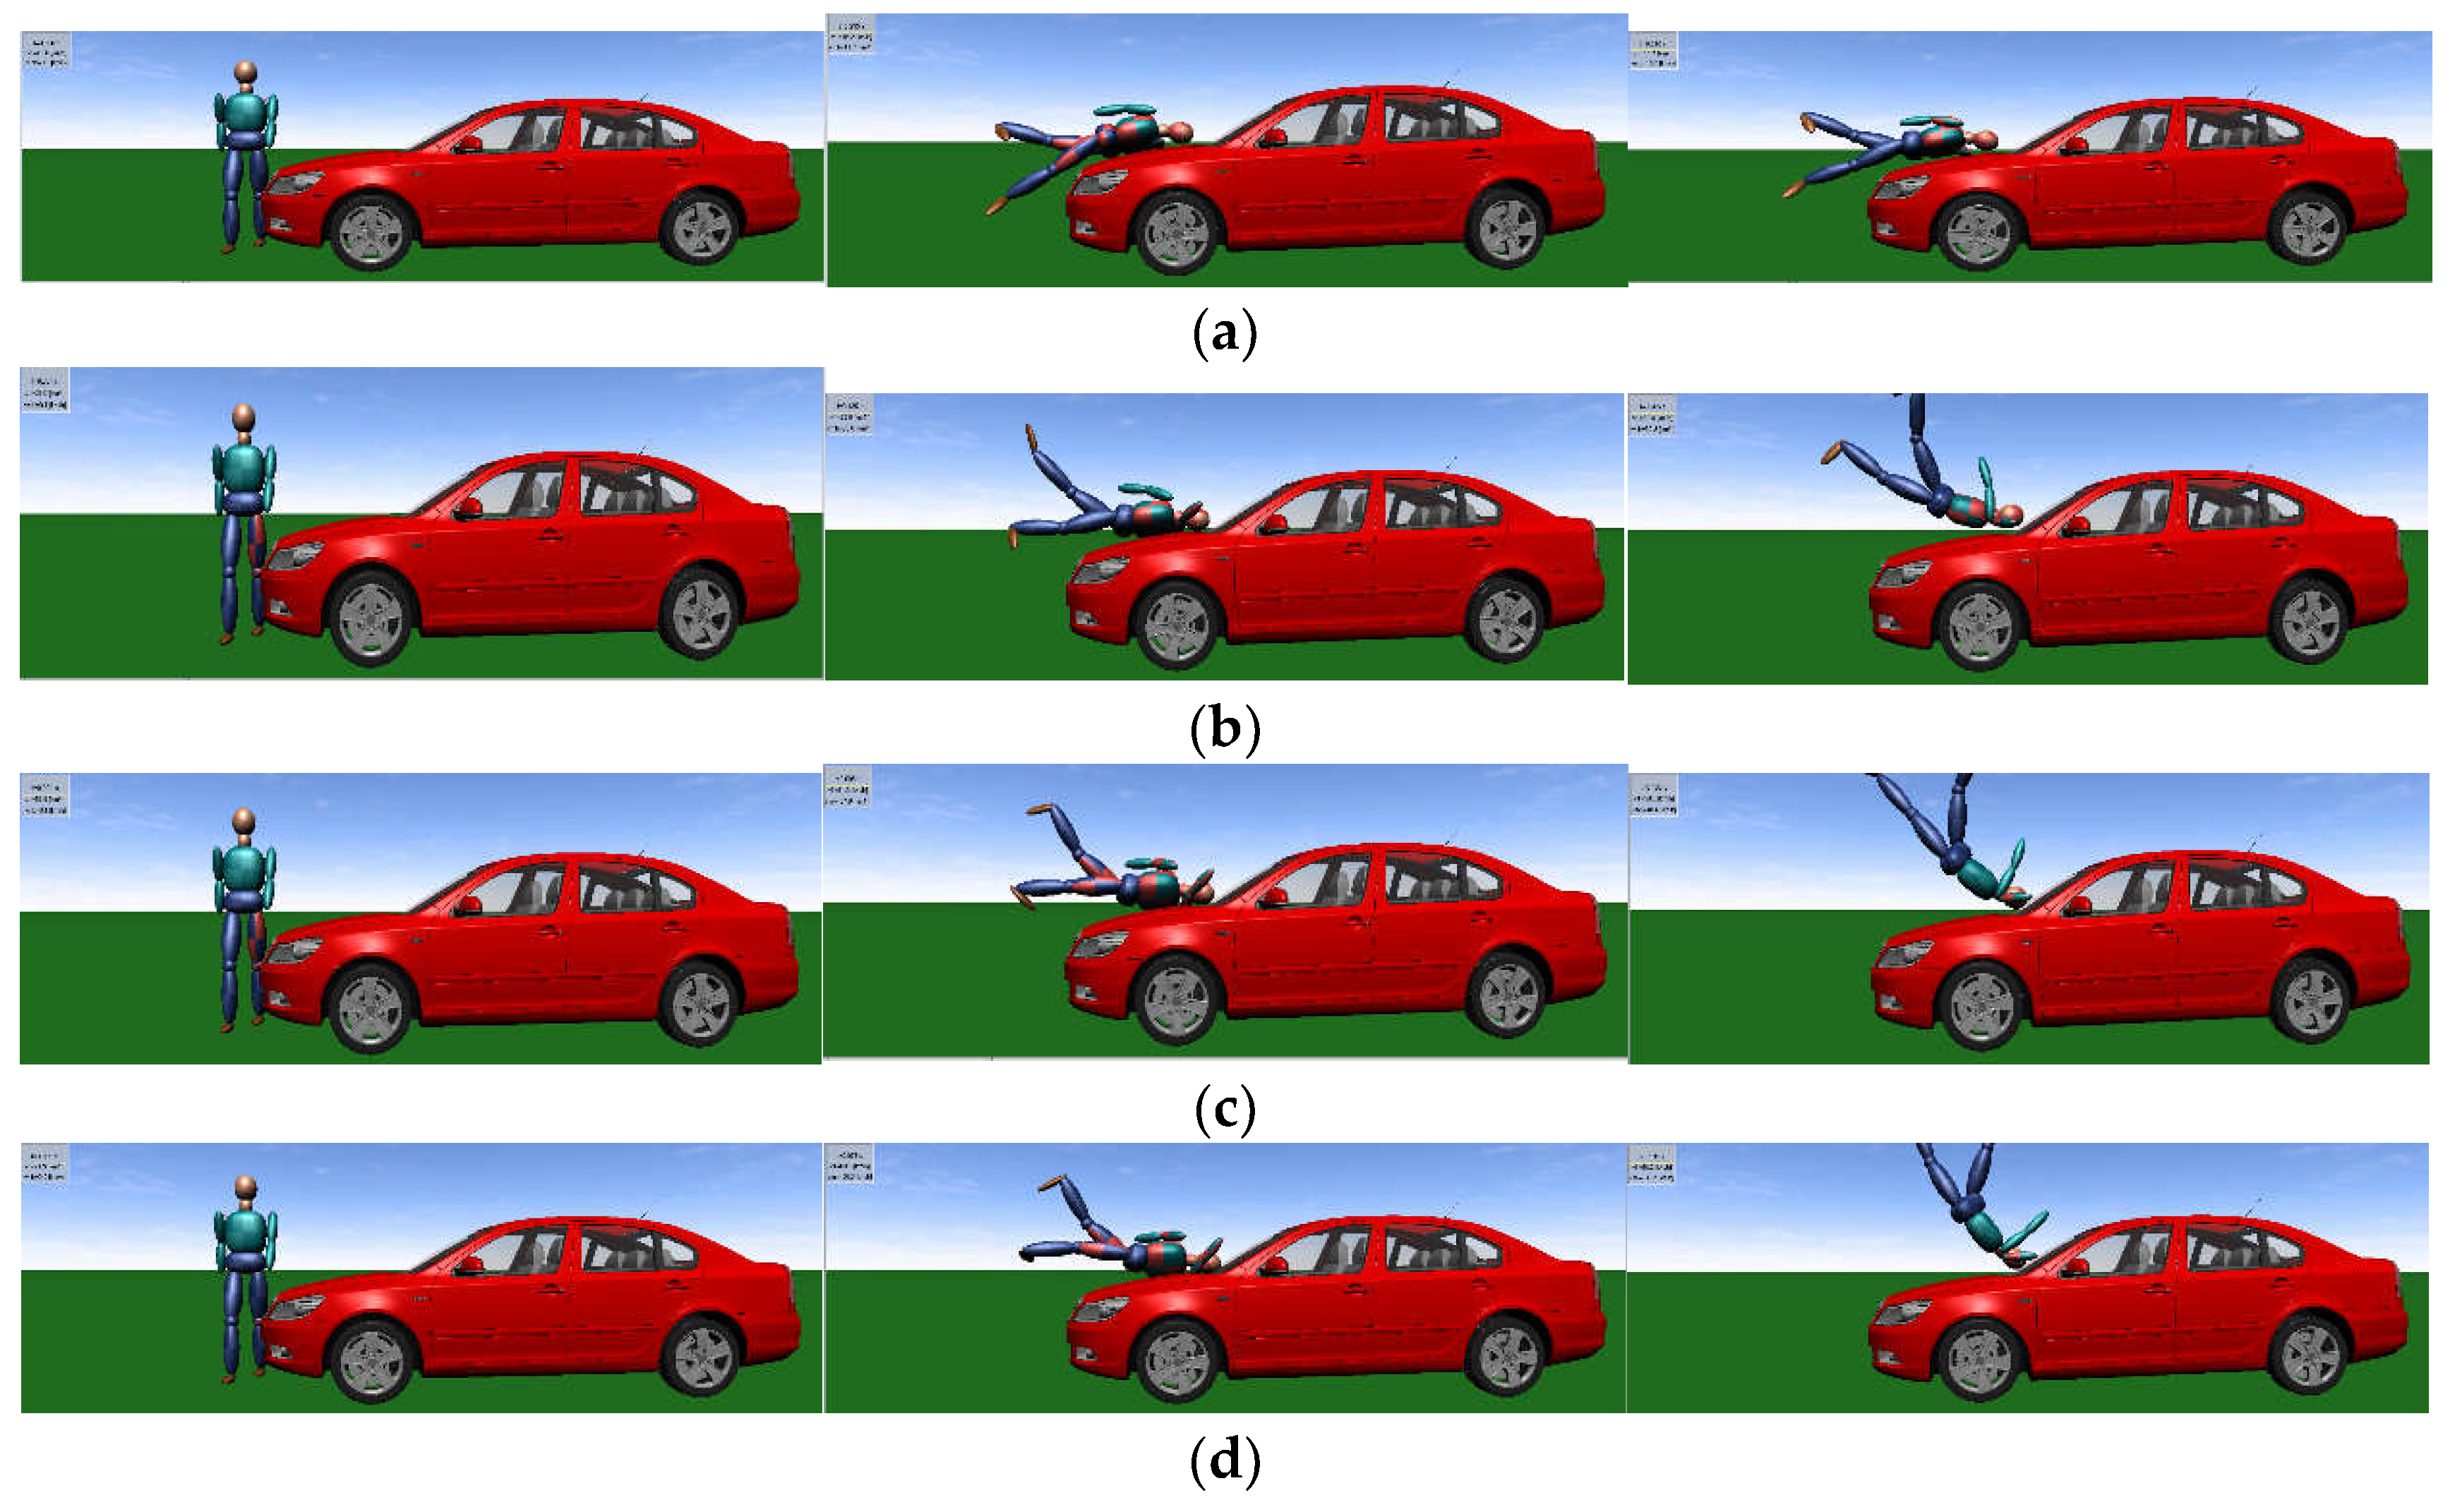
The simulations show the existence of the two sub-phases of the contact between vehicle and pedestrian for all the cases analyzed,
Figure 5. With the exception of low collision speeds, the resulting impact types are of the roof vault and somersault typology. The increase in speed at the moment of impact results in a larger movement of the pedestrian as he or she detaches from the car, performing somersaults through the air.
For an impact speed of 5 m/s the impact type is wrapped around, the pedestrian is not thrown through the air but slides off the vehicle.
The time at which the pedestrian detaches from the vehicle is obtained from the diagram of the contact forces between the body segments and the car.
For the Compact class CC vehicle,
Figure 5, the maximum distance in this case is around 4.01 meters at a speed of 10 m/s,
Figure 6. At the same time, the greatest variation in the distances travelled in the contact phase is observed here, depending on the impact speed. The minimum distance is 1.2 m at a collision speed of 5 m/s. For this category of cars, at low impact speeds, the pedestrian kinematics is of the wrap around type, according to the classification in Ravani, followed by the somersault and roof vault type at high speed.
Depending on the position of the pedestrian (left leg in front or behind), as well as the offset of the impact position from the center of the car, at low speeds, we could have a fender vault collision.
Considering the time origin at the moment of impact between the bumper and the pedestrian's foot, the secondary collision occurs at time 0.075 until 0.21 second, and the detachment from the car at time 0.125 until 0.515 second, depending on speed and deceleration.
The impact moments captured in
Figure 5 show the first contact, in the knee region of the lower limbs, followed by the contact of the femur with the front edge of the bonnet. The pedestrian then strikes the bonnet with the thorax while the secondary, head impact occurs in the bonnet-windscreen area. Until detached from the vehicle the pedestrian describes a roof vault or somersault movement for high speed collisions.
The low height geometric profile of some vehicles in this class leads to a high number of roof vault impacts compared to SUVs.
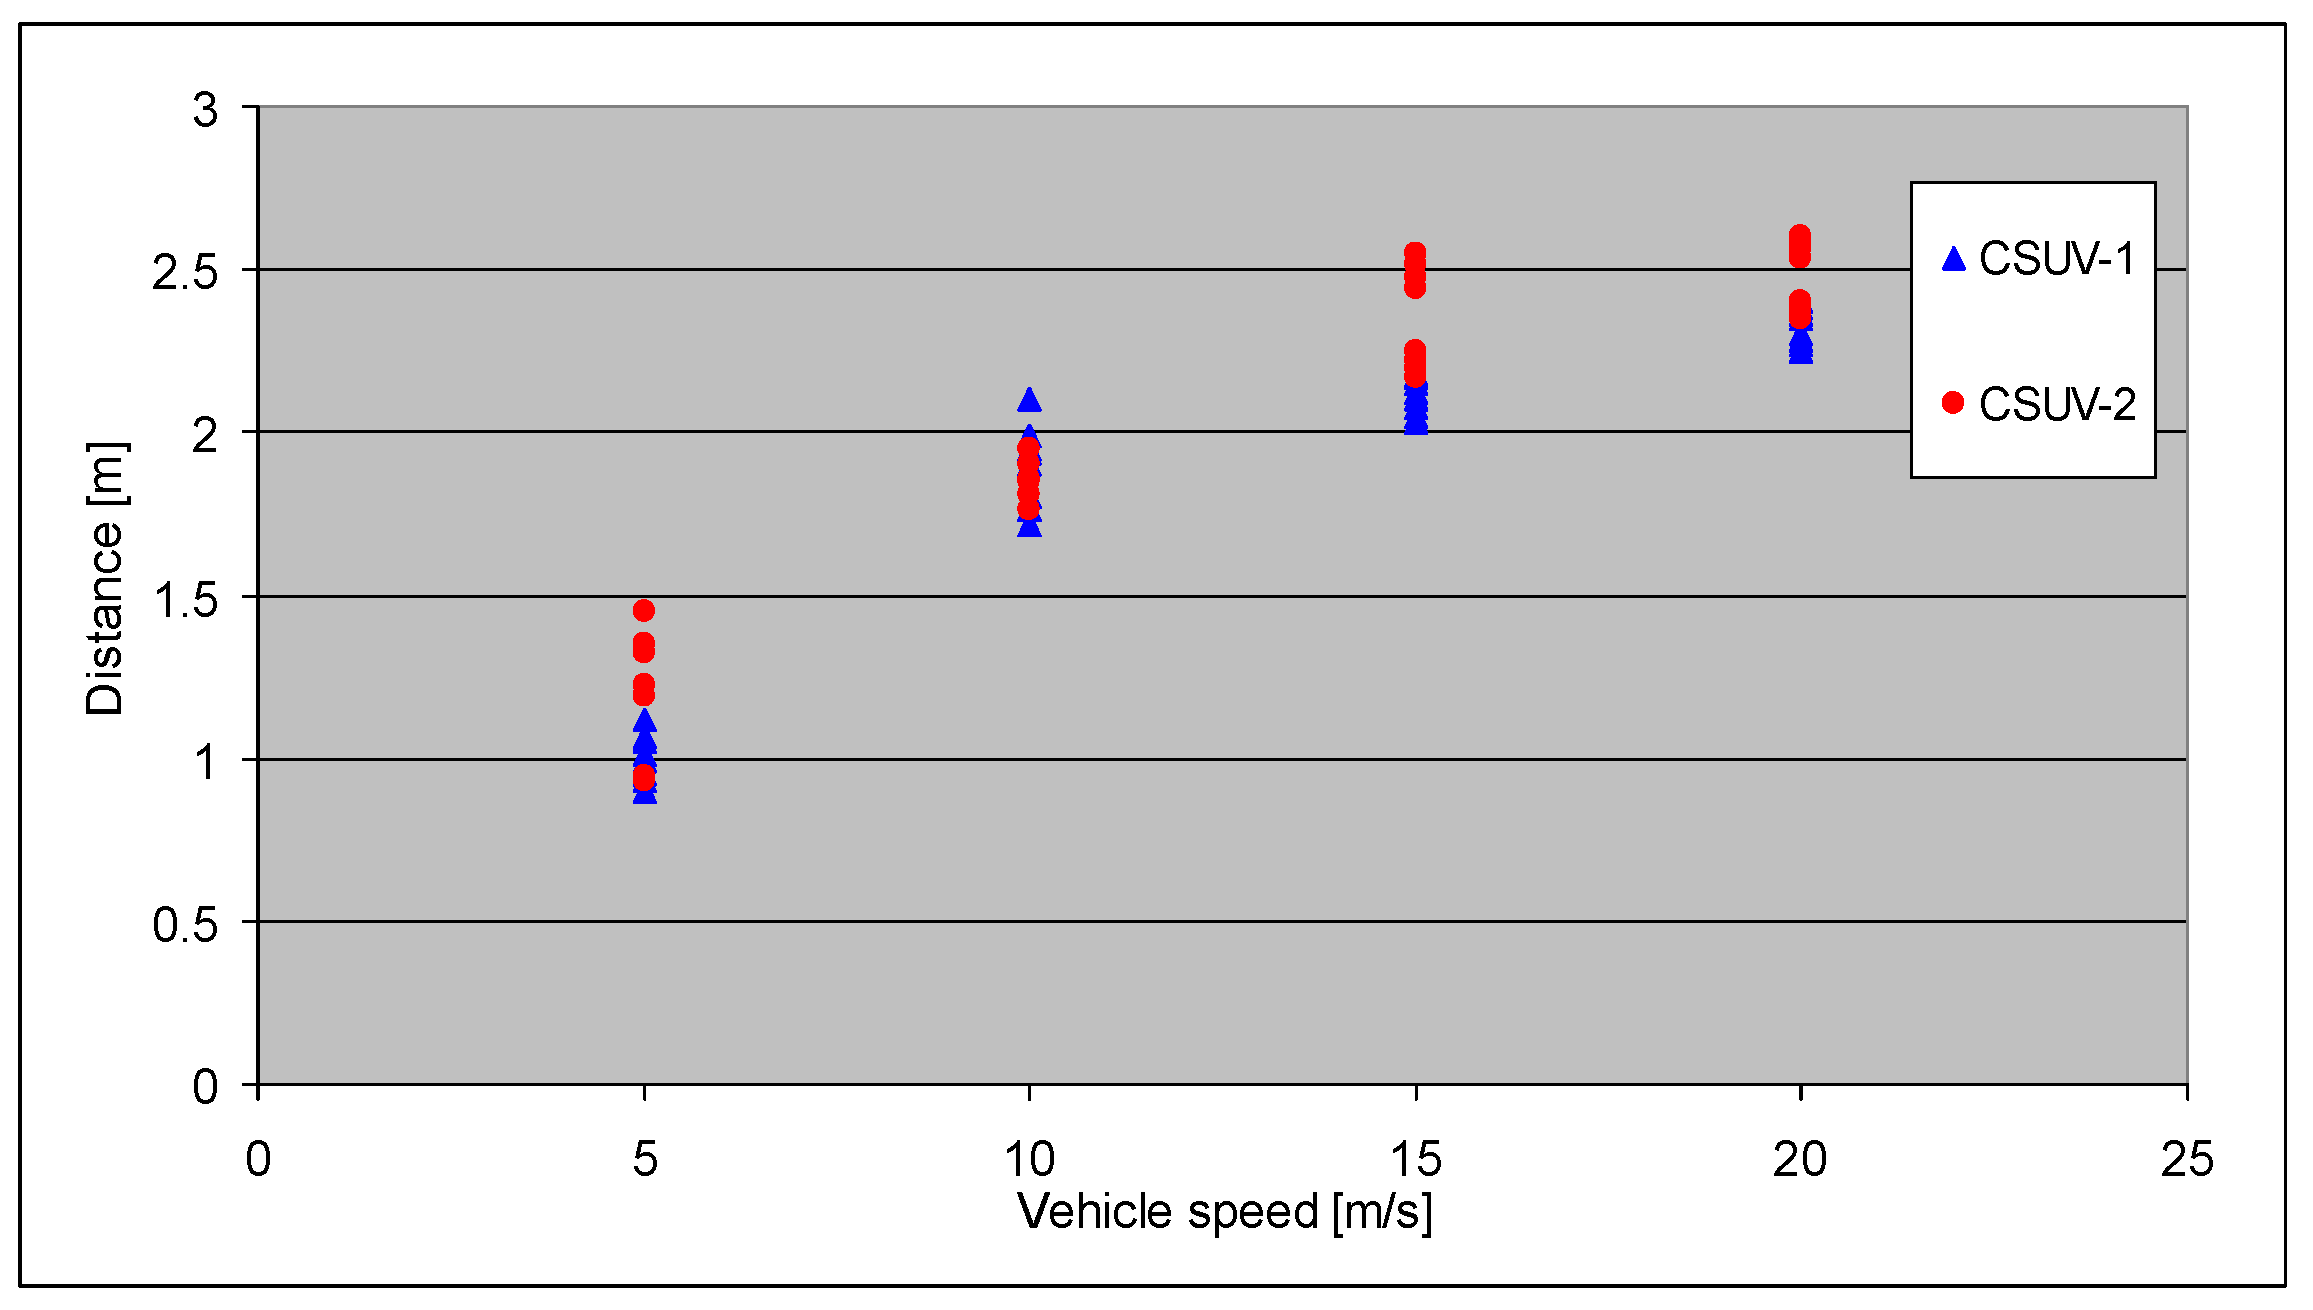
For the CSUV class - the maximum distance in this case is just over 2.6 meters at 20m/s,
Figure 7. In this case there is less dispersion, as a function of impact velocity, of the distances travelled in the contact phase. The minimum distance is 0.8 m at a collision speed of 5 m/s, which is the smallest of all the vehicle classes analyzed. For this class of cars, at low impact speeds, the pedestrian kinematics is of the wrap around type, followed by the somersault and roof vault type at high speed.
Considering the time origin at the moment of impact between the bumper and the pedestrian's foot, the secondary collision occurs at time 0.06-0.18 second, and the detachment from the car at time 0.115-0.30 sec.
The impact moments captured in
Figure 8 show the first contact, in the knee region of the lower limbs, followed by contact of the pelvis with the front edge of the bonnet. The pedestrian then strikes the bonnet with the thorax while the secondary, head impact occurs in the bonnet area at high speed. At collision speeds of 5 m/s, for this type of vehicle, it is possible that the head-to-body contact may not occur.
These vehicles can cause more severe injuries because of the greater height at the front edge of the bonnet. In this case pedestrians, especially small pedestrians, are hit in the pelvis-abdomen area with the front end, as opposed to compact class cars where the pelvis and abdomen were hit by the bonnet.
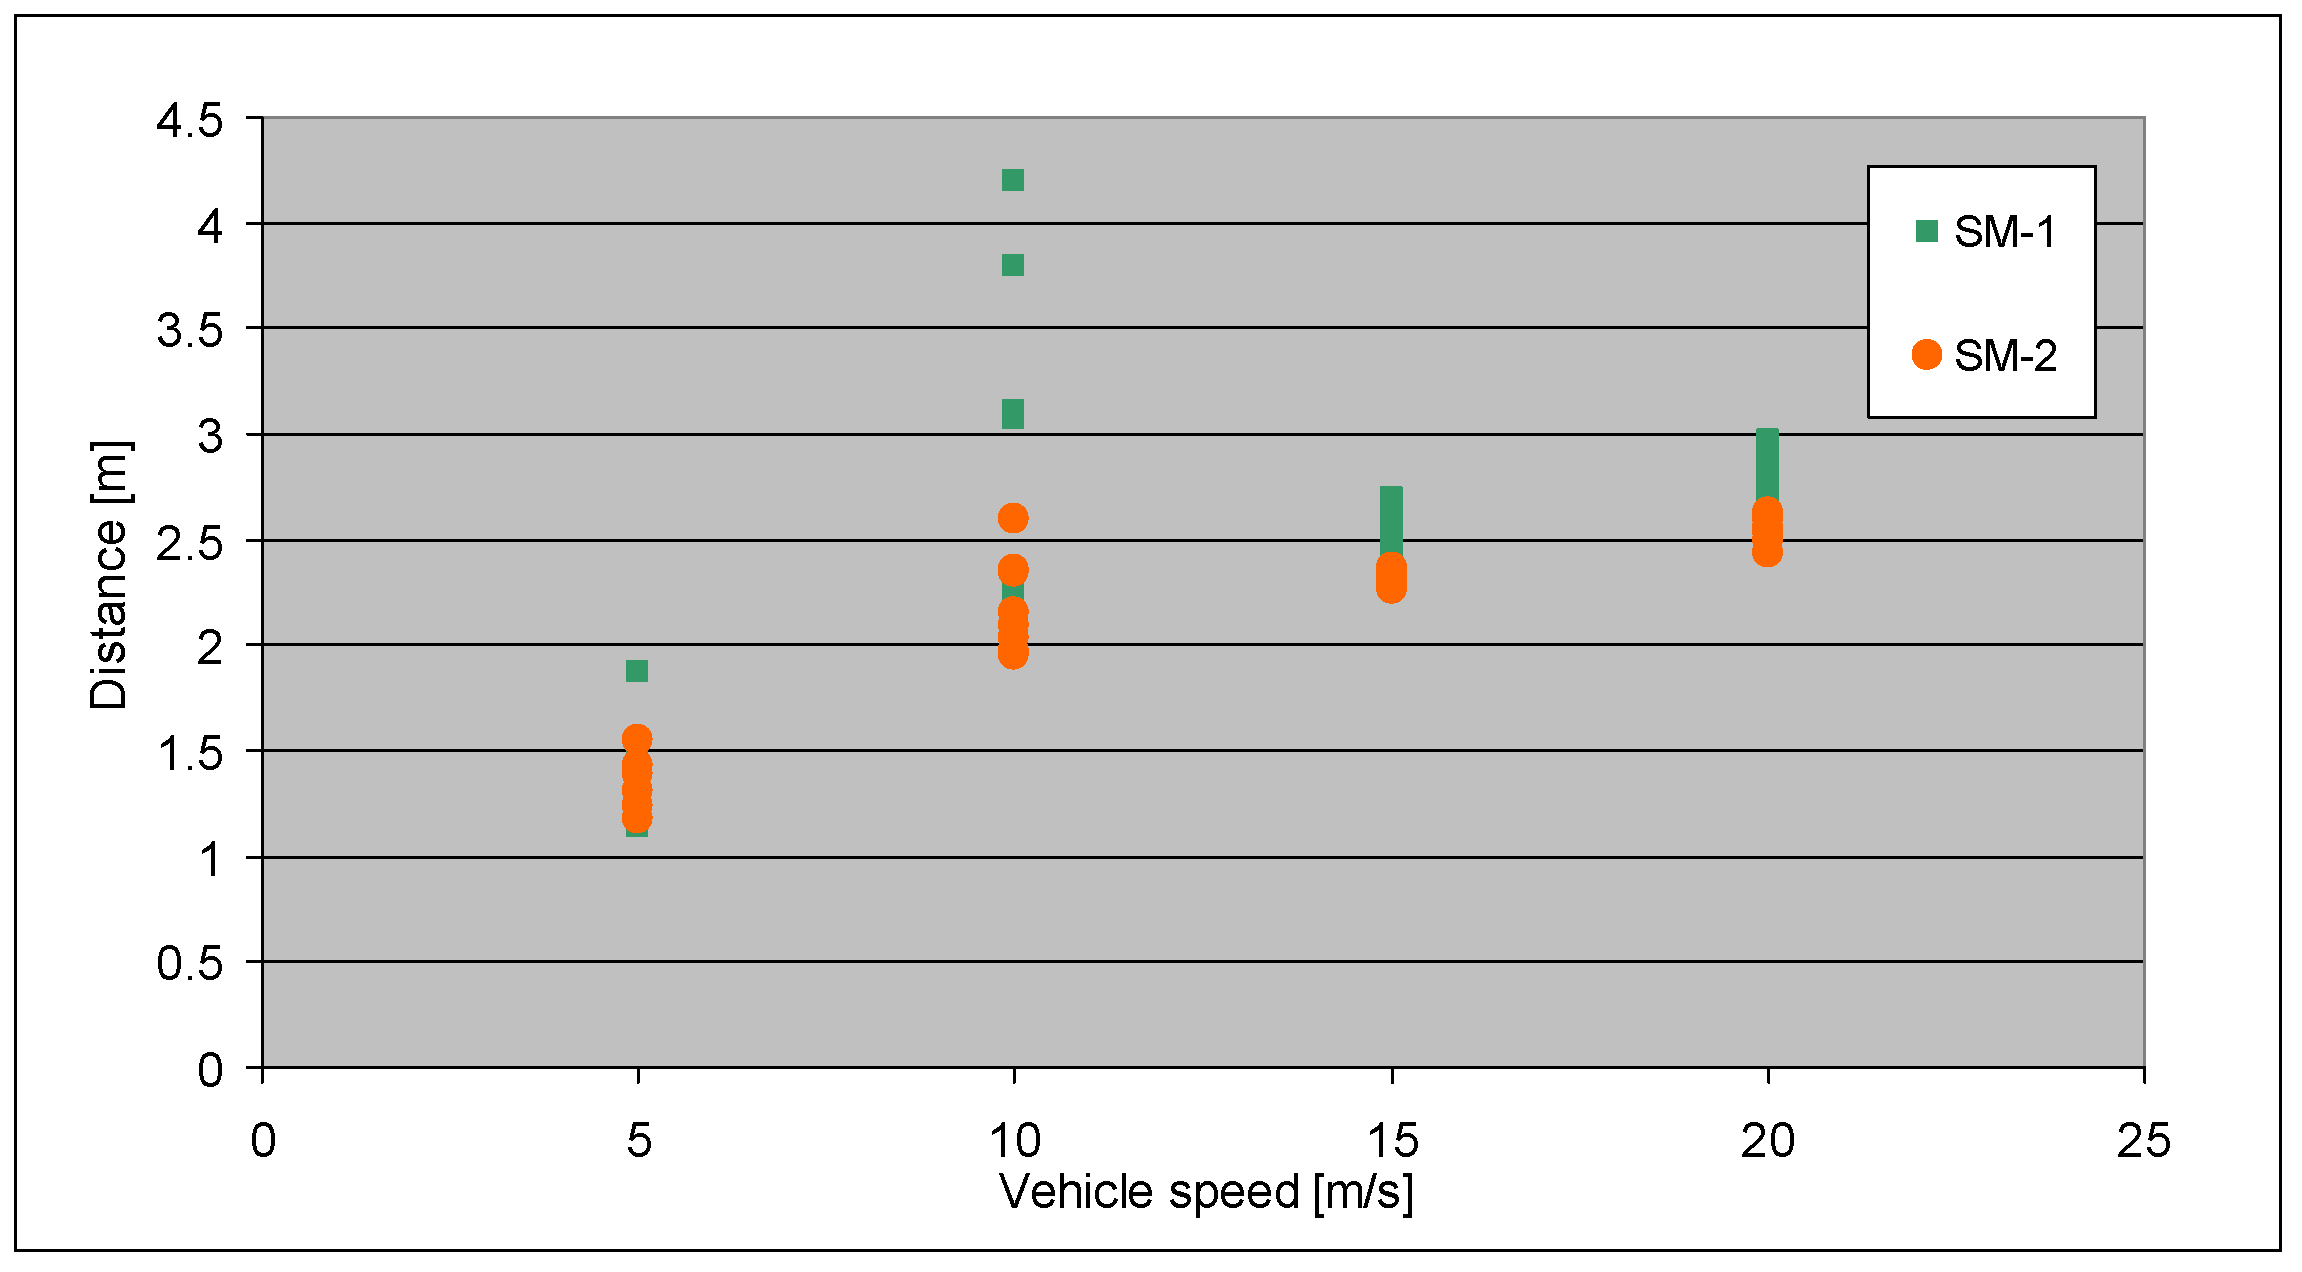
Analyzing the results by vehicle type, shows that for the SM class,
Figure 10 - the longest distances travelled by the pedestrian in contact with the car, until detachment from the car, are obtained. The maximum distance in this case is just over 4.3 meters at 10 m/s,
Figure 9. In this case there, for 10 m/s velocity, is a great dispersion, as a function of impact velocity, of the distances travelled in the contact phase. The minimum distance is 1.15 m at a collision speed of 5 m/s. For this class of cars, at low impact speeds, the pedestrian kinematics is of the wrap around type, followed by the somersault and roof vault type at high speed.
Considering the time origin at the moment of impact between the bumper and the pedestrian's foot, the secondary collision occurs at time 0.05-0.245 second, and the detachment from the car at time 0.125-0.42 sec.
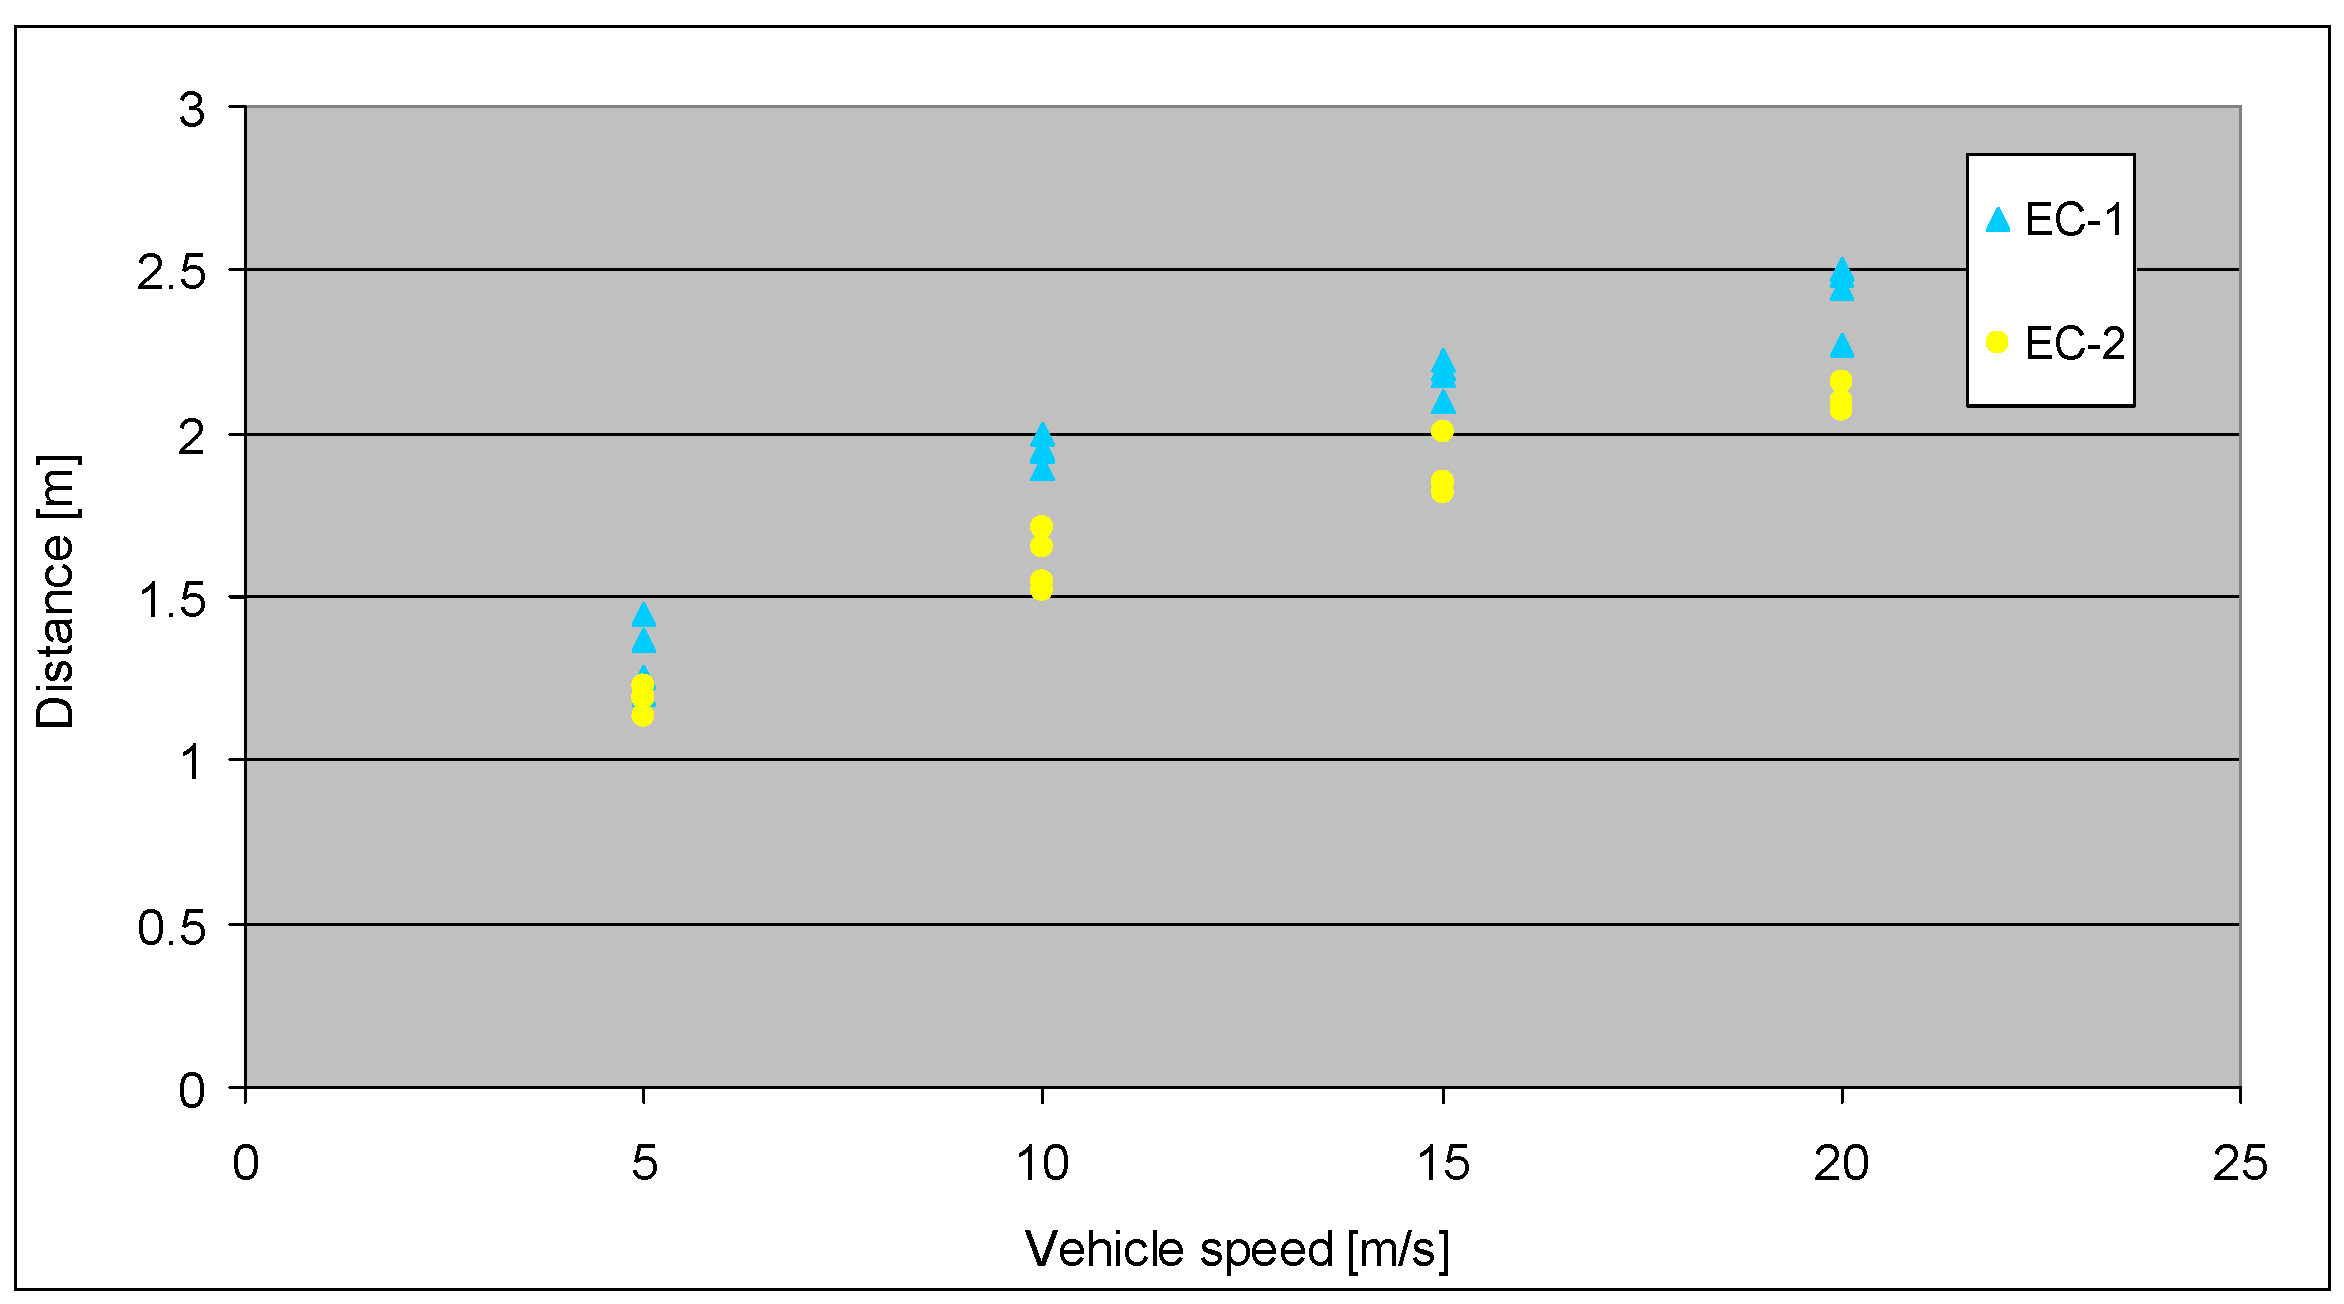
For executive class EC, the maximum distance in this case is around 2.5 meters at 20 m/s,
Figure 11. The minimum distance is 1.2 m at a collision speed of 5 m/s. For this class of cars, at low impact speeds, the pedestrian kinematics is of the wrap around type, followed by the somersault type after 10 m/s.
Considering the time origin at the moment of impact between the bumper and the pedestrian's foot, the secondary collision occurs at time 0.06-0.24 second, and the detachment from the car at time 0.105-0.315 sec.
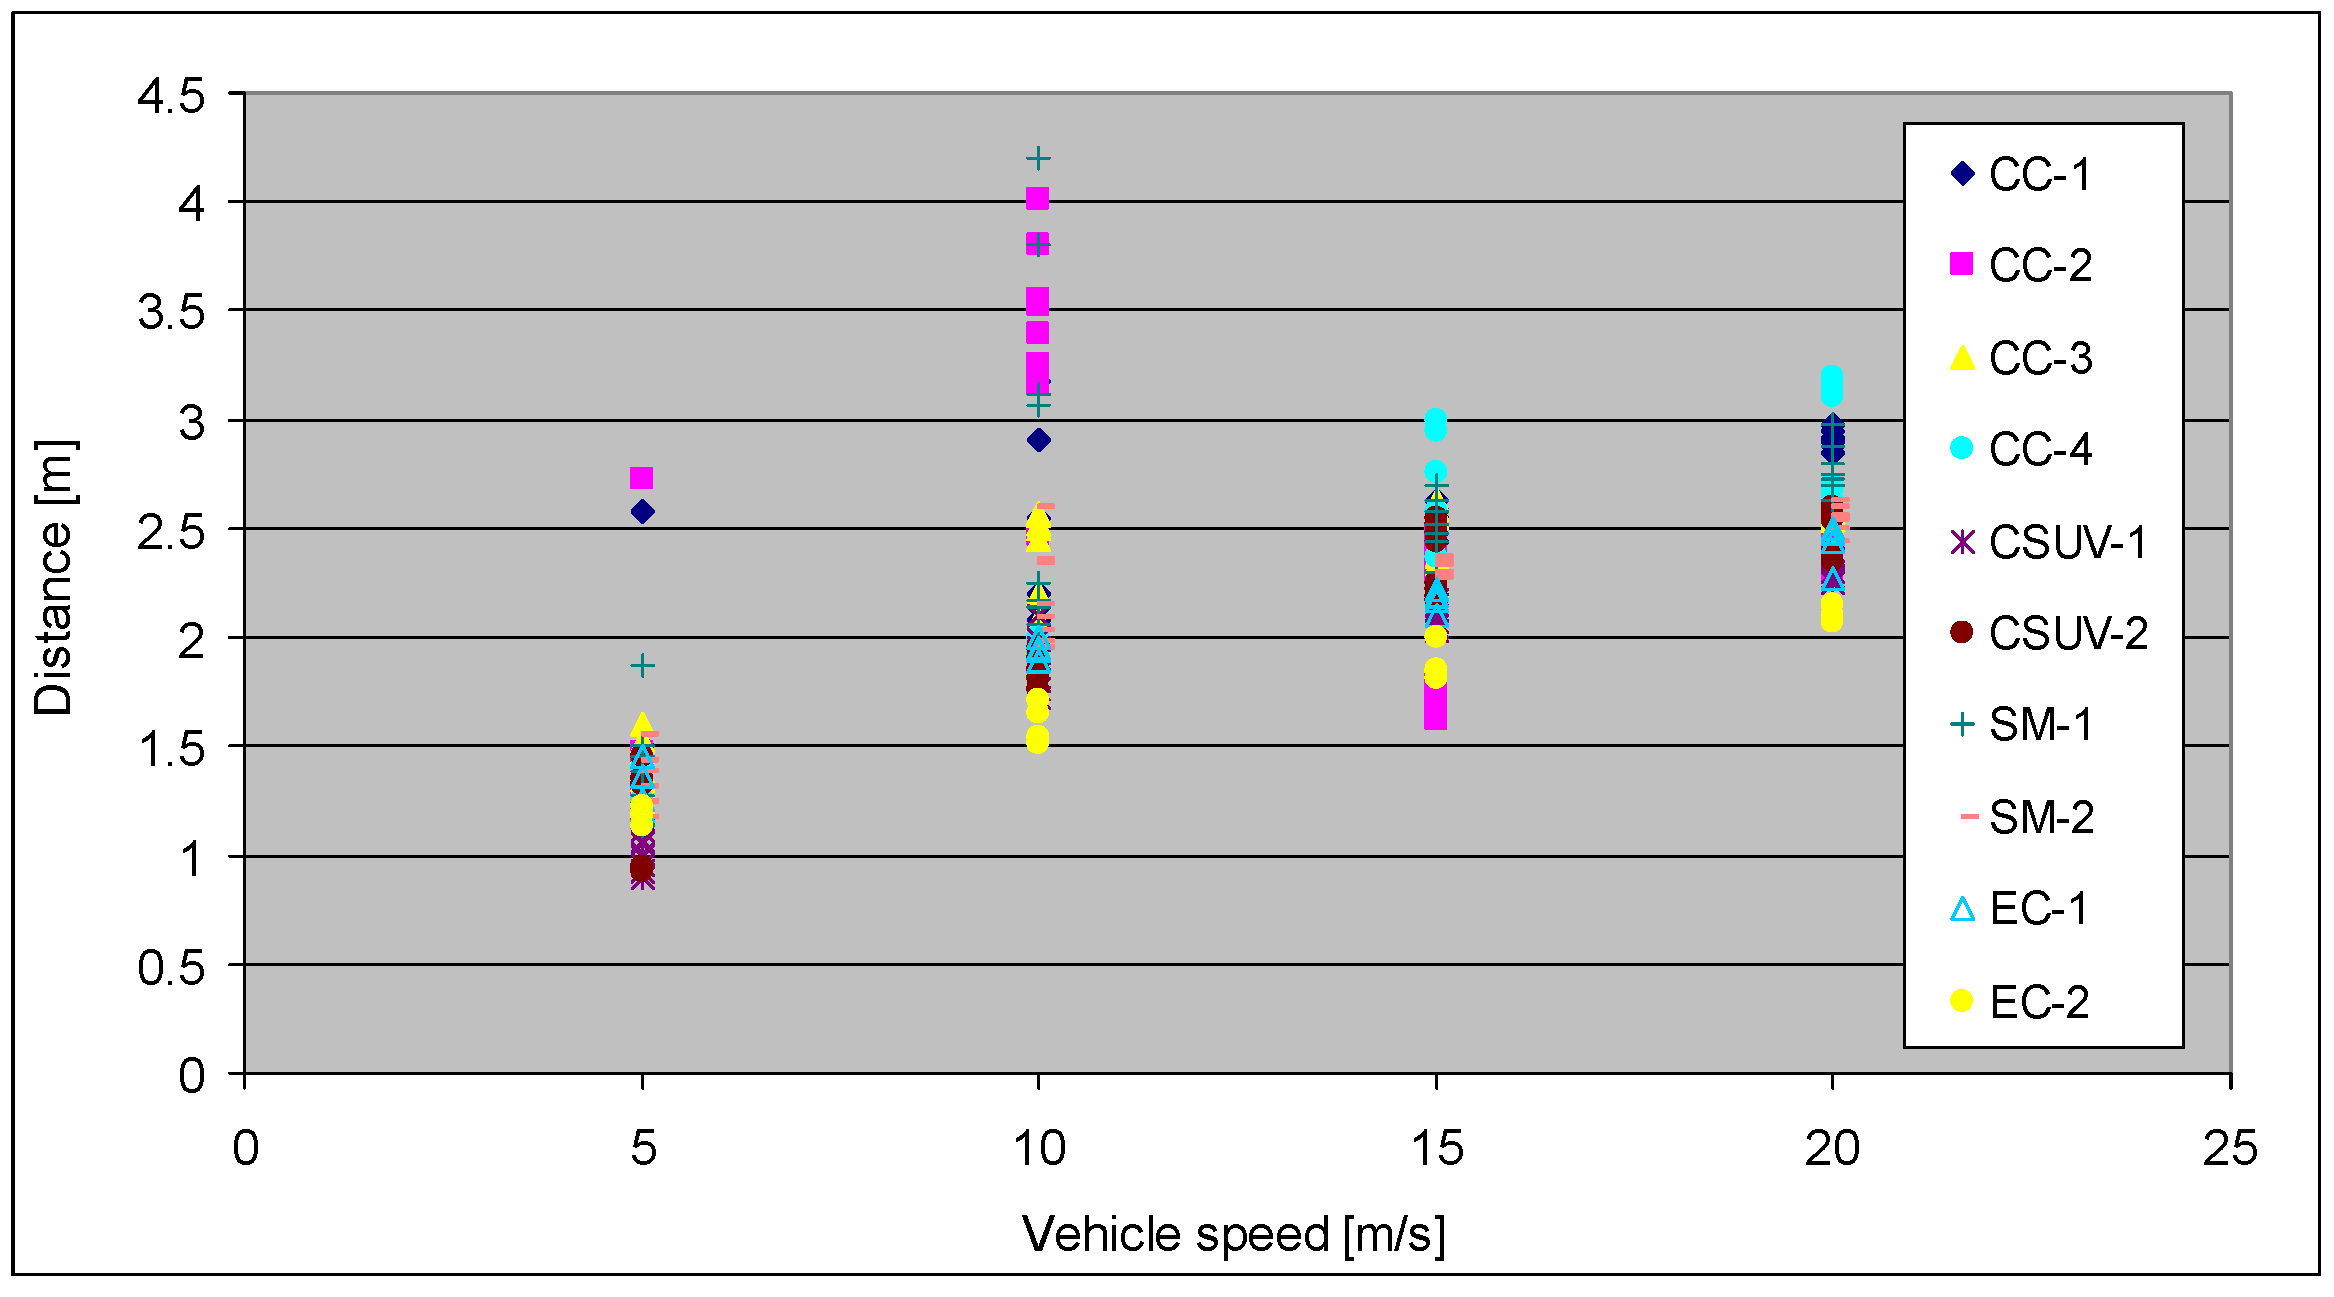
For all classes of vehicles, the tendency to increase the distance covered in the contact phase is observed, along with the increase in the impact speed. The posture of the pedestrian at the moment of impact generates the kinematics of his movement, but it does not significantly change the contact times, so implicitly the distances covered,
Figure 13.
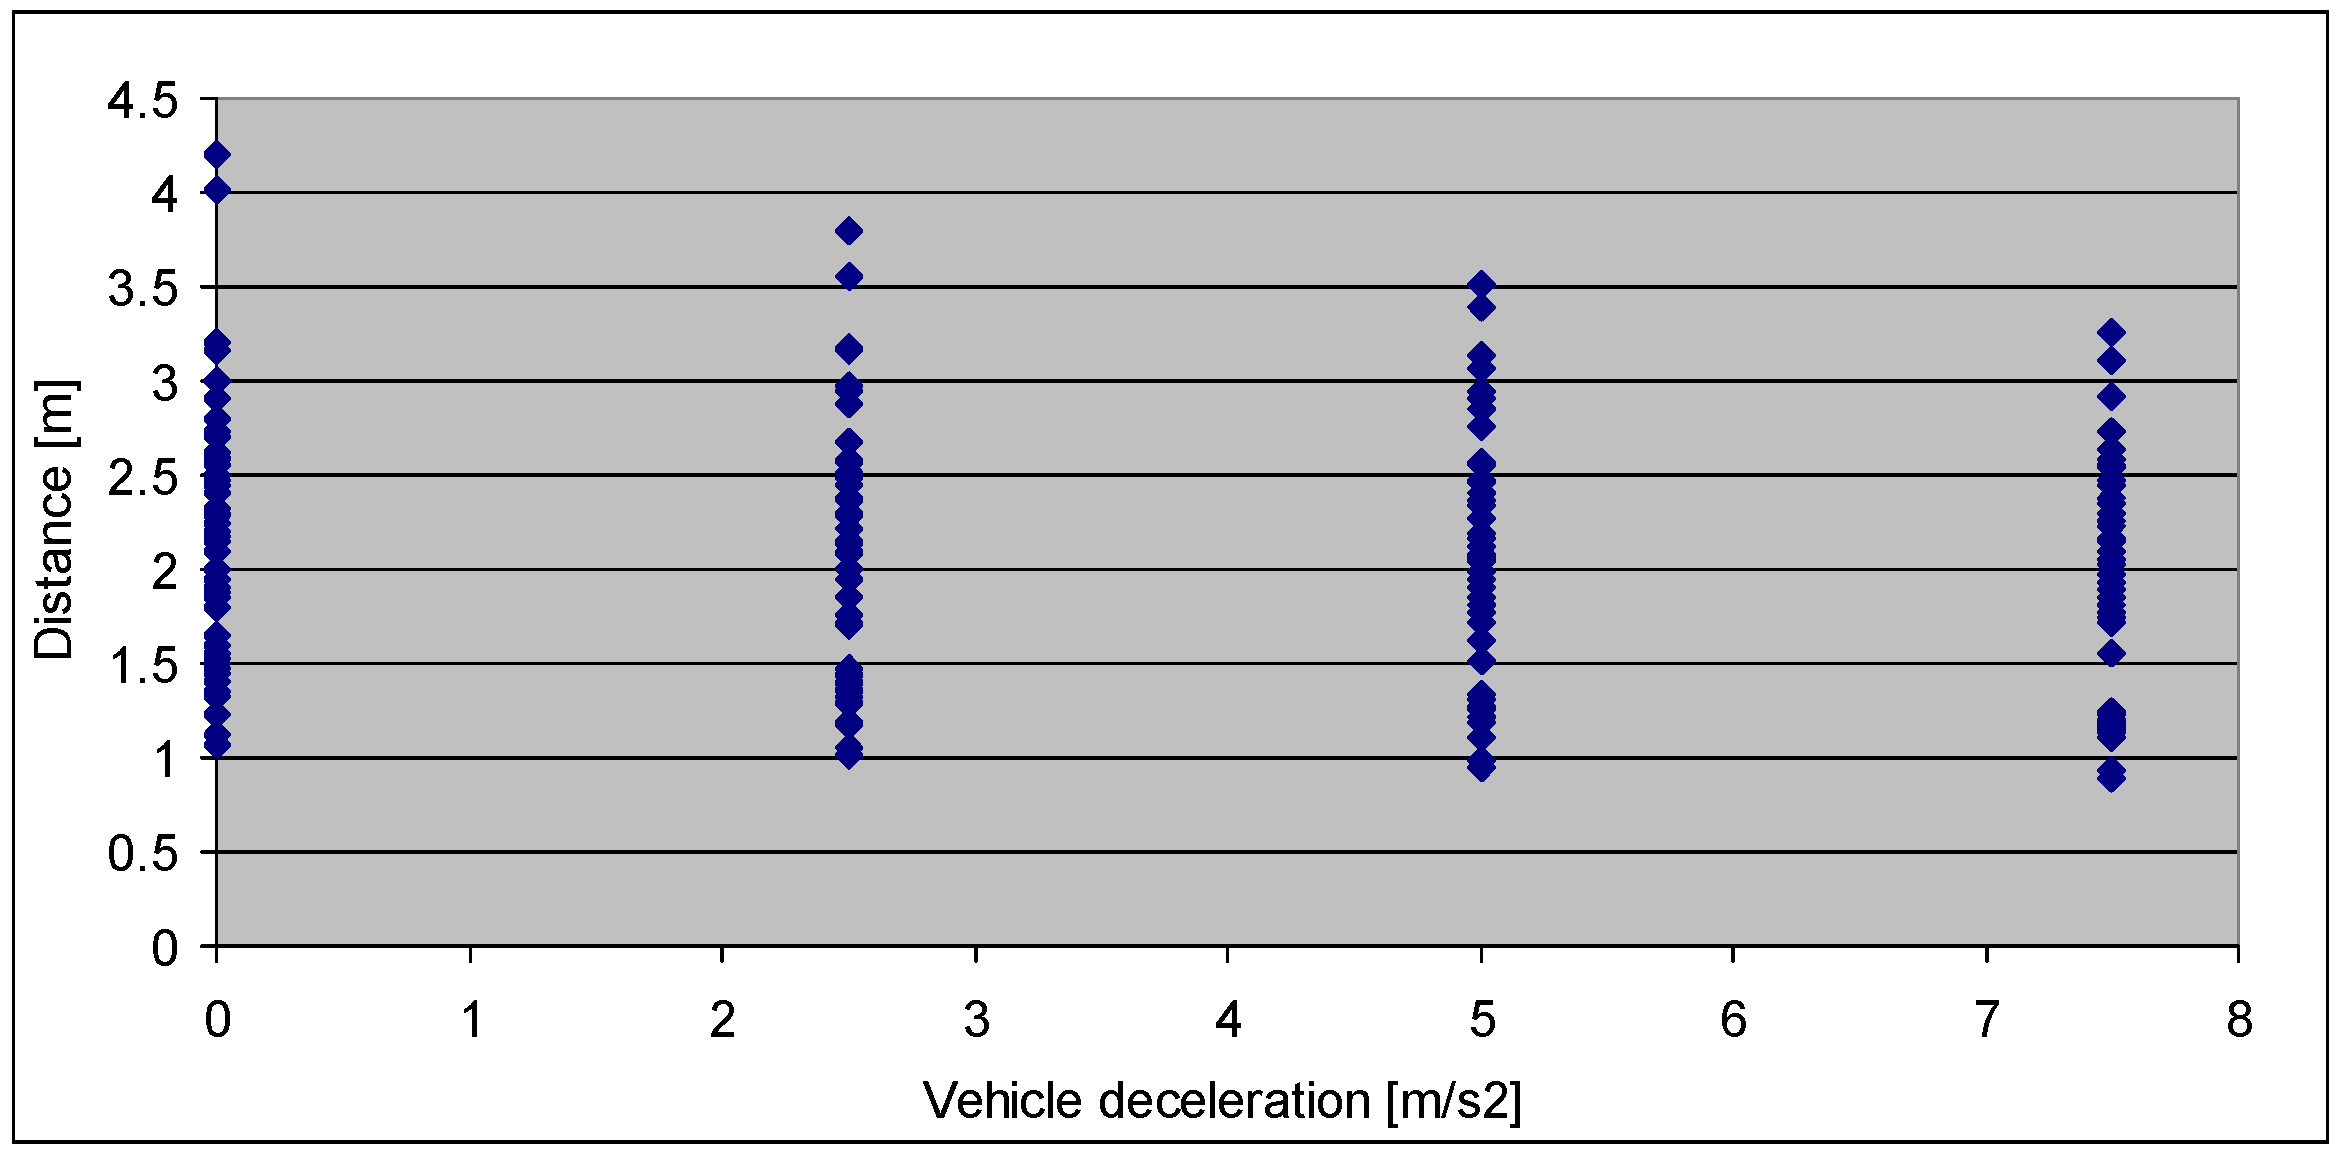
Analyzing as a whole all the categories of vehicles with which the simulations were carried out, we notice that with the increase in deceleration at the moment of impact, the maximum values of the distance traveled by the pedestrian until the separation from the vehicle decrease,
Figure 14.
5. Discussion
The current geometry of cars influences the distances traveled by pedestrians in contact with them. In the speed range of 10 m/s and 5 m/s, a large dispersion of the values obtained for the distances traveled by the vehicle in contact with the pedestrian can be observed, both in the case of simulations and in the analyzed experimental tests. For low speeds, the possible explanation is the fact that the movement of the pedestrian is not extensive, after the impact in the area of the lower limbs, he flips over on the hood and remains in contact until he slides in front or on the side of the vehicle.
In the simulations, the dispersion according to the vehicle class is presented in the
Table 3. It can be observed that the distance covered in the contact phase between vehicles and pedestrians depends on their class. Thus, SM and CC class vehicles have the longest contact phase distance, followed by CSUV and EC class.
The experimental researches, in number of 18, were carried out with different types of vehicles, at various impact speeds, with dummies of different sizes and masses or real accidents,
Figure 15, a, b, c. The video images captured during the experiments were analyzed, with the aim of establishing the distances traveled by pedestrians in contact with vehicles. They best reproduce the different specific conditions under which accidents involving pedestrians take place. Also, the impact conditions, dry or wet road, were varied. It should be mentioned that the dummies used had various masses and heights, thus covering as large a segment as possible of the anthropometric typologies of people.
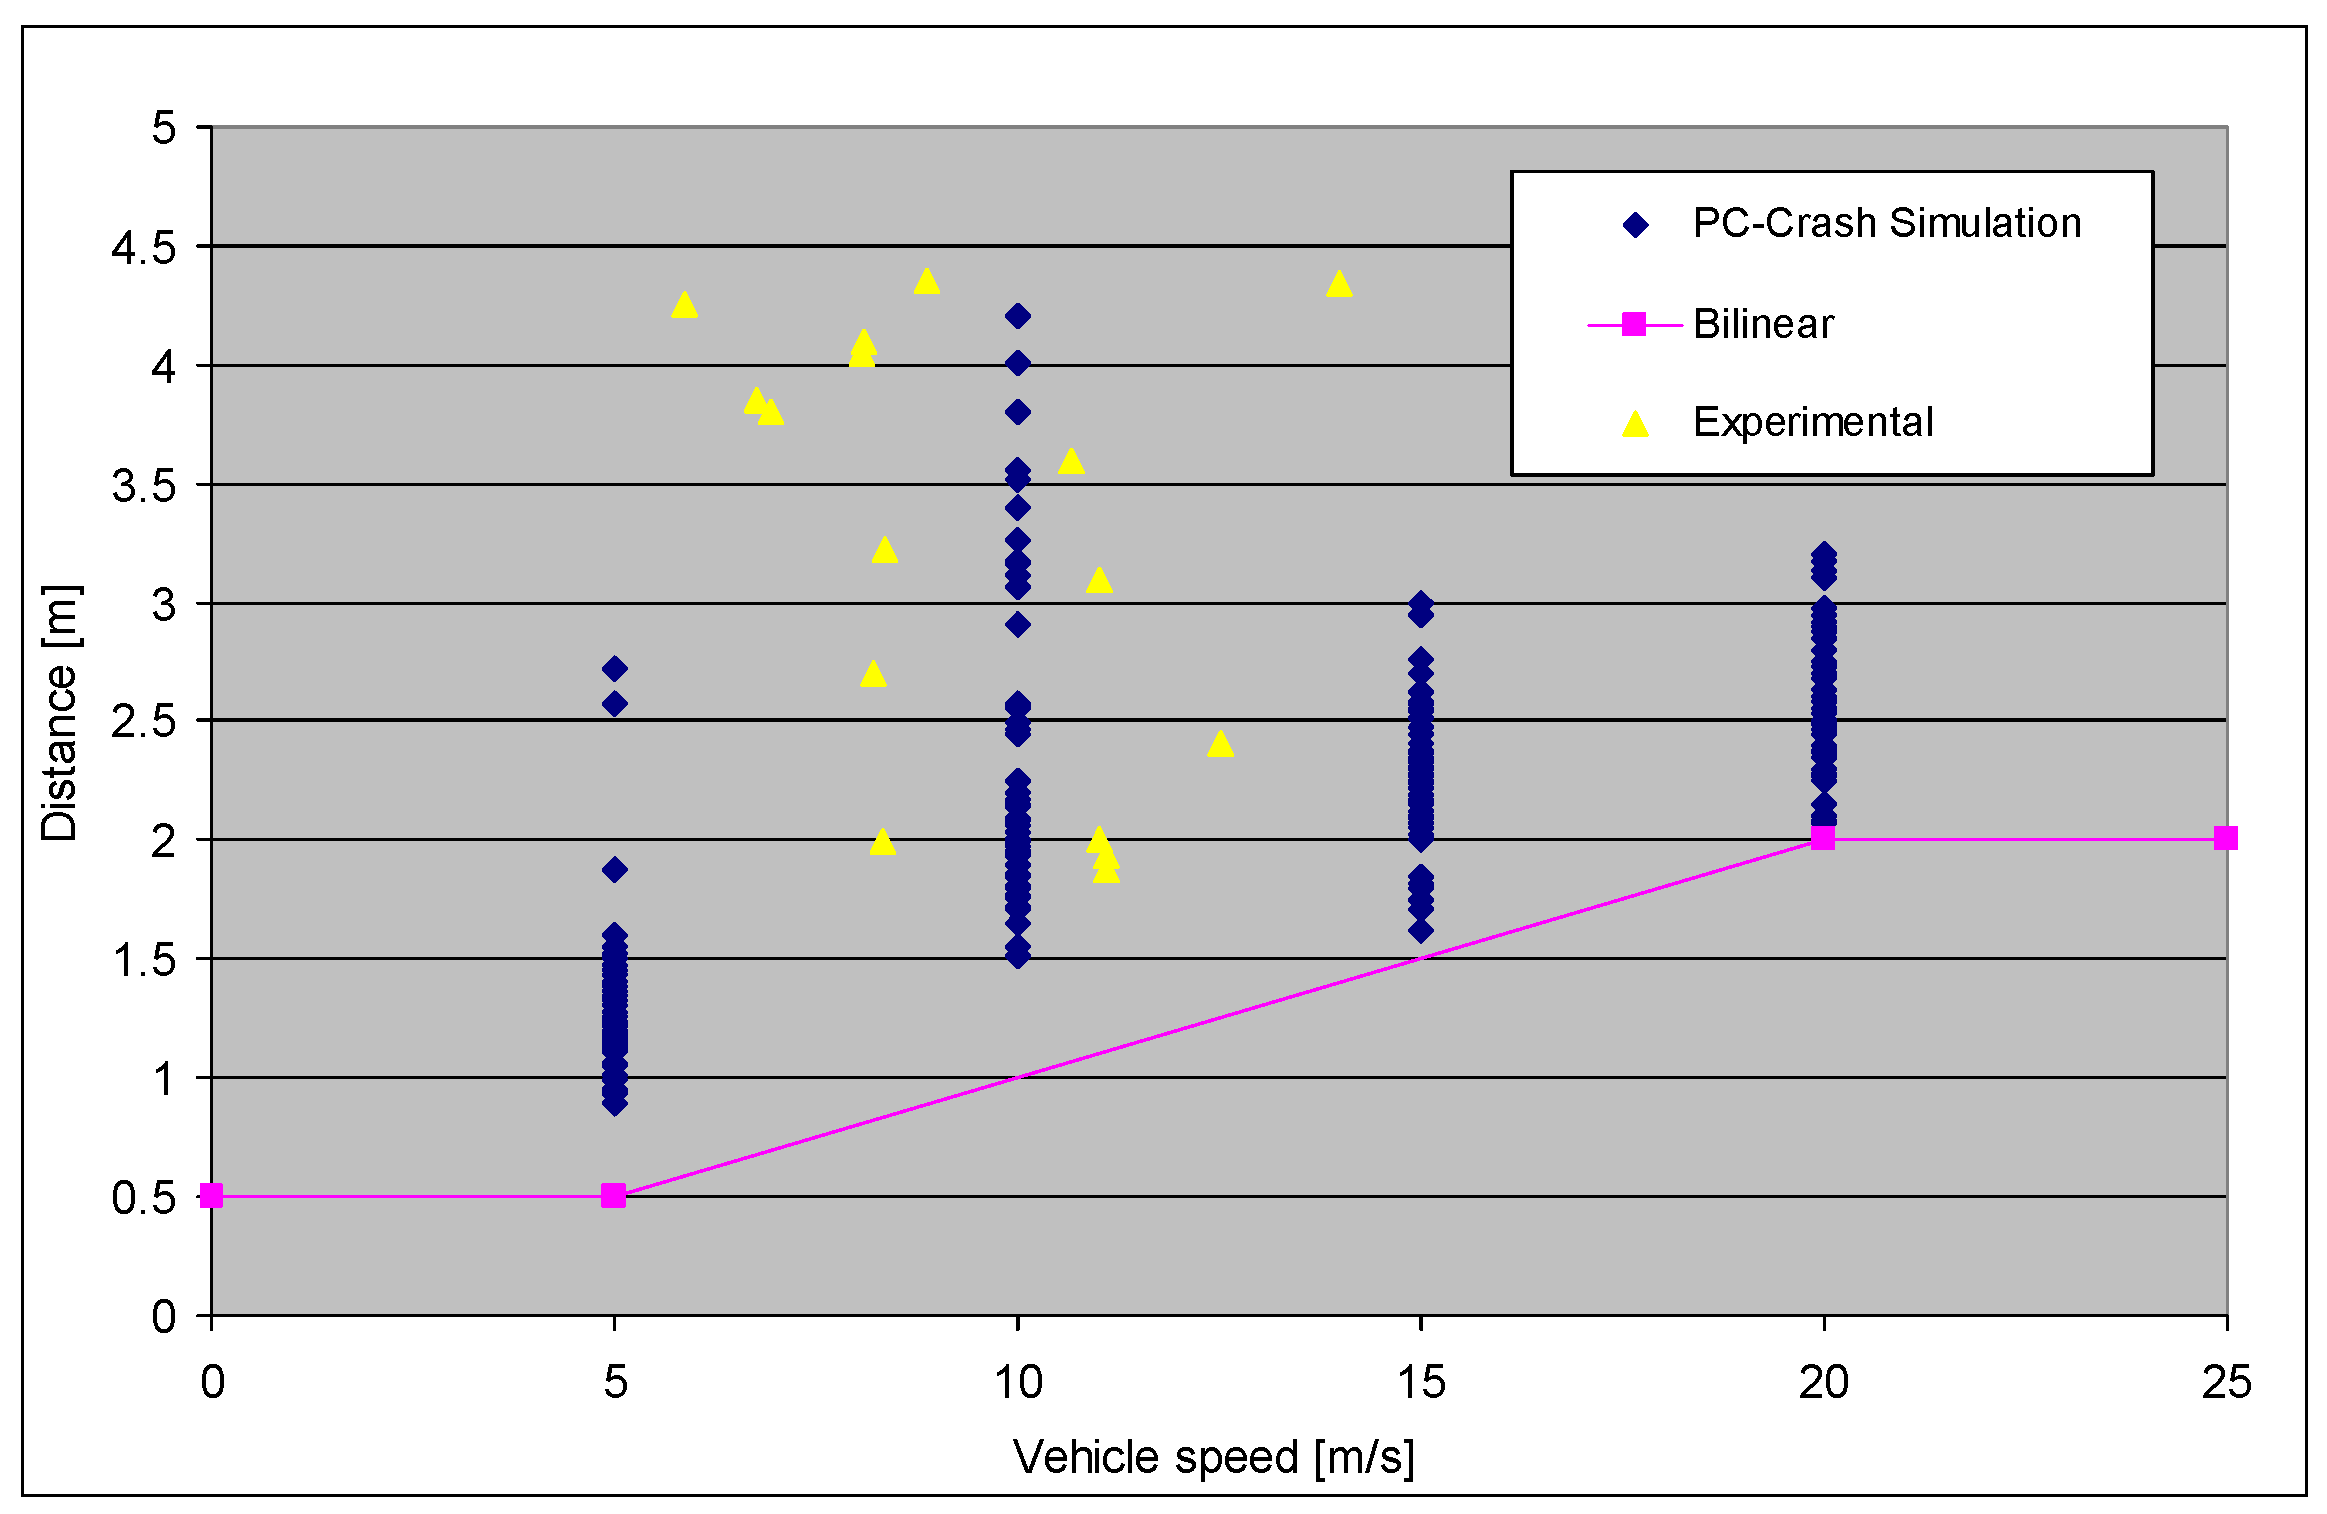
The experimental data confirm the existence of the two sub-phases of the contact between car and pedestrian. Superimposing the distances travelled by pedestrians over the simulation results,
Figure 16, shows a good correlation between them. The large dispersion of the travel distances around the speed of 10 m/s is also evident in the experimental investigations.
The comparison between the bilinear model and the theoretical and experimental results changes some aspects of the distance travelled in the contact phase between cars and pedestrians. Thus the reconstruction of traffic accidents can be made on the basis of new assumptions.
Future research could develop a new mathematical model of the pedestrian's distance in contact with the car.
6. Conclusions
The studies carried out in the field of car-pedestrian accident analysis have highlighted the existence of three phases of the development of the impact. The first phase, of contact with the car, was broken down in more recent studies into two stages as follows: the contact until the pedestrian hits his head or thorax with the vehicle and then the contact until he is detached from the vehicle. In the existing literature, the distance traveled by the car in contact with the pedestrian was approximated by the bilinear law proposed by Han and Brach.
The experimental results and the simulations in the current study have improved the prediction model of the distance traveled by the car in the contact phase with the pedestrian.
The theoretical simulations were made with four classes of vehicles, their frontal profile influencing the results obtained. The impact speed influences directly proportionally the distance traveled by the vehicle in contact with the pedestrian and inversely proportionally the contact times between them.
In the range of speeds 5-10 m/s, the results regarding the distance traveled in the contact phase show the greatest dispersion, both in theoretical simulations and in experimental tests.
Low vehicles, such as coupes, hatchbacks or sedans, tend at high speeds to throw the pedestrian on top of them, SUVs tend to run over the pedestrian at low speeds, having a fairly high ground clearance, therefore the contact varies depending on the shape of the vehicle.
Author Contributions
Conceptualization, A.S. and B.B.; methodology, A.S. and B.B.; software, A.S. and B.B.; validation, A.S. and B.B.; formal analysis, A.S. and B.B.; investigation, A.S. and B.B.; resources, A.S. and B.B; data curation, A.S. and B.B.; writing—original draft preparation, A.S. and B.B.; writing—review and editing, A.S. and B.B.; visualization, A.S. and B.B.; supervision, A.S.; project administration, A.S. All authors have read and agreed to the published version of the manuscript.
Funding
This research received no external funding.
Data Availability Statement
Not applicable.
Conflicts of Interest
The authors declare no conflict of interest.
References
- Collins, J.C.; Moris. J. L. Highway Collision Analysis, Thomas Publishing, 1979.
- Wood, D.; Simms, C. Coefficient Of Friction In Pedestrian Throw. Impact – Journal of ITAI, 2000, vol 9, no 1, pp 12-14.
- Searle, J. A. The physics of throw distance in accident reconstruction. SAE Technical Paper Series, 1993, No. 930659.
- Searle, J. A. and Searle, A. The trajectories of pedestrians, motorcycles, motorcyclists, etc., following a road accident. SAE Technical Paper Series, 1983, No. 831622.
- Kuhnel, A. Der FahrzeugFussgangerUnfall und seine Rekonstruktion. Dissertation, TU-Berlin, 1980.
- Eubanks, J. J., Haight, W. R. Pedestrian Involved Traffic Collision Reconstruction Methodology, 1992, SAE Technical Paper Series, No. 921591.
- Limpert, R. Motor Vehicle Accident Reconstruction and Cause Analysis. 5th Edition. Lexis Publishing, Charlottesville, Virginia, USA, 1999. pp 539-554.
- RavaniB.;Brougham, D., Masson R.T. Pedestrian post impact kinematics and injury pattern. SAE Technical Paper Series, 1981, no. 811024.
- Brooks, D., et.al. A comprehensive review of pedestrian impact reconstruction.SAE Technical Paper Series, 1989, No. 890859.
- Han, I.; Brach, R. M. Throw Model For Frontal Pedestrian Collisions. SAE Technical Paper Series, 2001, 2001-01-0898.
- Batista, M. (2008). A Simple Throw Model For Frontal Vehicle Pedestrian Collisions. Promet-Traffic&Transportation, 2008, Vol. 20, no. 6, pp 357-368.
- Soica, A.; Tarulescu, S., Impact Phase In Frontal Vehicle-Pedestrian Collisions. International Journal of Automotive Technology, 2016, Vol. 17, No. 3, pp. 387−397.
- Shang, S.; Teeling, D.; Masson, C.;Arnoux, P-J.;Py, M.; Ferrand, Q.; Simms, C.K. Pedestrian Head Injuries in Ground Contact: a Cadaver Study, IRCOBI Conference, 2019.
- Moser, A.;Hoschopf, H.; Steffan, H.;Kasanicky, G. Validation of the PC-Crash Pedestrian Model, SAE Transactions, 2000, Vol. 109, Section 6: Journal Of Passenger Cars: Mechanical Systems Journal, pp. 1316-1339.
- Fatzinger, E.; Landerville, J.; Tovar, J.; and Nguyen, B., Validation of a PC-Crash Multibody Sport Bike Motorcycle Model. SAE Int. J. Adv. &Curr. Prac. in Mobility, 2021, 3(4):1682-1914.
- Páez, F-M.; Furones, A.; Sánchez, S. Pedestrian-Vehicle Accidents Reconstruction with PC-Crash®: Sensibility Analysis of Factors Variation, XII Conference on Transport Engineering, CIT 2016, Valencia, Spain, Transportation Research Procedia,18, pp. 115 – 121, 7-9 June 2016.
- Dongjun, K.; JaehoonS. Analysis of Pedestrian Accidents Based on In-vehicle Real Accident Videos.23rd International Technical Conference on the Enhanced Safety of Vehicles (ESV), Seoul , South Korea, 27-30 may 2013, Paper Number 13-0478.
- Han, Y.; Li, Q.; Wang, F.; Wang, B.; Mizuno, K.; Zhou, Q. Analysis of pedestrian kinematics and ground impact in traffic accidents using video records, International Journal of Crashworthiness, 2019, Volume 24, Issue 2.
- Matsui, Y.; Takahashi, K.; Imaizumi, R.; Ando, K. Car-To-Pedestrian Contact Situations In Near-Miss Incidents And Real-World Accidents In Japan. Traffic Injury Prevention, 2013, Vol. 14, pp 58–63.
- Untaroiu, C.D., Meissner, M.U., Crandall, J.R., Takahashi, Y., Okamoto, M., Ito, O. Crash reconstruction of pedestrian accidents using optimization techniques. International Journal of Impact Engineering, 2009, Vol. 36 (2), pp. 210-219.
- Crocetta, G., Piantini, S., Pierini, M., Simms, C. The influence of vehicle front-end design on pedestrian ground impact. Accid. Anal. Prev., 2015, Vol. 79, pp. 56–69.
- Shang, S.; Masson, C.; Llari, M.; Py, M.; Ferrand, Q.; Arnoux, P-J.; Simms, C. The predictive capacity of the MADYMO ellipsoid pedestrian model for pedestrian ground contact kinematics and injury evaluation. Accid. Anal. Prev., 2021,Vol.149, no. 105803.
- Posirisuk, P.; Baker, C.; Ghajari, M. Computational prediction of head-ground impact kinematics in e-scooter falls.Accid. Anal. Prev, 2022, Vol. 167, no. 106567.
- Van Rooij, L.; Bhalla, K; Meissner, M.; Ivarsson, J.; Crandall, J.; Longhitano, D.; Takahashi, Y.; Dokko, Y.; Kikuchi, Y. Pedestrian crash reconstruction using multi-body modeling with geometrically detailed, validated vehicle models and advanced pedestrian injury criteria. Proceedings of the 18th International Technical Conference on the Enhanced Safety of Vehicles (ESV), 2003, Citeseer.
- Deng, et al. Assessment of standing passenger traumatic brain injury caused by ground impact in subway collisions. Accid. Anal. Prev, 2022, Vol. 166, no. 106547.
- Liu, Yu, et al. An intelligent method for accident reconstruction involving car and e-bike coupling automatic simulation and multi-objective optimizations. Accid. Anal. Prev.,2022, Vol. 164, no. 106476.
- Stevenson, T. J. Simulation Of Vehicle-Pedestrian Interaction, A thesis submitted in partial fulfilment of the requirements for the Degree of Doctor of Philosophy in Engineering in the University of Canterbury by T. J. Stevenson University of Canterbury 2006.
- Xiaoyun, Z.; Xinyi, H.; Dongming, Z.; Xiaobo, Y. Research of non-linear frictional contact model in vehicle-pedestrian accidents based on computer simulation. International Journal of Crashworthiness,2020, Vol. 25, Issue 4,pp. 351-359.
- Zou, D.; Fan, Y.; Liu, N.; Zhang, J.; Liu, D.; Liu, Q.; Li, Z.; Wang, J.; Huang, J. Multiobjective optimization algorithm for accurate MADYMO reconstruction of vehicle-pedestrian accidents. Frontiers in Bioengineering and Biotechnology, 2022, Vol. 10.
- Savelberg, H.;Meijer, K. The Effect of Age and Joint Angle on the Proportionality of Extensor and Flexor Strength at the Knee Joint. The journals of gerontology. Series A, Biological sciences and medical sciences, 2004, /12/01, Vol.- 59.
- Mooney, L.;Herr, H. Biomechanical walking mechanisms underlying the metabolic reduction caused by an autonomous exoskeleton.Journal of NeuroEngineering and Rehabilitation, 2016, /01/28, Vol.– 13.
- Sentaro, K; Takanori, I.; Tadamitsu, M.; Toshihiko, H. Three-Dimentional Neck Kinematics During Breakfall ForOsoto-Gari And Its Association With Neck Flexion Strength In Novice Judokas. 35th Conference of the International Society of Biomechanics in Sports, Cologne, Germany, June 14-18, 2017.
- PC-CRASH, A Simulation Program for Vehicle Accidents, Operating and Technical Manual, Version 10.0, November 11, 2013, C Dr. Steffan Datentechnik.
- https://www.youtube.com/watch?v=40DtBcHGWHE, accesed on 3.07.2023.
- https://www.youtube.com/watch?v=YQnAn1rG_xY, accesed on 3.07.2023.
- https://www.youtube.com/watch?v=IN2D7p_kKa4, accesed on 3.07.2023.
Figure 1.
Vehicle-pedestrian contact phase schema.
Figure 1.
Vehicle-pedestrian contact phase schema.
Figure 2.
Vehicle-pedestrian impact, source [
13].
Figure 2.
Vehicle-pedestrian impact, source [
13].
Figure 3.
Pedestrian positions at the time of the impact.
Figure 3.
Pedestrian positions at the time of the impact.
Figure 4.
Example of pedestrian contact forces during impact with car.
Figure 4.
Example of pedestrian contact forces during impact with car.
Figure 5.
Example of collision, compact class vehicle, at (a)-5 m/s, (b)-10 m/s, (c)-15 m/s and (d)-20 m/s, with deceleration 2.5m/s2.
Figure 5.
Example of collision, compact class vehicle, at (a)-5 m/s, (b)-10 m/s, (c)-15 m/s and (d)-20 m/s, with deceleration 2.5m/s2.
Figure 6.
Carry distance for compact class vehicle.
Figure 6.
Carry distance for compact class vehicle.
Figure 7.
Carry distance for CSUV class vehicle.
Figure 7.
Carry distance for CSUV class vehicle.
Figure 8.
Example of collision for CSUV vehicle, at 5 m/s speed.
Figure 8.
Example of collision for CSUV vehicle, at 5 m/s speed.
Figure 9.
Carry distance for SM class vehicle.
Figure 9.
Carry distance for SM class vehicle.
Figure 10.
Impact phases for SM class vehicle.
Figure 10.
Impact phases for SM class vehicle.
Figure 11.
Carry distance for executive class vehicle.
Figure 11.
Carry distance for executive class vehicle.
Figure 12.
Impact phases for executive class vehicle.
Figure 12.
Impact phases for executive class vehicle.
Figure 13.
Pedestrian carrying distance for overall class vehicle.
Figure 13.
Pedestrian carrying distance for overall class vehicle.
Figure 14.
Pedestrian carrying distance as a function of braking deceleration.
Figure 14.
Pedestrian carrying distance as a function of braking deceleration.
Figure 15.
Examples of impact with dummies (a,b) and real accidents (c).
Figure 15.
Examples of impact with dummies (a,b) and real accidents (c).
Figure 16.
Comparison between carry distance from simulation, experimental tests and bilinear model.
Figure 16.
Comparison between carry distance from simulation, experimental tests and bilinear model.
Table 1.
Pedestrian characteristics data.
Table 1.
Pedestrian characteristics data.
| Pedestrian male adult |
Age
Mass
|
18 years
75 kg
|
| Height |
1.75 m |
| No of body elements |
20 |
| Friction coeff with car |
0.20 |
| Friction coeff with ground |
0.60 |
Table 2.
Simulation diagram.
Table 2.
Simulation diagram.
| Nr crt |
Vehicle type |
No of vehicles studied |
Vehicle Initial speed |
Vehicle deceleration |
Pedestrian type |
Pedestrian stance |
Pedestrian initial speed |
| 1 |
CC |
4 |
5 |
0, 2.5, 5, 7.5 |
MBD |
P1, P2 |
1.4 |
| 4 |
10 |
0, 2.5, 5, 7.5 |
MBD |
P1, P2 |
1.4 |
| 4 |
15 |
0, 2.5, 5, 7.5 |
MBD |
P1, P2 |
1.4 |
| 4 |
20 |
0, 2.5, 5, 7.5 |
MBD |
P1, P2 |
1.4 |
| 2 |
SMC |
2 |
5 |
0, 2.5, 5, 7.5 |
MBD |
P1, P2 |
1.4 |
| 2 |
10 |
0, 2.5, 5, 7.5 |
MBD |
P1, P2 |
1.4 |
| 2 |
15 |
0, 2.5, 5, 7.5 |
MBD |
P1, P2 |
1.4 |
| 2 |
20 |
0, 2.5, 5, 7.5 |
MBD |
P1, P2 |
1.4 |
| 3 |
CSUV |
2 |
5 |
0, 2.5, 5, 7.5 |
MBD |
P1, P2 |
1.4 |
| 2 |
10 |
0, 2.5, 5, 7.5 |
MBD |
P1, P2 |
1.4 |
| 2 |
15 |
0, 2.5, 5, 7.5 |
MBD |
P1, P2 |
1.4 |
| 2 |
20 |
0, 2.5, 5, 7.5 |
MBD |
P1, P2 |
1.4 |
| 4 |
EC |
2 |
5 |
0, 2.5, 5, 7.5 |
MBD |
P1, P2 |
1.4 |
| 2 |
10 |
0, 2.5, 5, 7.5 |
MBD |
P1, P2 |
1.4 |
| 2 |
15 |
0, 2.5, 5, 7.5 |
MBD |
P1, P2 |
1.4 |
| 2 |
20 |
0, 2.5, 5, 7.5 |
MBD |
P1, P2 |
1.4 |
Table 3.
Contact distance by different class vehicle.
Table 3.
Contact distance by different class vehicle.
| Vehicle Class |
Dveh min |
Dveh max |
Ratio Dmax/Dmin |
| CC |
1.11 |
4.01 |
3.61 |
| CSUV |
0.89 |
2.6 |
2.92 |
| EC |
1.20 |
2.5 |
2.08 |
| SM |
1.13 |
4.2 |
3.71 |
|
Disclaimer/Publisher’s Note: The statements, opinions and data contained in all publications are solely those of the individual author(s) and contributor(s) and not of MDPI and/or the editor(s). MDPI and/or the editor(s) disclaim responsibility for any injury to people or property resulting from any ideas, methods, instructions or products referred to in the content. |
© 2023 by the authors. Licensee MDPI, Basel, Switzerland. This article is an open access article distributed under the terms and conditions of the Creative Commons Attribution (CC BY) license (http://creativecommons.org/licenses/by/4.0/).
