Preprint
Article

Forecasting costs and risk of corn and soybean crops through Monte Carlo simulation

Altmetrics

Downloads

209

Views

79

Comments

0

A peer-reviewed article of this preprint also exists.

Submitted:

07 July 2023

Posted:

13 July 2023

You are already at the latest version

Alerts
Abstract
In Brazil, the production of corn and soybeans has been growing significantly in recent years. Considering that the strategies for investing in the production of these crops are conditioned by production costs and risk, the objective of this article is to propose a simulation model that indicates the trend of production costs for these commodities, considering the dispersion and correlation of selected key variable prices and corn and soybean production costs practiced between the years of 2018 and 2022. Fifty specialized companies in the state of Sao Paulo, Brazil, provided data for this study, and Monte Carlo simulations showed that the total cost of corn production/ha is between USD 600.00 and USD 1150.00, with a level of certainty of 84.7%, and soybeans are in the range of USD 260.00 to USD 420.00, with a level of certainty of 86.4%. The model evidenced a trend of decreasing production costs for the crops for the 2023/24 and 2024/25 harvests, as the input with the greatest impact (fertilizer) is showing a downward trend. On the other hand, costs related to labor, soybean seed, and fungicides are showing an upward trend, while dolomitic limestone corrective remains stable.
Keywords: 
Subject: Business, Economics and Management  -   Business and Management

1. Introduction

Corn and soybeans stand out among the main commodities of agribusiness. In Brazil, over the last decade, these products have been the primary agricultural items produced and exported, contributing to the trade surplus with export revenues exceed-ing $53.889 billion in 2021 [1]. The competitiveness of exports for these crops is directly affected by long-term changes and adjustments in production costs, transportation, handling, as well as export policies and fluctuations in exchange rates [2, 3].
In early 2022, for instance, the prices of corn and soybeans were elevated due to strong global demand [3], rising fertilizer costs [4, 5], and the drought in South Ameri-ca caused by the La Niña phenomenon. Another impactful factor for the sector was the war in Ukraine, which contributed to the increase in production costs for all commodities [5].
According to current projections, it is likely that the high prices of soybeans and corn will continue during the marketing period of the 2022/2023 crops [6]. Given this scenario, analyses, comparisons, and forecasts of production costs in agribusiness have been utilized as tools for decision-makers [7-9]. Pitrova et al. (2020) [10] and Amorim et al. (2020) [11] mentioned that computational simulation has proven to be an appropriate support tool for decision-making on rural properties. Meade et al. (2016) [2] re-ported that such factors include logistics, land, and storage, while Oliveira et al. (2022) [5] include fertilizers, seeds, fuel, pesticides, among others. In this regard, information about the relationship of these variables is essential to maintain and/or improve the agricultural performance of the sector, providing projections for short, medium, and long-term decision-making [5, 11].
The literature contains a substantial number of studies conducted in different countries focused on the production costs of corn and soybeans [2, 12-21], economic feasibility analyses using risk analysis through case studies [22-28], and analysis of soybean and corn prices [29, 30]. However, there is a gap in showcasing the impact of costs and their trend for the near future (24 months) for both crops, with recent data and a significant number of data/variables.
Therefore, it is important to identify the inputs that significantly influence the price and cost variation in the production of corn and soybeans. Do input prices show the same degree of correlation with production costs for both crops? By understanding the key inputs and their degree of influence on production costs for corn and soybeans, what could be the outlook for production costs in the 2024/25 and 2025/26 crops for these commodities?
To answer these questions, the present study focused on the state of São Paulo due to the significant presence of both crops in the region. Its objective was to propose a model that evaluates the dispersion, correlation, prices, and production costs of corn and soybeans, and how these factors impact cost predictions for these crops' harvests.
In this regard, the advancement of simulation applications in agribusiness has shown that models based on intelligent systems can be highly suitable for a wide range of applications in various fields. Unlike equations structured in linear, quadratic, or other predetermined formats, these models offer significantly greater adaptability to response data. They surpass the limitations of traditional statistical models, for in-stance. Using the Monte Carlo Simulation (MCS) model, the study aimed to explore various possible scenarios of production costs for these commodities, considering un-certainty and variability in the prices of selected key variables. By integrating the cost trend analysis with MCS, it was possible to understand and predict how fluctuations in input and labor markets influence the final production cost of corn and soybeans.
This model assists farmers in decision-making by enabling better financial planning and strategic decision-making. For example, it helps determine which crop to plant and facilitates negotiations and contracts involving the purchase of inputs and labor. It reduces the risk of financial losses and allows the adoption of strategies that maintain high competitiveness in the production and export of these crops in the country. This, in turn, boosts the Brazilian trade balance and strengthens its position in the global market for exporting these commodities.

2. Materials and Methods

2.1. Data Collection

The sampling consisted of 50 establishments in the state of São Paulo, and data collection was conducted through the monthly administration of a questionnaire from January 1, 2018, to December 30, 2022 (n=60). The obtained data (prices in USD) for diesel fuel, Trifloxystrobin Tebuconazole fungicide, Glyphosate herbicide, Thiamethoxam Lambda-Cyhalothrin insecticide, Dolomitic limestone corrective, NPK 05-25-25 fertilizer, Potassium chloride fertilizer, USD exchange rate, Soybean price per sack, Corn price per sack, Soybean seed, Corn seed, Tractor operator labor, Daily labor, and Urea fertilizer were tabulated and used for the analyses described below.

2.2. Descriptive Analysis

The descriptive analysis was conducted to elucidate the variability in the behavior of the prices (in USD) of the studied variables, to deepen the discussions on the factors that influence the fluctuations in their prices in the market. The elements included in the descriptive analysis were: sample size, minimum value, maximum value, arithmetic mean, total range, variance, standard deviation, coefficient of variation (low < 10%, medium between 10 and 20%, high between 20 and 30%, and very high > 30%), skew-ness (symmetric variation=0; >0 positive <0 negative), and kurtosis (leptokurtic: K < 0.263; mesokurtic: K = 0.263; and platykurtic: K > 0.263).

2.3. Pearson Correlation Coefficient (r) and Coefficient of Determination (R2)

The Pearson correlation coefficient (r) was used to measure the existence and degree of correlation between the price (in USD) of corn or soybean per sack (independent variable) and the price (in USD) of the other dependent variables used in this study, collected monthly.
The result of this analysis is presented as a dimensionless index, with values ranging from -1.0 to 1.0, reflecting the strength of a linear relationship between two sets of data. If the value of r is equal to 1, there is a perfect positive correlation between the two. If the value of r is equal to -1, there is a perfect negative correlation [31,32]. The Pearson correlation coefficient (r) is defined by Equation 1:
r = i = 1 n x i x ( y i y ) i = 1 n x i x 2 i = 1 n y i y 2
where x i e y i are the values of x and y, respectively, for the i-th individual.
The coefficient of determination (R2) is the square of the Pearson correlation coefficient and is a measure of the quality of the model fit. It describes the proportion of variability in one variable that is explained by the variability in the other variable. The value of R2 can range from 0 to 1, and since it is difficult to find a perfect correlation in practice, higher values are associated with lower error variance. In this study, R2 values ≥ 0.7 were considered to indicate a strong correlation in the interpretation of the correlation data [32].

2.4. Cost Analysis

The costs per sack of corn and soybean were calculated using Equations 2 and 3. The monetary value was converted to dollars using the exchange rate of US$ 5.25.
A T P C ( h a ) = T P C ( h a ) / A P R O D ( h a )
T P C S = T P C ( h a ) / A P R O D ( h a ) A P R I C E
where: ATPC: Average Total Production Cost (ha) corn or soybean; TPC: total production cost (ha) corn or soybean; APROD: average productivity (ha) corn or soy-bean; ATPCS Average Total Production Cost per sack of corn or soybean; APRICE Av-erage price per sack of corn or soybean.

2.5. Monte Carlo Simulation

The main production costs per sack of soybean and corn were investigated in relation to all the variables through cumulative frequency analysis using the Crystall Ball® software [33].
To analyze the probability level of cost variation and gross net revenue, Monte Carlo simulation (MCS) was used to provide projections through a stochastic approach [5, 24-25, 34].
A MSC is a numerical method that uses random numbers to solve mathematical problems for which an analytical solution is not yet known. The input variables that support the simulation are referred to as "Assumptions" by Crystal Ball [34]. [34].
In this way, possible numbers for the variable of interest are simulated, and then the average result of the process is obtained using Equation 4:
a m = 1 r i = 1 n x i
where: a_m is the average result of the MCS for the variable of interest, a, x represents the individual result of each simulated iteration, and n is the number of simulations (iterations).
In the present article, 50,000 iterations were performed, which is the maximum number of iterations provided by the software and is a significant number for the problem of interest. Similar values were used in the studies by Oliveira et al. (2022) and Silva et al. (2019) [5, 34].
To forecast future events, the methodology employed the Predictor tool, a stochastic simulation tool available in the software. It is used to make predictions based on time series data by analyzing historical data to identify trends and seasonal patterns. These insights are then projected into the future to forecast the most probable out-comes.
The scenarios were forecasted using the software itself for a period of 24 months, based on the data captured from 2018 to 2022. The results revealed the expected costs considering the previously described conditions. The MCS utilized quantitative methods based on time series to conduct the forecast [33]:
Simple Exponential Smoothing (Equation 5): This method weighs all the data with exponentially decreasing weights towards the past, extrapolating the limitations of moving averages.
P t + 1 = α R t + 1 α P t
ARIMA (Equation 6): It is a method superior to smoothing methods when applied over long periods, capable of capturing autocorrelations in the data and suitable for databases with trends and seasonal patterns.
R t = ϕ 1 R t 1 + ϕ 2 R t 2 + . . . + ϕ p R t p + a t θ 1 a t 1 + θ 2 a t 2 + . . . + θ q R t q
Damped Trend Non-Seasonal (Equation 7): Applies exponential smoothing twice, like double exponential smoothing. However, the trend component curve is damped (flattens over time) instead of being linear. This method is best for data with a trend but no seasonality.
T t = b ( L t L t 1 ) + ( 1 b ) ϕ T t 1
Double Moving Average (Equation 8): Applies the moving average technique twice, once to the original data and then to the resulting single moving average data. This method then uses both sets of smoothed data to project forward. This method is best for historical data with a trend but no seasonality. It results in a straight, sloped-line forecast.
F t + m = a t + b t m
Double Exponential Smoothing (Equation 9): Applies SES twice, once to the original data and then to the resulting SES data. Predictive Planning uses Holt’s method for double exponential smoothing, which can use a different parameter for the second ap-plication of the SES equation. This method is best for data with a trend but no seasonality. It results in a straight, sloped-line forecast.
T t = b ( L t L t 1 ) + ( 1 b ) T t 1

3. Analysis of Results

This section may be divided by subheadings. It should provide a concise and precise description of the experimental results, their interpretation, as well as the experimental conclusions that can be drawn.

3.1. Characterization of Crops in the Study Area

The cultivation of corn in São Paulo plays an important role in the state's economy. In 2022, the estimated corn production in São Paulo was 4.8 million tons [35]. The contribution of corn cultivation to the state's agriculture increased from 3.9% in 2017 to 6.1% in 2021 [36], and Brazilian exports experienced significant growth, leading to important changes in the domestic market. In 2021, the state of São Paulo contributed to the international shipment of 52,400 tons [35].
The cultivation of soybeans in the state of São Paulo is relatively more recent and has experienced significant growth since the 1990s. The planted area of soybeans in the state increased from approximately 580,000 hectares in the 2001/2002 crop season to 1,263.6 thousand hectares in the 2021/2022 period [37]. Soybeans now represent the second-largest crop in the state's agriculture, accounting for 12.1% of the total cultivated area, second only to sugarcane, which remains the primary crop with a share of 48.3% [36]. In 2021, São Paulo exported approximately 1.3 million tons of soybeans, with a value of around 630 million dollars. The main destinations for these exports were China, Iran, Thailand, and Spain [37].

3.2. Descriptive Analysis

The result of the descriptive analysis (Table 1) revealed a significant variability in the total range of all the variables chosen for this study.
This fact can be explained by the increase in prices of inputs used in the production of corn and soybeans from 2018 to 2022. The 59% appreciation of the dollar is related to the rise in prices of fertilizers, soil amendments, and agricultural pesticides during the studied period [38-42], as the dollar is the currency used in international transactions, including the trade of agricultural inputs that need to be imported by farmers.
In addition to these factors, uncertainties caused by the Covid-19 pandemic have led to imbalances between supply and demand of inputs in the global market, which have influenced significant fluctuations in prices of fertilizers, herbicides, fuel, and other inputs analyzed in this study [43]. The uncertainties stemming from the pandemic have affected all sectors of the agribusiness, from production to distribution and marketing, resulting in negative economic impacts across all segments, particularly in input costs [4, 44].
In contrast, the increase in the value of the dollar can also stimulate the exports of corn and soybeans, thereby reducing the domestic supply and further raising prices [45]. Given this scenario, it is crucial for the agricultural sector to be attentive to ex-change rate fluctuations and seek alternatives to mitigate the impact of the rising dol-lar on production costs.
The lowest variances and standard deviations were found for the collected prices of diesel fuel, dollar exchange rate, soybean seed, and corn seed. This indicates that the values of these inputs and the exchange rate did not deviate significantly from the mean during the study period.
The coefficient of variation results indicated that the prices of the following variables: diesel fuel, glyphosate herbicide, dolomitic limestone corrective, NPK 05-25-25 fertilizer, corn bushel, soybean bushel, soybean seed, potassium chloride fertilizer, and urea fertilizer exhibited a high dispersion. On the other hand, the prices of tiamethoxam lambda-cyhalothrin insecticide, dollar exchange rate, corn seed, and casual labor had a moderate dispersion, while the prices of trifloxystrobin tebuconazole fungicide and tractor operator labor were classified as having low dispersion.
The highest coefficient of variation was found for the glyphosate herbicide. The literature suggests that in addition to the external factors, internal factors such as market demand, production costs, distribution, and sales of each company, as well as government intervention (such as taxation on imported products), influence the costs and consequently the price formation of this herbicide [46].
The lowest coefficient of variation was found in the price of the variable "tractor operator labor." Although it showed low dispersion over the study period, expenses related to tractor operators' salary payments have shown great relevance in the total production costs of corn and soybeans [47-48].
No variable exhibited symmetry in the analyzed prices during the period from 2018 to 2022. Positive skewness distributions were found for: diesel oil, fungicide tri-floxystrobin tebuconazole, herbicide glyphosate, insecticide thiamethoxam lambda-cyhalothrin, dolomitic limestone corrective, fertilizer NPK 05-25-25, soybean bag price, corn bag price, soybean seed, tractor operator labor, daily laborer labor, potassium chloride fertilizer, and urea fertilizer. This means that the prices of these inputs remained above the average for a significant part of the analyzed period, which can be explained by the factors discussed earlier. The US dollar and corn seed were the only variables in which prices exhibited negative skewness distributions, meaning that they remained below the average for a significant part of the analyzed period. Despite reaching high values at times, the dollar remained below the average in recent years due to a combination of factors, including a decline in the performance of the US economy, which has not remained as strong due to global instabilities and political tensions [49]. Regarding corn seed, the study conducted by Seidler et al. (2022) [50] suggests that in addition to the exchange rate, the prices of this commodity in São Paulo are influenced by the prices in Sorriso - MT and in Paraguay, as they are the main national production areas and the origin of most of the corn imported by Brazil.
For the analysis of kurtosis, it was evident that the prices of corn seed exhibited a platykurtic distribution, meaning that the values were more concentrated around the mean. The price of corn seed in São Paulo increased by 120% from 2018 (USD 1,827.1) to 2022 (USD 4,028.54) [51]. This significant variability can be explained by changes in the commodities market and currency fluctuations that affect corn costs [52-54]
Regarding the price of the herbicide glyphosate and the price of diesel fuel, the mesokurtic distribution found for these inputs (moderate concentration of values around the mean) may be related to economic and environmental factors related to production, supply, and demand of these products [46, 55]. The remaining variables exhibited a leptokurtic distribution (relatively low concentration of values around the mean). The leptokurtic distribution in the prices of the agricultural inputs studied may have been influenced by the pandemic [24, 43], variations in agricultural productivity [39], supply and demand [40], and the price of the dollar [38, 41-42].
Understanding the factors that influence the costs of inputs to produce corn and soybeans, as well as the behavior of price variability, is crucial for producers to make informed decisions and better plan their crops. By doing so, it becomes possible to ensure the sustainability of agricultural production and maintain competitive-ness in the global market.

3.3. Financial Analysis of Corn and Soybeans

The data related to prices, dosage of inputs used in soybean and corn cultivation, production costs, the percentage that each variable represents, and net profit were collected (Table 2). The variables that had the highest percentage of contribution to the total production cost of these crops were NPK 05-25-25 fertilizer (45.9% in corn production and 56.5% in soybean production), soybean seeds (15.7% in soybean production), corn seeds (10.5% in corn production), potassium chloride fertilizer (9.6% in corn pro-duction), and urea (9.2% in soybean production).
The levels of certainty regarding the average production cost per hectare of corn associated with the analyzed variables were calculated using MCS and are presented in the cumulative frequency graph (Figure 1).
The simulation results presented in Figure 1 show that the range between USD 260.00 and USD 420.00 contains the average production costs of soybean per hectare paid in the state of São Paulo, with a level of certainty of 86.4% for an average of USD 340.20 and a standard deviation of USD 53.55, considering the period from 2018 to 2022.
These results provide information based on the analyzed historical prices. Thus, the analysis conducted can help minimize uncertainties regarding soybean production costs for the state and assist in making informed decisions regarding input purchases through this forecast.
The values obtained in this study are supported by the data collected by Conab (2022) [58] for the state of São Paulo, specifically the city of Assis, one of the main corn-producing municipalities in the state. The values provided by Conab are in Brazilian Reais and have been converted to US Dollars using the average commercial ex-change rate (R$/USD) for each year. The data used in this analysis were obtained from IPEAdata, available from the authors upon request). For comparison purposes, the average calculation was performed considering only the costs of operating expenses, excluding other costs such as storage, charges, among others. The average production cost of soybeans was found to be USD 417.77 during the period from 2019 to 2021.
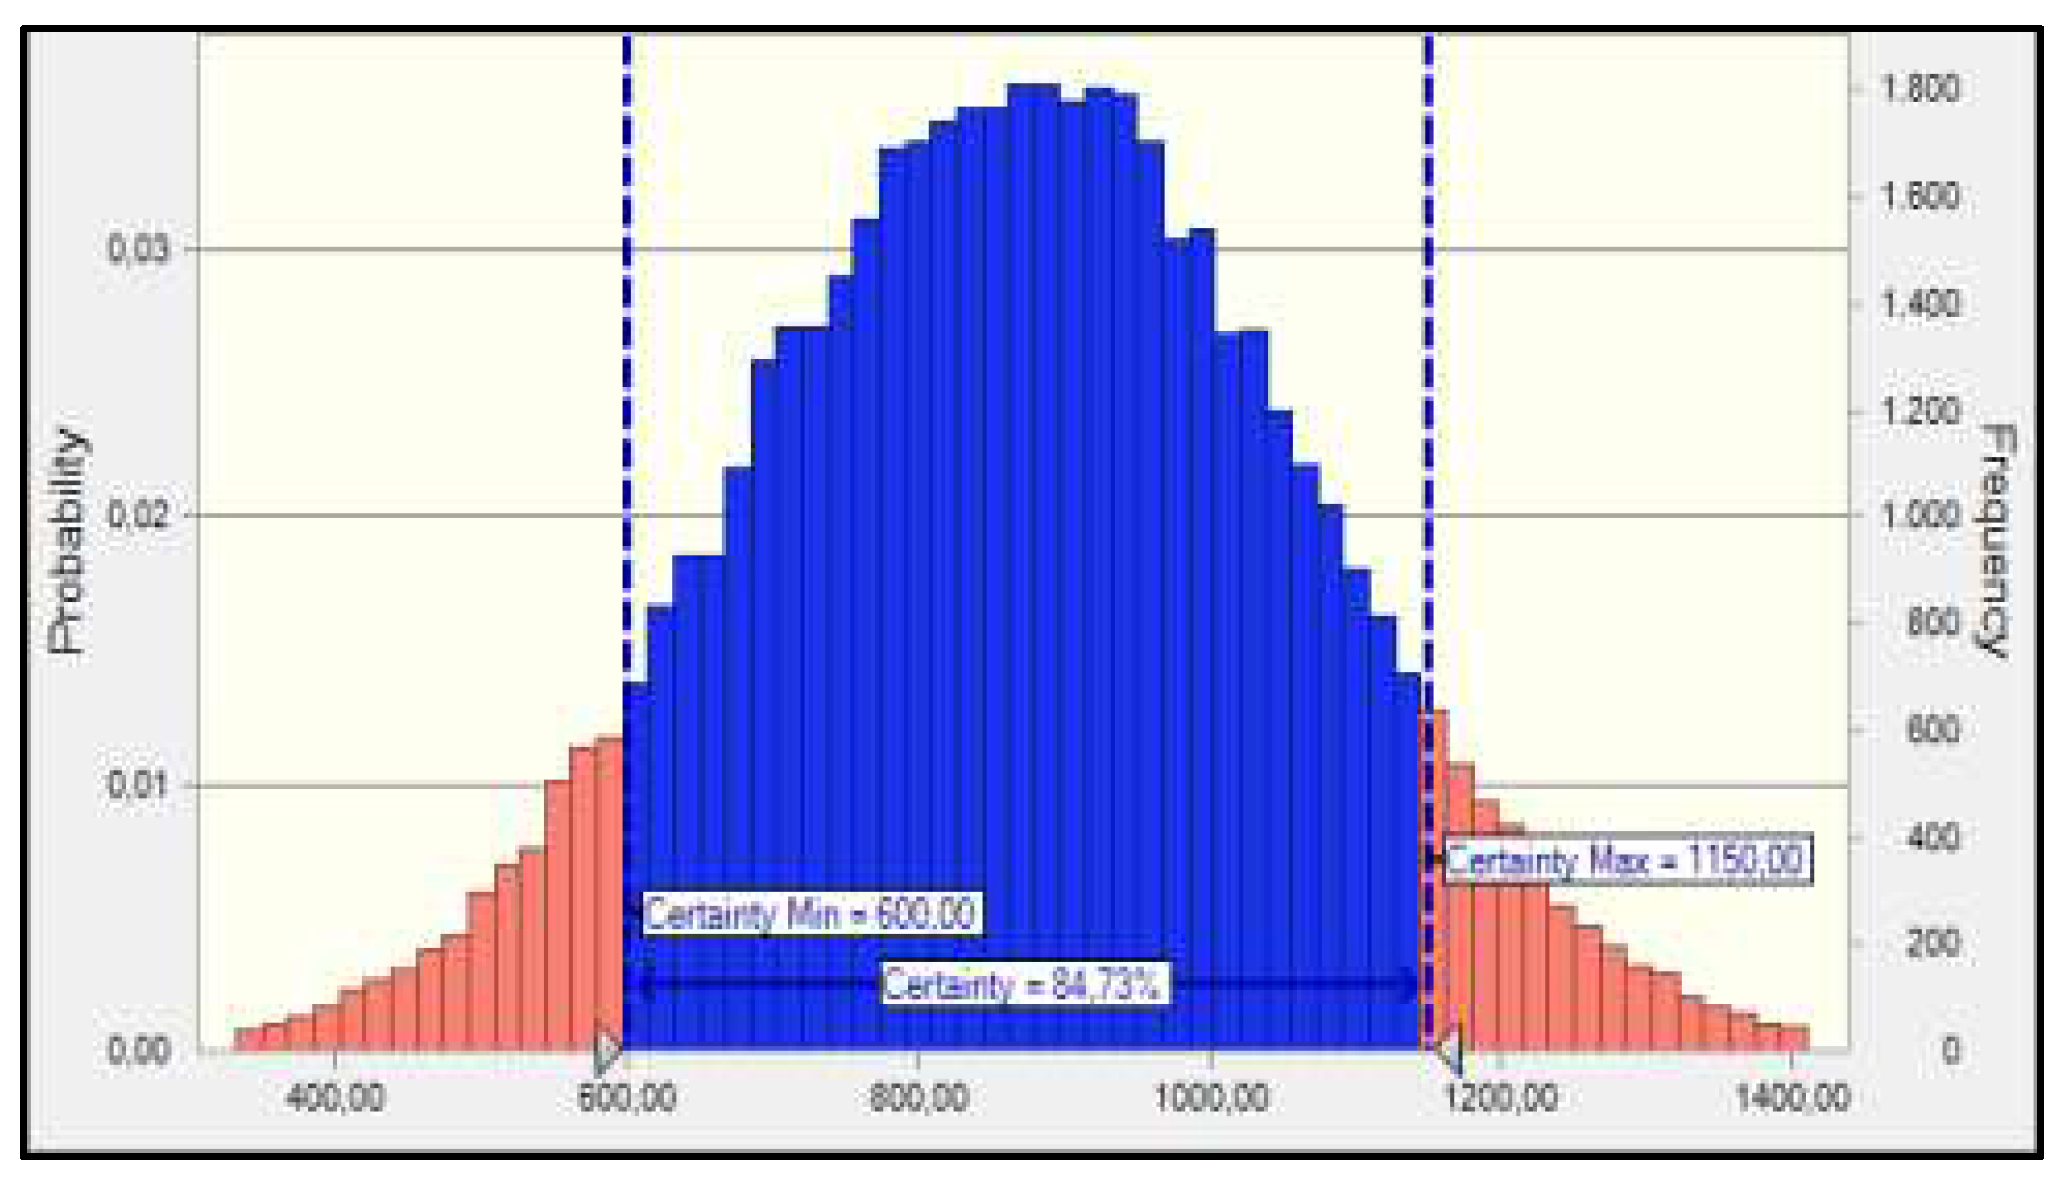
The levels of certainty of the average production cost per hectare of corn associated with the analyzed variables were calculated using SMC and are presented in the cumulative frequency graph (Figure 2).
The simulation results show that the range between USD600.00 and USD1150.00 contains the average production costs of corn per hectare in the state of São Paulo, with a level of certainty of 84.7% for an average of USD870.80 and a standard deviation of USD192.40, considering the period from 2018 to 2022.
The monitoring data from Conab (2022) [59] regarding the production costs of the second corn crop for the years 2019 and 2020 show an average production cost of USD421.26, represented by the city of Assis. On the other hand, Ventura et al. (2020) [20] indicate costs in other productive states in Brazil that corroborate with the results, ranging from USD613.00 to USD653.00 in the 2018/19 and 2019/20 crops (using trans-genic seeds).
The authors of this study observed that the production costs in each municipality/state were influenced by differences in productivity. Areas with higher productivity had lower production costs compared to smaller areas [19]. In addition to productivity, other factors contribute to the observed differences in corn production costs in different regions, such as climate [60], prices of inputs [61], and employed technology [62-63].
Considering the variables in this study, the most significant production costs for corn and soybeans (fertilizers and soil amendments) account for 68.7% and 61.5% respectively. Equally important, the costs of agricultural inputs (herbicides, insecticides, and fungicides) amount to 15% and 18.4% for both crops.
An alternative to reduce these costs would be the use of Variable Rate Technology (VRT) (application of soil amendments and fertilizers according to each point analyzed by grid or management zone) [11]. Supporting the above statement, Baio et al. (2018) [64] reported that this technique is employed in precision agriculture for the application of inputs and agricultural pesticides, which allows for the rationalization of these products. The authors affirmed that the use of VRT system proved to be advantageous in agricultural production.
Another hypothesis to reduce consumption and, consequently, the cost of chemical fertilizers in Brazil would be the use of organ mineral fertilizers (combinations of organic sources). Corroborating this, Freitas et al. (2021) [65] stated that this type of fertilizer emerges as an alternative for nutrient supply in corn cultivation and contributes to a reduced dependence on imported mineral fertilizers, in addition to being proven to increase productivity.
Reinforcing the statement, a case study in soybean cultivation in Brazil demonstrated that organ mineral fertilizers proved to be effective, achieving a productivity of 3,648.96 kg/ha, and could be an alternative to traditional mineral fertilization [66]. In general, international evidence of the efficacy of using organ mineral fertilizers in agricultural production is emphasized by Marchuk et al. (2023) [67] and Smith et al. (2020) [68].
Another hypothesis to reduce the total cost regarding the use of agricultural pesticides, which has shown significant growth, is the use of biological products. Van Lenteren et al. (2018) [69] reported that the use of biological control is growing at a rate of 10% to 20% per year worldwide. Spark (2021) [70] stated that the use of biological products in Brazil covered approximately 33 million hectares, with the largest areas being soybean (20 million ha) followed by corn (9.8 million ha).
To conclude, the gross revenue of corn is 9.1% lower than that of soybeans. This is due to several factors, such as the higher production cost per hectare for corn (18.8%) compared to soybeans, and a 7.6% lower price per 60kg sack, as mentioned above. However, the average prices (paid to farmers during the studied period) for corn at USD11.3 and soybeans at USD22.6 are close to the price levels of September 2020, indicating stability in prices.

3.4. Pearson Correlation Coefficient (r) and Coefficient of Determination (R2)

The degree of correlation between the selected dependent variables for this study (diesel fuel, fungicide Trifloxystrobin Tebuconazole, herbicide Glyphosate, insecticide Thiamethoxam Lambda-Cyhalothrin, Dolomitic Limestone amendment, NPK 05-25-25 fertilizer, exchange rate, soybean seed, corn seed, tractor operator labor, daily laborer labor, Potassium Chloride fertilizer, Urea fertilizer) and the independent variable (corn or soybean production) is presented in Table 3.
The results show the weight of the cost item in the cost structure of production. In this regard, the dependent variables: diarist, Glyphosate, and Trifloxystrobin Tebucon-azole do not have the same degree of correlation among the dependent variables. However, the remaining variables have the same degree of correlation among the de-pendent variables.
The highlighted variables show a correlation coefficient ≥ 0.70 (strong). The variables that showed strong correlation and R2 ≥ 0.70 for both crops were selected for future forecasting analysis (24 months) using SMC (predictor).

3.5. Monte Carlo Simulation – Predictor

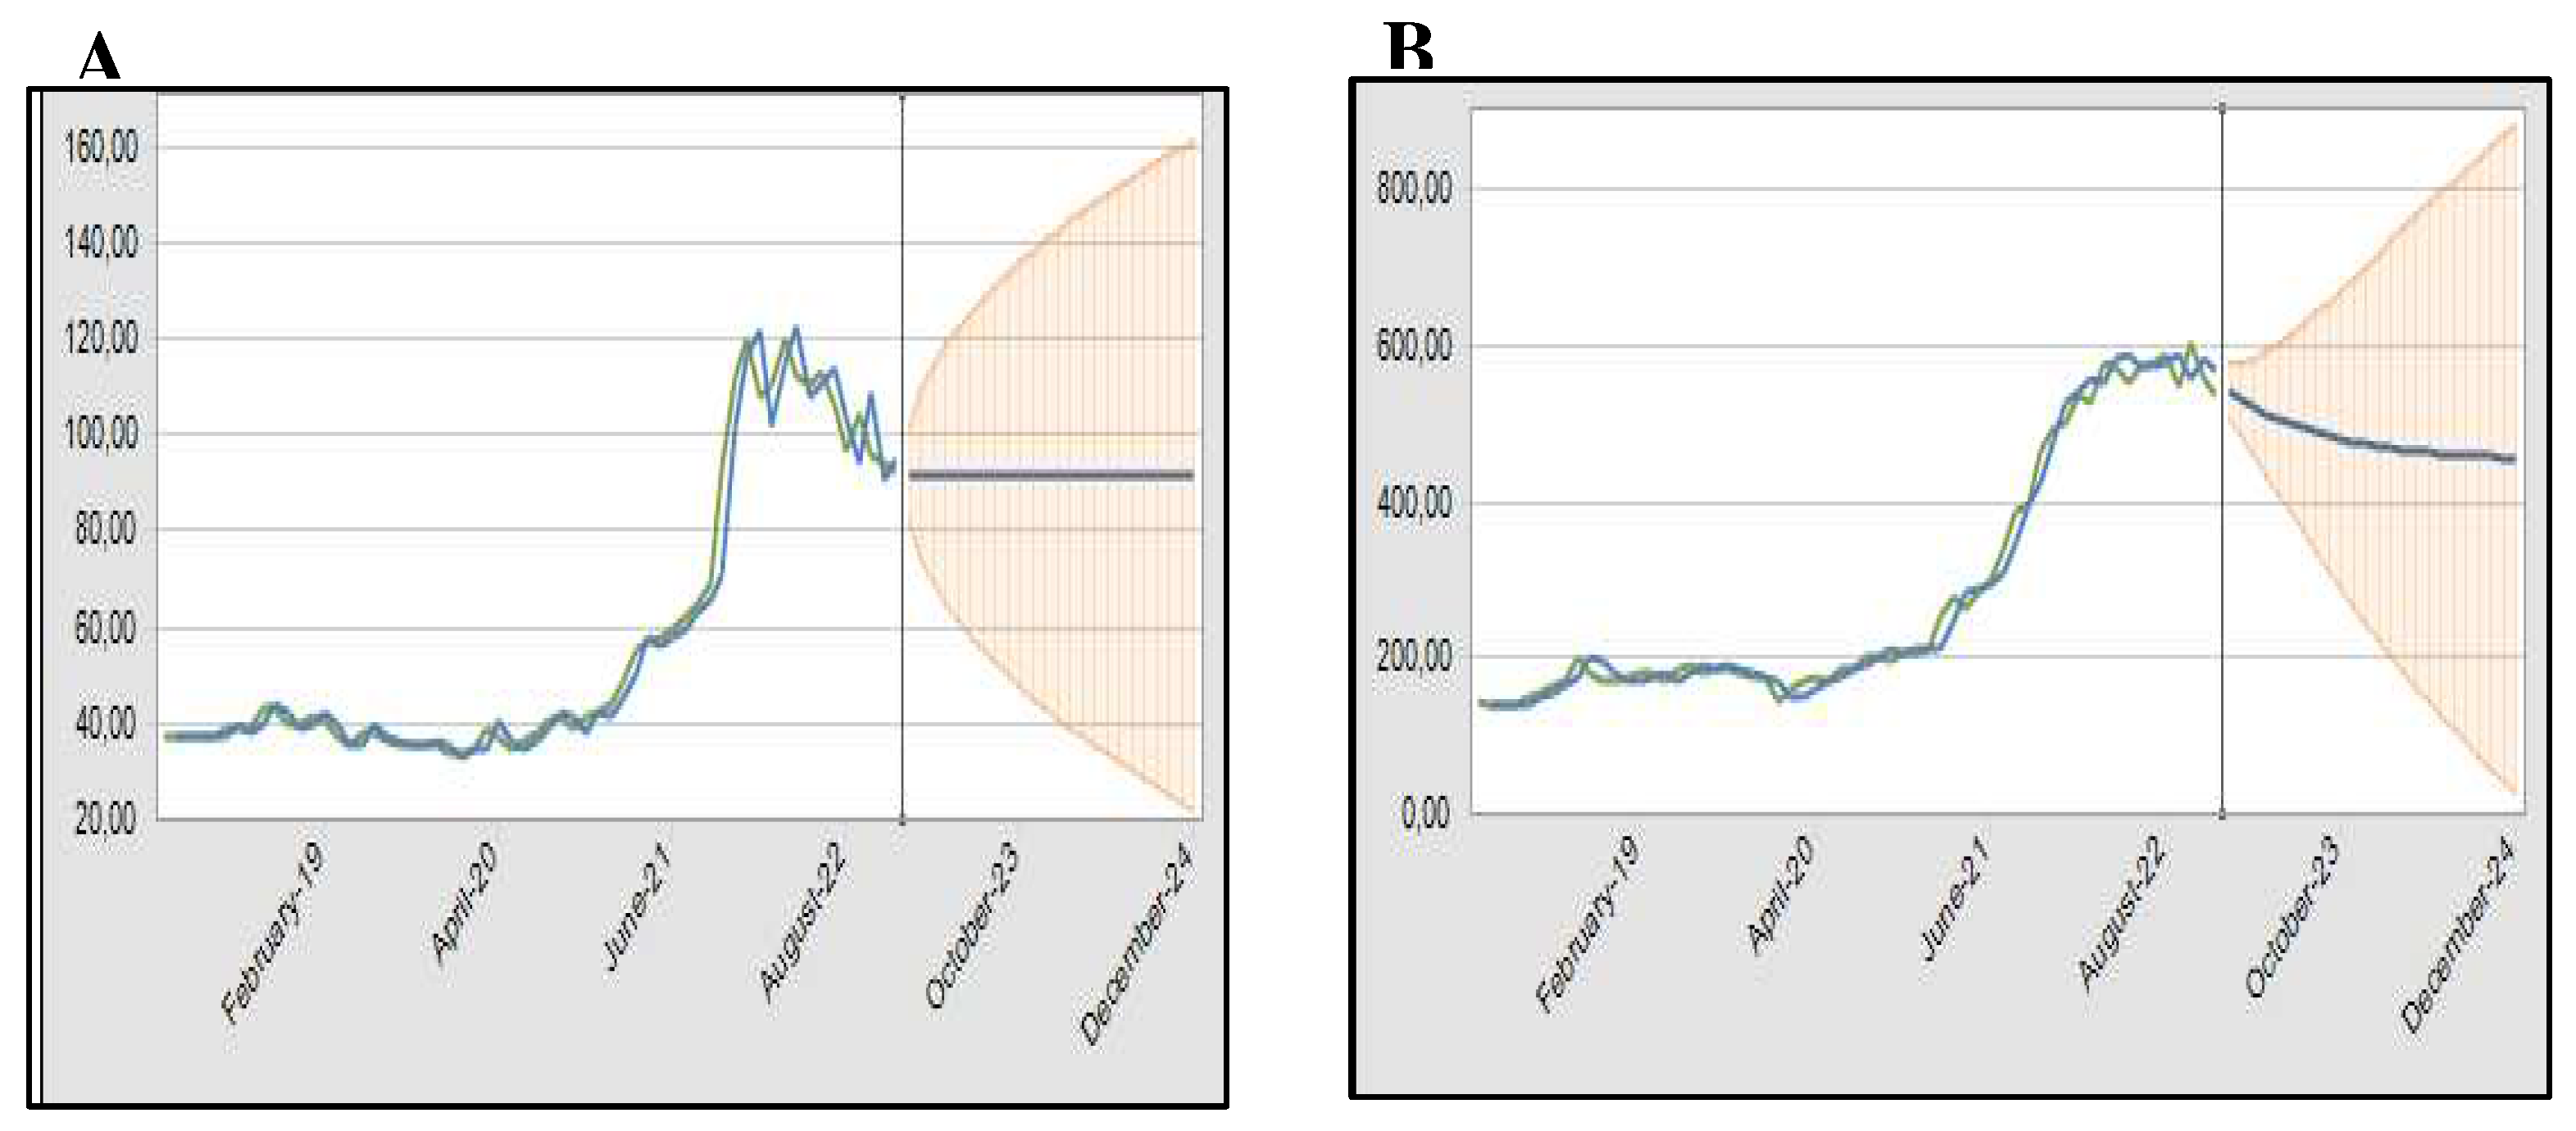
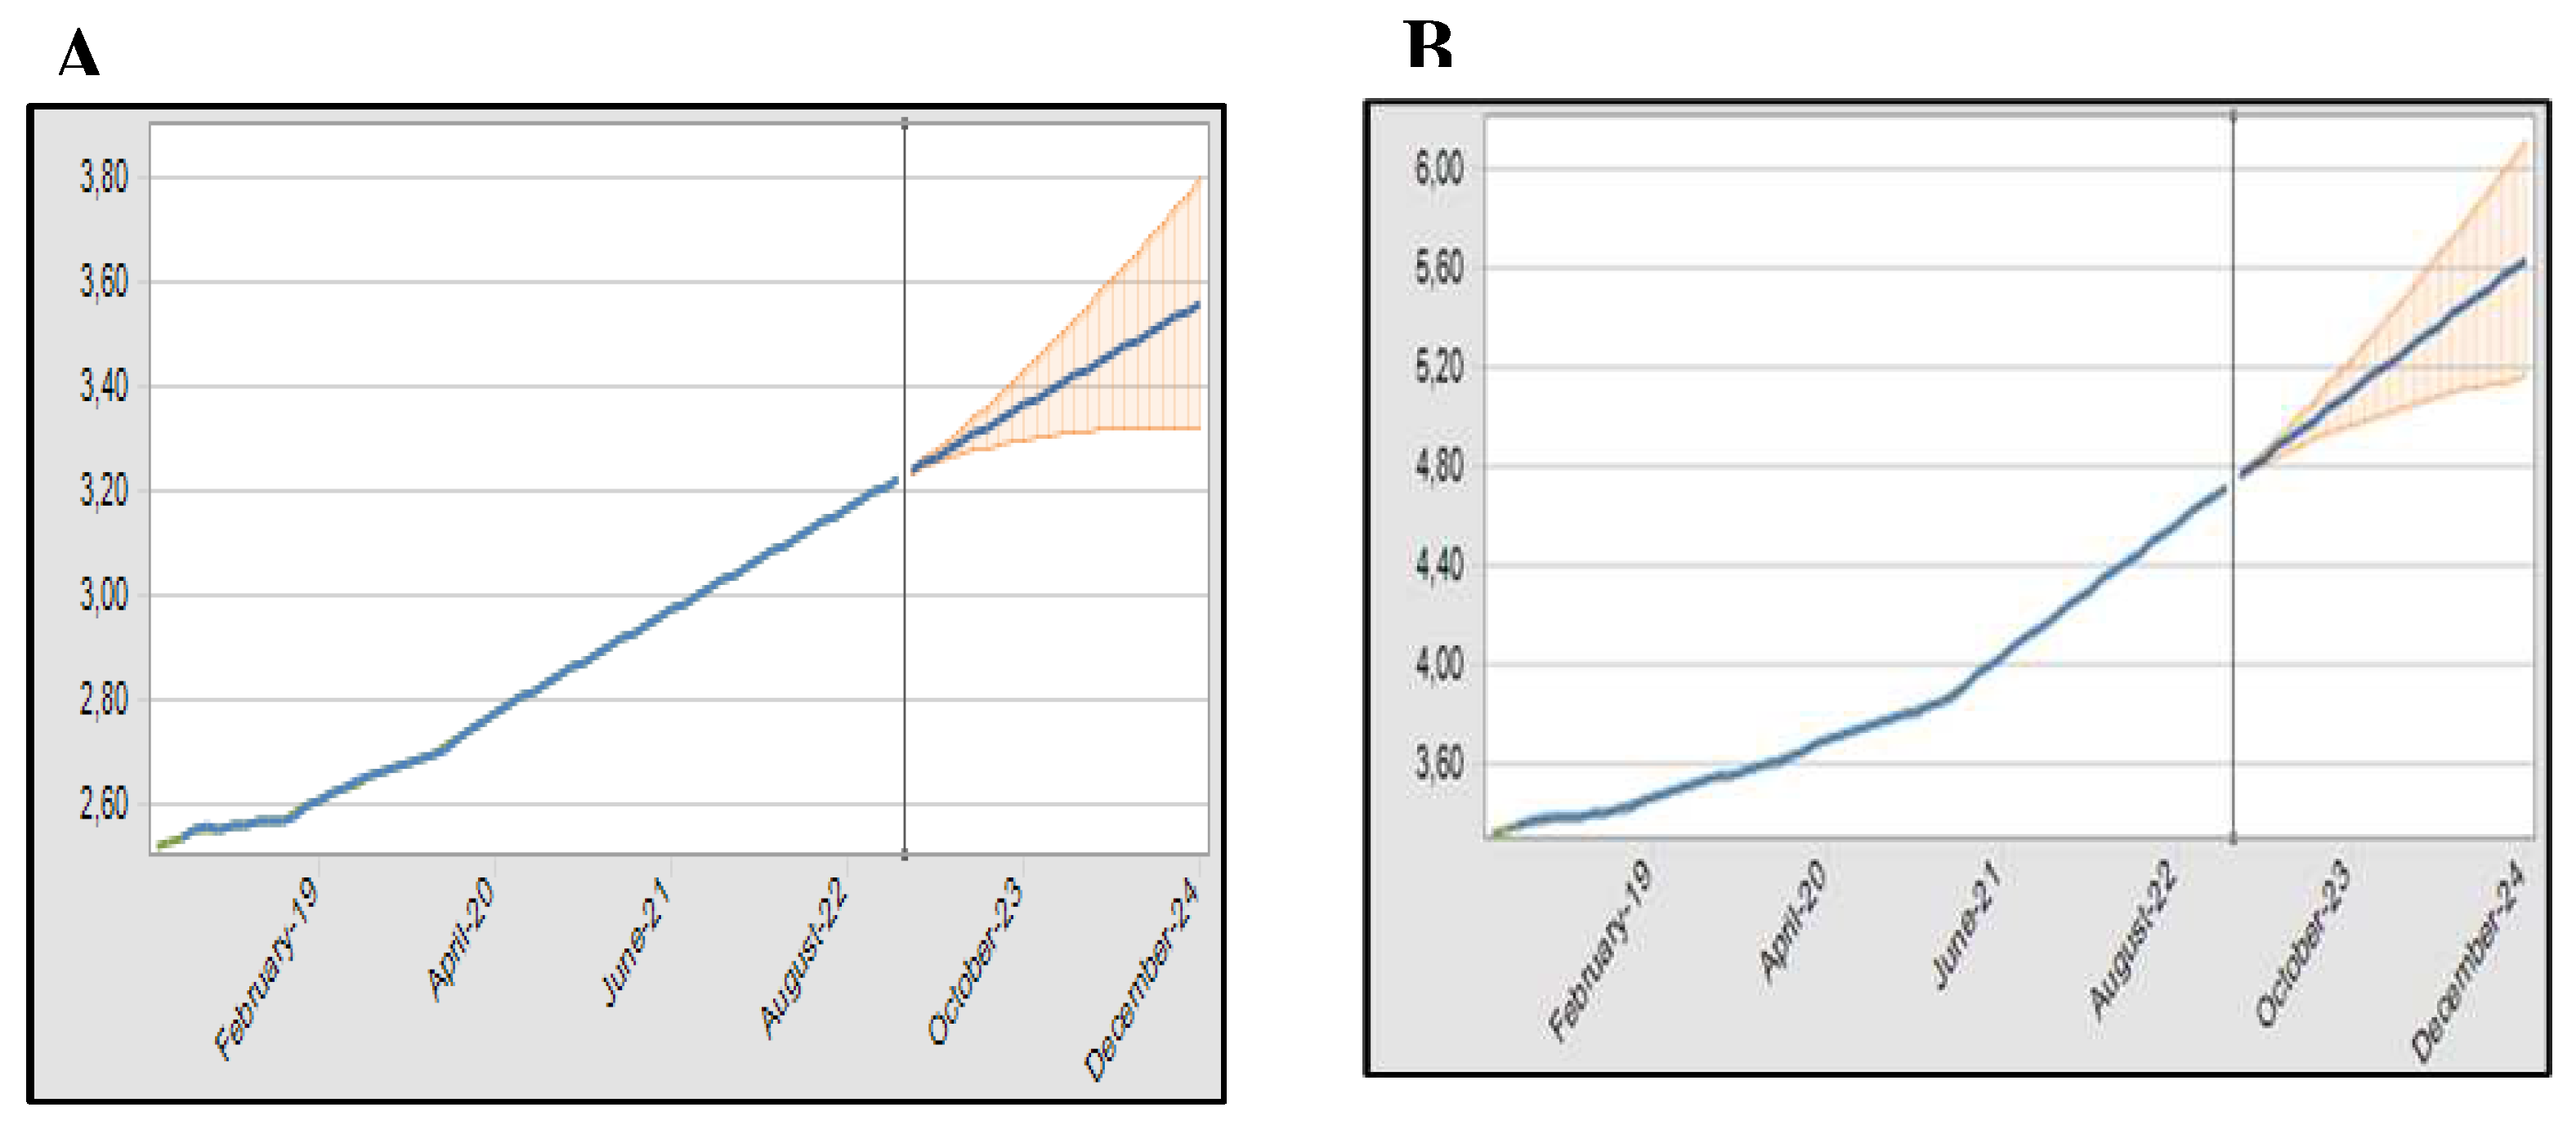
For the next 24 months, it was evidenced that the urea fertilizer (Figure 3A) shows a trend of stability in its price, while the NPK 05-25-25 fertilizer shows a downward trend (Figure 3B).
In this sense, it is possible to infer that the production cost of soybean planting is likely to decrease for the next two harvests, as the price of the NPK 05-25-25 fertilizer shows a strong correlation with the production cost of this crop. The stability in the price of urea for the next 24 months is due to the significant increase in the exchange rate in recent months, especially for the nitrogen component. It is important to note that the NPK 05-25-25 fertilizer utilizes 5% of this component in its formulation.
Among the models suggested by the software to forecast costs/ha for the next 24 months, DTN-S was able to capture the expected scenario for a near-term trend (730 days) for the cost/ton in Figure 3A, while ARIMA was used for Figure 3B.
The minimum cost/ha/soybean value for Figure 3A (urea) was USD 33.90, and for Figure 3B (NPK 05-25-25 fertilizer) it was USD 139.20. The average values were US$ 58.04 and USD 288.02, and the maximum values were USD 120.15 and USD 602.62, with a standard deviation of USD 29.32 and USD 161.58, respectively. The purchasing power of rural producers to acquire one ton of fertilizers was reduced until July 2022, when a recovery trend began, observed in October [42]. As of April 2023, the price of one ton of NPK 05-25-25 fertilizer is US$ 696.00, and the price of urea fertilizer is US$ 718.00 [57]. These values are considered above the average predicted in this analysis. The difference between the maximum and minimum values presented in this analysis was significant.
Using the penalizing criteria of AIC and BIC, the software found the best model for all the simulations performed. Knowing that the model that best fits the series is the one with the lowest value, it can be concluded that the most suitable model for Figure 3B is the ARIMA (1, 1, 2) series. The model indicates an order of 1 for the AR component (Auto Regressive), an order of 1 for the 2 component (Integration or differencing), and the last 2 for the MA component (Moving Average). The values for AIC were 5.99 and for BIC were 6.10* for Figure 3B, based on the lowest mean squared error. For Figure 3A, the AIC was 3.32 and the BIC was 3.36*.
The ARIMA model for Figure 3A showed that the series has an insignificant auto-regressive (AR) component. This is due to the partial autocorrelations of the series, as evidenced by the ARIMA (0, 1, 1) model. However, even so, the autoregressive coefficients and the model coefficient weighted the behavior of the forecast, increasing the accuracy of this variable, thus demonstrating an appropriate model. Additionally, it can be observed that the Durbin-Watson (DW) statistic values, which indicate no first-order correlation, whether positive or negative, are equal to 2.0 for Figure 3A.
The TANS model for Figure 3B demonstrated that the series has a non-stationary stochastic process, as the statistical properties of at least one finite sequence of components differ from those of the sequence for at least one integer. In other words, a non-stationary stochastic process is one where the joint distribution of any set of variables changes if we change the variables over time. This is due to the partial correlations of the series, as evidenced by the ARIMA (1, 1, 2) model. Additionally, it can be observed from the Durbin-Watson (DW) statistic values that there is first-order correlation, whether positive or negative, with values close to 2.0 for Figure 3B.
The results from Figure 4 refer to the projected values of dolomitic limestone corrective. The forecast indicates a stable scenario for the next 24 months. The minimum cost/ha/soybean/corn value from Figure 4 was USD 14.80. The average value was US$ 25.29, and the maximum value was USD 40.98, with a standard deviation of USD 8.02.
The current cost of dolomitic limestone corrective per hectare is US$ 25.3 [57], which falls within the predicted average. The literature indicates that the costs associated with this soil corrective are mainly influenced by the freight rates during its transportation [71].
According to the Predictor, for Figure 4, the best method with the lowest mean squared error chosen for all groups was the Damped Trend Non-Seasonal. Further-more, it can be observed that the values of the Durbin-Watson statistic indicate not first, second, or third-order correlation, whether positive or negative. The analyzed product is essential for the cultivation of corn/soybean, as soil acidification is a concern in almost all countries with significant production of these crops, and its reversal con-tributes to water and nutrient exploitation, aiding the plant during periods of drought [72].
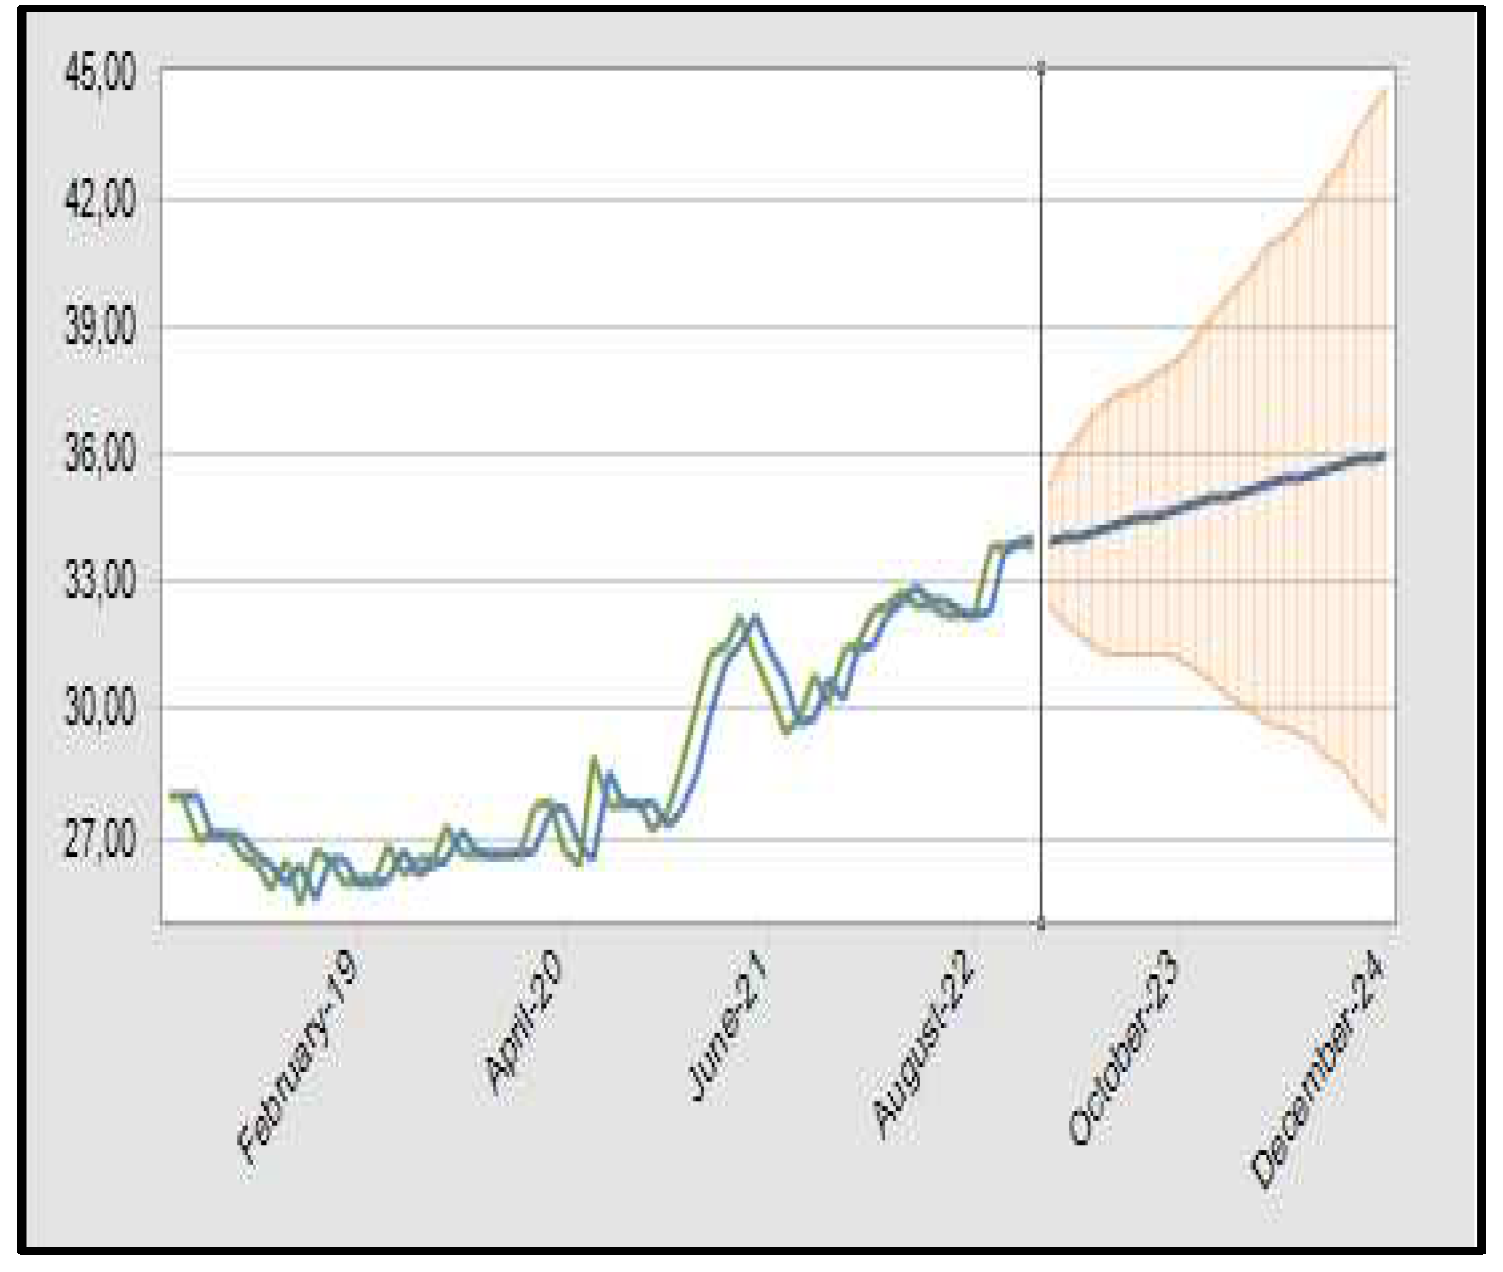
The results in Figure 5 pertain to the projected values of the Fungicide Trifloxystrobin Tebuconazole, which showed a strong relationship with the production costs of corn and soybean. The forecast indicates a scenario of price increase for the next 24 months. This fungicide was the only agricultural pesticide with R² ≥ 0.70 for both crops, and thus, it can influence the increase in production costs for the studied crops.
The minimum cost per hectare for soybean/corn, as shown in Figure 5, was USD 25.43. The average cost was USD 28.92, and the maximum cost was USD 33.99, with a standard deviation of USD 2.64. According to the IEA (2023) [57], the current cost of Trifloxystrobin Tebuconazole per hectare is USD 28.9, indicating that although there is a trend of price increase for this input over the next 24 months, the average cost remained within the estimated price by this forecast.
The statistical results conducted, according to the Predictor, showed that the best method with the lowest mean squared error chosen for all groups was DTN-S. This method is efficient for data with trends but without seasonality [33], which was the case in this analysis.
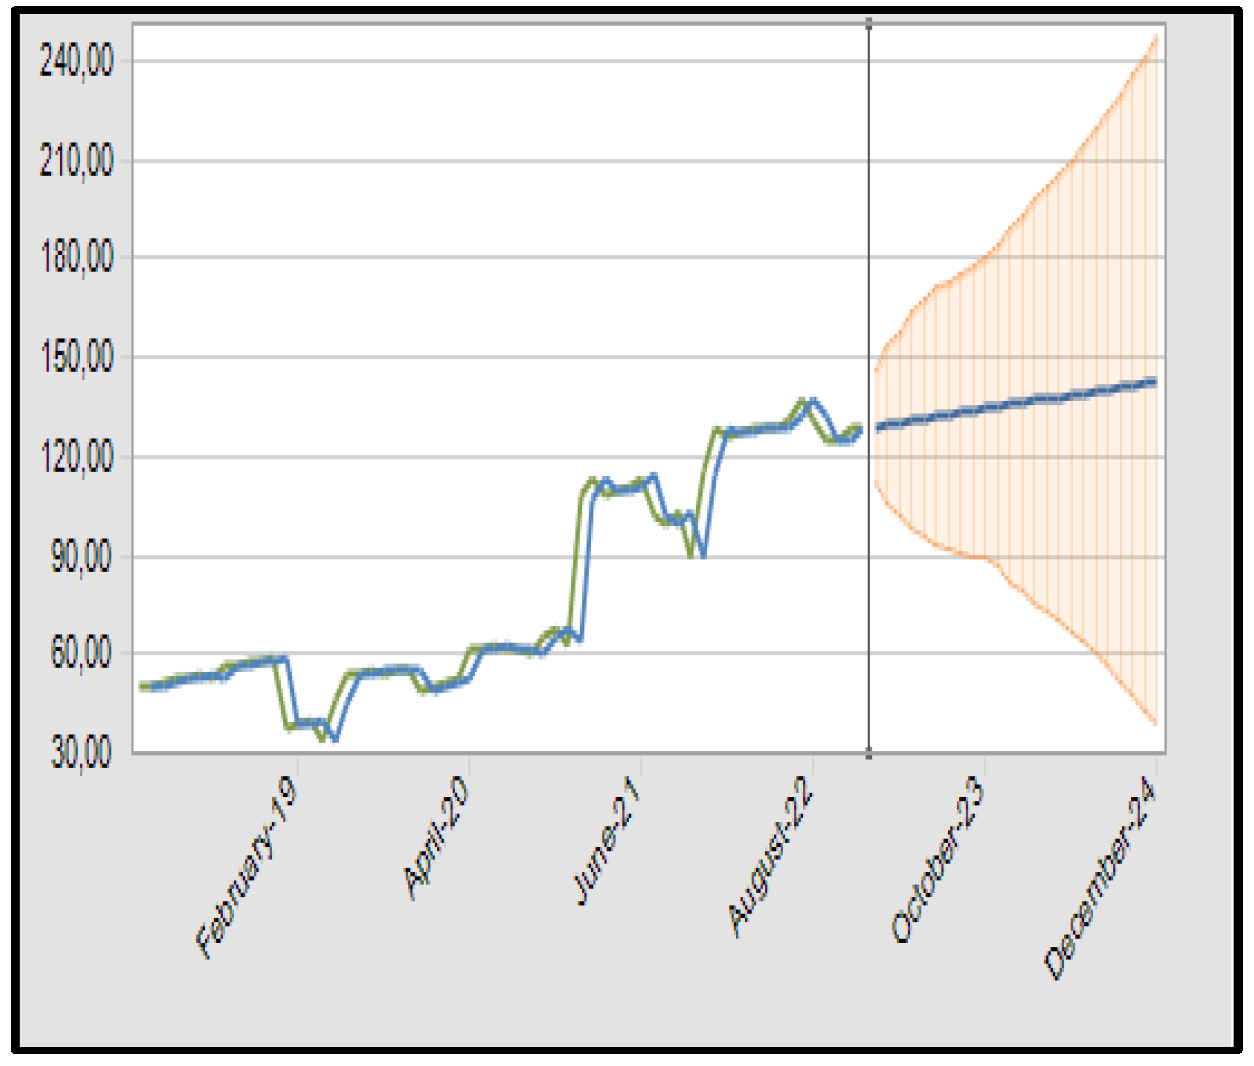
The projected values for soybean seed are presented in Figure 6. The results correspond to the projected values for both analyzed crops as dependent variables (corn/soybean). The forecast indicates a scenario of price increase for the next two years. The minimum cost per hectare for soybean seed was USD 34.29. The average cost was USD 79.93, and the maximum cost was USD 137.14, with a standard deviation of USD 33.28. The current cost of soybean seed per hectare is USD 79.9 [58]. This value also falls within the predicted average of this study.
For the variable Soybean seed, the most suitable method was DES. The results showed that the values of the DW statistic among all groups are close to 2.0.
The results from Figure 7, presented below, refer to the projected values and trends for the costs related to the labor aspect of tractor drivers and day laborers for both crops (corn/soybean). Figure 7A and 7B depict the trends for these variables, respectively. Both variables indicate an upward trend for the next 24 months.
The minimum cost per hectare for corn/soybean as shown in Figure 7a was US$ 2.52, and for Figure 7b it was US$ 3.31. The average costs were US$ 2.83 and US$ 3.84, and the maximum costs were US$ 3.23 and US$ 4.72, with standard deviations of US$ 0.22 and US$ 0.42, respectively. The average values obtained from the forecast align with the current values of US$ 2.83 for tractor driver labor and US$ 3.84 for day laborer labor [57].
The ARIMA models for Figure 7a and 7b demonstrated that the series has an insignificant autoregressive (AR) component. This is evident from the partial autocorrelations of the series, as shown in the ARIMA (0,2,0) model. The values of the DW statistic indicate that there is no first-order correlation, either positive or negative, with a value of 2.0 for Figure 7a and close to 2.0 for Figure 7b.
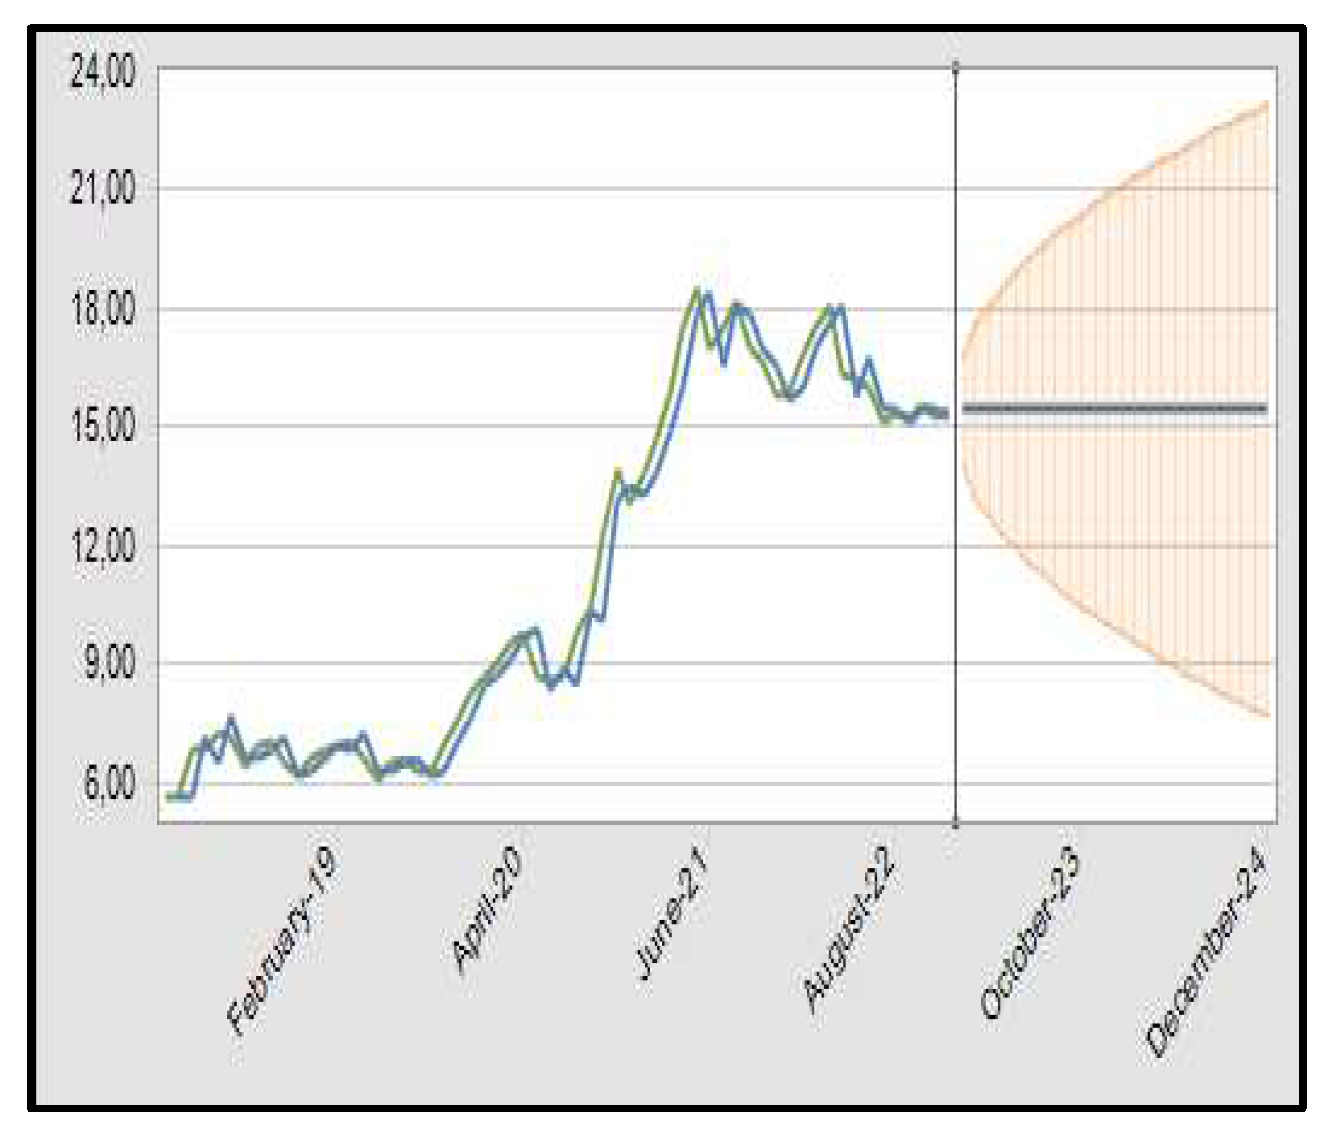
The results presented in Figure 8 are related to the projected values for the price trend per bushel of corn in the near future. However, it is evident that there is a stable price trend for corn per bushel in the coming months (24 months).
The minimum price per bag for corn, as shown in Figure 8, was USD 5.66. The average price was US$ 11.28, and the maximum price was US$ 18.53, with a standard deviation of USD 4.52. The current price is USD 11.3, which falls within the predicted price range of this analysis [57].
Using the penalizing criteria of AIC and BIC, like Figure 3a, the ARIMA (1, 1, 1) model was found to be the best fit for the series. The AIC value was -0.65, and the BIC value was -5.58*, based on the lowest mean squared error.
The statistical values for the MCS analysis conducted using the predictor, for Figure 3 and Figure 8, are presented in Table 4.

4. Discussion and Conclusions

In an industry highly dependent on fluctuations in agricultural input prices and market volatility, the ability to accurately predict costs is essential to ensure the economic viability of agricultural operations. In this context, this study identified historical prices (2018 to 2022) of inputs related to corn and soybean production and analyzed the influence of these variables on the production costs of these commodities. The results showed that inputs such as NPK 05-25-25 fertilizer, Urea fertilizer, Dolomitic Limestone corrective, Trifloxystrobin Tebuconazole fungicide, soybean seed, day laborer labor, tractor driver labor, and corn seed are relevant variables in estimating the production costs of corn and soybeans. Based on this finding, cost forecasting using Monte Carlo simulation provided a clear view of the expected expenses for the next 24 months, enabling farmers to make strategic planning and resource allocation decisions.
Although different approaches exist in the literature to enable such forecasting, classical deterministic approaches rely on fixed estimates for each variable involved and do not consider the uncertainty of projected scenarios. They often only consider an ideal scenario, resulting in unrealistic predictions and underestimation of risks [73-74]. On the other hand, the application of Monte Carlo simulation employs a stochastic approach in which the involved variables are modeled as probability distributions. Instead of providing fixed estimates, Monte Carlo simulation considers the uncertainties associated with each variable and generates multiple simulations to obtain a probabilistic distribution of possible outcomes, considering market variability and uncertainties [5, 34, 73-76].
Considering the numerical simulations, adjustments, and error measures, the model proposed in this article has shown accuracy in estimating future production prices of corn and soybeans. This makes it a useful tool for generating prices under different production scenarios for these commodities, including periods of significant fluctuation.
In practical terms, this model assists in the development of strategies and decision-making in trading, considering external factors that influence the production costs of corn and soybeans. It can also be utilized by other countries, especially emerging or developing ones that have similar production models to Brazil's.
Methodological approaches can help agribusiness decision-makers understand the key cost variables. This way, investors/agriculturists have the option to seek cost reduction alternatives through the substitution of new products (technological innovation) and also identify and forecast intentions regarding better profitability in subsequent crop production. Thus, the prices of the commodities analyzed in this study (corn and soybeans) can serve as auxiliary predictors in this process.
The cost and price variables can provide relevant information for decision-makers regarding the production behavior of the mentioned crops. We estimated cost and price forecasting models to statistically analyze/project the costs and prices of two agriculturally significant crops in Brazil, considering variables that have disparate correlations among them, including significant cost variables for the cultivation of these activities.
The results reveal interesting findings, such as a reduction in fertilizer costs, an increase in labor costs, soybean seed and fungicide costs, and stability in dolomitic limestone corrective costs in the near future (24 months). Additionally, the Monte Carlo simulation (SMC) provided insights by considering a range for corn production costs between USD 600.00 and USD 1150.00, and for soybean production costs between USD 260.00 and USD 420.00. Our findings also revealed that soybean profitability surpasses that of corn based on the variables analyzed in this study.
Although our results are valuable for agribusiness decision-makers, further research is needed to better understand the costs and prices for corn and soybean crops. For instance, replicating the analysis in other countries with significant production of these crops, such as the United States and Argentina, would be highly beneficial. This way, countries that show higher profitability in the near future could estimate a greater or lesser propensity for farmers/investors to invest in these crops, thus reinforcing the countries that would benefit to a greater or lesser extent from exchange rate fluctuations. Moreover, these results can contribute to a better understanding of food security implications in the mentioned countries.

Author Contributions

Conceptualization, F.A. and G.M.; methodology, F.R.; writing—original draft preparation, C.G. and F.A.; writing—review and editing, P.A. and M.B.; supervision, M.B. All authors have read and agreed to the published version of the manuscript.

Funding

This work has been supported by PIPECT/IFSP - Programa Institucional de Incentivo à Participação em Eventos Científicos e Tecnológicos para Servidores do Instituto Federal de Educação, Ciência e Tecnologia de São Paulo, notice number: 264, April 24, 2023 and by FCT – Fundação para a Ciência e Tecnologia within the R&D Units Project Scope: UIDB/00319/2020.

Institutional Review Board Statement

not applicable

Data Availability Statement

not applicable

Acknowledgments

We express our sincere gratitude to the IEA for providing the data used in this research.

Conflicts of Interest

The authors declare no conflict of interest.

References

  1. Aragão, A. , Contini, E. 2022. O agro no Brasil e no mundo: Um panorama do período de 2000 a 2021. Embrapa, Brasília, DF, Brasil. Available at:. https://www.embrapa.br/documents/10180/62618376/O+AGRO+NO+BRASIL+E+NO+MUNDO.pdf.
  2. Meade, B. , Puricelli, E., Mcbride, W., Valdes, C., Hoffman, L., Foreman, L., & Dohlman, E. 2016. Corn and Soybean Production Costs and Export Competitiveness in Argentina, Brazil, and the United States. World Bank Group Agricuture, Washington, DC, Estados Unidos.
  3. BELIK, W. 2020. Sustainability and food security after COVID-19: relocalizing food systems? Agricultural and Food Economics, 8(1):23. [CrossRef]
  4. Amorim, F. R. de, Andrade, A. G. de., Silva, S. A., Pigatto, G. 2021. Reflexo pós-pandemia nos preços das ações de três grupos do setor sucroalcooleiro no Brasil. Navus Revista de Gestão e Tecnologia 11:1-19.
  5. Oliveira, S. C. de. , Amorim, F. R. de., Barbosa, C. C., Andrade, Alequexandre, G. de., Solfa, F. D. G. 2022. Effect of Production Costs on the Price per Ton of Sugarcane: The Case of Brazil. International Journal of Social Science Studies, 10(6):15-27. [CrossRef]
  6. Sun, Z. , Katchova, A. L., Lee, S. 2023. Economic perspective on the U.S. agricultural commodity market for the 2022/23 marketing year. Department of Agricultural, Environmental, and Development Economics. Available at https://aede.osu.edu/about-us/publications/economic-perspective-us-agricultural-commodity-market-202223-marketing-year.
  7. Grafton, M. , Manning, M. 2017. Establishing a risk profile for New Zealand pastoral farms. Agriculture,7(10):81. [CrossRef]
  8. Lips, M. 2017. Disproportionate allocation of indirect costs at individual-farm level using maximum entropy. Entropy19(9):453. [CrossRef]
  9. Gao, J. , Zeng W., Ren, Z., Ao, C., Lei, G., Gaiser, T., Srivastava, A. 2023. A Fertilization Decision Model for Maize, Rice, and Soybean Based on Machine Learning and Swarm Intelligent Search Algorithms. Agronomy 13(5):1400. [CrossRef]
  10. Pitrova, J. , Krejˇcí, I., Pilar, L., Moulis, P., Rydval, J., Hlavatý, R., Horáková, T., Tichá, I., 2020. The economic impact ofdiversification into agritourism. International Food and Agribusiness Management Review 23(5): 713-734. [CrossRef]
  11. Amorim, F. R. de, Patino, M. T. O., Bartmeyer, P. M., Santos, D. F. L. 2020. Productivity and Profitability of the Sugarcane Production in the State of Sao Paulo, Brazil. Sugar Tech 22:596–604. [CrossRef]
  12. Pengue, W. A. 2004. Transgenic crops in Argentina and its hidden costs. In Proceedings of IV Biennial International Workshop Advances in Energy Studies. Unicamp, Campinas, SP, Brazil.
  13. Goldsmith, P. 2019. Soybean costs of production. African Journal of Food, Agriculture, Nutrition and Development 19(5): 15140–15144. [CrossRef]
  14. Migliorin, A. D. S. , Milani, B. 2021. Análise dos custos de produção da cultura da soja em uma pequena propriedade rural de Jaguari – RS. Revista Gestão em Análise 10(2): 33-47. [CrossRef]
  15. Pratine, E. , Suave, R., Maris Lima Altoé, S. (2021). Custos e margem de contribuição da produção de soja de uma propriedade rural. Custos e agronegócio online 17(2): 464-490.
  16. Rocha, R. R. 2020. Avaliação de custos de produção de soja convencional: um estudo de caso no município de Nova Mutum (Mato Grosso). Meio Ambiente 2(4): 40-47.
  17. Silva, K. H. A. , Guzatti, N. C., & Franco, C. 2020. Análise de custo de produção e lucratividade na produção do milho convencional e transgênico em Mato Grosso. Custos e agronegócio online 16(1):250-275.
  18. Silva, A. C. C. J. da, Rossato, J. V., Kraetzig, E. R. S., da Silva, V. R. 2022. Custos de produção da soja em uma propriedade rural no interior do Estado do Rio Grande do Sul. Custos e agronegócio online 18(1):2-24.
  19. Ishikawa-Ishiwata, Y. , Furuya, J. 2021. Fungicide cost reduction with soybean rust-resistant cultivars in Paraguay: A supply and demand approach. Sustainability 13(2):887. [CrossRef]
  20. Ventura, M. V. A. , Batista, H. R. F., Bessa, M. M., Pereira, L. S., Costa, E. M., Oliveira, M. H. R. de. 2020. Comparison of conventional and transgenic soybean production costs in different regions in Brazil. Research, Society and Development 9(7): e154973977. [CrossRef]
  21. Huerta, A. I. , Martin, M. A. 2002. Soybean production costs: an analysis of the United States, Brazil, and Argentina. AAEA Annual Meeting Long Beach, California, Estados Unidos.
  22. Granjo, J. F. O. , Duarte, B. P. M., Oliveira, N. M. C. 2017. Integrated production of biodiesel in a soybean biorefinery: Modeling, simulation and economical assessment. Energy129(15): 273-291. [CrossRef]
  23. Olortegui, J. A. C.; Marçal, E. F.; Rocha, R.A.; Apolinário, H.C.F.; Teixeira, P.C.M. 2021. Avaliação De Áreas Agrícolas Através De Uma Abordagem De Opções Reais Por Simulação De Monte Carlo Com Mínimos Quadrados Ordinários. Brazilian Journal of Development 7(12): 118237-118255. [CrossRef]
  24. Osaki, M. , Aparecido, A.L. R., Lima, F.F., Ribeiro, R. G., Barros, G. S de C. 2017. Risks associated with a double-cropping production system - A case study in southern Brazil. Scientia Agricola 76(2): 130–138. [CrossRef]
  25. Thompson, N. M. , Armstrong, S. D., Roth, R. T., Ruffatti, M. D., Reeling, C. J. 2020. Short-run net returns to a cereal rye cover crop mix in a midwest corn–soybean rotation. Agronomy Journal 112(2): 1068–1083. [CrossRef]
  26. Arce, C. , Arias, D. 2015. Paraguay Agricultural Sector Risk Assessment. World Bank Group Agricuture, Washington, DC, Estados Unidos.
  27. Calviño, P. , Monzon, J. P. 2009. Farming systems of Argentina: yield constraints and risk management. Crop physiology: Applications for genetic improvement and agronomy 51:55-70. [CrossRef]
  28. Wu, H. , Hubbard, K. G., Wilhite, D. A. 2004. An agricultural drought risk-assessment model for corn and soybeans. International Journal of Climatology: A Journal of the Royal Meteorological Society 24(6):723-741. [CrossRef]
  29. Krah, K. Maize price variability, land use change, and forest loss: evidence from Ghana. 2023. Land Use Policy 125:106472- 106513. [CrossRef]
  30. Wang, W. , Wei, L. 2021 Impacts of agricultural price support policies on price variability and welfare: evidence from China's soybean market. Agricultural Economics 52(1): 3-17. [CrossRef]
  31. Hair, J. F. Jr. , Anderson, R. E., Tatham, R. L., Black, W. C. 2005. Análise Multivariada dos Dados. Bookman, Porto Alegre, RS, Brasil.
  32. Moriasi, D. N. , Arnold, J. G., Liew, M. W. V., Bingner, R. L., Harmel, R. D.; Veith, T. L. 2007. Model evaluation guidelines for systematic Quantification of accuracy in watershed simulations. American Society of Agricultural and Biological Engineers, 50(3): 885-890, 2007. [Google Scholar] [CrossRef]
  33. Oracle. Como Trabalhar com Planejamento Preditivo no Smart View. 2023. Available at: https://docs.oracle.com/cloud/help/pt_BR/pbcs_common/CSPPU/title.htm.
  34. Silva, S. A. , Abreu, P. H. C., Amorim, F. R.; Santos, D. F. L. 2019. Application of Monte Carlo Simulation for Analysis of Costs and Economic Risks in a Banking Agency. IEEE Latin America Transactions 17(3): 409-41.
  35. Miura, M. 2022. Estimativa de Oferta e Demanda de Milho no Estado de São Paulo em 2022. Instituto de Economia Agrícola 17(8): 1-4.
  36. Seade – Sistema Estadual de Análise de Dados. 2022. Valor da produção agrícola da soja ultrapassa o da laranja em SP. Available at https://www.seade.gov.br/valor-da-producao-agricola-da-soja-ultrapassa-o-da-laranja-em-sp/#:~:text=O%20valor%20bruto%20da%20produ%C3%A7%C3%A3o,%2C%20que%20respondeu%20por%2011%25.
  37. Camargo, F. P. de, Fredo, C. E., Ghobril, C. N., Bini, D. L. de C., Angelo, J. A., Miura, M., Coelho, P. J., Martins, V. A., Nakama, L. M., Ferreira, T. T. 2022. Previsões e Estimativas das Safras Agrícolas do Estado de São Paulo, Levantamento Parcial, Ano Agrícola 2022/23 e Levantamento Final, Ano Agrícola 2021/2. Análises e Indicadores do Agronegócio 18(2): 1-20.
  38. Cepea - Centro de Estudos Avançados em Economia Aplicada. 2018. Custos grãos. Cepea, Piracicaba, SP, Brasil. Available at: https://www.cepea.esalq.usp.br/upload/revista/pdf/0845987001639146208.pdf.
  39. Cepea - Centro de Estudos Avançados em Economia Aplicada. 2019. Custos grãos. Cepea, Piracicaba, SP, Brasil. Available at: https://www.cepea.esalq.usp.br/upload/revista/pdf/0620053001581357527.pdf.
  40. Cepea - Centro de Estudos Avançados em Economia Aplicada. 2020. Custos grãos. Cepea, Piracicaba, SP, Brasil. Available at: https://www.cepea.esalq.usp.br/upload/revista/pdf/0723193001600198255.pdf.
  41. Cepea - Centro de Estudos Avançados em Economia Aplicada. 2021. Custos grãos. Cepea, Piracicaba, SP, Brasil. Available at: https://www.cepea.esalq.usp.br/upload/revista/pdf/0845987001639146208.pdf.
  42. Cepea - Centro de Estudos Avançados em Economia Aplicada. 2022. Custos grãos. Cepea, Piracicaba, SP, Brasil. Available at: https://www.cepea.esalq.usp.br/upload/revista/pdf/0603861001671131737.pdf.
  43. Shadidi, B. Najafi, G. 2021. Impact of covid-19 on biofuels global market and their utilization necessity during pandemic. Energy Equipment and Systems 9(4): 371-382.
  44. Lin, B. , Zhang, Y. Y. 2020. Impact of the COVID-19 pandemic on agricultural exports. Journal of Integrative Agriculture 19(12): 2937–2945. [CrossRef]
  45. Cepea - Centro de Estudos Avançados em Economia Aplicada. 2023. Após alcançar patamar recorde em 2021, PIB do agronegócio recua 4,22% em 2022. Cepea, Piracicaba, SP, Brasil. Available at: https://www.cepea.esalq.usp.br/upload/kceditor/files/PIB-DO-AGRONEGOCIO-2022.17MAR2023.pdf.
  46. Facuri, F. G. , Ramos, M. R. 2019. Fatores de influência na formação do preço dos herbicidas à base de glifosato no Brasil. Enciclopédia Biofesta 16(29): 882-894. [CrossRef]
  47. Rabelo, C. G. , Souza, L. H., Oliveira, F. G. 2017. Análise dos custos de produção de silagem de milho: estudo de caso. Caderno de Ciências Agrárias 9(2):08-15.
  48. Batista, A. , Lopes, A. C. V., Costa, J. R. M. 2022. Gestão de custos na produção agrícola: um estudo na cultura da soja. XXIX Congresso Brasileiro de Custos, João Pessoa, PB, Brasil. Available at: https://anaiscbc.emnuvens.com.br/anais/article/view/4960/4973. 4960. [Google Scholar]
  49. Palma, A. A. 2023. Balanço de pagamentos, balança comercial e câmbio – evolução recente e perspectivas. Instituto de Pesquisa Econômica Aplicada (IPEA), Brasília, Brasil. Available at: https://www.ipea.gov.br/cartadeconjuntura/index.php/2023/04/balanco-de-pagamentos-balanca-comercial-e-cambio-evolucao-recente-e-perspectivas-6/#:~:text=As%20expectativas%20do%20relat%C3%B3rio%20Focus,US%24%20ao%20final%20de%202024.
  50. Seidler, E. P. , Costa, N. L., Almeida, M de., Coronel, D. A., Santana, A. C. de. 2022. Formação de preços do milho em São Paulo e suas conexões com o mercado interno e internacional. Colóquio – Revista do Desenvolvimento Regional 19(2): 259-278.
  51. Conab – Companhia Nacional de Abastecimento. 2023. Preços de insumos. Conab, Brasília, DF, Brasil. Available at: https://consultaweb.conab.gov.br/consultas/consultaInsumo.do?method=acaoCarregarConsulta.
  52. Alves, L. R. A. , Costa, M. S. da, Lima, F. F. de, Filho, J. B de S., Osaki, M., Ribeiro, R. G. 2018. Diferenças nas estruturas de custos de produção de milho convencional e geneticamente modificado no Brasil, na segunda safra: 2010/11, 2013/14 e 2014/15. Custos e agronegócio online 14(2):364-389.
  53. Staugaitis, A. J. , Vaznonis, B. 2022. Short-Term Speculation Effects on Agricultural Commodity Returns and Volatility in the European Market Prior to and during the Pandemic. Agriculture, 12(5):623. [CrossRef]
  54. Brum, A. L. , Baggio, D. K., Souza, F. M., Batista, G., Schneider, I. N. 2023. Influência dos fundos de investimento na formação das cotações do milho na Bolsa de Cereais de Chicago. Revista de Economia e Sociologia Rural 61(1): e251575. [CrossRef]
  55. Diesse - Departamento Intersindical de Estatística e Estudos Socioeconômicos. 2022. Redução do ICMS dos combustíveis, energia elétrica, transportes e comunicação. Diesse (Nota Técnica número 270). Available at: https://www.dieese.org.br/notatecnica/2022/notaTec270ICMS.pdf.
  56. Richeti, A. , Ceccon, G. Viabilidade Econômica do Milho Safrinha 2021, em Mato Grosso do Sul. 2020. Comunicado Técnico Embrapa 1(1):1-12. Available: https://ainfo.cnptia.embrapa.br/digital/bitstream/item/220036/1/COT-260.pdf.
  57. Instituto de Economia Agrícola (IEA) 2023. Banco de dados. Available: http://www.iea.agricultura.sp.gov.br/out/Bancodedados.
  58. Conab – Companhia Nacional de Abastecimento. 2022. Série Histórica - Custos - Soja - 1997 a 2022. Conab, Brasília, DF, Brasil. Available at: https://www.conab.gov.br/info-agro/custos-de-producao/planilhas-de-custo-de-producao/itemlist/category/824-soja.
  59. Conab – Companhia Nacional de Abastecimento. 2022b. Série Histórica - Custos - Milho 2ª Safra - 2005 a 2022. Conab, Brasília, DF, Brasil. Available at: https://www.conab.gov.br/info-agro/custos-de-producao/planilhas-de-custo-de-producao/itemlist/category/821-milho.
  60. Münch, T. Berg, M., Mirschel, W., Wieland, R., Nendel, C. 2013. Considering cost accountancy items in crop production simulations under climate change. European Journal of Agronomy 54: 57-68. [CrossRef]
  61. Artuzo, F. D. , Foguesatto, C. R., Souza, A. R. L. de, Silva, L. X. da. 2018. Gestão de custos na produção de milho e soja. Revista Brasileira de Gestão de Negócios 20(2): 27-294. [CrossRef]
  62. Noia Júnior, R. de S., Sentelhas, P. C. 2019. Soybean-maize succession in Brazil: Impacts of sowing dates on climate variability, yields and economic profitability. European Journal of Agronomy 103:140-151. [CrossRef]
  63. Brokes, G. , Barfoot, P. 2020. GM crop technology use 1996-2018: farm income and production impacts. GM Crops & Food 11(4):242-261. [CrossRef]
  64. Baio, F. H. R.; Neves, D. C; Souza, H. B.; Leal, A. J. F.; Leite, R. C.; Molin, J. P.; Silva, S. P. 2018. Variable rate spraying application on cotton using an electronic fow controller. Precision Agriculture 19(1): 1-17. [CrossRef]
  65. Freitas, J. M. de, Vaz, M. C., Dutra, G. A., Souza, J. L. De, Rezende, C. F. A. 2021. Response of corn productivity to mineral and organomineral fertilization. Research, Society and Development 10(5):26810514301. [CrossRef]
  66. Costa, F. G. , Caixeta Filho, J. V., & Arima, E. (2019). Influence of Transportation on the use of the Land: Viabilization Potential of Soybean Production in Legal Amazon Due to the Development of the Transportation Infrastructure. Revista de Economia e Sociologia Rural 39(2):155-177.
  67. Marchuk, S. , Tait, S., Sinha, P., Harris, P., Antille, D. L., McCabe, B.K. 2023. 2023. Biosolids-derived fertilisers: A review of challenges and opportunities. Science of The Total Environment 875:162555. [CrossRef]
  68. Smith, W.B. , Wilson, M., Pagliari, P. 2020. Organomineral fertilizers and their application to field crops. Animal Manure: Production, Characteristics, Environmental Concerns, and Management 67:229–243. [CrossRef]
  69. Van Lenteren, J. C. , Bolckmans, K.,Köhl J., Ravensberg, W. J., Urbaneja, A. 2018. Biological control using invertebrates and microorganisms: plenty of new opportunities. BioControl 63:39-59. [CrossRef]
  70. Spark - Inteligência Estratégica. 2021. BIP Spark mostra aumento de 37% na movimentação do mercado de produtos biológicos, para R$ 1,7 bilhão. Available: https://www.noticiasagricolas.com.br/noticias/agronegocio/302521-bip-spark-mostra-aumento-de-37- na-movimentacao-do-mercado-de-produtos-biologicos-para-r-1-7-bilhao.html#.YeM053rMLIU.
  71. Cepea - Centro de Estudos Avançados em Economia Aplicada. 2018. Custos grãos. Cepea, Piracicaba, SP, Brasil. Available at: https://www.cepea.esalq.usp.br/upload/revista/pdf/0003812001534166207.pdf.
  72. Beerling, D. J, Leake, J. R., Long, S. P, Scholes, J. D., Ton, J., Nelson, P. N., Bird, M., Kantzas, E., Taylor, L. L., Sarkar, B., Kelland, Delucia, E., Kantola, I., M., Müller, C., Rau, G., Hansem, J. 2018. Farming with crops and rocks to address global climate, food and soil security. Nature Plants 4(3):138–147. [CrossRef]
  73. Graveline, N. , Loubier, S., Gleyses, G., Rinaudo, J. D. 2012. Impact of farming on water resources: assessing uncertainty with Monte Carlo simulations in a global change context. Agricultural systems 108:29-41. [CrossRef]
  74. Odavić, P. , Zekić, V., Milić, D. 2017. Life cycle cost of biomass power plant-Monte Carlo simulation of investment. Economics of Agriculture 64(2):587-599. [CrossRef]
  75. Dharmawan, K. 2017. Pricing European options on agriculture commodity prices using mean-reversion model with jump diffusion. In AIP Conference Proceedings 1827(1):020002. [CrossRef]
  76. Oktoviany, P. , Knobloch, R., Korn, R. 2021. A machine learning-based price state prediction model for agricultural commodities using external factors. Decisions in Economics and Finance 44(2):1063-1085. [CrossRef]
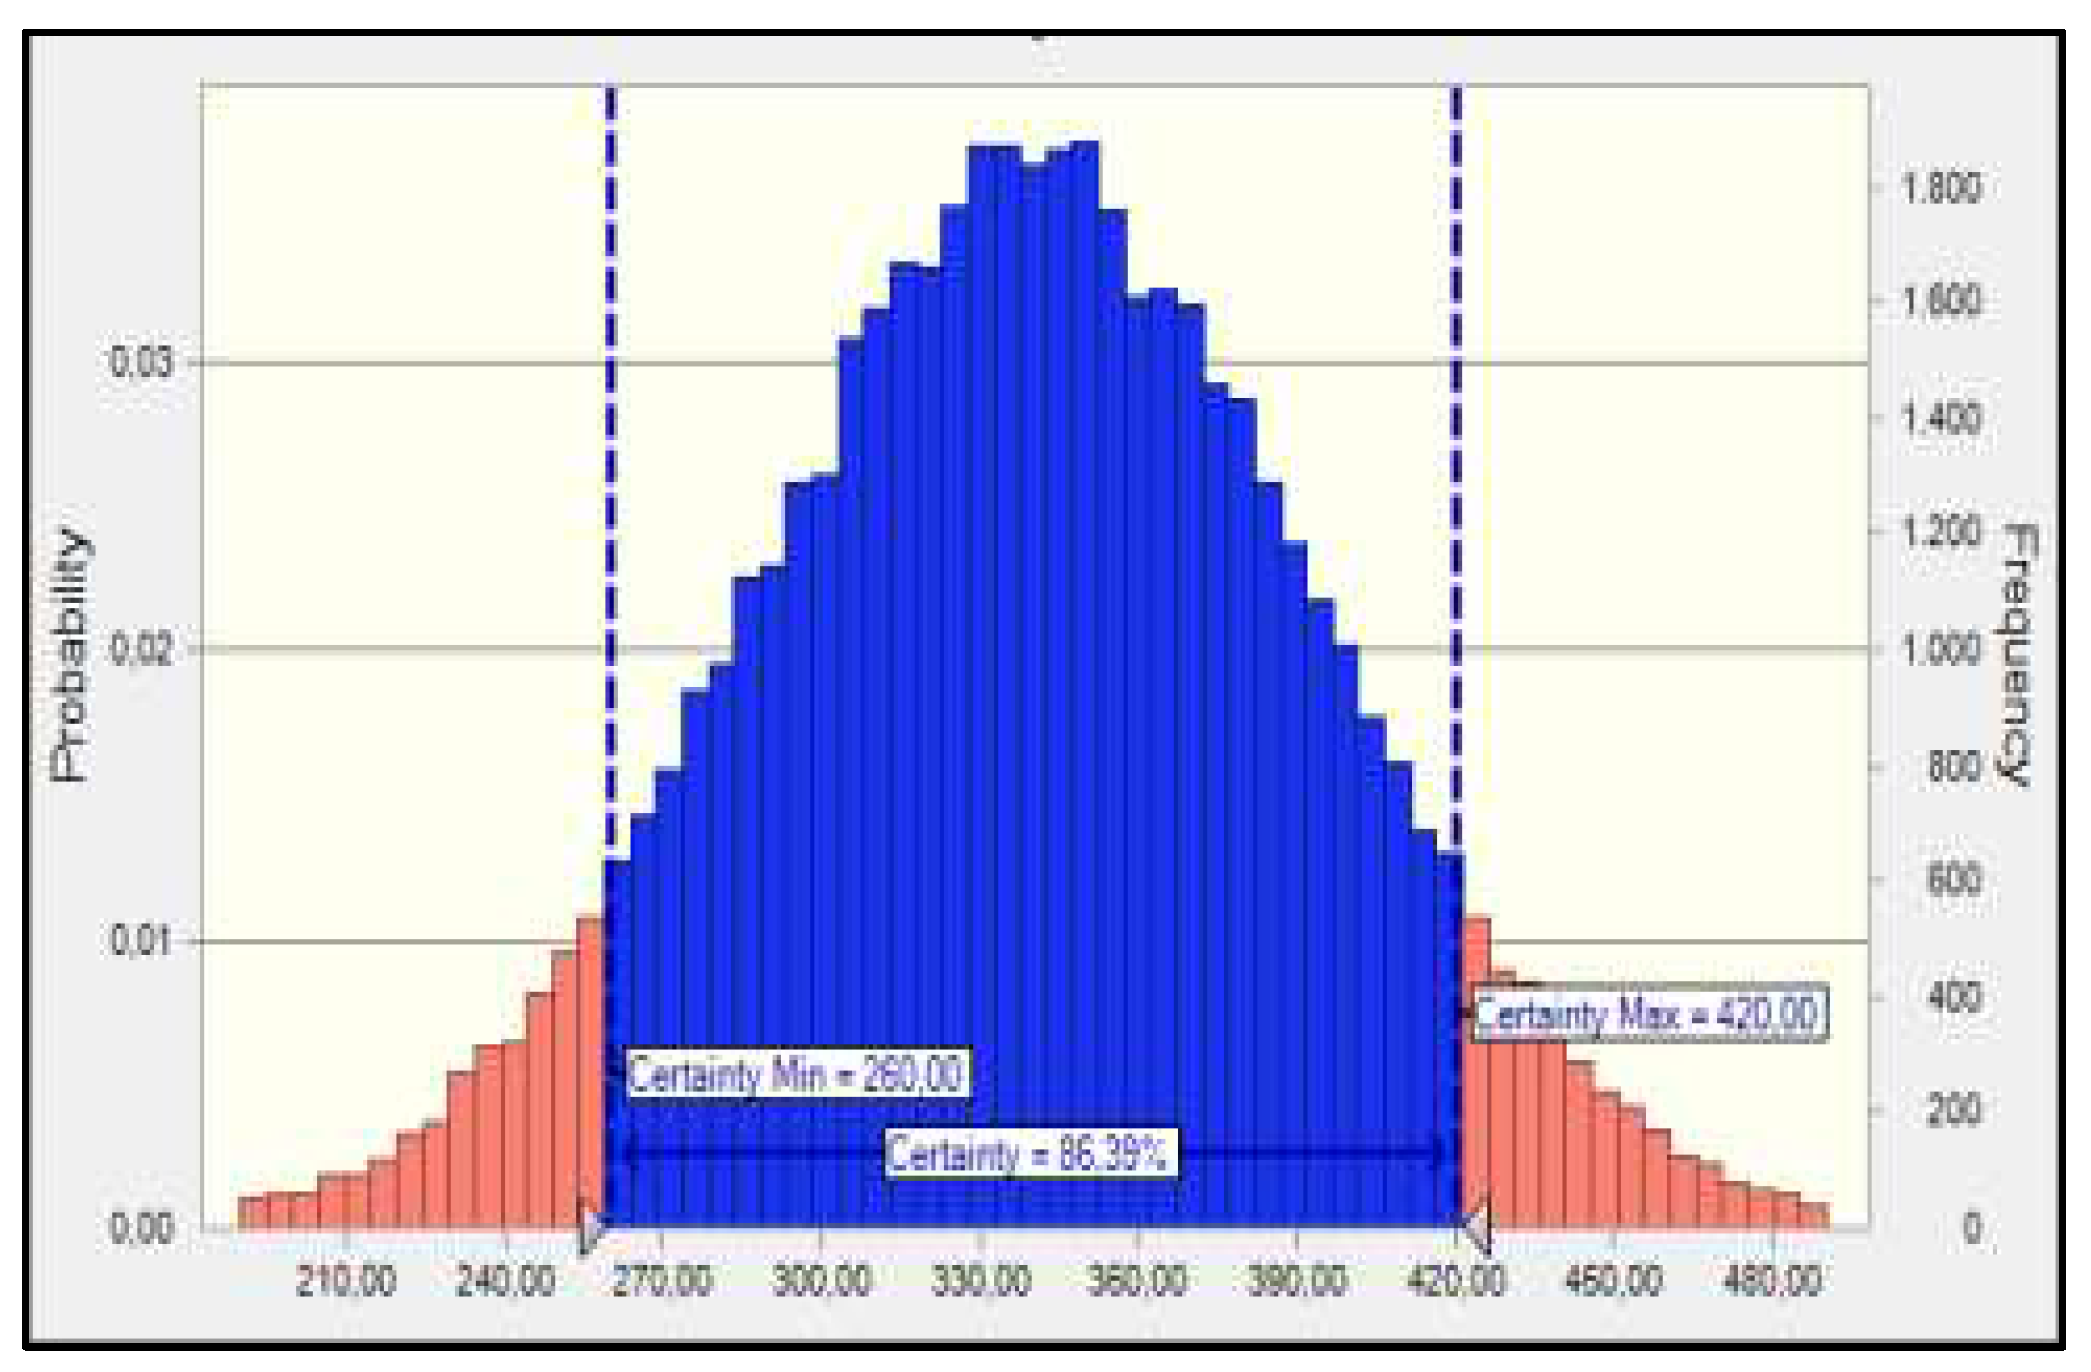
Figure 1. Cumulative frequency graph Total cost soy/hectare.
Preprints 78894 g001
Figure 2. Cumulative frequency graph Total cost corn/hectare.
Preprints 78894 g002
Figure 3. Price trends for the next 24 months of the variables urea fertilizer (3A) and NPK 05-25-25 fertilizer (3B).
Preprints 78894 g003
Figure 4. Price trend for the next 24 months of the variable dolomitic limestone corrective.
Preprints 78894 g004
Figure 5. Price trend for the next 24 months of the fungicide variable Trifloxystrobin Tebuconzole.
Preprints 78894 g005
Figure 6. Price trend for the next 24 months of the variable Soybean seed.
Preprints 78894 g006
Figure 7. Price trend for the next 24 months of the variables tractor driver labor (3A) and day laborer labor (3B).
Preprints 78894 g007
Figure 8. Price trend for the next 24 months of the variable corn price per bag.
Preprints 78894 g008
Table 1. Descriptive measures referring to variables related to the price and cost of production of corn and soybeans from January 2018 to December 2022.
DOIL FUTT HEGL INTL DLLC NPKF DLR SOYB CORB SOYS CORS TRAC DAI PCF URF
N 60 60 60 60 60 60 60 60 60 60 60 60 60 60 60
MIN 0.57 16.95 18.91 29.59 14.8 278.4 3.18 12.61 5.66 0.57 2.33 302.26 13.25 352.38 339.04
MAX 1.41 22.66 92.02 48.68 40.98 1205.24 5.67 36.51 18.53 2.29 4.31 387.01 18.9 1256.63 1201.48
RANGE 0.84 5.71 73.11 19.09 26.18 926.84 2.49 23.9 12.87 1.72 1.98 84.75 5.65 904.25 862.43
MEAN 0.80 19.28 36.22 38.17 25.28 576.043 4.66 22.57 11.27 1.332 3.299 339.33 15.37 602.53 580.38
VAR 0.0586 3.1021 625.35 24.85 64.30 104435 0.5986 72.132 20.392 0.3075 0.114 706.85 2.81 113307.91 85958.13
SD 0.24 1.7613 25.0071 4.9851 8.0191 323.1645 0.77 8.4931 4.5157 0.55 0.33 26.58 1.67 336.61 293.18
CV 30.1% 9.1% 69.0% 13.1% 31.7% 56.1% 16.6% 37.6% 40.0% 41.6% 10.2% 7.8% 10.9% 55.8% 50.5%
SKEW (g1) 1.2158 0.5324 1.3291 0.3488 0.73 0.947 -0.265 0.2153 0.2287 0.4712 -0.2119 0.2294 0.6285 1.0545 1.0692
KURT (g2) 0.0765 -1.2306 0.026 -0.7111 -0.7596 -0.8431 -1.443 -1.7728 -1.693 -1.4971 1.1549 -1.2933 -0.8398 -0.7136 -0.5489
N: sample size (monthly data collected from 2018 to 2022); MIN: minimum; MAX: maximum; RANGE: total range; MEAN: arithmetic mean; VAR: variance; SD: standard deviation; CV: coefficient of variation; SKEW: skewness; KURT: kurtosis; DOIL: diesel oil; FUTT: fungicide trifloxystrobin tebuconazole; HEGL: herbicide glyphosate; INTL: insecticide thiamethoxam lambda-cyhalothrin; DLLC: dolomitic limestone corrective; NPKF: NPK 05-25-25 fertilizer; DLR: dollar exchange rate; SOYB: soybean bag; CORB: corn bag; SOYS: soybean seed; CORS: corn seed; TRAC: tractor operator labor; DAI: daily laborer labor; PCF: potassium chloride fertilizer; URF: urea fertilizer.
Table 2. Financial Analysis of Corn and Soybeans.
Items Description Unit Crop Cost/ha (USD) Cost/ha/corn (%) Cost/ha/soybean (%)
DOIL 36 L/ha Corn/soybean 29,8 4.7 5.8
FUTT 0.750 L/ha Corn/soybean 28,9 4.6 5.7
HEGL 5 L/ha Corn/soybean 36,2 5.8 7.1
INTL 0.750 L/ha Corn/soybean 28,6 4.6 5.6
DLLC 1 T/ha Corn/soybean 25,3 4.0 5.0
NPKF 500 T/ha Corn/soybean 288,0 45.9 56.5
DLR 60 Kg/ha Soybean 10,5 NA NA
SOYB 20 Kg/ha Corn 11,3 NA NA
SOYS 60 Kg/ha Soybean 79,9 NA 15.7
CORS 20 Kg/ha Corn 66,0 10.5 NA
TRAC 2 2 h/ha Corn/soybean 2.83 0.5 0.6
DAI 2 2 h/ha Corn/soybean 3.84 0.6 0.8
PCF 100 Kg/ha Corn 60,2 9.6 NA
URF 100 Kg/ha Corn 58,0 9.2 NA
TCOST NA ha Corn 627.7 NA NA
NA ha Soybean 509.5 NA NA
EPROD 50 bag/ha 60 kg/bag Soybean 22,6 NA NA
91 bag/ha 60 kg/bag Corn 11,3 NA NA
Gross Income USD
Corn 1026,3
Soybean 1128,6
DOIL: diesel oil; FUTT: fungicide trifloxystrobin tebuconazole; HEGL: herbicide glyphosate; INTL: insecticide thiamethoxam lambda-cyhalothrin; DLLC: dolomitic limestone cor-rective; NPKF: NPK 05-25-25 fertilizer; DLR: dollar exchange rate; SOYB: soybean bag; CORB: corn bag; SOYS: soybean seed; CORS: corn seed; TRAC: tractor operator labor; DAI: daily laborer labor; PCF: potassium chloride fertilizer; URF: urea fertilizer.TCOST: Total Cost; EPROD: Expected Yield/Productivity; L: liter; T: tonelada; Ha: hectare; Kg: kilogram. h: hours; NA not applicable. Source: Elaborated by the authors based on Richeti and Ceccon (2020) [56] and IEA (2023) [57].
Table 3. Pearson correlation coefficient (r) and coefficient of determination (R2).
DV IV r R2 DC IV r R2 DC
DOIL Corn 0.72 0.52 Strong Soy 0.81 0.65 Strong
FUTT Corn 0.88 0.77 Strong Soy 0.92 0.85 very strong
HEGL Corn 0.65 0.42 moderate Soy 0.74 0.54 Strong
INTL Corn 0.79 0.64 Strong Soy 0.83 0.68 Strong
DLLC Corn 0.81 0.65 Strong Soy 0.87 0.77 Strong
NPKF Corn 0.80 0.64 Strong Soy 0.86 0.75 Strong
DLR Corn 0.79 0.62 Strong Soy 0.77 0.59 Strong
SOYB Corn 0.92 0.93 very strong Soy 0.97 0.93 very strong
SOYS Corn 0.92 0.93 very strong Soy 0.97 0.93 very strong
CORS Corn 0.15 0.02 negligible Soy 0.27 0.08 negligible
TRAC Corn 0.91 0.83 very strong Soy 0.95 0.90 very strong
DAI Corn 0.87 0.75 Strong Soy 0.92 0.85 very strong
PCF Corn 0.72 0.54 Strong Soy 0.81 0.66 Strong
URF Corn 0.77 0.60 Strong Soy 0.84 0.70 Strong
DV: dependent variable; IV: Independent variable; r: Pearson Correlation Coefficient; R2: coefficient of determination; DC: degree of correlation; DOIL: diesel oil; FUTT: fungicide trifloxystrobin tebuconazole; HEGL: herbicide glyphosate; INTL: insecticide thiamethoxam lambda-cyhalothrin; DLLC: dolomitic limestone corrective; NPKF: NPK 05-25-25 fertilizer; DLR: dollar exchange rate; SOYB: soybean bag; SOYS: soybean seed; CORS: corn seed; TRAC: tractor operator labor; DAI: daily laborer labor; PCF: potassium chloride fertilizer; URF: urea fertilizer.
Table 4. Statistical analysis of the costs of corn/soybean and corn prices.
Statistic D-W Theil' s U
DTN-S Arima (1,1,2) DES DTN-S Arima (1,1,2) DES
NPKF
(soybean)
1.92 1.92 1.97 0.96 0.96* 0.97
URF
(soybean)
Tans Arima (0,1,1) Sed Tans Arima (0,1,1) Sed
1.91 2.0 1.64 0.94 0.92* 0.94
DLLC
(soybean)
DTN-S DMA DES DTN-S DMA DES
1.82 1.76 2.00 0.99* 0.96 0.94
FUTT
(soybean)
DES DTN-S SES DES DTN-S SES
2.00 2.01 2.01 0.98* 0.98 0.98
CORS DES DTN-S SES DES DTN-S SES
1.99 1.99 1.99 0.96* 0.96 0.97
TRAC
(corn/soybean)
DTN-S Arima (0,2,0) DES DTN-S Arima (0,2,0) DES
1.70 2.00 1.70 0.99 0.99* 0.99
DIA
(corn/soybean)
DTN-S Arima (0,2,0) DES DTN-S Arima (0,2,0) DES
1.58 1.82 1.58 0.99 0.99* 0.99
CORB
(corn/soybean)
DTN-S Arima (1,1,1) DES DTN-S Arima (1,1,1) DES
1.99 1.85 1.61 0.99 0.94* 0.99
Statistical D-W: Durbin-Watson; DTN-S: Damped Trend Non-Seasonal; DES: Double Exponential Smoothing; DMA: Double Moving Average; SES: Single Exponential Smoothing; NPKF: NPK 05-25-25 fertilizer; URF: Fertilizer Urea; DLLC: dolomitic limestone corrective; FUTT: fungicide trifloxystrobin tebuconazole; CORNS: corn seed; TRAC: tractor operator labor; DAI: daily laborer labor; CORB: Corn bag.
Disclaimer/Publisher’s Note: The statements, opinions and data contained in all publications are solely those of the individual author(s) and contributor(s) and not of MDPI and/or the editor(s). MDPI and/or the editor(s) disclaim responsibility for any injury to people or property resulting from any ideas, methods, instructions or products referred to in the content.
Copyright: This open access article is published under a Creative Commons CC BY 4.0 license, which permit the free download, distribution, and reuse, provided that the author and preprint are cited in any reuse.
Prerpints.org logo

Preprints.org is a free preprint server supported by MDPI in Basel, Switzerland.

Subscribe

© 2024 MDPI (Basel, Switzerland) unless otherwise stated