Preprint
Article

New Dimensions Regarding Demographic Behavior and Family Stability in Romania and Bihor County: A Comparative Analysis

Altmetrics

Downloads

129

Views

50

Comments

0

Submitted:

12 July 2023

Posted:

13 July 2023

You are already at the latest version

Alerts
Abstract
A nation's vitality, dynamism and economic strength will always be related to its demographic component, and a healthy and vigorous population will ensure its long-term future. However, the current realities demonstrate the existence of an obvious population decrement at the level of the entire country particularly triggered by the birth rate decrease and the high demographic aging to which other factors add ap specific to local communities, which in their turn determined a particular type of demographic behaviour. Therefore we aim to analyze those elements with a major population dynamics impact such as family stability and demographic potential that can generate a specific demographic behaviour, as a result of the major changes that have occurred in the last period of time. These elements are translated through several demographic indicators that characterize the family, such as the nuptiality index and the divorce index whose evolution was registered and analyzed for the period 1992-2021. Their evolution indicates the demographic potential of Romania, as well as of Bihor county.
Keywords: 
Subject: Environmental and Earth Sciences  -   Geography

1. Introduction

The situation of Romania's economic, social and political life in the last three decades of the post-communist period left its mark directly or indirectly on the population distribution and demographic growth.
Demographic behaviour, as an essential element in the evolution of Romania's population, had a relatively natural course until the years 1960-1965, after which an aggressively controlled one followed, imposed by the country's communist regime [1,2,3,4,5,6]. In the post-communist period, we notice an obvious tendency to return to the meanings before the years 1966-1967 [7]. As a rule, it is dimensioned and structured according to the successive intervention of local communities specific factors and is appreciated in relation to the receptivity of influences from the outside or at the level of basic components. Among the most stable demographic behaviour components, we consider those related to the natural phenomena of human evolution, respectively, the number of marriages, considering the relatively equal proportion between the two sexes and the share of fertile women in the total female population [7]. Divorces are among the elements that introduce distortions in the evolution of demographic phenomena. These two demographic components can vary temporally and spatially depending on the economic situation, social and political factors, where the legislation in the field plays an important role and last but not least, the factor related to the mentality of the individual, respectively family couples.
So, among the basic synthetic indicators that can be used in order to analyze the demographic behaviour, the demographic potential and the stability/instability of family couples stand out.

2. Theoretical framework

The problems related to demographic behaviour, with the elements that define it (birth rate, fertility, nuptials, divorce, etc.), represent research topics for a very wide range of researchers in the field of sociology, demography, geography or other related fields. Some of these demographic components have always influenced the phenomenon of demographic transition, which has been a priority area for researchers to develop theories, such as the demographic transition theory formulated by W.S. Thompson [8] and H. Leibenstein [9] or J. Geddes and K. Muir [10], to which we also add the contribution of Trebici [11].
In the present study, we did not aim for a strict demographic transition approach, but rather a comparative analysis of the Romanian population demographic behaviour aspects, then transposed to the county level, i.e. Bihor county. In this sense, we will only refer to certain approaches focused on those components that lay at the basis of Romania's demographic behaviour. Among the many studies dealing with various demographic aspects with implications on the Romanian population demographic behaviour, those of the renowned demographer V. Trebici [12,13,14] can be mentioned. A much more concrete study, focused directly on the demographic behaviour of Romanian cities belongs to the geography authors I. Ianoș and L. Guran [7]. The problems related to the demographic crisis in Romania, highlighted by the analysis of some essential components, such as: birth rate, fertility, marriage rate, divorce rate or the phenomenon of demographic aging have been topics of scientific research among sociologists T. Rotariu [15,16,17], T. Rotariu, L. Dumănescu & M. Hărăguş [18] or O. Cucu-Oancea [19]. The demographic evolution, the current demographic situation (demographic decline) and the demographic perspectives of the Romanian population are analyzed and explained by the demographer V. Ghețău [20,21,22] and D. Sandu [23]. The tendency of the deterioration of the components that reflect the demographic behaviour of the Romanian population is also studied by A. Ilieș [24], A. Ilieș & M. Stașac [25], A. V. Litră [26], M. Stupariu & I. Josan [27], M. Stașac & L. Bucur [28], M. Drăgan [29], C. Filimon [30], M. Stupariu [31], L. Guran-Nica [32], R. Linc, I. Dincă, M. Stasac, C. F. Tătar & L. Bucur [33], M. Ropa [34], L. A. Deac, G. V. Herman, M. Gozner, G. C. Bulz & E. Boc [35], C. F. Tătar, I. Dincă, R. Linc, M. I. Stupariu, L. Bucur, M. S. Stașac & S. Nistor [36] and the demographic risk J. Benedek [37], V. Surd, V. Puiu, V. Zotic, & C. Moldovan [38], I. Muntele [39].

3. Materials and Methods

For the accomplishment of this study, we mainly used the primary statistical data provided by the National Institute of Statistics, namely the Tempo-online series, for the period 1992-2021. With the help of these data, corroborated with information from the specialized literature, the main objective of the study is to make the demographic evolution model to which Romania currently subscribes, highlighting the particularities of Bihor county in the northwest of the country, but also outlining some risks demographic (i.e. family instability risk).
We used a methodological flow in which we find the statistical method by which these data were processed through the Excel program, the result being rendered in the form of evolutionary diagrams, and the cartographic representation (i.e. the demographic potential index map and family stability rate map) at national and local level was carried out using the GIS work tool that facilitates the interpretation of the statistical material, but also acts as a source of new data.
These are accompanied by the comparative method by which the main demographic indicators that influence demographic behaviour and family stability are analyzed on two scalar levels: on a macro scale, Romania is analyzed, and on a lower scalar level, Bihor county with its demographic peculiarities. Thus, we took into account two simple indicators that characterize family phenomena [19], represented by nuptiality and divorce, as well as the composite indicator represented by the demographic potential on the basis of which the family instability risk map was created.
The targeted time period is during 1992 and 2021. The data used for the demographic analysis are taken from the National Institute of Statistics of Romania, Statistical Databases section: Tempo-Online [40]. These refer to the total population by residence on 1st July of each year, the number of marriages, the number of divorces, the female population and the female population of childbearing age (i.e 15-49 years). Based on these data, demographic indices were calculated: family stability/instability, marriage rate, divorce rate and demographic potential.
These refer to: the total population by residence on 1st July, the number of marriages, the number of divorces, the female population and the female population of childbearing age (15-49). Based on these data, demographic indices were calculated: family stability/instability, marriage rate, divorce rate and demographic potential.
The work starts from the hypothesis that the structure of the female population, especially the fertile contingent, influences the demographic potential of a geographical area. It can undergo a series of changes over time, generating a certain demographic stability or instability. Hence the second hypothesis according to which the element of stability is determined by the intensity of marriages, respectively the nuptiality index, while instability can be caused by the phenomenon of divorce.

4. Results and Discussions

In order to be able to observe the demographic behaviour manifestation, both at the national and local level, respectively the case of Bihor county, we focus on the analysis of some representative demographic indicators, namely the demographic potential index, which can be evaluated as a result of the ratio between the number of women of fertile age and their total number, then the marriage rate and the divorce rate, through which the intensity of marriages and divorces is shown at the national and local level.
The evolution of the main demographic behaviour components in the last three decades reveals the disruptive character of external interventions, especially of a legal-legislative nature [7]. The goal of the old totalitarian regime to "standardize" living conditions, in parallel with a family planning system based on pronatalist influences did not yield the expected results at the level of the entire country. Thus, the western part of Romania and especially Banat (Caraș-Severin and Timiș counties, partly also Arad) remained at a “Banațean” type traditional demographic behaviour, based on low values of birth and mortality, so with a natural balance close to zero or even negative, resulting in slow population growth. At the opposite pole, the rest of Romania's territory and especially the north-eastern part (counties in the region of Moldova) complied with the legal laws adopted by the state, the result being the spectacular increase in the birth rates values and their maintenance across time until the fall of the communist political system.
The transformations that took place after the 1990s in the political and economic system, in social life, but also in people's mentality, once again influenced the population’s demographic behaviour. Thus, along with the pro-natalist laws repeal, it was possible to note that, against a generalized economic conditions’ deterioration background of the standard of living a normal demographic behaviour is returning, without great differences between the regions that once adopted pro-natalist policies, respectively with traditions totally opposite in terms of family planning [41].
Along with the new evolution trends of the main demographic indicators after 1990, Romania intrinsically aligned itself with the Western countries demographic models. Thus, we can note, on the one hand, that birth and fertility rates are clearly decreasing, while divorces, the age of couples at first marriage and the age of the mother at first birth have increased [42].

4.1. Demographic potential

A territory’s demographic potential index can be evaluated by the relationship that is established between the number of women of childbearing age and the total number of the female population. Indirectly, through this indicator, the degree of vitality of a population can be expressed, as well as the real possibilities of its regeneration [7].
Therefore, the female population evolution and structure, and especially of the female population of childbearing age can influence the fertility phenomenon, generating a certain type of demographic behaviour. There is an interdependence between fertility and birth rate, in the sense that the intensity of fertility influences the birth rate level.
The female population of Romania in the last 30 years is part of the general trend of demographic decline as the total population. Thus, according to the data from 1992 there were 11,733,975 women registered out of a total of 23,126,797 inhabitants (50.7%), in 2021 its number decreased to 11,285,967 women, but with a more obvious weight compared to the male population (51.2%) out of a total of 22,046,917 inhabitants. It is a deficit of the female contingent of -480,008 women, which means a rate of decrease of -3.8% over the entire mentioned period (i.e. 1992-2021).
The female population of childbearing age registered a slight increase in the period 1992-2004, from 5.6 million to 5.9 million, due to the reaching of the female reproductive age born before 1990. After 2004, a downward trend follows, reaching 5,167,438 women of childbearing age in 2021, one of the main causes being female emigration after Romania's accession to the EU (Figure 1).
Analyzing the demographic potential index at the level of Romania starting from the post-December period, respectively the year 1992 and until the year 2021, a decrease in its values can be observed from 48.1% in 1992 to 45.8% in 2021 (Figure 1). In this negative trend, a peak (51.3%) can be identified in 2004, against the background of a growing female population of fertile age.
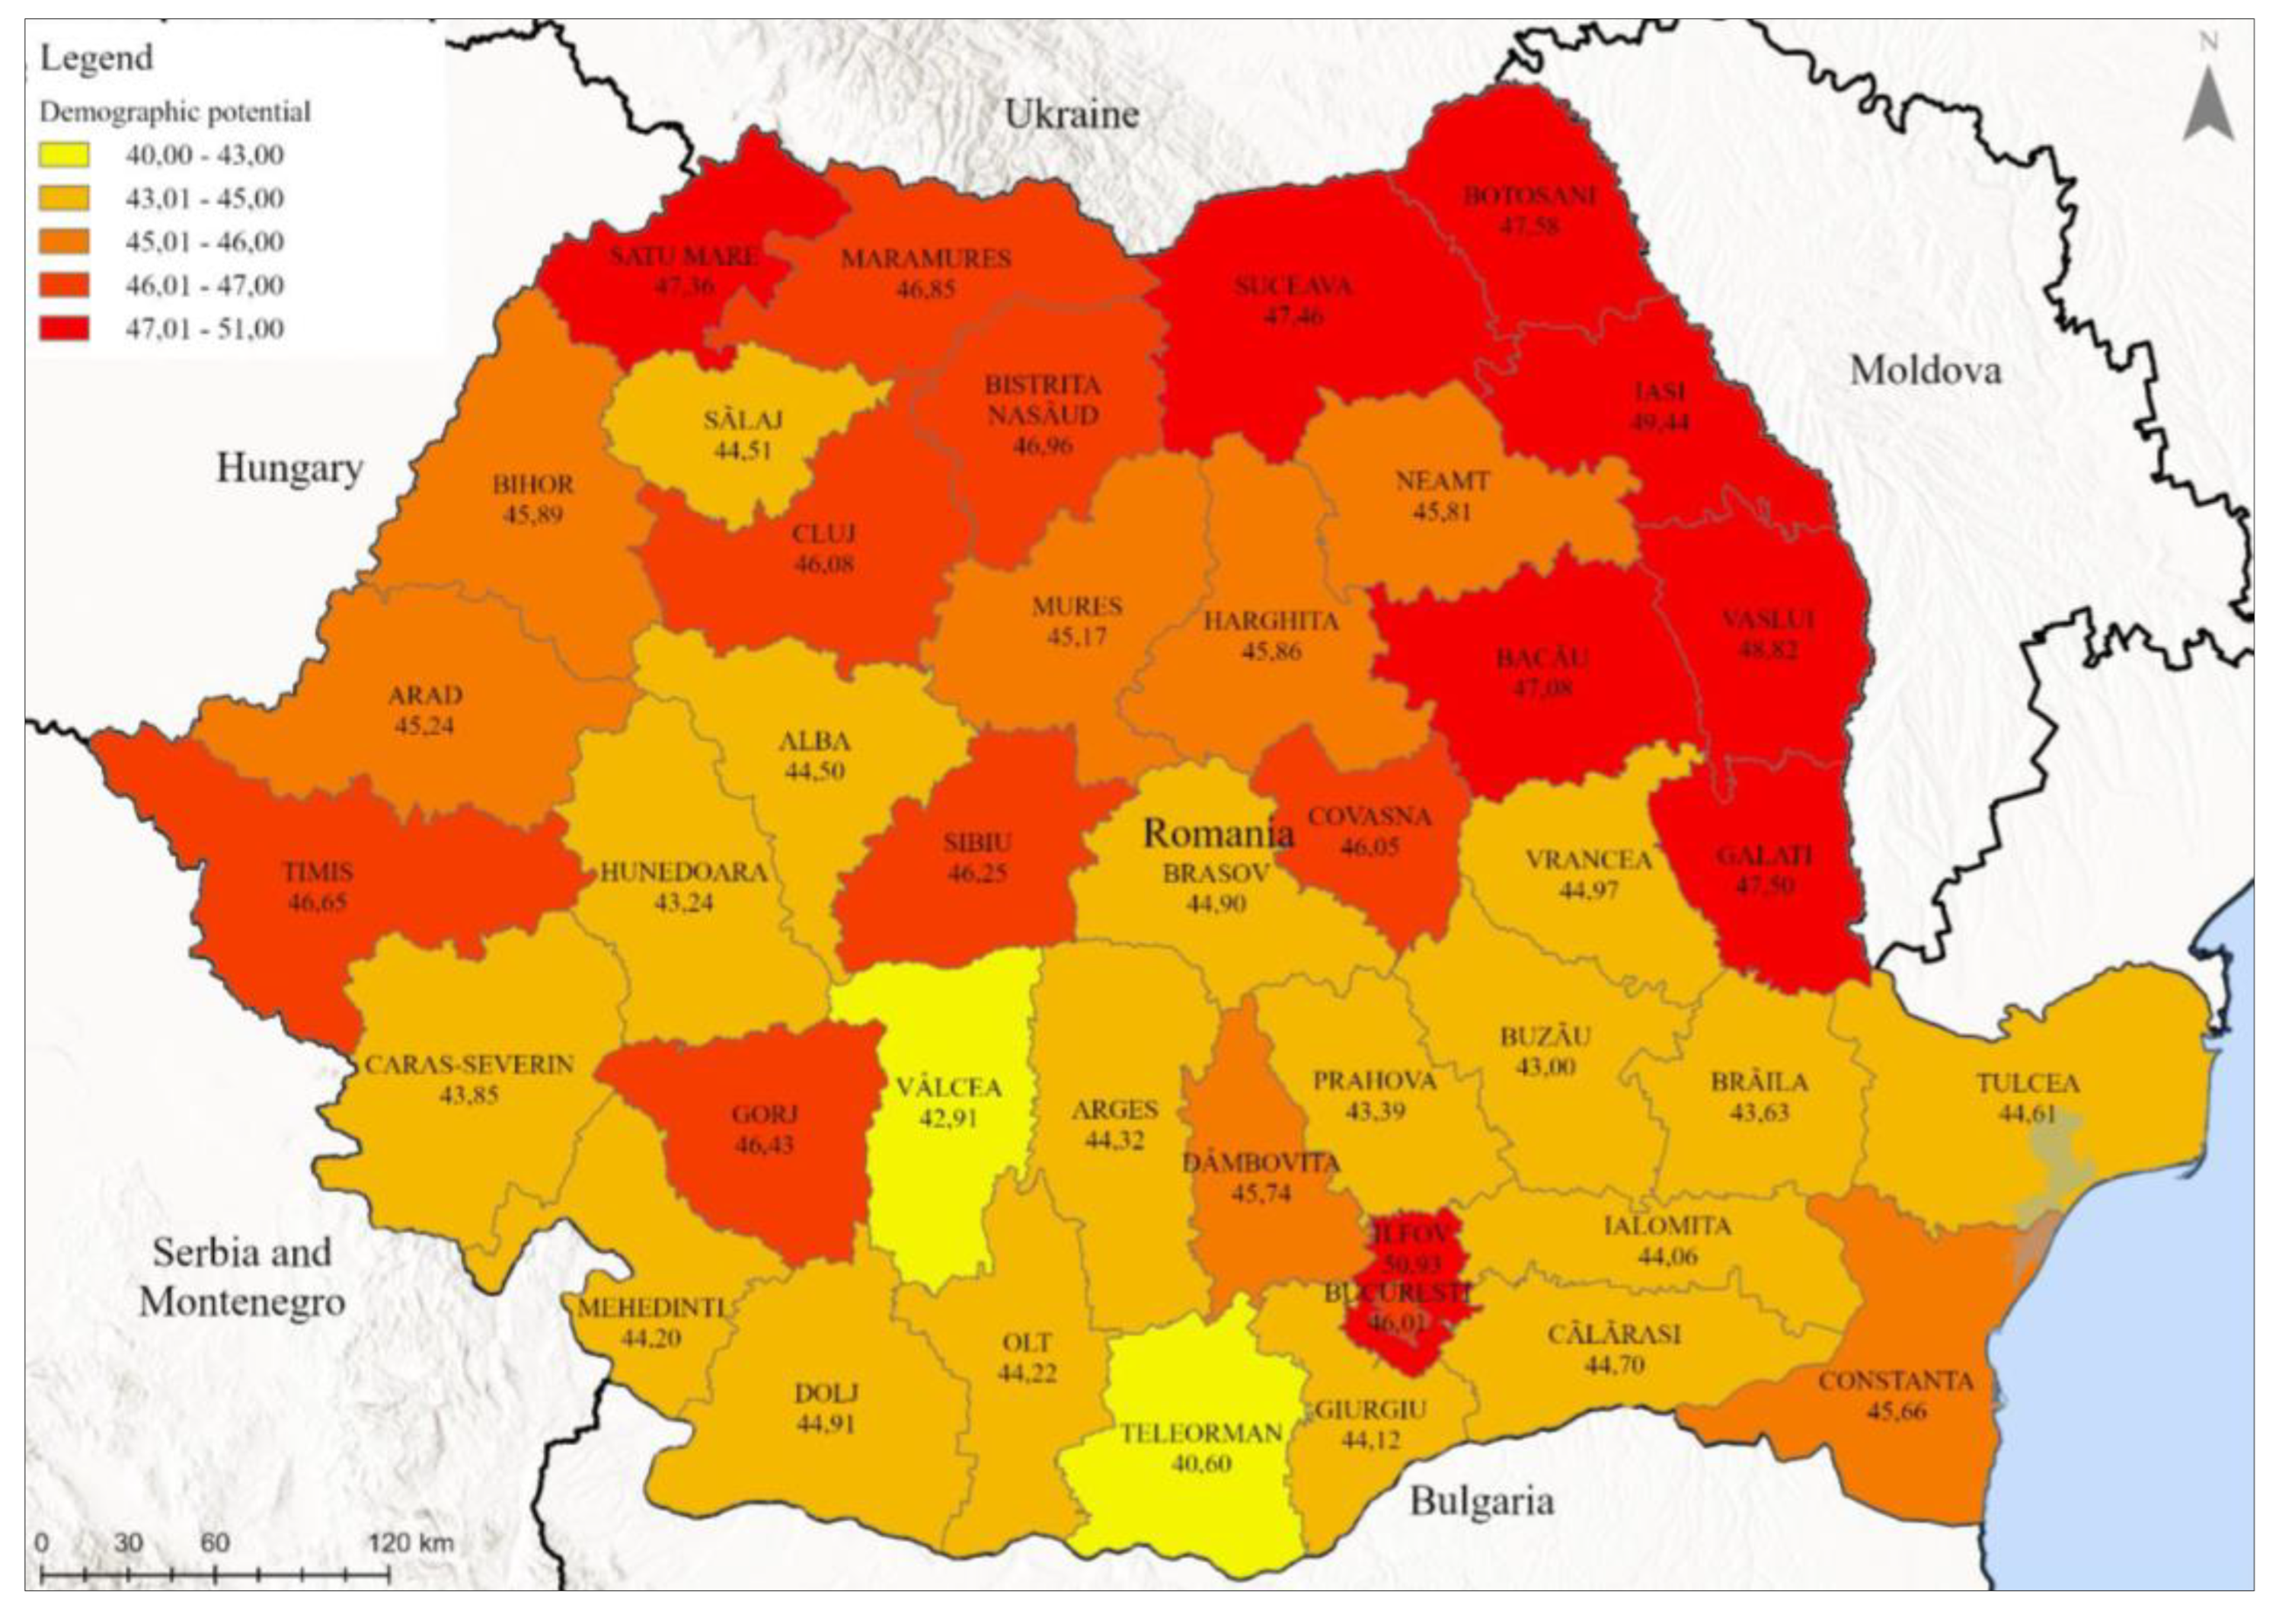
For the recent period of 2021, above-average values were recorded in the counties in the north-east of the country where the value of this index exceeds 47%, (i.e. the counties of Iași with 49.4% and Vaslui with 48.8%). This higher level of the demographic potential index for these counties indicates a higher degree of vitality of the population, a consequence of a traditional demographic behaviour still with higher birth rates than mortality rates (procreative behaviour - children are considered, a support for old age, the phrase is frequently encountered: "to have someone to give me a cup of water in my old age"). The young and especially female segments of the population are quite significant, delaying, to some extent, the demographic aging phenomenon. However, the highest value of this index was recorded in Ilfov county (50.9%) in southern Romania (Figure 2). The vitality increment in this county occurred against the background of an internal migratory movement, from neighbouring counties more sensitive in terms of economic development, thus contributing to the increase in the number of inhabitants both naturally (i.e. positive natural balance) and migratory.
Values close to the average or below it are registered by the vast majority of counties in the center, west, south and southeast of Romania. The lowest value of the demographic potential index is registered by Teleorman county (40.6%), followed by Vrancea (42.9%). In general, the lower degree of vitality appears in counties with less economic development and especially the young able-bodied population preferred to migrate either to more developed counties or outside the borders. Thus, a demographic deficit occurred, including women with an emphasis on the young segment that should contribute to demographic growth.
At a lower scalar level, for Bihor county, the demographic potential index has a similar evolution to that of Romania. Three distinct evolution intervals can be noted: during 1992-2004 this index is slightly lower than at the national level, during 2004-2017 the difference between the two diminishes and in the interval 2017-2021 the values of this index are approximately identical. At the level of 2021, a value very close to the Romanian average is highlighted (45.9% in Bihor county, compared to 45.8% in Romania), which shows a population average vitality degree (Figure 1).
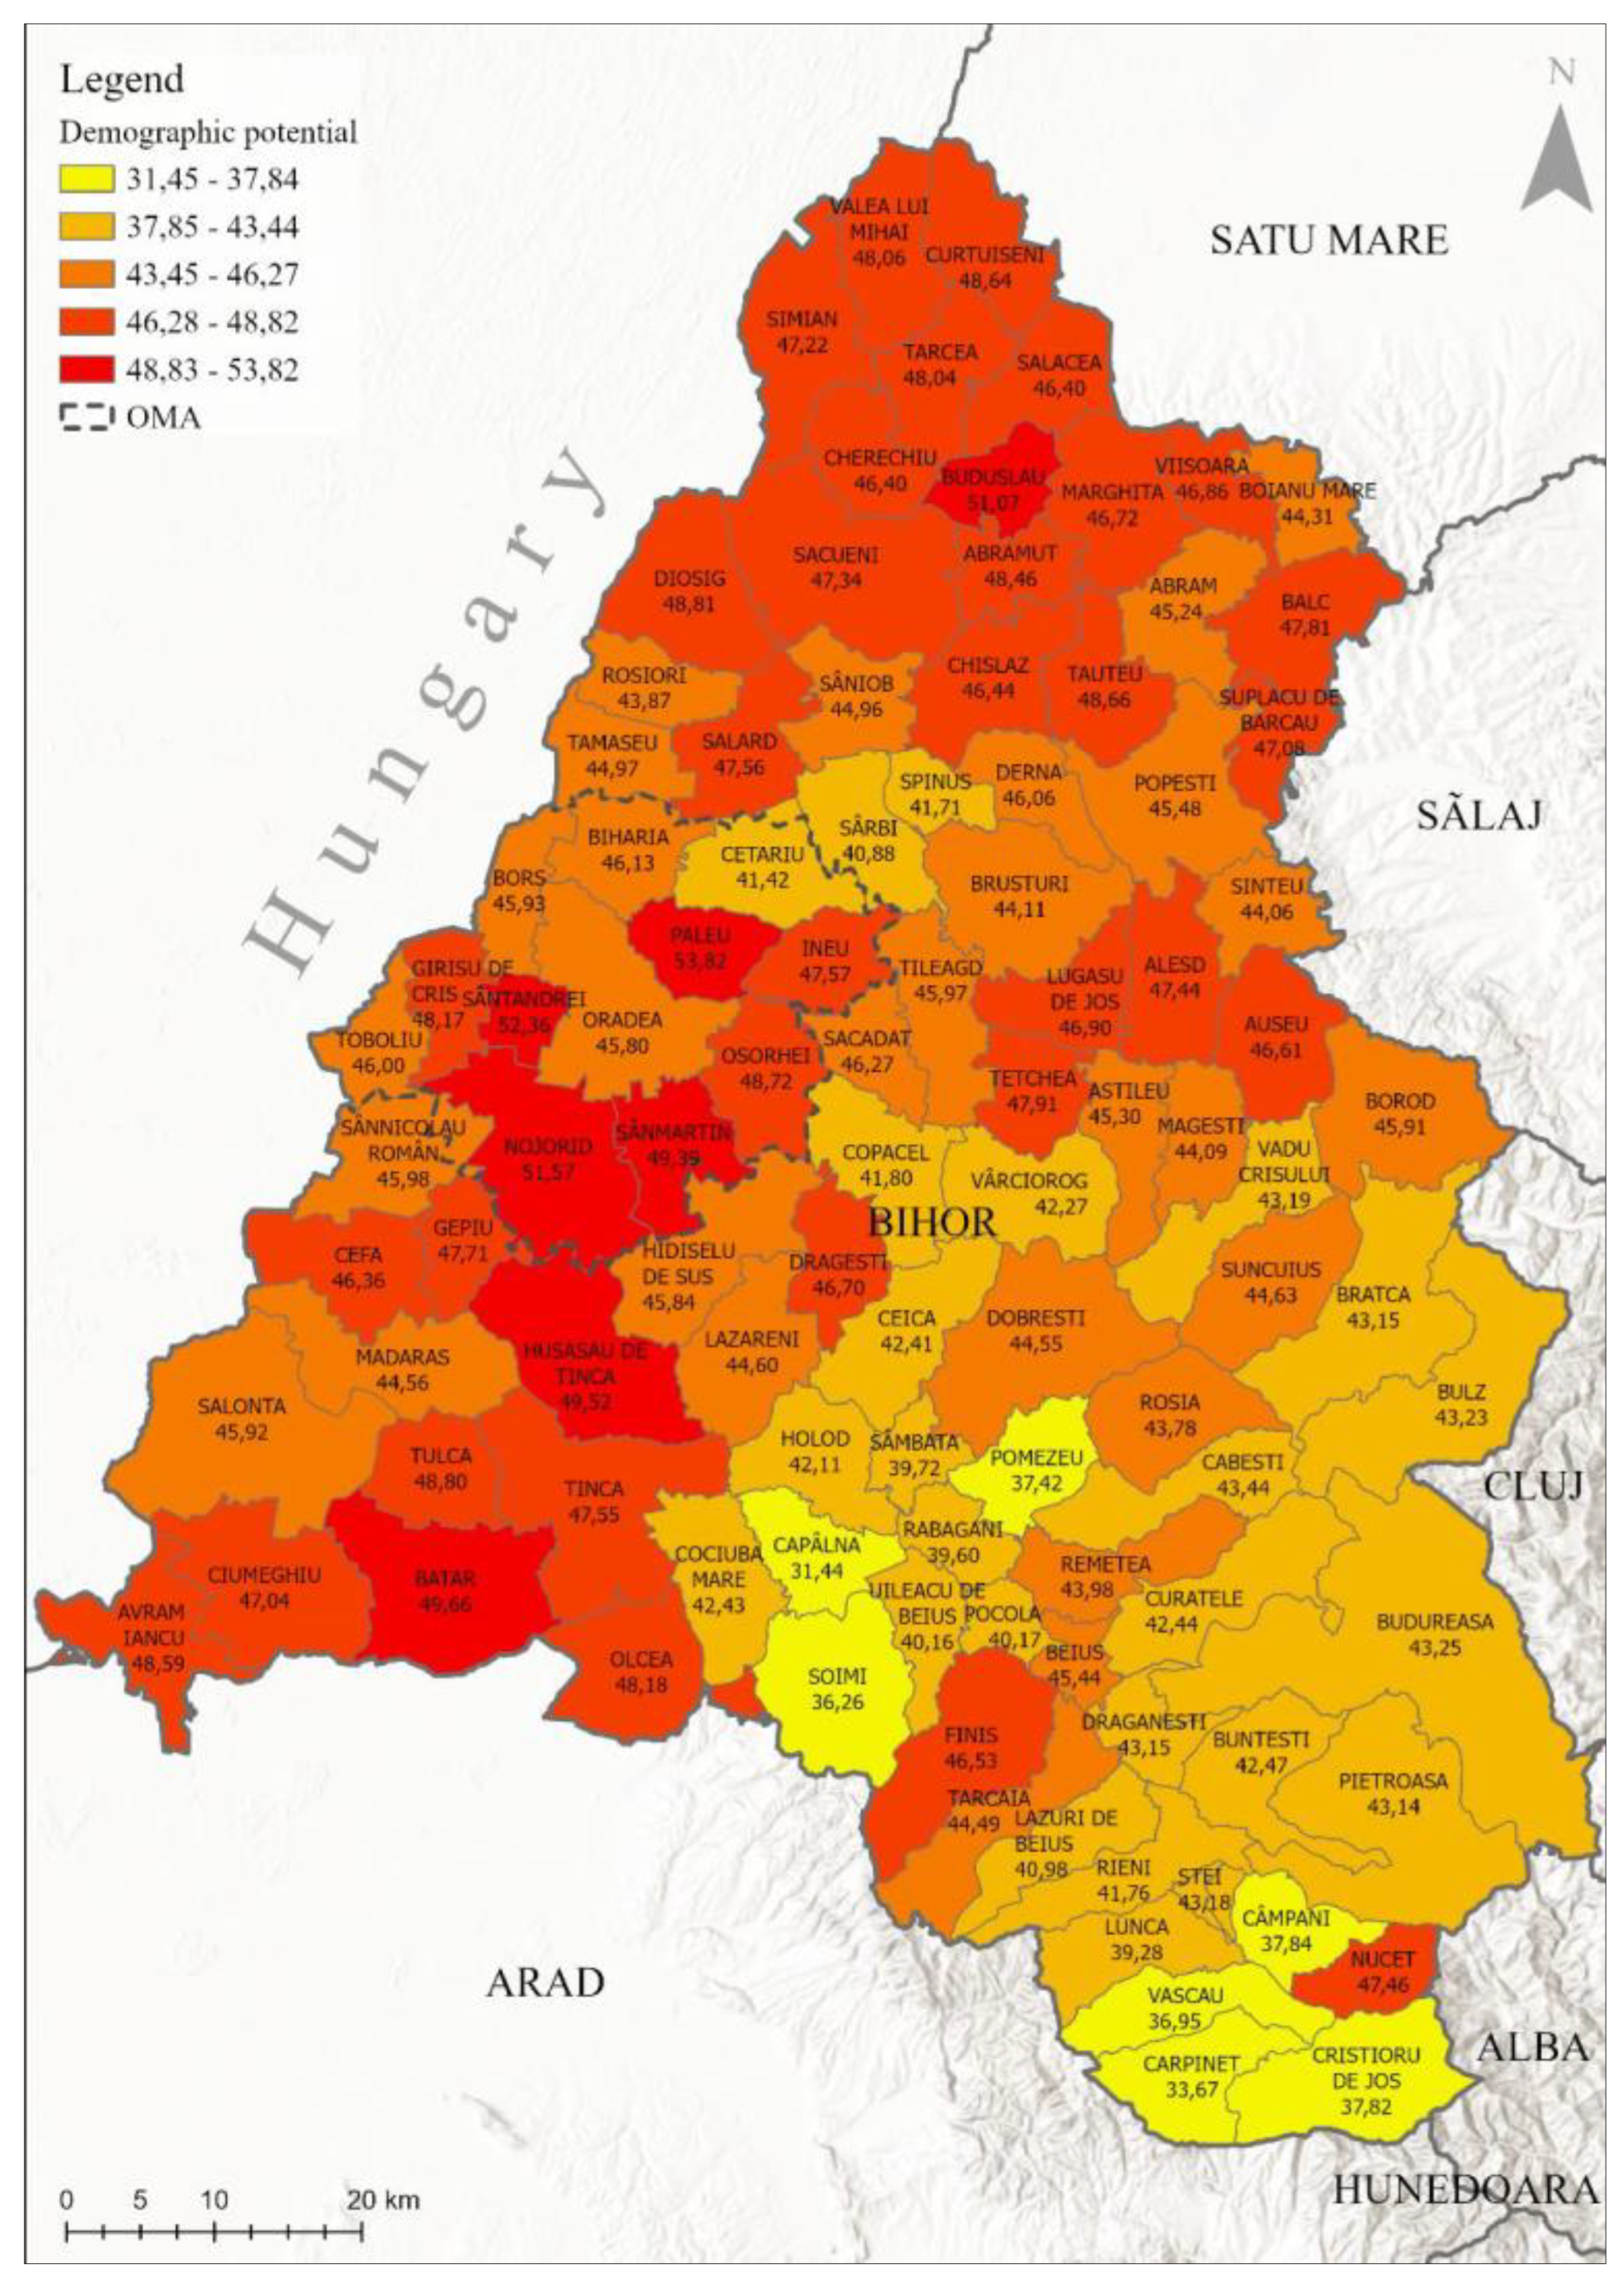
In Figure 3 it can be seen that the highest demographic potential values are found in the urban environment, with values over 47% (Valea lui Mihai with 48.1%, Aleșd with 47.4%, Săcuieni with 47.3%), but also in the area corresponding to the Oradea Metropolitan Area (the communes of Paleu with 53.8%, Sântandrei with 52.4%, Nojorid with 51.6%, Sânmartin with 49.4%, Oșorhei with 48.7%). If the municipality of Oradea is characterized by an average demographic potential index (45.8%), the peri-urban communes that form the metropolitan area have higher above average values which indicates a higher vitality degree. Benefiting from the advantageous geographical position, located in the immediate vicinity of Oradea municipality, these communes play the role of genuine "bedroom" type localities, many residents, especially young people, preferring to settle here, to the detriment of the much more congested municipality of Oradea.
At the opposite end, the lowest population vitality and regeneration degree can be registered in the communes close the mountain area, especially those in the southern and southeastern extremity of Bihor county, with values between 30-40% (i.e. Căpâlna 31.4%, Cărpinet 33.6%, Șoimi 36.2%). They are characterized by a high degree of population aging, including the female population. In this sense, the contingent of the young female population under the age of 15 is less significant than that of the female population over 50 years of age and we are thus witnessing the demographic aging process setting in which, to the extent of its increment, may lead to some of these localities depopulation.

4.2. Familial Stability/Instability
Family stability is an important demographic behaviour feature. This indicator was analyzed through the lens of the ratio between the number of divorces and the number of marriages, which can be expressed in the form of an inversely proportional global indicator. More precisely, it is about the index of family instability, which can highlight a more or less conducive state to demographic growth [7].
Taking into account the analysis of two emblematic demographic indicators (marriage and divorce rate), it will be possible to particularize and explain certain territorial differentiations of the population demographic behaviour both at the national and regional level, respectively, Bihor county, in our case.
The nuptials study is of particular importance in demographic research, constituting an important birth phenomenon premise. Marriage is a natural act in the evolution of society and normally results in offspring, leading to obvious population growth. At the individual level, the organization of married life, respectively, the formation of a family represents for most young people an important event of personal achievement.
Seven to eight decades ago, Romania was based on a traditionalist cultural-family model in which marriage, family and religion represented the main moral and spiritual values of the population which led to an increase in the number of births and consequently to a demographic growth. Across time, along with the modernization of society and the young generations of the last three to four decades, we witness a series of changes in family behaviour as well, generated by the numerous social, economic, cultural and political transformations [41]. Thus, family behaviour based on certain traditional rules of family formation and organization, marriage relations, the predominance of the nuclear family, has now been replaced by a diversity of alternative family models, such as postponing marriage until older ages (after the age of 30), cohabitation, celibacy, the desire to have as few children as possible (one-maximum two or maybe none), etc. All this leaves its mark on a regressive demographic behaviour and thus, instead of having a demographic growth, on the contrary we are faced with a population decrease against the background of an increase in the degree of demographic aging.
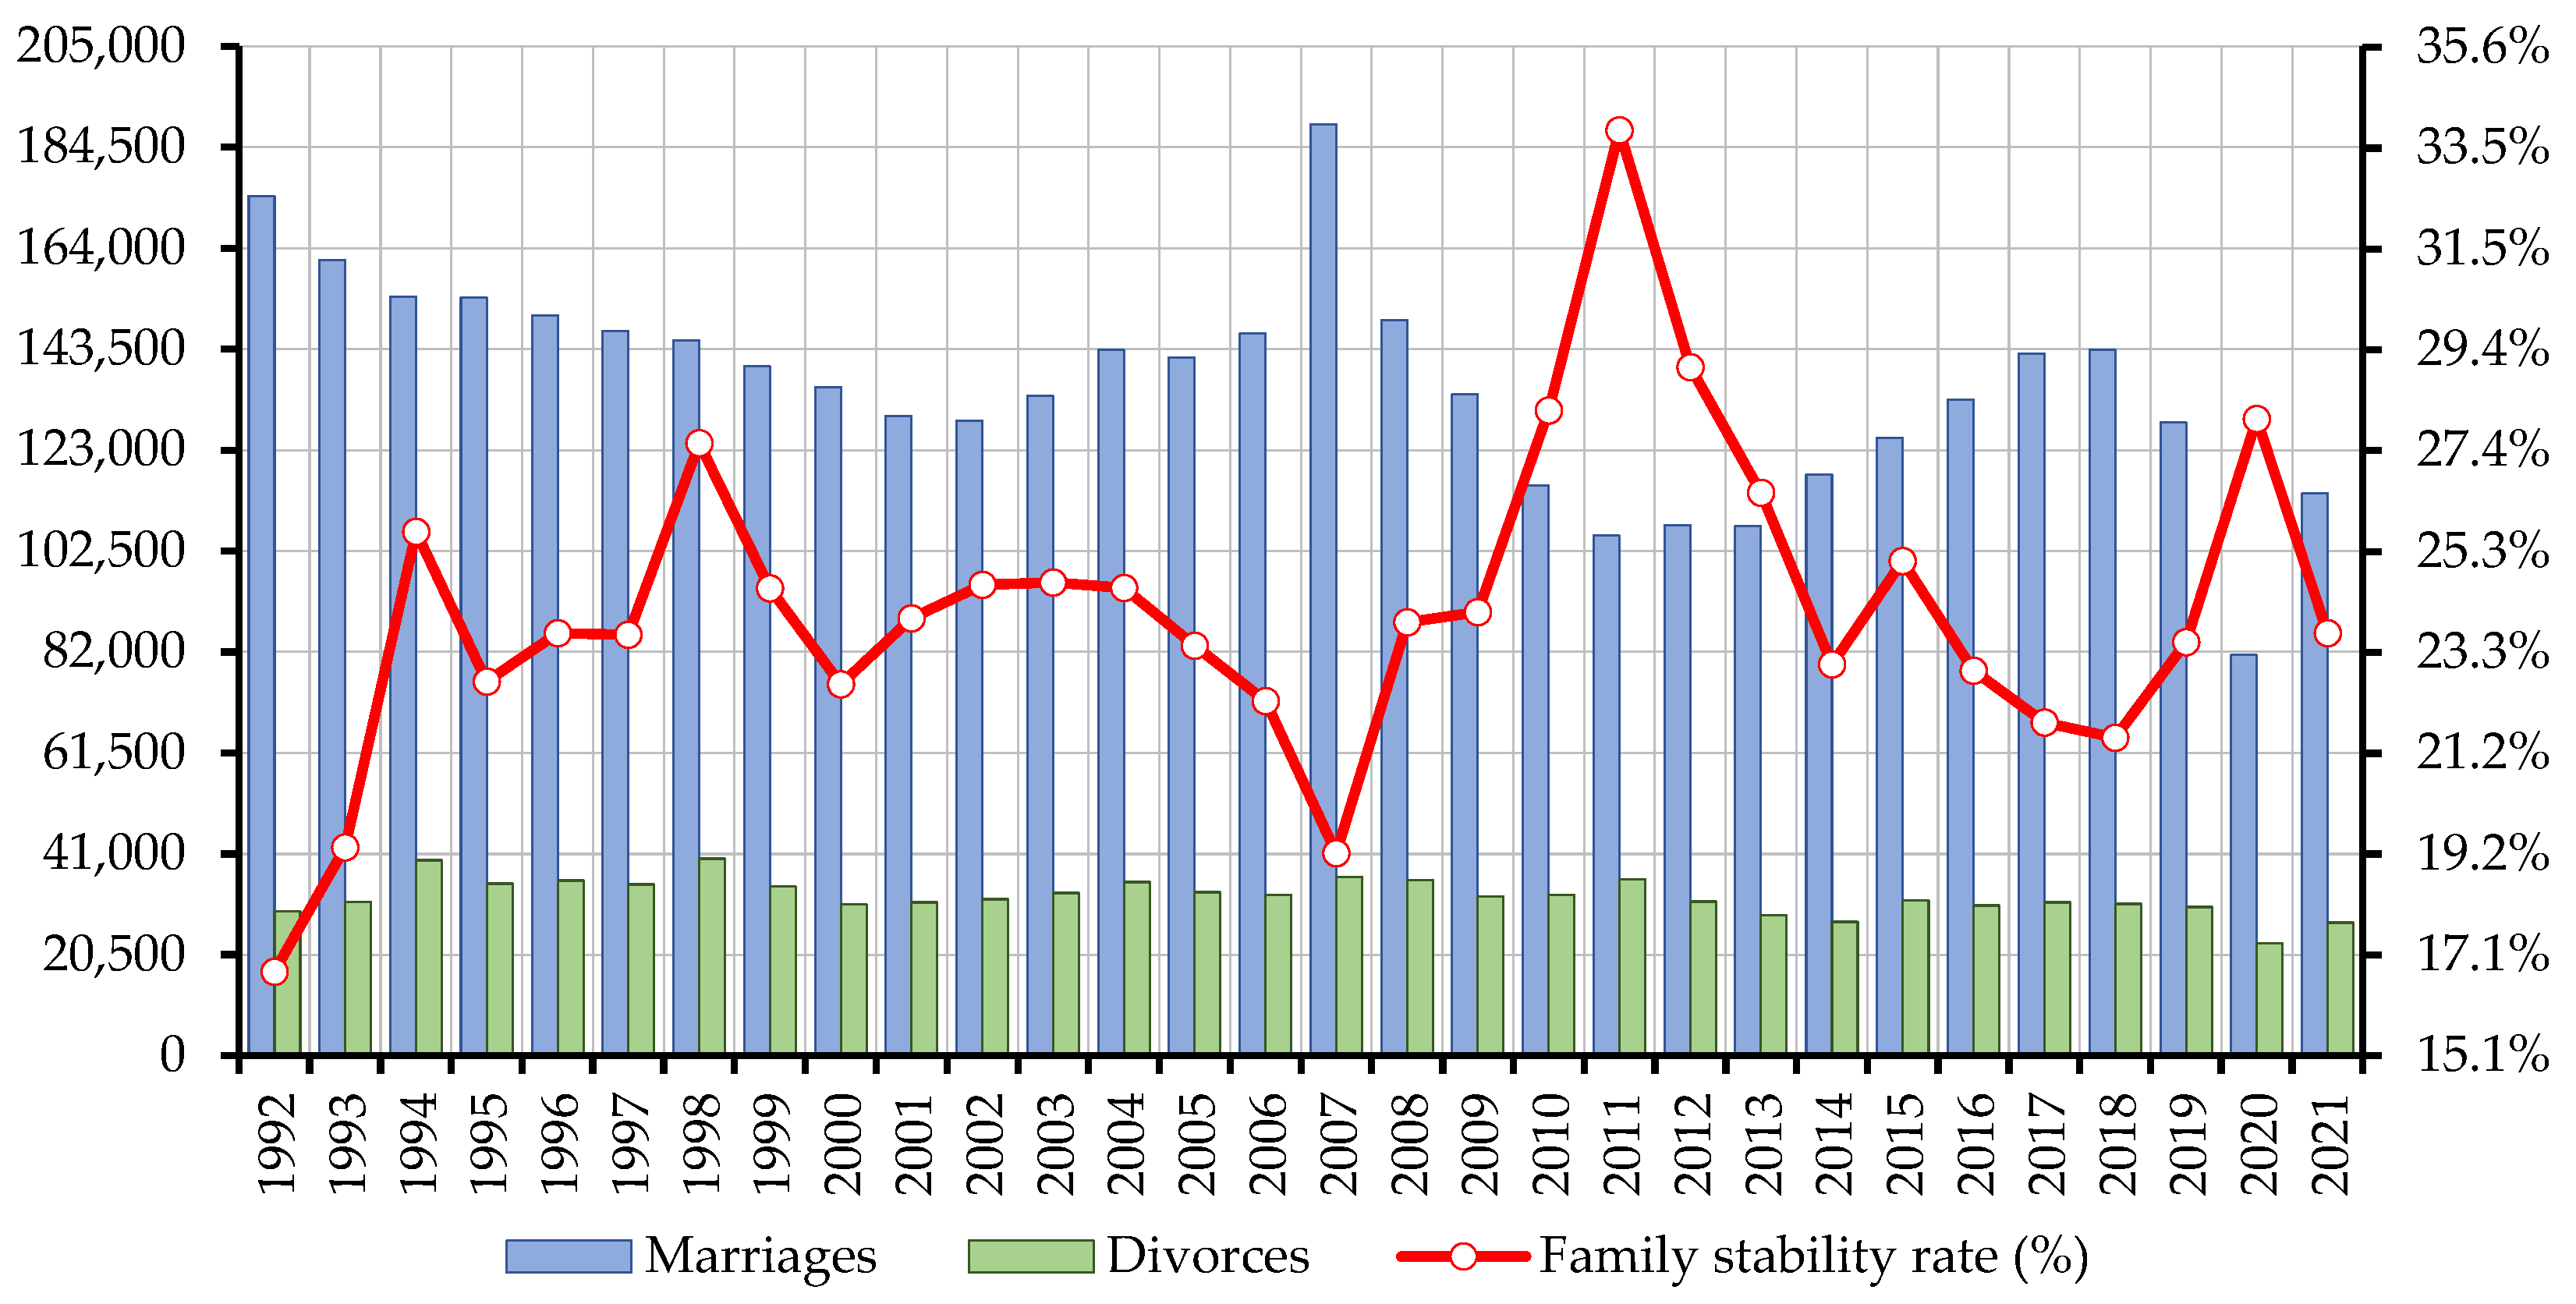
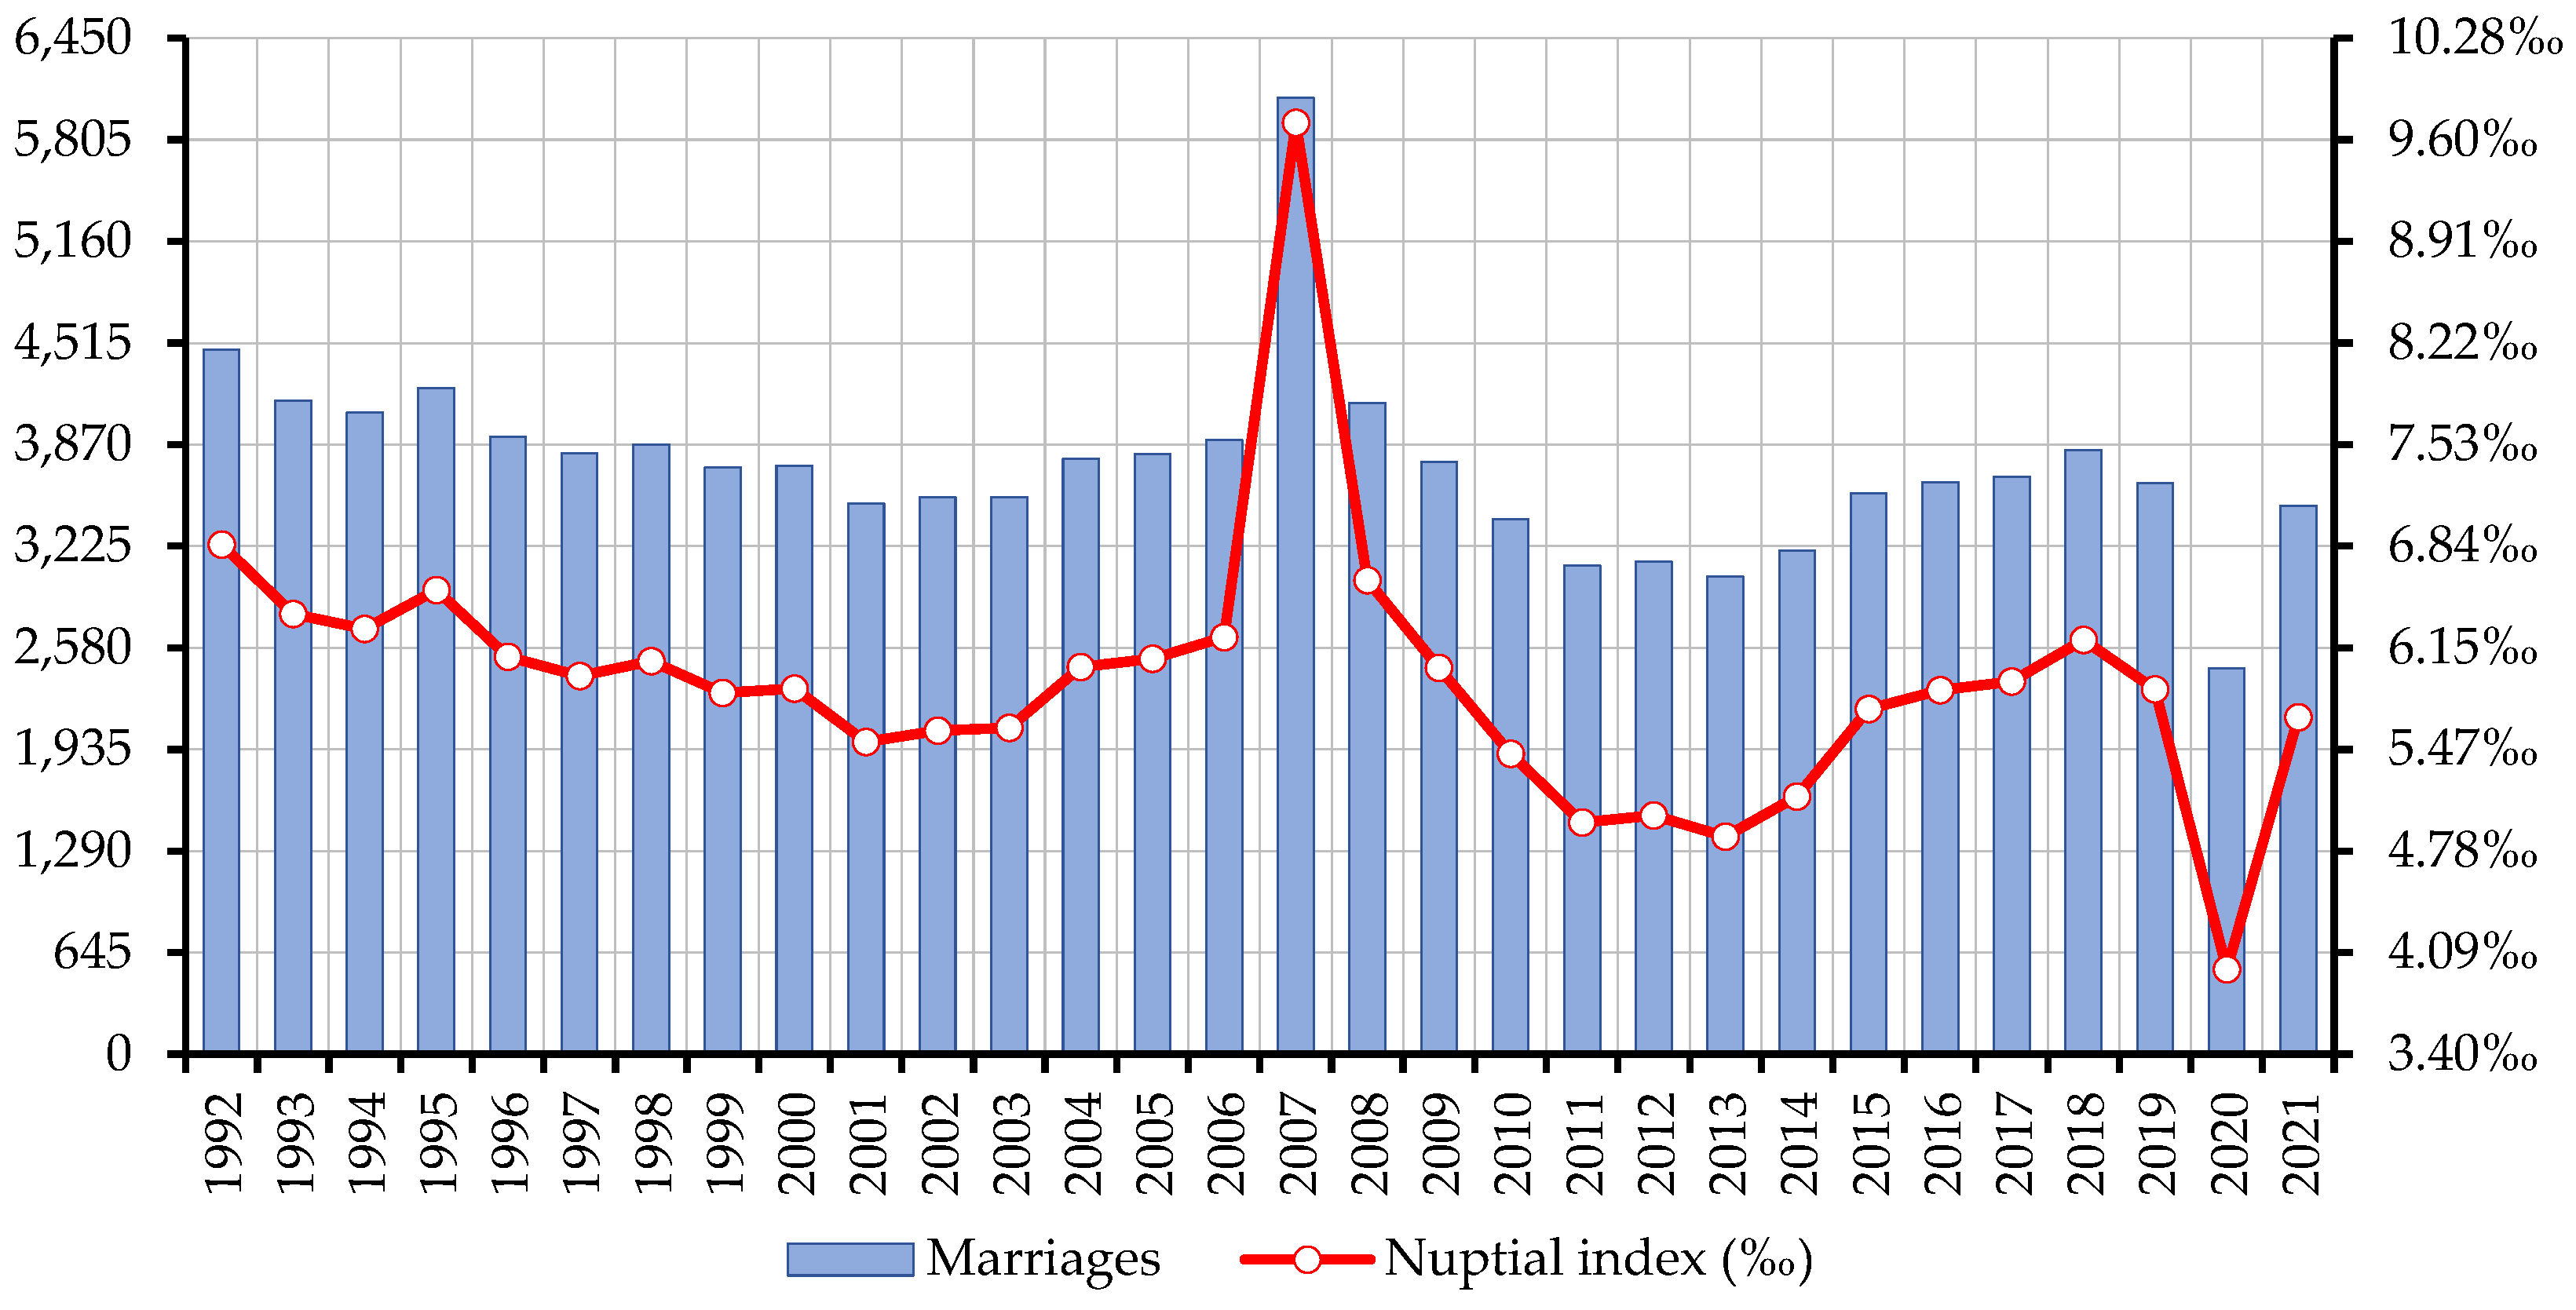
Statistical data indicate a decrease in the number of marriages in the last 30 years, from 174,593 marriages, registered according to data from 1992 to 107,460 in 2012 and only 81,343 marriages in 2020 [40]. This lower value in 2020 can be attributed, most likely, to the restrictions imposed as a result of the COVID 19 pandemic which led to the postponement/cancellation of many marriages.
On the downward trend in the number of marriages between 1992-2002, a slight recovery can be noted, especially after 2002 when we witness a gradual increase in their number, until 2007, which marks a maximum reached in the last 30 years, i.e. 189,240 marriages. The cause may be due to a law that offered financial support to couples getting married for the first time [43].
The same situation can be noted in the case of the nuptiality index, whose values have decreased from 7.6‰ in the 1992s to 5.1‰ in 2012 and 3.7‰ in 2020. In 2021, we are witnessing an important increase in the marriages number and implicitly in the nuptial index, with values even exceeding those recorded 10 years ago (5.2‰). It is probably a “recovery” of those established and lost during the pandemic (2020-2021) (Figure 4). With this, Romania aligns itself with the European standards regarding the marriage rate (4-5‰).
Going down to the lower scalar level, the marriage rate for Bihor County is the same as the national average (5.68‰), with values slightly above average in both urban (5.75‰) and rural (5.62‰) environments.
Compared to these averages, higher values emerge, even over 8‰ in some municipalities: Balc (8.49‰), Cefa (8.93‰), Ceica (8.30‰) or Ineu (13.48‰), where the value of this index is more than double the average of Bihor county. These high values above the county (5.68‰) and national (5.18‰) averages, where other communes fall apart from those previously mentioned can be attributed to a traditional cultural model that has the family at the center of attention, its stability and progress. As for the commune of Ineu, this value well above the average (13.48‰) could also be justified as a result of the presence of a very large number of Roma population which oriented towards a specific ethnic demographic behaviour, traditions and customs.
Compared to these high values of the nuptiality index, at the level of Bihor county there are also municipalities in which no marriages were registered, at least at the level of 2021, such as for example Gepiu and Săcădat. This situation could generate a certain instability among the population if the phenomenon maintains its continuity.
Divorces. If marriage is a natural act accepted with the consent of both partners (husband and wife) in order to found a family that will further contribute to the evolution of society, resulting in offspring and consequently demographic growth, divorce is manifested by the separation or separation of the two partners, for various well-founded reasons (i.e. misunderstanding, incompatibility of character, infidelity, shortcomings in terms of lifestyle, etc.) and which will have effects from a demographic perspective, translated into family instability and problems related to demographic evolution [19].
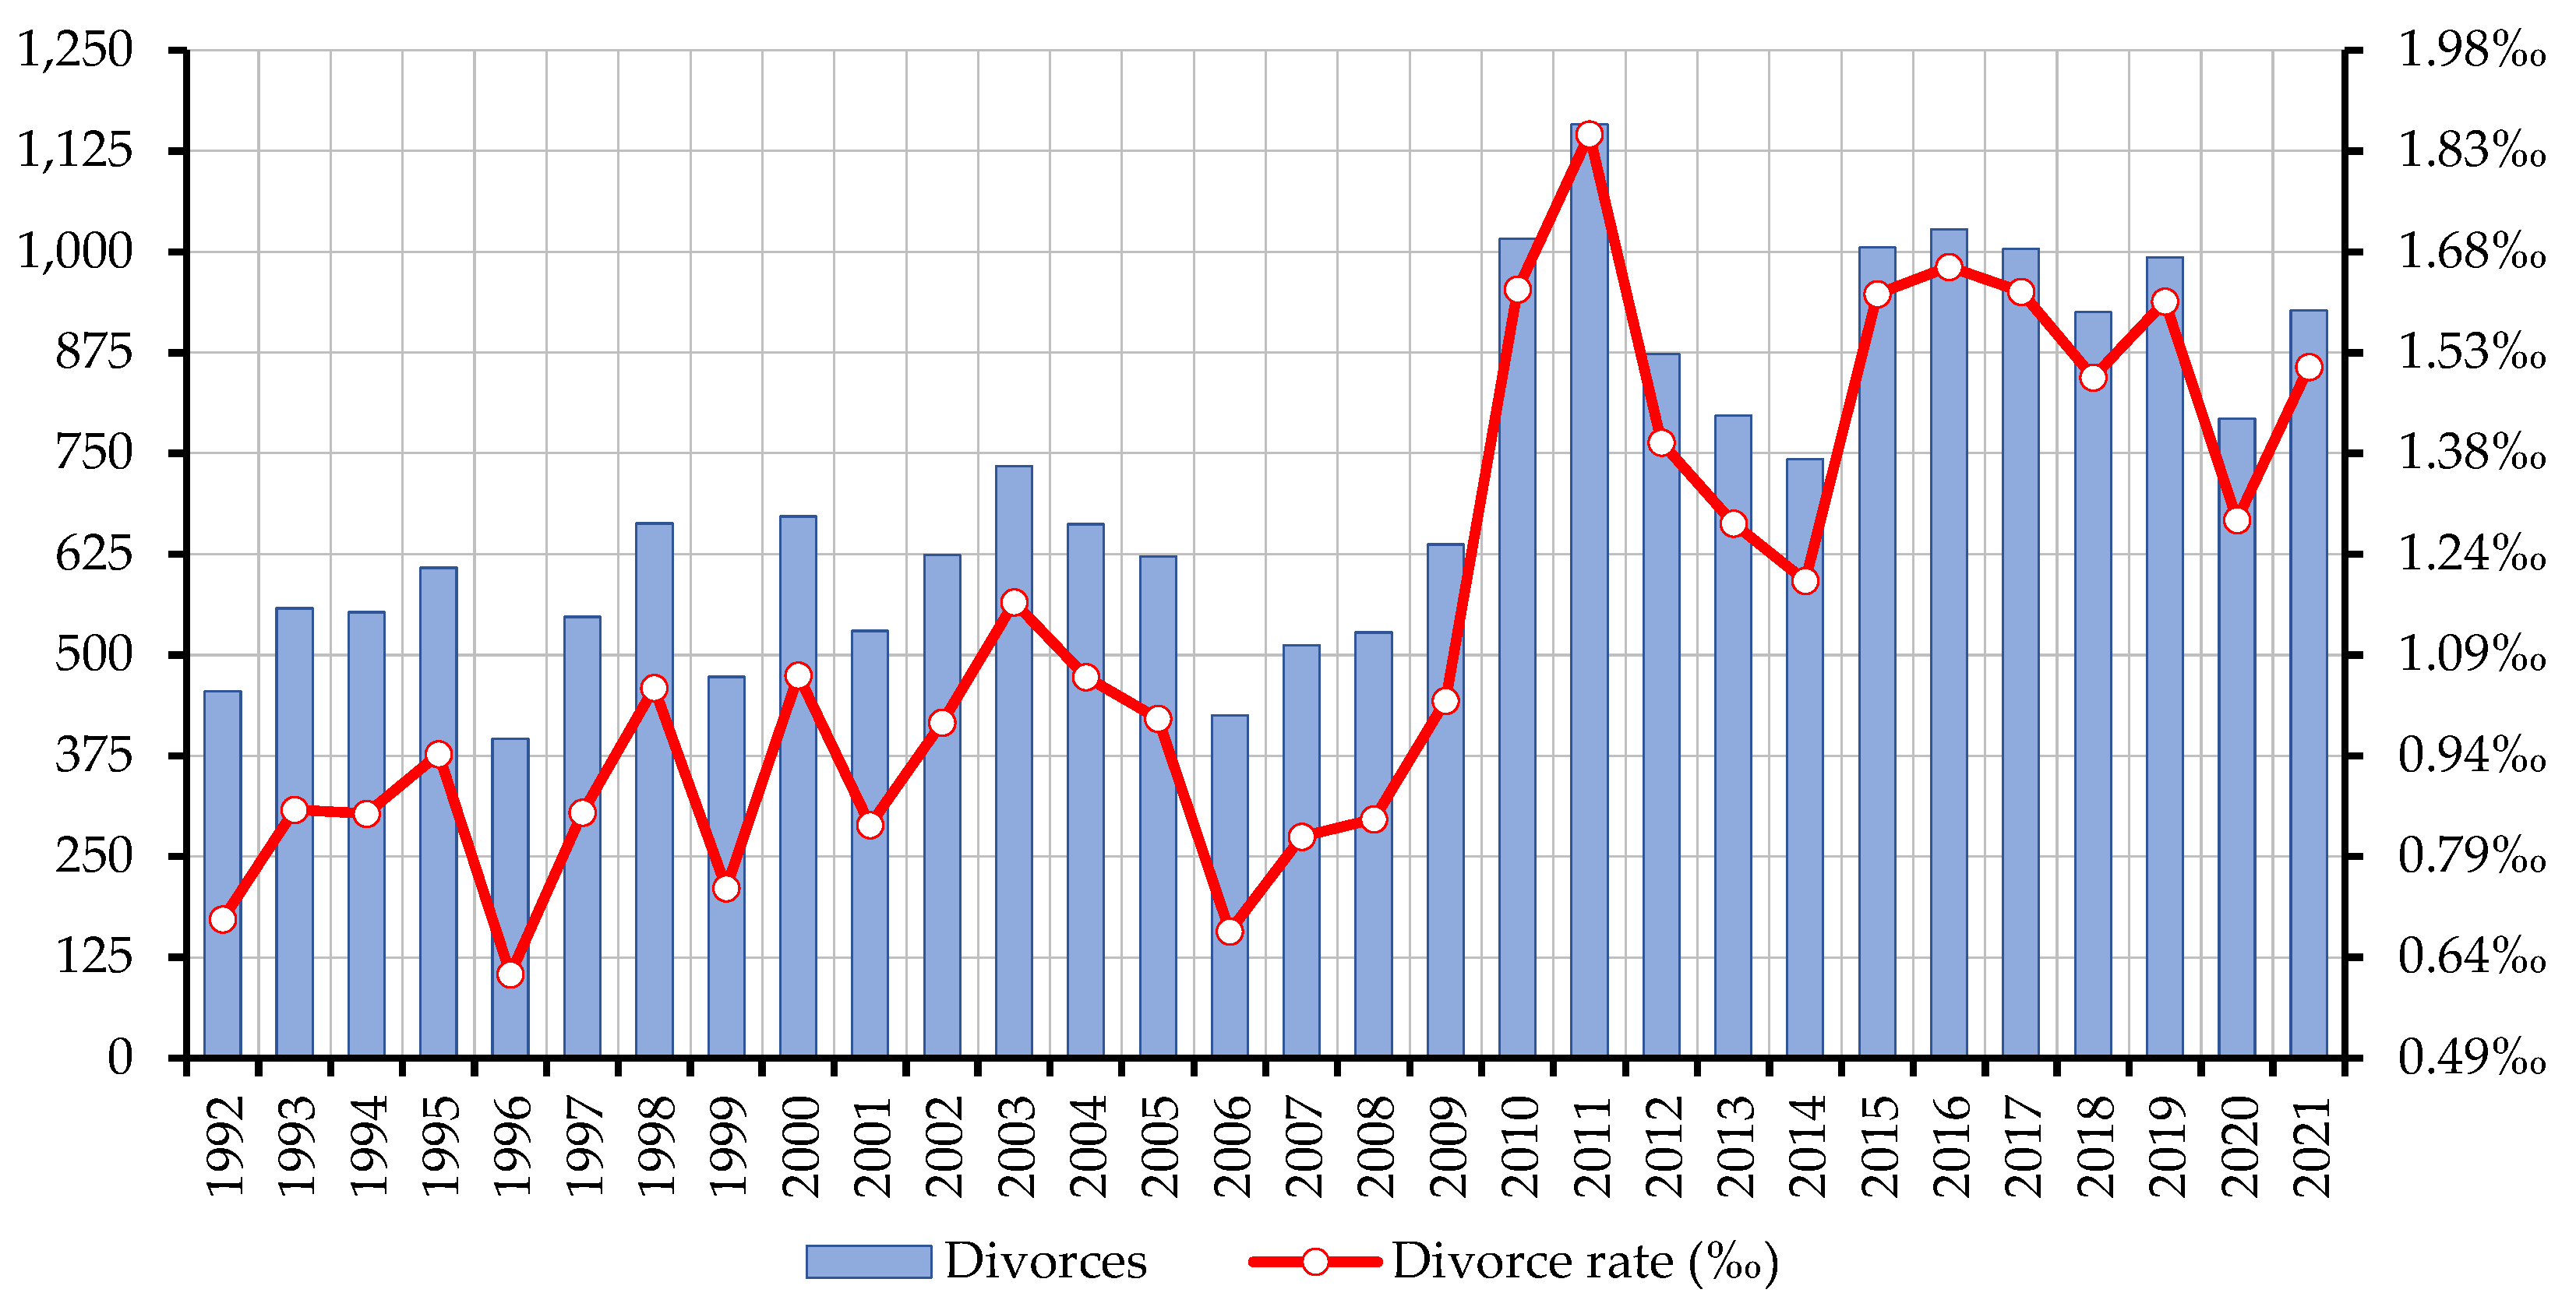
In 2021, 27,024 divorces were registered in Romania either through final law suits or through notary and civil status officers' decisions, the divorce rate being 1.23 divorces per 1000 inhabitants, on an increasing trend compared to the previous year (2020) when 20,785 divorces were registered with a divorce rate of 1.03‰. In fact, 2020 marks the lowest number of divorces and the lowest divorce rate in the last 30 years, the main reason could be the restrictions imposed during the COVID 19 pandemic. Anyway, the divorce rate in Romania is relatively low, compared to other European states [44], which determines a certain family stability.
The counties with most divorces registered in 2021 were: the capital Bucharest (2600 divorces), followed by Iași, Constanța, Prahova with values of over 1000 divorces.
If we consider the divorce rate, here we can see that Bihor county ranks second after Brașov county, with a rate of 1.51‰ and 1.56‰ respectively, followed by Constanța county with 1.5‰, clearly higher values compared to the national average. In Bihor county, the most numerous divorces were registered at the level of 2021 in the municipality of Oradea (379), followed by the municipalities of Marghita (46) and Salonta (26). Moreover, the urban environment stands out with higher values of both the number of divorces and the divorce rate (1.7‰), compared to the rural environment (1.3‰), the latter being much more conservative, in terms of of family stability.
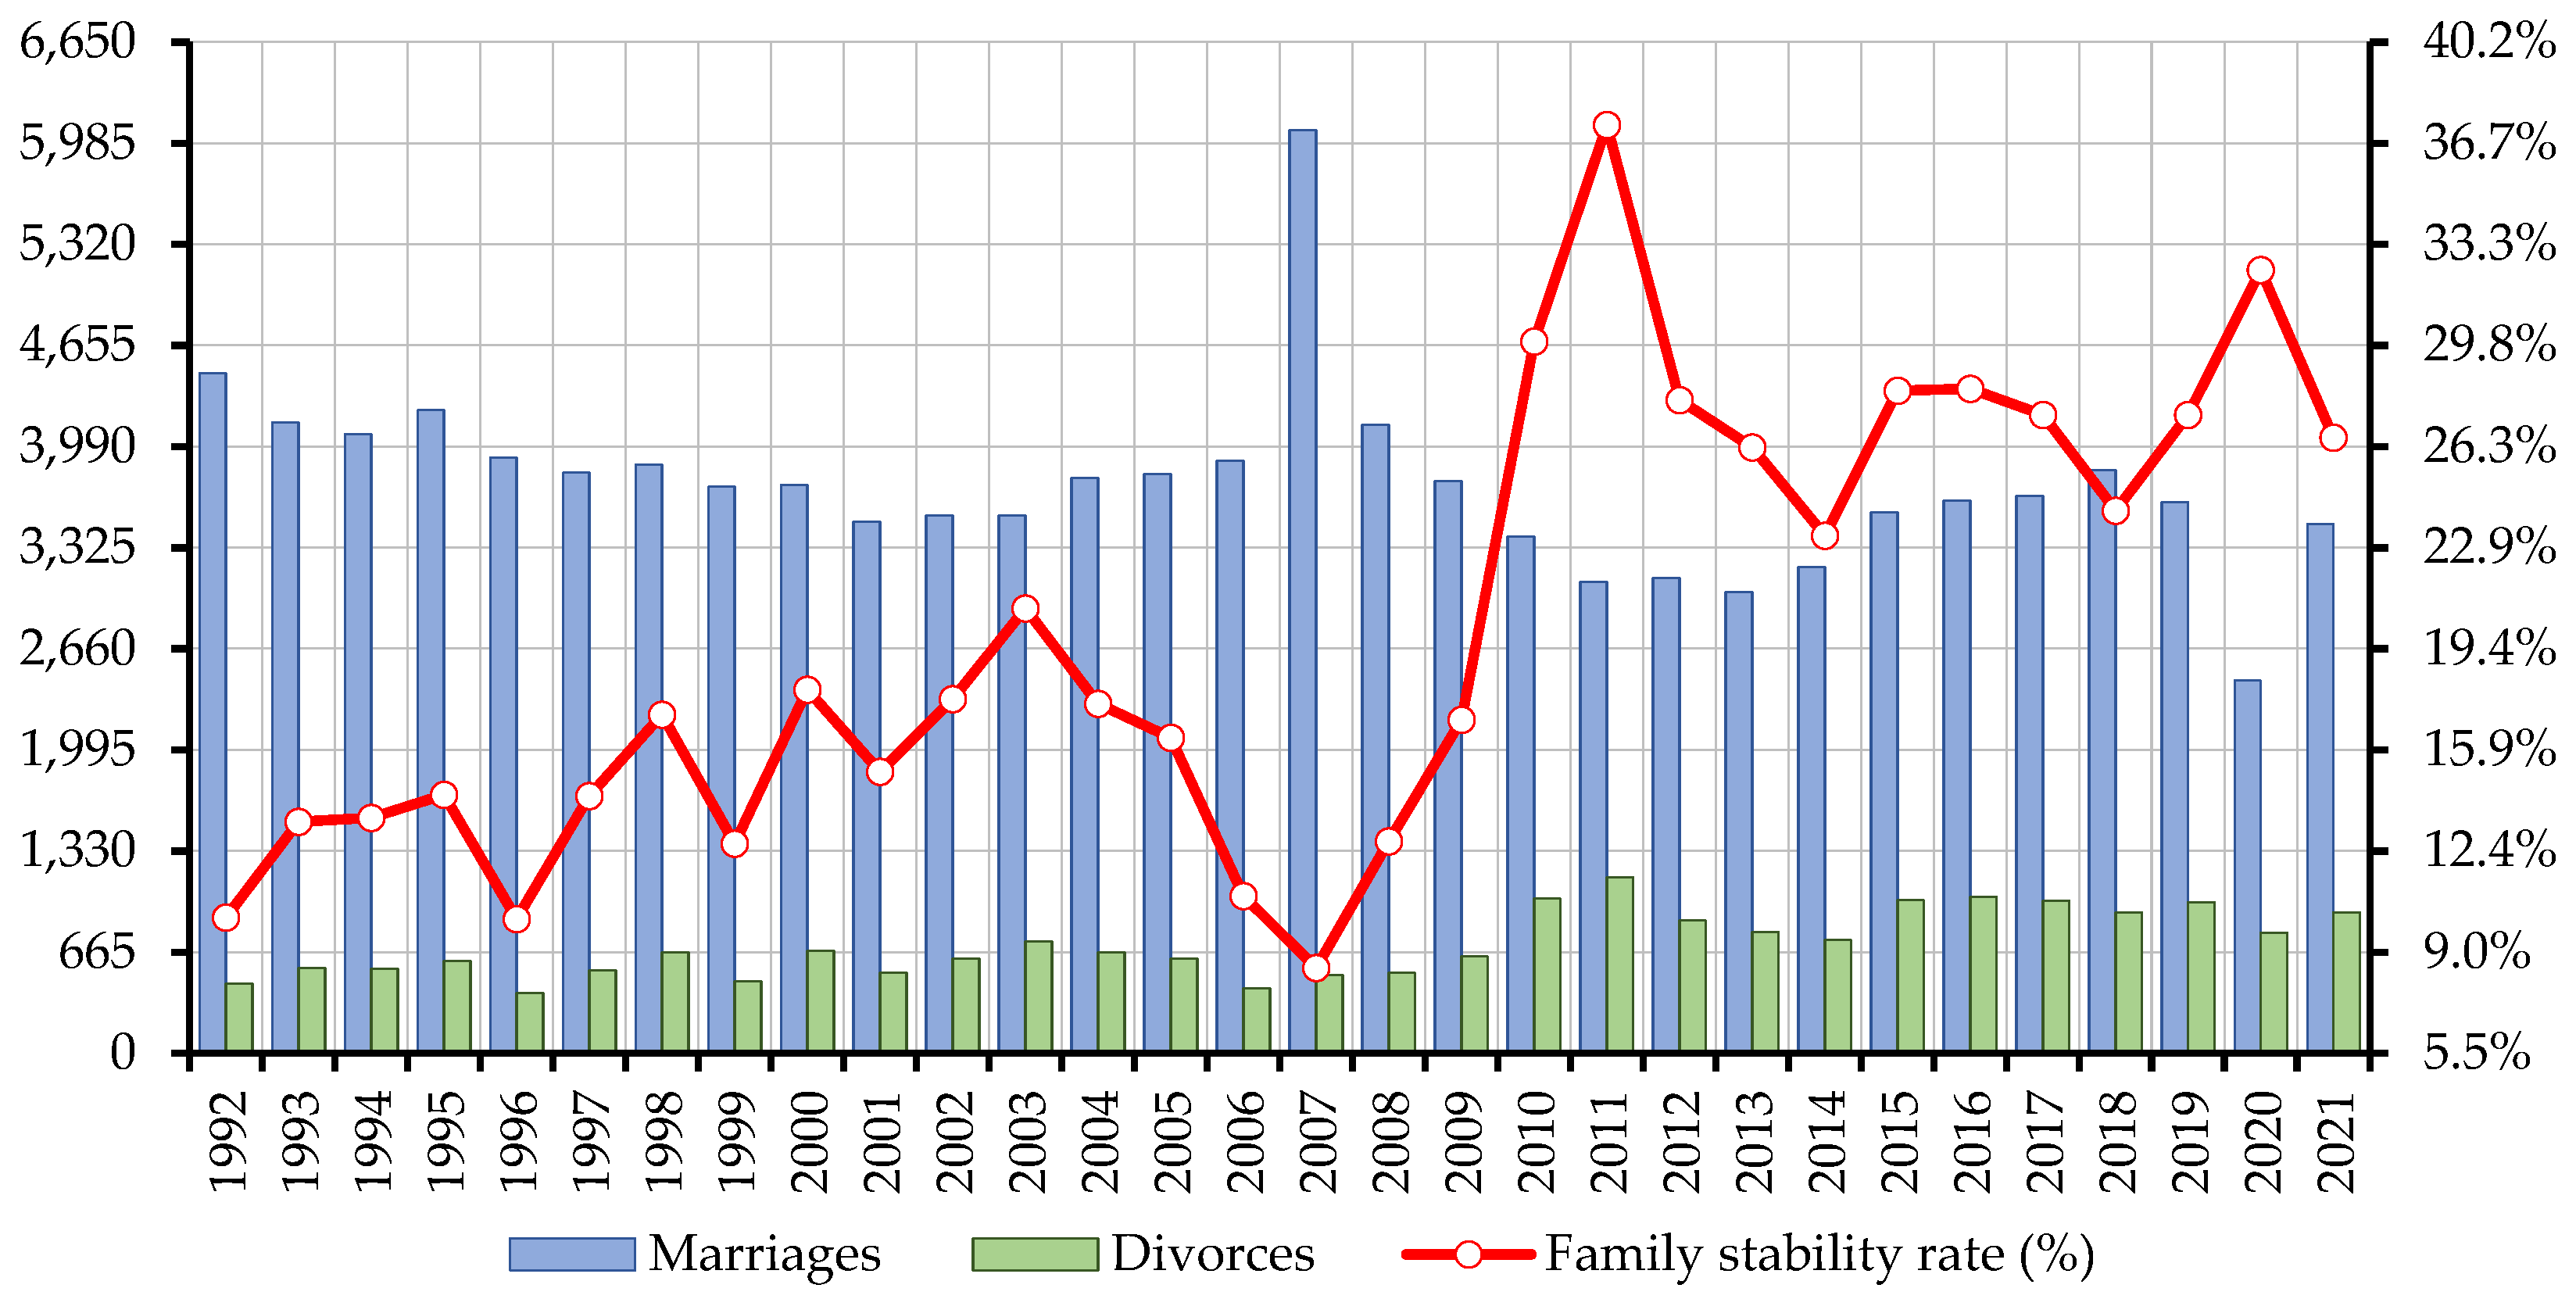
Family stability is a composite demographic indicator highlighting the ratio between the number of divorces and that of marriages, manifested in a period of time, within a well-defined territory. The higher the value of this indicator, the lower the degree of family stability, in other words we are facing an instability phenomenon and the lower its value, the higher the degree of stability.
In the case of Romania, the family instability rate began to increase in the last three decades, its values increasing from 16.8% in 1992 to 23.7% in 2021, although the highest degree of family instability was recorded in 2011 (33.9%), after which it gradually decreases until now.
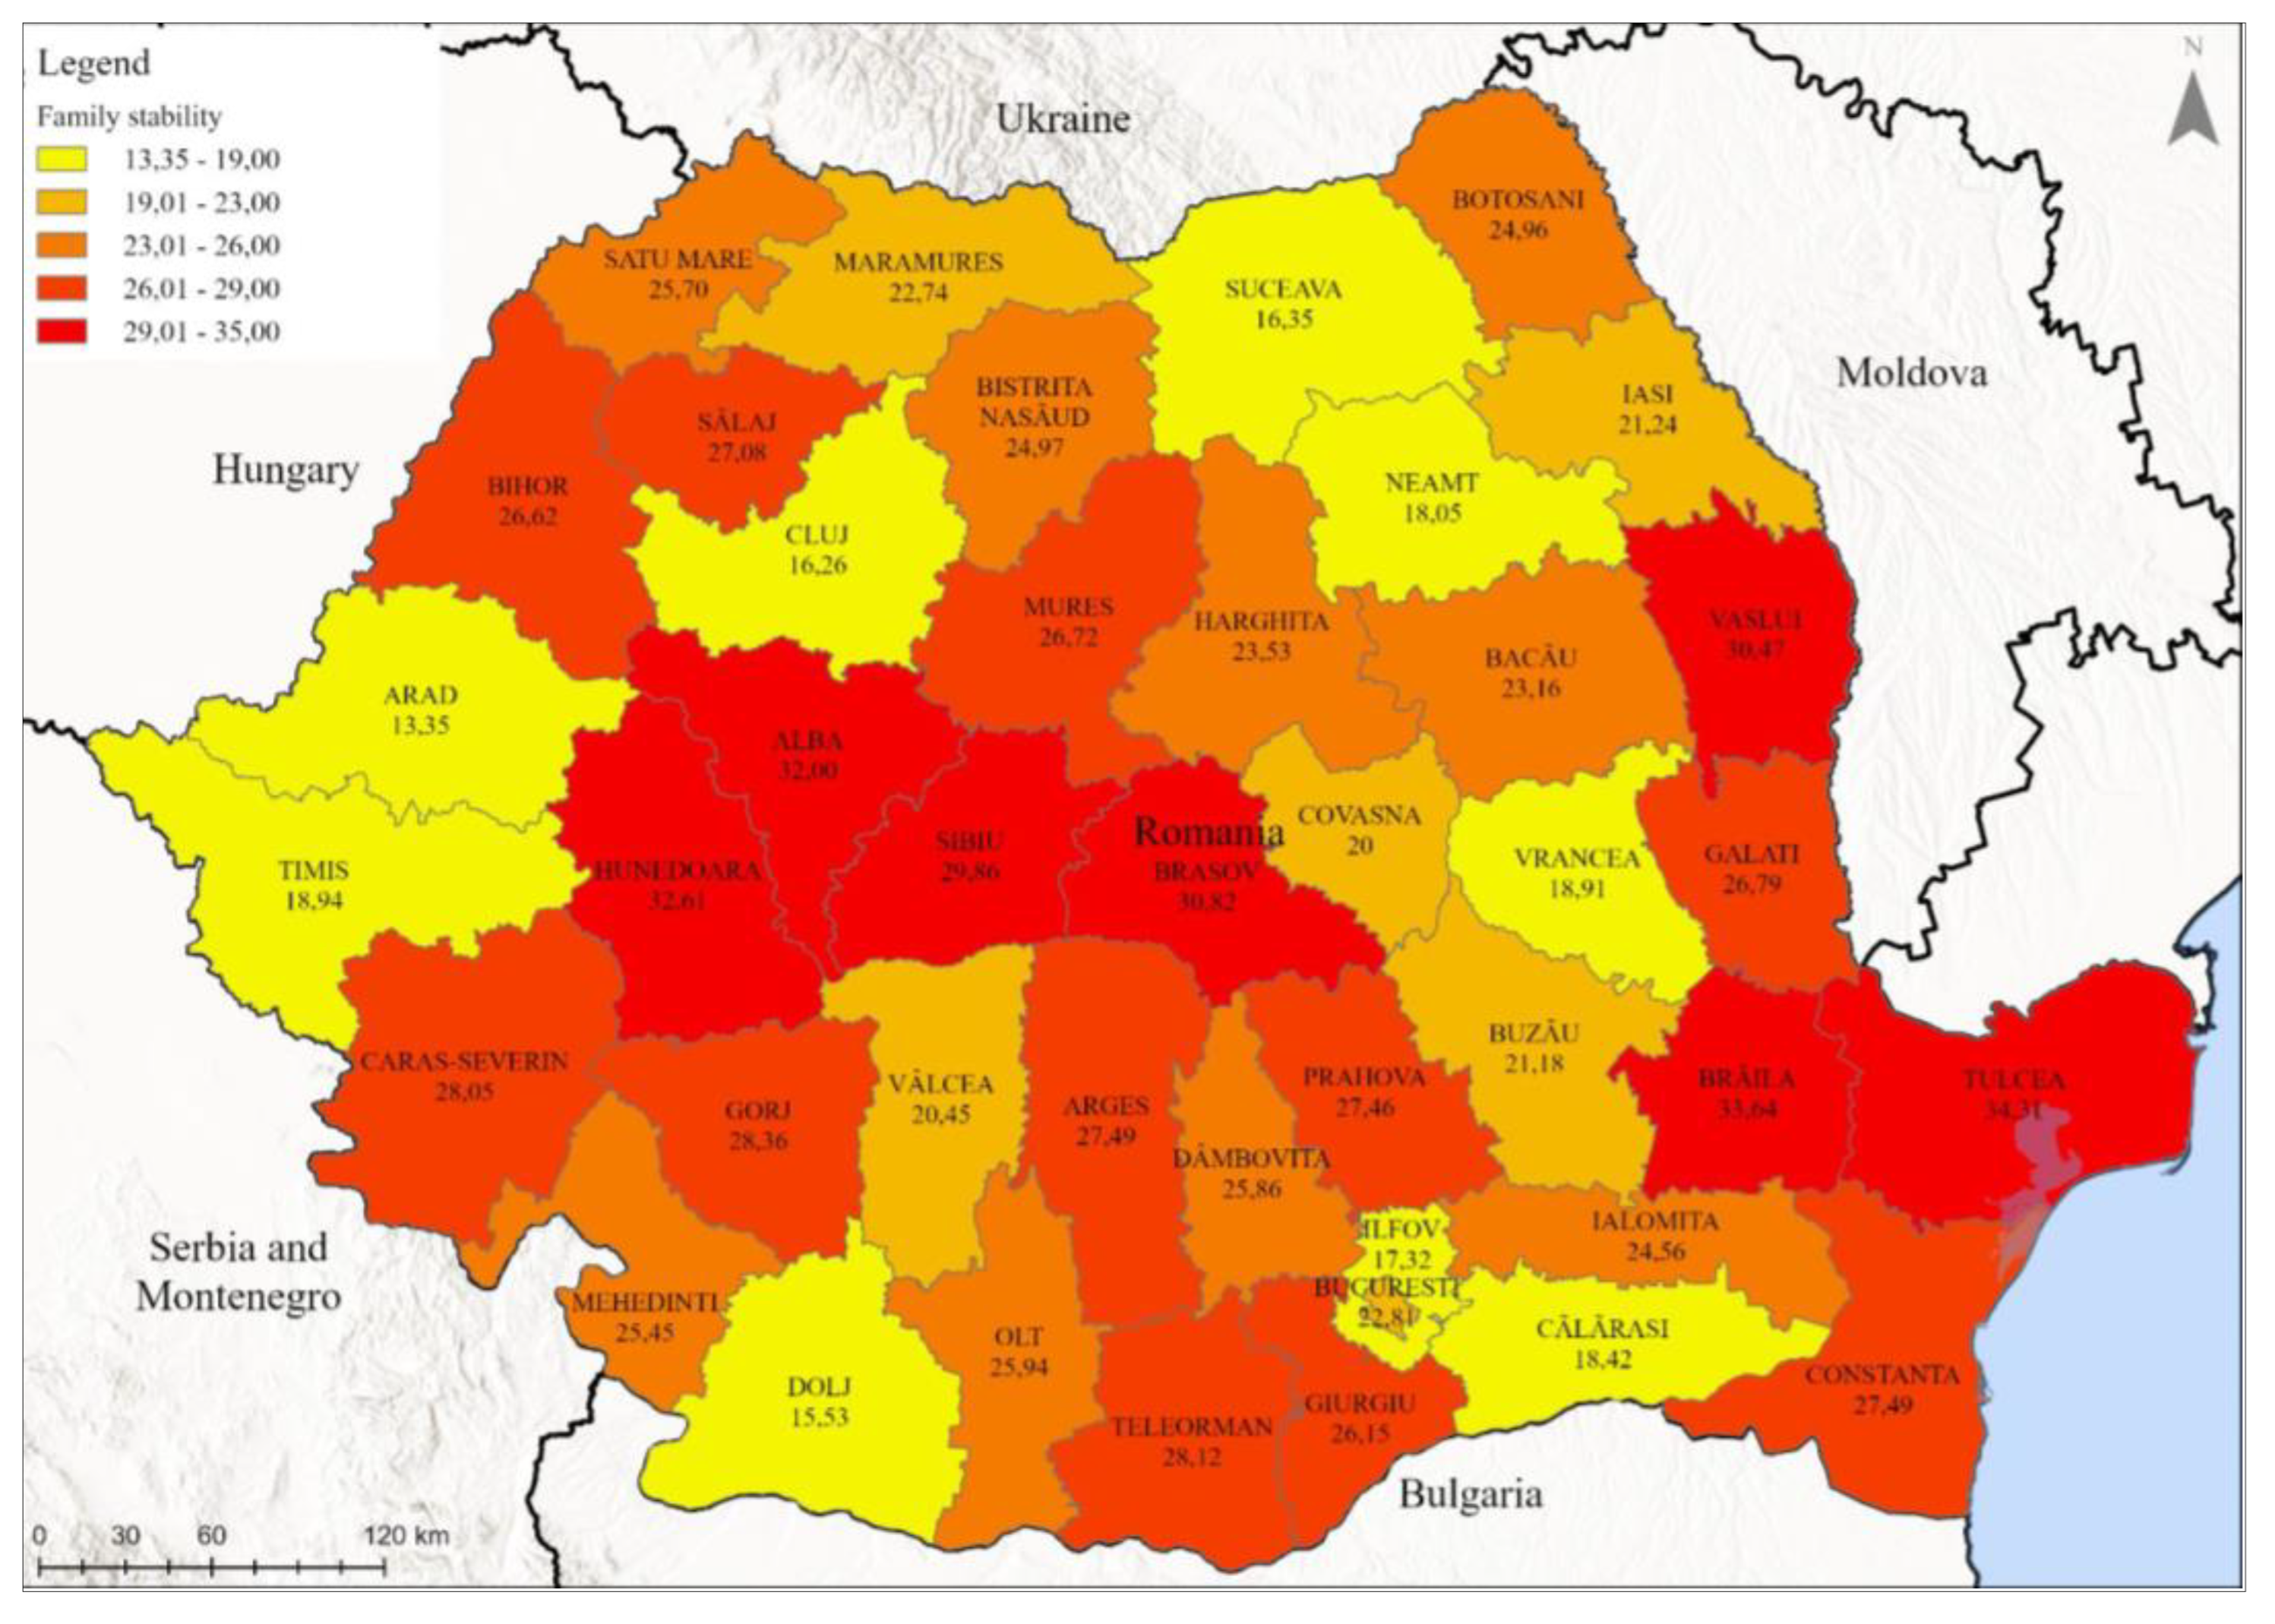
In general, family stability is much more evident in the rural area, compared to the urban area and at county level, for the year 2021, the most unstable are: Tulcea (34.3%), Brăila (33.6%), Hunedoara (32.6%), Alba (32%), and those with greater family stability are: Arad (13.4%), Cluj (16.3%), Suceava (16.4%), Ilfov (17, 3%). Of course, these values fluctuate, they vary from one year to the next and the hierarchies change depending on the intensity of some social, political and demographic factors that can influence marriages and divorces in a certain territory.
Figure 5. Divorces and the divorce rate in Romania during 1992-2021. Source of data [40].
Preprints 79292 g005
Figure 6. The family stability rate in Romania during 1992-2021. Source of data [40].
Preprints 79292 g006
For Bihor county, the lowest value of this indicator was recorded in 2007 (8.4%), thus indicating the highest family stability (the cause being, probably, the impact of that law that offered financial support to couples on their first marriage) while the value of 37.3% from 2011 indicates the highest degree of family instability.
The territorial analysis of family stability for the year 2021 highlights the fact that Bihor county is located in a "balance zone" with the average value of this index of 26.6% being slightly lower compared to the average value of 23.7%, recorded at a national level.
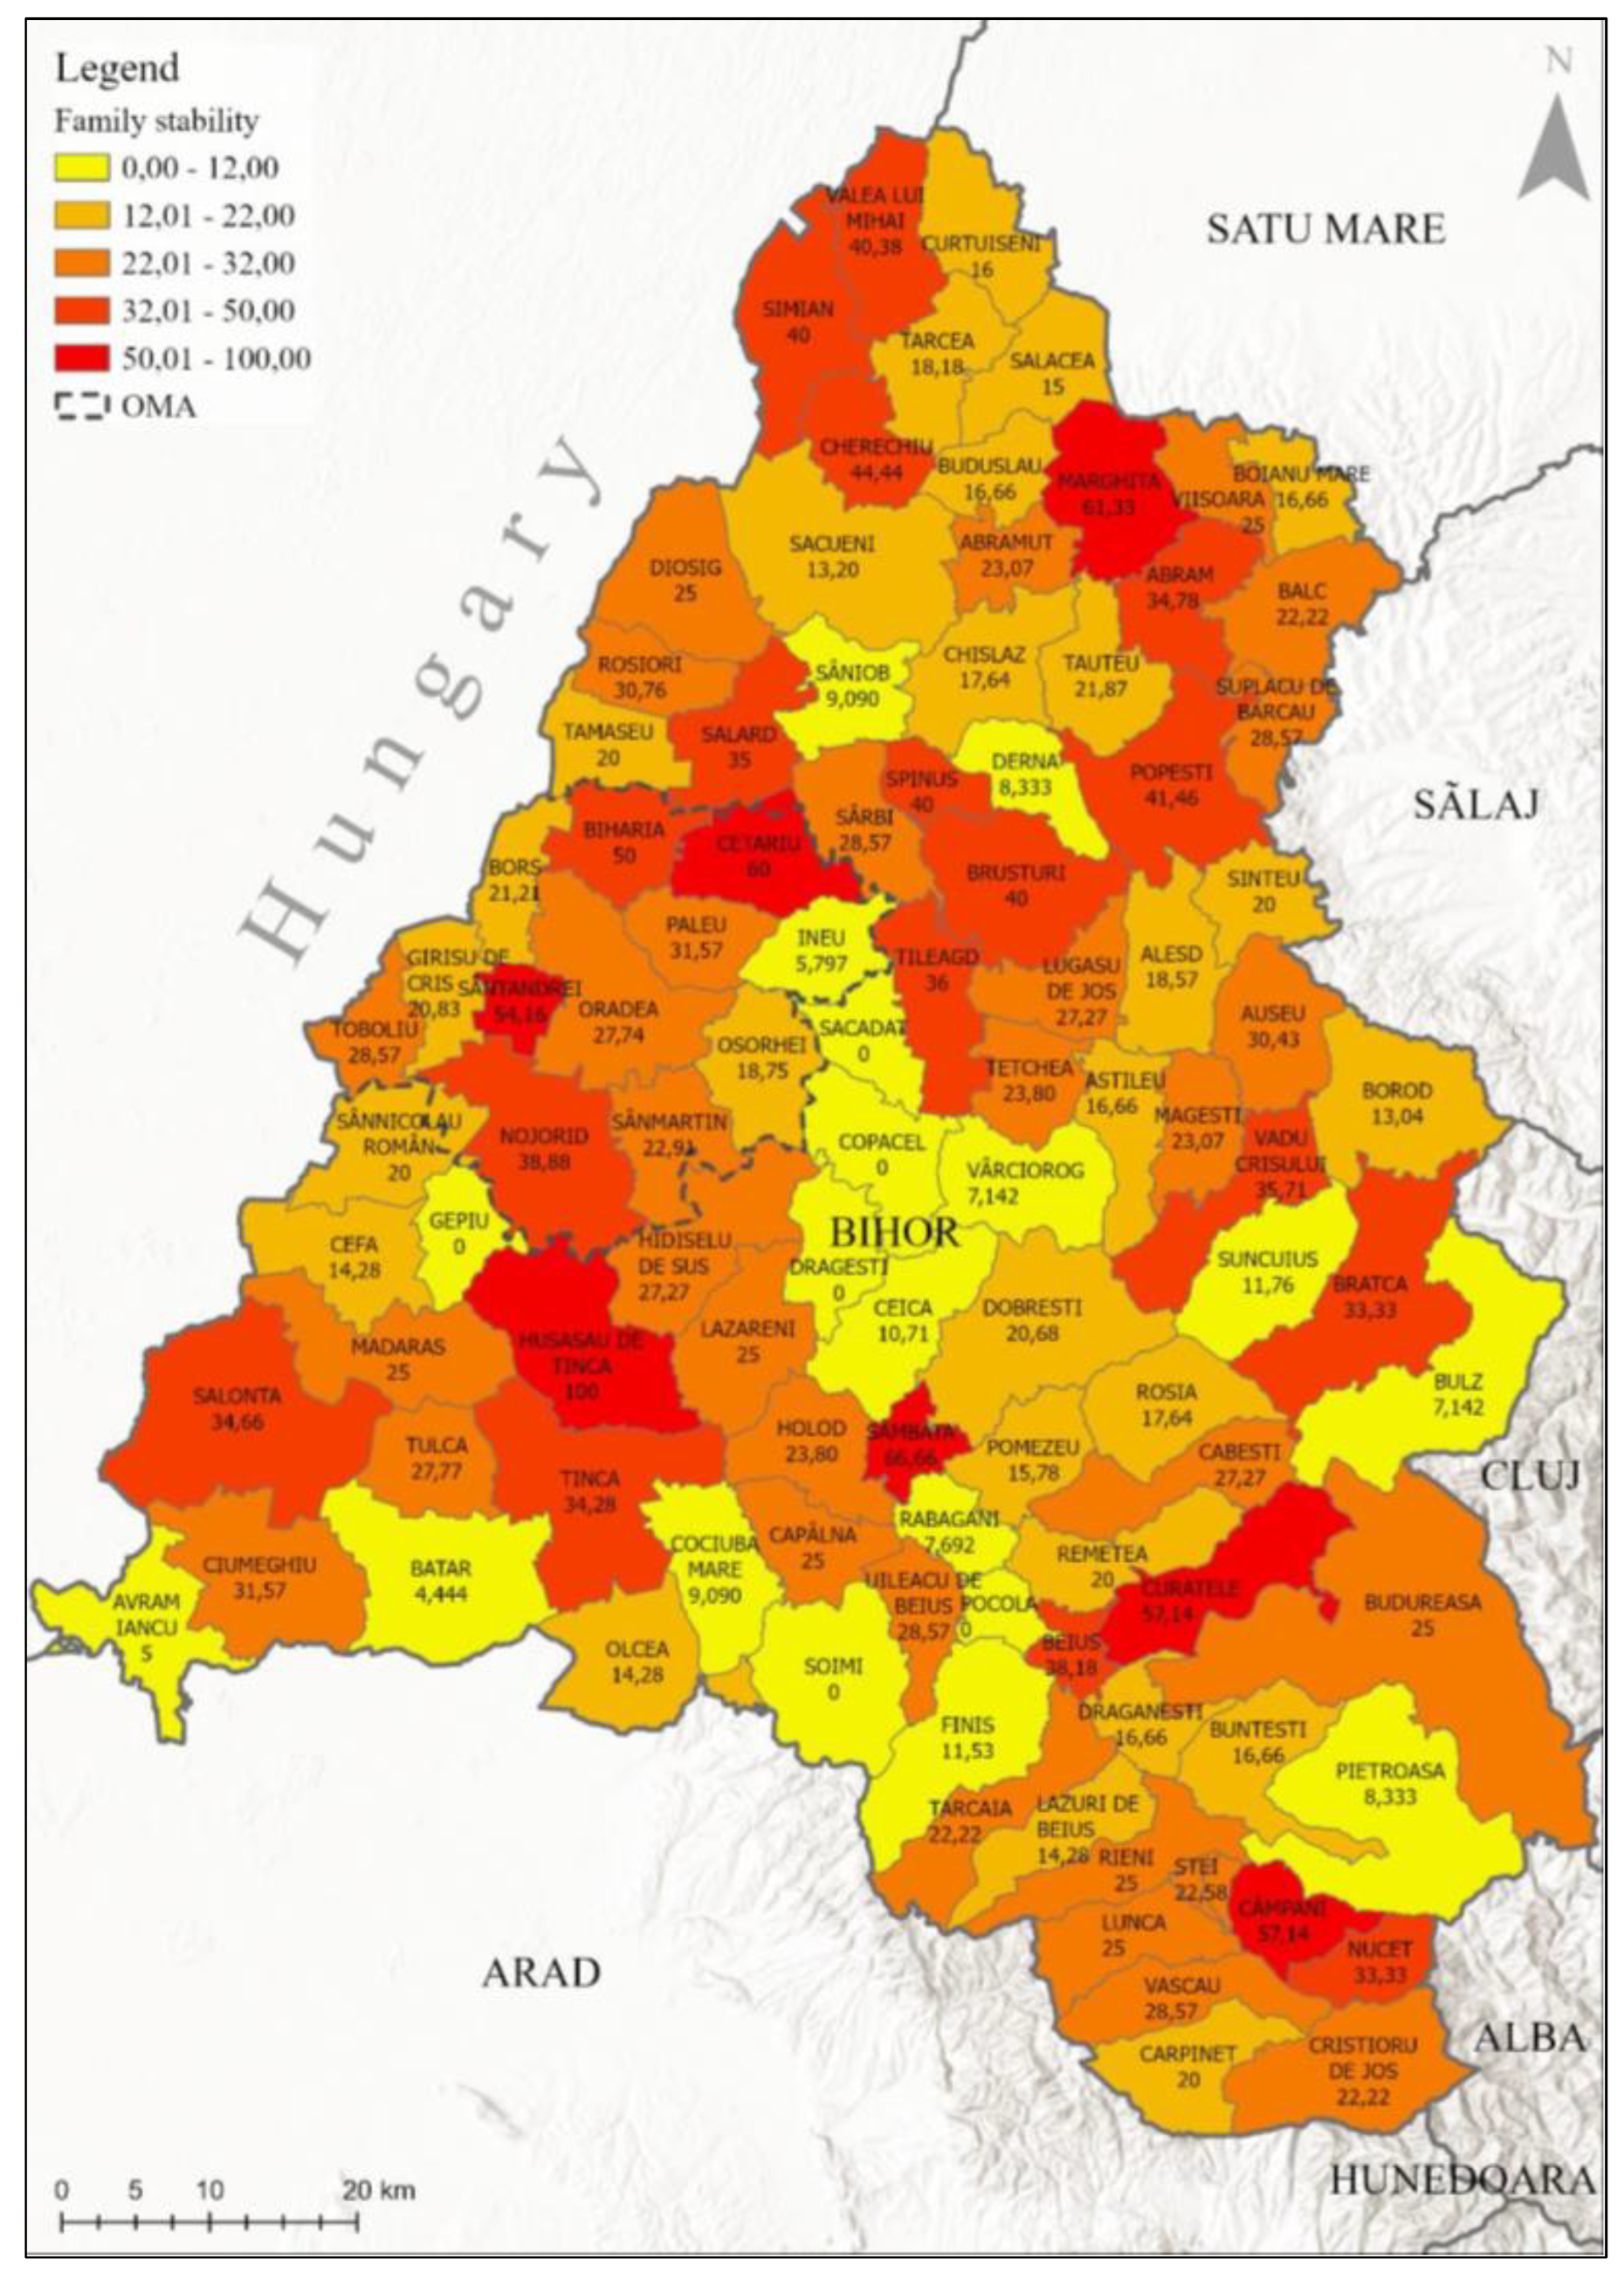
Although Bihor county is characterized by a certain balance regarding family stability, certain territorial differences can still be noted. First of all, a higher family stability can be noted in the rural environment, where the average value in 2021 was 23.8%, compared to the urban environment (29.3%). The highest degree of family instability was in Marghita (61.3%), followed by Valea lui Mihai (40.4%) and Beiuș (38.2%), while the municipality of Oradea with 27.7% had a much more obvious stable family.
Furthermore, the communes in the southern and eastern half overlapping deep rural spaces, show a higher degree of stability compared to the communes closer to the urban spaces, especially those that are part of the metropolitan area.
Figure 7. Family stability rate in Romania (2021). Source of data: authors' calculations [40].
Preprints 79292 g007
Figure 8. The family stability rate in Bihor county during 1992-2021. Source of data [40].
Preprints 79292 g008
Figure 9. Family stability rate in Bihor county (2021). Source of data: authors' calculations [40].
Preprints 79292 g009

5. Conclusions

Romania as a European country and a member of the European Union has taken important steps in reaching a new Western demographic behaviour specific. However, in the Romanian society the influence of economic, social and political factors have also left their mark on the demography which on the one hand are still related to traditional cultural values and on the other on the other hand these are found in Western modernism [45].
In this sense, the family remains an essential element in the individual's life and official marriage is still a means of establishing a family. However, the decision to get married is pushed to older ages, either for educational reasons or first getting a job that will provide them with decent living conditions in married life.
The demographic behaviour differences are also triggered by the existence of regional cultural models, but also due to an unequal dynamic of economic development.
Bihor County is in line with national standards, with balanced values both in terms of demographic potential, namely the degree of vitality and the possibilities of regeneration of the population as well as family stability, certainly with the obvious differences imposed by the two types of rural-urban environments, mentalities, way of life and organization of married life and last but not least the possibilities of economic development.
The demographic potential reflects the demographic power of the nation and its ability to provide future population growth [46], so this indicator reveals that in the case of Romania it decreased slightly during the analyzed period 1992-2021 from 48,1% in 1992 to 45,8% in 2021. By comparison to former Socialist eastern countries, Russia demographic potential applied model of Dalkhat [46] shows that it will be deeply depopulated by the end of this century, a phenomenon further aggravated by wars, revolutions, socioeconomic transition and emigration.
European countries marriage and divorce rate vary greatly [47]. Post socialist countries show the highest divorce rates in Europe [44]. Socialist oriented divorce studies such as that of Swianiewicz [48] and more focused that of Härkönen et al. [44] analyzes seven former socialist countries divorce rates such as that of Bulgaria, Estonia, Hungary, Lithuania, Poland and Romania during their transition to the new democratic regime and shows that the divorce rates were higher in this period in the Baltic states and Russia, whereas it was the lowest in Bulgaria, Romania and Poland. According to our study results, during the interval 1992-2021 the highest divorces rate was registered in the year 2011. More recently, in 2021 the highest divorce rate took place in the capital city of Bucharest. Happily Romania is not yet on the alarming divorce path, as further studies show that there is an intergenerational transmission of divorce, namely children of divorced parents face a higher divorce risk in their own marriages [49].
Marriages create stability in a family and its pattern in Romania wasn’t very sinuous except for its two extremes in 2007 when the highest stability rate was registered, a year which coincides with Romania’s integration in the EU and the lowest in 2020, a year which also coincided with the pandemic crises. In terms of family stability recent studies show that most partnerships begin as consensual unions than direct marriages, but marriage is preferred when a child is born for childrearing. In Romania and Bulgaria the transition from cohabitation to marriage gradient is faster than in Hungary and the tendency is to see more educated women first resorting to cohabitation as a prelude to marriage is higher in Romania and Bulgaria, according to the study of Haragus [50].

Author Contributions

Conceptualization Stasac Marcu; methodology: Stupariu I. Marius; software: Bucur Liviu, Marius I. Stupariu; data curation: Stasac Marcu and Marius I. Stupariu; investigation: Linc Ribana, Tatar Corina Florina; original draft preparation: Stasac Marcu; review and editing: Linc Ribana, Tatar Corina Florina and Nistor Stelian.

Conflicts of Interest

The authors declare no conflict of interest.

References

  1. Ministry of Justice Decree No 770/1966, Anti-Abortion Decree; 1966.
  2. Bolovan, I. Aspecte privind relaţia politică-demografie în timpul regimului comunist din România / Aspects regarding the political-demographic relationship during the communist regime in Romania. Arhiva Someşană 2004, 3, 285–294.
  3. Anton, L. La Mémoire de l’avortement En Roumanie Communiste : Une Ethnographie Des Formes de La Mémoire Du Pronatalisme. Roumain. Thesis, for PhD, Université ”Victor Segalen”, Bordeaux II / Université de Bucarest: Bordeaux / Bucharest, 2010. [Google Scholar]
  4. Jinga, L.; Soare, F.; Doboș, C.; Roman, C. Politica pronatalistă a regimului Ceaușescu. Vol. II: Instituții și practici / The pro-natalist policy of the Ceaușescu regime. Vol II: Institutions and Practices; Editura Polirom: Iași, 2011; ISBN 978-973-46-2014-2. [Google Scholar]
  5. Coman, O. Gardienii Decretului. Lumea ascunsă a represiunii împotriva avorturilor / Guardians of the Decree. The hidden world of abortion repression Available online: https://beta.dela0.ro/gardienii-decretului-lumea-ascunsa-a-represiunii-impotriva-avorturilor/.
  6. Miron, O. Politica Pronatalistă În România Comunistă, o Cale de Control al Vieții Private / Pro-Natalist Politics in Communist Romania, a Way of Controlling Private Life. Polis. Revista de Științe Politice 2021, IX.
  7. Ianoș, I.; Guran, L. Comportamentul demografic recent al orașelor României / The recent demographic behavior of Romanian cities. SCG 1995, XLII, 3–12. [Google Scholar]
  8. Thompson, W.S. Population. The American Journal of Sociology 1929, 34, 959–975. [Google Scholar] [CrossRef]
  9. Leibenstein, H. A Theory of Economic-Demographic Development; Princeton University Press: Princeton, 1954; ISBN 978-0-8371-1046-2. [Google Scholar]
  10. Geddes, J.; Muir, K. Aspects of Social Geography: Change and Development; Edward Arnold: London, 1978; ISBN 978-0-7131-7614-8. [Google Scholar]
  11. Trebici, V. Populația terrei: demografie mondială / Population of the Earth: World Demography; Editura Științifică: București, 1991; ISBN 978-973-44-0061-4. [Google Scholar]
  12. Trebici, V. Populația României și creșterea economică. Studii de demografie economică / Romania’s population and economic growth。Studies of economic demography; Editura Politică, 1971. 1971. [Google Scholar]
  13. Trebici, V. Genocid și demografie / Genocide and demography; Editura Humanitas, 1991; ISBN 978-973-28-0218-2.
  14. Trebici, V. Demografie / Demography; Editura Enciclopedică, 1996; ISBN 978-973-45-0159-5.
  15. Rotariu, T. Demografie și sociologia populației. Fenomene demografice / Population demography and sociology. Demographic phenomena; Editura Polirom: Iași, 2003; ISBN 978-973-681-409-9. [Google Scholar]
  16. Rotariu, T. Demografie şi sociologia populaţiei. Structuri şi procese demografice / Population demography and sociology. Demographic structures and processes; Editura Polirom: Iași, 2009; ISBN 978-973-46-1250-5. [Google Scholar]
  17. Rotariu, T. Studii demografice / Demographic studies; Editura Polirom: Iași, 2010; ISBN 978-973-46-1701-2. [Google Scholar]
  18. Rotariu, T.; Dumănescu, L.; Hărăguş, M. Demografia României în perioada postbelică (1948-2015) / Demography of Romania in the post-war period (1948-2015); Editura Polirom: Iași, 2017; ISBN 978-973-46-6865-6. [Google Scholar]
  19. Cucu-Oancea, O. Disparităţi privind comportamentele demografice ale populaţei rurale din România / Disparities regarding the demographic behaviors of the rural population in Romania. Revista Română de Sociologie 2005, 16, 481–501.
  20. Ghețău, V. Tranziție și demografie / Transition and demography. Populație & Societate. Periodic al Centrului de Cercetari Demografice Vladimir Trebici 1997, 1.
  21. Ghețău, V. Situația demografică a României: stadiu actual, factori de influență și perspective / The demographic situation of Romania: current state, influencing factors and perspectives; Caietele sesiunilor de dezbatere a Strategiei de dezvoltare durabilã a României „Orizont-2025”; București, 2004.
  22. Ghețău, V. Declinul demografic și viitorul populației României - o perspectivă din 2007 asupra populației României din secolul 21 / Demographic decline and the future of Romania’s population - a 2007 perspective on Romania’s population in the 21st century; Institutul Național de Cercetări Economice, Centrul de Cercetari Demografice „Vladimir Trebici”: Buzău, 2007. [Google Scholar]
  23. Sandu, D. Migrația temporară în străinătate / Temporary migration abroad. In Demografia României; Editura Academiei Române: București, 2018 ISBN 978-973-27-3504-6.
  24. Ilieș, A. Etnie, confesiune și comportament electoral în Crișana și Maramureș (Sfârșitul sec. IX și sec. XX). Studiu geografic / Ethnicity, confession and electoral behavior in Crișana and Maramureș (End of the 9th and 20th centuries). Geographical study; Editura Dacia: Cluj-Napoca, 1997; ISBN 973-35-0782-2. [Google Scholar]
  25. Ilieș, A.; Stașac, M. Studiul geografic al populației / Geographical study of population; Editura Universității din Oradea: Oradea, 2000. [Google Scholar]
  26. Litrã, A.V. Evoluția Demograficã a României – Convergențã Sau Periferizare? / The Demographic Evolution of Romania - Convergence or Peripheralization? Theoretical and Applied Economics 2006, 2, 93–100.
  27. Stupariu, I.M.; Josan, I. Aspecte Privind Nupţialitatea Şi Divorţialitatea În România / Aspects Regarding Nuptiality and Divorce in Romania. Analele Universităţii din Oradea. Seria Geografie 2006, 16, 86–93.
  28. Stașac, M.; Bucur, L. Geo-Demographical Changes in Rural Space of Oradea Metropolitan Area. Analele Universității din Oradea. Seria Geografie 2010, 20, 223–232.
  29. Drăgan, M. Aspecte ale comportamentului demografic în Munţii Apuseni / Aspects of demographic behavior in the Apuseni Mountains. Geographia Napocensis 2013, VII, 43–48. [Google Scholar]
  30. Filimon, C. Depresiunea Oradea-Bratca: studiu de populaţie şi de aşezări / The Oradea-Bratca depression: population and settlement study; Presa Universitară Clujeană: Cluj-Napoca, 2014; ISBN 978-973-595-717-9. [Google Scholar]
  31. Stupariu, I.M. Municipiul Oradea. Studiu de Geografie Umană / Oradea municipality. Study of Human Geography; Editura Universității din Oradea: Oradea, 2014; ISBN 978-606-10-1355-5. [Google Scholar]
  32. Guran-Nica, L. Aspects of the Demographic Crisis in Romania. Studii și Cercetări de Antropologie 2015, 5, 61–71.
  33. Linc, R.; Dinca, I.; Stașac, M.; Tătar, C.F.; Bucur, L. Surveying the Importance of Population and Its Demographic Profile, Responsible for the Evolution of the Natura 2000 Sites of Bihor County, Romania. Eastern European Countryside 2017, 23, 147–170. [Google Scholar] [CrossRef]
  34. Ropa, M. Depresiunea Beiușului. Studiu de geografia populației / Beișului depression. Population geography study; Editura Risoprint: Cluj-Napoca, 2020. [Google Scholar]
  35. Deac, L.A.; Herman, G.V.; Gozner, M.; Bulz, G.C.; Boc, E. Relationship between Population and Ethno-Cultural Heritage - Case Study: Crișana, Romania. Sustainability 2023, 15, 9055. [Google Scholar] [CrossRef]
  36. Tătar, C.F.; Dinca, I.; Linc, R.; Stupariu, I.M.; Bucur, L.; Stașac, M.; Nistor, S. Oradea Metropolitan Area as a Space of Interspecific Relations Triggered by Physical and Potential Tourist Activities. Sustainability 2023, 15, 3136. [Google Scholar] [CrossRef]
  37. Benedek, J. Riscurile Umane / Human Risks. Riscuri şi catastrofe 2002, 1, 43–54.
  38. Surd, V.; Puiu, V.; Zotic, V.; Moldovan, C. Riscul demografic in Muntii Apuseni / The demographic risk in the Apuseni Mountains; Presa Universitară Clujeană: Cluj-Napoca, 2007; ISBN 978-973-610-626-2. [Google Scholar]
  39. Muntele, I. Les Risques Géo-Démographiques En Roumanie. Réalités et Perspectives. Lucrările seminarului geografic „Dimitrie Cantemir” 2009, 30, 73–85.
  40. National Institute for Statistics of Romania Baze de Date Statistice - Tempo Online Available online: http://statistici.insse.ro:8077/tempo-online/#/pages/tables/insse-table.
  41. Bulgaru, M.; Bulgaru, O. Modalități de Constituire a Cuplurilor Familiale: Consecințe Demografice / Ways of Establishing Family Couples: Demographic Consequences. Studia Universitatis Moldaviae 2020, 133, 3–14. [Google Scholar] [CrossRef]
  42. National Institute for Statistics of Romania Evoluţia Natalităţii Şi Fertilităţii În România (Evolution of Birth Rate and Fertility in Romania); National Institute for Statistics of Romania: București, 2012.
  43. Parlamentul României Legea, Nr. 396 Din 30 Octombrie 2006 Privind Acordarea Unui Sprijin Financiar La Constitui-Rea Familiei / Law No. 396 of October 30, 2006 Concerning the Granting of Financial Support to the Establishment of the Family; Parlamentul României: București, 2006. [Google Scholar]
  44. Härkönen, J.; Billingsley, S.; Hornung, M. Divorce Trends in Seven Countries over the Long Transition from State Socialism: 1981-2004. In Divorce in Europe. New Insights in Trends, Causes and Consequences of Relation Break-Ups; Mortelmans, D., Ed.; European Studies of Population; Springer, 2000; Vol. 21, pp. 63–89 ISBN 1381-3579.
  45. Baetica, R. Nupţialitatea şi natalitatea în România / Marriage and birth rate in Romania; Statistic Explained; Eurostats: București, 2015. [Google Scholar]
  46. Dalkhat, E. Application of the Demographic Potential Concept to Understanding the Russian Population History and Prospects: 1897-2100. Demographic Research 2001, 4, 289–336. [Google Scholar] [CrossRef]
  47. Kalmijn, M. Explaining Cross-National Differences in Marriage, Cohabitation, and Divorce in Europe, 1990-2000. Population Studies. A Journal of Demography 2007, 61, 243–263. [Google Scholar] [CrossRef] [PubMed]
  48. Swianiewicz, P. Municipal Divorces ꟷ The Under-Researched Topic of Territorial Reforms. Acta Geobalcanica 2020, 6, 27–33. [Google Scholar] [CrossRef]
  49. Diekmann, A.; Schmidheiny, K. The Intergenerational Transmission of Divorce: A Fifteen-Country Study with the Fertility and Family Survey. Comparative Sociology 2013, 12, 211–235. [Google Scholar] [CrossRef]
  50. Hărăguş, M. From Cohabitation to Marriage When a Child Is on the Way. A Comparison of Three Former Socialist Countries: Romania, Bulgaria and Hungary. Journal of Comparative Family Studies 2015, 46, 329–350. [CrossRef]
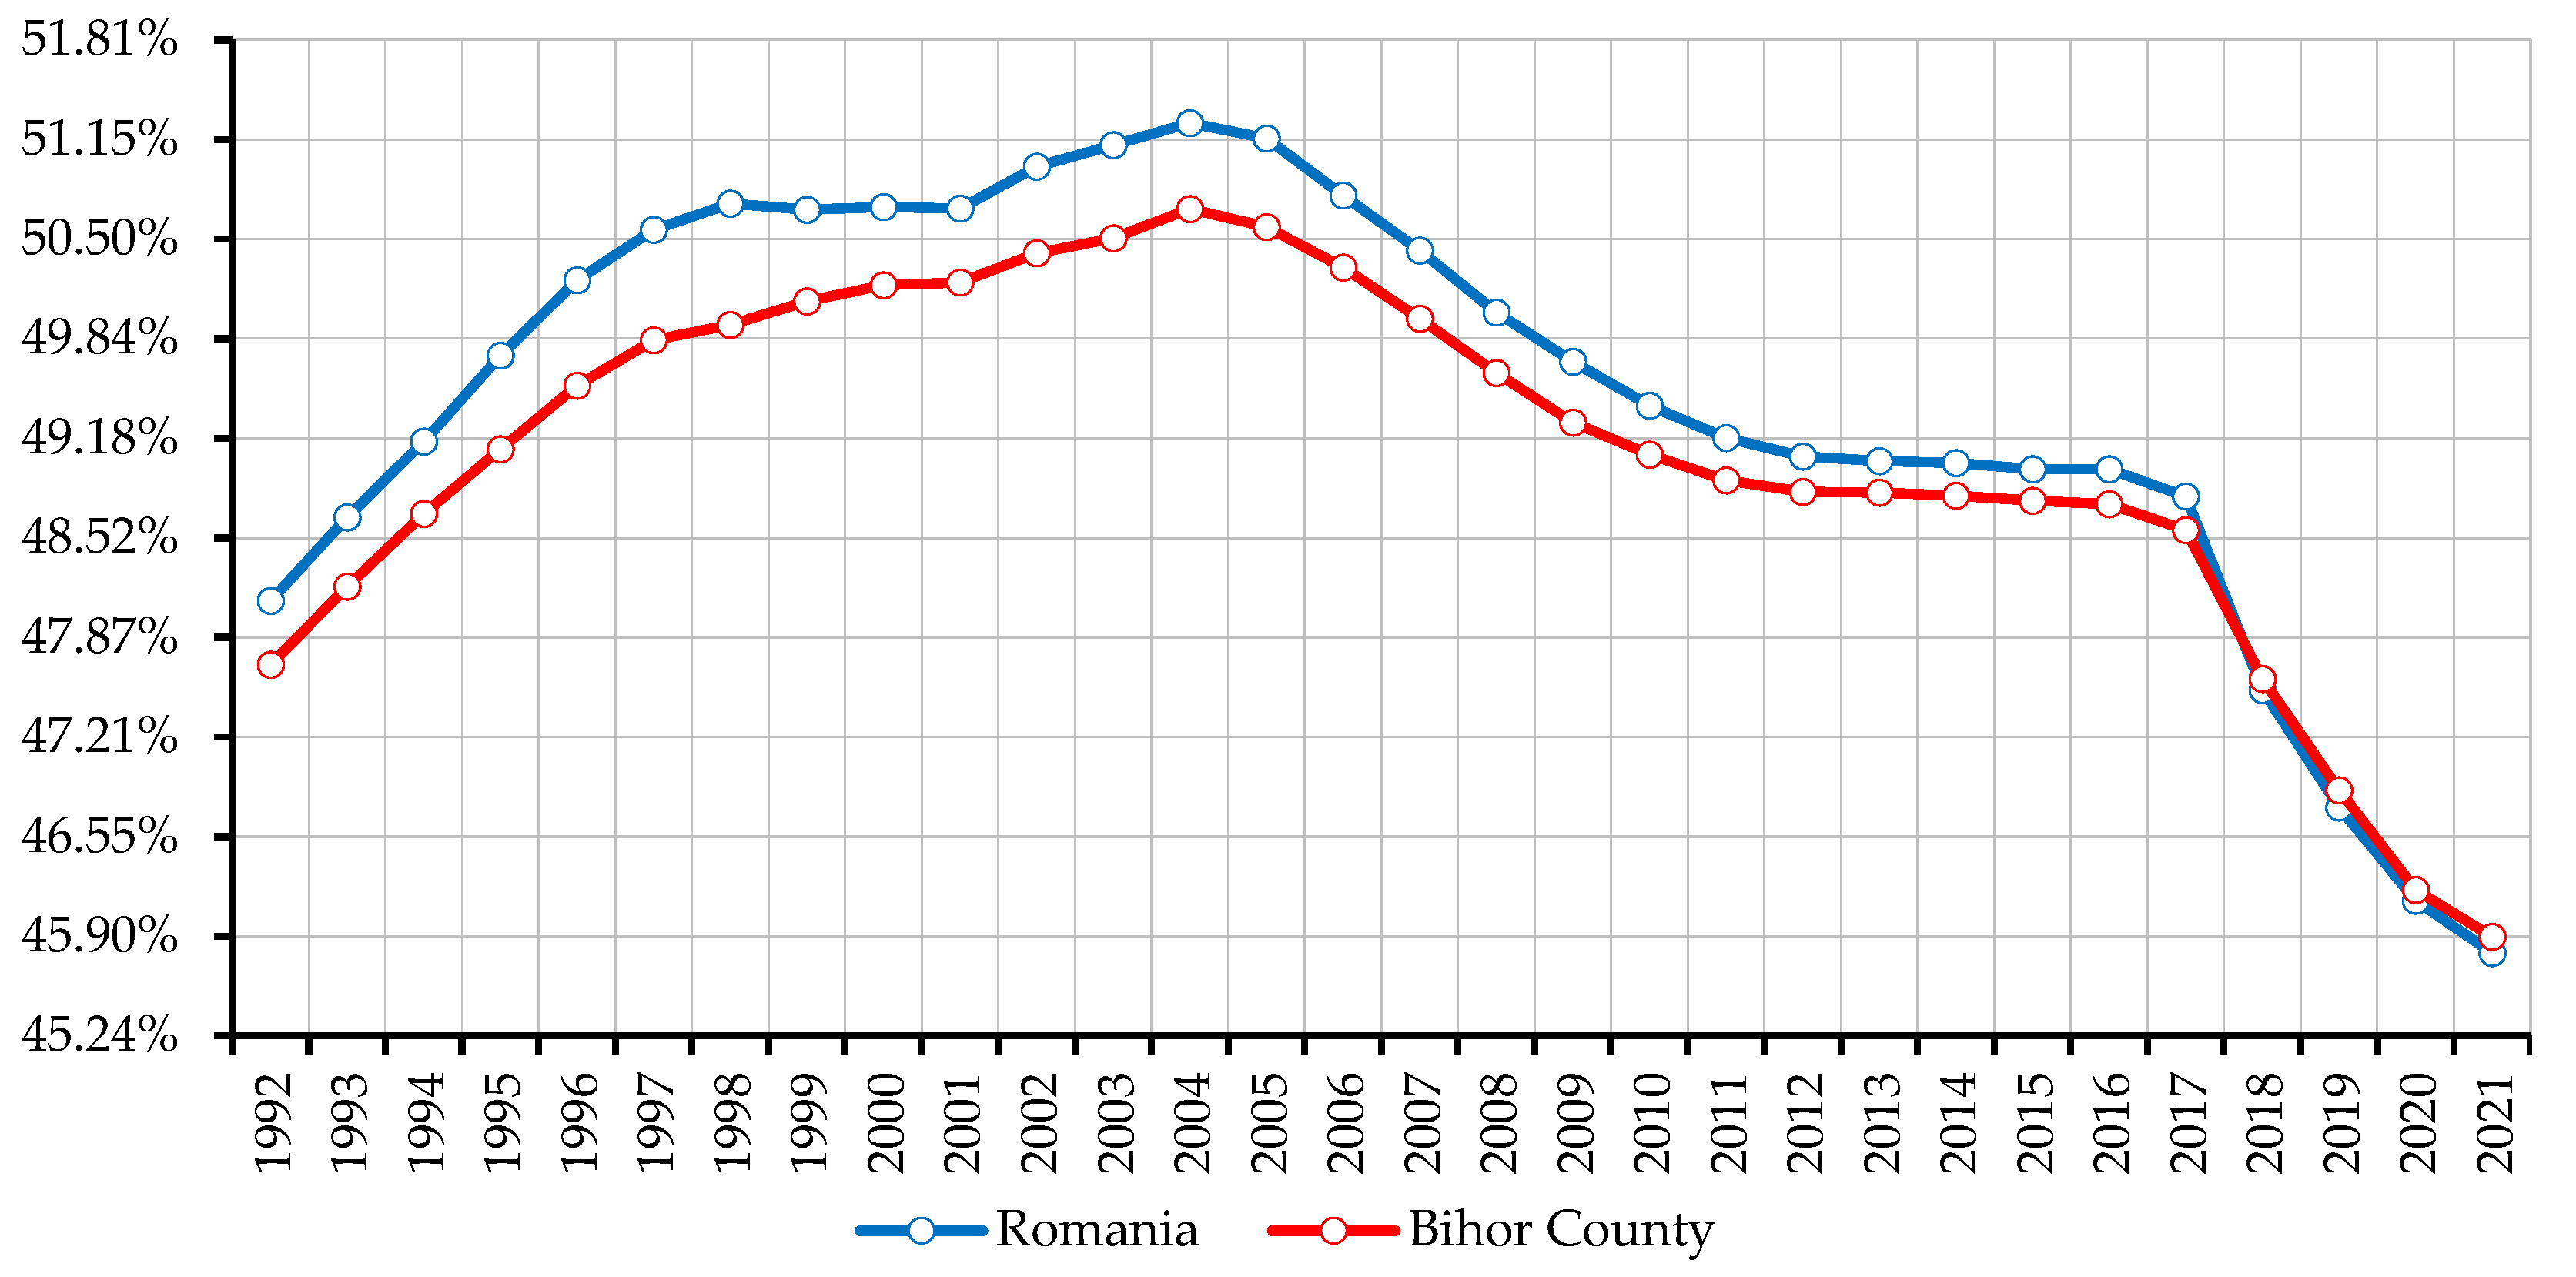
Figure 1. Demographic potential index in Romania and Bihor county during 1992-2021. Source of data [40].
Preprints 79292 g001
Figure 2. Demographic potential index in Romania (2021). Source of data: authors' calculations [40].
Preprints 79292 g002
Figure 3. Demographic potential index in Bihor county (2021). Source of data: authors' calculations [40].
Preprints 79292 g003
Figure 4. Marriages and nuptial index in Romania during 1992-2021. Source of data [40].
Preprints 79292 g004
Disclaimer/Publisher’s Note: The statements, opinions and data contained in all publications are solely those of the individual author(s) and contributor(s) and not of MDPI and/or the editor(s). MDPI and/or the editor(s) disclaim responsibility for any injury to people or property resulting from any ideas, methods, instructions or products referred to in the content.
Copyright: This open access article is published under a Creative Commons CC BY 4.0 license, which permit the free download, distribution, and reuse, provided that the author and preprint are cited in any reuse.
Prerpints.org logo

Preprints.org is a free preprint server supported by MDPI in Basel, Switzerland.

Subscribe

© 2024 MDPI (Basel, Switzerland) unless otherwise stated